Embed Size (px)
Citation preview

Consumer Satisfaction/Dissatisfaction in Apparel Online Shopping at the
Product-Receiving Stage: The Effects of Brand Image and Product Performance
Hsiao-Ling Lin
Thesis submitted to the faculty of the Virginia Polytechnic Institute and State
University
in partial fulfillment of the requirements for the degree of
Master of Science
In
Apparel, Housing and Resource Management
Jessie H. Chen-Yu, Chair
Jihyun Kim
Noreen M. Klein
April 25, 2008
Blacksburg, VA
Keywords: Brand image, product performance, consumer satisfaction/dissatisfaction
Copyright 2008, Hsiao-Ling Lin

Consumer Satisfaction/Dissatisfaction in Apparel Online Shopping at the
Product-Receiving Stage: The Effects of Brand Image and Product Performance
by
Hsiao-Ling Lin
Committee Chairman: Jessie H. Chen-Yu
Apparel, Housing and Resource Management
ABSTRACT
Due to the success of apparel online shopping, many researchers in consumer
behavior hope to extend the existing consumer behavior theories into the electronic
commerce area to assist apparel marketers to develop effective marketing strategies to
understand, attract, and maintain their consumers (Goldsmith & McGregor, 1999). Many
apparel researchers have investigated Consumer Satisfaction/Dissatisfaction (CS/D) with
online shopping (Hou, 2005; Jiang & Rosenbloom, 2005; Kim, Kim & Lennon, 2006;
Lee, 2004). However, most of these studies focused on CS/D with apparel websites or
e-service quality, rather than CS/D with the products purchased online.
In apparel online shopping, consumers cannot examine the textures, hand, or color
of the fabric or try on the garment. Because of the intangibility of apparel products on the
website, consumers may use extrinsic cues, such as brand image, to judge if the brand is
worthy of the price and to make an inference of the product quality (O’Neal, 1992).
Previous studies about brand image mainly discussed about how brand image influences
consumers’ perception and evaluation of product quality (d’ Astous & Saint-Louis, 2005;
Dodds, Monroe & Grewal, 1991) and the impact of brand image to consumers’ purchase
intention (Ataman & Ulengin, 2003; Li, 2004; Park & Stoel, 2005). No research has
examined how brand image influences consumers’ expectations at purchase and the
perceptions of product performance at the product-receiving stage, and the role of brand
image in CS/D after receiving products, especially in the realm of apparel online
shopping. Therefore, a study investigating the roles of brand image and product
performance in CS/D with apparel online shopping is essential.

The purpose of the study was to examine the factors related to CS/D with the
purchased product and with the brand in apparel online shopping at the product-receiving
stage. The four objectives of the study were to examine (a) the relationships between
consumers’ individual differences (i.e., brand sensitivity, brand familiarity, brand
self-congruity and demographics) and perceived brand image at the purchase stage, (b)
the influence of consumers’ perceived brand image at purchase on their expectation for
product performance and on perceived product performance, (c) antecedences of CS/D
with the product and CS/D with the brand, and (d) antecedences of product return
intention and repurchase intention.
A model of CS/D with the purchased apparel product and with the brand in an
online shopping context was proposed as the framework of this study. Different from the
two stages (i.e., purchase stage, product-consumption stage) usually proposed in the
studies of offline shopping, an extra product-receiving stage was included between
purchase and product-consumption stages to illustrate the process of CS/D after
consumer receive the product that they ordered online. Fifteen hypotheses were
developed according to the relationships proposed in the framework. A 2 X 2
between-subjects factorial experimental design was developed to conduct this study. The
treatment variables were brand image and product performance. Two levels of brand
image at the purchase stage (i.e., higher, lower) were manipulated by two brand names
and logos. Two levels of product performance at the product-receiving stage (i.e., higher,
lower) were manipulated by two sweatshirts with different levels of quality. A website
was developed to simulate the apparel online shopping process, and a questionnaire was
developed to measure the variables included in this study. A structural equation model
was developed to examine the proposed relationships and hypotheses.
Results in this study showed that both brand image and product performance
significantly influenced CS/D with product and CS/D with the brand. Product
performance was the most important factor on consumers’ satisfaction with the product
that they ordered online. Brand image at purchase played a direct role in CS/D with the
brand but an indirect role in CS/D with the product. Brand image at purchase positively
influenced product performance expectation; product performance expectation positively
influenced the perception of product performance; and then, perceived product

performance affected satisfaction/dissatisfaction with the product. Visible attribute (i.e.,
style, color) expectancy disconfirmation was also found to be an antecedence of CS/D
with the product. If perceived product performance of style and color was better than
what they expected, participants tended to be more satisfied with the product. CS/D with
the product was found to be a significant antecedence of CS/D with the brand. CS/D with
the product was found to be the direct factor influencing product return intention, and
perceived brand image at the product-receiving stage and CS/D with the brand were
antecedents of repurchase intention.
In conclusion, this study suggests that brand image and product performance were
significant factors on CS/D with the purchased product and with the brand at the
product-receiving stage in apparel online shopping. This study is beneficial to consumer
behavior researchers and apparel e-tailers by identifying the roles of brand image and
product performance in apparel online shopping. Based on the results, marketing
strategies in apparel online shopping were provided.

TABLE OF CONTENT
ABSTRACT.......................................................................................................................ii
TABLE OF CONTENTS..................................................................................................v
LIST OF FIGURES..........................................................................................................ix
LIST OF TABLES.............................................................................................................x
CHAPTER I. INTRODUCTION.................................................................................. 1
Introduction.............................................................................................................. 1
Purpose of the Study................................................................................................ 4
Definition of the Variables in the Study................................................................... 4
CHAPTER II. REVIEW OF LITERATURE...............................................................6
Consumer Satisfaction/Dissatisfaction.................................................................... 6
Definitions and Components of Consumer Satisfaction/Dissatisfaction..... 6
Measurements of Consumer Satisfaction/Dissatisfaction............................ 8
Expectancy Disconfirmation Model............................................................ 9
Consumer Expectation..................................................................... 9
Perceived Performance.................................................................. 13
Expectancy Disconfirmation.......................................................... 14
Psychological Effects on the Expectancy Confirmation Process.. 14
Consumer Expectation and Satisfaction/Dissatisfaction with Online
Shopping.............................................................................................. 17
Navigation and Website Design..................................................... 17
Ordering and Delivery Processes................................................... 19
Customer Service........................................................................... 20
Merchandising and Product Information....................................... 21
v

Brand Image........................................................................................................... 22
Definitions of Brand Image....................................................................... 22
Dimensions of Brand Image...................................................................... 23
Brand Name/Logo.......................................................................... 23
Brand Benefits............................................................................... 24
Brand Attitudes.............................................................................. 25
Brand Personality........................................................................... 26
Brand Providers and Users............................................................. 27
Variables Related to Brand Image.............................................................. 27
Brand Sensitivity............................................................................ 28
Brand Familiarity........................................................................... 29
Summary of Literature Review.............................................................................. 30
CHAPTER III. METHODOLOGY............................................................................ 34
Framework and Hypotheses of the Study.............................................................. 34
Individual Differences............................................................................... 36
Purchase Stage........................................................................................... 38
Product-Receiving Stage............................................................................ 39
Product-Consumption Stage...................................................................... 46
Research Method................................................................................................... 46
Selection of Participants............................................................................ 47
Selection of Treatments..............................................................................48
Selection of Brand Name and Logo............................................... 48
Selection of Garment Samples....................................................... 49
Instrument Development........................................................................................ 51
Internet Shopping Web Pages.................................................................... 51
Questionnaire Development....................................................................... 52
Data Collection...................................................................................................... 57
Data Analysis......................................................................................................... 59
vi

CHAPTER IV. RESULTS............................................................................................ 61
Participants’ Profiles.............................................................................................. 61
Demographic Characteristics..................................................................... 61
Wardrobe Expenditures and Apparel Online Shopping Experiences.........63
Gender Differences.................................................................................... 63
Measure Reliability and Manipulation Check....................................................... 66
Measure Reliability.................................................................................... 67
Manipulation Check................................................................................... 68
Results of Hypothesis Testing................................................................................ 70
The Relationship between Individual Differences and Perceived Brand
Image....................................................................................................70
Results of Structural Equation Modeling................................................... 71
Processes of Correcting and Trimming the Model........................ 71
Hypothesis Testing with Structural Equation Modeling................ 78
CHAPTER V. SUMMARY, DISCUSSIONS, APPLICATIONS, LIMITATIONS,
AND RECOMMENDATIONS........................................................... 85
Summary of the Study............................................................................................ 85
Discussions and Applications of the Findings....................................................... 87
Participants’ Differences in Gender, Wardrobe Expenditures and Apparel
Online Shopping Experiences.............................................................. 87
Brand Self-Congruity and Perceived Brand Image at Purchase................ 90
Perceived Brand Image at Purchase, Product Performance Expectation,
and Perceived Product Performance.................................................... 91
Antecedences of Consumer Satisfaction/Dissatisfaction with the Product
and Consumer Satisfaction/Dissatisfaction with the Brand................. 92
Perceived Brand Image at the Product-Receiving Stage........................... 96
Product Return Intention and Repurchase Intention.................................. 97
Conclusion and Suggestions for Strategies in Apparel Online Shopping.............. 99
Limitations of the Study and Recommendations for Future Researches............. 100
vii

viii
REFERENCES............................................................................................................... 103
APPENDIXES................................................................................................................ 123
Appendix A – Advertisement for Recruiting Participants in the Dorms.............. 124
Appendix B – Survey for Choosing Brand Names to Create Different Levels of
Brand Image.................................................................................125
Appendix C – Survey for Choosing Sweatshirts to Create Different Levels of
Product Performance.................................................................... 126
Appendix D – Size Charts for Sample Sweatshirts............................................. 127
Appendix E.1 – Web Page for Higher Brand Image Group (Men’s Sweatshirt). 128
Appendix E.2 – Web Page for Lower Brand Image Group (Men’s Sweatshirt).. 135
Appendix E.3 – Web Page for Higher Brand Image Group (Women’s
Sweatshirt)................................................................................. 137
Appendix E.4 – Web Page for Lower Brand Image Group (Women’s
Sweatshirt)................................................................................. 140
Appendix F.1 – Questionnaire for Higher Brand Image Group – Part I.............. 142
Appendix F.2 – Questionnaire for Higher Brand Image Group – Part II............. 143
Appendix F.3 – Questionnaire for Lower Brand Image Group – Part I...............148
Appendix F.4 – Questionnaire for Lower Brand Image Group – Part II............. 149
Appendix G – Informed Consent for Participants............................................... 154
Appendix H.1 – Instruction 1 – Higher Brand Image Group.............................. 157
Appendix H.2 – Instruction 1 – Lower Brand Image Group............................... 158
Appendix H.3 – Instruction 2 – Higher Brand Image Group.............................. 159
Appendix H.4 – Instruction 2 – Lower Brand Image Group............................... 160
Appendix I – Random Number Sheet for Assigning Participants into Experimental
Groups............................................................................................ 161

LIST OF FIGURES
Figure 3.1 A framework of consumer satisfaction/dissatisfaction with the purchased
apparel product and the brand in an online shopping context....................... 35
Figure 4.1 The hypothesized SEM model....................................................................... 73
Figure 4.2 The results of the hypothesized SEM model................................................. 74
Figure 4.3 The SEM model with added paths.................................................................77
Figure 4.4 The final model of consumer satisfaction/dissatisfaction with the purchased
apparel product and the brand in an online shopping context....................... 79
Figure 5.1 The result model of consumer satisfaction/dissatisfaction with the purchased
apparel product and the brand in an online shopping context....................... 89
ix

x
LIST OF TABLES
Table 3.1 Factorial design of treatment variables........................................................... 47
Table 4.1 Demographic characteristics of the participants............................................. 62
Table 4.2 Wardrobe expenditures and apparel online shopping experiences of the
participants..................................................................................................... 64
Table 4.3 Gender differences in wardrobe expenditures and apparel online shopping
experiences..................................................................................................... 65
Table 4.4 Gender differences in variables measured in the framework.......................... 67
Table 4.5 Measure reliability........................................................................................... 69
Table 4.6 Correlation matrix of model constructs.......................................................... 75
Table 4.7 Added paths and hypothesis testing with SEM results................................... 76
Table 5.1 Hypotheses and summary of the results.......................................................... 88

CHAPTER I
INTRODUCTION
This chapter was composed of three sections. The first section was the
introduction, which described the background of the study. The second section, the
research purpose, discussed the objectives of the study. The third section stated the
definition of each variable in this study.
Introduction
According to the prediction of Forrester Research (October, 2006), non-travel
online retail revenues in the United States (U.S.) will reach the quarter-trillion-dollars
mark by 2011. Wikipedia Encyclopedia Online reported that apparel, accessories and
footwear became the largest category selling online in 2006, which was18.3 billion. Other
large categories selling online were computer hardware and software (17.2 billion),
automobiles and auto parts (16.7 billion), and home furnishings (10.0 billion). The main
reasons why consumers shop apparel products online are convenience, selection and price
(Corcoran, 2006). Consumers can access brands they do not have in local markets,
especially luxurious and high-end products. Because of the success of apparel online
shopping, many researchers in consumer behavior hope to extend the existing consumer
behavior theories into the electronic commerce area to assist apparel marketers to develop
effective marketing strategies to understand, attract, and maintain their consumers
(Goldsmith & McGregor, 1999).
Satisfaction is important for both consumers and marketers. For consumers, it is
their ultimate goal to utilize limited financial resource and efforts to maximize their
satisfaction and gain the optimal products or services (Chen-Yu, Williams & Kincade,
1999). For marketers, satisfying consumers’ needs and want is a requirement to attract
new consumers, keep existing consumers, and make profits (Bloemer & Kasper, 1995;
1

Peter & Olson, 2005). Although a satisfactory experience does not guarantee loyalty, the
likelihood that consumers will remain loyal depends on their level of satisfaction
(Blackwell, Miniard & Engel, 2001). In addition to the possibility of repeat purchase,
consumer satisfaction/dissatisfaction (CS/D) may also shape consumers’ word-of-mouth,
which is one of the best promotions because of its high credibility (Peter & Olson, 2005).
Consumers with satisfying experiences may tell their family and peers about the
pleasurable purchase experiences and encourage them to try the products or services.
Consumers with dissatisfying experiences, on the contrary, may decide not to use the
product/service anymore or decide switching to another brand. Some consumers may
discourage their family and friends to shop at the same store or buy the same brand
(Chen-Yu & Hong, 2006).
Many studies have investigated consumer behavior within the scope of Internet
shopping and showed that there were significant differences between online and offline
shopping in consumer attitudes and behavior for products and services chosen. For
example, Degeratu, Rangaswamy and Wu (2000) found that brand name had higher
influences on consumers in online than offline shopping. Lynch and Ariely (2000) and
Shankar, Rangaswamy and Pusateri (2001) found that consumers’ price sensitivity was
lower in online than offline shopping. Therefore, studies in understanding consumer
behavior in online shopping are needed. In recent years, many apparel researchers have
investigated CS/D with online shopping (Hou, 2005; Jiang & Rosenbloom, 2005; Kim,
Kim & Lennon, 2006; Lee, 2004). However, most of these studies focused on CS/D with
apparel websites or e-service quality, rather than CS/D with the products purchased
online.
Chen-Yu et al., (1999) propose a model for CS/D with the performance of apparel
products, which suggests that one important determinant of CS/D with a product at
purchase was the confirmation/disconfirmation between consumers’ perceived
at-purchase performance and their experienced-based norm. However, this model can
only be applied to traditional brick-and-mortar apparel shopping but cannot be applied to
online shopping because in brick-and-mortar apparel shopping, consumers can examine
how the garment looks like by trying on the garment. Consumers can evaluate the
performance of the product and compare it with a norm based on their past experiences.
2

The outcome of the comparison between consumers’ perceived performance and their
experienced-based norm leads to satisfaction or dissatisfaction with the product. Because
consumers already knew what the garment looks like at purchase, their expectation for
the product is more related to product performance after wash or after a long-time wear,
instead of the appearance of the garment. Consumers in online shopping, however, cannot
physically examine the product at the purchase stage. They can only imagine how the
apparel will look like or will fit based on the description and photographs of the product,
or the sizing charts provided by the website. Only after consumers receive the purchased
product, can they evaluate the product performance. Therefore, consumers’ expectation at
the purchase stage is more related to how the garment will look like and whether the
product quality will be sufficient. The evaluation of the garment will not happen until at
the product-receiving stage. The perception of the product performance may be similar to
or significant different from their expectation at purchase, which leads to satisfaction or
dissatisfaction with the product. Because the uniqueness of the process in apparel online
shopping, it is essential to examine CS/D at the product-receiving stage in online
shopping.
In apparel online shopping, consumers cannot examine the textures, hand, or color
of the fabric or try on the garment. Because of the intangibility of apparel products on the
website, consumers may perceive a high level of risk when they make their purchase
decision. Consumers may use extrinsic cues, such as brand image, to judge if the brand is
worthy of the price and to make an inference of the product quality (O’Neal, 1992)
because brand image can help consumers to process, organize, and retrieve information in
memory (Aaker, 1991). For marketers, brand image is extremely important because it can
help them to position their products, differentiate themselves from other brands, create
consumers’ positive attitudes and emotions toward their brand, and help their target
customers perceive a high level of benefits of purchasing or using their brand (Pitta &
Kutsanis, 1995). Therefore, studies in the role of brand image in online shopping are
needed and important. However, previous studies about brand image mainly have
discussed about how brand image influences consumers’ perception and evaluation of
product quality (d’ Astous & Saint-Louis, 2005; Dodds, Monroe & Grewal, 1991) and the
impact of brand image to consumers’ purchase intention (Ataman & Ulengin, 2003; Li,
3

2004; Park & Stoel, 2005). No research was found to examine how brand image
influences consumers’ expectations at purchase and the perceptions of product
performance at the product-receiving stage, and the role of brand image in CS/D after
receiving products, especially in the realm of apparel online shopping.
Purpose of the Study
The purpose of the study was to examine the factors related to CS/D with the
purchased product and with the brand in apparel online shopping at the product-receiving
stage. The four objectives of the study were to examine (a) the relationships between
consumers’ individual differences (i.e., brand sensitivity, brand familiarity, brand
self-congruity and demographics) and perceived brand image at the purchase stage, (b)
the influence of consumers’ perceived brand image at purchase on their expectation for
product performance and on perceived product performance, (c) antecedences of CS/D
with the product and CS/D with the brand, and (d) antecedences of product return
intention and repurchase intention. There was no research on CS/D with the product and
with the brand purchased in online shopping. The findings of this study can extend the
understanding of consumer online shopping behavior, especially in CS/D in the online
shopping context. The study results may also help apparel e-tailers to understand the role
of brand image in CS/D in order to develop effective marketing strategies to provide
maximum customer satisfaction.
Definition of the Variables in the Study
1. Brand sensitivity: the degree to which a consumer notices or uses brands as important
information to making purchase decision (Nelson & Devanathan, 2006).
2. Brand familiarity: the number of consumers’ brand-related, direct or indirect,
experiences (Kent & Allen, 1994).
3. Brand self-congruity: the degree of similarity between consumer’s self-image and
brand image (Sirgy, 1982).
4

5
4. Brand image: the total impression of a particular brand in consumers’ minds (Ditcher,
1985).
5. Consumer expectation: consumers’ pre-usage belief that a product possesses a
particular level of an attribute or a particular level of overall performance, or that
product usage will result in a particular outcome (Bone, Shimp &.Sharma, 1990).
6. Perceived product performance: the subjective evaluation of performance made by a
consumer at purchase or after a product is consumed (Chen-Yu et al., 1999; Halstead,
Hartmann & Schmidt, 1994).
7. Expectancy Disconfirmation: consumers’ evaluation of the discrepancy between their
expectations and their perception of the actual performance (Halstead et al., 1994).
8. Consumer satisfaction/dissatisfaction: consumers’ perception, overall evaluation,
and psychological reaction to their experience (Hou, 2005).
9. Product return intention: consumers’ anticipation/likelihood of bringing or sending
the purchased product to a former or proper place (Merriam-Webster Dictionary
Online, 2008).
10. Repurchase intention: consumers’ anticipation/likelihood of buying the same
product or products of the same brand again (Blackwell et al., 2001).

CHAPTER II
REVIEW OF LITERATURE
In this chapter of literature review, previous studies in consumer satisfaction/
dissatisfaction (CS/D) and brand image were reviewed in the following sections. The first
section, CS/D, included the review of definitions and components of CS/D,
measurements of CS/D, antecedents of CS/D, and consumer expectation and CS/D
toward online shopping. The second section, brand image, contained the reviews of
definitions, dimensions and variables related to brand image.
Consumer Satisfaction/Dissatisfaction
Definitions and Components of Consumer Satisfaction/Dissatisfaction
CS/D has been deemed as a fundamental determinant of long-term consumer
behavior (Oliver, 1980b). The concept of CS/D has been discussed extensively in the
retailing and service quality areas (Anderson & Fornell, 1994; Bitner, Brown & Meuter,
2000; Cronin & Taylor, 1992; Zeithaml, Berry & Parasuraman, 1996). Meanwhile, the
CS/D with e-tailing or e-satisfaction has attracted more researchers’ attention (e.g., Selz
& Schubert, 1998; Szymanski & Hise, 2000). However, the definition of CS/D is still
divergent in the literature of the retailing and service quality areas (Hou, 2005).
Howard and Sheth (1969) first propose that CS/D as a related psychological state
evaluates the responsiveness between what consumers actually get and give. CS/D is also
defined as a total psychological state when there is a difference between the emotion and
expectation, and the expectation is consumers’ feelings anticipated and stored up from
their previous experience (Oliver, 1981). Churchill and Surprenant (1982) pose that CS/D
is a result of which consumers compare the expected reward and the actual cost after
purchasing and using products. After the concept of CS/D is extended to service,
Zeithaml and Bitner (2000) define CS/D as consumers’ evaluation of a product or service
6

of whether the product or service has met their needs and expectation. Most researchers
focus on the CS/D in the post-purchase stage, for example, Engel, Blackwell and Miniard
(1995) state that CS/D is a post-purchase evaluation that a chosen alternative meets or
exceeds expectation. Some researchers recognize that CS/D is not limited in the
post-purchase stage but exists in various stages of consumer behavior process. Hou (2005)
defines CS/D as consumers’ perception, overall evaluation, and psychological reaction to
their experience in the pre-purchasing, purchasing and post-purchasing stages.
CS/D could be distinguished as either a process or an outcome (Parker &
Mathews, 2001; Yi, 1990). The process focuses on the perceptual, evaluative and
psychological process that contributes to CS/D. The in-process CS/D is consumers’
satisfaction/dissatisfaction during the sequence of episodes constructing the transaction
(Jiang & Rosenbloom, 2005). In terms of levels of aggregation, an immediate
post-purchase evaluative judgment or an affective reaction to a specific purchase
occasion can be viewed as transaction-specific CS/D with less aggregation (Oliver, 1993).
Transaction-specific CS/D captures the complex psychological reactions that consumers
have and may offer diagnostic information about a specific product or service encounter
for a firm (Oliver, 1997). On the other hand, when CS/D is regarded as the outcome, it is
the result of the purchase experience or service reception (Yi, 1990). The experience of
distinct emotions at a certain stage of purchasing may determine consumers’ overall
satisfaction/dissatisfaction and behavior intention. The outcomes and results in a certain
stage can be accumulated and become overall CS/D or cumulative CS/D based on overall
evaluation of the total purchase and consumption experiences with a product or service
over time (Anderson, Fornell & Lehmann, 1994; Fornell, 1992). Overall CS/D is more
fundamental indicator of the past, current and future performance of a firm (Anderson et
al., 1994).
In online shopping, in-process CS/D is a set of discrete service encounters during
the transaction process with the e-tailing service provider over a period of time while the
overall CS/D is the general attitude toward the service provider after the transaction is
done (Jiang & Rosenbloom, 2005; Oliver, 1997). Boulding, Kalra, Staelin and Zeithaml
(1993) found that overall CS/D was the sum up of all previous transaction-specific
evaluations and was updated after each transaction. Hou (2005) states that both the
7
outcome and the process contribute to the consumer’s overall CS/D in online shopping
because online consumers take much more time in searching information and
communicating on the web than in actual purchasing time.
When it comes to components of CS/D, Giese and Cate (2000) define that there
are three basic components composed of CS/D (i.e., response, focus, time). CS/D is a
cognitive or affective response that relates to a specific focus (e.g., a product, brand,
experience) and occurs at a certain time (i.e., pre-purchase stage, purchase stage,
post-purchase stage). For example, a female customer was satisfied with the brand,
Victoria Secret because during the purchasing process (time), the salesperson introduced
many styles to her and the attitude was very polite (focus) that the customer held a
positive image toward Victoria Secret (response).
Measurements of Consumer Satisfaction/Dissatisfaction
There is no standardized method for measuring CS/D. Hausknecht (1990)
describes that the inconsistencies in theory have led to inconsistencies in measurement of
CS/D which may be accountable for inconsistencies in reported results. He proposes two
dimensions in measurements of CS/D. One dimension reflects what is being measured
and has three approaches (i.e., evaluative/cognitive, emotional/affective,
behavioral/conative). The second dimension reflects how the measurements are gathered
and has two approaches (i.e., verbal, graphic). Haisknecht suggests that the graphic
approach (e.g., faces, circles, and ladder) can communicate the concept of quantities of
CS/D better than the verbal format. A verbal scale is easy to complete for respondents;
however, it is ambiguous for researchers to analyze (Hill, Brierley & MacDougall, 2003).
Although Kasten and Weintraub (1999) suggest using a graphic scale with numeric scores
and verbal labels can reduce the ambiguity of the verbal scale, verbal scales have been
used in most CS/D studies.
Various types of verbal scales have been used in CS/D studies. Two major types
of scale are single-item scales and multi-item scales. Many researchers used single-item
scales (e.g., one to five) from “very satisfied” to “very dissatisfied” responses to reflect
the extent of overall CS/D (Murray & Howat, 2002; Shim & Mahoney, 1992; Yoon &
Ekinci, 2003). Other researchers used multi-item scales (Danaher & Mattsson, 1994;
8

Estelami & Maeyer, 1997; Rust & Zahorik, 1993). For example, Estelami and Maeyer
(1997) used five items (i.e., facilities, cost, decision of attending the school, time
spending in the school, overall assessment) to measure CS/D toward the school.
Westbrook and Oliver (1981) examined the reliabilities of various types of scales (i.e.,
verbal, graphic, semantic differential, Likert, inferential scales) and found that the
semantic differential scale (e.g., satisfied vs dissatisfied) had the highest reliability.
Expectancy Disconfirmation Model
The expectancy disconfirmation model has been widely used to determine CS/D.
The first proposition related to this model can be traced back to the proposition suggested
by Swan and Combs (1976) indicating that satisfaction is related to performance that
meets expectation, whereas dissatisfaction occurs when performance fails to meet
expectation. Expectancy disconfirmation is a mental comparison of an actual state with
its expected probability (Barsky, 1992; Lee, 2004; Spreng, MacKenzie & Olshavsky,
1996). Consumers purchase products and services with pre-purchase expectation about
anticipated performance. After purchasing and using the products and services, the
performance outcomes are compared with the initial expectation, resulting in a feeling of
satisfaction, neutral or dissatisfaction. If the perceived performance exceeds a consumer’s
expectation, it leads to positive disconfirmation, and the consumer will feel satisfied with
the product or service (Lee, 2004). If the perceived performance matches a consumer’s
expectation, it results in confirmation (or zero disconfirmation), and the consumer will
feel neutral or satisfied. However, if the perceived performance does not meet a
consumer’s expectation, it leads to negative disconfirmation, and the consumer will be
dissatisfied. Based on the expectancy disconfirmation model, CS/D has three antecedents
(i.e., expectation, perceived performance, disconfirmation between expectation and
perceived performance). Each antecedent is discussed in the following sections.
Consumer Expectation
One antecedent of CS/D is consumer expectation. Consumer expectation have
been investigated in a number of research settings such as expectation on product
promotion activities, product price, economic inflation, and financial spending (Kalwani
9

& Kim, 1992; Ludvigson, 2004; Roos, 2005); however, they have received the most
attention in the CS/D and service quality literatures (Zeithaml, Berry & Parasuraman,
1993). Many researchers suggest that expectation are formed through mainly three
sources: (a) direct prior experience with the product or similar products and knowledge of
product attributes, (b) exposure to marketing stimuli and information from external
sources such as advertising, promotion or price, and (c) communication from reference
groups such as word-of-mouth information or observation of product usage (Holak,
Lehmann & Sultan, 1987; Smith & Swinyard, 1988).
Many study findings support that consumer expectation is a determinant of CS/D.
Chen-Yu, Hong and Lee (2001) compared U.S. and South Korean college student
consumers and found that expectation for apparel product performance was a significant
determinant of CS/D in both countries. Consumers who had a higher level of expectation
for performance at the purchase stage had a higher level of satisfaction with the product
at the product-consumption stage. Goode (2001) used CD players to examine CS/D and
found that consumers’ expectation for the product quality significantly influenced their
satisfaction/dissatisfaction. If consumers had a higher level of expectation for the product
quality of the CD player, they had a higher level of satisfaction. Kim, Ferrin and Rao
(2003) conducted a web survey to investigate university students’
satisfaction/dissatisfaction with e-tailers and also found that consumer expectation had
direct effects on CS/D regardless of their perceived performance.
Many types of expectation have been identified in the CS/D literature including
predictive expectation, ideal and desired expectation, normative and deserved expectation,
and minimum tolerable and adequate expectation. Each type of expectation is discussed
in the following sections.
Predictive expectation. Miller (1977) defined the predictive “will be”
expectation standard as “expected standard”. Swan and Trawick (1980) and Prakash
(1984) then termed this standard as predictive expectation, defined as estimates of
anticipated performance level, which are expectation that consumer-defined probabilities
of the occurrence of positive or negative events (Oliver, 1981). Several other researchers
also give a similar definition. For example, Spreng and Page (2001) and Zeithaml et al.
10

(1993) define predictive expectation as consumers’ beliefs or predictions about what is
likely to happen in the future. Schommer (1996) and Swan, Trawick, and Carroll (1981)
found that predictive expectation was a significant comparison standard to determine
CS/D. Schommer found that after perceiving a relatively low level of performance,
consumers who hold high predictive expectation are less likely to be satisfied than those
who hold low expectation. Swan et al. (1981) found that if the product performance
equaled to consumers’ predictive expectation, they held a neutral attitude. If the
performance failed to meet the predictive expectation, consumers felt dissatisfied.
Ideal and desired expectation. Miller (1977) identified another type of
expectation, ideal expectation, as the “wished for” level of performance. It is what
consumers believe the performance can be. In CS/D research, no researchers have studied
this type of expectation. It is possible that most consumers do not use ideal expectation as
a comparison standard to determine their CS/D. Swan and Trawick (1980) identified
desired expectation as the level at which consumers subjectively want the product or
service to perform. Compared the level of performance in desired expectation and
predictive expectation, consumers usually expect a higher level of performance in their
desired expectation than that in predictive expectation. Swan et al. (1981) found that if
product performance equaled to desired expectation, consumers felt satisfied.
Nevertheless, if the product performance equaled to consumer’s predictive expectation,
they only held neutral attitudes toward the product. Spreng and Mackoy (1996) found that
desired expectation had a larger effect on consumer satisfaction while predictive
expectation had a larger effect on dissatisfaction.
Normative and deserved expectation. Summers and Granbois (1977) identified a
type of expectation related to how frequently problems should occur. Prakash (1984)
called this type of expectation as “normative expectation”, which were what the
consumers think the level of performance “ought to be” or “should” happen. Normative
expectation is often modified based on consumers’ past expectation (Woodruff, Cadotte
& Jenkins, 1983). For instance, a consumer expected a shirt to have a pilling problem
after one wash. However, if a shirt he bought did not show any pilling problem until
11

one-year’s wear and wash, when the consumer buy a shirt again, his normative
expectation for the time to occur a pilling problem on a shirt might be modified from
after one wash to after one-year’s usage based on his last experience. Deserved
expectation is also defined as what the consumers think the level of performance “ought
to be” or “should” happen; however, it is based on consumers’ investment (Miller, 1977).
Consistently, Liethty and Churchill (1979) also view deserved expectation as the level of
performance the consumer ought to receive under a perceived set of costs. Gilly, Cron
and Barry’s study (1982) showed that the deserved expectation was valid as a comparison
standard for consumers to evaluate performance, and the difference between the deserved
expectation and the consumers’ perceived performance could measure CS/D sufficiently.
Ekinci (2003) found that deserved expectation was significant in predicting service
quality and CS/D in the hospitality industry.
Minimum tolerable and adequate expectation. Miller (1977) proposes minimum
tolerable expectation, defined as the lowest level of performance acceptable to consumers.
It is the minimum level that the consumer believes the level of performance “must be”.
Ekinci (2002) indicates that even if the performance is better than a consumer’s minimum
tolerable expectation, the consumer may not feel satisfied. If the actual performance falls
between minimum tolerable expectation and deserved expectation, consumers will feel
dissatisfied. Ekinic’s minimum tolerable expectation is similar to the “adequate
expectation” proposed by Zeithaml et al. (1993) and Liljander and Strandvik (1993).
They propose a zone of tolerance (i.e., the zone between ideal expectation and adequate
expectation), which is corresponded to a hierarchy of expectation in the order of ideal,
normative, desired, predicted, deserved and adequate expectation from top to bottom. If
the actual performance falls into the zone of tolerance between ideal and predictive
expectation, consumers will feel satisfied. If the actual performance falls within
predictive and deserved expectation, they will feel neutral. If the actual performance falls
into the zone of tolerance between deserved and adequate expectation, consumers will
feel dissatisfied. An individual consumer’s zone of tolerance increases or decreases
depending on many factors, including product attributes, price, or service (Santos &
Boote, 2003).
12

Perceived Performance
Another antecedent of CS/D is perceived performance and is usually defined as
the subjective evaluation of performance made by a consumer at purchase or after a
product is consumed (Chen-Yu, Williams & Kincade, 1999; Churchill & Surprenant,
1982; Halstead, Hartmann & Schmidt, 1994). Compared the characteristics of online and
offline shopping, consumers cannot experience the product while browsing websites;
therefore, their perceived performance is formed only at the product-receiving stage.
Many researchers found perceived performance was an important determinant in
CS/D at the product-consumption stage. Whenever a product performed well, consumers
were satisfied, regardless of the levels of the pre-existing comparison standard (e.g.,
expectation). Chen-Yu et al. (1999) used sweatshirts as experimental samples and found
that perceived performance had a significant cause-and-effect relationship with CS/D at
product-consumption stage. Tse and Wilton (1988) used record players as the product and
also concluded that whenever a product performed well, regardless of the previous
comparison standard and disconfirmation, consumers would be satisfied. Spreng et al.,
(1996) manipulated the product performance of camcorders and found a strong direct
effect of performance on CS/D at product-consumption stage.
For the perceived performance of apparel products, O’ Neal (1992) suggests that
consumers evaluate clothing quality in eight areas, including appropriateness for intended
end use (e.g., the style of a cocktail dress is suitable for a formal party), price in relation
to benefits (i.e., good value), product performance (e.g., durability, drapes,
wrinkle-resistance), product life cycle (i.e., trendy or out-of-date), store image, brand
reputation, social benefits, and psychological benefits. Hatch and Roberts (1985) propose
that the attributes of apparel products can be categorized into two aspects: intrinsic and
extrinsic. Intrinsic attributes are physical product attributes that cannot be changed, for
example, fiber content, style, color, fit/size, and comfort. Extrinsic attributes are product
attributes that the manufacturer or retailer provides, such as price, brand name, store
image, and warranty. Most researchers have focused on the study of intrinsic attributes of
apparel products and identified many criteria in the evaluation of apparel products (i.e.,
fiber content, style or design, color or pattern, fit, comfort, suitability or appropriateness
for a specific occasion, coordination with other clothing, how pleasing it was to others)
13

(Eckman, Damhorot & Kadolph, 1990; McLean, Roper & Smothers, 1986; Workman,
1990). When it comes to extrinsic attributes, researchers have only examined the role of
price in quality evaluation and did find that price was an important criterion (Brown &
Rice, 1998; Burns & Bryant, 1997; Forsythe, 1991).
Expectancy Disconfirmation
The third antecedent of CS/D is expectancy disconfirmation. Expectancy
disconfirmation is consumers’ evaluation of the discrepancy between their expectation
held at the pre-purchase stage and their perception of the actual performance (Halstead et
al., 1994). Lee (2004) indicates that expectancy disconfirmation is the extent to which
performance exceeds, meets or falls below of consumers’ expectation, resulting in
positive, zero or negative disconfirmation. Expectancy disconfirmation is broadly
accepted as a determinant of CS/D and many research results support the expectancy
disconfirmation model (Hong & Rucker, 1995; Oliver & DeSarbo, 1988; Tse & Wilton,
1988). Hong and Rucker (1995) examined CS/D of female consumers in northern
California toward either a jacket or pantyhose and found that CS/D was affected directly
by expectancy disconfirmation. Furthermore, Chen-Yu et al. (1999) utilized sweatshirts
as products and university students as samples and found that expectancy disconfirmation
between the performance expectation at purchase and performance perception after
product consumption was a significant determinant of CS/D. In Spreng and Chiou’s
(2002) study of CS/D formation process, they examined the expectancy disconfirmation
model and also found that expectancy disconfirmation had a strong positive correlation
with CS/D.
Psychological Effects on the Expectancy Confirmation Process
Various psychological theories have been proposed and used in the assessment of
the consequences of consumer decisions. Four theories are often used to address the
psychological effects on the consumer expectancy confirmation process in assessing
CS/D (i.e., assimilation/cognitive dissonance theory, contrast theory, assimilation-contrast
theory, generalized negativity theory). Each theory is introduced in the following
sections.
14

Assimilation (cognitive dissonance) theory. According to assimilation (or
cognitive dissonance) theory, disconfirmed expectation creates a state of dissonance or
psychological discomfort (Festinger, 1957). If a person perceives that two ideas are
psychological dissonant, he or she will try to reduce this mental discomfort by changing
or distorting one or both the ideas to make them consistent (Festinger, 1962). As applied
to product evaluation, if a disparity exists between expectation and actual product
performance, consumer may minimize it by changing his or her expectation toward the
perception of the product or adjusting the perception of the product to be more consistent
with his or her expectation (Anderson, 1973). Chen-Yu, Hong and Lee (2001) compared
the determinants of CS/D with the performance of apparel products (i.e., sweatshirts)
between South Korea and the U.S. and found that the assimilation effect could explain
Korean university students’ satisfaction at the product-consumption stage. For Korean
participants, no matter the performance of sweatshirts was high or low, their initial
expectation of product performance had a positive influence on their satisfaction. Korean
participants would adjust their perception to reduce the disconfirmation between their
expectation and perceived performance of sweatshirts.
Contrast theory. Contrast theory is opposite to the cognitive dissonance theory
presuming that when product expectation is not met by actual performance, the
discrepancy consumer perceived will be exaggerated (Engel & Blackwell, 1982). If the
product performs better than expected, consumers will evaluate the product higher than
its actual performance. If the product performs worse than expected, consumers will
evaluate the product lower than its actual performance (Anderson, 1973). In other words,
perceptions of product performance are enhanced by positive disconfirmation, and
lowered by negative disconfirmation (Yi, 1990). Many research results support the
contrast theory. Duhaime (1988) and Chen-Yu, et al (2001) found that U.S. consumers
were more satisfied when the perceived product performance met their expectation held
at the purchase stage, whereas they were more dissatisfied when the perceived
performance at the product-consumption stage fell below their expectation. Kennedy and
Thirkell (1988) found a positive correlation between expectation and CS/D among
satisfied consumers, but an inverse relationship between expectation and CS/D among
15

dissatisfied consumers. Consumers who had high initial expectation would feel strongly
dissatisfied than those who had relatively low expectation when dissatisfaction occurred.
Dagenais and Duhaime (1992) also found a significant contrast effect when
dissatisfaction occurred.
Assimilation-contrast theory. The assimilation-contrast theory combines
assimilation theory and contrast theory and suggests that there are latitudes of acceptance,
rejection, and neutrality in a consumer’s perception (Anderson, 1973). When consumers’
have a moderate level of disconfirmation between their expectation and the actual
product performance, they will adjust their product perceptions to meet expectation; and
therefore, the assimilation effect occurs. However, when a large disparity exists between
consumers’ expectation and perceived performance, consumers will magnify the disparity;
and therefore, the contrast effect will happen. This argument is supported by several
research results. Bone, Shimp and Sharma (1990), Boulding et al., (1993), and Spreng et
al. (1996) found that the assimilation effects occurred when perceived performance was
close to expectation. Bone, et al. (1990) found that the contrast effects occurred when
perceived performance was much different from the expectation. Higher expectation
would result in lower perceived performance.
Generalized negativity theory. Carlsmith and Aronson (1963) propose the
generalized negativity theory that any disconfirmation of expectation will be perceived as
less pleased than a confirmation of expectation. If consumers expect a specific
performance of the product, and a different performance occurs, they will judge the
product less favorably than if they had no prior expectation. Either positive or negative
disconfirmation lowers product evaluation (Yi, 1990); Oliver (1976) also supports the
theory that positive or negative disconfirmation leads to an unfavorable evaluation of a
product under the circumstance of high consumers’ involvement, commitment, and
interest toward products. In Spreng and Page’s study (2003) on measures of
disconfirmation, the authors found that there was a significant negative effect of
disconfirmation on CS/D to support the generalized negativity theory. Participants in this
study hold a lower satisfaction toward the camcorders as long as the product performance
16

was not as they expected, no matter the performance of camcorder is higher or lower than
their expectation.
Consumer Expectation and Satisfaction/Dissatisfaction with Online Shopping
Czepiel, Solomon, Suprenant and Gutman (1985) suggest that there are two
independent elements contribute to CS/D. One is the functional element, which usually
refers to the product itself and the other element is the service provided by the retailer. In
the scope of CS/D toward online shopping, many researchers have focused on service
quality including website design, navigation, security and customer service rather than
the merchandise itself. For example, in Lam and Lee’s (1999) model of Internet CS/D,
the authors propose that logistics support, customer service, pricing attractiveness and
website storefront affect CS/D towards e-tailers. Ho and Wu (1999) suggest that logistical
support, technological characteristics, information characteristics, homepage presentation,
and product characteristics affect CS/D with e-tailers. Szymanski and Hise (2000) found
that convenience, site design, and financial security were dominant factors in
e-satisfaction while the product information had relatively small impact on e-satisfaction.
Jun, Yang and Kim (2004) identified six factors associated with e-satisfaction including
reliable/prompt responses, access, ease of use, attentiveness, security, and credibility, and
found that reliable/prompt responses, ease of use, and attentiveness had significant
influence on CS/D. Integrating these factors mentioned above, four factors (i.e.,
navigation and website design, ordering and delivery processes, customer service,
merchandising and product information) which would influence consumer expectation
and CS/D toward online shopping are discussed in the following sections.
Navigation and Website Design
Consumers expect to save time and efforts to reduce search cost in online
shopping (Lim & Dubinsky, 2004). The search costs include Internet connection time,
actual time, efforts taken for the user to search an e-tailer’s website, and time to
download information (Gupta & Chattergee, 1997). Consumers are unwilling to tolerate
delays related to delivering audio, animation, graphics and video (Lohse & Spiller, 1998).
Several studies found a significant positive correlation between the information
17

downloading time and the website user’s CS/D (Page & Lepkowska-White, 2002; Van
Riel, Liljander & Jurriens, 2001). Weinberg (2000) suggests that consumers are likely to
feel distracted by the wait when they are uncertain about the actual waiting time.
Consistent with Weinberg’s argument, Dellaert and Kahn (1999) found that consumers’
waiting time for the website could influence their evaluations of the website negatively if
there was no countdown information available. Lim and Dubinsky (2004) suggest that
e-tailers should provide waiting time information (e.g., time bar indicator at the bottom of
the web page) to help consumers become more tolerant of waiting.
Besides waiting time, a well-structured and user-friendly website is more
favorable than the hard-to-navigate one (Eighmey & McCord, 1998; Fram & Grady,
1995). A well designed website can save consumers’ searching time and cognitive efforts
to shop more effectively online (Szymanski & Hise, 2000). Manes (1997) found that a
good website design contained good organization and easy search, and each of the
elements of website design could influence consumers’ satisfaction with the website.
Chen, Clifford and Wells (2002) found informativeness, organization, and entertainment
created positive attitudes towards a website. Within these three features, informativeness
played the most important role in CS/D with a store website.
Then and DeLong (1999) raise the importance of visual display in communicating
information. They suggest that the more information the e-tailer offers through the visual
display, the more interested the consumers will be in purchasing the product. The authors
examined 63 university students’ perceptions of apparel website design features and
identified three important visual aspects of successful websites (i.e., images of the online
product in the closest representation of end use, displayed in conjunction with similar
items, from various angles, such as front and back views). They also found that
consumers preferred a realistic human model rather than a fashion model to display the
silhouette of the garment and how the apparel would drape on the body. Consumers
expected and were interested in display of the product in a variety of images and features
on the web pages.
18

Ordering and Delivery Processes
In addition to providing a fast, easy-to-navigate, and informative website,
consumers also expect e-tailers to offer a convenient and easy online ordering process
(Lim & Dubinsky, 2004). Shopping cart and express checkout process would help
consumers save time and confirmation letter and auto-saved feature of personal
information (e.g., consumer name, address, phone number) could also help consumer
perceive “convenience” during shopping online. Beside convenience, consumers also
expect security while ordering products online. The security refers to online transaction
safety. Researchers suggest that the lack of security on the websites will make online
shoppers have serious concerns about their credit card transactions and privacy of
personal information (French & O’ Cass, 2001; Jun et al., 2004; Madu & Madu, 2002).
Studies also showed that the concern of transaction security significantly influenced
CS/D and purchase intention (Szymanski & Hise, 2000; Yoo & Donthu, 2001). In
addition, credibility, which is regarded as trustworthiness and believability of e-tailers, is
also a factor that influences CS/D toward online shopping. The results of Jun et al. (2004)
study showed that consumers considered the length of business history as an important
indicator of trustworthy e-tailers. E-tailers can help reduce online risk perceived by
consumers through informing them about the company and the security of online
transactions (Jeffery, 1999).
After ordering, the merchandises have to be processed by shipping, handling and
delivering via postal services and then could be reached by consumers (Park & Kim,
2007). Convenient delivery is an important advantage of online shopping over offline
shopping because it can help consumers save efforts in the transportation to physical
stores and searching parking spaces, and the costs of fuel (Wang, Wang & Wang, 2006).
Many researchers have noticed the importance of delivery time in online shopping.
Gommans, Krishnan, and Scheffold (2001) pose that fast delivery may influence
consumers’ attitudes toward online shopping and indirectly influence CS/D. Studies also
found that delivery delay resulted in a lower evaluation in purchase experience (Hui,
Thakor & Gill, 1998; Taylor, 1995). Consumers have different delivery needs; for
example, some consumers prefer quick delivery to experience products soon while others
are willing to wait to save the shipping fee (Jiang & Rosenbloom, 2005). Therefore, the
19

time-related information (i.e., stock availability, shipping/handling cycle, expected
waiting time) is needed for online shoppers (Hui & Zhou, 1996). Park and Kim (2007)
examined the effect of delivery-time-related information on perceived consumption delay,
perceived time risk, attitude toward the website, and online purchase intention. They
found that participants who had been informed of in-stock information perceived
significantly less consumption delay than those who had been informed of back-order
information. Participants who had ships-within-24-hours information perceived
significantly less consumption delay than those who had no such information. The
authors also found that perceived consumption delay also had significant direct effects on
perceived time risk and purchase intention in online apparel shopping. Besides
information related to delivery, Jiang and Rosenbloom (2005) found that whether the
product was delivered as promised and whether consumers could access to order tracking
were also significant influences of consumers’ expectation and CS/D.
Customer Service
Yang, Peterson and Huang (2001) examined online pharmacy patrons and found
customer service was an important factor related to CS/D. The online customer service
usually includes answers to frequently ask questions (FAQ), sales representative service,
payment and credit return policies, and information about shipping and handling costs
(Then & DeLong, 1999; Lim & Dubinsky, 2004). Among various service items that
e-tailer provided, Lohse and Spiller (1998) found that having FAQ sections and offering
sales representative service increased website visits and sales, and the extent of
information gathering from e-tailers and the ease of contact would influence CS/D toward
online shopping (Jun et al., 2004). Ghose and Dou (1998) also found that online shoppers
preferred two-way communication with e-tailers rather than being passive information
recipients. Consumers expected the communication between the staffs and customers to
be careful, continuous, useful, and across geographic barriers (Yang et al., 2001).
Moreover, online consumers preferred to have multiple ways to contact e-tailers, such as
through e-mail box, question posting boards, mail-in address, telephone, and fax numbers.
Ghose and Dou (1998) also found that online shoppers preferred two-way
communication with e-tailers rather than being passive information recipients. For
20

example, consumers often contact customer representatives through telephone or e-mails
and they expect e-tailers’ comments and feedback through e-inquiry (Burke, 1997; Cox &
Dale, 2002). Another online customer service that online shoppers like to use is online
community (i.e., surfer postings) where consumers can report their feelings and
experience with products and e-tailers. This service feature may decrease consumers’
perceived risk associated with purchasing from e-tailers (Park & Stoel, 2002). Personal
attentiveness (i.e., e-tailers offer personalized service to their consumers) is another
dimension that online consumers are longing for in customer service (Jun et al., 2004).
For example, the website of Land’s End offers “Specialty Shoppers” option. The
company creates a personalized file for each individual customer to keep information
such as the customer’s sizes, tastes and past purchases so that the customer service
representative can answer the customer’s questions or provide suggestions for the section
of size, style or gift.
Merchandising and Product Information
In previous studies, merchandising referred to product variety, assortment, and the
product-related information online (Jarvenpaa & Todd, 1997; Szymanski & Hise, 2000).
The findings of previous studies showed that wider assortments and richer product
information would increase the consumers’ positive perception toward the e-tailers.
Greater assortments could increase the possibility to attract consumers and to satisfy their
wants and needs, especially when the items were not widely distributed. Product
information is also a critical factor affecting consumers’ choice in online shopping
because consumers cannot actually see and feel the products (Alba et al., 1997; Lynch &
Ariely, 2000; Ward & Lee, 2000). Peterson, Balasubramanian and Bronnenberg (1997)
indicate that the extent and quality of product-related information on the e-tailer’s
website will influence consumers’ decision-making and the level of CS/D. For apparel
products, product information usually includes intrinsic features, such as fiber content,
fabric construction, size chart, and color description, and extrinsic features, such as price,
country of origin and brand name (Eckman et al., 1990). Compared with other product
categories, fit issue may be more critical for apparel online shoppers because they are
21

unable to try on the garments featured on the website (Then & DeLong, 1999), and
therefore, the information about size is crucial for apparel online shoppers.
Brand Image
In this section, the definitions of brand image will be addressed at first, and then
the five dimensions of brand image (i.e., brand name/logo, brand benefits, brand attitudes,
brand personality, and brand providers and users) and the variables related to the brand
image (i.e., brand sensitivity, brand familiarity) are followed.
Definitions of Brand Image
Although brand image has been acknowledged as an important concept in
marketing (Gardner & Levy, 1955), there is no consistency in its definition (Dobni &
Zinkhan, 1990). For example, Herzog (1963) proposes that brand image is the sum of
impressions that consumers receive from various sources. Kotler (1988) defines brand
image as the set of beliefs held by consumers about a specific brand. Kapferer (1992)
suggests that brand image is the result of consumer’s decoding, extracting, and
interpreting the brand signals. Although there are different definitions of brand image, in
general, researchers agree that brand image is a set of consumer-constructed associations
linked to the brand, which is usually organized in some meaningful ways (Aaker, 1991;
Keller, 1993; Nandan, 2005). For example, Biel (1992) defines that brand image as the
combined effects of brand associations. Brand association is the category of a brand’s
assets and liabilities that involves anything linked in memory to a brand (Aaker, 1991,
Faircloth, Capella & Alford, 2001). Engel, Blackwell and Miniard (1993) suggest that
brand image is bound up with the consumer’s perceptions of the brand’s tangible and
intangible associations. For an image of apparel brand, the tangible associations are
usually related to the functional attributes of clothing, such as warmth or comfort of
clothing (Keller, 1993). The intangible associations are related to the emotional attributes,
such as aesthetics expression and creating fun. Neal and Bathe (1997) state that many
image drivers are the intangible symbolic benefits, which are used to satisfy consumers’
22

social or emotional needs. These brand images are often associated with the wearer’s
trustworthiness, lifestyle and self-image.
Dimensions of Brand Image
Brand image can be categorized into five dimensions, (i.e., brand name/logo,
brand benefits, brand attitudes, brand personality, and brand providers and users). These
five dimensions are described individually in following sections:
Brand Name/Logo
According to the American Marketing Association, a brand is name, term, sign or
symbol or a combination of them to identify the products or services of the seller and
differentiate the seller from its competitors (Keller, 2003). Hem and Iversen (2004) define
logo as the graphic design, with or without brand name attached to it, to identify a brand
with quality products or services. Kapferer (1992) indicates that brand image contains a
logo or a word, related to a product, acquires a meaning determined by the product, and
the history and culture of the company. Biel (1992) describes brand image as a cluster of
attributes and associations that consumers connect to the brand name/logo. Brand
names/logos are valuable assets that help communicate quality and evoke specific
knowledge frameworks associate with the brand (Hoyer & Brown, 1990; Keller, 1993).
Dodds, Monroe and Grewal (1991) state that brand name/logo plays an important role in
enhancing the value of a product. For marketers, a good brand name/logo may create high
levels of brand awareness, stimulate strong consumer preference, and contribute to the
success of the product (Chan & Huang, 1997). For consumers, brand names/logos help
them to recall brand benefits (Janiszewski & van Osselaer, 2000), to make product
inferences and evaluations (Zinkhan & Prenshaw, 1994), and to make purchase decision
(Holden & Vanhuele, 1999). Zinkhan and Martin (1987) indicate that consumers often
form instant, non-neutral attitudes towards the product based on brand name or logo
alone. These instant attitudes can be very strong and may not be changed by subsequent
communications, either from the marketers or from other consumers’ words of mouth.
Degeratu, Rangaswamy and Wu (2000) found that the brand name was regarded as more
important when there was less information available. Hogg, Bruce and Hill (1998)
23

examined young consumers’ brand recognition of sportswear and found the significant
result that young consumers used brand names and logos/symbols to associate with brand
images.
Rao and Ruekert (1994) indicate that one of the major purposes of a brand
name/logo is providing cues about product quality for both observable and unobservable
product attributes. Consumers often perceive a high level of risk in purchasing apparel
because the quality of many after-care attributes such as dimensional stability or
durability are difficult to be evaluated at purchase. To reduce risk, consumers may learn
to rely on brand name/logo to draw inferences about the product quality (Fowler &
Clodfelter, 2001). Although marketers often use brand name/logo to signal product
quality to reduce consumers’ uncertainty about product performance (Heiman & Muller,
1996), inconsistent study results were found in the relationship of brand name/logo and
perceived product quality. In an early study, the highest consumers’ quality ratings were
attributed to products with better brand names selling in a better-quality store at a higher
price (Render & O’Connor, 1976). In later studies, Holstius and Palschik (1983) found
that brand name influenced the perceptions of garment quality only among
fashion-conscious consumers, not among consumers in general. Baugh and Davis (1989)
found that consumers perceived designer brand clothing as a status symbol but not
necessarily as an indicator of high quality. Forsythe (1991) examined the impact of brand
name on consumer evaluation of the apparel quality and found no significant relationship
between brand name and quality perceptions. However, because the inability of
examining products online, brand/logo plays a more important role in online shopping.
Degeratu et al. (2000) found that brand name/logo was an important factor influencing
consumers’ buying decision in online shopping and e-store patronage.
Brand Benefits
Benefits are the personal value that consumers attach to the product attributes;
that is, what consumers can gain from the product or service (Keller, 1993). Benefits can
be distinguished into three types: functional, experiential, and symbolic benefits (Park,
Jaworski, & MacInnis, 1986). Functional benefits are intrinsic advantages of
product/service consumption corresponded to the intrinsic attributes (e.g., fiber content,
24

style, color, size) (Keller, 1993). For example, Maloney (2001) found that consumers
preferred to buy New Balance athletic shoes because of the functional benefits such as
wide selections of shoe width and cushioning support for exercising. Experiential benefits
relate to what it feels like to use the product or service. For example, a consumer may
feel very excited when he or she wears the clothes, enjoy feeling the texture, and
appreciate the appearance of the garments. These benefits satisfy consumers’ sensory
pleasure, variety and cognitive stimulation. Symbolic benefits satisfy consumers’
underlying needs for social approval, self-esteem and personal expression. They are more
extrinsic advantages of product or service consumption (Keller, 1998) and more related to
extrinsic attributes (e.g., country of origin, price). For example, Gucci handbags are
popular due to Gucci’s trendy image that helps consumers to distinguish themselves from
the majority and show their social status.
Brand Attitudes
Another dimension of brand image is brand attitudes, which refers to consumers’
affect or feelings toward the brand. Keller (1993) indicates that brand images are closely
related to how favorably the brand is evaluated. The higher the brand attitude, the higher
the brand image is. A positive overall brand attitude can be formed if consumers believe
that the brand has attributes that can satisfy their wants and needs. According to the
multi-attribute attitude model (Wilkie & Pessimier, 1973), only salient attributes play an
important role in brand attitude. If consumers do not consider certain brand attributes to
be important, they are unlikely to view the brand as very good or bad (Keller, 1993). For
example, the consumer who considers quality is more important than price would have a
positive attitude toward the brand providing products with high quality, but may not have
strong preference with the brand providing products with a low price. Prior experience
with a certain brand or other similar brands would influence brand attitudes (Woodruff et
al., 1983). For example, the consumer bought a J. Crew wool coat and found it kept body
warm in the severe weather; therefore, she formed a positive attitude toward J. Crew.
25

Brand Personality
Brand personality is a set of characteristics related to a brand. These
characteristics are the ones being used to describe human individuals, for example,
classic, reliable, and charming. Brand personality can be an important way to differentiate
a brand in a product category (Halliday, 1996) and can be a propellant of consumer
preference and usage (Biel, 1993). Brand personality traits are often developed through
brand positioning (Harris & Chernatony, 2001), users’ imagery, and consumers’ contacts
with the company’s employees (Aaker, 1997). For example, the brand personality traits of
Abercrombie and Fitch are young, active and sexy. It sells causal luxury apparel products
and targets 18 to 22 year old college students who live in a confident, classically stylish
lifestyle (Abercrombie and Fitch, n.d.). It recruits college students as sales associates to
enhance the brand personality of youth and energy when consumers contact with their
employees.
Consumers may develop brand preferences because the brand personality reflects
their actual self-images. Consumers tend to link their self-images with the product images
at the pre-purchase stage (Ataman & Ulengin, 2003) and would choose products with the
attributes that match some aspects of their selves (Onkvisit & Shaw, 1987). The idea that
consumers prefer brands with images similar to their self-images is regarded as
self-image and product-image congruity (i.e., brand self-congruity) (Hogg & Savolainen,
1999). Consumers may express themselves who they are, what they are and how they
want to be viewed by using the self-congruity brands (Graeff, 1997). Self-image is a
multidimensional concept with different types of self, including actual self, ideal self,
social self and sex-role self (Onkivisit & Shaw, 1987).
Many study results support the proposition of brand self-congruity. Jamal and
Goode (2001) and Sirgy et al. (1997) examined the relationship between brand
self-congruity and brand preference, and found that brand self-congruity was a significant
predictor of brand preference (i.e., brand attitude), purchase intention and store loyalty.
Malhotra (1988) found that consumers were likely to prefer, intend to purchase, or use
brands with image that they deem consistent as their self-images. Some brands may be
chosen because consumers regard them as projecting images that they do not posses now
but desire to have (Schiffman & Kanuk, 1983). For example, if a boy desires to be as
26

professional as an athlete that he admires, he may buy sportswear with the athletic name
or his number, using the product to project his ideal self image. Consumers may also
select brands that match the social expectation of others within a particular situation.
They may use a brand to express themselves to others in an appropriate manner and
project the desired image (Graeff, 1997). Sirgy et al., (1997) introduce a global measure
of brand self-congruity that respondents can directly rate the congruity between brand
image and their own self-image (e.g., Wearing Nike shoes is consistent with how I see
myself). In recent studies, this direct measurement has been increasingly adopted to
examine the brand/product self-congruity within the realm of brand/product personality
(Govers & Mugge, 2004; Govers & Schoormans, 2005; Helgeson & Supphellen, 2004)
and has been proved to be an appropriate approach to compare the consumer’s self-image
with their perception of brand (Han, 2006).
Brand Providers and Users
Biel (1992) proposes that beside components related to product itself, providers
and users also influence brand image. The three elements (i.e., the image of the provider
of the product/service or the corporate image, the image of the user, and the image of the
product/service itself) contribute to brand image variously depend on product category
and different brands. In apparel product categories, taking Ralph Lauren Collection as an
example, although the high-quality apparel product itself contributes to the brand image,
the positive corporate image of social responsibility (e.g., campaigns against breast
cancer) also contributes to the brand image. In addition, the users of Ralph Lauren
Collection, such as consumers in upper social class, enhance the brand image. In other
product categories, such as consumption goods (e.g., shampoo, tissues, cleaners), the
image of product itself plays an important role in the brand image, but the image of the
brand provider and the image of users contributes rather less.
Variables Related to Brand Image
Brand Sensitivity and brand familiarity are two variables closely related to brand
image. Brand image is stored as associations and impressions mentally in consumers’
27

mind; therefore, to what extent consumers are sensitive and familiar with the brand would
also influence their perception of the brand image.
Brand Sensitivity
Brands play an important role if a consumer is sensitive to them while making
purchase decision (Kapferer & Laurent, 1992). However, consumers can be very sensitive
to brands within a specific category but insensitive in other category (Kapferer, 1991).
Kapferer and Laurent (1983) indicate that consumers’ involvement in a certain category
of products is the most important factor to brand sensitivity. They propose three
dimensions of involvement that were particularly related to brand sensitivity. First, a
person’s interest in a product category affects one’s involvement with the product
category, and in turns influences one’s sensitivity to the brands in this product category.
The more a consumer is interested in a certain category, the more he or she is sensitive to
the brands in the product category. For example, teenagers are a group that pays more
attention to fashion and physical appearance (Bouchard, 2002; Wilson &
Sweeney-MacGillivray, 1998). They may be more sensitive to the brands of fashion
products and the brands of products that influence their appearance. The second
dimension of involvement is how risky a consumer feels about a purchase decision for a
certain product category. The more the consumer feels the purchase is risky, the more he
or she is involved in the product category, and the more the consumer is sensitive to
brands. For example, young consumers may have emotional stress and feelings of
deprivation if they dress differently from the standard dress code (Liskey-Fitzwater,
Moore & Gurel, 1993). They may pay much attention on brand selection to avoid the risk
of becoming the outlier of the dress standard. The last dimension of involvement is how
much a consumer believes that a product can reflect his or her self-image. Kapferer and
Laurent (1983) found that the stronger the consumer has this belief, the more he or she is
involved with the product, and the more the consumer cares about brands. Clothing is an
important tool in non-verbal communication, and in reflecting and establishing one’s
actual and desired self-image (Sweeney-MacGillivray & Wilson, 1997); therefore, many
consumers may be sensitive to brands of apparel products.
28

Brand Familiarity
Brand familiarity is the number of consumers’ brand-related, direct or indirect,
experiences (Alba & Hutchinson, 1987; Kent & Allen, 1994). The experiences (e.g.,
exposure to advertisements of the brand, exposure to the brand in a store, purchase or
usage of the brand) increase brand familiarity. Brand familiarity can increases the degree
of the influence of brand image because it captures consumers’ brand associations within
their memory and help form the brand knowledge structure (Alba & Hutchinson, 1987).
Moreover, Sen and Johnson (1997) found that familiarity resulting from the mere
possession of a brand could lead to positive evaluation towards the brand. Compared to
less familiar brands, well-known brands could gain better recall from consumers’
memory (Kent & Allen, 1994). MacInnis, Moorman and Jaworski (1991) also found that
consumers tended to pay more attention to product information in advertisements for
familiar brands rather than unfamiliar brands.
29

Summary of Literature Review
Consumer Satisfaction/Dissatisfaction
CS/D has been deemed as a fundamental determinant of long-term consumer
behavior (Oliver, 1980b). CS/D could be distinguished as either a process or an outcome
(Parker & Mathews, 2001; Yi, 1990). CS/D as a process is an immediate post-purchase
evaluative judgment or an affective reaction to a specific purchase occasion (Oliver,
1993). CS/D as a process captures the complex psychological reactions that consumers
have and may offer diagnostic information about a specific product or service encounter
for a firm (Oliver, 1997). On the other hand, when CS/D is regarded as the outcome, it is
the result of the purchase experiences or service receptions (Yi, 1990). The overall CS/D
or cumulative CS/D as an outcome is based on overall evaluation of the purchase and
consumption experiences over time (Anderson, Fornell & Lehmann, 1994; Fornell, 1992).
Boulding, Kalra, Staelin and Zeithaml (1993) found that overall CS/D was the sum up of
all previous transaction-specific evaluations and was updated after each transaction.
To determine CS/D, the expectancy disconfirmation model has been widely used.
Based on the expectancy disconfirmation model, CS/D has three antecedents. They are:
consumer expectation, perceived performance, and disconfirmation between expectation
and perceived performance. Many study findings support that consumer expectation is a
determinant of CS/D. Chen-Yu, Hong and Lee (2001) found that expectation for apparel
product performance was a significant determinant of CS/D for both U.S. and Korean
college student consumers. Consumers who had a higher level of expectation for
performance at the purchase stage had a higher level of CS/D with the product at the
product-consumption stage. Kim, Ferrin and Rao (2003) also found that consumer
expectation had direct effects on CS/D regardless of their perceived performance.
Another antecedent of CS/D is perceived performance and is usually defined as the
subjective evaluation of performance made by a consumer at purchase or after a product
is consumed (Chen-Yu, Williams & Kincade, 1999; Halstead, Hartmann & Schmidt,
1994). Tse and Wilton (1988) found that whenever a product performed well, regardless
of the previous comparison standard and disconfirmation, consumers would be satisfied.
Spreng et al., (1996) and Chen-Yu, Hong and Lee (2001) also found a strong direct effect
30

of performance on CS/D at product-consumption stage. Expectancy disconfirmation is
consumers’ evaluation of the discrepancy between their expectation held at the
pre-purchase stage and their perception of the actual performance (Halstead et al., 1994).
If the perceived performance exceeds a consumer’s expectation, it leads to positive
disconfirmation, and the consumer will feel satisfied with the product or service (Lee,
2004). Hong and Rucker (1995) found that CS/D was affected directly by expectancy
disconfirmation. Consumers’ clothing satisfaction with the jacket or pantyhose was
significantly higher when they perceived product performance after consumption was
better than their expectation for the product performance formed at purchase (i.e.,
positive expectancy disconfirmation). Consistently, Chen-Yu et al. (1999) found that
expectancy disconfirmation between consumers’ performance expectation formed at
purchase and performance perception after product consumption was a significant
determinant of CS/D with sweatshirts.
Consumer Expectation and Satisfaction/Dissatisfaction with Online Shopping
Four factors (i.e., navigation and website design, ordering and delivery processes,
customer service, merchandising and product information) influencing consumer
expectation and CS/D were reviewed (Ho and Wu, 1999; Jun, Yang and Kim, 2004;
Szymanski and Hise, 2000). For navigation and website design, several studies found a
significant positive correlation between the information downloading time and the
website user’s CS/D (Page & Lepkowska-White, 2002; Van Riel, Liljander & Jurriens,
2001). Manes (1997) found that a good website design contained good organization and
easy search, and each of the elements of website design could influence consumers’
satisfaction with the website.
Many researchers have noticed the importance of delivery time in online shopping.
Gommans, Krishnan, and Scheffold (2001) pose that fast delivery may influence
consumers’ attitudes toward online shopping and indirectly influence CS/D. Park and
Kim (2007) examined the effect of delivery-time-related information on perceived
consumption delay, perceived time risk, attitude toward the website, and online purchase
intention. They found that participants who had been informed of in-stock information
31

perceived significantly less consumption delay than those who had been informed of
back-order information.
Customer service is another factor influence CS/D in online shopping. Yang,
Peterson and Huang (2001) found customer service was an important factor related to
CS/D. The online customer service usually includes answers to frequently ask questions
(FAQ), sales representative service, payment and credit return policies, and information
about shipping and handling costs (Lim & Dubinsky, 2004; Then & DeLong, 1999).
For merchandising and product information on the website, the findings of
previous studies showed that wider assortments and richer product information would
increase the consumers’ positive perception toward the e-tailers. Peterson,
Balasubramanian and Bronnenberg (1997) indicate that the extent and quality of
product-related information on the e-tailer’s website will influence consumers’
decision-making and the level of CS/D. For apparel products, product information
usually includes intrinsic features, such as fiber content, fabric construction, size chart,
and color description, and extrinsic features, such as price, country of origin and brand
name (Eckman et al., 1990).
Brand Image
Brand image is a set of consumer-constructed associations linked to the brand,
which is usually organized in some meaningful ways (Aaker, 1991; Keller, 1993; Nandan,
2005). Brand image can be categorized into five dimensions, (i.e., brand name/logo,
brand benefits, brand attitudes, brand personality, and brand providers and users). Rao
and Ruekert (1994) indicate that one of the major purposes of a brand name/logo is
providing cues about product quality for both observable and unobservable product
attributes. Brand Benefits can be distinguished into three types: functional, experiential,
and symbolic benefits (Park, Jaworski, & MacInnis, 1986). Brand attitudes refer to
consumers’ affect or feelings toward the brand. Keller (1993) indicates that the higher the
brand attitude, the higher the brand image is. Brand personality as a dimension is a set of
characteristics related to a brand. These characteristics are the ones being used to
describe human individuals, for example, classic, reliable, and charming. The idea that
consumers prefer brands with images similar to their self-image is regarded as self-image
32

33
and product-image congruity (i.e., brand self-congruity) (Hogg & Savolainen, 1999).
Consumers may express themselves who they are, what they are and how they want to be
viewed by using the self-congruity brands (Graeff, 1997). The fifth dimension of brand
image is brand providers and users. Biel (1992) proposes that beside components related
to product itself, providers and users also influence brand image.
In addition, brand sensitivity and brand familiarity are two variables closely
related to brand image. Brands play an important role if a consumer is sensitive to them
while making purchase decision (Kapferer & Laurent, 1992). Brand familiarity is the
number of consumers’ brand-related, direct or indirect, experiences (Alba & Hutchinson,
1987; Kent & Allen, 1994). Brand familiarity can increases the degree of the influence of
brand image because it captures consumers’ brand associations within their memory and
help form the brand knowledge structure (Alba & Hutchinson, 1987).

CHAPTER III
METHODOLOGY
The methodology chapter was divided into five sections. The first section was the
framework and hypotheses of the study that were developed according to the purpose of
the study. The research method was in the second section including the selection of
participants, and then the selection of the treatments was followed. The third section,
instrument development, discussed the web page design and the questionnaire
development. In the fourth section, the data collection method and procedure were
described. The data analysis part was in the fifth section to explain how the data and
hypotheses were analyzed.
Framework and Hypotheses of the Study
Based on previous literature review in Chapter II, a model of CS/D with the
purchased apparel product and the brand in an online shopping context was developed as
the framework of this study (see Figure 3.1). This model started from the individual
difference variables, which were proposed to be significantly related to consumers’
perception of brand image at the purchase stage. Consumers’ online shopping processes
were categorized into three stages, the purchase stage, the product-receiving stage, and
the product-consumption stage. The inclusion of purchase and product-consumption
stages was based on Chen-Yu, Williams and Kincade’s (1999) model of CS/D with the
performance of ready-to-wear apparel products, suggesting that the process of
determining CS/D includes the purchase and the product-consumption stages. The
purchase stage is the time when consumers search, compare, examine and decide the
apparel product that they want to purchase and the product-consumption stage is the time
when consumers use/wear and care (e.g., wash, dry-clean) the apparel product. However,
Chen-Yu et al.’s model only considers consumers’ experiences in offline shopping,
34

Individual Differences
Figure 3.1 A framework of consumer satisfaction/dissatisfaction with the purchased apparel product and the brand in an
online shopping context
Brand Sensitivity
Brand Familiarity
Brand Self- Congruity
Demographics
• Gender • Age • Personal income
• Household income
Expectancy Disconfirmatio
Product Performance Expectation
Perceived Product Performance
Product Usage
Consumer Satisfaction /
Dissatisfaction with the Product
Repurchase Intention
Perceived After-Care
Product Performance
Product Care
Consumer Satisfaction /
Dissatisfaction with the Brand
Expectancy Disconfirmation
After-Care Product
Performance Expectation
Perceived Brand Image at product-receiving
Product Return Intention
Consumer Satisfaction /
Dissatisfaction
Brand Name/Logo
Product Performance
Comparison Process
Comparison Process
H1 H2
H3
H4
H5
H6
Product-Consumption Stage
H8
Purchase Stage Product-Receiving Stage
Perceived Brand Image at Purchase
H7
H9
H11
H10
H12 H13
35

in which, consumers can see, touch, and try on the garment that they choose. In online
shopping, consumers cannot physically examine or try on the garment that they like.
When they purchase the product, they only can predict the product quality and how it
may look like or may fit. They can only examine the garment that they purchased after
they receive it. To examine CS/D when consumers receive the product that they ordered,
the stage of product-receiving stage was added in the framework of this study. The
product-receiving stage is the time when consumers receive and open the package, and
try on the product. They ordered the product from a website and have waited for a period
of time for the product to be delivered. This is the first time that consumers actually see
and touch the product. The proposed relationships and the hypotheses were discussed in
the following sections:
Individual Differences
Individual differences among consumers, such as gender, employment status and
personal income influence consumers’ attitude toward the whole process of apparel
online shopping (Xu & Paulins, 2005). d’ Astous & Saint-Louis (2005) suggest that
consumers’ brand sensitivity and familiarity with apparel brands would influence their
purchase decision. If consumers are more sensitive to or familiar with a certain apparel
brand, they are more likely to purchase the products of the brand. In this framework, four
individual difference variables (i.e., brand sensitivity, brand familiarity, brand
self-congruity, demographics) were proposed to have a significant influence on
consumers’ perception of brand image at purchase.
The first variable was brand sensitivity, which has been defined as the degree to
which a consumer notices or uses brands as important information to make purchase
decision (d’ Astous, and Saint-Louis, 2005; Nelson & Devanathan, 2006). Lachance,
Beaudoin and Robitaille (2003) suggest that if a consumer is brand sensitive, brands will
play an important role in his or her psychological process that precedes the purchasing act.
These propositions suggest that consumers with different levels of brand sensitivity may
place different levels of importance on brand information (e.g., brand name) when they
form their perception of brand image. Therefore, the relationship between brand
sensitivity and perceived brand image was included in the framework.
36

The second individual difference variable was brand familiarity, which can be
defined as the number of consumers’ brand-related, direct or indirect, experiences (Kent
& Allen, 1994). Alba and Hutchinson (1987) suggest that brand familiarity can increase
the degree of the influence of brand image because it captures consumers’ brand
associations within their memory and help consumers to form the brand knowledge
structure. Based on this proposition, the relationship between brand familiarity and
perceived brand image was included in the framework.
The third individual difference variable was brand self-congruity, which is defined
as the degree of similarity between consumer’s self-image and brand image (Sirgy, 1982).
Sirgy et al. (1997) found that brand self-congruity was a significant predictor of brand
preference, purchase intention and store loyalty. Malhotra (1988) examined consumers’
product purchasing choices and also found that consumers were likely to prefer, intend to
purchase, or use brands with image that they deemed consistent with their self-images.
According to these study findings, brand self-congruity was expected to be related to
brand image, and therefore, the relationship between brand self-congruity and perceived
brand image was included in the framework.
The fourth individual difference variable was demographics, including gender,
age, personal income, and household income. Sahdev and Gautama (2007) examined the
relationship between consumer characteristics including gender, nationality, level of
materialism, and brand perception, and found that nationality had a significant
relationship with brand perception. Laforet (2007) investigated the relationship between
consumers’ demographic characteristics and brand trust of banks, and found that gender,
age, and income were significantly related to participants’ brand trust. These study results
suggest that consumers’ demographic characteristics may be significant related to brand
image, and therefore, the relationships between consumers’ demographics and perceived
brand image was included in the framework.
To examine the relationships between the four individual difference variables (i.e.,
brand sensitivity, brand familiarity, brand self-congruity, demographics) and perceived
brand image, the first hypothesis was stated as below:
37

Hypothesis 1. There will be a significant relationship between perceived brand image at
purchase and the proposed individual difference variables (i.e., brand sensitivity,
brand familiarity, brand self-congruity, demographics).
Purchase Stage
At the purchase stage of online shopping, consumers browse websites to search
apparel product information. They use brand name and logo shown on the website to
distinguish various brands (Keller, 2003). Brand names also assist the consumer in
recalling brand benefits and play an important role in brand image (Holden & Vanhuele,
1999; Janiszewski & van Osselaer, 2000). Hem and Iversen (2004) define logo as the
graphic design, with or without brand name attached to it, to identify a brand image with
quality products or services. Based on these propositions, brand name/logo was proposed
to have influence on consumers’ perception of brand image in this framework.
Miller (1977) suggests that consumers form expectation for product performance
at purchase. Consumers may use various cues to form their expectation for the product
performance. In this framework, consumers’ perceived brand image at purchase was
proposed to be an important influence on the formation of consumers’ expectation for
product performance. Chen and Ching (2007) investigated university students’ perception
of mobile service to examine the relationship between consumers’ perception of brand
image and their expectation. The study results showed that there was a significant
relationship between the university students’ perceived brand image and their expectation.
When they perceived the mobile service company have better image, they had greater
expectation for the mobile service. O’Neal (1992) also found that consumers’ existing
perceived brand image influenced their expectation toward product performance of the
brand. Randall, Ulrich and Reibstein (1998) propose that in consumers’ mind, brand is
usually associated with product performance especially for the product attributes that are
difficult to observe. Since in online shopping, consumers cannot examine the
performance of many product attributes, it is possible that consumers may use brand
image to predict apparel product quality and form performance expectation of apparel
product quality. Thus, the relationship between perceived brand image at purchase and
38
consumers’ expectation for product performance was included in the framework of study.
The second hypothesis was stated as below:
Hypothesis 2. There will be a significant relationship between participants’ perceived
brand image at purchase and their expectation for product performance.
Participants who perceive the brand with better image will have a higher level of
expectation for product performance at the purchase stage.
Product-Receiving Stage
At the product-receiving stage in online shopping, after consumers receive the
product that they ordered online, they would examine the product performance such as fit,
style, color and workmanship to determine the product quality (Eckman, Damhorot &
Kadolph, 1990), and thus, product performance was included in the study framework and
proposed to have a significant influence on consumers’ perceived product performance.
Variables Influencing Perceived Product Performance at Product-Receiving
Various variables may influence consumers’ perception of the product
performance at the product-receiving stage. Jang, Dickerson and Hawley (2005)
conducted person-to-person interviews to examine how the performance of apparel was
measured by consumers and found that brand image was one of important criteria for
measuring apparel product performance. Swinker and Hines (2006) also found that brand
image significantly affected consumers’ perceived performance of garments. Baugh and
Davis (1989) found that store image influenced consumers’ evaluation of private label
shirts. Based on these study results, the relationship between perceived brand image at
purchase and consumers’ perceived product performance at the product-receiving stage
was included in this framework. The third hypothesis was stated as below:
Hypothesis 3. There will be a significant relationship between participants’ perceived
brand image at purchase and their perceived product performance at the
product-receiving stage. Participants who perceive the brand with better image at
39

the purchase stage will perceive the product performance to be better at the
product-receiving stage.
Miller (1977) suggests that when consumers evaluate the product performance
after they use the product, if the perceived performance is not consistent with their initial
expectation formed at purchase, they may adjust their perception of product performance
to make their expectation and perceived performance to be more consistent. This
proposition suggests that consumers’ expectation formed at purchase may influence their
evaluation of product performance at the product-consumption stage. This proposition
was supported by several study findings. Spreng, MacKenzie and Olshavsky (1996) and
Spreng and Mackoy (1996) examined the positive or negative effects of expectation on
perceived product performance and found a significantly positive effect of expectation on
perceived performance. Participants with a higher level of expectation perceived the
product performance significantly better than those with a lower level of expectation.
Based on these propositions and study results, it is possible that in online shopping,
consumers’ expectation formed at purchase may influence their evaluation of product
performance at the product-receiving stage, and thus, the relationship between consumer
expectation for product performance and perceived performance after they received the
product was included in the framework, and the fourth hypothesis was stated as below:
Hypothesis 4. There will be a significant relationship between participants’ expectation
for product performance at the purchase stage and their perceived performance at
the product-receiving stage. Participants who have a higher level of expectation
for product performance at the purchase stage will perceive the product
performance to be better at the product-receiving stage.
Variables Influencing CS/D with the Product and CS/D with the Brand
After consumers receive the product and evaluate the product performance, their
evaluation may directly or indirectly lead to satisfaction, indifference, or dissatisfaction.
Various variables may significantly influence CS/D at product-receiving stage. One is
product performance expectation at the purchase stage. Chen-Yu, Hong and Lee (2001)
40

compared U.S. and South Korean college student consumers and found that expectation
for apparel product performance to be a significant determinant of CS/D for college
student consumers in both countries. Consumers who had a higher level of expectation
for product performance at the purchase stage had a higher level of CS/D with the
product at the product-consumption stage. Chen-Yu et al. (1999) used apparel product
information (i.e., store name, price, country of origin, product performance information)
to manipulate consumers’ expectation for product performance at the purchase stage and
found that the higher the consumer expectation for product performance, the higher the
CS/D with the apparel product at the product-consumption stage. These study findings
suggest that it is possible that in online shopping, consumers’ product performance
expectation at the purchase stage may also have a significant influence on CS/D with the
product at the product-receiving stage, and thus, this relationship was included in the
framework, and Hypothesis 5 was developed as below:
Hypothesis 5. There will be a significant relationship between participants’ expectation
for product performance at the purchase stage and their satisfaction/dissatisfaction
with the product at the product-receiving stage. Participants who have a higher
level of expectation for product performance at the purchase stage will have a
higher level of satisfaction with the product.
Another antecedence of CS/D is perceived product performance. Tse and Wilton
(1988) found that whenever consumers perceived that a product performed well,
regardless of the previous comparison standard (e.g., expectation), consumers would be
satisfied. Chen-Yu et al. (1999) found that consumers’ perceived performance was a
determinant of CS/D with apparel products at purchase. Consumers who perceived the
product performance to be better had a higher level of satisfaction with the product at
purchase. Spreng et al. (1996) found a strong direct effect of perceived product
performance on CS/D at the product-consumption stage. When consumers perceived
better product performance, they had a higher level of satisfaction with the product after
consumption. Based on these study findings, the relationship between perceived product
41

performance and CS/D with the product at the product-receiving stage was included in
the framework and Hypothesis 6 was developed as below:
Hypothesis 6. There will be a significant relationship between participants’ perceived
product performance at the product-receiving stage and their
satisfaction/dissatisfaction with the product at the product-receiving stage.
Participants who perceive the product with better performance will have a higher
level of satisfaction with the product.
Another common predictor of CS/D is expectancy disconfirmation (i.e., the
difference between consumers’ perceived product performance and their expectation for
the product performance formed at purchase). Hong and Rucker (1995) examined CS/D
of female consumers in northern California toward either a jacket or pantyhose and found
that expectancy disconfirmation significantly affected CS/D with the product.
Consumers’ clothing satisfaction with the jacket or pantyhose was significantly higher
when they perceived product performance after consumption was better than their
expectation for the product performance formed at purchase (i.e., positive expectancy
disconfirmation). Chen-Yu et al. (1999) examining CS/D with apparel product
performance also found that expectancy disconfirmation was a determinant of CS/D with
the apparel product at the product-consumption stage. Consumers who perceived the
product performance at the product-consumption stage above their performance
expectation at purchase had a higher level of satisfaction. Based on these study findings,
the relationship between expectancy disconfirmation and CS/D with the product at the
product-receiving stage was included in the framework and Hypothesis 7 was developed
as below:
Hypothesis 7. There will be a significant relationship between participants’ expectancy
disconfirmation and their satisfaction/dissatisfaction with the product at the
product-receiving stage. Participants who perceive that the product performance is
better than the product performance they expected will have a higher level of
satisfaction with the product. Participants who perceive that the product
42

performance is worse than the product performance they expected will have a
lower level of satisfaction with the product.
CS/D with the product and CS/D with the brand may have a significant
interrelationship. Day (1982) suggests that CS/D with the retailer and CS/D with the
product are separate concepts, but they are interrelated. Ha (2004) proposes that if
consumers are not satisfied with the product performance sold on a website, their
satisfaction with the brand will be reduced and their probability of purchase the product
or service online will be decreased. Beerli, Martin and Quintana (2004) investigated
CS/D in the retail banking market and found the importance of consumers’ perceived
quality of the service in CS/D with the bank. If consumers perceived a higher level of
service quality, they had a higher level of satisfaction with the bank. These propositions
suggest that significant interrelationships may exist between CS/D with the product and
CS/D with the brand. Therefore, Hypothesis 8 and Hypothesis 9 were developed to
examine these relationships.
Hypothesis 8. Participants who have a higher level of satisfaction with the product will
have a higher level of satisfaction with the brand.
Hypothesis 9. Participants who have a higher level of satisfaction with the brand will
have a higher level of satisfaction with the product.
Influence of CS/D with the Brand on Perceived Brand Image at Product-Receiving
After consumers received and examined the product they ordered online, their
satisfaction/dissatisfaction with the brand may influence their perception of brand image
at product-receiving stage. No studies were found have discussed the relationship
between CS/D with the brand and the perception of brand image. However, Pritchard,
Havitz and Howard (1999) propose that CS/D influences consumers' brand attitude.
Russell-Bennett, McColl-Kennedy and Coote (2007) found that consumers who had a
higher level of satisfaction held a positive attitude toward the preferred brand and had a
higher brand loyalty. Above proposition and study finding suggest that CS/D with the
43
brand may influence consumer’s perceived brand image. This relationship was included
in this framework. Hypothesis 10 was developed as below:
Hypothesis 10. There will be a significant relationship between participants’
satisfaction/dissatisfaction with the brand and their perception of brand image at
the product-receiving stage. Participants who have a higher level of satisfaction
with the brand will perceive the brand with better image at the product-receiving
stage.
Influence of CS/D with the Product on Intention of Product Return
CS/D with the product may play a significant role in consumers’ future behaviors,
such as product return. Blumberg (2008) proposes that a large portion of product return is
due to customers who are not satisfied with the product. Nitse, Parker, Krumwiede and
Ottaway (2004) investigated consumers’ satisfaction with fashion websites and found that
if consumers were dissatisfied with the color of the product, they were more likely to
return the product. Based on the proposition and the study result and, the relationship
between CS/D with the product and product return intention was included in this
framework. Hypothesis 11 was developed as below:
Hypothesis 11. There will be a significant relationship between participants’
satisfaction/dissatisfaction with the product at the product-receiving stage and
their product return intention. Participants who have a higher level of satisfaction
with the product will have a lower level of intention to return the product.
Influences of CS/D with the Brand and Perceived Brand Image at Product-Receiving on
Repurchase Intention
CS/D with the brand may play a significant role in consumers’ intention to
repurchase products of the same brand. Oliver (1980a) proposes a cognitive model of the
antecedents and consequences of CS/D, in which, repurchase intention is proposed as a
consequence of CS/D. Kim, Ferrin and Rao (2003) investigated college students’ online
shopping behavior and found that there was a significant relationship between CS/D with
44

the e-tailer and their repurchase intention to buy products on the same website of the
e-tailer. The higher the level of consumers’ satisfaction with the e-tailer, the more likely
they would repurchase products on the same website. Based on these propositions and
study results, the relationship between CS/D with the brand and repurchase intention was
included in the framework. Hypothesis 12 was developed as below:
Hypothesis 12. There will be a significant relationship between participants’
satisfaction/dissatisfaction with the brand at the product-receiving stage and their
intention to repurchase the products of the same brand. Participants who have a
higher level of satisfaction with the brand will have a higher level of repurchase
intention.
Studies showed that consumers’ perception of brand image had a significant
relationship with their purchase intention and repurchase intention. Grewal, Krishnan,
Baker and Borin (1998) found that store image had a direct and positive relationship with
consumers’ purchase intention. Consumers who perceived the better the store image, the
higher the consumers’ intention to purchase the products from the same store. Lo (2001)
used jeans and grocery products to examine the relationship between consumers’ brand
image evaluation and their repurchase intention. The author found that consumers who
evaluated the brand image to be better had a higher level of intention to repurchase the
products of the brand. These study findings suggest that there may be a relationship
between consumers’ perception of brand image at the product-receiving stage and their
intention to repurchase the product of the same brand. Thus, this relationship was
included in this framework and Hypothesis 13 was developed as followed:
Hypothesis 13. There will be a significant relationship between participants’ perception
of brand image at the product-receiving stage and their intention to repurchase the
product of the same brand. Participants who perceive the brand with better image
at the product-receiving stage will have a higher level of repurchase intention.
45
Product-Consumption Stage
Based on the model proposed by Chen-Yu, et al. (1999), the product-consumption
stage starts from the time that consumers wear the apparel product. After they take care of
the garment, for example, washing or dry-cleaning the garment, consumers form a
perception of the product performance. According to the study results of Chen-Yu et al.,
three variables were determinants of CS/D with performance after wash (i.e., consumers’
perception of after-wash product performance, the disconfirmation between consumers’
after-wash performance expectation and perceived after-wash performance, and CS/D at
purchase). Based on these results, four antecedents of CS/D at the product-consumption
stage were included in this framework, (i.e., consumers’ perception of after-care
performance, expectancy disconfirmation between after-care product performance
expectation at the product-receiving stage and perceived after-care product performance,
CS/D with the product, CS/D with the brand). Because this study only focused on CS/D
at the product-receiving stage, no hypothesis was proposed for the examination of the
relationship at the product-consumption stage.
Research Method
Both experimental and survey design techniques were used in the study. A 2 X 2
between-subjects factorial experimental design was developed. At the purchase stage, the
treatment variable was perceived brand image. Brand name and logo were used to create
two levels of perceived brand image at the purchase stage (i.e., higher, lower). At the
product-receiving stage, the treatment variable was perceived product performance.
Garments with two levels of performance were used to create two levels of perceived
product performance (i.e., higher, lower). This design resulted in four experimental
groups (See Table 3.1). In Group 1, participants were exposed to a higher level of brand
image at the purchase stage and a higher level of product performance at the
product-receiving stage. In Group 2, participants were exposed to a higher level of brand
image at the purchase stage and a lower level of product performance at the
product-receiving stage. In Group 3, participants were exposed to a lower level of brand
image and a higher level of product performance at the product-receiving stage. In Group
46

4, participants were exposed to a lower level of brand image and a lower level of product
performance at the product-receiving stage. Thirty participants were randomly assigned
to each experimental group, 120 participants in total.
Selection of Participants
University students were selected as participants in this study for the following
reasons. University students are one of the major users of Internet (Pitkow & Kehoe,
1996). They are usually savvy in computer skills and web browsing. They search for
product information on websites and spend a lot in online apparel shopping (Comegys &
Brennan, 2003). However, their perceptions of quality of apparel products do not
significantly differ from non-students (Peterson & Jolibert, 1995). In addition, the data
collection of an experimental design study needs to be conducted in a controlled
environment. University students are willing to come to the experimental setting and
commit to the time requirements. These factors are important for an experimental study.
Table 3.1 Factorial design of treatment variables
Product Performance
at the Product-Receiving Stage
High Low
High
Group 1
• Higher Brand Image • Higher Product Performance
Group 2
• Higher Brand Image • Lower Product Performance
Brand Image at the Purchase
Stage
Low
Group 3
• Lower Brand Image • Higher Product Performance
Group 4
• Lower Brand Image • Lower Product Performance
A convenience sampling method was adopted in this study. An advertisement (See
Appendix A) regarding experiment time, place and the contact information of the
researcher was placed on the announcement boards in each dorm on campus to recruit
47

undergraduate students to participate in the study. To control the variance of gender, the
number of male and female participants in each experimental cell was 15 males and 15
females. Due to the size range of garment samples was M, L, XL and XXL, the
undergraduate students who wore size S were not recruited.
Selection of Treatments
There were two treatment variables: brand image at the purchase, and product
performance at the product-receiving stage. The selection of each treatment is discussed
in the following sections.
Selection of Brand Name and Logo
Brand image is a set of consumer-constructed associations linked to the brand,
which is usually organized in some meaningful ways (Aaker, 1991; Keller, 1993; Nandan,
2005). Brand image can be categorized in five dimensions: brand name/logo, brand
benefits, brand attitudes, brand personality, and brand providers and users. According to
Biel (1992), consumers connect the brand name/logo directly to brand image. Zinkhan
and Martin (1987) indicate that consumers often form instant, non-neutral attitudes
towards the brand based on brand name or logo alone. Van Gelder (2003) also states that
brand image can be transferred into a logo or a name that presents identity. In Yang’s
study (2003) about the impact of brand image on perceived value in the woman’s
underwear market, she successfully used brand names and logos to create different brand
image; therefore, brand name and logo were also used to create high and low levels of
brand image in this study.
To select two brand names/logos to create different levels of brand image, the
researchers first conducted an online survey to identify the brands of sweatshirts provided
on the e-tailers. Using the filter criteria of selling both men’s and women’s sweatshirts
and offering at least 10 styles of sweatshirts, 15 brands were identified. These brands
could be categorized into four price ranges from the highest to the lowest. The highest
price range was $60 to $74.99, including Abercrombie & Fitch, Armani Exchange and J.
Crew. The second price range was $45 to $59.99, including, Adidas, Nike, and Reebok.
The third price range was $30 to $44.99, including American Eagle, Gap, Hollister Co.
48

and Champion. The lowest price range was $15 to $29.99, including Aéropostale, Forever
21, Hanes, Land's End and Old Navy.
After identifying 15 brands of sweatshirts, 60 undergraduate students were asked
to participate in a survey to evaluate the image of the 15 brands identified by the online
survey (see Appendix B). The measure scale ranged from 0 to 6. If the participants did
not know the brand, they chose “0”. Six is the maximum possible point, indicating that
the highest brand image. The campus interception method was used to recruit participants
for this survey. Undergraduate students in the library, dining halls, bus stops and math
emporium were recruited to participate in the survey. The results showed four brands (i.e.,
Armani Exchange, Champion, Forever 21, Land's End) being rated more than 10 times of
“0” (i.e., did not know the brand), and thus being eliminated. The average scores of the
rest of 11 brands showed that the brand with highest brand image was Abercrombie &
Fitch, and the brand with lowest brand image was Aéropostale. The mean scores were
4.73 and 2.33, respectively. The paired t-test result showed that there was a significant
difference between these two brands in brand image (t = 2.00, p < .001). Based on these
results, the brand name/logo of Abercrombie & Fitch and Aéropostale were used to create
two levels of brand image.
Selection of Garment Samples
Sweatshirts were chosen to be the garment samples of this study because
sweatshirts can be found in many online shopping websites and almost all consumers
have experiences in wearing and buying sweatshirts. There is no age or gender limitation
in wearing sweatshirts. Based on the results of an online survey conducted by the
researchers, the most common fiber content of sweatshirts sold online was 80% cotton
and 20% polyester. To avoid the results to be influenced by participants’ preference in
fiber content, 80% cotton and 20% polyester was used to describe the fiber content of the
sweatshirts. To avoid the results to be influenced by participants’ preference in color and
design patterns, a sweatshirt with a basic style (i.e., rib crew neck, rib cuffs, long sleeves,
solid color, no logos, no pockets, no design features) was selected as the garment sample
for this study.
49

To create different levels of product performance, sweatshirts with different
quality were selected. Two, navy color, men’s sweatshirts and two, gray color, women’s
sweatshirts were chosen. For men’s sweatshirts, the sweatshirts with a higher level of
quality were purchased from the Belk Department Store and the brand name was
“Saddlebred.” The sweatshirts with a lower level of quality were purchased from
Clothingwarehouse.com and the brand name was “Jerzees”. The fabric thickness of the
two sweatshirts was compared. The thickness of the men’s sweatshirts with better quality
was 1.60 mm in average and the sweatshirts with a lower level of quality was 1.16 mm in
average. The t-value showed that the fabric thickness of the two men’s sweatshirts was
significant different (t = 2.44, p < .001). To ensure the perception of the quality of the two
men’s sweatshirts were significantly different, a pilot-test, using a survey in Appendix C,
was conducted. One group of 33 undergraduate students was asked to evaluate the
sweatshirts representing the one with a higher level of quality and another group of 36
students was asked to evaluate the sweatshirts representing the one with a lower level of
quality. The mean scores were 4.36 and 3.50, respectively. The t-test results showed that
there was a significant difference between these two sweatshirt samples in product
performance (t = 1.67, p < .001). Therefore, the two navy men’s sweatshirts were adopted
as the garment samples in this study.
For women’s sweatshirts, the sweatshirts with a higher level of quality were from
the Belk Department Store and the brand name was “Kim Rogers”. The sweatshirts with
a lower level of quality were purchased from Clothingwarehouse.com and the brand
name was “Jerzees”. The fabric thickness of the two sweatshirts was compared. The
thickness of the women’s sweatshirts with better quality was 1.54 mm in average and the
sweatshirts with a lower level of quality was 1.32 mm in average. The t-value showed
that the fabric thickness of the two women’s sweatshirts was significant different (t =
2.31, p < .001). To ensure the quality of the two women sweatshirts were evaluated
significantly different, a pilot-test, using a survey in Appendix C, was conducted. One
group of 16 undergraduate students was asked to evaluate the sweatshirts representing the
one with a higher level of quality and another group of 37 students was asked to evaluate
the sweatshirts representing the one with a lower level of quality. The mean scores of
product evaluation were 5.00 and 2.70, respectively. The t-test results showed that there
50

was a significant difference between these two sweatshirt samples in product
performance (t = 2.04, p < .001).
In this study, 30 male and 30 female participants were recruited to try on the
sweatshirts with a high level of quality, and another 30 male and 30 female participants
were recruited to try on the sweatshirts with a low level of quality. Each garment was
estimated to be tried on by five participants; therefore, 6 men’s and 6 women’s
sweatshirts with a higher quality, and 6 men’s and 6 women’s sweatshirts with a lower
quality were purchased. For both men’s and women’s, the size range was M, L, XL, and
XXL. The S size was not included because S size sweatshirt was not available in the Belk
store. According to the sales associate, customers seldom purchase S size sweatshirts, and
therefore, the Belk store does not carry S size for sweatshirts. Based on the available
sizes in the stores, the size ratio purchased for both men’s and women’s sweatshirts was 1,
2, 2, 1 for sizes M, L, XL, and XXL, respectively. The measurements of chest, shoulder,
and body length of each size were listed in Appendix D.
Instrument Development
Online shopping web pages and two sets of questionnaires were developed as the
instruments of the research. The development of the web pages and the questionnaire
were described in the following sections.
Internet Shopping Web Pages
Internet web pages were used as a medium to create an online shopping
environment for participants to role-play an online purchase with a sweatshirt. For men’s
sweatshirt, Appendix E.1 showed the web pages for the brand having a higher level of
brand image. Appendix E.2 showed the main page and size chart for the brand having a
lower level of brand image. To prevent the study results being influenced by the website
design, the design of web page shown to different experimental groups were the same.
The only differences were the brand name, brand logo and the size chart. The picture of
sweatshirts in both web pages (i.e., the web page for the higher brand image, the web
page for the lower brand image) was the same. The picture of the sweatshirt represents
51

the higher-quality one was used in both web pages to prevent the influence of
participants’ perception of pictures rather than brand image on the study results. For
women’s sweatshirt, Appendix E.3 and E.4 showed the main page and size chart for the
brand having a higher level of brand image and a lower level of brand image respectively.
The web page design included six elements. They were: the view of the product,
product information, privacy policy, ordering and delivery process, shipping and return
policy, and customer service information. The view of the product included normal size
and larger-sized photos that gave participants a detailed view of the product. According to
Eckman, Damhorot and Kadolph (1990), product information should include style
description, color description, fiber content, size chart/availability, and therefore, these
four features were included in the web pages. Studies results showed that price and
country of origin were significant factors that consumers used to access apparel product
quality (Hatch & Roberts, 1985; Heisey, 1990). To avoid the influence of price and
county of origin on the perception of brand image and product performance, the
information of price and country of origin was omitted. Researchers suggest that the lack
of security on the websites will make online shoppers have serious concerns about their
credit card transactions and privacy of personal information (French & O’ Cass, 2001;
Jun et al., 2004; Madu & Madu, 2002). Therefore, the privacy policy regarding consumer
personal information protection was included in the web pages. For ordering and delivery
process, purchasing and payment options were provided, and order status checking was
included for consumers to estimate waiting time of receiving products (Hui & Zhou,
1996). Shipping and return policy such as shipping and handling charges and
return/exchange policy were adopted from a website selling apparel products. The contact
fax/phone number and company e-mail address were also included in the web page
design.
Questionnaire Development
Two sets of questionnaires were developed with identical questions but with
different brand names. One questionnaire contained a brand name with a higher level of
brand image (see Appendix F.1 and F.2) was used in the Higher Brand Image Groups (i.e.,
Groups 1, 2). The other questionnaire contained a brand name with a lower level of brand
52

image (see Appendix F.3 and F.4) was used in the Lower Brand Image Groups (i.e.,
Groups 3, 4). The first part of the questionnaire was for participants to answer after
seeing a web page (see Appendix F.1 and Appendix F.3). The second part was for them to
respond after role-playing that they have purchased the sweatshirt shown on the web page,
received the product after the delivery time they expected, and tried on the sweatshirt that
they received (see Appendix F.2 and Appendix F.4). The questions in each part were
discussed in the following sections.
Questionnaire – Part I
Two variables were measured in Questionnaire – Part I. They were perceived
brand image and performance expectation at the purchase stage.
Perceived brand image at purchase. Participant’s total impression toward the
brand shown on the web page was measured in Questionnaire – Part I, Question 1. This
item was adapted from Chung (2002). A six-point scale ranging from “Terrible” (1) to
“Excellent” (6) was used.
Performance expectation. The predictive performance expectation (i.e., what the
consumer believes the performance will be) was measured in Questionnaire – Part I,
Question 2. The participant was asked to indicate their expectation about the sweatshirt
based on the picture and information shown on the web pages. This item was adapted
from Chen-Yu’s study (1995) and a six-point scale ranging from “Terrible” (1) to
“Excellent” (6) was used.
Questionnaire – Part II
Seventeen variables were measured in Questionnaire – Part II. The measure of
each variable was discussed in the following sections.
Perceived performance. Six items were included in Questionnaire – Part II,
Section I, Question 1 to 6 to measure the participant’s perception of the performance of
the sweatshirt at the product-receiving stage. After trying on the sweatshirt, the
participant was asked to evaluate the overall performance of the sweatshirt in Question 1.
In Question 2 to 6, the participant was asked to evaluate the style, color, fabric, fit and
workmanship of the sweatshirt, respectively. A six-point scale, ranging from “Terrible” (1)
53

to “Excellent” (6), was used and these questions were adapted from the study of Chen-Yu
(1995).
Expectancy disconfirmation. Expectancy disconfirmation was measured in
Questionnaire – Part II, Section II, Question 1 to 6. In Question 1, the participant was
asked to compare his/her initial expectation held at purchase and the perception of the
performance of the sweatshirt and indicate if the performance was worse than he/she
expected, just as expected, or better than expected. In Question 2 to 6, the participant was
asked to compare his/her initial expectation held at purchase and the perception of the
performance of the style, color, fabric, fit, and workmanship of the sweatshirt and
indicate if the performance was worse than he/she expected, just as expected, or better
than expected. These items were derived from Chen-Yu (1995) and a scale ranging from
“Much Worse Than I Expected” (-3), to “Just as I Expected” (0), to “Much Better Than I
Expected” (+3) was used.
Perceived brand image at product-receiving. Perceived brand image at the
product-receiving stage was measured in Questionnaire – Part II, Section III, Question 1.
Participant’s total impression toward the brand was measured again using the same
question that measured the perceived brand image at purchase. A six-point scale ranging
from “Terrible” (1) to “Excellent” (6) was used.
Satisfaction/dissatisfaction with the brand and with the product. Two types of
satisfaction/dissatisfaction were measured in this study. The CS/D with the brand was
measured in Questionnaire – Part II, Section III, Questions 2 and 3, and CS/D with the
product was measured in Questionnaire – Part II, Section III, Questions 4 to 6. Two
different measure formats (i.e., verbal, graphic), adapted from Chen-Yu’s study (1995),
were used. In Question 2, the participant was asked to evaluate the degree of his/her
satisfaction/dissatisfaction with the brand by choosing from a seven-point scale with
“Very Low” (-3), to “Neutral” (0), to “Very High” (+3). In Question 3, a graphic format
of a continuum of percentage of satisfaction was shown to the participant. The participant
was asked to write down the percent of satisfaction that he/she had with the brand. In
Question 4, the participant was asked to evaluate the degree of his/her
satisfaction/dissatisfaction with the performance of the sweatshirt by choosing from a
seven-point scale with “Very Low” (-3), to “Neutral” (0), to “Very High” (+3). Question
54

5 was similar to Question 3; a graphic format of a continuum of percentage of satisfaction
was used to measure the percent of satisfaction that the participant had with the
sweatshirt. In Question 6, an open-end question was used to ask the participant to explain
why he or she was satisfied or dissatisfied with the sweatshirt.
Product return intention. Product return intention was measured in
Questionnaire – Part II, Section III, Question 7. The participant was asked to indicate
how likely he/she would be to return the sweatshirt based on the price which corresponds
to the actual market price of the brand. The statement was adapted from the study of
Jiang and Rosenbloom (2005). A scale ranging from “Very Unlikely” (1) to “Very Likely”
(6) was used.
Repurchase intention. Repurchase intention was measured in Questionnaire –
Part II, Section III, Question 8. The participant was asked to indicate how likely he/she
would be to buy apparel products of the brand. This item was adapted from the study of
Belleau et. al (2007). A scale ranging from “Very Unlikely” (1) to “Very Likely” (6) was
used to measure the repurchase intention.
Brand sensitivity. Brand sensitivity was measured in Questionnaire – Part II,
Section IV, Questions 1 to 7. Questions 1 and 2 were to measure the participant’s
attention to apparel brands and if consumers use brands as a cue of the quality of apparel
products. These two questions were adapted from the study of d’ Astous and Saint-Louis
(2005). Question 3 was to measure the degree of importance of buying a brand name
apparel product for consumers. This question was created by the researchers of this study.
Questions 4 to 7 were to measure the participant’s sensitivity to brand while buying
sweatshirts, which were adapted from Lachance, Beaudoin and Robitaille (2003). The
participant was asked to choose the number from 1 to 6, ranging from “Strongly
Disagree” (1) to “Strongly Agree” (6).
Brand familiarity. Brand familiarity was measured in Questionnaire – Part II,
Section V, Questions 1 to 3. For Question 1, Park and Stoel’s (2005) statement was
adapted. The participant was asked to indicate how familiar he or she was with the brand
shown in the questionnaire. The question was measured on a six-point scale, ranging
from “Very Unfamiliar” (1) to Very Familiar” (6). In Question 2, the participant was
asked to indicate how knowledgeable he or she was with the brand shown in the
55

questionnaire. The question was measured on a six-point scale ranging from “Not
Knowledgeable” (1) to “Very Knowledgeable” (6). In Question 3, the participants was
asked if he or she had any previous experience with the brand. The question was
measured on a seven-point scale, ranging from “No Experience” (0) to “A Lot of
Experiences” (6). These two statements in Question 2 and 3 were adapted from the study
of Kent and Allen (1994).
Brand self-congruity. Brand self-congruity contained two types of brand
self-congruity, actual brand self-congruity and ideal brand self-congruity. Actual brand
self-congruity was measured in Questionnaire – Part II, Section VI, Questions 1 to 3.
Three items (i.e., how the brand reflects myself, comparing myself with others, the brand
image fits how I see myself) were adapted from the studies of Han (2006) and Helgeson
and Supphellen (2004). Ideal brand self-congruity was measured in Questionnaire – Part
II, Section VI, Questions 4 to 6, which were also adapted from Han (2006) and Helgeson
and Supphellen (2004). In these three statements, the term “would like to be” was used to
measure the participant’s expected ideal self-image by wearing the brand. For example,
one statement was “Wearing (the brand name) products reflect who I would like to be”.
The scale for actual brand self-congruity and ideal brand self-congruity was the same,
which was a six-point scale, ranging from “Strongly Disagree” (1) to “Strongly Agree”
(6).
Wardrobe expenditures and experiences in apparel online shopping. In
Questionnaire – Part II, Section VII, Questions 1 to 4, the participant’s wardrobe
expenditure and experiences in apparel products online shopping were asked. In Question
1, the participant’s total wardrobe expenditure in last year was asked. The frequency of
apparel online shopping was asked in Question 2. How much money and how many
apparel items the participant has purchased online in last six months were asked in
Questions 3 and 4.
To measure the participant’s confirmation/disconfirmation of perception on the
picture and actual product, the participant was asked to indicate how similar the
sweatshirt he or she received to the picture shown on the web page. If differences exist,
he or she had to briefly explain the differences. Two items were developed by researchers
in Questionnaire – Part II, Section VII, Questions 5 and 6.
56

Demographics. In Questionnaire – Part II, Section VIII, Questions 1 to 6,
demographic characteristics of the participant was asked, including gender, age, major,
class standing, personal income, and annual household income. These questions were
adapted from Chen-Yu’s study (1995).
Data Collection
Virginia Tech undergraduate students were recruited as participants in this study.
There were 25 dorms on campus for Virginia Tech undergraduate students, and nine of
them were assigned for different specific groups, such as students with leaderships or
transferred students. Among the 16 non-assigned dorms, eight of them were co-ed dorms
(i.e., both male and female students live there). Co-ed dorms were selected for the data
collection because co-ed dorms were easier for both male and female students to come to
participate in the experimental study compared with only male-allowed or only
female-allowed dorms. Based on the availability of space, two co-ed dorms were selected,
and one room in each dorm was reserved as experimental space for collecting data.
Before the data collection, a protocol submission package was sent to the
Institutional Review Board for Research Involving Human Subjects (IRB) to gain
approval for data collection. The advertisement shown in Appendix A was posted on the
announcement boards in each dorm to recruit participants. The information of time and
place of the experimental study was included in the advertisement. The contact
information (i.e., name, e-mail) of the researcher was also be provided. In order to
increase the participation rate, a drawing of 25 dollars for every 10 participants were be
the compensation and also be announced in the advertisement. Participants who wanted
to join the drawing were asked to leave their contact information on a drawing
participation sheet, and a number from 1 to 10 was assigned on the sheet. Once the
researcher received 10 drawing participation sheets, a drawing was conducted. The
drawing method was using 10 table tennis balls with marked number 1 to 10 respectively
to represent these 10 participants. These balls were collected in a big black box. To avoid
disruption, the drawing was conducted outside the experiment room. If the winner was
living in the dorm where the data collection was conducted, a friend of the researcher
57

delivered the $25 winning prize to the room immediately. For the winners who could not
be contacted immediately, they were contacted using the contact information that he or
she left on the contact information sheet.
The data collection procedure was as following:
1. A consent form stating purpose of study, procedure of the study and the approximate
time was prepared for the participant to sign (See Appendix G).
2. After the participant returned the signed consent form, he or she was randomly
assigned to an experimental group (Group 1 to 4) based on a prepared random
number sheet (Appendix I). The Microsoft Excel software was used to obtain the
random number sheet.
3. After the participant was assigned to a group, a computer was provided for him or her.
Instruction 1 (Appendix H.1 and H.2) was shown on the computer screen to describe
the scenario and guide the participant to role-play the online shopping process step by
step. Participants in all experimental groups received the same instruction. At the end
of the instruction, the participant was asked to click on the link of “Enter the website”
and started to examine the picture of the sweatshirt and read the information provided
on the website (Appendix E). Groups 1 and 2 received the web pages that contained a
brand with a higher level of brand image, and Groups 3 and 4 received the web pages
and Instruction 1 that contained a brand with a lower level of brand image.
4. After the participant browsed the website, a copy of Questionnaire – Part I (Appendix
F.1 and F.3) was given to the participant to answer. The version of questionnaires
given was based on the experimental group, in which he/she was assigned. Groups 1
and 2 received the questionnaire containing a brand with a higher level of brand
image, and Groups 3 and 4 received the questionnaire containing a brand with a lower
level of brand image. The questionnaire was prepared in a hard copy.
5. After the participant completed Questionnaire – Part I, the participant was instructed
by the researchers to click on the link of “Exit the website”, which linked to
Instruction 2 (Appendix H.3 and H.4). Groups 1 and 2 received the instruction that
contained a brand with a higher level of brand image, and Groups 3 and 4 received
the instruction that contained a brand with a lower level of brand image. In
Instruction 2, the participant was asked to let the researcher know which size that he
58

or she would purchase. A sweatshirt with the selected size was given to the
participant to try on. Groups 1 and 3 received the sweatshirt with a higher level of
product performance, and Groups 2 and 4 received the sweatshirt with a lower level
of product performance.
6. After trying on the sweatshirt, the participant was asked to remain wearing the
sweatshirt and completed Questionnaire – Part II (Appendix F.2 and F.4). Groups 1
and 2 received the questionnaire that contained a brand with a higher level of brand
image, and Groups 3 and 4 received the questionnaire that contained a brand with a
lower level of brand image.
7. After completing Part II of the questionnaire, the participant returned the
questionnaire and the sweatshirt. If the participant would like to participate in the
drawing, he or she was asked to leave the information (i.e., name, major, address,
e-mail address, phone number). A drawing was conducted after every 10 participants
who wanted to join in the drawing and had completed the data collection procedure.
Data Analysis
Both Statistical Package for the Social Sciences (SPSS) 15.0 and Analysis of
Moment Structures (AMOS) 7.0 were used for the data analysis. Descriptive analysis (i.e.
frequency, percentage) and chi-square tests were used to examine participants’
demographic profiles, wardrobe expenditures and apparel online shopping experiences.
The t-test was used to check if the two treatment variables (i.e., brand image and product
performance) were successfully manipulated by brand name/logo and garments with
different product quality. Confirmatory factor analysis was used to examine the construct
of brand sensitivity, brand familiarity, brand self-congruity, perceived product
performance and expectancy disconfirmation and Cronbach’s alpha was calculated to
examine the reliability of the construct.
For hypothesis testing, multiple regression analysis was used to examine
Hypothesis 1 that which individual difference variables were significantly related to
perceived brand image at purchase. Structural equations modeling (SEM) was conducted
to test Hypothesis 2 to 13 in this study. SEM examines relationships of variables
59

60
simultaneously in the proposed research model. This analyzing skill provides a method to
deal with multiple relationships and also provided high statistical efficiency (Hair,
Tatham, Anderson & Black, 1998). The drop in chi-square value greater than 4.00 was
used to remove any restriction and include new path between variables in the model. The
reason of setting 4.00 as the criterion was because the critical value in the chi-square
distribution with one degree of freedom is 3.84. If the drop in chi-square is less than 3.84,
the change will not be significant. For convenience, the value 4.00 is used instead of the
exact value of 3.84 (Structural Equation Modeling, 2005).
To examine the model fit, both absolute indexes and comparative indexes of fit
were used. Goodness of fit index (GFI) and adjusted goodness of fit index (AGFI) are
classified as absolute indexes of fit because they compare the hypothesized model with
no model (Hu & Bentler, 1995). These two indexes were used in this study because they
are popular measures although Fan, Thompson, and Wang (1999) caution that GFI and
AGFI values can be overly influenced by sample size. An index value of equal or greater
than .90 was used as an indicator of acceptable fit (Byrne, 2001; Structural Equation
Modeling, 2005). Comparative indexes of fit are based on a comparison of the
hypothesized model against some standard (e.g., the independence model), which
represents a baseline model. Among the comparative indexes of fit, the comparative fit
index (CFI) and incremental fit index (IFI) were selected to be used because these
indexes take sample size and degrees of freedom into account, which are considered to be
better indexes. An index value closer to .95 was used as an indicator of good fit based on
the suggestion of Hu and Bentler (1999). In addition to the four comparative indexes of
fit, the root mean square error of approximation (RMSEA) was also used to examine the
model fit because RMSEA has been recognized as one of the most informative criteria in
covariance structure modeling (Byrne, 2001). It takes into account the error of
approximation in the population. The index value less than .08 was used as an indicator
of acceptable fit based on the suggestion of Browne and Cudeck (1993). To test the
hypotheses, the standardized regression weight (i.e., a number between 0 and 1) will be
reported and the p-value of the hypothesized relationship will be calculated to determine
if the standardized regression weight is significantly different from 0. A level of
significance of .05 will be used as the standard for rejecting or supporting the hypothesis.

CHAPTER IV
RESULTS
In this chapter, the results of the study were reported in the following sections
based on the framework of consumer satisfaction/dissatisfaction (CS/D) with the
purchased apparel product and the brand in an online shopping context proposed in
Chapter III. First, participants’ profiles were stated. The measurement reliability and
manipulation check were in the second section. The results of hypothesis testing were
reported in the third section.
Participants’ Profiles
Participants’ profiles were described in the following three sections. In the first
section, participants’ demographic characteristics were stated, including gender, age,
major, class standing, personal income and annual household income. Participants’
wardrobe expenditures and apparel online shopping experiences were described in the
second section. In the third section, gender differences were compared and presented.
Demographic Characteristics
A total of 120 undergraduate students participated in this study, including 60 male
and 60 female students. Demographic characteristics (i.e., gender, age, major, class
standing, personal income, annual household income) of participants were listed in Table
4.1. Participants’ ages ranged from 18 to 25 and most of them were 18 to 19 years old,
32.5% and 46.7%, respectively. The majority of the participants majored in Engineering
(38.3%), followed by Business (19.2%) and Liberal Arts & Human Sciences (15.8%).
Most of them were freshman and sophomore (44.2% and 39.2%). As for their personal
income, most of the participants were not employed (50.0%) or their personal income
61

Table 4.1 Demographic characteristics of the participants
Variable Description Frequency PercentageGender Male 60 50.0% Female 60 50.0% Age 18 39 32.5% 19 56 46.7% 20 13 10.8% 21 5 4.2% 22 5 4.2% 25 2 1.7% College Agriculture & Life Sciences 9 7.5% Architecture & Urban Studies 3 2.5% Business 23 19.2% Engineering 46 38.3% Liberal Arts & Human Sciences 19 15.8% Natural Resources 1 0.8% Science 12 10.0% University Studies 7 5.8% Class Standing Freshman 53 44.2% Sophomore 47 39.2% Junior 14 11.7% Senior 6 5.0% Personal Income Not employed 60 50.0% Under $ 10,000 53 44.2% $ 10,000 – $ 14,999 5 4.2% $ 15,000 – $ 19,999 0 0.0% $ 20,000 – $ 24,999 1 0.8% $ 25,000 – $ 34,999 1 0.8% $ 35,000 – $ 49,999 0 0.0% $ 50,000 and more 0 0.0% Annual Household Income Under $ 10,000 8 6.7% $ 10,000 – $ 14,999 2 1.7% $ 15,000 – $ 19,999 6 5.0% $ 20,000 – $ 24,999 6 5.0% $ 25,000 – $ 34,999 6 5.0% $ 35,000 – $ 49,999 13 10.8% $ 50,000 – $ 69,999 20 16.7% $ 70,000 – $ 89,999 55 45.8% $ 90,000 and more 8 3.3% Missing data (Unwilling to answer) 4 6.7%
62

was under $10,000 before tax for 2006 (44.2%). Most participants’ annual household
income was $70,000 – $89,999 (45.8%).
Wardrobe Expenditures and Apparel Online Shopping Experiences
Participants’ wardrobe expenditures and apparel online shopping experiences
were also investigated (See Table 4.2). More than half of the participants (58.3%) had an
experience in purchasing apparel products online. Among these apparel online shoppers,
most purchased apparel products every half year (60.0%), spent under $100 or less
(66.7%), and purchased one to three items in last six months (67.3%). Online shoppers
and non-online shoppers were compared in money spent on the wardrobe last year. In
chi-square test, the number in each cell should be at least five; therefore, the participants
spending $1,000 - $1,499 and $1,500 and more were combined. The results of chi-square
test showed that there was a tendency for online shoppers to spend more than non-online
shoppers on their wardrobe last year. However, the difference was not significant at
the .05 level [X² (3) = 7.58, p = .06].
Gender Differences
Gender differences of participants’ wardrobe expenditures and apparel online
shopping experiences were examined by chi-square tests. The results showed that there
was a significant difference between male and female participants in money spent on the
wardrobe last year [X² (4) = 33.71, p < .001] (See Table 4.3). Almost three quarters of
female participants (70.0%) spent $200 to $1,000 on their wardrobes last year, and more
than one quarter of female participants (28.3%) spent above $ 1,000 while most male
participants spent either under $200 (38.3%) or $200 to $ 499 (43.3%) on their wardrobes
last year. Only 18.4% spent above $500 on their wardrobes last year. The number of
online shoppers and non-online shoppers between genders was compared and the results
of chi-square test showed a significant difference [X² (1) = 4.94, p < .05]. Significantly
more female (58.6%) participants than male participants (41.4%) were apparel online
shoppers.
The frequency of purchasing apparel products online was compared between
genders and the results showed that female participants had a higher tendency to purchase
63

Table 4.2 Wardrobe expenditures and apparel online shopping experiences of the participants
Variable Percentage
of Total Participants
Percentage of Online Shoppers
Percentage of Non-Online Shoppers
Money spent on the wardrobe last year Under $ 200 20.0% 14.3% 28.0% $ 200 – $ 499 40.8% 44.3% 36.0% $ 500 – $ 999 20.8% 17.1% 26.0% $ 1,000 – $ 1,499 10.0% 11.4% 8.0% $ 1,500 and more 8.3% 12.9% 2.0%
Frequency of purchasing apparel products online
None 41.7% NA 58.3% Every half year 35.0% 60.0% NA Every three months 11.7% 20.0% NA Once a month 7.5% 12.9% NA Twice a month and more 4.2% 7.1% NA
Amount spent on apparel products online last six months
None 50.0% NA 50.0% Under $ 50 19.2% 38.4% NA $ 51 – $ 100 14.2% 28.3% NA $ 101 – $ 150 5.0% 10.0% NA $ 151 – $ 200 5.0% 10.0% NA $ 201 and more 6.7% 13.3% NA
Quantity of apparel products purchased online last six months
None 51.7% NA 48.3% 1 – 3 items 32.5% 67.3% NA 4 – 6 items 10.8% 22.4% NA 7 items and more 5.0% 10.3% NA
64

Table 4.3 Gender differences in wardrobe expenditures and apparel online shopping experiences
Variable Description Male Female X²
Under $ 200 38.3% 1.7% $ 200 – $ 499 43.3% 38.3% $ 500 – $ 999 10.0% 31.7% $ 1,000 – $ 1,499 5.0% 15.0%
Money spent on the wardrobe last year
$ 1,500 and more 3.4% 13.3%
33.71**
None 51.6% 31.6% Every half year 30.0% 40.0% Every three months 11.7% 11.7% Once a month 3.3% 11.7%
Frequency of purchasing apparel products online
Twice a month and more 3.4% 5.0%
6.31
None 63.3% 36.7% Under $ 50 13.3% 25.0% $ 51 – $ 100 13.3% 15.0% $ 101 – $ 150 3.4% 6.6% $ 151 – $ 200 5.0% 5.0%
Amount spent on apparel products online last six months
$ 201 and more 1.7% 11.7%
9.66*
None 68.3% 35.0% 1 – 3 items 25.0% 40.0% 4 – 6 items 5.0% 16.7%
Quantity of apparel products purchased online last six months 7 items and more 1.7% 8.3%
14.90**
* p < .05, ** p < .001
apparel products online more frequently. However, the difference between genders was
not significant at the .05 level [X² (3) = 6.31, p = .10]. When the online shoppers between
genders were compared, the results showed that there was no significant difference
between male and female online shoppers in frequency of purchasing apparel products
online. The most frequency of purchasing apparel products online was every half year for
both male online shoppers (62.1%) and female online shoppers (58.5%).
Male and female participants were significantly different in amount of money
spent on apparel products online last six months [X² (3) = 9.66, p < .05]. There were
63.3% of male participants who did not spend any money on apparel products online last
six months; however, only 36.7% of female participants did not spend any money on
65

apparel products online last six months. Exactly 40.0% of female participants spent $1 to
$100 and 23.3% spent above $100 on apparel products online last six months while only
26.6% of male participants spent $1 to $100 and 10.1% of male participants spent above
$ 100. Among the participants who purchased apparel products online, female online
shoppers spend sufficiently more than male online shoppers [X² (1) = 6.73, p < .01]. More
than one-third of female participants (34.1%) spent above $100 on apparel products
online last six months while only 17.2% male participants spend above $100.
A significant difference between genders in the quantity of apparel items
purchased last six months was found [X² (2) = 14.90, p < .001]. More than two-third of
male participants (68.3%) had not purchased any apparel products online, but only
one-third of female participants (35.0%) had not purchased any apparel item online in the
last six months. A significance was also found between male and female online shoppers
[X² (2) = 10.06, p < .01]. Among online shoppers, more than one-third of male
participants (34.5%) had not purchased any apparel item online in the last six months
while only 7.3% of female participants had not purchased any apparel item online in the
last six months.
The gender differences in all 12 variables in the framework were examined with
t-tests. These variables included brand sensitivity, brand familiarity, brand self-congruity,
perceived brand image at purchase, product performance expectation, perceived product
performance, expectancy disconfirmation, CS/D with the product, CS/D with the brand,
perceived brand image at product-receiving, product return intention and repurchase
intention. The results showed that gender difference existed only in participants’ brand
familiarity [t (118) = -3.10, p < .01; Male – M = 3.32, Female – M = 4.04] (See Table 4.4).
Female participants were significantly more familiar with the brands shown in this study
than male participants. Beside brand familiarity, no significant differences between
genders were found in other variables.
Measure Reliability and Manipulation Check
In the study, five variables were measured with multi-items (i.e., brand sensitivity,
brand familiarity, brand self-congruity, perceived product performance, expectancy
66

Table 4.4 Gender differences in variables measured in the framework
M Variable Male Female t-value
Brand Sensitivity 3.38 3.11 1.27 Brand Familiarity 3.32 4.04 -3.10* Brand Self-Congruity 1.91 2.06 -.89 Perceived Brand Image at Purchase 3.62 3.63 -.07 Product Performance Expectation 3.82 3.53 1.51 Perceived Product Performance 4.04 3.81 1.52 Expectancy Disconfirmation .28 .41 -.94 CS/D with the Product 33.35 32.61 37 CS/D with the Brand 33.69 32.21 .73 Perceived Brand Image at Product-receiving 3.78 3.85 -.32
Product Return Intention 4.02 4.07 -.16 Repurchase Intention 3.07 3.37 -1.25 * p < .01
disconfirmation). Confirmatory factor analysis was used to examine if the items in each
variable measured the same construct and Cronbach’s alpha was calculated to examine
the reliability of measure items in each construct. These results were reported in the first
following section. The second section reports the results of manipulation check. In the
study, perceived brand image was manipulated by two brand names/logos, and perceived
product performance was manipulated by two levels of product performance. To examine
if the treatments had successfully created significant different levels of perceived brand
image and perceived product performance, the manipulation check was conducted.
Measure Reliability
Five variables were measured with multi-items (i.e., brand sensitivity, brand
familiarity, brand self-congruity, perceived product performance, expectancy
disconfirmation). Confirmatory factor analysis showed that except expectancy
disconfirmation, all other four variables were extracted in only one factor, indicating the
ratings measured by the items of each of the four variables were close to each other,
revealing high reliability among the items. Therefore, the average score of the items
measuring each variable of these four variables was calculated and used in the
examination of hypothesis testing.
67

For expectancy disconfirmation, two factors were extracted. One was made up of
two items which were related to the expectancy disconfirmation with the style and the
color of the sweatshirt. Because participants could see the style and color of the
sweatshirt in the picture posted on the web page, this factor was named as “visible
attribute expectancy disconfirmation” (See Table 4.5) The other factor was composed of
four items which were related to the expectancy disconfirmation with the fabric, fit,
workmanship, and overall performance of the sweatshirt. These attributes could not be
examined through the picture of the sweatshirt posted on the web page, and thus, this
factor was named as “invisible attribute expectancy disconfirmation”. The average of the
items in each factor was calculated and used in the hypothesis testing.
The Cronbach’s alpha of each construct was calculated (See Table 4.5). Except
visible attribute expectancy disconfirmation, all other variable had Cronbach’s alpha
of .77 or greater, indicating a fairly high reliability. However, the Cronbach’s alpha of
visible attribute expectancy disconfirmation was .39, indicating that the consistency
between the two measures items was low. Although style and color of the sweatshirt were
both visible attributes could be examined on the web pages, it is very possible that
participants had different degrees of expectation, evaluation, or tolerance to style and
color, and thus, led to inconsistent ratings of disconfirmation for style and
disconfirmation for color.
Manipulation Check
Two brand names/logos (i.e., Abercrombie & Fitch, Aéropostale) and Two levels
of product performance (i.e., high, low) were used to create different levels of perceived
brand image and perceived product performance of the sweatshirts. The t-test results
showed that there was a significant difference between the two brand name/logo groups [t
(118) = 9.27, p < .001]. Mean scores for the two groups were 4.43 and 2.82, respectively.
Participants who saw the brand name of Abercrombie & Fitch on the web page perceived
a significantly higher brand name of Abercrombie & Fitch on the web page perceived a
significantly higher brand image than those who saw the brand name of Aéropostale. For
product performance, the t-test results also indicated that there was a significant
difference between the higher product performance group and the lower product
68

Table 4.5 Measure reliability
Item Cronbach’s alpha
Brand Sensitivity
When making a purchase of apparel product, I always pay attention to the brand. In general, the brand of apparel tells a lot about its quality. Buying a brand name apparel product is important to me. When making a purchase of sweatshirt, I always pay attention to the brand. When I buy a sweatshirt, I prefer buying a well-known brand. I don’t choose my sweatshirt according to the brand. In general, the brand of a sweatshirt tells a lot about its quality.
.92
Brand Familiarity
Are you familiar with Abercrombie & Fitch/Aéropostale? How much do you know about Abercrombie & Fitch/Aéropostale? Do you have any previous experience with Abercrombie & Fitch/Aéropostale?
.86
Brand Self-Congruity
Wearing Abercrombie & Fitch/Aéropostale products reflect who I am. People who wear Abercrombie & Fitch/Aéropostale are much more like me than
people who use other brands. The image of Abercrombie & Fitch/Aéropostale fits how I see myself. Wearing Abercrombie & Fitch/Aéropostale products reflect who I would like to be.I would like to be perceived as similar to the typical consumer of Abercrombie & Fitch/Aéropostale. The image of Abercrombie & Fitch/Aéropostale fits how I would like to see
myself.
Perceived Product Performance
.91
I think this sweatshirt is _____. (Terrible/Excellent) I think the style of this sweatshirt is _____. (Terrible/Excellent) I think the color of this sweatshirt is _____. (Terrible/Excellent) I think the fabric of this sweatshirt is _____. (Terrible/Excellent) I think the fit of this sweatshirt is _____. (Terrible/Excellent) I think the workmanship of this sweatshirt is___. (Terrible/Excellent)
Expectancy Disconfirmation
.82
Visible Attribute Expectancy Disconfirmation The style of this sweatshirt is _____. (Much worse than I expected/Just as I
expected/Much better than I expected) The color of this sweatshirt is _____. (Much worse than I expected/Just as I
expected/Much better than I expected)
.39
Invisible Attribute Expectancy Disconfirmation This sweatshirt is _____. (Much worse than I expected/Just as I expected/Much
better than I expected) The fabric of this sweatshirt is _____. (Much worse than I expected/Just as I
expected/Much better than I expected) The fit of this sweatshirt is _____. (Much worse than I expected/Just as I
expected/Much better than I expected) The workmanship of this sweatshirt is _____. (Much worse than I expected/Just as
I expected/Much better than I expected)
.77
69

performance group [t (118) = 3.30, p < .001]. The mean score for the higher performance
group was 4.17 and for the lower performance group was 3.68. Participants who received
a sweatshirt with a higher level of product performance perceived the sweatshirt with a
significantly higher level of product performance than those who received a sweatshirt
with a lower level of product performance. These results indicated that the two treatments
had successfully manipulated and created significantly different levels of perception of
brand image and product performance.
Results of Hypothesis Testing
The proposed 13 hypotheses based on the framework of CS/D with the purchased
apparel product and with the brand in an online shopping context were examined.
Multiple regression analysis was used to test Hypothesis 1 of the relationship between
individual differences and participants’ perceived brand image at purchase. Hypotheses 2
to 13 were examined by structural equation modeling. The results were reported in the
following sections.
The Relationship between Individual Differences and Perceived Brand Image
There were seven individual difference variables proposed in the framework
including brand sensitivity, brand familiarity, brand self-congruity, and four
demographics (i.e., gender, age, personal income, household income). Multiple
regression analysis was conducted to identify the individual difference variables that were
significantly related to perceived brand image at purchase. In the multiple regression
analysis, the dependent variable was perceived brand image at purchase and the
independent variables included brand sensitivity, brand familiarity, brand self-congruity
and four demographic characteristics (i.e., gender, age, personal income, annual
household income).
Hypothesis 1. There will be a significant relationship between perceived brand image at
purchase and the proposed individual difference variables (i.e., brand sensitivity,
brand familiarity, brand self-congruity, demographics).
70

The result of stepwise regression analysis revealed the equation for the predictor
of perceived brand image at purchase as followed:
Perceived Brand Image at Purchase = 2.900 + .382 (Brand Self-Congruity)
Among these seven variables related to individual differences, only one variable, brand
self-congruity, was a significant predictor of perceived brand image at purchase. The F
value showed that this regression model was significant in explaining consumers’
perception of brand image [F (1, 114) = 9.48, p < .01]. However, the multiple correlation
coefficient for this equation (R) was .277, and the square of the correlation coefficient (R2)
was .077, indicating that brand self-congruity only explained 7.7% of the variance in the
perceived brand image at purchase. The results showed that there was a significant and
positive relationship between participants’ brand self-congruity and their perceived brand
image at purchase. At the purchase stage, participants who perceived that the brand image
at purchase was consistent with his or her self-image would perceive the image of the
brand significantly better. Based on these results, Hypothesis 1 was partially supported.
Results of Structural Equation Modeling
The results of SEM were reported in this section. The processes of correcting and
trimming the model were first stated. The results of hypothesis testing from Hypotheses 2
to 13 were addressed in the second section.
Processes of Correcting and Trimming the Model
AMOS 7.0 was used to conduct the SEM. In this study, Goodness-of-fit index
(GFI) and Adjusted-goodness-of-fit-index (AGFI) equal or greater than .90 were used as
indicators of acceptable fit based on the SPSS Amos Course Guide (Structural Equation
Modeling, 2005). Comparative-fit-index (CFI) and Incremental-fit-index (IFI) close
to .95 were used as indicators of good fit based on the suggestion of Hu and Bentler
(1999). The root mean square error of approximation (RMSEA) less than .08 was also
used as an indicator of acceptable fit based on the suggestion of Browne and Cudeck
(1993). The hypothesized model was as shown in Figure 4.1. Initially, 10 variables were
71

72
included in the hypothesized model. The fit indexes indicated that the original
hypothesized model fit was poor (GFI = .88, AGFI = .75, CFI = .85, IFI = .85, RMSEA
= .17). The standardized regression weight of each relationship in the hypothesized model
was shown in Figure 4.2. Correlations between the 10 constructs for the model were
presented in Table 4.6. The correlation matrix among constructs was positive definite,
expect product return intention because product return intention conveyed a negative
meaning. If the participant’s rating of product return intention was higher, the
participant’s intention to return the product was higher. The direction of the rating of
product return intention was opposite to other variables. Thus, only the correlation
coefficients of product return intention were negative.
A poor fit of the model can be improved by examining modification indices or the
standard residuals (Hair et al., 1998). According to the modification indices, paths
between variables which were related to larger reductions of chi-square were identified
and added one by one. Consequently, three paths were added to improve the model fit to
the data (See Table 4.7). The three paths were: (a) from perceived brand image at
purchase to perceived brand image at product-receiving, (b) from perceived brand image
at purchase to CS/D with the brand, and (c) from perceived product performance to
perceived brand image at product-receiving. After adding the four paths between
variables, the model fit became much better (GFI = .94, AGFI = .85, CFI = .96, IFI = .96,
RMSEA = .09). The SEM model after adding paths was presented as Figure 4.3.
To examine if all parameters in the model were significantly different from 0 at a
level of significance of .05, the p-value of all parameters were calculated. The parameter
that had a p-value greater than .05 was first identified and then the parameter with the
highest p-value was removed one by one. After each removal of one parameter, the model
fit was checked to examine if the removal of the parameter improved the fit of the model.
According to this process, four paths were removed. They were the paths (a) from
perceived brand image at purchase to perceived product performance at the
product-receiving stage, (b) from product performance expectation to CS/D with the
product, (c) from invisible attribute expectancy disconfirmation to CS/D with the product,
and (d) CS/D with the brand to CS/D with the product. After trimming the four
parameters that were not significant, all indexes, except AGFI, showed the fit of the final

H2 H4
H3
H5
H7aH6
H10
H8
Perceived Brand Image at Purchase
H7b
Invisible Attribute Expectancy
Disconfirmation
Visible Attribute Expectancy
Disconfirmation
Product Return Intention
Product Performance Expectation
Perceived Product
Performance
H9
Satisfaction/ Dissatisfaction
with the Product
H11
Satisfaction/ Dissatisfaction with the Brand
Perceived Brand Image at
Product-Receiving
H13H12
Repurchase Intention
Figure 4.1 The hypothesized SEM model 73

74
Figure 4.2 The results of the hypothesized SEM model
H2 .37*** H4
.52***
H3 .07
H5 .17*
H7a .22**
H6 .43***
H10 .73***
H8 .57***
Perceived Brand Image at Purchase
H7b .13
Invisible Attribute Expectancy
Disconfirmation
Visible Attribute Expectancy
Disconfirmation
Product Return Intention
Repurchase Intention
Product Performance Expectation
Perceived Product
Performance
H9
-.28**.58*** -.34***
.84***
-.25
Satisfaction/ Dissatisfaction
with the Product
H11 -.30***
H13 .45*** H12
.30**
*p < .05, **p < .01, ***p < .001
Perceived Brand Image at
Product-Receiving
Satisfaction/ Dissatisfaction with the Brand

Table 4.6 Correlation matrix of model constructs
Constructs Included in the Hypothesized Model 1 2 3 4 5 6 7 8 9 10
1. Perceived brand image at purchase 1.00
2. Product performance expectation .37 1.00
3. Perceived product performance .26 .55 1.00
4. Invisible attribute expectancy disconfirmation .10 .13 .66 1.00
5. Visible attribute expectancy disconfirmation .05 .04 .43 .35 1.00
6. CS/D with the product .20 .42 .70 .51 .45 1.00
7. CS/D with the brand .11 .24 .38 .27 .24 .55 1.00
8. Perceived brand image at product-receiving .08 .17 .28 .20 .18 .41 .73 1.00
9. Repurchase intention .07 .15 .24 .17 .15 .35 .62 .66 1.00
10. Product return intention -.06 -.13 -.21 -.15 -.14 -.30 -.17 -.12 -.10 1.00
75
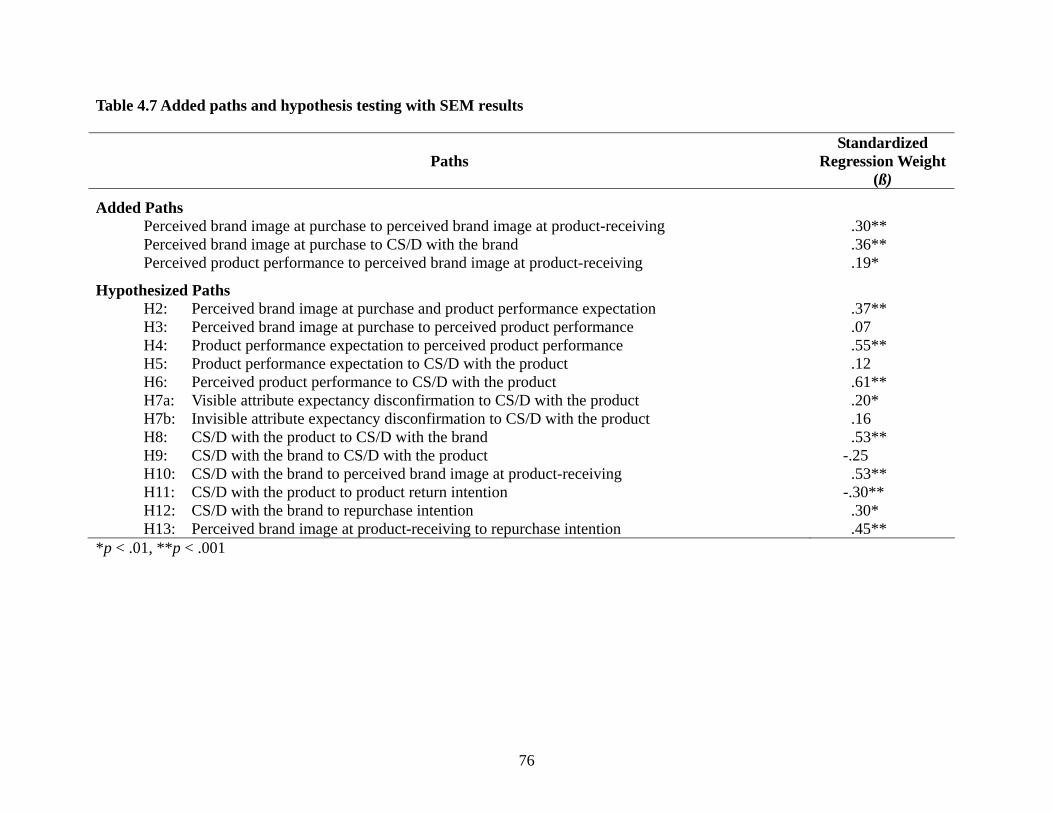
76
Table 4.7 Added paths and hypothesis testing with SEM results
Paths Standardized
Regression Weight (ß)
Added Paths
Perceived brand image at purchase to perceived brand image at product-receiving .30** Perceived brand image at purchase to CS/D with the brand .36** Perceived product performance to perceived brand image at product-receiving .19*
Hypothesized Paths
H2: Perceived brand image at purchase and product performance expectation .37** H3: Perceived brand image at purchase to perceived product performance .07 H4: Product performance expectation to perceived product performance .55** H5: Product performance expectation to CS/D with the product .12 H6: Perceived product performance to CS/D with the product .61** H7a: Visible attribute expectancy disconfirmation to CS/D with the product .20* H7b: Invisible attribute expectancy disconfirmation to CS/D with the product .16 H8: CS/D with the product to CS/D with the brand .53** H9: CS/D with the brand to CS/D with the product -.25 H10: CS/D with the brand to perceived brand image at product-receiving .53** H11: CS/D with the product to product return intention -.30** H12: CS/D with the brand to repurchase intention .30* H13: Perceived brand image at product-receiving to repurchase intention .45**
*p < .01, **p < .001

Figure 4.3 The SEM model with added paths
H2 .37*** H4
.52***
H3 .07
H5 .26*
H7a .26**H6 .45***
H10 .51***
H8 .72***
H7b .16
Invisible Attribute Expectancy
Disconfirmation
Visible Attribute Expectancy
Disconfirmation
Product Return Intention
Repurchase Intention
H9
*p < .05, **p < .01, ***p < .001
-.25
Satisfaction/ Dissatisfaction
with the Product
H11 -.30***
Perceived Brand Image at
Product-Receiving
H13
Perceived Brand Image at Purchase
Product Performance Expectation
Perceived Product
Performance
Satisfaction/ Dissatisfaction with the Brand
-.28**.58*** -.34***
.84***
.29***
.37***
.19**
Hypothesized Path
Added Path
.45*** H12
.30**
77
model was good (GFI = .93, AGFI = .86, CFI = .96, IFI = .96, RMSEA = .08). Both GFI
and AGFI measure the difference between sample covariances and implied covariances,
and the result can be overly influenced by sample size (Fan, Thompson, & Wang, 1999).
Different from GFI, AGFI adjusts for the number of degrees of freedom in the model,
which is even more sensitive to the sample size and the number of parameters included in
the model. The final model was presented in Figure 4.4.
Hypothesis Testing with Structural Equation Modeling
Fourteen proposed hypotheses were examined. To test the hypotheses, the
standardized regression weight (i.e., ß, a number between 0 and 1) will be reported and
the p-value of the hypothesized relationship will be calculated to determine if the
standardized regression weight is significantly different from 0. A level of significance
of .05 will be used as the standard for rejecting or supporting the hypothesis.
Hypothesis 2. There will be a significant relationship between participants’ perceived
brand image at purchase and their expectation for product performance.
Participants who perceive the brand with better image will have a higher level of
expectation for product performance at the purchase stage.
The results indicated that there was a significant and positive relationship between
participants’ perceived brand image at purchase and their expectation for product
performance (ß = .37, p < .001). Participants who perceived the product with better brand
image at the purchase stage had significantly higher expectation for the product
performance. Based on these results, it was concluded that Hypothesis 2 was supported.
Hypothesis 3. There will be a significant relationship between participants’ perceived
brand image at purchase and their perceived product performance at the
product-receiving stage. Participants who perceive the brand with better image at
the purchase stage will perceive the product performance to be better at the
product-receiving stage.
The results indicated that there was no significant relationship between
participants’ perceived brand image at purchase and their perception of product
78

Signficant Path
79
H2 .37** H4
.52**
H5 .12
Figure 4.4 The final model of consumer satisfaction/dissatisfaction with the purchased apparel product and the brand in an online shopping context
H7a .20*H6 .61**
H10 .53**
H8 .53**
H7b .16
Invisible Attribute Expectancy
Disconfirmation
Visible Attribute Expectancy
Disconfirmation
Product Return Intention
Repurchase Intention
H9 -.25
Satisfaction/ Dissatisfaction
with the Product
H11 -.30**
Perceived Brand Image at
Product-Receiving
H13 .45** H12
.30*
*p < .01, **p < .001
Perceived Brand Image at Purchase
Product Performance Expectation
Perceived Product
Performance
Satisfaction/ Dissatisfaction with the Brand
-.28*.58** -.34**
.84**
.30**
.36**
.19*
Added Path
H3 .07
Insignificant Path

performance at the product-receiving stage. Participants who perceived the product with
better brand image at the purchase stage did not perceive that the product have a
significantly better performance. Based on these results, Hypothesis 3 was not supported.
Hypothesis 4. There will be a significant relationship between participants’ expectation
for product performance at the purchase stage and their perceived performance at
the product-receiving stage. Participants who have a higher level of expectation
for product performance at the purchase stage will perceive the product
performance to be better at the product-receiving stage.
The results showed that there was a significant and positive relationship between
participants’ expectation for product performance at the purchase stage and their
perceived product performance at the product-receiving stage (ß = .52, p < .001).
Participants who had a higher level of expectation for product performance at the
purchase stage perceived that the product had a significantly better performance at the
product-receiving stage. Based on these results, Hypothesis 4 was supported.
Hypothesis 5. There will be a significant relationship between participants’ expectation
for product performance at the purchase stage and their satisfaction/dissatisfaction
with the product at the product-receiving stage. Participants who have a higher
level of expectation for product performance at the purchase stage will have a
higher level of satisfaction with the product.
The results indicated that there was no significant relationship between
participants’ expectation for product performance and CS/D with the product. Participants
who had a higher level of expectation for product performance at the purchase stage did
not have a significantly higher level of satisfaction with the product. Based on these
results, Hypothesis 5 was not supported.
Hypothesis 6. There will be a significant relationship between participants’ perceived
product performance at the product-receiving stage and their
satisfaction/dissatisfaction with the product at the product-receiving stage.
80

Participants who perceive the product with better performance will have a higher
level of satisfaction with the product.
The results indicated that there was a significant and positive relationship between
participants’ perception of product performance and CS/D with the product (ß = .61, p
< .001). Participants who perceived the product with a higher level of performance had a
significantly higher level of satisfaction with the product. Based on these results,
Hypothesis 6 was supported
Hypothesis 7 examined the relationship between participants’ expectancy
disconfirmation and their satisfaction/dissatisfaction with the product at the
product-receiving stage. The results of confirmatory factor analysis revealed two factors
in expectancy disconfirmation (i.e., visible attribute expectancy disconfirmation, invisible
attribute expectancy disconfirmation), and thus, two sub-hypothesis of Hypothesis 7,
Hypothesis 7a and Hypothesis 7b, were developed to examine the relationship between
participants’ visible attribute expectancy disconfirmation and satisfaction/dissatisfaction
with the product, and between invisible attribute expectancy disconfirmation and
satisfaction/dissatisfaction with the product.
Hypothesis 7a. There will be a significant relationship between participants’
visible attribute (i.e., style, color) expectancy disconfirmation and their
satisfaction/dissatisfaction with the product at the product-receiving stage.
Participants who perceive that the product performance of visible
attributes is better than what they expected will have a higher level of
satisfaction with the product. Participants who perceive that the product
performance of visible attributes is worse than what they expected will
have a lower level of satisfaction with the product.
The results indicated that there was a significant and positive relationship
between participants’ visible attribute expectancy disconfirmation and CS/D with
the product (ß = .20, p < .01). Participants who perceived that style and color were
better than what they expected had a higher level of satisfaction with the product.
81

Participants who perceived that style and color were worse than what they
expected had a lower level of satisfaction with the product.
Hypothesis 7b. There will be a significant relationship between participants’
invisible attribute (i.e., fabric, fit, workmanship, overall performance)
expectancy disconfirmation and their satisfaction/dissatisfaction with the
product at the product-receiving stage. Participants who perceive that the
product performance of invisible attributes is better than what they
expected will have a higher level of satisfaction with the product.
Participants who perceive that the product performance of invisible
attributes is worse than what they expected will have a lower level of
satisfaction with the product.
The results showed that there was no significant relationship between
participants’ invisible attribute expectancy disconfirmation and CS/D with the
product. Participants who perceived that the product performance of invisible
attributes was better or worse than what they expected did not have a higher or
lower level of satisfaction with the product.
Based on these results above, Hypothesis 7 was partially supported because only
visible attribute expectancy disconfirmation had a significant relationship with CS/D with
the product.
Hypothesis 8. Participants who have a higher level of satisfaction with the product will
have a higher level of satisfaction with the brand.
The results showed that there was a significant and positive relationship between
CS/D with the product and CS/D with the brand (ß = .53, p < .001). Participants who had
a higher level of satisfaction with the product had a significantly higher level of
satisfaction with the brand. Based on these results, Hypothesis 8 was supported.
82

Hypothesis 9. Participants who have a higher level of satisfaction with the brand will
have a higher level of satisfaction with the product.
The results showed that there was no significant relationship between CS/D with
the brand and CS/D with the product. Participants who had a higher level of satisfaction
with the brand did not have significantly a higher level of satisfaction with the product.
Based on these results, Hypothesis 9 was not supported.
Hypothesis 10. There will be a significant relationship between participants’
satisfaction/dissatisfaction with the brand and their perception of brand image at
the product-receiving stage. Participants who have a higher level of satisfaction
with the brand will perceive the brand with better image at the product-receiving
stage.
The results showed that there was a significant and positive relationship between
CS/D with the brand and perceived brand image at product-receiving (ß = .53, p < .001).
Participants who had a higher level of satisfaction with the brand significantly perceived
the brand with better image at the product-receiving stage. Based on these results,
Hypothesis 10 was supported.
Hypothesis 11. There will be a significant relationship between participants’
satisfaction/dissatisfaction with the product at the product-receiving stage and
their product return intention. Participants who have a higher level of satisfaction
with the product will have a lower level of intention to return the product.
The results showed that there was a significant and negative relationship between
CS/D with the product and product return intention (ß = -.30, p < .001). Participants who
had a higher level of satisfaction with the product had significantly a lower level of
intention to return the product. Based on these results, Hypothesis 11 was supported.
Hypothesis 12. There will be a significant relationship between participants’
satisfaction/dissatisfaction with the brand at the product-receiving stage and their
intention to repurchase the products of the same brand. Participants who have a
83

84
higher level of satisfaction with the brand will have a higher level of repurchase
intention.
The results showed that there was a significant and positive relationship between
CS/D with the brand and repurchase intention (ß = .30, p < .01). Participants who had a
higher level of satisfaction with the brand had a significantly higher level of intention to
repurchase the products of the brand. Based on these results, Hypothesis 12 was
supported.
Hypothesis 13. There will be a significant relationship between participants’ perception
of brand image at the product-receiving stage and their intention to repurchase the
product of the same brand. Participants who perceive the brand with better image
at the product-receiving stage will have a higher level of repurchase intention.
The results showed that there was a significant and positive relationship between
perceived brand image at product-receiving and repurchase intention (ß = .45, p < .001).
Participants who perceived the brand with better image at the product-receiving stage had
a significantly higher level of intention to repurchase the products of the brand. Based on
these results, Hypothesis 13 was supported.

CHAPTER V
SUMMARY, DISCUSSIONS, APPLICATIONS, LIMITATIONS,
AND RECOMMENDATIONS
This chapter included four sections. The summary of the study was presented in
the first section. In the second section, the discussions and applications of the findings
were stated. Conclusion and suggestions for strategies in apparel online shopping was
addressed in the third section. The limitations of the study and the recommendations for
further researches were discussed in the last section of this chapter.
Summary of the Study
The purpose of the study was to examine the factors related to consumer
satisfaction/dissatisfaction (CS/D) with the purchased product and with the brand in
apparel online shopping at the product-receiving stage. The four objectives of the study
were to examine (a) the relationships between consumers’ individual differences (i.e.,
brand sensitivity, brand familiarity, brand self-congruity and demographics) and
perceived brand image at the purchase stage, (b) the influence of consumers’ perceived
brand image at purchase on their expectation for product performance and on perceived
product performance, (c) antecedences of CS/D with the product and CS/D with the
brand, and (d) antecedences of product return intention and repurchase intention.
A model of CS/D with the purchased apparel product and the brand in an online
shopping context was proposed as the framework of this study, which included three
stages of apparel online shopping: the purchase stage, the product-receiving stage, and
the product-consumption stage. Because no previous study has examined CS/D with the
product and with the brand at the product-receiving stage in apparel online shopping, this
study only focused on the product-receiving stage. Fifteen hypotheses were developed
according to the relationships proposed in the framework in Chapter III.
85

A 2 X 2 between-subjects factorial experimental design was used as the research
method for this study. Two levels of brand image at the purchase stage (i.e., higher, lower)
were manipulated by two brand names and logos. Two levels of product performance at
the product-receiving stage (i.e., higher, lower) were manipulated by two sweatshirts with
different levels of quality. A website was developed by the researchers to simulate the
apparel online shopping process, and a questionnaire was developed to measure the
variables included in this study. Participants of this study were recruited from Virginia
Tech undergraduate students, using the convenient sampling method. An advertisement
regarding experiment time, place and the contact information of the researcher were
announced on the announcement boards in each dorm on campus to recruit undergraduate
students to participate in the study.
A total of 120 undergraduate students participated in this study, including 60 male
and 60 female students. Participants’ ages ranged from 18 to 25 and most of them were
18 to 19 years old (79.2%) and freshman and sophomore (83.4%). The majority of the
participants majored in Engineering (38.3%), followed by Business (19.2%) and Liberal
Arts & Human Sciences (15.8%). As for their personal income, most of the participants
were not employed (50.0%) or their personal income was under $10,000 before tax for
2006 (44.2%). Most participants’ annual household income was $70,000 – $89,999
(45.8%). On the subject of participants’ wardrobe expenditure and apparel online
shopping experience, results showed that most participants spent $200 to $499 on their
wardrobes last year (40.8%), and 58.3% of them had the experience of apparel online
shopping. Among the online shoppers, two third of participants (66.7%) spent under $100
last six months for purchasing apparel products online and one third of participants
(33.3%) spent over $100. For the quantity of apparel products that online shoppers
purchased last six months, two third of participants (67.3%) purchased one to three items
and one third of them (32.7%) purchased above four apparel items.
Multiple regression analysis was used to examine Hypothesis 1 that which
individual difference variables were significantly related to perceived brand image at
purchase. Structural equation modeling (SEM) was used for testing the rest of 12
hypotheses in this study. A hypothesized SEM model was developed, including 10
variables in the proposed framework. Hypotheses 1 to 13 were examined and the results
86

of hypotheses testing were listed in Table 5.1. The result model with hypothesis testing
was showed in Figure 5.1.
Discussions and Applications of the Findings
The discussions and applications of the study findings were grouped in the
following six sections. First, the study findings about participants’ differences in gender,
wardrobe expenditures and apparel online shopping experiences were discussed. The role
of brand self-congruity in apparel online shopping was addressed in the second section.
The relationships among perceived brand image at purchase, product performance
expectation, and perceived product performance were followed in the third section. In the
fourth section, the antecedent variables of CS/D with the product and CS/D with the
brand were discussed. The variables influencing perceived brand image at the
product-receiving stage were followed in the fifth section. The antecedences of product
return intention and repurchase intention were addressed in the sixth section.
Participants’ Differences in Gender, Wardrobe Expenditures and Apparel Online
Shopping Experiences
The results of this study showed that gender was related to brand familiarity and
apparel online shopping experiences but not related to other variables included in the
study. Female participants were more familiar with apparel brands, spent more money on
their wardrobe, and purchased more items and spent more money in apparel online
shopping than male participants. These findings are consistent with previous studies,
indicating that female consumers were more likely to be online apparel shoppers (Lee &
Johnson, 2002; Rhee, 2006). According to these study results, e-tailers not only should
provide more female apparel items on their websites, but also need to design the website
more favorable for female consumers. Female consumers’ preferences and behaviors may
very different from male consumers. For example, a UK study found that for website
design, female online shoppers preferred rounded forms, brighter and complex color
schemes, and casual language and tone, while male online shoppers preferred straight
lines and shapes, simple and darker colors, and formal or expert language with few
87

88
Table 5.1 Hypotheses and summary of the results
Hypothesis Results
H1: There will be a significant relationship between perceived brand image at purchase and the proposed individual difference variables (i.e., brand sensitivity, brand familiarity, brand self-congruity, demographics).
Partially Supported
H2: There will be a significant and positive relationship between participants’ perceived brand image at purchase and their expectation for product performance.
Supported
H3: There will be a significant and positive relationship between participants’ perceived brand image at purchase and their perceived product performance at the product-receiving stage.
Not Supported
H4: There will be a significant and positive relationship between participants’ expectation for product performance at purchase and their perceived performance at the product-receiving stage.
Supported
H5: There will be a significant and positive relationship between participants’ expectation for product performance at the purchase stage and their satisfaction/dissatisfaction with the product at the product-receiving stage.
Not Supported
H6: There will be a significant and positive relationship between participants’ perceived product performance at the product-receiving stage and their satisfaction/dissatisfaction with the product at the product-receiving stage.
Supported
H7: There will be a significant relationship between participants’ expectancy disconfirmation at the product-receiving stage and their satisfaction/dissatisfaction with the product at the product-receiving stage.
Partially Supported
H7a: There will be a significant relationship between participants’ invisible attribute expectancy disconfirmation at the product-receiving stage and their satisfaction/dissatisfaction with the product at the product-receiving stage.
Supported
H7b: There will be a significant relationship between participants’ visible attribute expectancy disconfirmation at the product-receiving stage and their satisfaction/dissatisfaction with the product at the product-receiving stage.
Not Supported
H8: There will be a significant and positive relationship between participants’ satisfaction with the product and their satisfaction with the brand. Supported
H9: There will be a significant and positive relationship between participants’ satisfaction with the brand and their satisfaction with the product.
Not Supported
H10: There will be a significant and positive relationship between participants’ satisfaction/dissatisfaction with the brand and their perception of brand image at the product-receiving stage.
Supported
H11: There will be a significant and negative relationship between participants’ satisfaction/dissatisfaction with the product at the product-receiving stage and their product return intention.
Supported
H12: There will be a significant and positive relationship between participants’ satisfaction/dissatisfaction with the brand at the product-receiving stage and their intention to repurchase the products of the same brand.
Supported
H13: There will be a significant and positive relationship between participants’ perception of brand image at the product-receiving stage and their intention to repurchase the product of the same brand.
Supported

Signficant Path
Added Path
Insignificant Path
89
Figure 5.1 The result model of consumer satisfaction/dissatisfaction with the purchased apparel product and the brand in an
online shopping context
Perceived Brand Image at Purchase
Consumer Satisfaction/Dissatisfaction
with the Product
Visible Attribute
Expectancy Disconfirmation
Consumer Satisfaction/Dissatisfaction
with the Brand
Brand Self-Congruity
H1 .28*
Perceived Brand Image at
Product-Receiving
Product Performance Expectation
Repurchase Intention Product Return Intention *p < .01, **p < .001
Product-Receiving Stage Purchase Stage
Invisible Attribute
Expectancy Disconfirmation
H2 .37**
H3 .07 H4
.52**
H5 .12
H7a .20*
H7b .16 H8
.53**
-.28*
-.34** .58** .84**
H12 .30*
H6 .61**
H9 -.25
.30**
H10 .53**
H11 -.30** H13
.45**
.36**
.19*
Perceived Product Performance

abbreviations (Moss, Gunn & Heller, 2006). As for promotion sent by e-tailers, Phillip
and Suri (2004) found that female online shoppers had a stronger preference for the
coupon contained in the e-mail than male online shoppers did. These studies provide
evidence for the importance in identifying gender differences in online shopping to better
serve e-tailers’ target customers. The current study results showed that female participants
involved in apparel online shopping more than male participants; however, Smith (2008)
reported that a new apparel online shopping pattern has emerged. Male consumers now
become fast growing fashion online shoppers. They make quick purchase decision and
return fewer products than female consumers. Thus, some e-tailers start to aim at male
consumers by providing menswear sections on the website or launching shopping
websites just for male consumers to make the apparel online shopping easier and faster
for them.
Brand Self-Congruity and Perceived Brand Image at Purchase
Brand self-congruity was the only individual difference variable significantly
related to participants’ perception of brand image at the purchase stage in this study. The
results indicated that at the purchase stage, brand self-congruity was positively related to
participants’ perceived brand image at purchase. The result is consistent with previous
studies that consumers tended to link their self-image with the brand image (Ataman &
Ulengin, 2003) and choose brands with the attributes that match some aspects of their
selves (Onkvisit & Shaw, 1987). Clothing is a non-verbal communication of individual
personality and self-image (Thomas, Cassill & Forsythe, 1991) and apparel brand often
plays important symbolic, self-expression, and socialization roles (Shim & Koh, 1997).
These may be the reasons why when the brand image of apparel products was more
consistent with participants’ self-image, they would be more likely to rate the brand
image positively. This finding supports the proposition of Kressmann et. al (2006),
suggesting that it is essential for e-tailers to identify the self-concept of their target
consumers and build the brand image more compatible with the image that their target
consumers would like to express because at the purchase stage, when consumers search
for products and evaluate their alternatives, the brand matches their self-image will be
perceived as having a better image.
90

Perceived Brand Image at Purchase, Product Performance Expectation, and
Perceived Product Performance
Results showed that participants who perceived better brand image at the
purchase stage had higher expectation for product performance. This result is consistent
with the study results of O’Neal (1992) and Lennon and Fairhurst (1994), indicating that
consumers would use brand name, brand image and store image to evaluate apparel
product quality and form their expectation projecting the product performance. However,
participants’ perception of brand image at purchase did not directly influence their
perception of product performance. It indirectly influenced perceived product
performance through participants’ expectation for product performance. Participants’
perceived brand image would influence their expectation, and then their expectation, in
turn, would influence their perception of product performance.
The above results showed a linkage among three variables (i.e., perceived brand
image at purchase, product performance expectation, perceived product performance).
Participants’ perception of brand image at purchase would positively influence their
expectation for product performance. When participants tried on the product and
evaluated the product, their expectation for product performance formed at purchase
would positively influence their perception of product performance. These findings
provide evidence for the importance of brand image. In online shopping, consumers
cannot physically examine the apparel product to ensure the product quality. Consumers
would depend on brand image to create expectation about product performance. For a
brand that consumers perceive to have a good brand image, consumers expect that they
would receive a product with good quality. This expectation may increase the likelihood
of purchasing the product and have a positive influence on consumers’ evaluation of
product performance when they receive and examine the product.
91

Antecedences of Consumer Satisfaction/Dissatisfaction with the Product and
Consumer Satisfaction/Dissatisfaction with the Brand
The variables influencing CS/D with the product and the variables influencing CS/D
with the brand were examined in this study. Two antecedents of CS/D with the product
and two antecedents of CS/D with brand were found. Each relationship and the
application were discussed in the following sections.
Consumer Satisfaction/Dissatisfaction with the Product
Results showed that two factors (i.e., perceived product performance, visible
attribute expectancy disconfirmation) significantly influenced CS/D with the product. In
these two variables, the standardized regression weight of perceived product performance
was much greater than that of visible attribute expectancy disconfirmation, indicating that
perceived product performance was a much more important factor influencing CS/D with
the product. Participants who perceived a higher level of product performance had a
higher level of satisfaction at the product-receiving stage. This result is consistent with
the study finding of Tse and Wilton (1988). Whenever consumers perceived a product
performing well, consumers would be satisfied. Chen-Yu et al. (1999) also found that
product performance had a strong direct effect on CS/D.
The result that perceived product performance to be the most important factor on
CS/D with the product suggests that to achieve a higher level of consumer satisfaction
with the product at the product-receiving stage, providing apparel products with good
product performance is most essential. In order to provide “good” product performance,
e-tailers need to first understand what criteria that consumers use to evaluate the product
performance at the product-receiving stage. In this study, the measure items of perceived
product performance included style, color, fabric, fit, workmanship and overall
performance of the sweatshirt. These measures of product performance are similar to the
criteria that consumers use to evaluate a product at purchase in offline shopping. When
consumers receive the product they ordered online, this is the first time they physically
see the product, and therefore, they evaluate the product similar to how they evaluate a
product at purchase in offline shopping. However, in offline shopping, consumers can
examine and try on the apparel product they are interested in. If they do not like the
92

product, they can easily switch to another product. A product that does not match to
customers’ evaluation criteria may not influence their satisfaction. However, in online
shopping, if consumers do not like the product they received, they cannot switch to
another product right away. The product delivered to consumers must be very close to
customers’ evaluation criteria. Therefore, understanding target customers’ evaluating
criteria may be the most crucial task for e-tailers to increase customers’ satisfaction with
the product they purchased online.
Participants’ expectation for product performance was hypothesized to be related
to CS/D with the product; however, the results did not show a significant relationship.
This result indicated that participants’ expectation for product performance did not
directly influence CS/D with the product; however, it indirectly influenced CS/D with the
product through the visible attribute expectancy disconfirmation. Visible attribute
expectancy disconfirmation was found to be an antecedence of CS/D with the product.
Participants who perceived the product performance of style and color to be better than
what they expected tended to have a higher level of satisfaction with the product. These
results are consistent with the study of Chen-Yu et al. (1999), indicating that expectancy
disconfirmation was a determinant of CS/D with the apparel product.
The results related to the visible attribute expectancy disconfirmation suggest that
e-tailers need to help their customers to form accurate expectation that matches the actual
product performance, especially in the attributes that consumers can observe on web
pages. For example, if e-tailers use special effects to modify the photo to make the
garment looks attractive but the photo does not truthfully illustrate the actual style or
color, when consumers receive the product and find the style or color is not as they
expected, they will be dissatisfied with the product, and this dissatisfaction may lead to
their dissatisfaction with the brand. Thus, e-tailers should not only focus on the aesthetic
aspect of product presentation but also pay attention to the accuracy of their
communication. To help customers to form a correct expectation for product style, as
suggested by Then and DeLong (1999), e-tailers could display their products in a variety
of images, for example, showing the products in various angles such as front and back
views. Currently, different e-tailers utilize different visual displays to present the product
style, such as two-dimensional photos of their products, photos of the product on a
93

mannequin, and photos of the product worn by a model. A two-dimensional photo may
not exactly reflect the style because it is hard for consumers to imagine the
three-dimensional shape when the product is worn on the body. A photo of the product on
a mannequin or worn by a model may provide better communication for product style,
but may still have limitations in reflecting the actual look when customers wear the
product because consumers’ body shape may be very different from the mannequin or
model, even if they wear the same size as the mannequin or model. The advantage of
using a mannequin is that e-tailers can easily display garments on mannequins with
various sizes. Links can be provided to allow customers to see the garment style on the
mannequin in the same size as their own. While it is difficult to find models to represent
the standard of each size, the shape of mannequin for each size can kept the same and
provides a consistent presentation when it displays various products. Further studies
regarding product display may need to be conducted to examine which display method is
a better way to communicate product style.
In current websites, many e-tailers only show one garment in one color and then
use color swatches to show other color choices, instead of providing photos of garments
in all color selection. The current study results suggest that color is one of essential
criteria that consumers use to evaluate product performance when they evaluate the
product they ordered online. It is better that e-tailers create links to allow customers to
assess to the pictures of the product with each color to help them accurately sense the
appearance of the product with different colors. Communicating the true color of a
product is a challenge for apparel e-tailers because even if e-tailers can accurately show
the color of the product on the website, the color displayed on different computer
monitors may demonstrate a different color. One way to better communicate the product
color may be by sending loyal customers color swatches, which show the colors of most
products in the season. Apparel design companies usually develop a color theme for each
season and then develop various lines of products using the same color theme. Although
computer techniques are very advanced in nowadays, design companies are still often
used color swatches to communicate with manufactures to ensure that the color of the
product they order can be delivered accurately. The same method may be used to
94

communicate with loyal online customers to provide a tool for them to identify the color
they prefer and sense the color of the product more accurately.
The current study showed that the product performance expectation formed at
purchase, expectancy disconfirmation of invisible attributes (i.e., fabric, fit,
workmanship), and CS/D with the brand were not antecedences of CS/D with the product.
CS/D with the product majorly was resulted in participants’ evaluation of product
performance. A possible reason why expectation for product performance did not play a
significant role in determining CS/D with the product might be that insufficient
information was provided on web pages about the invisible product attributes. Most
current websites only provide fabric content to describe the fabric, use size charts to offer
fit information, and rarely provide any information about workmanship. Similar to most
current websites, in this study, only fabric content and size charts were provided. No
description about the workmanship of the sweatshirt was provided. Because of the
inadequate information about these product attributes, it is possible that participants could
not have a clear base to form their expectation for the performance of the attributes such
as fabric quality and garment workmanship and fit, and thus, they did not use the
expectation formed at purchase as a comparison standard to determine their satisfaction.
Consumer Satisfaction/Dissatisfaction with the Brand
As for CS/D with the brand, perceived brand image at purchase and CS/D with
the product were significant antecedences. Participants who perceived the brand with
better brand image at purchase had a higher level of satisfaction with the brand at the
product receiving stage. This result is consistent with the study result of Esch, Langner,
Schmitt and Geus (2006), who found that brand image had a positive relationship with
CS/D with the brand. The positive relationship found between CS/D with the product and
CS/D with the brand is consistent with the study by Ha (2004), indicating that if
consumers were dissatisfied with the product performance sold on a website, their
satisfaction with the brand would be reduced. CS/D with the product and CS/D with the
brand was hypothesized to be interrelated; however, the study results showed that the
effect was only one direction from CS/D with the product to CS/D with the brand. CS/D
with the product positively influenced CS/D with the brand, but CS/D with the brand did
95

not directly influence CS/D with the product. These results suggest that CS/D with the
brand may be a cumulated outcome of CS/D with the product that consumers purchased.
Each satisfaction or dissatisfaction with a product of the brand may build up or reduce
consumers’ satisfaction with the brand. As the proposition of Yi (1990) that CS/D is the
result of the continuous purchase experience or service reception. To build up CS/D with
a brand, e-tailers should ensure the image and quality to be consistent of all the products
they carry. For example, many apparel companies offer apparel products including
clothing, accessories and shoes or even household textiles such as bed sheets and
comforters. To develop a high level of consumer satisfaction with the brand, e-tailers
need to satisfy consumers in every single transaction.
Perceived Brand Image at the Product-Receiving Stage
Three antecedences (i.e., perceived brand image at purchase, perceived product
performance, CS/D with the brand) were found to influence participants’ perception of
brand image at the product-receiving stage. It was not surprising to find that participants’
initial perception of brand image formed at the purchase stage was significantly
associated with their perception of brand image after they received the product.
Participants’ perception of product performance after they examined and tried on the
product also influenced their perceived brand image at the product-receiving stage.
However, among the three antecedences, CS/D with the brand was the most important
factor influencing participants’ perception of brand mage at the product-receiving stage.
These results showed that consumers may adjust their perception of brand image after
they received the product according to their perception of brand image at the purchase
stage and the quality of the product that they ordered online. More importantly, if
consumers are satisfied with the brand, they might modify their perception of the brand to
be a better image. These results further illustrate the importance of CS/D with the brand.
Building up a good brand image is important. However, to maintain the good image, it is
essential that target customers are satisfied with the brand, not only the product.
96

Product Return Intention and Repurchase Intention
When participants’ product return intention was examined, results showed that
there was a significant relationship between product return intention and CS/D with the
product. Participants who had a lower level of satisfaction with the product had a
significantly higher level of intention to return the product. This result is consistent with
the study of Nitse et al., (2004), indicating that if consumers were dissatisfied with the
product, they were more likely to return the product. These results suggest that e-tailers
should make sure that their products can satisfy their consumers. The more their
customers are satisfied with the product, the less likely they would return the product.
O’Neill and Chu (2001) indicate that product return causes direct and indirect costs for
e-tailers. The direct costs include inventory, product packaging and shipment from
manufacturers, and indirect costs include communication service with customers and
product return processing. Thus, reducing product return is essential for e-tailers.
Understanding the reason why customers return the product may provide valuable
information to prevent similar problem occurs, and thus, may reduce the product return
rate in future. E-tailers may consider providing a short survey form in the shipping box or
posting on the website for customers to download. If consumers would like to return the
product, he or she may fill out the survey form and get a return shipping discount. This
survey may help e-tailers to understand customers’ shopping experience and their
opinions on product performance, customer service quality, and other features regarding
the website, the product, and service that the e-tailer provided. From the perspective of
customer relationship, good return policy and service are crucial because they can
improve customer’s online shopping experience with the e-tailer even if they are not
satisfaction with the product. The current study found a significant relationship between
CS/D with the brand and repurchases intention. It is possible that if customers are
satisfied with the e-tailer, their intention to repurchase products from the same website
may be also increased.
When repurchase intention was examined, results showed that there were
significant relationships between perceived brand image at the product-receiving stage
and repurchase intention, and between CS/D with the brand and repurchase intention.
Participants who perceived the brand with better image at the product-receiving stage had
97

a higher intention to repurchase the products of the brand. This result is consistent with
previous study results (Grewal et.al, 1998), indicating that store image had a direct and
positive relationship with consumers’ purchase intention. These results further indicate
the importance of brand image, which not only may influence customers’ satisfaction but
also their intention to repurchase the products of the same brand. These results suggest
that when building up apparel brands, e-tailers should use easy-to-remember brand name
and easy-to-recognized brand logo to help their customers to include their brand into their
evoked set (i.e., the brands that can be activated from memory). To building up brand
image, studies showed that advertising may be the most important factor to developing
brand image (Lindsay, 1990). Advertisements carrying messages about the brand can help
marketers to build up an image with a specific brand personality and also help to increase
brand equity (i.e., the value of the brand in consumers’ minds) (Meenaghan, 1995). To
maintain the existing customers to repurchase the products of the same brand, e-tailers
may periodically send out promotion e-mails with coupon codes to show their
appreciation for the loyal customers and help consumers to recall their memory related to
the brand.
Participants who had a higher level of satisfaction with the brand significantly had
a higher intention to repurchase the products of the brand. This result is consistent with
previous study results (Bennett & Rundle-Thiele, 2004; Jones & Suh, 2000; Kim, Ferrin
& Rao, 2003), indicating that CS/D influenced consumers’ repurchase intention. However,
CS/D with the product had no significantly direct relationship with participants’ intention
to repurchase products of the same brand. It indirectly influenced repurchase intention
through CS/D with the brand. These results suggest that to develop a long-term
relationship with customers, it is important to increase customers’ satisfaction with the
brand, in addition to their satisfaction with the products. For example, e-tailers may
provide prompt responses to consumers’ questions, periodical greetings or birthday gift
code to increase customers’ satisfaction with the brand.
98

Conclusion and Suggestions for Strategies in Apparel Online Shopping
Although the results of this study cannot be generalized to the general population
and the results need to be verified by other studies, this study provides some insights that
may extend the understanding of consumer behavior in online shopping at the
product-receiving stage. This study showed that more female participants are involved in
apparel online shopping than male participants. In addition to providing more products to
attract female online shoppers, e-tailers should also consider website design and provide
the sales promotion more favorable for female consumers. For example, they might use
colorful schemes on the website design or include coupons in the promotion e-mails.
Affective advertisements (i.e., banners, pop-up messages) in special days (e.g.,
Valentine’s Day, Anniversary) or celebrity advocates may be also effective ways to draw
more female consumers browsing the website.
This current study showed that brand image played an essential role in apparel
online shopping. Pitta and Kutsanis (1995) indicate that brand image can help e-tailers to
position their products, differentiate themselves from other brands, create consumers’
positive attitudes and emotions toward their brand, and help their target customers
perceive a high level of benefits of purchasing or using their brand. The current study
further reveals some insights in the effect of brand image in online shopping. Brand
image at purchase could positively influence consumers’ expectation for product
performance, indirectly influence consumers’ perception of product performance through
product performance expectation, directly influence consumers’ perceived brand image at
the product-receiving stage, and directly affect satisfaction with the brand. In order to
create a good brand image, this study suggests that e-tailers should identify the self-image
of their target consumers, in order to develop a brand with an image that is consistent
with the image of their target customers. The congruity between the image of the brand
and customers’ self-image can increase consumers’ perception of the brand image at the
purchase stage.
The current study suggests that e-tailers need to pay attention to the linkage
among brand image, product performance expectation and product performance. Brand
image played a significant role in influencing consumers’ expectation for the product
99

performance. The perceived product performance directly influenced by expectation for
product performance, and it would affect CS/D with the product. The current study
showed that product performance was the most important direct factor related to
consumers’ satisfaction with the product that they order online. Hence, e-tailers need to
provide products that fulfill customers’ evaluation criteria. This study suggests that when
consumers evaluate the performance of a sweatshirt, they evaluate product style, color,
fabric, fit, and workmanship, similar to the evaluation of product at purchase in offline
shopping.
This study also showed that visible attribute expectancy disconfirmation might
influence CS/D with the product. To increase consumer satisfaction with the product at
the product-receiving stage, it is important for e-tailers to help their customers to select
the style and color that they desire and help them to form an accurate expectation for
product performance. For example, they may provide more descriptions on style,
consistently show their products on mannequins with standardized sizes, provide links to
show garments in each color selection, send color swatches to loyal customers.
The current study showed that CS/D with the product directly influenced product
return intention. Perceived brand image and CS/D with the brand directly influenced
repurchase intention. These study results suggest that e-tailers have to pay attention to
CS/D with the product in order to reduce the product return rate, and increase the rate of
successful transaction in apparel online shopping. To maintain a good brand image and
increase customers’ brand loyalty, it is important to achieve a high level of consumer
satisfaction with the brand by accumulating satisfaction with the product in each
transaction.
Limitations of the Study and Recommendations for Future Researches
An experimental design was used in this study. A major advantage of
experimental design is the existence of control condition that reduces the influences of
exogenous variables, and therefore, increases the internal validity (Gray, 2004). The
disadvantage of the experimental design, however, is the external validity may be low
because the participants in the experimental study have to come to a specific controlled
100

environment to participate in the study. Because the great degree of control and the
artificial environment, participants in an experimental design study may react differently
from their behaviors in the real-world (Cooper & Emory, 1995). In this study, participants
were asked to role-play a situation in an online shopping scenario. They pretended that
they had found a product in the website of a particular brand and decided to purchase it.
After the time they expected, they received the product. However, they did not really pay
for the product or wait for the delivery time to receive the product. In addition, the
researcher stayed beside the participant during the data collection, in case the participant
needed any assistance in browsing the website or answering the question. The simulating
experimental environment and artificial online shopping process may result in responses
that differ from real-world behaviors. To verify the current study results, other research
methods may be utilized in future research. For example, focus group interview can be
conducted to investigate consumers’ perception of brand image and product performance
in a more detail way, understanding by which criteria they evaluate the image of apparel
brands and the product performance in online shopping. A large scale survey can be
conducted to examine if the current study results can be generalized to other populations.
University students were selected as the participants of the study because they are
one of the major users of Internet (Pitkow & Kehoe, 1996). They search for product
information on websites and spend a lot in online apparel shopping (Comegys & Brennan,
2003). However, university students have higher education, more experiences with
computers and the Internet, and are in a similar age group. Their characteristics and
behaviors may be different from other population groups. In addition, the sample size in
an experimental design is usually small, and thus, the participants often cannot represent
the general population and the result may not be able to generalize to a large population.
In this study, only 120 undergraduate students from one university were recruited to
participate in the study, and therefore, the results of the study may not be generalized to
all college students. For future studies, a larger sample size and consumers from other
population groups of different ages, education levels, and personal or household income
can be used to verify the results of the current study.
Sweatshirts were chosen in this study as the garment sample. The advantage of
selecting sweatshirts was the loose fit that participants’ evaluation of product
101

102
performance would not be dominated by the fit. However, consumers’ evaluating criteria
of product performance may be varied for different product items. For example, future
studies may utilize apparel products with various fit requirements (e.g., shirts, jeans) or
for various occasions (e.g., formal party, interview, outdoor events, exercise) to examine
if variables influence CS/D differ in various products with different fit requirements or
for different occasions. Future researchers may also use accessories or shoes as samples
to examine if the results will be consistent with the current study.
The relationship between invisible attribute expectancy disconfirmation and CS/D
with the product was not significant. We suggest that the reasons may be the website in
this study did not provide enough information about invisible attributes (i.e., fabric, fit,
workmanship) for participants to form an accurate expectation at the purchase stage. Thus,
the expectation could not be a significant comparison standard to determine
satisfaction/dissatisfaction. Future researchers may need to investigate whether there is a
significant relationship between invisible attribute expectancy disconfirmation and CS/D
with the product if sufficient information about invisible attributes of the product
provided.
This study emphasized on the relationships between brand image and CS/D with
the product and with the brand in online shopping. However, CS/D at the
product-receiving stage may also be influenced by the service of e-tailers (e.g., delivery
time, customer service). Future studies of CS/D at the product-receiving stage in apparel
online shopping may need to include the concepts of CS/D with the service to investigate
the relationships between brand image and CS/D with the product, with the service, and
with the brand.

REFERENCES
Aaker, D. A. (1991). Managing brand equity: Capitalizing on the value of a brand name. New York: The Free Press.
Aaker, J. L. (1997). Dimension of brand personality. Journal of Marketing Research,
34(3), 347-356. Abercrombie and Fitch (n.d.). A & F Careers. Retrieved July 30, 2007, from
http://www.abercrombie.com. Alba, J. W., & Hutchinson, J. W. (1987). Dimension of consumer expertise. Journal of
Consumer Research, 13(1), 511-454. Alba, J., Lynch, J., Weitz, B., Janiszewski, C., Lutz, R., Sawyer, A., & Wood, S. (1997).
Interactive home shopping: Consumer, retailer, and manufacturer incentives to participate in electronic marketplaces. Journal of Marketing, 61(3), 38-53.
Anderson, E. W., & Fornell, C. (1994). A customer satisfaction research prospectus. In R.
T. Rust & Oliver, R. L. (Eds.), Service quality: New directions in theory and practice (pp.241-268). Thousand Oaks, CA: Sage Publications, Inc.
Anderson, E. W., Fornell, C. & Lehman, D. (1994). Customer satisfaction, market share,
and profitability: Findings from Sweden. Journal of Marketing, 58(3), 53-66. Anderson, R. E. (1973). Consumer dissatisfaction: The effects of disconfirmed
expectancy on perceived product performance. Journal of Marketing Research, 10(1), 38-44.
Ataman, B., & Ulengin, B. (2003). A note on the effect of brand image on sales. Journal
of Product and Brand Management, 12(4), 237-250. Barksy, J. D. (1992). Customer satisfaction in the hotel industry: Meaning and
measurement. Hospitality Research Journal, 16(1), 51-73. Baugh, D. F., & Davis, L. L. (1989). The effect of store image on consumers’ perceptions
of designer and private label clothing. Clothing and Textiles Research Journal, 7(3), 15-21.
Beerli, A., Martin, J. D., & Quintana, A. (2004). A model of customer loyalty in the retail
banking market. European Journal of Marketing, 38(1/2), 253-275.
103

Belleau, B. D., Summers, T. A., Xu, Y., & Pinel, R. (2007). Theory of reasoned action: Purchase intention of young consumers. Clothing & Textiles Research Journal, 25(3), 244-257.
Bennett, R., & Rundle-Thiele, S. (2004). Customer satisfaction should not be the only
goal. Journal of Services Marketing, 18(7), 514-523. Biel, A. L. (1992). How brand image drives brand equity. Journal of Advertising
Research, 32(6), 6-13. Biel, A. L. (1993). Converting image into equity. In D. A. Aaker & Biel, A. (Eds.), Brand
equity and advertising. Hillsdale, NJ: Lawrence Erlbaum Associates. Bitner, M. J., Brown, S. W., & Meuter, M. L. (2000). Technology infusion in service
encounters. Journal of the Academy of Marketing Science, 28(1), 138-149. Blackwell, R. D.,Miniard, P. W., & Engel, J. F. (2001). Consumer behavior (9th ed.).
New York: Harcourt College Publishers. Bloemer, J. M. M., & Kasper, H. D. P. (1995). The complex relationship between
consumer satisfaction and brand loyalty. Journal of Economic Psychology, 16(2), 311-329.
Blumberg, M. R. (2008, Jan/Feb), Reducing returns, maximizing loss prevention and
validating warranty entitlement in the retail industry. Reverse Logistics Magazine, 9, 13.
Bone, P. F., Shimp, T. A., & Sharma, S. (1990). Assimilation and contrast effects in
product performance perceptions: Implications for public policy. Journal of Public Policy and Marketing, 9(1), 100-110.
Bouchard, P. (2002, September 24). Young female adolescents: Comeback of sex
stereotypes. Paper presented at the Chaire d’étude Claire-Bonenfant sur la condition féminine, Université Laval, Quebec City, Canada.
Boulding, W., Kalra, A., Staelin, R., & Zeithaml, V. A. (1993). A dynamic process model
of service quality: From expectations to behavior intensions. Journal of Marketing Research, 30(1), 7-27.
Brown, P., & Rice, J. (1998). Ready-to-wear apparel analysis. Upper Saddle River, NJ:
Merrill/Prentice Hall. Browne, M. W., & Cudeck, R. (1993). Alternative ways of assessing model fit. In K. A.
Bollen & J. S. Long (Eds), Testing structural equation models (pp. 445-455). Newbury Park, CA: Sage.
104

Byrne, B. M. (2001). Structural equation modeling with AMOS: Basic concepts, applications, and programming. Mahwah, NJ: Lawrence Erlbaum Associates, Publishers.
Burke, R. R. (1997). Do you see what I see? The future of virtue shopping. Journal of
Academy of Marketing Science, 25(4), 352-360. Burns, L. D., & Bryant, N. (1997). The business of fashion. New York: Fairchild. Carlsmith, J. M., & Aronson, E. (1963). Some hedonic consequences of the confirmation
and disconfirmation of expectancies. Journal of Abnormal and Social Psychology, 66(2), 151-156.
Chan, A. K. K., & Huang, Y. Y. (1997). Brand naming in China: A linguistic approach,
Marketing Intelligence & Planning, 15(5), 227-234. Chen, J. S., & Ching, R. K. H. (2007). The effects of mobile customer relationship
management on customer loyalty: Brand image does matter. Proceedings of the 40th Hawaii International Conference on System Sciences, Hawaii, 526, 151-160.
Chen, Q., Clifford, S. J., & Wells, W. D. (2002). Attitude towards the site II: New
information. Journal of Advertising Research, 42(2), 33-45. Chen-Yu, H. J. (1995). Consumer satisfaction/dissatisfaction with the performance of
ready-to-wear apparel products. Unpublished doctoral dissertation, University of Minnesota, St. Paul.
Chen-Yu, J., & Hong, K. (2006). How do dissatisfied apparel consumers respond? A
comparison of college students in the U.S. and South Korea. Journal of Family & Consumer Sciences, 98(3), 20-25.
Chen-Yu, J. H., Hong, K. H., & Lee, Y. (2001). A comparison of determinants of
consumer satisfaction dissatisfaction with the performance of apparel products between South Korea and the United States. International Journal of Consumer Studies, 25(1), 62-71.
Chen-Yu, H. J., Williams, G., & Kincade, D. H. (1999). Determinants of consumer
satisfaction/dissatisfaction with the performance of apparel products. Family and Consumer Sciences Research Journal, 28(2), 167-192.
Chung, J. E. (2002). Modeling the differential effects of brand image and country-of-
manufacture on Korean consumers' purchasing behavior of hybrid products. Unpublished doctoral dissertation, Michigan State University, East Lansing.
Churchill, G. A., Jr., & Suprenant, C. (1982). An investigation into the determinants of
consumer satisfaction. Journal of Marketing Research, 19(4), 491-504.
105

Comegys, C., & Brennan, M. L. (2003). Students’ online shopping behavior: A dual-country perspective. Journal of Internet Commerce 2(2), 69-87.
Cooper, D. R., & Emory, C. W. (1995). Business research methods. Homewood, IL:
Richard D. Irwin. Corcoran, C. T. (2006, 10 July). Get your clicks - Shopping online is becoming easier,
thanks to innovations in technology and consumer comfort levels. Women’s Wear Daily, p.12B.
Cox, J., & Dale, B. G. (2002). Key quality factors in Web site design and use: An
examination. International Journal of Quality & Reliability Management, 19(6/7), 862-888.
Cronin, J. J., & Taylor, S. A. (1992). Measuring service quality: A re-examination and
extension. Journal of Marketing, 56(3), 56-68. Czepiel, J. A., Solomon, M. R., Suprenant, C. F., & Gutman, E. G. (1985). Service
encounters: An overview. Lexington, MA: Lexington Books. d’ Astous, A., & Saint-Louis, O. (2005). National versus store brand effects on consumer
evaluation of a garment. Journal of Fashion Marketing and Management, 9(3), 306-317.
Dagenais, D. L., & Duhaime, C. P. (1992). Estimating models of determination of
consumer satisfaction: An alternative approach. Journal of Consumer Satisfaction, Dissatisfaction and Complaining Behavior, 5, 24-35.
Danaher, P. J., & Mattsson, J. (1994). Customer satisfaction during the service delivery
process. European Journal of Marketing, 28(5), 5-16. Day, R. L. (1982). The next step: Commonly accepted constructs in satisfaction and
complaining research. In Ralph L. Day and H. Keith Hunt (Eds.), International Fare in Consumer Satisfaction and Complaining Behavior (pp.49-56). Bloomington, IN: School of Business, Indiana University.
Degeratu, A. M., Rangaswamy, A., & Wu, J. (2000). Consumer choice behaviour in
online and traditional supermarkets: The effects of brand name, price and other search attributes. International Journal of Research in Marketing, 17(1), 55-78.
Dellaert, B., & Kahn, B. E. (1999). How tolerable is delay? Consumers’ evaluations of
Internet Web sites after waiting. Journal of Interactive Marketing, 13(1), 41-54. Ditcher, E. (1985). What's in an image? Journal of Consumer Marketing, 2(1), 75-81.
106

Dobni, D., & Zinkhan, G. M. (1990). In search of brand image: A foundation analysis. Advances in Consumer Research, 17, 110-119.
Dodds, W. B., Monroe, K. B., & Grewal, D. (1991). Effects of price, brand, and store
information on buyers’ product evaluations. Journal of Marketing Research, 28(3), 307-319.
Duhaime, C. (1988). Consumer satisfaction with distribution system for durable product.
Journal of Consumer Satisfaction, Dissatisfaction and Complaining Behavior, 1, 53-60.
Eckman, M., Damhorst, M. L., & Kadolph, S. J. (1990). Toward a model of the in-store
purchase decision process: Consumer use of criteria for evaluating women’s apparel. Clothing and Textiles Research Journal, 8(2), 13-22.
Eighmey, J., & McCord, L. (1998). Adding value in the information age: Uses and
gratifications of sites on the World Wide Web. Journal of Business Research, 41(3), 187-194.
Ekinci, Y. (2002). A review of theoretical debates on the measurement of service quality:
Implications for hospitality research. Journal of Hospitality & Tourism Research, 26(3), 199-216.
Ekinci, Y. (2003). Which comparison standard should be used for service quality and
customer satisfaction? Journal of Quality Assurance in Hospitality & Tourism, 4(3/4), 61-75.
Engel, J. F., & Blackwell, R. D. (1982). Consumer behavior (4th ed.). New York: Dryden
Press. Engel, J. F., Blackwell, R. D., & Miniard, P. W. (1993). Consumer behavior (7th ed.).
New York: Dryden Press. Engel, J., Blackwell, R. D., & Miniard, P. W. (1995). Consumer behavior (8th ed.). New
York: Dryden Press. Esch, F. R., Langner, T., Schmitt, B. H., & Geus, P. (2006). Are brands forever? How
brand knowledge and relationships affect current and future purchases. Journal of Product & Brand Management, 15(2), 98–105.
Estelami, H., & Maeyer, P. D. (1997). A visual approach for identifying consumer
satisfaction segments. Journal of Consumer Satisfaction, Dissatisfaction and Complaining Behavior, 10, 104-115.
107

Faircloth, J. B., Capella, L. M., & Alford, B. L. (2001). The effect of brand attitude and brand image on brand equity. Journal of Marketing Theory and Practice, 9(3), 61-75.
Fan, X. Thompson, B., & Wang, L. (1999). Effects of sample size, estimation methods,
and model specification on structural equation modeling fit indexes. Structural Equation modeling: A Multidisciplinary Journal, 6(1), 56-83.
Festinger, L. (1957). A theory of cognitive dissonance Stanford, CA: Stanford University
Press. Festinger, L. (1962). Cognitive dissonance. Scientific American, 7(2), 93-102. Fornell, C. (1992). A national customer satisfaction barometer: The Swedish experience.
Journal of Marketing, 56(1), 6-21. Forrester Research, Inc. (2006, October 12). US eCommerce: Five-year forecast and data
overview. Retrieved September 9, 2007, from http://www.forrester.com/Research/ Document/Excerpt/0,7211,40248,00.html. Forsythe, S. M. (1991). Effect of private, designer, and national brand names on
shoppers’ perception of apparel quality and price. Clothing and Textiles Research Journal, 9(2), 1-6.
Fowler, D., & Clodfelter, R. (2001). A comparison of apparel quality: Outlet stores
versus department stores. Journal of Fashion Marketing and Management, 5(1), 57-66.
Fram, E. H., & Grady, D. B. (1995). Internet buyers: Will the surfers become buyers?
Direct Marketing, 58(6), 63-65. French, T., & O’Cass, A. (2001). Internet users’ adoption of Web retailing: User and
product dimensions. Journal of Product & Brand Management, 10(6), 361-381. Gardner, B. B., & Levy, S. J. (1955). The product and the brand. Harvard Business
Review, 33(2), 33-39. Ghose, S., & Dou, W. (1998). Interactive functions and their impacts on the appeal of
Internet presence sites. Journal of Advertising Research, 38(2), 29-43. Giese, J., & Cate, A. (2000). Defining customer satisfaction. Academy of Marketing
Science Review, 2000(1), 1-3.
108

Gilly, M. C., Cron, W. L., & Barry, T. E. (1982). The expectations-performance comparison process: An investigation of expectation types. In R. L. Day & Hunt, H. K. (Eds.), International Fare in Consumer Satisfaction and Complaining Behavior (pp.10-16). Bloomington, IN: Indiana University.
Goldsmith, R. E., & McGregor, S. (1999). Electronic commerce: An emerging issue in
consumer education. Journal of Consumer Studies and Home Economics, 23(3), 197-206.
Gommans, M., Krishnan, K. S., & Scheffold, K. B. (2001). From brand loyalty to
e-loyalty: A conceptual framework. Journal of Economic and Social Research, 3(1), 43-58.
Goode, M. M. H. (2001). Predicting consumer satisfaction from CD players. Journal of
Consumer Behaviour, 1(4), 323-335. Govers, P.C.M., & Mugge, R. (2004), “I love my jeep, because it’s tough like me”: The
effect of product-personality congruence on product attachment. Proceedings of the Fourth International Conference on Design and Emotion, Turkey, 4, 1-15.
Govers, P. C. M., & Schoormans, F. P. L. (2005). Product personality and its influence
on consumer preference. Journal of Consumer Marketing, 22(4), 189-197. Graeff, T. R. (1997). Consumption situations and the effects of brand image on
consumers’ brand evaluations. Psychology and Marketing, 14(1), 49-70. Gray, D. E. (2004). Doing research in the real world. Thousand Oaks, CA: Sage
Publications, Inc. Grewal, D., Krishnan, R., Baker, J., & Borin, N. (1998). The effect of store name, brand
name and price discounts on consumers' evaluations and purchase intentions. Journal of Retailing, 74(3), 331-352.
Gupta, S., & Chattergee, R. (1997). Consumer and corporate adoption of the World Wide
Web as a commercial medium. In R. A. Peterson (Ed.), Electronic marketing and the consumer (pp.123-138). Thousand Oaks, CA: Sage Publications.
Ha, H. Y. (2004). Factors influencing consumer perceptions of brand trust online.
Journal of Product & Brand Management, 13(5), 329-342. Hair, J. F., Tatham, R. L., Anderson, R. E., & Black, W. (1998). Multivariate data
analysis (5th ed.). Upper Saddle River, NJ: Prentice Hall. Halliday, J. (1996). Chrysler brings out brand personalities with ‘97 ads. Advertising Age,
67(40), 3-6.
109
Halstead, D., Hartmann, D., & Schmidt, S. L. (1994). Multisource effects on the satisfaction process. Journal of Academy of Marketing Science, 22(2), 114-129.
Han, J. W. (2006). The impact of self-concept/product-image congruity and functional
congruity on brand preference: Three product categories. Unpublished doctoral dissertation, Tallahassee, Florida State University.
Harris, F., & Chernatony, L. d. (2001). Corporate branding and corporate brand
performance. European Journal of Marketing, 35(3/4), 441-456. Hatch, K. L., & Roberts, J. A. (1985). Use of intrinsic and extrinsic cues to access textile
product quality. Journal of Consumer Studies and Home Economics, 9(4), 341-357.
Hausknecht, D. R. (1990). Measurement scales in consumer satisfaction/dissatisfaction.
Journal of Consumer Satisfaction, Dissatisfaction and Complaining Behavior, 3, 1-11.
Heiman, A., & Muller, E. (1996). Using demonstration to increase new product
acceptance: Controlling demonstration time. Journal of Marketing Research, 33(4), 422-430.
Heisey, F. L. (1990). Perceived quality and predicted price: Use of the minimum
information environment in evaluating apparel Clothing & Textiles Research Journal, 8(4), 22-28.
Helgeson, J. G., & Supphellen, M. (2004). A conceptual and measurement comparison of
self-congruity and brand personality: The impact of socially desirable responding. International Journal of Market Research, 46(2), 205-237.
Hem, L. E., & Iversen, N. M. (2004). How to develop a destination brand logo: A
qualitative and quantitative approach. Scandinavian Journal of Hospitality and Tourism, 4(2), 83-106.
Herzog, H. (1963). Behavioral science concepts for analyzing the consumer. In P. Bliss
(Ed.), Marketing and the behavioral sciences (pp.76-86). Boston: Allyn and Bacon.
Hill, N., Brierley, J., & MacDougall, R. (2003). How to measure customer satisfaction
(2nd ed.). Hampshire, UK: Gower Publishing, Ltd. Ho, C., & Wu, W. (1999). Antecedents of customer satisfaction on the Internet: An
empirical study of online shopping. Proceedings of the Thirty-Second Hawaii International Conference on System Sciences, USA, 5, 5027-5035.
110

Hogg, M. K., Bruce, M., & Hill, A. J. (1998). Fashion brand preferences among young consumers. International Journal of Retail and Distribution Management, 26(8), 293-300.
Hogg, M. K., & Savolainen, M. H. (1999). Exploring the impact of public and private
contexts on self-image and product/brand-image congruity. New Product Development and Innovation Management, 1(2), 155-166.
Holak, S. L., Lehmann, D. R., & Sultan, F. (1987). The role of expectations in the
adoption of innovative consumer durables: Some preliminary evidence. Journal of Retailing, 63(3), 243-259.
Holden, S. J. S., & Vanhuele, M. (1999). Know the name, forget the exposure: Brand
familiarity versus memory of exposure context. Psychology & Marketing, 16(6), 479-496.
Holstius, K., & Paltschik, M. (1983). Brand names and perceived value. European
Research, 11(4), 151-156. Hong, K., & Rucker, M. (1995). The role of product type and consumer fashion
involvement in clothing satisfaction. Journal of Consumer Satisfaction, Dissatisfaction and Complaining Behavior, 8, 198-207.
Hou, Y. (2005). Service quality of online apparel retailers and its impact on customer
satisfaction, customer trust and customer loyalty. Unpublished doctoral dissertation, University of North Carolina, Greensboro.
Howard, J. A., & Sheth, J. N. (1969). The theory of buyer behavior. New York: John
Wiley & Sons, Inc. Hoyer, W. D., & Brown, S. P. (1990). Effects of brand awareness on the choice for a
common, repeat-purchase product. Journal of Consumer Research, 17(2), 141-148.
Hu, L. T., & Bentler, P. M. (1995). Evaluating model fit. In R. H. Hoyle (Ed.), Structural
equation modeling: Concepts, issues, and applications (pp.76-99). Thousand Oaks, CA: Sage.
Hu, L. T., & Bentler, P. M. (1999). Cutoff criteria for fit indexes in covariance structure
analysis: Conventional criteria versus new alternatives. Structural Equation Modeling: A Multidisciplinary Journal, 6(1), 1-55.
Hui, M. K., Thakor, M. V., & Gill, R. (1998). The effect of delay type and service stage
on consumers’ reactions to waiting. Journal of Consumer Research, 24(4), 469-479.
111

Hui, M. K., & Zhou, L. (1996). How does waiting duration information influence customers’ reactions to waiting for services? Journal of Applied Social Psychology, 26(19), 1702-1717.
Jamal, A., & Goode, M. H. (2001). Consumer and brands: A study of the impact of
self-image congruence on brand preference and satisfaction. Marketing Intelligence and Planning, 19(7), 482-492.
Jang, N., Dickerson, K. G., & Hawley, J. M. (2005). Apparel product development:
Measures of apparel product success and failure. Journal of Fashion Marketing and Management, 9(2), 195-206.
Janiszewski, C., & van Osselaer, S. M. J. (2000). A connectionist model of brand-quality
associations. Journal of Marketing Research, 37(3), 331-350. Jarvenpaa, S. L., & Todd, P. A. (1997). Consumer reactions to electronic shopping on the
World Wide Web. International Journal of Electronic Commerce, 1(2), 59-88. Jeffrey, D. (1999), Study says 2 of 3 consumers still leery of Web purchasing. Billboard,
111(36), 85. Jiang, P., & Rosenbloom, B. (2005). Customer intention to return online: Price perception,
attribute-level performance, and satisfaction unfolding over time. European Journal of Marketing, 39(1/2), 150-174.
Jones, M. A., & Suh, J. (2000). Transaction-specific satisfaction and overall satisfaction:
An empirical analysis. Journal of Services Marketing, 14(2), 147-159. Jun, M., Yang, Z., & Kim, D. (2004). Customers’ perceptions of online retailing service
quality and their satisfaction. International Journal of Quality & Reliability Management, 21(6), 817-840.
Kalwani, M. U., & Yim, C. K. (1992). Consumer price and promotion expectations: An
experimental study. Journal of Marketing Research, 29(1), 90-100. Kapferer, J. N. (1991). Brand, capital or firms. Paris: Les Editions d’Organisation. Kapferer, J. N. (1992). Strategic brand management: New approaches to creating and
evaluating brand equity. New York: The Free Press. Kapferer, J. N., & Laurent, G. (1983). Brand sensitivity. Adolescence, 18(71), 659-674. Kapferer, J. N., & Laurent, G. (1992). Brand sensitivity. Paris: Les Editions
d’Organisation.
112

Kasten, R., & Weintraub, Z. (1999). Rating errors and rating accuracy: A field experiment. Human Performance, 12(2), 137-153.
Keller, K. L. (1993). Conceptualizing, measuring, and managing customer-based brand
equity. Journal of Marketing, 57(1), 1-22. Keller, K. L. (1998). Strategic brand management, in building, measuring and managing
brand equity (1st ed.). Upper Saddle River, NJ: Prentice Hall, Pearson Education, Inc.
Keller, K. L. (2003). Strategic brand management, in building, measuring and managing
brand equity (2nd ed.). Upper Saddle River, NJ: Prentice Hall, Pearson Education, Inc.
Kennedy, J. R., & Thirkell, P. C. (1988). An extended perspective on the antecedents of
satisfaction. Journal of Consumer Satisfaction, Dissatisfaction and Complaining Behavior, 1, 2-9.
Kent, R. J., & Allen, C. T. (1994). Competitive interference effects in consumer memory
for advertising: The role of brand familiarity. Journal of Marketing, 58(3), 97-105.
Kim, D. J., Ferrin, D. L., & Rao, H. R. (2003). A study of the effect of consumer trust on
consumer expectations and satisfaction: the Korean experience. Proceedings of the 5th ACM International Conference on Electronic Commerce, Pittsburgh, Pennsylvania, 50, 310-315.
Kim, M., Kim, J., & Lennon, S. J. (2006). Online service attributes available on apparel
retail web sites: An E-S-QUAL approach. Managing Service Quality, 16(1), 51-77.
Kolter, P. (1988). Marketing management: Analysis, planning and control. Englewood
Cliffs, NJ: Prentice Hall. Kressmann, F., Sirgy, M. J., Herrmann, A., Huber, F., Huber, S., & Lee, D. J. (2006).
Direct and indirect effects of self-image congruence on brand loyalty. Journal of Business Research, 59(2006), 955-964.
Lachance, M. J., Beaudoin, P., & Robitaille, J. (2003). Adolescents' brand sensitivity in
apparel: Influence of three socialization agents. International Journal of Consumer Studies, 27(1), 47-57.
Laforet, S. (2007). British grocers’ brand extension in financial services. Journal of
Product & Brand Management, 16(2), 82-97.
113

Lam, J. C. Y., & Lee, M. K. O. (1999). A model of Internet consumer satisfaction: Focusing on the Website design. Proceedings of the Fifth Americas Conference on Information Systems, USA, 1999, 526-529.
Lee, H. H. (2004). Antecedents and consequences of satisfaction with a mass customized
Internet apparel shopping site. Unpublished doctoral dissertation, Iowa State University, Ames.
Lee, M., & Johnson, K. P. (2002). Exploring differences between Internet apparel
purchasers, browsers, and non-purchasers. Journal of Fashion Marketing and Management, 6(2), 146-157.
Lennon, S. J., & Fairhurst, A. E. (1994). Categorization of the quality concept. Home
Economics Research Journal, 22(3), 267-285. Li, X. (2004). How brand knowledge influences consumers’ purchase intentions.
Unpublished doctoral dissertation, Auburn University, Auburn. Liechty, M., & Churchill, G.A. (1979). Conceptual insights into consumer satisfaction
with services. Educator’s Conference Proceedings, Chicago: American Marketing Association, USA, 94, 509-515.
Liljander, V., & Strandvik, T. (1993). Estimating zones of tolerance in perceived service
quality and perceived service value. International Journal of Service Industry Management, 4(2), 6-28.
Lim, H., & Dubinsky, A. J. (2004). Consumers’ perceptions of e-shopping characteristics:
An expectancy-value approach. Journal of Service Marketing, 18(7), 500-513. Lindsay, M. (1990). Establish brand equity through advertising. Marketing News, 24(2),
16. Liskey-Fitzwater, M., Moore, C. L., & Gurel, L. M. (1993). Clothing importance and
self-perception of female adolescents with and without scoliosis. Clothing and Textiles Research Journal, 11(3), 16-22.
Lo, Z. W. (2001). The study of the impact of product categories, price discount and
brand awareness on consumers' brand evaluation and repurchase intention. Unpublished master thesis. Business Administration and Graduate institute of Management, Providence University, Taiwan.
Lohse, G. L., & Spiller, P. (1998). Electronic shopping: Designing online stores with
effective customer interfaces has a critical influence on traffic and sales. Communications of the ACM, 41(7), 81-87.
114

Ludvigson, S. C. (2004). Consumer confidence and consumer spending. Journal of Economic Perspectives, 18(2), 29-50.
Lynch, J. G., & Ariely, D. (2000). Wine online: Search cost affect competition on price,
quality, and distribution. Marketing Science, 19(1), 83-103. MacInnis, D. J., Moorman, C., & Jaworski, B. J. (1991). Enhancing and measuring
consumers’ motivation, opportunity, and ability to process brand information from ads. Journal of Marketing, 55(4), 32-53.
Madu, C. N., & Madu, A. A. (2002). Dimensions of e-quality. International Journal of
Quality & Reliability Management, 19(3), 246-258. Malhotra, N. K. (1988). Self-concept and product choice: An integrated perspective.
Journal of Economic Psychology, 9(1), 1-28. Maloney, D. (2001). Achieve new balance. Modern Material Handling, 56(11), 38-41. Manes, S. (1997). Web sites: Slow by design? Informationweek, 4(642), 124. McLean, F. P., Roper, L. L., & Smothers, R. (1986). Imported versus domestic blouses:
Women’s preferences and purchase motives. Home Economics Research Journal, 14(3), 306-313.
Meenaghan, T. (1995). The role of advertising in brand image development. Journal of
Product & Brand Management, 4(4), 23-34. Merriam-Webster Dictionary Online (n.d.). Online Search. Retrieved March 15, 2008,
from http://www.merriam-webster.com. Miller, J. A. (1977). Studying satisfaction, modifying models, eliciting expectations,
posing problems, and making meaningful measurements. In H. K. Hunt (Ed.), Conceptualization and Measurement of Consumer Satisfaction and Dissatisfaction (pp.72-91). Bloomington, IN: School of Business, Indiana University.
Moss, G., Gunn, R., & Heller, J. (2006). Some men like it black, some women like it pink:
Consumer implications of differences in male and female website design. Journal of Consumer Behaviour, 5(4), 328-341.
Murray, D., & Howat, G. (2002). The relationships among service quality, value,
satisfaction, and future intentions of customers at an Australian sports and leisure centre. Sport Management Review, 5(1), 25-43.
Nandan, S. (2005). An exploration of the brand identity-brand image linkage: A
communications perspective. Journal of Brand Management, 12(4), 264-278.
115

Neal, W. D., & Bathe, S. (1997). Using the value equation to evaluate campaign effectiveness. Journal of Advertising Research, 37(3), 80-85.
Nelson, M. R., & Devanathan, N. (2006). Brand placements Bollywood style. Journal of
Consumer Behaviour, 5(3), 211-221. Nitse, P. S., Parker, K. R., Krumwiede, D., & Ottaway, T. (2004). The impact of color in
the e-commerce marketing of fashions: An exploratory study. European Journal of Marketing, 38(7), 898-915.
Oliver, R. L. (1976). Hedonic reactions to the disconfirmation of product performance expectations: Some moderating conditions. Journal of Applied Psychology, 61(2), 246-250.
Oliver, R. L. (1980a). A cognitive model of the antecedents and consequences of
satisfaction decisions. Journal of Marketing Research, 17(4), 460-469. Oliver, R. L. (1980b). Theoretical bases of consumer satisfaction research: Review,
critique, and future direction. In C.W. Jr Lamb & Dunne, P.M. (Eds.), Theoretical Developments in Marketing, (pp.206-210), American Marketing Association, Chicago, IL.
Oliver, R. L. (1981). Measurement and evaluation of satisfaction processes in retail
settings. Journal of Retailing, 57(3), 25-48. Oliver, R. L. (1993). Cognitive, affective, and attribute bases of the satisfaction response.
Journal of Consumer Research, 20(3), 418-430. Oliver, R. L. (1997). Satisfaction: A behavior perspective on the consumer. New York:
McGraw-Hill. Oliver, R. L., & DeSarbo, W. S. (1988). Response determinants in customers satisfaction
judgments. Journal of Consumer Research, 14(4), 495-507. O’Neal, G. S. (1992). A conceptual model of consumer perception of apparel quality.
Journal of Theory in Home Economics, 2(1), 1-25. O'Neill, S., & Chu, J. (2001). Online returns management strategies. Executive Strategy
Report, IBM Corporation. Onkvisit, S., & Shaw, J. (1987). Self-concept and image congruence: Some research and
managerial implications. Journal of Consumer Marketing, 4(1), 13-23. Page, C., & Lepkowska-White, E. (2002). Web equity: A framework for building
consumer value in online companies. Journal of Consumer Marketing, 19(2), 231-248.
116

Park, C. W., Jaworski, B. J., & MacInnis, D. J. (1986). Strategic brand concept-image management. Journal of Marketing, 50(4), 621-635.
Park, J., & Kim, J. (2007). The importance of perceived consumption delay in Internet
shopping: Time-related information, time risk, attitude, and purchase intention. Clothing & Textiles Research Journal, 25(1), 24-41.
Park, J., & Stoel, L. (2002). Apparel shopping on the Internet: Information availability on
US apparel merchant Web sites. Journal of Fashion Marketing and Management, 6(2), 158-176.
Park, J., & Stoel, L. (2005). Effect of brand familiarity, experience and information on
online apparel purchase. International Journal of Retail & Distribution Management, 33(2), 148-160.
Parker, C., & Mathews, B. P. (2001). Customer satisfaction: Contrasting academic and
consumers’ interpretations. Marketing Intelligence & Planning, 19(1), 38-44. Peter, J. P., & Olson, J. C. (2005). Consumer behavior & marketing strategy (7th ed.). NY:
McGraw-Hill/Irwin. Peterson, R. A., Balasubramanian, S., & Bronnenberg, B. J. (1997). Exploring the
implication of the Internet for consumer marketing. Journal of Academy of Marketing Science, 25(4), 429-346.
Peterson, R. A., & Jolibert, A. J. P. (1995). A meta-analysis of country-of-origin effects.
Journal of International Business Studies, 26(4), 883-896. Pitkow, J. E., & Kehoe, C. M. (1996). Emerging trends in the www user population.
Communications of the ACM, 39(6), 106-108. Pitta, D. A., & Kutsanis, L. P. (1995). Understanding brand equity for successful brand
extension. Journal of Consumer Marketing, 12(4), 51-64. Phillip, M. V., & Suri, R. (2004). Impact of gender differences on the evaluation of
promotional emails. Journal of Advertising Research, 44(4), 360-368. Prakash, V. (1984). Validity and reliability of the confirmation of expectations paradigm
as a determinant of consumer satisfaction. Journal of the Academy of Marketing Science, 12(4), 63-76.
Pritchard, M. P., Havitz, M. E., & Howard, D. R. (1999). Analyzing the
commitment-loyalty link in service contexts. Journal of the Academy of Marketing Science, 27(3), 333-348.
117

Randall, T., Ulrich, K., & Reibstein, D. (1998). Brand equity and vertical product line extent. Marketing Science, 17(4), 356-379.
Rao, A. R., & Ruekert, R. W. (1994). Brand alliances as signals of product quality. Sloan
Management Review, 4(1), 87-97. Render, B., & O’Connor, T. S. (1976). The influence of price, store name, and brand
name on perception of product quality. Journal of the Academy of Marketing Science, 4(4), 722-730.
Rhee, Y. J. (2006). Online impulse buying behavior with apparel products: Relationships
with apparel involvement, website attributes, and product category/price. Unpublished doctoral dissertation, Virginia Polytechnic Institute and State University, Blacksburg, VA.
Russell-Bennett, R., McColl-Kennedy, J. R., & Coote, L. V. (2007). Involvement,
satisfaction, and brand loyalty in a small business services setting. Journal of Business Research, 60(2007), 1253-1260.
Rust, R. T. & Zahorik, A. J. (1993). Customer satisfaction, customer retention and market
share. Journal of Retailing, 69(2), 193-215. Roos, M. W. M. (2005). TV weather forecast or look through the window? Expert and
consumer expectations about macroeconomic conditions. International Review for Social Sciences, 58(3), 415-437.
Sahdev, A., & Gautama, P. (2007). Are consumer perceptions of brand affected by
materialism? Proceedings of International Conference on Marketing and Society, India, Indian Institute of Management Kozhikode, 6, 459-462.
Santos, J., & Boote, J. (2003). A theoretical exploration and model of consumer
expectations, post-purchase affective states and affective behaviour. Journal of Consumer Behaviour, 3(2), 142-156.
Schiffman, L. G., & Kanuk, L. L. (1983). Consumer behavior. NJ: Prentice-Hall. Schommer, J. C. (1996). Roles of normative and predictive expectations in evaluation of
pharmacist consultation services. Journal of Consumer Satisfaction, Dissatisfaction and Complaining Behavior, 9, 86-94.
Selz, D., & Schubert, P. (1998). Web assessment: A model for the evaluation and the
assessment of successful electronic commerce applications. Proceedings of the Thirty-First Hawaii International Conference on System Sciences, USA, 4, 222-231.
118

Sen, S., & Johnson, E. J. (1997). Mere-possession effects without possession in consumer choice. Journal of Consumer Research, 24(2), 105-117.
Shankar, V., Rangaswamy, A., & Pusateri, M. (2001). The online medium and price
sensitivity. Unpublished manuscript, University of Maryland at College Park, MD.
Shim, S., & Koh, A. (1997). Profiling adolescent consumer decision-making styles:
Effects of socialization agents and social structural variables. Clothing and Textiles Research Journal, 15(1), 50-59.
Shim, S., & Mahoney, M. Y. (1992). Differentiation of satisfied users and dissatisfied
users of in-home electronic shopping mode: An exploratory study. Journal of Consumer Satisfaction, Dissatisfaction and Complaining Behavior, 5, 192-200.
Sirgy, M. J. (1982). Self-concept in consumer behavior: A critical review. Journal of
Consumer Research, 9(3), 287-300. Sirgy, M. J., Grewal, D., Mangleburg, T., Park, J., Chon, K., Claiborne, C. B., Johar, J. S.,
& Berkman, H. (1997). Assessing the predictive validity of two methods of self-image congruence. Journal of the Academy of Marketing Science, 25(3), 229-241.
Smith, R. A. (2008, March 13). Fashion online: Retailers tackle the gender gap. The Wall
Street Journal. New York: NY, D.1. Smith, R. E., & Swinyard, W. R. (1988). Cognitive response to advertising and trial:
Belief strength, belief confidence and product curiosity. Journal of Advertising, 17(3), 3-14.
Spreng, R. A., & Chiou, J. S. (2002). A cross-cultural assessment of the satisfaction
formation process. European Journal of Marketing, 36(7/8), 829-955. Spreng, R. A., MacKenzie, S. B., & Olshavsky, R. W. (1996). A reexamination of the
determinants of consumer satisfaction. Journal of Marketing, 60(3), 15-32. Spreng, R. A., & Mackoy, R. (1996). An empirical examination of a model of perceived
service quality and satisfaction. Journal of Retailing, 72(2), 201-214. Spreng, R. A., & Page, T. J. (2001). The impact of confidence in expectations on
consumer satisfaction. Psychology & Marketing, 18(11), 1187-1204. Spreng, R. A., & Page, T. J. (2003). A Test of Alternative Measures of Disconfirmation.
Decision Sciences, 34(1), 31-62. Structural Equation Modeling with Amos (2005). Chicago, IL: SPSS, Inc.
119

Summers, J. O. & Granbois, D. H. (1977). Predictive and normative expectations in consumer dissatisfaction and complaining behavior. Advances in Consumer Research, 4, 155-158.
Swan, J. E., & Combs, L. J. (1976). Product performance and consumer satisfaction: A
new concept. Journal of Marketing, 40(2), 25-33. Swan, J. E., & Trawick, I. F. (1980). Satisfaction related to predictive vs. desired
expectations. In R. L. Day & Hunt, K. (Eds.), Refining Concepts and Measures of Consumer Satisfaction and Complaining Behavior, (pp.7-12). Bloomington, IN: Indiana University.
Swan, J. E., Trawick, I. F., & Carroll, M. G. (1981). Satisfaction related to predictive,
desired expectations: A field study. In R. L. Day & Hunt, H. K. (Eds.), New Findings on Consumer Satisfaction and Complaining (pp.15-22). Bloomington, IN: Indiana University Press.
Sweeney-MacGillivray, M. S., & Wilson, J. D. (1997). Clothing and appearance among
early, middle and late adolescents. Clothing and Textiles Research Journal, 15(1), 43-49.
Swinker, M. E., & Hines, J. D. (2006). Understanding consumers’ perception of clothing
quality: A multidimensional approach. International Journal of Consumer Studies, 30(2), 218-223.
Szymanski, D. M., & Hise, R. T. (2000). E-satisfaction an initial examination. Journal of
Retailing, 76(3), 309-322. Taylor, S. (1995). The effects of filled waiting time and service provider control over the
delay on evaluations of service. Journal of the Academy of Marketing Science, 23(1), 38-48.
Then, N. K., & DeLong, M. R. (1999). Apparel shopping on the Web. Journal of Family
and Consumer Sciences, 91(3), 65-68. Thomas, J. B., Cassill, N. L., & Forsythe, S. M. (1991). Underlying dimensions of
apparel involvement in consumers' purchase decisions. Clothing & Textiles Research Journal, 9(3), 45-48.
Tse, D. K., & Wilton, P. C. (1988). Models of consumer satisfaction formation: An
extension. Journal of Marketing Research, 25(2), 204-212. Van Gelder, S. (2003). Global brand strategy: Unlocking brand potential across
countries, culture and market. London: Kogan Page.
120

Van Riel, A. C. R., Liljander, V., & Jurriens, P. (2001). Exploring consumer evaluations of e-services: A portal site. International Journal of Service Industry Management, 12(4), 359-377.
Wang, S., Wang, S., & Wang, M. T. (2006). Shopping online or not? Cognition and
personality matters. Journal of Theoretical and Applied Electronic Commerce Research, 1(3), 68-80.
Ward, M. R., & Lee, M. J. (2000). Internet shopping, consumer search and product
branding. Journal of Product & Brand Management, 9(1), 6-18. Weinberg, B. D. (2000). Don’t keep your Internet customers waiting too long at the
(virtual) front door. Journal of Interactive Marketing, 14(1), 30-38. Westbrook, R. A. & Oliver, R. L. (1981). Developing better measures of consumer
satisfaction: Some preliminary results. Advances in Consumer Research, 8, 94-99. Wilkie, W., & Pesssmier, E. (1973). Issues in marketing’s use of multi-attribute models.
Journal of Marketing, 10(4), 428-441. Wilson, J. D., & Sweeney-MacGillivray, M. S. (1998). Self-perceived influences of
family, friends, and media on adolescent clothing choice. Family and Consumer Sciences Research Journal, 26(4), 425-443.
Woodruff, R. B., Cadotte, E. R., & Jenkins, R. L. (1983). Modeling consumer satisfaction
processes using experience-based norms. Journal of Marketing Research, 20(3), 296-304.
Workman, J. E. (1990). Effects of fiber content labeling on perception of apparel
characteristics. Clothing and Textiles Research Journal, 8(3), 19-24. Xu, Y., & Paulins, V. A. (2005). College students' attitudes toward shopping online for
apparel products: Exploring a rural versus urban campus. Journal of Fashion Marketing and Management, 9(4), 420-433.
Yang, C. C. (2003). A study of product innovation, brand image, price impact on
perceived value in woman’s underwear market. Unpublished master thesis. Department of Textiles and Clothing, Fu Jen Catholic University, Taiwan.
Yang, Z., Peterson, R. T., & Huang, L. (2001). Taking the pulse of Internet pharmacies.
Marketing Health Services, 21(2), 5-10. Yi, Y. (1990). A critical review of consumer satisfaction. Chicago, IL: American
Marketing Association.
121

122
Yoo, B., & Donthu, N. (2001). Developing a scale to measure the perceived quality of Internet shopping sites (SITEQUAL). Quarterly Journal of Electronic Commerce, 2(1), 31-47.
Yoon, T., & Ekinci, Y. (2003). An examination of the SERVQUAL dimensions using the
Guttman scaling procedure. Journal of Hospitality & Tourism Research, 27(1), 3-23.
Zeithaml, V. A., Berry, L. L., & Parasuraman, A. (1993). The nature and determinants of
customer expectations of service. Journal of the Academy of Marketing Science, 21(1), 1-12.
Zeithaml, V. A., Berry, L. L., & Parasuraman, A. (1996). The behavioral consequences of
service quality. Journal of Marketing, 60(2), 31-46. Zeithaml, V. A., & Bitner, M. J. (2000). Service marketing: Integrating customer focus
across the firm. Boston, MA: McGraw-Hill. Zinkhan, G. M., & Martin, C. R. J. (1987). Brand names and infertial beliefs: Some
Insights on naming new products. Journal of Business Research, 15(2), 157-172. Zinkhan, G. M., & Prenshaw, P. J. (1994). Good life images and brand name associations:
Evidence from Asia, America, and Europe. Advances in Consumer Research, 21, 496-500.

APPENDIXES
123

124
Appendix A -- Advertisement for Recruiting Participants in the Dorms
Research Participants Needed!!
Just browse a website, try on a sweatshirt and complete a questionnaire, you have the chance to win 25 dollars
Every 10 participants have a drawing Make an appointment RIGHTNOW!!
Consumer Satisfaction with Sweatshirts
DATE: TIME: PLACE: Contact: Hsiao-Ling Lin [email protected]
Department of Apparel, Housing & Resource Management
Celin
e L
in
lin1
20
3@
vt.e
du
C
elin
e L
in
lin1
20
3@
vt.e
du
C
elin
e L
in
lin1
20
3@
vt.e
du
C
elin
e L
in
lin1
20
3@
vt.e
du
C
elin
e L
in
lin1
20
3@
vt.e
du
C
elin
e L
in
lin1
20
3@
vt.e
du
C
elin
e L
in
lin1
20
3@
vt.e
du
C
elin
e L
in
lin1
20
3@
vt.e
du
C
elin
e L
in
lin1
20
3@
vt.e
du
C
elin
e L
in
lin1
20
3@
vt.e
du
C
elin
e L
in
lin1
20
3@
vt.e
du
C
elin
e L
in
lin1
20
3@
vt.e
du
C
elin
e L
in
lin1
20
3@
vt.e
du
C
elin
e L
in
lin1
20
3@
vt.e
du
Purpose of Study: To examine the role of brand image in consumer satisfaction with apparel online shopping

Appendix B -- Survey for Choosing Brand Names to Create Different Levels of Brand Image This is a research about consumers’ perception of apparel brand image. Please evaluate the following brands by circling the number from 1 to 6 that best reflects your evaluation of brand image (“1” for the lowest brand image and “6” for the highest brand image). If you do not know the brand, you can circle the number of “0”. Don’t Know Low High Abercrombie & Fitch ------ 0 1 2 3 4 5 6
Adidas ---------------------- 0 1 2 3 4 5 6
Aéropostale ----------------- 0 1 2 3 4 5 6
American Eagle ------------ 0 1 2 3 4 5 6
Armani Exchange ---------- 0 1 2 3 4 5 6
=========================================================
Champion ------------------- 0 1 2 3 4 5 6
Forever 21 ------------------ 0 1 2 3 4 5 6
Gap -------------------------- 0 1 2 3 4 5 6
Hanes ------------------------ 0 1 2 3 4 5 6
Hollister Co.---------------- 0 1 2 3 4 5 6
=========================================================
J. Crew ---------------------- 0 1 2 3 4 5 6
Land's End ------------------ 0 1 2 3 4 5 6
Nike ------------------------- 0 1 2 3 4 5 6
Old Navy ------------------- 0 1 2 3 4 5 6
Reebok --------------------- 0 1 2 3 4 5 6
125

Appendix C -- Survey for Choosing Sweatshirts to Create Different Levels of Product Performance
This research is about consumers’ evaluations of sweatshirts. The brand name/logo is intentionally taken off to avoid influencing your evaluation. Please omit the torn label or stickers on the garment. Please examine the garment and answer the question by circling the number that reflecting your evaluation. There is no right or wrong answer, please DO NOT DISCUSS your evaluation with others. It is your opinion that is important to us. Thank you for your participation! Hsiao-Ling (Celine) Lin Dr. Jessie Chen-Yu
Sweatshirt 80 % Cotton, 20% Polyester
Machine Wash Question: Terrible Excellent My evaluation of this sweatshirt is _____. 1 2 3 4 5 6
126

Appendix D -- Size Charts for Sample Sweatshirts
A. Men’s Sweatshirts
High-quality Sweatshirts (Saddlebred) Low-quality Sweatshirts (Jerzees)
Size Chest Sleeve Body Quantity Size Chest Sleeve Body Quantity
M 38-40 34-35 25 1 M 38-40 33-34 23 1
L 42-44 35-36 26 2 L 42-44 34-35 24 2
XL 46-48 36-37 27 2 XL 46-48 35-36 25 2
XXL 50-52 37-38 28 1 XXL 50-52 36-37 26 1
B. Women’s Sweatshirts
High-quality Sweatshirts (Kim Rogers) Low-quality Sweatshirts (Jerzees)
Size Chest Sleeve Body Quantity Size Chest Sleeve Body Quantity
M 34-36 31-32 23 1 M 34-36 30-31 22 1
L 38-40 33-34 24 2 L 38-40 32-33 23 2
XL 42-44 35-36 25 2 XL 42-44 34-35 24 2
XXL 46-48 37-38 26 1 XXL 46-48 36-37 25 1
127

Appendix E.1 -- Web Page for Higher Brand Image Group (Men’s Sweatshirt)
Main Page
128

Enlarge Garment
129

Size Chart
130

Privacy Policy
131

Ordering & Delivery Process
132

Shipping & Return Policy
133

Customer Service
134

Appendix E.2 -- Web Page for Lower Brand Image Group (Men’s Sweatshirt)
Main Page
135

Size Chart
136
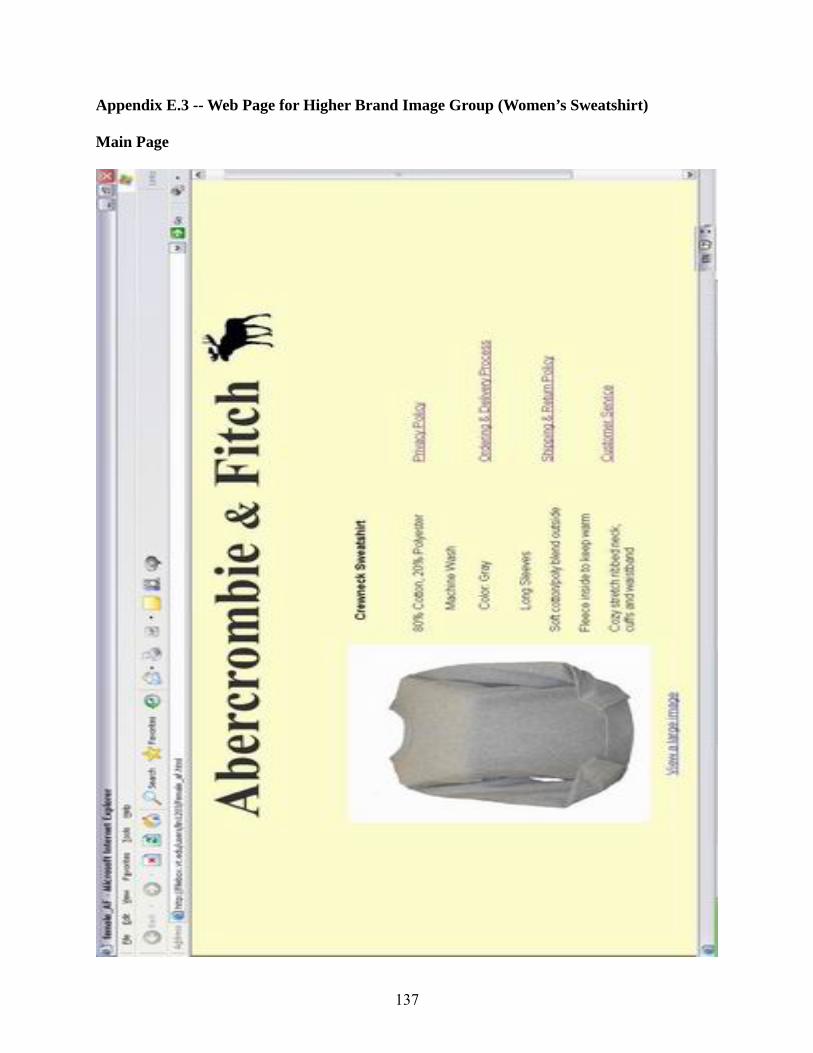
Appendix E.3 -- Web Page for Higher Brand Image Group (Women’s Sweatshirt)
Main Page
137

Enlarge Garment
138
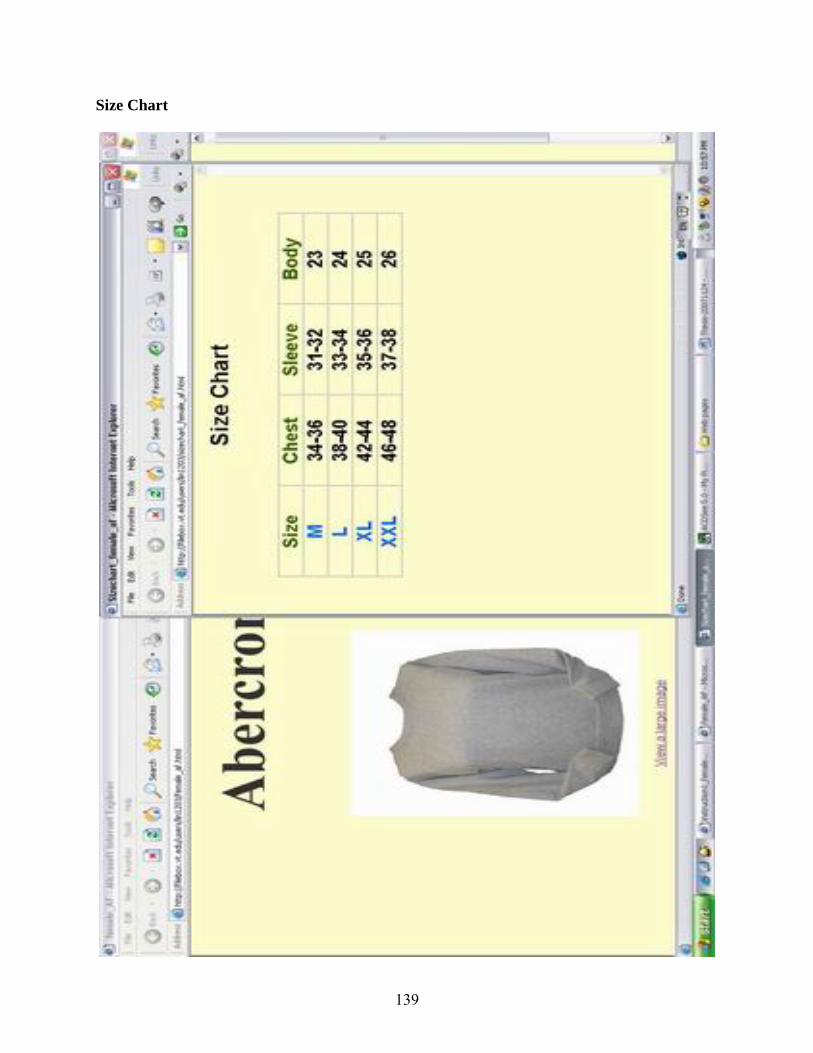
Size Chart
139

Appendix E.4 -- Web Page for Lower Brand Image Group (Women’s Sweatshirt)
Main Page
140

Size Chart
141

Appendix F.1 -- Questionnaire for Higher Brand Image Group – Part I
Questionnaire – Part I
After you browsing the website, please respond to this part of questionnaire.
Terrible Excellent
1. What is your general impression of Abercrombie & Fitch? ------------ 1 2 3 4 5 6
Terrible Excellent
2. Based on the picture and information shown on the web pages,
I expect this sweatshirt will be _______. ---------------------------------- 1 2 3 4 5 6
Please wait for the instruction of the researcher!
142

Appendix F.2 -- Questionnaire for Higher Brand Image Group – Part II
Questionnaire – Part II
After you try on the sweatshirt, please respond to this part of questionnaire.
(I. Evaluation)
Please answer the following questions based on your evaluation of the sweatshirt.
Terrible Excellent
1. I think this sweatshirt is _____. ------------------------------------- 1 2 3 4 5 6
2. I think the style of this sweatshirt is _____. ----------------------- 1 2 3 4 5 6
3. I think the color of this sweatshirt is _____. ----------------------- 1 2 3 4 5 6
4. I think the fabric of this sweatshirt is _____. ---------------------- 1 2 3 4 5 6
5. I think the fit of this sweatshirt is _____. -------------------------- 1 2 3 4 5 6
6. I think the workmanship of this sweatshirt is _____. ------------- 1 2 3 4 5 6
=====================================================================
(II. Disconfirmation) Much Much Worse Just Better Than I as I Than I Expected Expected Expected
1. This sweatshirt is ________.------------------------------------------ -3 -2 -1 0 1 2 3
2. The style of this sweatshirt is ____. --------------------------- -3 -2 -1 0 1 2 3
3. The color of this sweatshirt is ____. --------------------------- -3 -2 -1 0 1 2 3
4. The fabric of this sweatshirt is ____. -------------------------- -3 -2 -1 0 1 2 3
5. The fit of this sweatshirt is ____. ----------------------------- -3 -2 -1 0 1 2 3
6. The workmanship of this sweatshirt is ____. ---------------- -3 -2 -1 0 1 2 3
143

(III. Satisfaction, return intention and repurchase intention)
Please answer the following questions based on your satisfaction/dissatisfaction.
Terrible Excellent 1. What is your general impression of Abercrombie & Fitch? ---------- 1 2 3 4 5 6
Very Very Low Neutral High
2. My degree of satisfaction with Abercrombie & Fitch is _____. -3 -2 -1 0 1 2 3 3. Please refer to the scale below and write down the percent of satisfaction that you have with
Abercrombie & Fitch.
│____│____│____│____│____│____│____│____│____│____│ 0% 10% 20% 30% 40% 50% 60% 70% 80% 90% 100%
Not Satisfied Perfectly at All Satisfied
I am ___________ % satisfied with Abercrombie & Fitch.
Very Very Low Neutral High
4. My degree of satisfaction with this sweatshirt is _____.---------- -3 -2 -1 0 1 2 3
5. Please refer to the scale below and write down the percent of satisfaction that you have with the performance of the sweatshirt.
│____│____│____│____│____│____│____│____│____│____│ 0% 10% 20% 30% 40% 50% 60% 70% 80% 90% 100%
Not Satisfied Perfectly at All Satisfied
I am ___________ % satisfied with the sweatshirt.
6. Please explain why you are satisfied or dissatisfied with this sweatshirt?
_____________________________________________________________________________________ _____________________________________________________________________________________ Very Very Unlikely Likely
7. How likely would you be to return this sweatshirt if the price of the sweatshirt is $60. ------------------------------------------------- 1 2 3 4 5 6
8. How likely would you to be buy products of Abercrombie & Fitch? 1 2 3 4 5 6
144

(IV. Brand sensitivity) Please answer the following questions based on your perception about brand. Strongly Strongly Disagree Agree 1. When making a purchase of apparel product, I always pay attention to the brand. ------------------------------------------------------- 1 2 3 4 5 6 2. In general, the brand of apparel tells a lot about its quality. ----------- 1 2 3 4 5 6 3. Buying a brand name apparel product is important to me. ------------- 1 2 3 4 5 6 4. When making a purchase of sweatshirt, I always pay attention
to the brand. ------------------------------------------------------------------ 1 2 3 4 5 6 5. When I buy a sweatshirt, I prefer buying a well-known brand. ------- 1 2 3 4 5 6 6. I don’t choose my sweatshirt according to the brand. ------------------- 1 2 3 4 5 6 7. In general, the brand of a sweatshirt tells a lot about its quality. ------- 1 2 3 4 5 6 ========================================================================== (V. Brand familiarity) Very Very Unfamiliar Familiar
1. Are you familiar with Abercrombie & Fitch? ------------------------ 1 2 3 4 5 6 Not Very Knowledgeable Knowledgeable
2. How much do you know about Abercrombie & Fitch? -------------- 1 2 3 4 5 6 No A lot of Experience Experiences
3. Do you have any previous experience with Abercrombie & Fitch? 0 1 2 3 4 5 6 =========================================================================== (VI. Brand self-congruity)
Strongly Strongly Disagree Agree
1. Wearing Abercrombie & Fitch products reflect who I am. ---------- 1 2 3 4 5 6 2. People who wear Abercrombie & Fitch are much more like me than people who use other brands. ---------------------------------------- 1 2 3 4 5 6 3. The image of Abercrombie & Fitch fits how I see myself. ------------ 1 2 3 4 5 6 4. Wearing Abercrombie & Fitch products reflect who I would like to be. 1 2 3 4 5 6 5. I would like to be perceived as similar to the typical consumer of Abercrombie & Fitch. ------------------------------------------------------- 1 2 3 4 5 6
6. The image of Abercrombie & Fitch fits how I would like to see myself. ------------------------------------------------------------------- 1 2 3 4 5 6
145
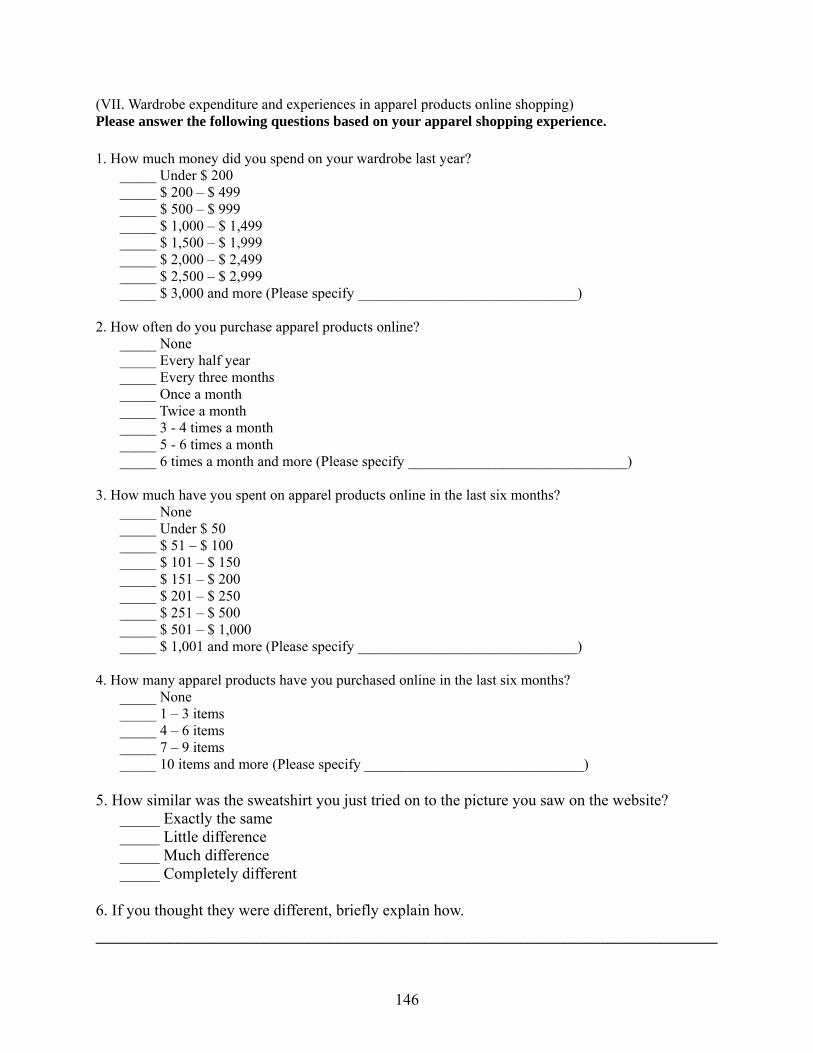
(VII. Wardrobe expenditure and experiences in apparel products online shopping) Please answer the following questions based on your apparel shopping experience. 1. How much money did you spend on your wardrobe last year?
_____ Under $ 200 _____ $ 200 – $ 499 _____ $ 500 – $ 999 _____ $ 1,000 – $ 1,499 _____ $ 1,500 – $ 1,999 _____ $ 2,000 – $ 2,499 _____ $ 2,500 – $ 2,999 _____ $ 3,000 and more (Please specify ______________________________)
2. How often do you purchase apparel products online? _____ None _____ Every half year
_____ Every three months _____ Once a month
_____ Twice a month _____ 3 - 4 times a month _____ 5 - 6 times a month _____ 6 times a month and more (Please specify ______________________________) 3. How much have you spent on apparel products online in the last six months? _____ None _____ Under $ 50 _____ $ 51 – $ 100 _____ $ 101 – $ 150 _____ $ 151 – $ 200 _____ $ 201 – $ 250 _____ $ 251 – $ 500 _____ $ 501 – $ 1,000 _____ $ 1,001 and more (Please specify ______________________________) 4. How many apparel products have you purchased online in the last six months? _____ None _____ 1 – 3 items _____ 4 – 6 items _____ 7 – 9 items _____ 10 items and more (Please specify ______________________________) 5. How similar was the sweatshirt you just tried on to the picture you saw on the website? _____ Exactly the same _____ Little difference _____ Much difference _____ Completely different 6. If you thought they were different, briefly explain how.
_____________________________________________________________________________________
146

(VIII. Demographic information) Please answer the following questions or check the item that best describe you.
1. Your gender is:
_____ Male _____ Female
2. Your age is _______. 3. Your major is ___________________________________. 4. Your class standing is:
_____ Freshman _____ Sophomore _____ Junior _____ Senior
5. If you are employed, how much you earned before tax for 2006?
_____ I’m not employed. _____ Under $ 10,000 _____ $ 10,000 – $ 14,999 _____ $ 15,000 – $ 19,999 _____ $ 20,000 – $ 24,999 _____ $ 25,000 – $ 34,999 _____ $ 35,000 – $ 49,999 _____ $ 50,000 and more
6. Your annual household income (includes all family members) before tax for 2006 is:
_____ Under $ 10,000 _____ $ 10,000 – $ 14,999 _____ $ 15,000 – $ 19,999 _____ $ 20,000 – $ 24,999 _____ $ 25,000 – $ 34,999 _____ $ 35,000 – $ 49,999 _____ $ 50,000 – $ 69,999 _____ $ 70,000 – $ 89,999 _____ $ 90,000 and more
Thank you for your participation in this study!
147

Appendix F.3 -- Questionnaire for Lower Brand Image Group – Part I
Questionnaire – Part I
After you browsing the website, please respond to this part of questionnaire.
Terrible Excellent
1. What is your general impression of Aéropostale? ---------------------- 1 2 3 4 5 6
Terrible Excellent
2. Based on the picture and information shown on the web pages,
I expect this sweatshirt will be _______. ---------------------------------- 1 2 3 4 5 6
Please wait for the instruction of the researcher!
148

Appendix F.4 -- Questionnaire for Lower Brand Image Group – Part II
Questionnaire – Part II
After you try on the sweatshirt, please respond to this part of questionnaire.
(I. Evaluation)
Please answer the following questions based on your evaluation of the sweatshirt.
Terrible Excellent
1. I think this sweatshirt is _____. ------------------------------------- 1 2 3 4 5 6
2. I think the style of this sweatshirt is _____. ----------------------- 1 2 3 4 5 6
3. I think the color of this sweatshirt is _____. ----------------------- 1 2 3 4 5 6
4. I think the fabric of this sweatshirt is _____. ---------------------- 1 2 3 4 5 6
5. I think the fit of this sweatshirt is _____. -------------------------- 1 2 3 4 5 6
6. I think the workmanship of this sweatshirt is _____. ------------- 1 2 3 4 5 6
=====================================================================
(II. Disconfirmation) Much Much Worse Just Better Than I as I Than I Expected Expected Expected
1. This sweatshirt is ________.------------------------------------------ -3 -2 -1 0 1 2 3
2. The style of this sweatshirt is ____. --------------------------- -3 -2 -1 0 1 2 3
3. The color of this sweatshirt is ____. --------------------------- -3 -2 -1 0 1 2 3
4. The fabric of this sweatshirt is ____. -------------------------- -3 -2 -1 0 1 2 3
5. The fit of this sweatshirt is ____. ----------------------------- -3 -2 -1 0 1 2 3
6. The workmanship of this sweatshirt is ____. ---------------- -3 -2 -1 0 1 2 3
149

(III. Satisfaction, return intention and repurchase intention)
Please answer the following questions based on your satisfaction/dissatisfaction.
Terrible Excellent 1. What is your general impression of Aéropostale? ----------------- 1 2 3 4 5 6
Very Very Low Neutral High
2. My degree of satisfaction with Aéropostale is _____. ----------- -3 -2 -1 0 1 2 3 3. Please refer to the scale below and write down the percent of satisfaction that you have with
Aéropostale.
│____│____│____│____│____│____│____│____│____│____│ 0% 10% 20% 30% 40% 50% 60% 70% 80% 90% 100%
Not Satisfied Perfectly at All Satisfied
I am ___________ % satisfied with Aéropostale.
Very Very Low Neutral High
4. My degree of satisfaction with this sweatshirt is _____.---------- -3 -2 -1 0 1 2 3
5. Please refer to the scale below and write down the percent of satisfaction that you have with the performance of the sweatshirt.
│____│____│____│____│____│____│____│____│____│____│ 0% 10% 20% 30% 40% 50% 60% 70% 80% 90% 100%
Not Satisfied Perfectly at All Satisfied
I am ___________ % satisfied with the sweatshirt.
6. Please explain why you are satisfied or dissatisfied with this sweatshirt?
_____________________________________________________________________________________ _____________________________________________________________________________________ Very Very Unlikely Likely
7. How likely would you be to return this sweatshirt if the price of the sweatshirt is $25. -------------------------------------------- 1 2 3 4 5 6
8. How likely would you to be buy products of Aéropostale? -------- 1 2 3 4 5 6
150

(IV. Brand sensitivity) Please answer the following questions based on your perception about brand. Strongly Strongly Disagree Agree 1. When making a purchase of apparel product, I always pay attention to the brand. ------------------------------------------------------- 1 2 3 4 5 6 2. In general, the brand of apparel tells a lot about its quality. ----------- 1 2 3 4 5 6 3. Buying a brand name apparel product is important to me. ------------- 1 2 3 4 5 6 4. When making a purchase of sweatshirt, I always pay attention
to the brand. ------------------------------------------------------------------ 1 2 3 4 5 6 5. When I buy a sweatshirt, I prefer buying a well-known brand. ------- 1 2 3 4 5 6 6. I don’t choose my sweatshirt according to the brand. ------------------- 1 2 3 4 5 6 7. In general, the brand of a sweatshirt tells a lot about its quality. ------- 1 2 3 4 5 6 ========================================================================== (V. Brand familiarity) Very Very Unfamiliar Familiar
1. Are you familiar with Aéropostale? ------------------------------------ 1 2 3 4 5 6 Not Very Knowledgeable Knowledgeable
2. How much do you know about Aéropostale? ------------------------- 1 2 3 4 5 6 No A lot of Experience Experiences
3. Do you have any previous experience with Aéropostale? --------- 0 1 2 3 4 5 6 =========================================================================== (VI. Brand self-congruity) Strongly Strongly Disagree Agree
1. Wearing Aéropostale products reflect who I am. --------------------- 1 2 3 4 5 6 2. People who wear Aéropostale are much more like me than people who use other brands. --------------------------------------- 1 2 3 4 5 6 3. The image of Aéropostale fits how I see myself. --------------------- 1 2 3 4 5 6 4. Wearing Aéropostale products reflect who I would like to be. ------ 1 2 3 4 5 6 5. I would like to be perceived as similar to the typical consumer of Aéropostale. ---------------------------------------------------------------- 1 2 3 4 5 6 6. The image of Aéropostale fits how I would like to see myself. ------------------------------------------------------------------- 1 2 3 4 5 6
151

(VII. Wardrobe expenditure and experiences in apparel products online shopping) Please answer the following questions based on your apparel shopping experience. 1. How much money did you spend on your wardrobe last year?
_____ Under $ 200 _____ $ 200 – $ 499 _____ $ 500 – $ 999 _____ $ 1,000 – $ 1,499 _____ $ 1,500 – $ 1,999 _____ $ 2,000 – $ 2,499 _____ $ 2,500 – $ 2,999 _____ $ 3,000 and more (Please specify ______________________________)
2. How often do you purchase apparel products online? _____ None _____ Every half year
_____ Every three months _____ Once a month
_____ Twice a month _____ 3 - 4 times a month _____ 5 - 6 times a month _____ 6 times a month and more (Please specify ______________________________) 3. How much have you spent on apparel products online in the last six months? _____ None _____ Under $ 50 _____ $ 51 – $ 100 _____ $ 101 – $ 150 _____ $ 151 – $ 200 _____ $ 201 – $ 250 _____ $ 251 – $ 500 _____ $ 501 – $ 1,000 _____ $ 1,001 and more (Please specify ______________________________) 4. How many apparel products have you purchased online in the last six months? _____ None _____ 1 – 3 items _____ 4 – 6 items _____ 7 – 9 items _____ 10 items and more (Please specify ______________________________) 5. How similar was the sweatshirt you just tried on to the picture you saw on the website? _____ Exactly the same _____ Little difference _____ Much difference _____ Completely different 6. If you thought they were different, briefly explain how.
_____________________________________________________________________________________
152

(VIII. Demographic information) Please answer the following questions or check the item that best describe you.
1. Your gender is:
_____ Male _____ Female
2. Your age is _______. 3. Your major is ___________________________________. 4. Your class standing is:
_____ Freshman _____ Sophomore _____ Junior _____ Senior
5. If you are employed, how much you earned before tax for 2006?
_____ I’m not employed. _____ Under $ 10,000 _____ $ 10,000 – $ 14,999 _____ $ 15,000 – $ 19,999 _____ $ 20,000 – $ 24,999 _____ $ 25,000 – $ 34,999 _____ $ 35,000 – $ 49,999 _____ $ 50,000 and more
6. Your annual household income (includes all family members) before tax for 2006 is:
_____ Under $ 10,000 _____ $ 10,000 – $ 14,999 _____ $ 15,000 – $ 19,999 _____ $ 20,000 – $ 24,999 _____ $ 25,000 – $ 34,999 _____ $ 35,000 – $ 49,999 _____ $ 50,000 – $ 69,999 _____ $ 70,000 – $ 89,999 _____ $ 90,000 and more
Thank you for your participation in this study!
153

Appendix G -- Informed Consent for Participants
Informed Consent for Participants in Research Projects Involving Human Subjects
Title of Project: Consumer Satisfaction/Dissatisfaction in Apparel Online Shopping at the
Product Receiving Stage: The Effects of Brand Image and Product Performance Investigator(s): Dr. Chen-Yu and Hsiao-Ling Lin I. Purpose of this Research/Project The purpose of the study is to examine consumer satisfaction/dissatisfaction (CS/D) with the product and the brand that they purchase online at the product-receiving stage. The four objectives of the study are to examine (a) the relationships between consumers’ individual differences (i.e., brand sensitivity, brand familiarity, brand self-congruity, demographics) and perceived brand image at purchase, (b) the relationships between consumers’ perceived brand image and expectation, and between perceived brand image and perceived product performance, (c) the effects of the three variables (i.e., consumer expectation, perceived performance, expectancy disconfirmation) on CS/D with the product and CS/D with the brand at the product-receiving stage, and (d) the relationship between CS/D with the product/brand and purchase intention. The 2 X 2 between-subjects factorial experimental design is used as research method. 120 participants will be recruited in the survey. The qualified participants are students enrolled in Virginia Tech and above 18 years old, both males and females. II. Procedures There are two parts in this survey. First, you have to follow Instruction 1 shown on the computer screen to role-play an online purchase with a sweatshirt. In the meantime, the mock website selling a sweatshirt will be accessed on the computer. After you browse the website, please complete Part I of the questionnaire. Instruction 2 will be followed to be shown on the computer screen to inform you that you are going to receive the sweatshirt you just buy on the website. After getting the sweatshirt from the investigator, please try it on and remain wearing it to complete Part II of the questionnaire. After returning the sweatshirt to the investigator, the whole survey procedure is done. The total time for this experiment is estimated 10 to 15 minutes. III. Risks There is no known risk to you. The personal information for the compensation drawing and individual results of this study will be held confidential by the investigators.
154

IV. Benefits The first benefit of this research is that the results may contribute to the brand management for apparel e-tailers. Marketers can have more insights into the role of brand image in CS/D, especially with online shopping. The second benefit is for further consumer researchers that they can explore more in CS/D with the product and with the brand. They can also conduct further researches by using other research methods (e.g., survey, focus group interview) to verify the results of this study. V. Extent of Anonymity and Confidentiality The confidentiality of all participants involved in this study will be ensured by the investigators and the IRB. Anonymity is promised in the questionnaire of this study that you only have to answer demographics including gender, age, major, class standing, personal income and annual household income. No names, identification numbers or social security numbers will be asked to reveal in this survey. However, for the compensation drawing, you will be asked to leave your personal information (i.e., name, major, address, phone number, e-mail address) for further contact. The personal information will be promised to be confidential by the investigators and the IRB. Moreover, at no time will the investigators release the results of the study to anyone other than individuals working on the project without your written consent. VI. Compensation A drawing of 25 dollars cash for every 10 participants will be conducted. You are asked to leave their contact information (i.e., name, major, address, phone number, e-mail address) on the contact information sheet that the investigator prepared after you finish the whole survey. After the data of every 10 participants are collected, the investigator will draw a winner. The drawing method is using 10 table tennis balls marked the number 1 to 10 respectively to represent these 10 participants on the contact information sheet orderly. These 10 balls will be put into a big black box. The investigator will draw one ball from the box and the number corresponds to the winner. The winners will be contacted through the contact information they leave and further make an appointment with the investigator to get the 25 dollars cash compensation. The winners have to sign a form to verify that they have got the compensation. VII. Freedom to Withdraw You are free to withdraw from this study at any time. You are free not to answer any questions, or not to respond to experimental situations that you choose without any penalty. VIII. Subject's Responsibilities I voluntarily agree to participate in this study. I have the following responsibilities: a) Follow the instructions of the investigator during the procedure, b) Stay in the survey room until the survey is done, c) Return the sweatshirt back to the investigators after the survey is done.
155

X. Subject's Permission I have read and understand the Informed Consent and conditions of this project. I have had all my questions answered. I hereby acknowledge the above and give my voluntary consent: _______________________________________________ Date______________ Subject signature Should I have any pertinent questions about this research or its conduct, and research subjects' rights, and whom to contact in the event of a research-related injury to the subject, I may contact: Hsiao-Ling Lin Dr. Chen-Yu 248 Wallace Hall 115 Wallace Hall Virginia Tech Virginia Tech Blacksburg, VA 24060 Blacksburg, VA 24060 (540) 231-6832 (540) 231-6216 [email protected] [email protected] If you have any questions about the protection of human research participants regarding this study, you may contact Dr. David Moore, Chair Virginia Tech Institutional Review Board for the Protection of Human Subjects, telephone: (540) 231-4991; email: [email protected]; address: Research Compliance Office, 2000 Kraft Drive, Suite 2000 (0497), Blacksburg, VA 24060.
156

V I R G I N I A P O L Y T E C H N I C I N S T I T U T E AND S T A T E U N I V E R S I T YAn equal opportunity, affirmative action i n s t i t u t i o n
Invent the Future
Office of Research ComplianceInstitutional Review Board1880 Pratt Drive (0497)Blacksburg, Virginia 24061540/231-4991 Fax: 540/231-0959E-mail: [email protected] www.irb.vt.edu
V I R G I N I A P O L Y T E C H N I C I N S T I T U T E U N I V E R S I T Y A N D S T A T E U N I V E R S I T Y
SUBJECT:
cc: File
DATE: November 2, 2007
MEMORANDUM
TO: Hsiu I. Chen-YuHsiao-Ling Lin
FROM: David M. Moore
IRB Expedited Approval: “Consumer Satisfaction/Dissatisfaction in Apparel OnlineShopping At the Product Receiving Stage: The Effects of Brand Image and Product Performance” , IRB # 07-515
This memo is regarding the above-mentioned protocol. The proposed research is eligible for expedited review according to the specifications authorized by 45 CFR 46.110 and 21 CFR 56.110. As Chair of the Virginia Tech Institutional Review Board, I have granted approval to the study for a period of 12 months, effective November 2, 2007.
As an investigator of human subjects, your responsibilities include the following:
1. Report promptly proposed changes in previously approved human subject researchactivities to the IRB, including changes to your study forms, procedures and investigators, regardless of how minor. The proposed changes must not be initiatedwithout IRB review and approval, except where necessary to eliminate apparent immediate hazards to the subjects.
2. Report promptly to the IRB any injuries or other unanticipated or adverse events involving risks or harms to human research subjects or others.
3. Report promptly to the IRB of the study’s closing (i.e., data collecting and data analysis complete at Virginia Tech). If the study is to continue past the expiration date (listed above), investigators must submit a request for continuing review prior to the continuing review due date (listed above). It is the researcher’sresponsibility to obtained re-approval from the IRB before the study’s expiration date.
4. If re-approval is not obtained (unless the study has been reported to the IRB as closed) prior to the expiration date, all activities involving human subjects and data analysis must cease immediately, except where necessary to eliminate apparent immediate hazards to the subjects.
Important:If you are conducting federally funded non-exempt research, this approval letter must state that theIRB has compared the OSP grant application and IRB application and found the documents to be consistent. Otherwise, this approval letter is invalid for OSP to release funds. Visit our website at http://www.irb.vt.edu/pages/newstudy.htm#OSP for further information.
Approval date:Continuing Review Due Date:Expiration Date:
11/2/2007
11/1/200810/18/2008
FWA00000572( expires 1/20/2010)IRB # is IRB00000667
Office of Research ComplianceInstitutional Review Board2000 Kraft Drive, Suite 2000 (0497)Blacksburg, Virginia 24061540/231-4991 Fax 540/231-0959e-mail [email protected]

Appendix H.1 -- Instruction 1 – Higher Brand Image Group
Instruction 1
Please carefully read through the following instruction. 1. Please put yourself in the following scenario
and role-play that you are doing an online shopping for a sweatshirt.
2. You will see a sweatshirt in the website of Abercrombie & Fitch.
3. Please hit “Enter the website” and you will see the website of Abercrombie & Fitch. Please start to examine the picture of the sweatshirt and read the information provided on the website.
157

Appendix H.2 -- Instruction 1 – Lower Brand Image Group
Instruction 1
Please carefully read through the following instruction. 1. Please put yourself in the following scenario
and role-play that you are doing an online shopping for a sweatshirt.
2. You will see a sweatshirt in the website of Aéropostale.
3. Please hit “Enter the website” and you will see the website of Aéropostale. Please start to examine the picture of the sweatshirt and read the information provided on the website.
158
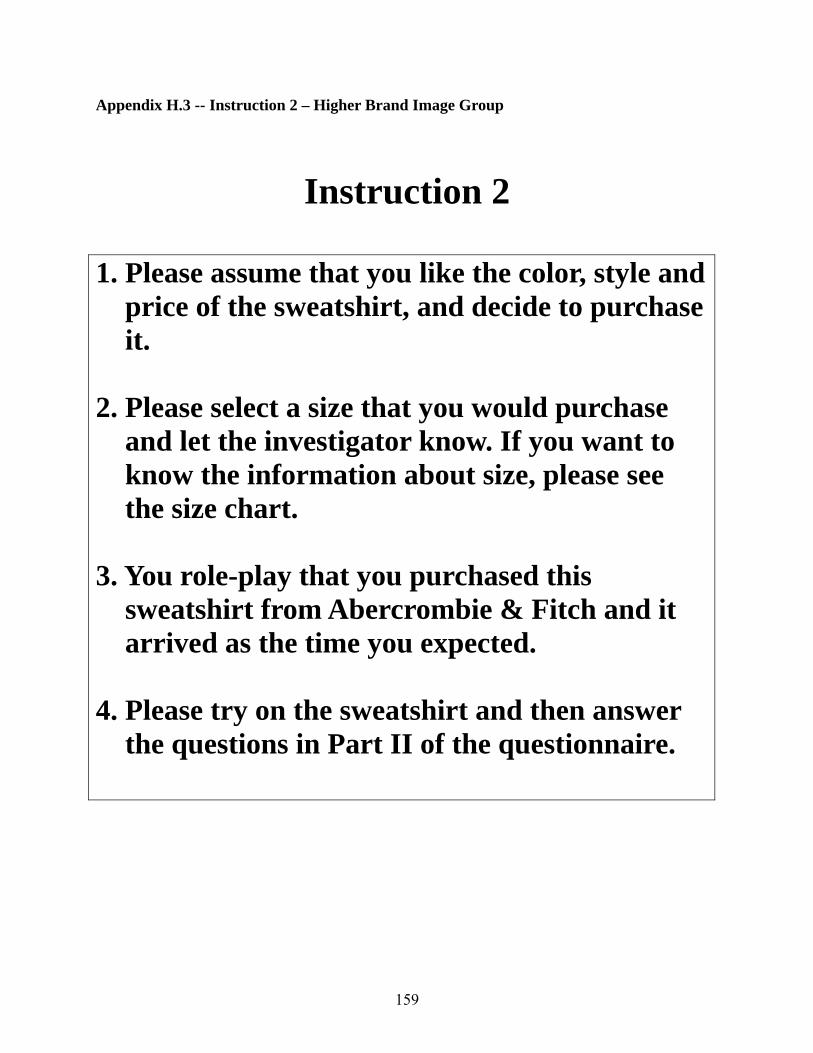
Appendix H.3 -- Instruction 2 – Higher Brand Image Group
Instruction 2
1. Please assume that you like the color, style and price of the sweatshirt, and decide to purchase it.
2. Please select a size that you would purchase
and let the investigator know. If you want to know the information about size, please see the size chart.
3. You role-play that you purchased this
sweatshirt from Abercrombie & Fitch and it arrived as the time you expected.
4. Please try on the sweatshirt and then answer
the questions in Part II of the questionnaire.
159

Appendix H.4 -- Instruction 2 – Lower Brand Image Group
Instruction 2
1. Please assume that you like the color, style and price of the sweatshirt, and decide to purchase it.
2. Please select a size that you would purchase
and let the investigator know. If you want to know the information about size, please see the size chart.
3. You role-play that you purchased this
sweatshirt from Aéropostale and it arrived as the time you expected.
4. Please try on the sweatshirt and then answer
the questions in Part II of the questionnaire.
160

161
Appendix I -- Random Number Sheet for Assigning Participants into Experimental Groups
Participant Assigned Group 1 (Male) 3 2 1 4
2 (Female) 2 1 4 3 3 (M) 2 3 1 4 4 (F) 2 3 1 4 5 (M) 3 2 4 1 6 (F) 1 2 3 4 7 (M) 2 4 3 1 8 (F) 2 3 1 4 9 (M) 3 4 2 1 10 (F) 3 1 2 4 11 (M) 4 2 1 3 12 (F) 4 3 2 1 13 (M) 3 1 2 4 14 (F) 3 4 2 1 15 (M) 2 3 1 4 16 (F) 4 3 2 1 17 (M) 3 2 1 4 18 (F) 3 4 2 1 19 (M) 1 3 2 4 20 (F) 3 4 2 1 21 (M) 1 3 2 4 22 (F) 4 2 3 1 23 (M) 3 4 2 1 24 (F) 2 1 3 4 25 (M) 1 4 2 3 26 (F) 3 1 2 4 27 (M) 3 1 4 2 28 (F) 2 1 3 4 29 (M) 2 3 1 4 30 (F) 2 3 4 1


![Experience Dissatisfaction[1]](https://img.dokumen.tips/doc/110x75/577ce6361a28abf1039261dd/experience-dissatisfaction1.jpg)


