Embed Size (px)
Citation preview
Consumer Research:
Applications in the Real World

Types of Consumer Research
Product Research
Test Marketing
Packaging Test
Pricing Research
Usage and attitude (UnA) research
Distribution Research
Advertising Research

Product Research and
Test Marketing
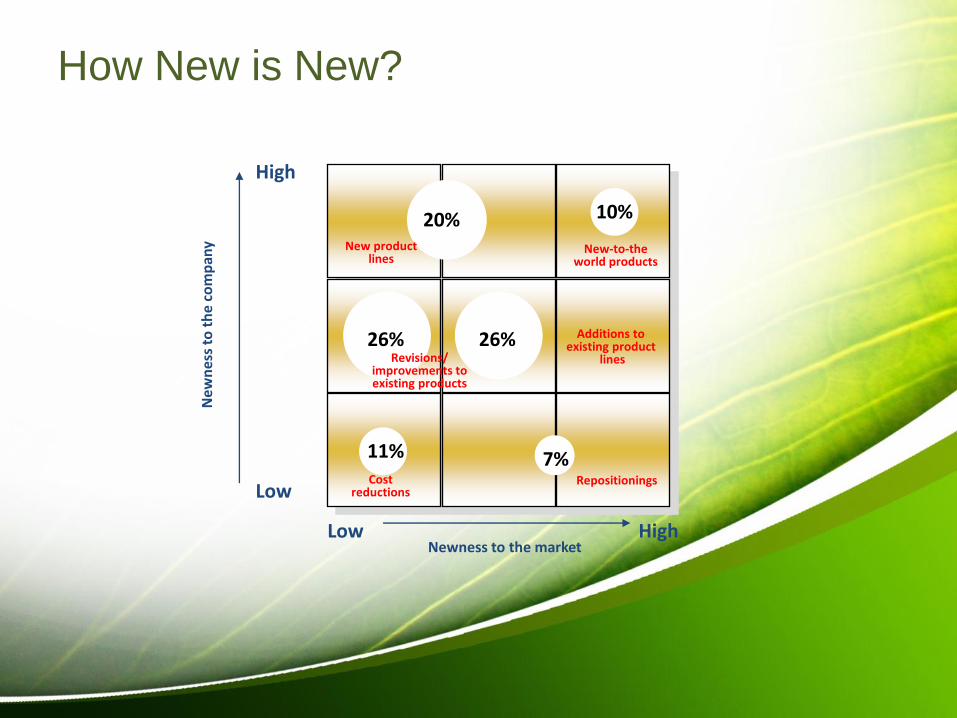
How New is New?
High
Low
Low High Newness to the market
Ne
wn
ess
to t
he
com
pan
y
26% 26%
20% New product
lines
Revisions/ improvements to existing products
11% Cost
reductions
7%
Additions to existing product
lines
Repositionings
10%
New-to-the world products
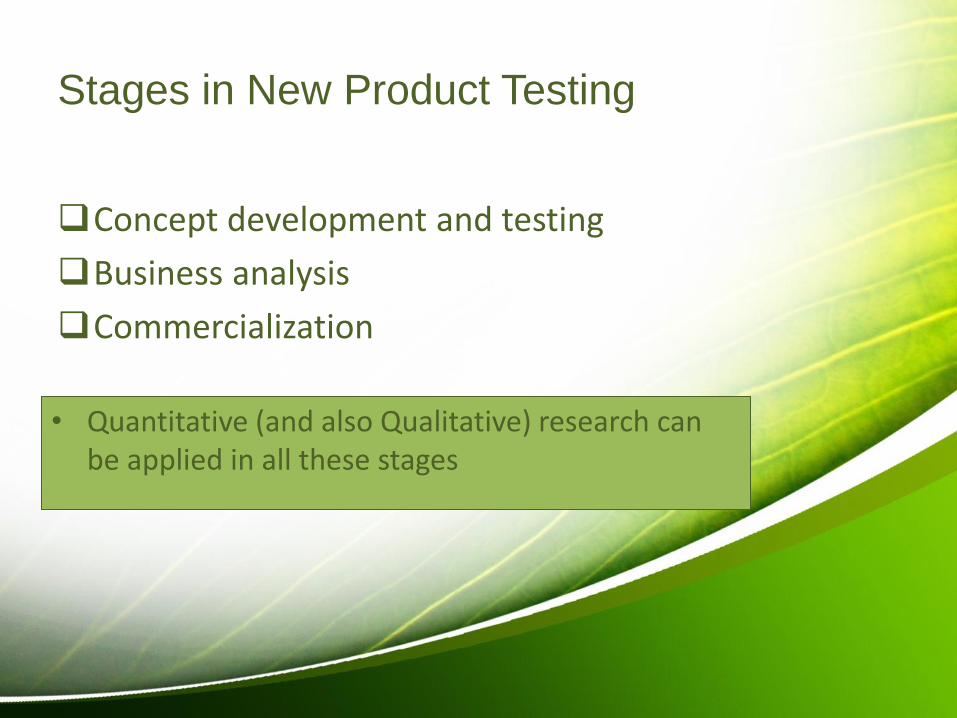
Stages in New Product Testing
Concept development and testing
Business analysis
Commercialization
• Quantitative (and also Qualitative) research can be applied in all these stages

Examples of Concept

Examples of Concept

Examples of Concept
• Apogen adalah konter farmasi yang terletak dalam minimarket dan menyediakan produk obat berkualitas, terjamin keasliannya dengan harga terjangkau, khususnya obat generik.
• Apogen merupakan bentuk usaha retail farmasi yang didukung oleh grup yang bergerak di bidang kesehatan.
• Produk yang disediakan adalah obat2 generik, obat bebas (OTC) dan suplemen kesehatan.

Concept Development and Testing:
Techniques
FGD
Monadic Ratings
Paired Comparison Ratings
Sequential monadic
Conjoint analysis
Usage test : including blind test
At central location
Home placement
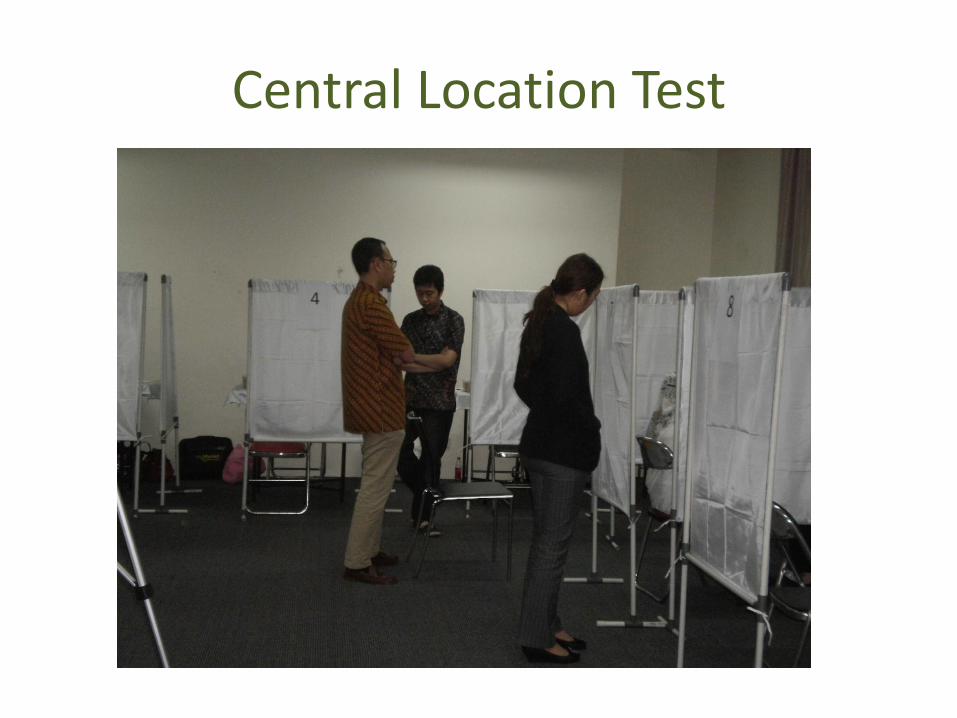
Central Location Test

Central Location Test

Home Placement Test
Product is placed at consumers’ home
Use the product as guided
Fill Diary
Interviews: pre and post usage
Blind test
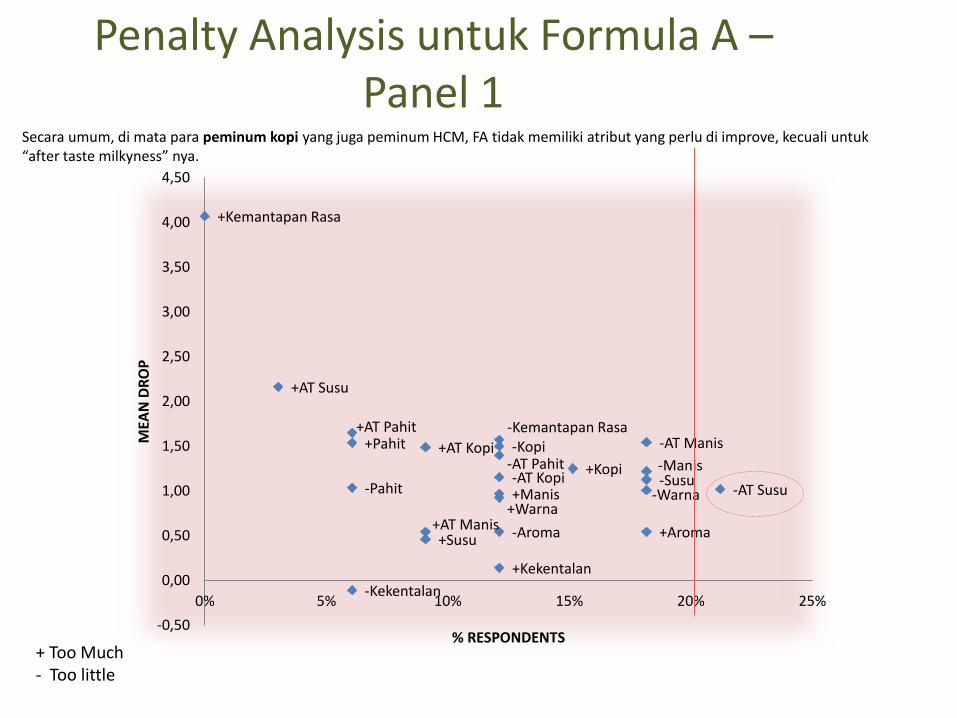
Penalty Analysis untuk Formula A – Panel 1
-Warna +Warna
-Kekentalan
+Kekentalan
-Aroma +Aroma
-Manis
+Manis -Susu
+Susu
-Kopi
+Kopi -Pahit
+Pahit -Kemantapan Rasa
+Kemantapan Rasa
-AT Manis
+AT Manis
-AT Susu
+AT Susu
-AT Kopi
+AT Kopi -AT Pahit
+AT Pahit
-0,50
0,00
0,50
1,00
1,50
2,00
2,50
3,00
3,50
4,00
4,50
0% 5% 10% 15% 20% 25%
MEA
N D
RO
P
% RESPONDENTS + Too Much - Too little
Secara umum, di mata para peminum kopi yang juga peminum HCM, FA tidak memiliki atribut yang perlu di improve, kecuali untuk “after taste milkyness” nya.
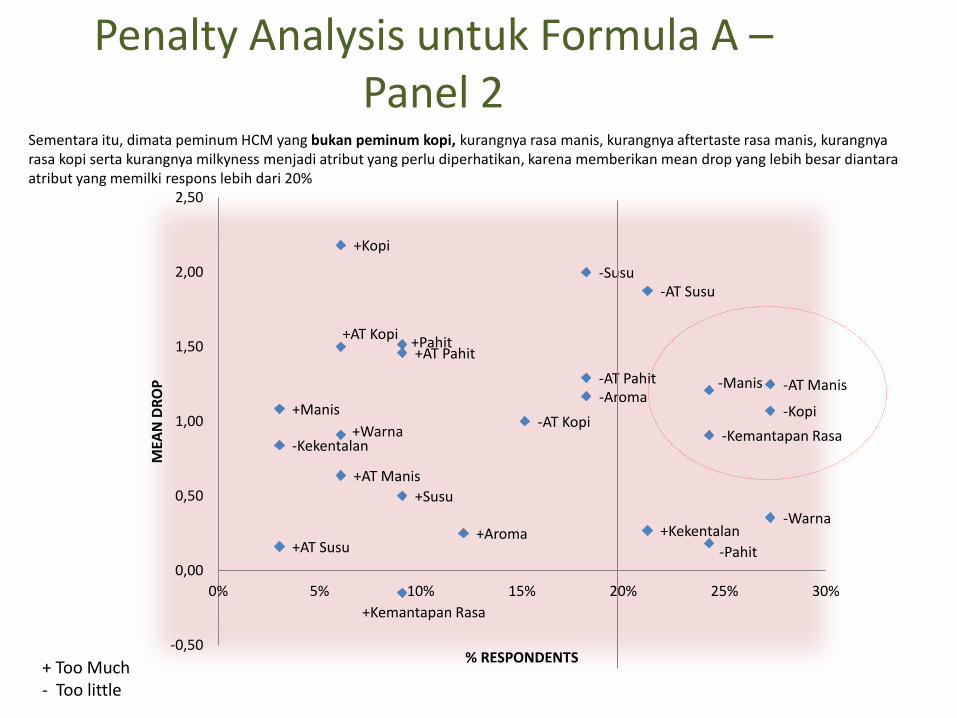
Penalty Analysis untuk Formula A – Panel 2
-Warna
+Warna -Kekentalan
+Kekentalan
-Aroma
+Aroma
-Manis
+Manis
-Susu
+Susu
-Kopi
+Kopi
-Pahit
+Pahit
-Kemantapan Rasa
+Kemantapan Rasa
-AT Manis
+AT Manis
-AT Susu
+AT Susu
-AT Kopi
+AT Kopi
-AT Pahit
+AT Pahit
-0,50
0,00
0,50
1,00
1,50
2,00
2,50
0% 5% 10% 15% 20% 25% 30%
MEA
N D
RO
P
% RESPONDENTS + Too Much - Too little
Sementara itu, dimata peminum HCM yang bukan peminum kopi, kurangnya rasa manis, kurangnya aftertaste rasa manis, kurangnya rasa kopi serta kurangnya milkyness menjadi atribut yang perlu diperhatikan, karena memberikan mean drop yang lebih besar diantara atribut yang memilki respons lebih dari 20%

Business Analysis and Commercialization
Objective:
Estimate the sales level
Estimate profitability
Techniques:
Test Marketing

Test Marketing
Number of cities to be tested?
At least two cities for each test program
5 major cities: Jakarta, Surabaya, Semarang, Medan, Makasar
Length of test: usually 6-12 months but depends on:
Repeat purchase activity
How soon will competitors react
The cost available
Packaging Test
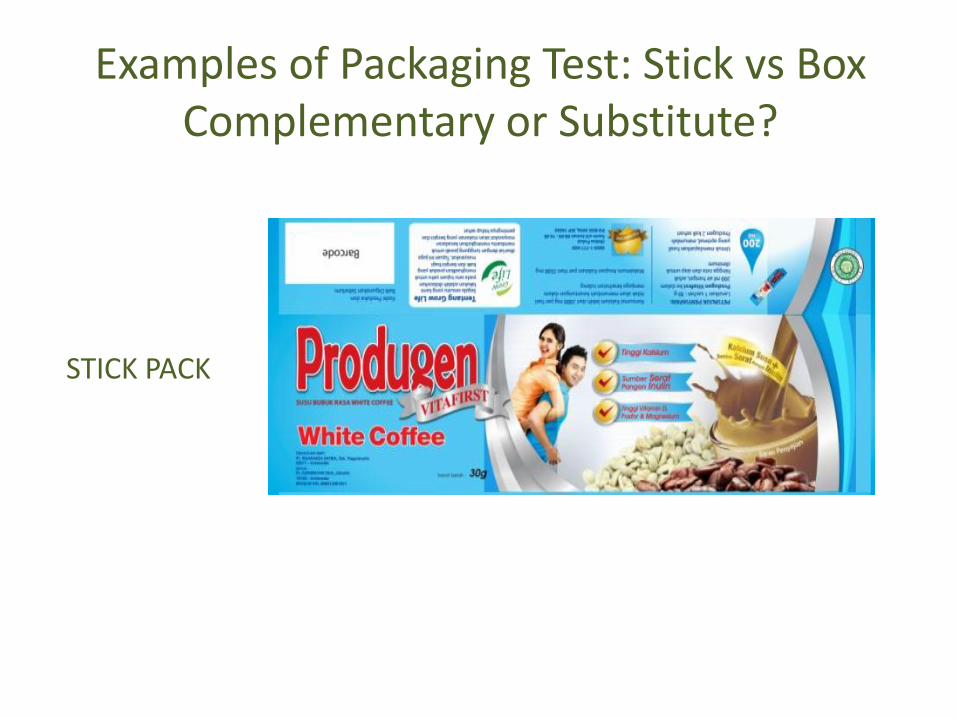
Examples of Packaging Test: Stick vs Box Complementary or Substitute?
STICK PACK
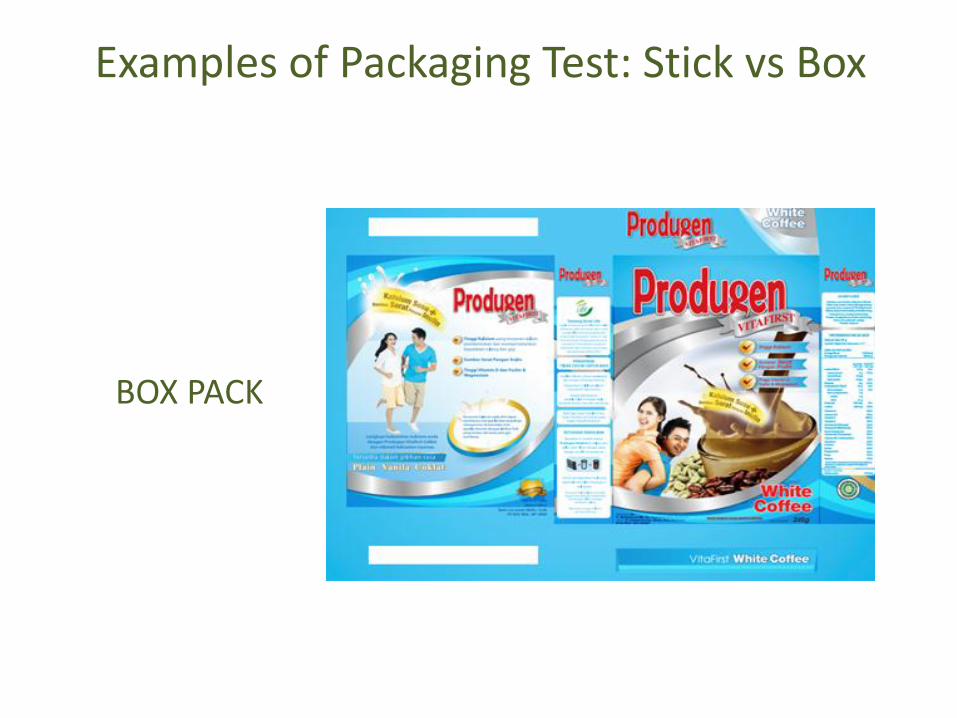
Examples of Packaging Test: Stick vs Box
BOX PACK

Pricing Research
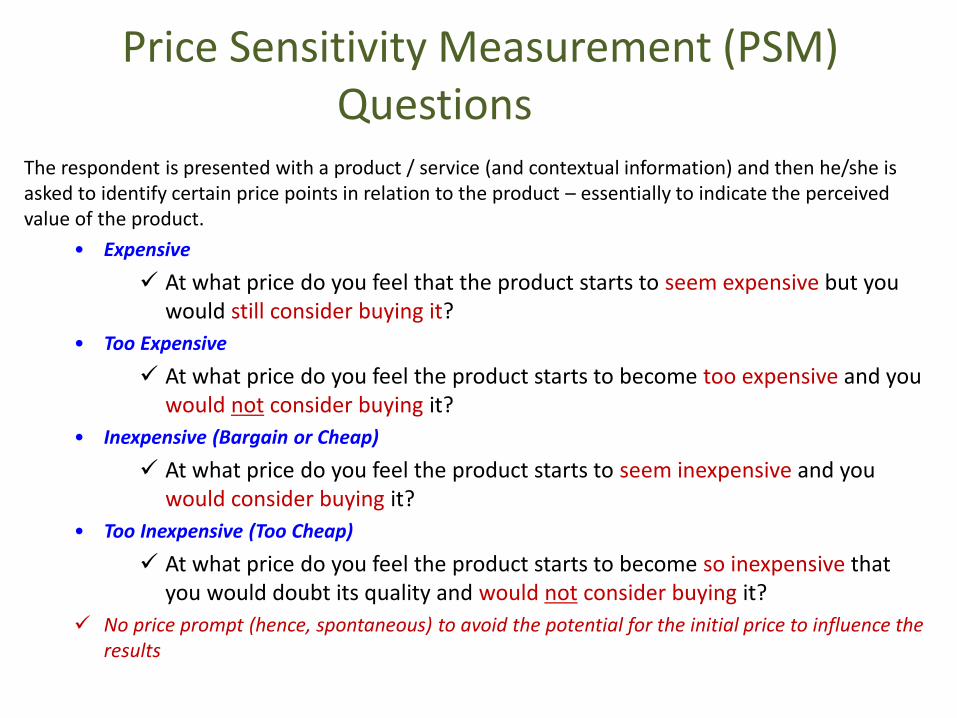
Price Sensitivity Measurement (PSM) Questions
The respondent is presented with a product / service (and contextual information) and then he/she is asked to identify certain price points in relation to the product – essentially to indicate the perceived value of the product.
• Expensive
At what price do you feel that the product starts to seem expensive but you would still consider buying it?
• Too Expensive
At what price do you feel the product starts to become too expensive and you would not consider buying it?
• Inexpensive (Bargain or Cheap)
At what price do you feel the product starts to seem inexpensive and you would consider buying it?
• Too Inexpensive (Too Cheap)
At what price do you feel the product starts to become so inexpensive that you would doubt its quality and would not consider buying it?
No price prompt (hence, spontaneous) to avoid the potential for the initial price to influence the results

The percentage data of each question is accumulated as follows
[The lower a price is , the more people think it is cheap]
Too Cheap
Too Cheap...
[The higher a price is , the more people think it is expensive]
Too Expensive
Too Expensive...
Cheap
Cheap...
Expensive
Expensive...

0%
10%
20%
30%
40%
50%
60%
70%
$2 $3 $4 $5 $6
Price
Too
Cheap
Expensive
Too
Expensive
Point of Marginal Cheapness :
is the intersection of the expensive
and too inexpensive curves
Indifferent Price Point :
is the price where the number of people
who view the product as expensive
equals the number who view it as
inexpensive; intersection of the
expensive and inexpensive curves
Point of MarginalExpensiveness :
is the intersection of the inexpensive
and too expensive curves
OptimalPrice Point :
The point where resistance against the price is minimized –
those viewing it as too expensive equals those viewing it as too
inexpensive; the intersection of the too expensive and too
inexpensive curves
Acceptable Price Range
Acceptable price range is the range between the PMC and the PME.
Theoretically, few competitive products in an existing category would be priced
outside this range, so there would be few sales outside of this range
Cheap
PSM - Interpretation of output result
IPP
PME
PMC
OPP
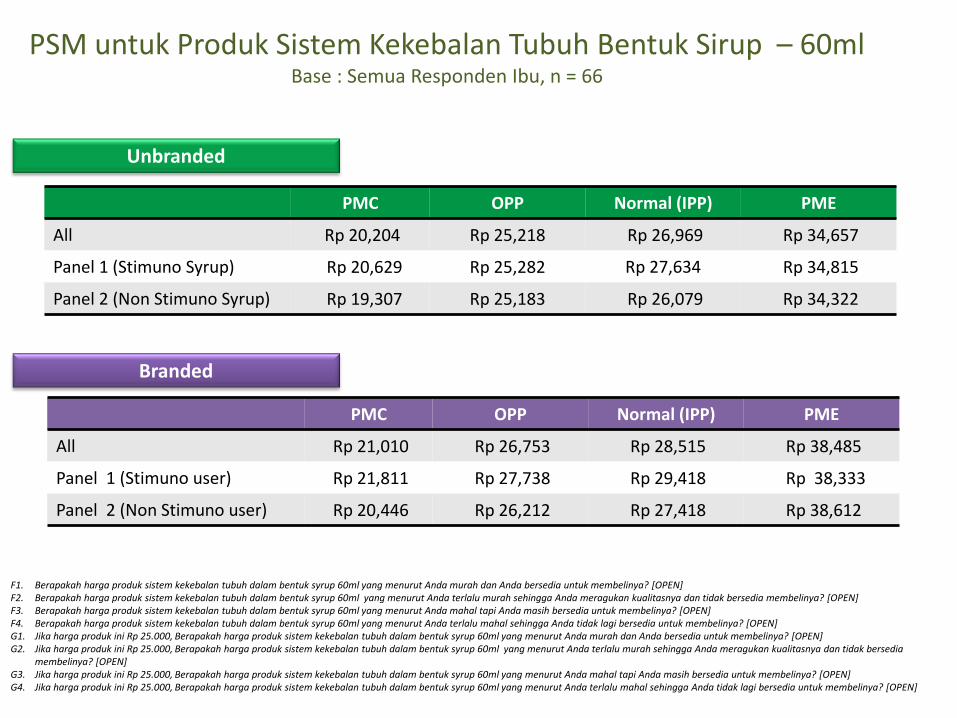
PMC OPP Normal (IPP) PME
All Rp 20,204 Rp 25,218 Rp 26,969 Rp 34,657
Panel 1 (Stimuno Syrup) Rp 20,629 Rp 25,282 Rp 27,634 Rp 34,815
Panel 2 (Non Stimuno Syrup) Rp 19,307 Rp 25,183 Rp 26,079 Rp 34,322
PMC OPP Normal (IPP) PME
All Rp 21,010 Rp 26,753 Rp 28,515 Rp 38,485
Panel 1 (Stimuno user) Rp 21,811 Rp 27,738 Rp 29,418 Rp 38,333
Panel 2 (Non Stimuno user) Rp 20,446 Rp 26,212 Rp 27,418 Rp 38,612
F1. Berapakah harga produk sistem kekebalan tubuh dalam bentuk syrup 60ml yang menurut Anda murah dan Anda bersedia untuk membelinya? [OPEN] F2. Berapakah harga produk sistem kekebalan tubuh dalam bentuk syrup 60ml yang menurut Anda terlalu murah sehingga Anda meragukan kualitasnya dan tidak bersedia membelinya? [OPEN] F3. Berapakah harga produk sistem kekebalan tubuh dalam bentuk syrup 60ml yang menurut Anda mahal tapi Anda masih bersedia untuk membelinya? [OPEN] F4. Berapakah harga produk sistem kekebalan tubuh dalam bentuk syrup 60ml yang menurut Anda terlalu mahal sehingga Anda tidak lagi bersedia untuk membelinya? [OPEN] G1. Jika harga produk ini Rp 25.000, Berapakah harga produk sistem kekebalan tubuh dalam bentuk syrup 60ml yang menurut Anda murah dan Anda bersedia untuk membelinya? [OPEN] G2. Jika harga produk ini Rp 25.000, Berapakah harga produk sistem kekebalan tubuh dalam bentuk syrup 60ml yang menurut Anda terlalu murah sehingga Anda meragukan kualitasnya dan tidak bersedia
membelinya? [OPEN] G3. Jika harga produk ini Rp 25.000, Berapakah harga produk sistem kekebalan tubuh dalam bentuk syrup 60ml yang menurut Anda mahal tapi Anda masih bersedia untuk membelinya? [OPEN] G4. Jika harga produk ini Rp 25.000, Berapakah harga produk sistem kekebalan tubuh dalam bentuk syrup 60ml yang menurut Anda terlalu mahal sehingga Anda tidak lagi bersedia untuk membelinya? [OPEN]
Branded
Unbranded
PSM untuk Produk Sistem Kekebalan Tubuh Bentuk Sirup – 60ml Base : Semua Responden Ibu, n = 66

UnA Research

Usage and Attitude Research
Understanding how consumers using the product category:
• When do the consumers using the product category?
• What to be used: does variant matters?
• Where do they consume/use the product or product category?
• How much do they use the product?: Heavy, light users?
• How or where do they purchase the product?
• How do they perceive the brands?
• Etc..

Data Collection Technique
Quantitative Research is commonly applied, but Qualitative research might give more insights
Survey
In-depth interviews: semi structured
Focus Group Discussion
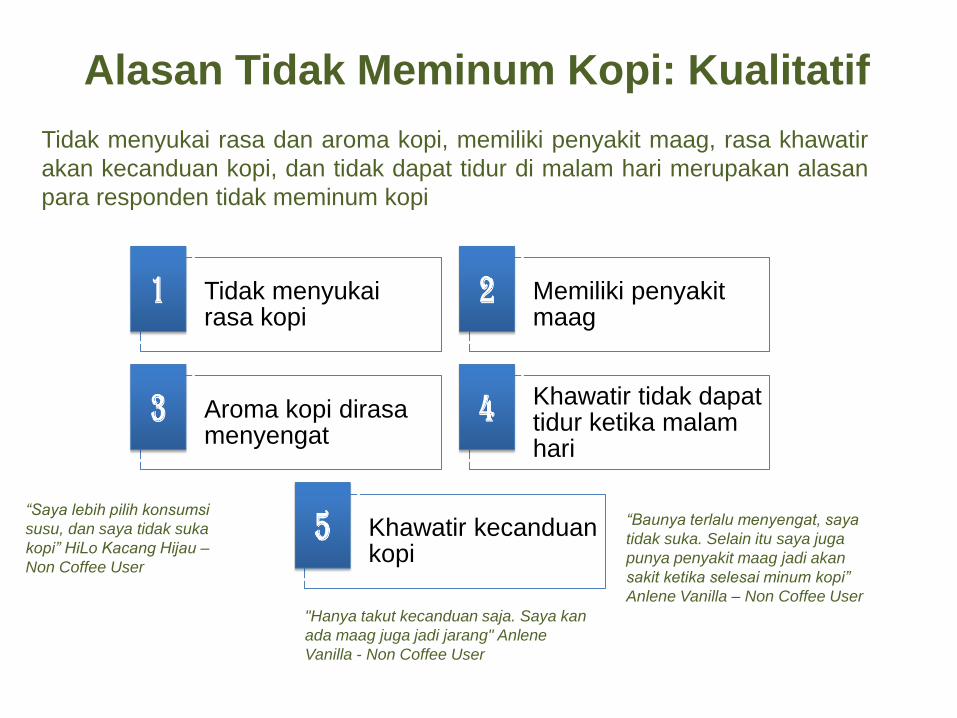
Alasan Tidak Meminum Kopi: Kualitatif
Tidak menyukai rasa dan aroma kopi, memiliki penyakit maag, rasa khawatir
akan kecanduan kopi, dan tidak dapat tidur di malam hari merupakan alasan
para responden tidak meminum kopi
“Saya lebih pilih konsumsi
susu, dan saya tidak suka
kopi” HiLo Kacang Hijau –
Non Coffee User
Tidak menyukai rasa kopi
Memiliki penyakit maag
Aroma kopi dirasa menyengat
Khawatir tidak dapat tidur ketika malam hari
Khawatir kecanduan kopi
"Hanya takut kecanduan saja. Saya kan
ada maag juga jadi jarang" Anlene
Vanilla - Non Coffee User
“Baunya terlalu menyengat, saya
tidak suka. Selain itu saya juga
punya penyakit maag jadi akan
sakit ketika selesai minum kopi”
Anlene Vanilla – Non Coffee User

Jenis dan Merek Kopi yang Dikonsumsi Responden
Luwak White Koffie
ABC Susu Good Day ABC Mocca
Nescafe Torabika
Cappucino Kapal Api
Susu
Para responden peminum kopi mengkonsumsi berbagai merek kopi instant
"Sebenarnya kalau lebih suka yang ABC susu karena rasanya
pas sekali antara kopi dan susunya, Saya lebih sering minum
kopi dikantor jadi saya meminum Nescafe karena memang itu
yang disediakan di kantor. Kalau dirumah saya minum kopi
hanya pada saat weekend" Produgen Vanilla - Coffee User
"Good Day dan Luwak White
Coffee. Saya sebenarnya
lebih senang Good Day
tetapi karena saya memiliki
masalah lambung, akhirnya
saya minum Luwak White
Coffee" Produgen Cokelat
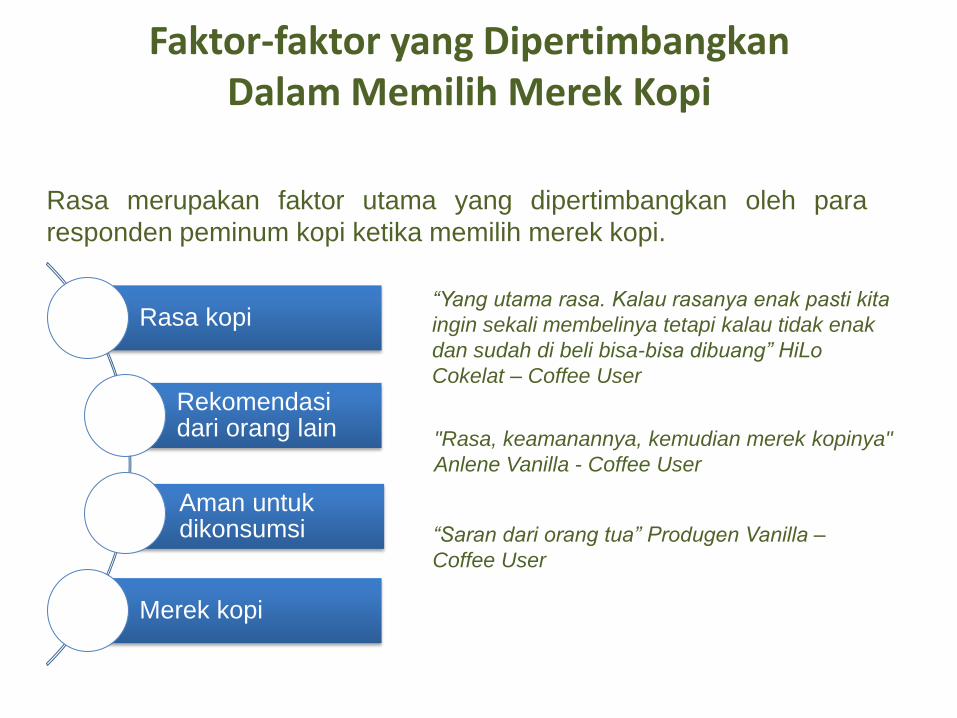
Faktor-faktor yang Dipertimbangkan Dalam Memilih Merek Kopi
Rasa kopi
Rekomendasi dari orang lain
Aman untuk dikonsumsi
Merek kopi
Rasa merupakan faktor utama yang dipertimbangkan oleh para
responden peminum kopi ketika memilih merek kopi.
“Yang utama rasa. Kalau rasanya enak pasti kita
ingin sekali membelinya tetapi kalau tidak enak
dan sudah di beli bisa-bisa dibuang” HiLo
Cokelat – Coffee User
"Rasa, keamanannya, kemudian merek kopinya"
Anlene Vanilla - Coffee User
“Saran dari orang tua” Produgen Vanilla –
Coffee User

Panel Non Stimuno Syrup
Ukuran 60 ml
Ukuran 100 ml
33%
67%
H2. Ukuran mana yang lebih anda sukai antara 60 ml dengan 100ml.
Ukuran Kemasan yang Paling Disukai
Memilih 100ml • Isinya lebih banyak
sehingga lebih tahan lama
• Harganya lebih murah dan ekonomis
“”Isinya lebih banyak sehingga tidak cepat habis, dan jadi lebih efisien dari segi harga” Panel Non Stimuno
“Lebih ekonomis karena isinya banyak jado lebih awet” Panel Non Stimuno
Memilih 60ml • Mencoba produk baru
• Harganya lebih terjangkau
• Lebih cepat habis sehingga bisa mengganti varian rasa lainnya
“Karena untuk mencoba suatu produk baru, tentu saya beli ukuran kecil terlebih dahulu. Jika ternyata cocok dan kualitasnya bagus, pasti saya beli ukuran besar” Panel Non Stimuno
“Supaya cvepat habis, jadi kan bisa membeli rasa yang lain” Panel Non Stimuno
“Kalau yang ukuran kecil itu kan lebih murah dan lebih terjangkau harganya” Panel Non Stimuno
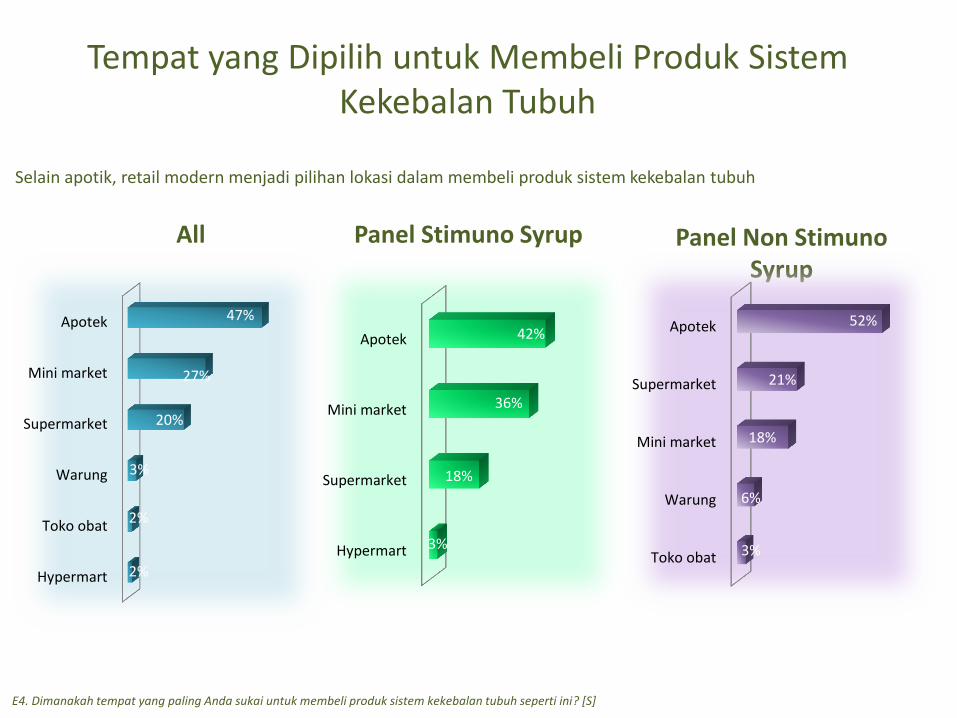
Tempat yang Dipilih untuk Membeli Produk Sistem Kekebalan Tubuh
E4. Dimanakah tempat yang paling Anda sukai untuk membeli produk sistem kekebalan tubuh seperti ini? [S]
Panel Stimuno Syrup Panel Non Stimuno Syrup
Toko obat
Warung
Mini market
Supermarket
Apotek
3%
6%
18%
21%
52%
All
Hypermart
Toko obat
Warung
Supermarket
Mini market
Apotek
2%
2%
3%
20%
27%
47%
Hypermart
Supermarket
Mini market
Apotek
3%
18%
36%
42%
Selain apotik, retail modern menjadi pilihan lokasi dalam membeli produk sistem kekebalan tubuh

Distribution Research
Why Distribution Research is Important?
For many products the cost of distribution is greater than manufacturing costs

Location Studies
Location is a critical success factor of retailers
Research aim is to find the best location
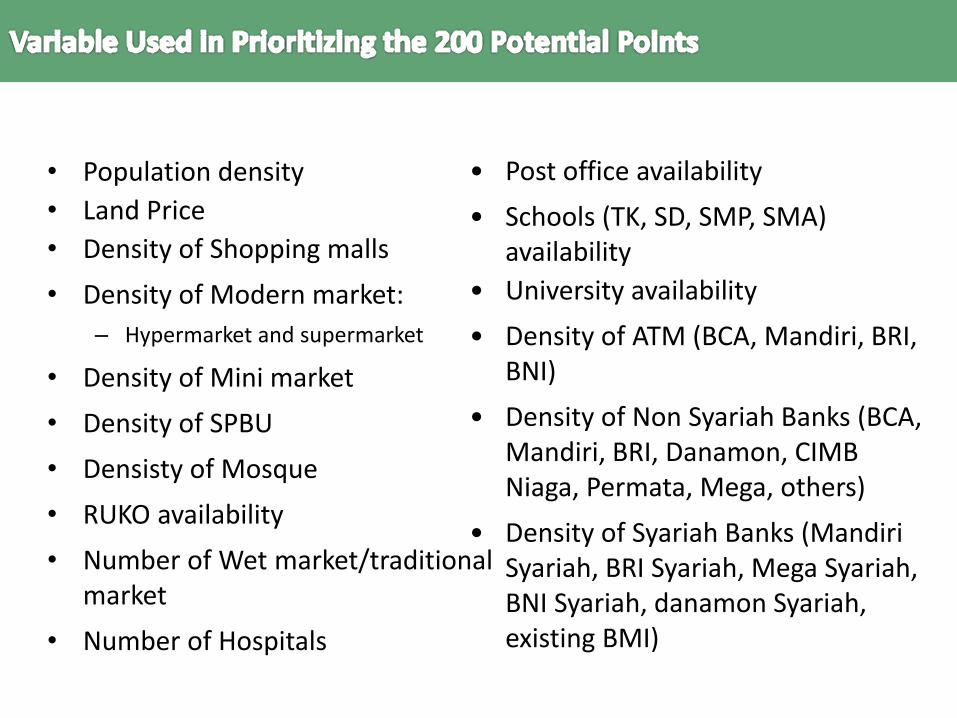
• Population density
• Land Price
• Density of Shopping malls
• Density of Modern market:
– Hypermarket and supermarket
• Density of Mini market
• Density of SPBU
• Densisty of Mosque
• RUKO availability
• Number of Wet market/traditional market
• Number of Hospitals
• Post office availability
• Schools (TK, SD, SMP, SMA) availability
• University availability
• Density of ATM (BCA, Mandiri, BRI, BNI)
• Density of Non Syariah Banks (BCA, Mandiri, BRI, Danamon, CIMB Niaga, Permata, Mega, others)
• Density of Syariah Banks (Mandiri Syariah, BRI Syariah, Mega Syariah, BNI Syariah, danamon Syariah, existing BMI)


Advertising Research

Advertising Research
Pre vs Post Aired/launched
Advertising effectiveness:
Reach the target audiences?
Brand recalled?
Message recalled?
Attitude toward brand?
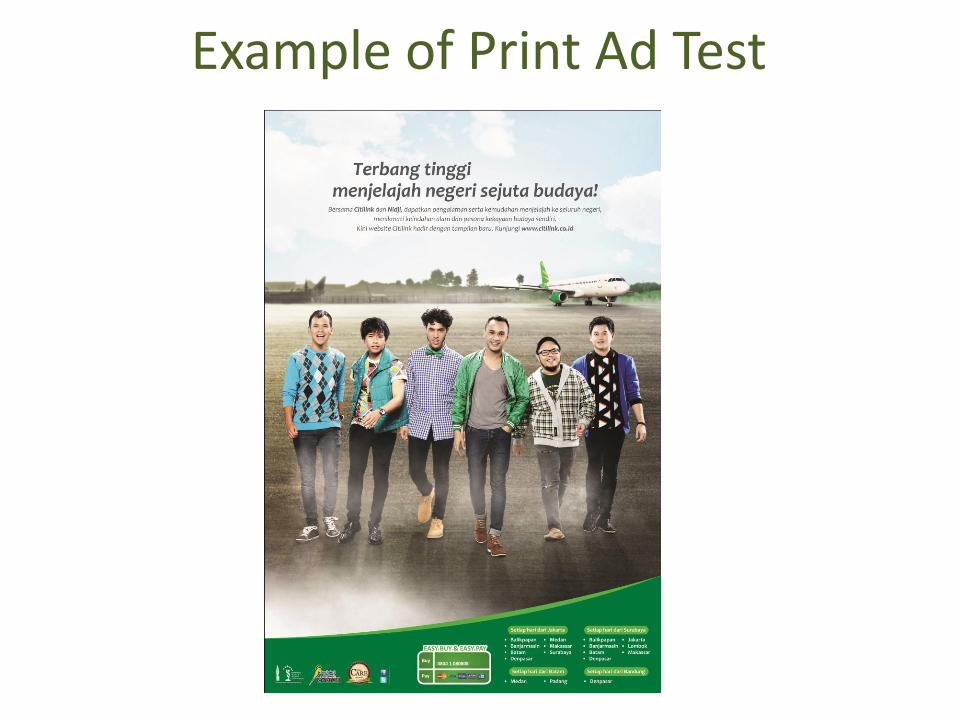
Example of Print Ad Test

Print Ad 1: Ever Seen Before Base : All Respondent, n =1131
30%
70%
Yes
No
Ever Seen the Print Ad 1
34%
30%
27%
24%
22%
17%
1%
1%
1%
1%
TV
Travel agent
Billboard/Spanduk
Website
Koran
Brosur/Leaflet/Flyers
Tabloid
Majalah
Pameran
Airport
Source (n=339)
F2. Have you seen that ad before? F3. Where have you seen those Ad
However, only around 30% of respondents claimed that they ever seen the Nidji Ad version. TV was recalled as the main source of the Nidji version ad awareness

Spontaneous Recall of Print Ad Base : All Respondent, n =1131
1%
1%
1%
81%
1%
2%
1%
3%
Air Asia
Lion Air
Mandala Air
Citilink
Sriwijaya Air
Merpati
Batavia
Garuda Indonesia
Print Ad 1
Recalled % Band " Nidji" 91%
Aircraft Design 25% word "bersama citilink dan
nidji, terbang tinggi menjelajah negeri"
14%
Word "Citilink" 5% Background Colors of ad 4%
Route Destinations 3% Good service 3%
promo price 1%
Print Ad 1
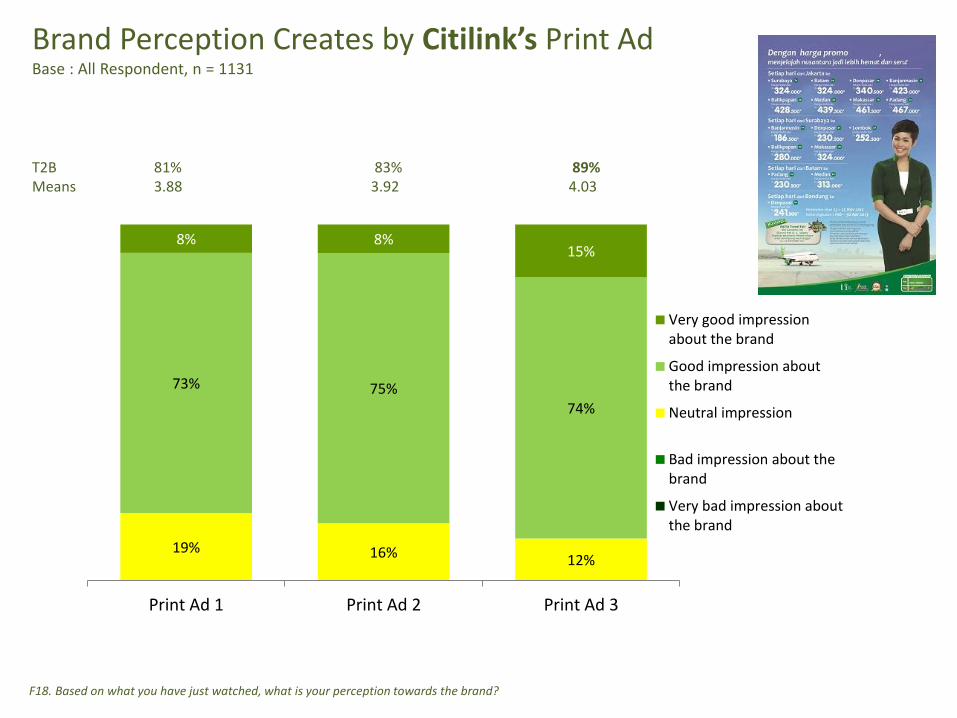
Brand Perception Creates by Citilink’s Print Ad Base : All Respondent, n = 1131
F18. Based on what you have just watched, what is your perception towards the brand?
19% 16% 12%
73% 75% 74%
8% 8% 15%
Print Ad 1 Print Ad 2 Print Ad 3
Very good impressionabout the brand
Good impression aboutthe brand
Neutral impression
Bad impression about thebrand
Very bad impression aboutthe brand
T2B 81% 83% 89% Means 3.88 3.92 4.03

Purchase Intention after Seeing Citilink’s Print Ads Base : All Respondent, n = 1131
F22. After watching that ad, which statement that best describe your intenttion?
1% 4% 2% 1%
27% 27%
16%
59% 60%
61%
9% 11%
22%
Print Ad 1 Print Ad 2 Print Ad 3
The ad strongly encourages me touse the airline
The ad encourages me to use theairline
I have not decided it yet
The ad did not encourage me to usethe airline
The ad did not encourage me to usethe airline at all
T2B 68% 71% 83% Means 3.72 3.81 4.04

Thank You