Embed Size (px)
Citation preview

CONSUMER PICKS
WWW.NRN.COM
APRIL 4, 2016
1966 • NRN celebrates 50 years of industry leadership • 2016
THE DEFINITIVE ANNUAL RANKING OF TOP RESTAURANT BRANDS, PAGE 10

APRIL 4, 2016 | NRN.COM | 3
Love. It isn’t a word often used in businesses, but it is a word often used about businesses. Whether a customer loves your brand, loves your menu, loves your servers or loves your culture translates into whether your business will thrive. Love is a word businesses should get comfortable with.
The annual Consumer Picks special report from Nation’s Restau-rant News and WD Partners is a measure of restaurant brand success
from the eyes of their guests. Surveying customers to the tune of 37,339 ratings, including specific data points on 10 restaurant brand attributes like Cleanliness, Value, Service and Craveability, Consumer Picks ranks 173 chains on whether or not their guests are feeling the love.
In this year’s report, starting on page 10, there is valuable analysis on top strat-egies to win over the customer, from the simplicity of cleaning the restaurant to the more complex undertaking of introducing an app to provide guests access to quick mobile payment options. Some winning brands relaunched menus and oth-ers redesigned restaurants. It is very clear through this report’s data and operator insights that to satisfy today’s demanding consumer, a holistic approach to your brand — who you are, what you stand for, the menu items you serve, the style in which you serve it and the atmosphere you provide to your guest — is required.
This isn’t anything new. Anyone in the restaurant business knows what is ex-pected. But it’s the execution that counts. And it’s the execution that is so hard
— mostly because it requires people, in real life, making it happen, to the best of their abilities, day in and day out.
In-N-Out is a dominant player in Consumer Picks, each year winning top scores nearly across the board. The burgers are great; it’s fun to see the hand-cut fries; and the service is fast and accu-rate. But it’s the team that makes that happen.
“We hire friendly, hard-working associates who are committed to making sure that every time a customer visits one of our 311 restaurants, that customer enjoys a great experience,” said Carl Van Fleet, an In-N-Out spokesman.
It doesn’t stop at the hire. In-N-Out pays higher wages than many limited-service restaurant chains and offers some full- and part-time benefits like paid vacations, free meals and a 401(k) plan.
Morton’s the Steakhouse, also a winner with top scores across the board, said investment in re-training of servers and staff was key to customer appreciation. The brand worked on the menu and on the restaurant atmosphere, but it doubled down on the team.
Time and time again we hear — and see — that efforts placed against engaging and strength-ening a restaurant’s workforce, from the corporate C-suite to the hourly worker, is the best indi-cator of success with the customer and success with the business.
Spreading the love through your workforce is the best way to feel the love from your guests.
Sarah E. Lockyer | editor-in-chief
[email protected] | @slockyerNRN
TM
FIND OUT WHICH BRANDS AREWINNING OVER TODAY’S DINERS
APRIL 4, 2016 | NRN.COM | 11
CONSUMER PICKSB
rand love. It’s what mat-ters most for restaurants fighting day in and day out to win a new cus-tomer, a repeat guest, a
regular, an advocate. In the sixth annual Consum-
er Picks special report, Nation’s Restaurant News reveals what con-sumers really think about more than 170 brands in the restaurant industry, from fine dining to fast food.
In partnership with WD Partners, a restaurant strategy and design firm, this proprietary study uses 37,339 survey rating from custom-ers who have dined out in the past six months to dig into what guests want from restaurants, and which brands are providing — or not providing — a quality experience. Each brand is rated on 10 attri-butes: Atmosphere, Cleanliness, Craveability, Food Quality, Likely to Recommend, Likely to Return,
WINNING BRANDS
Ben & Jerry’s ..............................p12
In-N-Out Burger .........................p14
The Cheesecake Factory ............p18
Morton’s the Steakhouse .......... p22
Cracker BarrelOld Country Store ...................... p27
INDUSTRY TRENDS
The race to stay relevant .......... p30
FULL RANKINGS
Limited Service ....................... p36
Casual Dining ........................... p83
Fine Dining ................................ p86
Family Dining ............................. p86
DEMOGRAPHIC TRENDS ................................ p88
METHODOLOGYInsights & Methodology ............ p94The Consumer Picks survey was developed by WD Partners’ Insights group, a division of WD
Partners. For more detailed or customized data, contact [email protected].
KEY TERMS:ATTRIBUTES10 areas of customer ranking, including: Atmosphere, Cleanliness, Craveability, Food Quality, Likely to Recommend, Likely to Return, Menu Variety, Reputation, Service and Value ATTRIBUTE SCORESThe percentage of respondents who said a brand excelled in an attribute area, or who said they were highly likely to revisit or recommend the brand OVERALL SCOREAn average of a brand’s Attribute Scores, weighted by the level of importance customers in their respective segments placed on each attribute DEMOGRAPHIC TRENDSInsights represent areas where a dif-ference of +/- 5 percentage points was present between demographic groups’ responses
INSIDE:
Menu Variety, Reputation, Service and Value. In addition, consumers tell us which of those attributes are most important to them and to each type of restaurant. The data leads to not only a rich ranking of restaurant brands, but also to in-sights into consumer demograph-ics and demands.
This special report pays partic-ular attention to the five winning chains within the Limited-Service, Casual-Dining, Fine-Dining and Family-Dining segments. While these winning brands vary in approach, they all show a commitment to what they do best, and a strategy that is clearly leading to results.
Consumer Picks, with data and rankings, analysis and insights and consumer infographics and informa-tion, is a deep dive into consumer tastes and trends every operator will want to study to help move their businesses forward.

12 | NRN.COM | APRIL 4, 2016
WINNING BRANDS IN-DEPTHThe restaurant brands featured on the following pages vary widely in cuisine and service style, but they’ve each found ways to resonate with consumers. NRN takes a closer look at the top-scoring brands in Limited Service, Casual Dining, Fine Dining and Family Dining. For the largest segment, Limited Service, which includes 112 brands offering everything from ice cream to tacos, we showcase the top scorers among both treat brands and savory brands.
BEN & JERRY’SLIMITED-SERVICE WINNER / SWEET
BY JONATHAN MAZE
en Cohen and Jerry Green-field took a $5 correspon-dence course on ice cream making and in 1978 used that knowledge to start their first shop in a Burlington, Vt., renovated gas station.
After they rented space in an old spoon and bobbin mill, it was the packaged ice cream the two started selling in 1980 that would make Ben & Jerry’s a nationally known brand with ice cream names like “Cherry Garcia” and “Chubby Hubby.”
But the company’s franchise system re-mains an important element of that brand and that, too, remains beloved among consumers — enough so that the 579-unit chain received top marks among Limited-Service chains in a highly competitive field.
“We consider it a crucial part of who we are because it brings the Ben & Jerry’s brand to life,” said Eric Thomas, the franchise development manager for the chain. “The shops have remained near and dear to our hearts as we’ve grown.”
The chain was the overall leader among Limited-Service chains, earning top scores in that category in a variety of measures, including Food Quality, Menu Variety and Reputation.
Ben & Jerry’s believes that its success is rooted in training and its location strategy. The company concentrates on building new stores in places where peo-ple are walking and enjoying themselves, leisure-time destinations.
“We focus on leisure-time destinations where people are on foot and having a great time, whether they’re dining at restau-rants, an upscale boutique style shopping, going to the movies or the theater,” Thom-as said. “They’re spending money because they want to, not because they have to.”
The chain is careful in selecting new locations that fit this definition, and build between 10 and 15 locations each year.
“Our growth is focused more on qual-ity over quantity,” he said. “We know that finding those fun, leisure-time destina-tions is a challenge, and we want to make sure we’re opening in the right spots.” And with the right operators, he said.
The system’s operators generally own two or three locations at a time so they are closer to the customer base.
“We have to feel comfortable with our franchise candidates,” Thomas said. “They have to be passionate believers in Ben & Jerry’s values. It’s a different sort of franchisee who becomes a Ben & Jer-ry’s franchisee. We’re looking for people who want to own a business that puts smiles on people’s faces.”
He added that the company’s mission CONTINUED ON PAGE 14
SURVEY STRENGTH: CRAVEABILITY The limited-service ice cream chain’s location strategy concentrates on building new stores in places where people are walking and having a good time.
#1OF 112
LIMITED-SERVICE CHAINS
PHO
TOS: B
EN &
JER
RY’S

14 | NRN.COM | APRIL 4, 2016
and values — which include using sustain-able methods to make its ice cream; en-suring the company can manage growth along with an active social mission — fits well with today’s younger consumers.
“Our iconic flavors have served us well over the years,” Thomas said. “But the mission and values really resonates, par-ticularly with younger folks and the Mil-lennial generation. It’s a really nice fit.”
Ben & Jerry’s also focuses heavily on training and development. The company invites prominent guest speakers to talk about customer service at the company’s annual franchise meetings. It works with franchisees on developing young workers and has a program for store managers.
The company’s field team works with store managers as well as with franchisees. Ben & Jerry’s has a store manager adviso-ry council, as well as a franchisee advisory
council, that gives the company feedback
and helps work on service issues.
“It’s differ-ent to manage a young person who is work-
ing in a scoop shop today than
it was 15 years ago,” Thomas said.
“Ice cream is supposed to be an up-lifting, fun, rewarding element in some-one’s day,” he added. “Whether they’re celebrating a great event, or if they’re coming for a pick-me-up. Our job is in making that moment happen.” n
BEN & JERRY’S / IN-N-OUT BURGERLIMITED-SERVICE WINNERS
CONTINUED FROM PAGE 12
Ben & Jerry’s uses sustainable methods to make its ice cream in order to manage the chain’s growth in popularity among Millennials.
IN-N-OUT BURGERLIMITED-SERVICE WINNER / SAVORY
BY JONATHAN MAZE
n-N-Out Burger bested its burger competition to finish tops in the Consumer Picks survey among Limited-Service chains.
This is no surprise. It’s almost a rite of passage for the iconic chain. It makes a frequent appear-
ance at the top of that list, including 2013 and 2015, and when it doesn’t fin-ish at the top it is not far behind.
Why does In-N-Out garner so much enthusiasm and such a loyal following when burgers in the restaurant business are so ubiquitous — and when numerous other chains have emerged in recent years that target quality consumers? Why do people who live on the East Coast
consider a visit to In-N-Out a must whenever they travel to California?
The answer to that is its simplicity. In-N-Out has focused on a very lim-ited menu of burgers and fries, and has served that menu very well since Harry and Esther Snyder opened the first location in a 10-square-foot space
in Baldwin Park, Calif., in 1948.“It’s so beautifully, incredi-bly simple,” said John Gor-
don, a restaurant consul-tant based in San Diego. “It’s burgers, fries and shakes and there’s little else.”
That simple menu en-ables the chain to avoid
shortcuts. The burgers are fresh and not frozen. The fries are
cut in house.“Somebody is peeling potatoes
somewhere,” Gordon said. “They’re sliced from the whole potato into
French fries in a bowl right before they’re put into a fryer. And it’s very visible to the customers in the store. There’s a little stagecraft.”
For all of its simplicity, In-N-Out has its own menu expansion in the form of a “secret menu” that its loy-al customers know about, which can build loyalty. Indeed, the secret menu has been so successful that many other chains have since adopted their own secret menus over the years.
And the company has kept price points to a minimum. That has en-abled In-N-Out to remain under many competitors in the emerging better burger category.
Perhaps most importantly, the chain is dedicated to operations and customer service.
“We have always been extremely focused on quality and we’ve always placed a heavy emphasis on custom-
CONTINUED ON PAGE 16
#3OF 112
LIMITED-SERVICE CHAINS
SURVEY STRENGTH: REPUTATION In-N-Out Burger’s cult-like following deems it a must-go destination for people who live on the East Coast when they travel to California. The iconic chain garners a great deal of customer enthusiasm.
JAM
IE MC
CA
RTH
Y/GETTY IM
AG
ES FO
R B
EN & JER
RY’S
IN-N
-OU
T B
URG
ER
#7OF ALL 173
RESTAURANT CHAINS

16 | NRN.COM | APRIL 4, 2016
er service,” said Carl Van Fleet, an In-N-Out spokesman. “In fact, our mission statement contains these words: “The custom-er is our most important asset.”
“We hire friendly, hard-working associ-ates who are commit-ted to making sure that every time a customer visits one of our 311 restau-rants, that customer enjoys a great experience.”
The hiring piece is important. The company pays higher wages, gener-ally over $11 an hour, according to the employer rating website Glass-door. The chain also provides a good environment for those workers; the company’s employees and former em-ployees give the chain high marks on Glassdoor.
“The quality of the crews are con-siderably better than what you’ll find almost anywhere else,” Gordon said.
The hamburger patties are pre-pared in a commissary, Gordon not-ed, and no store is more than 200 miles away from one, a fact that has
limited the chain’s expansion oppor-tunities over the years, but helped it maintain that important quality.
This strategy would not likely be possible if In-
N-Out didn’t remain a family company. When investors buy equity in a chain, or a com-pany goes public and starts selling stock, it
can force compromises in the name of growth and
profits. The family-owned nature of the business has enabled
it to remain remarkably disciplined. So the company doesn’t have outside pressure to lower wages or raise pric-es or build more units or serve frozen burgers.
Of course, most readers probably know all of this. In-N-Out is famous for it. Customers know about the se-cret menu and the low prices and the hard-working employees and the company’s refusal to sell out to Wall Street. And maybe that’s why it con-tinues to remain at the top of the Con-sumer Picks list year after year. n
BEN & JERRY’S / IN-N-OUT BURGERLIMITED-SERVICE WINNERS
CONTINUED FROM PAGE 14
In-N-Out has focused on a very limited menu of burgers and fries, and that simplicity has served the chain very well.
IN-N
-OU
T B
URG
ER
if it ’s not
it ’s not oasted.
®
®
It’s the passionately-prepared-to-temptingly-tender
-juicy-and-scrumptiously-crispy-perfection-from-the-
fi nest-ingredients-and-exceptional-equipment-perfect-
recipe-for-building-your business-one-and-only-amazing
Genuine Broaster Chicken®. Find out how this iconic
brand can enhance your menu and increase sales for
you. Call 1.800.365.8278 or visit broaster.com/GBC.
Chicken Perfected. ©2016 Broaster Company. All rights reserved.
BRST134_IfItsNotBro_GBC_NRN.indd 1 3/18/16 12:28 PM
#12OF ALL 173
RESTAURANT CHAINS

18 | NRN.COM | APRIL 4, 2016
WINNING BRANDS IN-DEPTH
THE CHEESECAKE FACTORYCASUAL-DINING WINNER
BY LISA JENNINGS
t a time when consumer tastes are changing, fans of The Cheesecake Facto-ry know they can always find what they want on the menu: Something for everyone.
The 187-unit chain was the top pick within Casual Dining in this year’s Con-sumer Picks survey, earning the highest marks for Food Quality, Cleanliness, Reputation, Likely to Recommend and, unsurprisingly, for Menu Variety.
Perhaps more than anything else, it is The Cheesecake Fac-tory’s broad menu of more than 250 items made from scratch — from Avocado Eggrolls to Pasta Carbonara — that sets the brand apart.
The trick has been keep-ing the vast menu relevant. Over the past year, The Cheese-cake Factory has struck a chord in that regard with the addition of a new “Super” Foods menu, with dishes like al-mond-crusted salmon served over kale; shaved Brussels sprouts and quinoa; and the Super Antioxidant Salad with spin-ach, kale, broccoli, avocado, roasted pear and blueberries with a lemon-blueberry vinaigrette.
David Gordon, president of The Cheesecake Factory Inc., said the new lineup was such a hit after it was intro-duced last summer that it was expanded with a new menu rollout earlier this year.
“We knew ‘Super’ Foods would reso-nate, especially with Millennials,” Gor-don said. “‘Super Foods’ is probably one of our greatest areas of competitive ad-vantage.”
The Calabasas Hills, Calif.-based
chain also struck gold with the addi-tion three years ago of its SkinnyLicious menu, a platform of dishes under 590 calories, as well as more small plates and snacks. The move added options for health-minded customers, even though more often than not those customers fin-ish their lower-calorie meal with a slice of indulgent cheesecake.
Gordon said internal surveys indicate CONTINUED ON PAGE 20
SURVEY STRENGTH: MENU VARIETY The Cheesecake Factory’s broad menu of more than 250 items made from scratch, including the Oreo Cheesecake slice pictured left, is what sets the brand apart. The chain keeps the vast menu relevant with the addition of the “Super” Foods and SkinnyLicious menus.
#1OF 40
CASUAL-DINING CHAINS
PHOTOS: THE CHEESECAKE FACTORY

20 | NRN.COM | APRIL 4, 2016 APRIL 4, 2016 | NRN.COM | 21
© 2
016
Nati
on
al P
aste
uri
ze
d E
gg
s, In
c.
Winner of the ACF Seal of Approval for culinary performance.
Raw or undercooked shell eggs cause 4 out of 5 cases of Salmonella enteritidis foodborne illnesses. Protect your reputation with naturally
pasteurized Davidson’s Safest Choice® eggs.
It’s Simple.egg safety:
pasteurized = peace of mind™
Egg safety resources & recipes: SafeEggs.com/eggsafety
available cage free
7242_NPE_ItsSimple_NRN_2016-03_Half.indd 1 2/12/16 9:11 AM
that about one quarter of customers say they come specifically for the legendary cheesecakes, which are available in about 70 varieties throughout the year, from White Choco-late Raspberry Truffle to Car-amel Pecan Turtle.
Food may be a focal point, but the experience is also a top priority, Overton said, during an earnings call with analysts in February.
The company is increasingly turn-ing to technology to enhance the cus-tomer experience.
In the second quarter, The Cheese-cake Factory will roll out a new mobile app dubbed Cake Pay that will allow customers to pay their bill with a smart-phone, eliminating the pain point of waiting for servers to bring the check.
After testing the app in three units, Overton said, “We feel like it certain-ly can enhance somebody’s experience towards the end of their meal and give them that convenience to be able to pay whenever they’d like.”
Other casual-dining chains have moved further into consumer-facing technologies, like touchscreen tablets for ordering, but that’s not something that customers will see at Cheesecake Facto-ry anytime soon, Gordon said.
Instead, technological advances are happening behind the scenes. For exam-ple, the chain recently rolled out a system of end-to-end encryption in restaurants to ensure that no customer credit card
data is in the possession of the restau-rant. In the event of a security breach, an increasingly common occurrence in the restaurant industry, hackers would come away empty handed.
Technology will also play a role in a new server training program set to roll out this year that will focus on “meeting today’s guests’ needs in service and hos-pitality,” Gordon said.
“We do think guests today are willing to wait for something that’s experiential,” he said. “It’s not just about the food.”
Given the challenges of executing the vast menu and keeping customer expe-rience in mind, The Cheesecake Factory also takes pride in hiring and retaining top talent, Gordon said. In March, the chain was named among Fortune magazine’s 100 Best Companies to Work For, for the third consecutive year. It was the only restaurant company to make the list.
Meanwhile, The Cheesecake Factory is also exploring ways to meet customer needs outside its restaurants. About 10 percent of sales already come from take-out.
Within the next two months or so, the chain plans to begin testing the use of various third-party services to offer delivery.
Gordon said the test would be in Cal-ifornia, but he declined to say where spe-cifically.
The Cheesecake Factory attempt-ed delivery years ago, but that was be-fore the recent wave of tech-minded, third-party specialists began changing the landscape, allowing customers to use their smartphones to order their favorite restaurant meals to their homes with a few taps.
“We’re seeing Millennials wanting to eat at home more than ever before,”
THE CHEESECAKE FACTORYCASUAL-DINING WINNER
CONTINUED FROM PAGE 18
Gordon said. “But we want to make sure our brand is protected and that people feel its part of The Cheesecake Factory experience; that food is deliv-ered the way we want.”
If delivery takes off, the move could open up a new line of incre-mental revenue for The Cheesecake Factory, which surpassed $2 billion in sales for the first time in 2015. The chain’s average unit volume for do-mestic restaurants grew to $10.6 mil-lion last year.
Still, like most concepts in casual dining, grow-ing traffic remains a challenge.
The Cheesecake Factory’s same-store sales rose 1.1 percent in the fourth quarter ended Dec. 29, but that included a 2.5-percent in-crease from pricing and 0.5-per-cent growth in positive mix. Traffic declined 1.9 percent, and company officials project traffic trends in fiscal 2016 to be flat to down 1 percent.
However, Overton said the brand is “navigating the challenging land-scape by continuing with our suc-cessful recipe of menu and design in-novation and operational excellence that is served to make The Cheese-cake Factory one of the most differ-entiated restaurant concepts in the casual-dining industry.”
The brand is also growing in popu-
larity overseas, and international ex-pansion is accelerating. The chain has opened licensed units in the Middle East and Mexico.
This year, four to five internation-al locations will open, including the first unit in China, within the Shang-hai Disney Resort, a high-profile lo-cation that is likely to introduce the brand to a new global audience.
Domestically, the company ex-pects to open eight restaurants, in-
cluding one unit of sister brand Grand Lux Cafe.
The goal is to reach 300 units in the U.S., which Overton said is well within the company’s reach.
In addition to the core brand and Grand
Lux Cafe, the company operates one RockSugar Pan
Asian Kitchen location. And executives are actively look-
ing for a new brand for expansion, either by acquisition or a concept grown internally, possibly taking a step away from casual dining.
“Fast casual is interesting to us, although fit and growth potential are our key priorities,” said Doug Benn, The Cheesecake Factory chief finan-cial officer and executive vice presi-dent, during the February earnings call. n
SURVEY STRENGTH: FOOD QUALITY The Cheesecake Fac-tory’s Reese’s Peanut Butter Chocolate Cake, shown here, is one of the 70 cheese-cake varieties offered, in addition to salads, sandwiches, pizzas and entrees. The chain received the highest Food Quality score of any Casual-Dining chain.
SURVEY STRENGTH: LIKELY TO RECOMMEND Although food is a focal point for the chain, overall ex-perience is also a top priority, according to The Cheesecake Factory’s chairman and CEO David Overton. The company is turning to technology to enhance customer experience, such as rolling out a mobile app to allow customers to pay their bill with a smartphone. That emphasis on experience likely is a key factor in the chain’s segment-leading Likely to Recommend score.
OVERALL SCORE:
74.2%
PHOTOS: THE CHEESECAKE FACTORY
#6OF ALL 173
RESTAURANT CHAINS

22 | NRN.COM | APRIL 4, 2016
WINNING BRANDS IN-DEPTH
MORTON’S THE STEAKHOUSEFINE-DINING WINNER
BY BRET THORN
orton’s The Steakhouse, squeezed past Ruth’s Chris Steak House, last year’s winner, to be the top scoring Fine-Dining chain in the Consumer Picks survey.
“We’ve done a lot of things differently than the old Morton’s,” said Tim Whit-lock, Morton’s chief operating officer. Whitlock worked at Morton’s more than 20 years ago before leaving the chain. He eventually came to work for Landry’s, and when company chairman and CEO Tilman Fertitta bought Morton’s, he made Whitlock its COO.
Since then, Whitlock and his team have worked to upgrade Morton’s train-ing procedures, revamp the menu and take the decor in a different direction.
All five of the white tablecloth chains in the survey — Morton’s, Ruth’s Chris Steak House, The Capital Grill, Flem-ing’s Prime Steakhouse & Wine Bar and McCormick & Schmick’s round out the quintet — scored in a pretty tight range,
with the difference in most of the scores being statistically insignificant. Ruth’s Chris, for one, had high scores for Food Quality, Cleanliness, Rep-utation and Likelihood to Recommend.
However Morton’s was markedly higher in terms of Value, Atmosphere and Craveability — all factors that the chain’s manage-ment has been working to improve since Houston-based Landry’s took it over in 2012.
When it comes to decor, Morton’s lo-cations traditionally have been big, mas-culine steakhouses with shuttered win-dows and Rat Pack era music of the 1950s and ’60s. Whitlock’s team changed the
carpet, chairs and upholstery, making it all slightly darker, but they also opened
the windows to let in natural light, sometimes to dramatic effect.
“We have a restaurant in San Juan, Puerto Rico. We took the shutters off the windows and now we have an oceanfront restaurant,” Whitlock said.
The team also intro-duced a musical format more
suitable to the 21st century.The systemwide remodeling
of the chain’s 73 restaurants is about 90 percent complete, Whitlock said.
When it comes to service, Morton’s has “a great team of people — great
CONTINUED ON PAGE 24
SURVEY STRENGTH: CRAVEABILITY Four years ago, Morton’s added 15 new menu items, including surf and turf platters that paired filet with shrimp, scallops and a crab cake. It has recently added seasonal salads, and lower-priced side dishes and desserts. Morton’s was slated to introduce an 8-ounce Snake River Farms Wagyu strip steak, above, on April 1.
#1OF FIVE
FINE-DINING CHAINS
PHOTOS: MORTON’S THE STEAKHOUSE

24 | NRN.COM | APRIL 4, 2016
regional managers, great servers and man-agers who love the hospitality business,” Whitlock said. “We’ve really focused on hospitality over the past four years: Great service, great upscale food, paying atten-tion to the flavors and the plate presenta-tion. We’ve made a commitment to retrain our teams — not only managers, but also our service staff, with our training depart-ment going to restaurants and retraining.”
That has included switching out training materials from a “kind of a self-guiding tool that was a bit dated in my opinion,” to a more traditional, but up-to-date training manual. “And hope-fully soon we’re going to update that with video training as well.”
When it comes to food, Morton’s has started to do something it had rarely done in the past: Change it.
“The menu was pretty much the same for the last 30 years,” Whitlock said.
Then four years ago the company in-troduced 15 new menu items, including surf and turf platters that paired filet with shrimp, scallops or a crab cake.
“They pretty much went to the top of the list of sales of items that were sold,” Whitlock said.
Morton’s also introduced low-er-priced items, including a 6-ounce fi-let, now its top selling steak.
“A lot of people don’t want a 12- or 14-ounce filet mignon,” Whitlock said. “They want a nice filet, but they don’t want that much of it.”
As a result, he said, more customers are ordering items with lower-food costs, such as salads, side dishes and desserts, making the meals more profitable.
“If you get a dessert or salad, I’m a very happy per-son,” Whitlock said.
Morton’s also introduced short ribs and a mixed grill, along with new plateware that veered from the tradition-al round and oval steak plates into new rectangular and oblong dishes.
Morton’s also introduced bar specials for its early evening Power Hour, includ-ing a trio of 2-ounce filet medallions, each with its own sauce — peppercorn, Béarnaise and blue-cheese butter — for a total of $8.
“That has been a big seller for us. People seem to really enjoy that,” Whitlock said.
Customers also like the Prime mini cheeseburgers that start at $7. Last month the chain introduced a Million Dollar Burger, a cheeseburger topped with foie
gras and truffle butter for $18. Recent seasonal specials, which change
every six months, include the Ba-con Steak, composed of two
thick, broiled 6-ounce slabs of Nueske’s bacon served with a bourbon glaze, “so it’s crunchy on the outside and moist on the inside,” Whitlock said.
Seasonal salads are on the menu, too, now, along
with specials such as bone-in filets and New York strips and mashed
cauliflower with Parmesan cheese.On April 1 the chain was slated to in-
troduce an 8-ounce Snake River Farms
MORTON’S THE STEAKHOUSEFINE-DINING WINNER
CONTINUED FROM PAGE 22
SURVEY STRENGTH: ATMOSPHERE Morton’s locations traditionally have been big, masculine steakhouses with shuttered windows and Rat Pack era music of the 1950s and ’60s. However, recent changes have been made to the carpet, chairs and upholstery, which are slightly darker but now offset by natural light from open windows.
#1OF ALL 173
RESTAURANT CHAINS
CONTINUED ON PAGE 26PHOTOS: MORTON’S THE STEAKHOUSE
Morton’s has added smaller steaks to its menu, which has led more customers to order desserts and side dish-es, which often have lower food costs. Its Strawberry Rhubarb Crisp, above, and Shrimp Alexander, left, are two such options.

26 | NRN.COM | APRIL 4, 2016
Wagyu strip, too.The team led by Tylor Field III, Mor-
ton’s vice president of wine and spirits, has also upgraded beverage options, with seasonal cocktails changing every six months, and premium wines by the glass, rotated out twice a year.
“The consumer is always looking for something new and fresh and dif-ferent,” Whitlock said.
To that end, Field has worked with Ray-mond Vineyards in St. Helena, Calif., to make a proprietary wine blend.
“It has been very, very successful for us,” Whitlock said.
Field also has brought in Coravin, a wine-dispensing device that replac-es the wine in a bottle with inert ar-gon gas, allowing restaurants to offer more premium wines by the glass without waste.
So now the restaurant, which has long offered about 40 wines by the glass, now also offers four high-end wines between $25 and $30 per glass.
Whitlock said customers have re-sponded well to the chance to try just one glass of pricey wine rather than committing to a whole bottle.
“They love it,” he said. “And they like to come back and have another
glass of that wine,” resulting in more repeat business.
Field also upgraded the chain’s craft beer program. Morton’s has developed a national program and enabled local managers to source beers that are pop-ular in their markets.
“It makes the restaurant feel a bit more local — part of the
community,” Whitlock said, adding that each unit also gets involved with local charity events.
The upshot of all of those changes, apart
from higher Consum-er Picks scores, has been a
somewhat younger customer base that has joined the “traditional VIPs” that have been Morton’s core audience. The price point is down a little, but so are food costs.
Morton’s has been opening new restaurants, too, including one in downtown Manhattan three years ago and in Taipei, Taiwan, in 2015.
In the coming year, Morton’s plans to open two new restaurants, both in upstate New York — one in Saratoga and the other in Niagara Falls.
“We’re going to be their steakhouse of choice,” Whitlock said. n
MORTON’S THE STEAKHOUSEFINE-DINING WINNER
CONTINUED FROM PAGE 24
Morton’s has a diverse menu that includes items such as tagliatelle bolognese, pictured above.
OVERALL SCORE:
79.9%
MO
RTO
N’S
TH
E ST
EAK
HO
USE
produced by
tramarketplace.com/register
*Free*Free registration valid for online registration only through June 21, 2016 at registration*Free registration valid for online registration only through June 21, 2016 at valid*Free registration valid for online registration only through June 21, 2016 at for*Free registration valid for online registration only through June 21, 2016 at online*Free registration valid for online registration only through June 21, 2016 at registration*Free registration valid for online registration only through June 21, 2016 at only*Free registration valid for online registration only through June 21, 2016 at through*Free registration valid for online registration only through June 21, 2016 at June*Free registration valid for online registration only through June 21, 2016 at 21,*Free registration valid for online registration only through June 21, 2016 at 2016*Free registration valid for online registration only through June 21, 2016 at at*Free registration valid for online registration only through June 21, 2016 at 5pm5pm CDT. Code not valid after June 21 at 5pm CDT or for on-site registration.CDT.5pm CDT. Code not valid after June 21 at 5pm CDT or for on-site registration.Code5pm CDT. Code not valid after June 21 at 5pm CDT or for on-site registration.not5pm CDT. Code not valid after June 21 at 5pm CDT or for on-site registration.valid5pm CDT. Code not valid after June 21 at 5pm CDT or for on-site registration.after5pm CDT. Code not valid after June 21 at 5pm CDT or for on-site registration.June5pm CDT. Code not valid after June 21 at 5pm CDT or for on-site registration.215pm CDT. Code not valid after June 21 at 5pm CDT or for on-site registration.at5pm CDT. Code not valid after June 21 at 5pm CDT or for on-site registration.5pm5pm CDT. Code not valid after June 21 at 5pm CDT or for on-site registration.CDT5pm CDT. Code not valid after June 21 at 5pm CDT or for on-site registration.or5pm CDT. Code not valid after June 21 at 5pm CDT or for on-site registration.for5pm CDT. Code not valid after June 21 at 5pm CDT or for on-site registration.on5pm CDT. Code not valid after June 21 at 5pm CDT or for on-site registration.site5pm CDT. Code not valid after June 21 at 5pm CDT or for on-site registration.registration.5pm CDT. Code not valid after June 21 at 5pm CDT or for on-site registration.
FREE
REGISTRATION*with promo code
6NRH
Take two days in Houston to make your company more competitive and proftable all year long.
HIGHLIGHTSCraft Beverage Garden • Technology Pavilion • New Product
Showcase • Culinary Innovation Station • Education Idea Center • 600+ leading vendors • and much more!
major partners

APRIL 4, 2016 | NRN.COM | 27
WINNING BRANDS IN-DEPTH
CRACKER BARREL OLD COUNTRY STORE
FAMILY-DINING WINNER
BY RON RUGGLESS
racker Barrel Old Coun-try Store Inc. regained the top spot among full-service Family-Dining restaurants in the 2016 Consumer Picks survey. The chain succeed-ed First Watch, which was
ranked No. 1 in Family Dining in 2015.The Lebanon, Tenn.-based chain re-
turned to the top Family-Dining spot af-ter being edged out last year for the first time in the six years of the survey, said Dennis Lombardi, consultant for the WD Partners Consumer Picks survey and president of Insight Dynamics LLC.
This year, University Park, Fla.-based First Watch Restaurants Inc. moved down to the second-place position, and Beaverton, Ore.-based Shari’s Café & Pies — which statistically has a much smaller base — moved up.
“Shari’s made a material improve-ment, going from 12th out of 16 last year to third out of 16 this year,” Lombardi said. “In addition to having the sub cat-egory high score in Menu Variety, it ma-terially improved its scores in a number of other attributes.”
Cracker Barrel took the top spot in four of 10 surveyed attributes: Reputa-tion, Service, Cleanliness and Atmo-sphere.
Christopher A. Ciavarra, Crack-er Barrel’s senior vice president of marketing told NRN that the brand is always looking for ways to enhance all four of those areas to contribute to its overall top ranking.
“We’ve got a pretty clear idea of who we are and the kind of experience we are trying to cre-ate,” Ciavarra said.
Positioned along major arterials in 42 states, Cracker Barrel has made it-self the home away from home for trav-elers and, with its Old Country Store gifts shops, offers something of a quick vacation to a more nostalgic time. That distinguished atmosphere extends to the
lines of white, wooden rocking chairs on the front porch of Cracker Barrel units. And, of course, they are for sale.
Once guests are on the property, Ciavarra said, “we have pretty clear stan-dards. We know when they come up on the front porch, what it should look like. And then through the gift shop, what that should look like.”
The retail store gives the brand a unique twist over other Family-Dining competitors. “We’re an Old Country Store,” he said. “The gift shop does a lot of that work for us at the end of the day.”
The retail shop offers the chain, which is only closed on Christmas Day, an opportunity to give guests a two-fer: a dual shopping and dining experience.
CONTINUED ON PAGE 28
SURVEY STRENGTH: ATMOSPHERE Cracker Barrel’s atmosphere includes white, wooden rocking chairs on the front porch, below, and the retail store, above, gives the brand a unique twist over other Family-Dining competitors.
#1OF 16
FAMILY-DINING CHAINS
PHOTOS: CRACKER BARREL OLD COUNTRY STORE

28 | NRN.COM | APRIL 4, 2016 APRIL 4, 2016 | NRN.COM | 29
And the rotating merchandise is a way to make each visit fresh, Ciavarra added.
“It creates a sense of change with guests for new and interesting things and serves as a waiting room for those guests whose names are on the waiting list,” he said.
The retail shop also is lucrative. “We generate more than $420 a square foot in that space,” he said. “Most small retailers would be delighted with those kind of sales. But, for us, it’s an important part of the experience.”
In the restaurant space, bathrooms are critical, Ciavarra said. And that point is especially important for Cracker Barrel, which because of its roadside locations, gets a higher percentage of travelers than many competitors.
“We source about 30 to 35 percent of our guests from traveling,” Ciavarra said, explaining on of the brand’s chief marketing pushes: billboards. “For us, if the customers are stepping off the road and they are looking for a place to eat but also a bathroom.”
In addition to spic-and-span restrooms, the
company trains cleanliness at every em-ployee position, he said. “Every position has cleanliness tied to it in some way, be it server, back-up cook, grill cook, a dish-washer,” he said. “They all have cleanli-ness standards tied to them.”
Each employee is trained with a “clean
as you go” model throughout their shift, he added. On top of what the store day and evening teams do toward cleanli-ness, each restaurant has a night main-tenance who does additional cleaning beyond what the store operating teams have done.
If any brand in the restaurant space embraces patriotism more than Cracker Barrel, it would be hard to find.
The company works with a number of military-based causes and, because of its Tennessee roots, taps into country music like few other restaurant concepts can do. Both enhance the brand’s red-white-and-blue reputation.
“Cracker has a lot of commitment to military families,” Ciavarra said.
“For a long time, our guests have asso-ciated us with patriotism, America and, to a degree, military. It’s also a place of family bonding, so military families are quite important to us. We have a number of past service people on our teams. Over the course of time, we invest in support-ing that cause.”
The company last year, for example, continued its Annual Four-Star Salute, an online auction where proceeds ben-efit the United Services Organizations, or USO, and Disabled American Vet-erans.
The company bridged its patriotism
and music reputations last year by ty-ing into a program with the Academy of Country Music that featured a life-size checkers board game with country artists to raise money for philanthropic groups.
“This can be a very lifestyle-driven brand,” Ciavarra said.
“We use music as a way to connect culturally with different groups. For ex-ample, to improve our reputation with the younger market we target artists that can help build affinity with them.”
This past fall, Cracker Barrel worked older artists as well as with more teen-fo-cused singers such as the vocal group Pentatonix and singer-songwriter Ra-chel Platten, who had the pop hits “Fight Song” and “Stand by You.”
Cracker Barrel has a music catalog program that at any one time will in-clude between five and eight artists who provide content or music packaging that is exclusive to the brand.
“We recognize music is important to us,” Ciavarra said. “It is important to our
CRACKER BARREL OLD COUNTRY STOREFAMILY-DINING WINNER
CONTINUED FROM PAGE 27
SURVEY STRENGTH: CLEANLINESS Each Cracker Barrel restaurant has a night maintenance crew that does additional cleaning beyond what the store’s teams do around their shifts.
Left: The brand embraces patriotism and works with a number of military-based causes.
OVERALL SCORE:
68.0%guests. It’s just one of those nice intersection points.”
The full-service chain has a mission stated as: “Pleasing People.” And that is the core of the service model.
“It’s a pretty straightforward mission,” Ciavarra said. “If you speak to hourlies, they know that.
They sense the tone and the general rules around which we operate: general respect. We have a pretty clear understand-ing about our brand. We want to create a home away from home where our guests are treated like family.”
Employees in the restau-rants wear stars on their aprons that reflect where they stand in Cracker Barrel’s Per-sonal Achievement Responsi-bility, or PAR, program, dis-tinguishing how far they have advanced.
“If you can continue to take on increasing skills and in-creasing skills and you demon-strate different behaviors, you can increase in pay and ben-efits. You can move up in the organization.”
The brand’s e-learning pro-gram has a series of modules to the levels, that go up to PAR 4.
In addition, some service se-crets are less based on e-learn-ing than on simple, tried-and-true techniques such as a medallion program.
“That’s a literal medallion that one shift leader hands over to another person if someone at the front of the house has to leave for floor,” Ciavarra said, assuring that someone is always in charge.
The company also last year rolled out a new dining-room management technology sys-tem to the system. “We think that allows us to better manage the floor, and we think will al-low us future capabilities that we’re excited to unlock,” he said.
Cracker Barrel has made many advances in the areas of Atmosphere, Cleanliness, Rep-utation and Service, but Ciavar-ra said the company continues to make changes.
“The consumer space is pretty dynamic and changing
quickly,” he said. “And we are work-ing hard to evolve and meet that chang-ing world while preserving the pieces that we think remain
important to our guests and future
guests.”One area the com-
pany has been working on is the Hispanic customer demo-
graphic, Ciavarra said, which ranges from catering retail of-ferings in the gift shop to aim-ing marketing the group.
The company is also looking at off-premise menu offerings as
well, he said.Cracker Barrel Old Country
Store owns and operates 635 lo-cations in 42 states. n
Premium Brand +Simple Operations =High ROE**
SmoothieKingFranchise.com
For Franchising Info:
**Return on Effort
Our Fans the Chance toVote us #1*
Thank You NRN For Giving
*
*#1 LSR Beverages & #6 Overall LSR
Smoothies WithA Purpose.®
PHOTOS: CRACKER BARREL OLD COUNTRY STORE
#22OF ALL 173
RESTAURANT CHAINS

30 | NRN.COM | APRIL 4, 2016
T he top scorers in key categories with-in this year’s Consumer Picks survey brought no surprises.
The lineup of consumer favorites like In-N-Out Burger, The Cheese-cake Factory, Morton’s the Steak-house, Ben & Jerry’s and Cracker Bar-rel Old Country Store include a solid
group of brands that have largely stuck to their knitting in their respective categories but also stayed relevant.
They do what they do well and have continued to do so for the younger generations that appear to be reshaping consumer preferences today.
But it’s within the restaurant segment niches — Casual- Dining/Seafood restaurants, for instance — where we see more dramatic stories being told about consumer preferences.
Chains like Red Lobster, Ninety Nine Restaurants & Pub, Smashburger and Rubio’s climbed the ranks in their respective categories this year, indicating that brand revamps and efforts to update are resonating with customers.
“Brands have to evolve to stay relevant,” said Dennis Lom-bardi, consultant for WD Partners, which conducted the Con-sumer Picks survey for NRN.
“The trick is to not get too far behind the consumer and not too far ahead,” Lombardi, who is also president of Insight Dy-namics LLC, said.
And it takes time for consumers to notice efforts to evolve a brand, he noted.
“Brands and their perception by consumers turn at about the same speed as large supertanker oil freighters,” Lombardi said. “It takes some time for enough consumers to
experience the brand for it to show up in the rankings.”It doesn’t take long, however, for brands to fall out of favor.Within the limited-service Mexican category, for example,
Chipotle Mexican Grill dropped significantly this year, allow-ing other players a leg up.
“It’s like a roller coaster,” Lombardi said. “You go up very slowly but come down real fast.”
Among those that improved their standings this year include Red Lobster, which climbed significantly in the rankings for Casual-Dining chains. Red Lobster, acquired by Golden Gate Capital in 2014, went from the No. 14 slot last year to No. 4 among overall Casual-Dining restaurants in 2016.
CONTINUED ON PAGE 32
The challenge of staying
relevantConsumer Picks results paint a picture of shifting fortunesas brands race to keep up with changing consumer preferences BY LISA JENNINGS
Smashburger climbed the overall Limited- Service rankings this year and landed a spot as the No. 2 player within the Limited Service/Burgercategory. The chain has earned consumer favor by focusing on food quality and targeting Millennials.
SM
ASH
BU
RG
ER

32 | NRN.COM | APRIL 4, 2016
Over the past two years, the chain has kept a steady pace of change by giving the restaurants a facelift with remodels, cater-ing the menu to new food trends and engaging with customers on social media.
Red Lobster units now sport a new Bar Harbor design, and the menu includes more wood-grilled items, larger shrimp and the scampi sauce is now made from scratch in house, all the better for dip-ping the popular Cheddar Bay Biscuits.
Within the Casual Din-ing/Seafood subcategory, Red Lobster scored the highest on Service, Menu Variety, and Craveability, indicating that efforts to invigorate the menu are meeting consumer prefer-ences.
Other chains made an impression on consumers by emphasizing value and focus-ing on building a regular cus-tomer base with consistency.
Also in Casual Dining, Ninety Nine Restaurant & Pub made a surprise showing at eight place — up from No. 25 last year — earning the highest score for both Value and Likelihood to Return.
Owned by Nashville, Tenn.-based American Blue Ribbon Holdings, the 106-unit Nine-ty Nine was born in Boston
and is known for its New En-gland-style menu, including
signature broiled sirloin tips, hand-breaded boneless wings and frosty mugs of beer.
Charlie Noyes, president of Ninety Nine, said the chain has long focused on “all day, everyday value, not at all on discount-ing,” including entrées at the wallet-friendly $9.99 price point.
Also, over the past three years, the chain has been remod-
eling restaurants, opening up the bar area and adding more high-top and communal tables. With that has come more pop-up promotions around holidays or sporting events that generate buzz, though, Noyes said, “It’s not the food fad of the month. Guests know they’ll get great consistent quality here.”
Today’s consumers, especially younger generations, are focused on quality and sourcing of ingredients more than ever, and that trend could be seen throughout the Consumer Picks rankings.
Among Burger players, Smashburger climbed the overall Limited-Service rankings, moving to No. 19 from last year’s 49th place. This year, Smashburger was the second-high-est-ranking player within the overall Limited Service/Burger category, behind perennial favorite In-N-Out Burger.
It’s a competitive category, but Smashburger has earned con-sumer love by focusing messaging on the quality of its food.
Over the past year, Smashburger has increased its marketing focus on Millennials, particularly using Instagram and Snap-chat, said Josh Kern, Smashburger’s chief marketing officer.
“We significantly grew our fan base on both social channels by enhancing our food photography and video assets, building brand loyalists through engagement, and testing a variety of
CONTINUED FROM PAGE 30
THE CHALLENGE OF STAYING RELEVANT
Ninety Nine Restaurant & Pub, a chain with $9.99 entrées, moved up the Casual-Dining rankings with high scores for Value and Likelihood to Return. CONTINUED ON PAGE 34
Several chains made a positive impression by emphasizing value and focusing on building a regular customer base.
Red Lobster has kept a steady pace of change by giving restaurants a facelift with remodels
that sport a new Bar Harbor design.
NIN
ETY
NIN
E RES
TAU
RA
NT
& PU
B
RED
LO
BST
ER
34 | NRN.COM | APRIL 4, 2016
targeted campaigns that resulted in meaningful conversations and connections,” he said.
The chain also had great success with limited-time offers promoting regional burgers. The Sin City Burger promotion that began late last year, a Las Vegas-inspired alleged hangover cure with bacon, cheese, haystack fried onions and a fried egg, was the chain’s best-selling limited-time offers.
Among Family-Dining chains, Cracker Barrel regained its leading position, winning top scores for Service, Reputation and Atmosphere.
Last year, First Watch pushed Cracker Barrel out of the lead after six years as a top Consumer Picks brand. This year, however, consumers put First Watch in the No. 2 slot. The morning-daypart chain scored highest on the attri-butes of Cleanliness and Likely to Recommend.
Original Pancake House, meanwhile, won for Food Qual-ity and Craveability.
Within the Limited Service/Mexican category, however, the big story was Chipotle Mexican Grill, proving Lombardi’s senti-ment that it takes a long time to build a brand’s reputation, but that reputation can fall quickly.
Chipotle slid in the overall Lim-ited-Service chains rankings from the modest No. 27 slot last year to No. 65 in this year’s survey, behind Noodles & Company, Sbarro, Au Bon Pain, and Zaxby’s.
Within the Limited Service/Mexican subcategory, it was nearly a clean sweep for Rubio’s,
which won top scores for all attributes except Food Quality, which went to fast-casual Qdoba Mexican Eats, and Value, which went to Del Taco.
And even though Chipotle beat Rubio’s ever so slightly on Food Quality, the Denver-based chain scored the lowest within the subcategory for Value and Menu Variety.
Chipotle also had low scores, along with Baja Fresh Mexican Grill and Taco Bell, for the attribute of Likely to Return. Among the eight Limited-Service Mexican brands on the survey, Chi-potle ranked fourth.
The survey, however, was conducted in January, at a time
when Chipotle was emerging from multiple foodborne illness outbreaks that sent same-store sales plummeting 36.4 percent in January.
After launching a strict new food-safety program, Chipot-le in February began a marketing blitz that included freebies along with messages of food quality and flavor. Officials at Chi-potle contend the recovery will take time, and Wall Street ana-lysts don’t expect same-store sales to turn positive until the end of the year at best.
While Chipotle suffered, other chains distinguished them-selves in this year’s ranking. The 194-unit Rubio’s, meanwhile, moved up to fifth place among all Limited-Service brands.
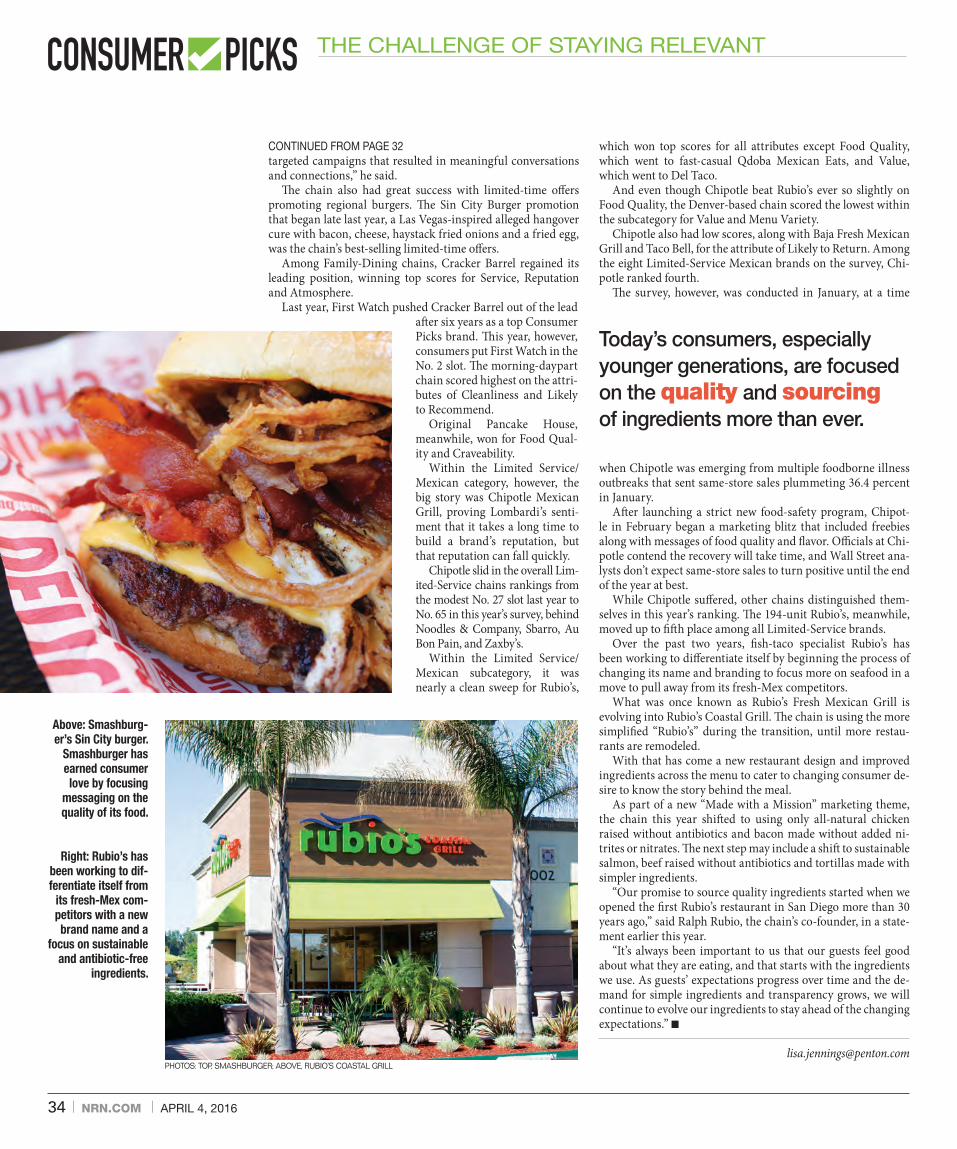
Over the past two years, fish-taco specialist Rubio’s has been working to differentiate itself by beginning the process of changing its name and branding to focus more on seafood in a move to pull away from its fresh-Mex competitors.
What was once known as Rubio’s Fresh Mexican Grill is evolving into Rubio’s Coastal Grill. The chain is using the more simplified “Rubio’s” during the transition, until more restau-rants are remodeled.
With that has come a new restaurant design and improved ingredients across the menu to cater to changing consumer de-sire to know the story behind the meal.
As part of a new “Made with a Mission” marketing theme, the chain this year shifted to using only all-natural chicken raised without antibiotics and bacon made without added ni-trites or nitrates. The next step may include a shift to sustainable salmon, beef raised without antibiotics and tortillas made with simpler ingredients.
“Our promise to source quality ingredients started when we opened the first Rubio’s restaurant in San Diego more than 30 years ago,” said Ralph Rubio, the chain’s co-founder, in a state-ment earlier this year.
“It’s always been important to us that our guests feel good about what they are eating, and that starts with the ingredients we use. As guests’ expectations progress over time and the de-mand for simple ingredients and transparency grows, we will continue to evolve our ingredients to stay ahead of the changing expectations.” n
THE CHALLENGE OF STAYING RELEVANT
CONTINUED FROM PAGE 32
Today’s consumers, especially younger generations, are focused on the quality and sourcing of ingredients more than ever.
Above: Smashburg-er’s Sin City burger.
Smashburger has earned consumer love by focusing
messaging on the quality of its food.
Right: Rubio’s has been working to dif-ferentiate itself from
its fresh-Mex com-petitors with a new brand name and a
focus on sustainable and antibiotic-free
ingredients.
PHOTOS: TOP, SMASHBURGER; ABOVE, RUBIO’S COASTAL GRILL

36 | NRN.COM | APRIL 4, 2016
1. Ben & Jerry’s SEGMENT WINNER: Frozen Treats TOP SCORE: Craveability2. Häagen-Dazs TOP SCORE: Cleanliness3. In-N-Out Burger SEGMENT WINNER: Burger TOP SCORES: Food Quality • Reputation • Likely to Recommend4. Chick-fil-A SEGMENT WINNER: Chicken TOP SCORE: Service5. Rubio’s** SEGMENT WINNER: Mexican TOP SCORE: Atmosphere6. Smoothie King SEGMENT WINNER: Beverage-Snack7. Bruster’s Real Ice Cream8. Red Mango**
9. Pei Wei Asian Diner SEGMENT WINNER: Asian10. Krispy Kreme Doughnuts11. Godfather’s Pizza SEGMENT WINNER: Pizza12. Corner Bakery Cafe** SEGMENT WINNER: Bakery-Cafe13. Baskin-Robbins14. Blimpie America’s Sub Shop** SEGMENT WINNER: Sandwich15. Pollo Tropical16. Peet’s Coffee & Tea17. Papa Murphy’s Take ‘N’ Bake Pizza TOP SCORE: Likely to Return18. Charley’s Grilled Subs19. Smashburger20. Quiznos21. Sarku Japan**22. Marble Slab Creamery**23. Starbucks Coffee24. Panera Bread25. Five Guys Burgers and Fries26. McAlister’s Deli27. Jason’s Deli
28. Cinnabon29. Culver’s30. Einstein Bros. Bagels31. Penn Station East Coast Subs32. Qdoba Mexican Eats33. Rita’s Italian Ice34. Tropical Smoothie Café**35. Raising Cane’s Chicken Fingers36. Marco’s Pizza37. Firehouse Subs38. Cold Stone Creamery39. Caribou Coffee**40. Potbelly Sandwich Shop41. Jamba Juice42. Round Table Pizza**43. Sizzler** SEGMENT WINNER: Buffet44. Baja Fresh Mexican Grill45. Which Wich46. Fuddruckers47. Whataburger48. Braum’s Ice Cream & Dairy Stores49. Bruegger’s Bagels50. Jet’s Pizza51. HomeTown Buffet**52. Mrs. Fields Cookies53. Jersey Mike’s Subs54. Great American Cookies55. Togo’s**56. Papa John’s Pizza57. Tim Hortons58. Souplantation/Sweet Tomatoes59. Hungry Howie’s Pizza**60. El Pollo Loco61. Noodles & Company62. Sbarro63. Au Bon Pain64. Zaxby’s65. Chipotle Mexican Grill66. Jimmy John’s Gourmet Sandwiches67. Boston Market68. Pizza Hut69. Carvel70. Wingstop71. Schlotzsky’s
72. Subway73. Golden Corral TOP SCORE: Menu Variety74. Dickey’s Barbecue Pit SEGMENT WINNER: Specialty75. Ponderosa Steakhouse/ Bonanza Steakhouse76. Steak ‘n Shake77. Panda Express78. Domino’s79. Moe’s Southwest Grill80. Orange Julius81. Wendy’s82. Fazoli’s83. Bojangles’ Famous Chicken ‘n Biscuits84. Taco John’s**85. Ryan’s86. Church’s Chicken87. Sonic America’s Drive-In88. Popeyes Louisiana Kitchen89. KFC90. Carl’s Jr.91. Captain D’s Seafood Kitchen92. Checkers93. Old Country Buffet94. Arby’s95. CiCi’s Pizza96. Del Taco97. Dunkin’ Donuts98. Wienerschnitzel99. Jack in the Box100. Rally’s Hamburgers
101. Little Caesars Pizza TOP SCORE: Value102. Hardee’s103. White Castle104. Burger King105. Taco Bell106. Auntie Anne’s107. Dairy Queen108. Long John Silver’s109. Krystal110. McDonald’s111. A&W Restaurants112. Chuck E. Cheese’s
9. Pei Wei Asian Diner
28. Cinnabon
101. Little Caesars Pizza
** 120-149 RESPONSES ALL PHOTOS COURTESY OF THE RESPECTIVE RESTAURANT COMPANIES
BRANDS RANKED BY OVERALL SCORELIMITED-SERVICE RESTAURANTS

38 | NRN.COM | APRIL 4, 2016
SMOOTHIE KING 67.0 6 72.8 52.7 67.1 70.3 69.6 67.0 58.0 69.6 72.4 71.4 KRISPY KREME DOUGHNUTS 64.5 10 75.6 53.7 66.5 56.9 48.2 72.0 53.3 73.9 77.9 71.2 PEET’S COFFEE & TEA 63.8 16 63.4 46.0 72.7 68.2 50.2 74.2 64.9 60.2 67.8 64.4 STARBUCKS COFFEE 62.3 23 65.7 26.5 73.4 72.1 50.4 78.7 66.0 59.7 67.2 71.0 CINNABON 61.5 28 76.1 47.0 59.2 64.7 41.2 68.6 49.8 68.7 76.2 62.2 TROPICAL SMOOTHIE CAFÉ ** 60.9 34 64.7 43.2 63.0 61.7 65.9 61.2 54.3 60.5 69.7 69.2 CARIBOU COFFEE ** 59.5 39 61.8 44.4 68.2 67.7 44.6 60.9 66.2 51.8 69.6 66.3 JAMBA JUICE 59.2 41 69.5 40.1 68.0 62.8 50.7 63.0 50.8 56.1 61.6 60.2 MRS. FIELDS COOKIES 57.5 52 64.4 44.0 60.2 54.1 44.6 64.6 47.4 66.6 62.9 58.5 GREAT AMERICAN COOKIES 57.5 54 69.1 41.8 57.9 62.0 49.3 65.6 44.2 58.9 65.6 60.6 ORANGE JULIUS 52.2 80 54.6 42.8 55.2 50.6 44.6 54.6 43.9 62.4 58.8 56.6 DUNKIN’ DONUTS 46.5 97 43.8 42.3 48.9 46.4 36.5 58.3 32.5 48.2 60.5 66.6 AUNTIE ANNE’S 43.6 106 56.8 35.1 39.2 40.4 26.8 51.2 25.3 59.2 57.7 53.0
OVERALL OVERALL LSR FOOD MENU LIKELY TO LIKELY TO CHAIN SCORE* RANK QUALITY VALUE CLEANLINESS SERVICE VARIETY REPUTATION ATMOSPHERE CRAVEABILITY RECOMMEND RETURN
BEVERAGE-SNACK
*OVERALL SCORES ARE AN AVERAGE OF ATTRIBUTE SCORES, EXCEPT FOR LIKELY TO RETURN, AND ARE WEIGHTED BY ATTRIBUTE IMPORTANCE. ATTRIBUTE SCORES REFLECT THE PERCENT OF RESPONDENTS WHO SAID A CHAIN WAS “OUTSTANDING” OR “ABOVE AVERAGE” IN THAT AREA. LIKELY TO RETURN SCORES REFLECT THE PERCENT OF RESPONDENTS WHO SAID THEY “DEFINITELY” OR “PROBABLY” WILL VISIT A CHAIN AGAIN. **120-149 RESPONSES
CORNER BAKERY CAFE ** 64.4 12 69.2 45.9 70.5 63.5 66.3 67.9 60.3 59.2 70.8 66.9 PANERA BREAD 62.2 24 80.8 40.1 66.7 57.0 59.3 72.5 61.0 50.7 67.2 61.4 EINSTEIN BROS. BAGELS 61.4 30 68.4 55.4 62.3 64.2 56.5 61.0 51.4 61.5 64.9 62.7 BRUEGGER’S BAGELS 58.0 49 66.9 51.3 65.3 60.1 51.8 59.6 46.6 50.6 62.9 61.5 TIM HORTONS 56.5 57 55.4 46.6 65.0 59.7 47.1 63.3 48.4 51.1 68.0 63.9 AU BON PAIN 55.6 63 65.2 43.5 69.1 49.1 55.0 60.5 47.4 44.7 58.3 58.8
OVERALL OVERALL LSR FOOD MENU LIKELY TO LIKELY TO CHAIN SCORE* RANK QUALITY VALUE CLEANLINESS SERVICE VARIETY REPUTATION ATMOSPHERE CRAVEABILITY RECOMMEND RETURN
BAKERY-CAFE
PEI WEI ASIAN DINER 64.6 9 70.4 48.4 68.5 60.0 65.8 67.4 60.7 68.3 68.0 64.1 SARKU JAPAN ** 62.7 21 61.4 65.1 59.1 59.3 59.7 66.0 61.2 57.9 69.8 65.5 NOODLES & COMPANY 55.8 61 71.7 38.6 63.1 49.2 51.3 62.9 38.3 55.2 63.1 57.2 PANDA EXPRESS 53.3 77 55.1 49.2 53.3 50.8 56.1 51.1 43.9 59.2 60.7 61.4
OVERALL OVERALL LSR FOOD MENU LIKELY TO LIKELY TO CHAIN SCORE* RANK QUALITY VALUE CLEANLINESS SERVICE VARIETY REPUTATION ATMOSPHERE CRAVEABILITY RECOMMEND RETURN
ASIAN
SIZZLER ** 59.2 43 63.6 53.2 61.8 59.1 62.4 57.8 51.2 54.6 68.6 57.8 HOMETOWN BUFFET ** 57.8 51 48.9 57.3 53.9 57.5 72.0 52.8 48.2 60.4 62.5 57.5 SOUPLANTATION/SWEET TOMATOES 56.4 58 66.3 51.2 65.2 43.1 54.6 51.7 50.8 51.6 66.0 67.6 GOLDEN CORRAL 53.8 73 51.8 54.6 46.1 50.7 76.1 56.7 41.8 47.6 60.7 59.1 PONDEROSA STEAKHOUSE/ 53.3 75 56.1 56.2 50.9 57.4 54.6 52.4 46.2 46.2 54.9 46.0 BONANZA STEAKHOUSE RYAN’S 50.2 85 46.5 44.5 48.5 51.8 66.9 47.1 40.7 43.0 62.5 54.5 OLD COUNTRY BUFFET 47.5 93 45.8 50.3 40.7 39.6 67.8 44.7 39.9 42.1 55.2 50.0
OVERALL OVERALL LSR FOOD MENU LIKELY TO LIKELY TO CHAIN SCORE* RANK QUALITY VALUE CLEANLINESS SERVICE VARIETY REPUTATION ATMOSPHERE CRAVEABILITY RECOMMEND RETURN
BUFFET
PEI WEI ASIAN DINER
CORNER BAKERY CAFE
SMOOTHIE KING
SIZZLER
CHICK-FIL-A
COMPLETE RANKINGS BY SUBSEGMENT (BLUE BOLDFACE: HIGHEST SCORE IN ATTRIBUTE CATEGORY)
LIMITED-SERVICE RESTAURANTS
CHICK-FIL-A 69.6 4 78.2 54.6 76.3 77.8 48.2 80.2 60.5 63.9 80.7 74.9 POLLO TROPICAL 63.8 15 71.3 67.7 66.8 61.2 54.5 64.7 53.6 54.7 72.9 71.7 RAISING CANE’S CHICKEN FINGERS 60.9 35 74.6 42.3 65.3 70.2 24.3 71.4 50.3 64.9 74.7 68.2 EL POLLO LOCO 56.1 60 68.7 52.5 56.3 52.4 51.1 54.2 42.0 57.5 66.6 61.5 ZAXBY’S 55.4 64 67.8 39.5 54.8 54.8 42.3 61.6 49.6 59.8 66.8 67.7 BOSTON MARKET 54.7 67 64.4 46.9 59.3 52.6 53.0 57.2 37.8 51.8 64.8 58.2 WINGSTOP 54.3 70 62.2 45.0 52.4 52.2 44.7 53.2 47.6 62.4 62.2 58.8 BOJANGLES’ FAMOUS 51.1 83 61.1 48.4 47.9 47.1 40.2 55.8 33.1 51.8 68.8 67.2 CHICKEN ‘N BISCUITS CHURCH’S CHICKEN 50.2 86 55.6 58.8 43.7 47.6 41.3 52.4 39.6 52.3 57.3 59.4 POPEYES LOUISIANA KITCHEN 50.0 88 63.0 48.9 42.2 44.6 40.2 52.7 32.7 59.1 61.4 59.7 KFC 48.6 89 60.0 38.6 41.4 46.2 40.7 52.1 34.5 59.0 60.6 59.3
OVERALL OVERALL CASUAL FOOD MENU LIKELY TO LIKELY TO CHAIN SCORE* RANK QUALITY VALUE CLEANLINESS SERVICE VARIETY REPUTATION ATMOSPHERE CRAVEABILITY RECOMMEND RETURN
CHICKEN
ALL PHOTOS COURTESY OF THE RESPECTIVE RESTAURANT COMPANIES

IN-N-OUT BURGER 70.6 3 84.5 71.8 72.5 75.4 34.6 85.0 53.6 72.7 82.5 74.3 SMASHBURGER 62.8 19 79.0 53.4 66.8 66.2 53.0 61.1 52.3 62.1 67.9 67.2 FIVE GUYS BURGERS AND FRIES 62.1 25 82.9 45.3 56.5 64.3 34.6 78.4 47.6 70.6 75.0 66.3 CULVER’S 61.5 29 72.7 44.3 64.7 65.0 61.0 68.1 47.4 56.8 70.5 63.8 FUDDRUCKERS 58.5 46 71.0 44.7 60.1 47.6 48.0 62.0 58.2 61.0 71.9 61.1 WHATABURGER 58.3 47 69.4 45.8 52.9 55.1 53.3 69.2 41.7 60.8 74.2 72.8 STEAK ‘N SHAKE 53.3 76 50.4 64.2 49.5 44.2 56.2 50.0 45.7 56.8 60.6 60.2 WENDY’S 51.7 81 57.9 55.3 47.3 50.3 53.9 53.3 34.0 50.9 57.4 59.1 SONIC AMERICA’S DRIVE-IN 50.1 87 50.3 47.3 37.0 52.0 65.6 50.5 36.6 53.8 59.2 67.5 CARL’S JR. 48.2 90 53.7 46.3 44.6 44.1 53.7 50.7 32.6 49.0 53.6 58.7 CHECKERS 47.8 92 52.3 61.8 37.9 44.0 46.0 43.4 32.2 53.5 57.3 54.2 JACK IN THE BOX 45.8 99 43.6 49.5 43.2 42.1 57.9 41.4 28.7 49.8 54.3 62.0 RALLY’S HAMBURGERS 45.5 100 40.5 50.1 38.6 41.0 48.4 44.6 34.4 53.1 55.3 49.5 HARDEE’S 45.3 102 53.3 40.0 44.1 40.4 50.1 41.7 34.2 46.0 55.8 59.1 WHITE CASTLE 45.3 103 39.7 55.1 37.6 39.1 32.8 48.7 27.7 69.1 63.2 67.8 BURGER KING 44.5 104 45.4 50.6 41.9 42.2 43.7 39.0 26.4 46.5 51.2 59.0 KRYSTAL 40.3 109 31.3 58.9 38.7 36.0 27.9 35.3 23.1 50.8 56.2 60.0 McDONALD’S 39.5 110 28.6 53.0 39.0 39.1 39.4 40.2 25.7 39.3 43.6 61.1 A&W RESTAURANTS 38.6 111 40.2 36.4 39.9 39.5 28.3 44.5 31.6 40.2 45.2 37.8
OVERALL OVERALL LSR FOOD MENU LIKELY TO LIKELY TO CHAIN SCORE* RANK QUALITY VALUE CLEANLINESS SERVICE VARIETY REPUTATION ATMOSPHERE CRAVEABILITY RECOMMEND RETURN
BURGER
RUBIO’S ** 67.0 5 70.6 55.8 70.2 69.8 59.4 62.7 66.4 63.9 78.9 75.7 QDOBA MEXICAN EATS 61.0 32 72.8 56.6 60.2 61.2 51.3 62.2 48.1 62.2 69.9 61.5 BAJA FRESH MEXICAN GRILL 59.1 44 69.0 55.8 60.1 56.8 55.8 59.1 52.9 56.3 58.6 53.3 CHIPOTLE MEXICAN GRILL 55.1 65 70.9 47.3 55.2 59.6 42.8 47.3 46.2 60.5 58.5 59.4 MOE’S SOUTHWEST GRILL 52.5 79 63.3 50.1 47.7 55.5 43.2 51.3 40.8 54.2 63.6 63.2 TACO JOHN’S ** 50.4 84 50.6 54.9 42.0 50.6 46.2 45.9 41.2 56.6 62.2 65.7 DEL TACO 46.8 96 38.0 65.9 43.9 40.7 55.4 36.7 30.7 50.4 56.4 62.3 TACO BELL 43.6 105 37.9 57.6 35.9 39.2 50.2 39.9 25.6 51.1 51.0 59.8
OVERALL OVERALL CASUAL FOOD MENU LIKELY TO LIKELY TO CHAIN SCORE* RANK QUALITY VALUE CLEANLINESS SERVICE VARIETY REPUTATION ATMOSPHERE CRAVEABILITY RECOMMEND RETURN
MEXICAN
BEN & JERRY’S 73.4 1 83.6 52.0 71.9 75.9 74.7 81.5 65.1 77.2 77.5 66.5 HÄAGEN-DAZS 70.9 2 79.8 53.2 77.9 65.9 64.3 77.5 62.8 74.4 78.1 69.8 BRUSTER’S REAL ICE CREAM 65.6 7 72.7 57.4 66.0 68.3 64.5 67.2 54.1 64.3 73.7 63.8 RED MANGO** 64.7 8 70.7 60.1 71.5 60.2 60.5 67.1 60.5 60.5 62.6 63.0 BASKIN-ROBBINS 64.2 13 72.3 49.6 63.8 61.3 66.8 66.6 52.2 70.8 73.3 66.2 MARBLE SLAB CREAMERY** 62.5 22 72.7 53.0 63.5 58.7 66.0 62.5 55.2 63.7 62.1 55.1 RITA’S ITALIAN ICE 61.0 33 66.3 55.1 60.1 62.7 54.7 66.7 46.4 67.5 73.8 46.7 COLD STONE CREAMERY 59.9 38 77.9 25.8 62.5 59.2 61.7 67.7 46.3 68.7 66.5 49.9 BRAUM’S ICE CREAM & DAIRY STORES 58.2 48 65.5 53.6 55.2 54.5 52.0 63.2 50.0 57.9 70.9 66.6 CARVEL 54.4 69 68.1 41.8 51.9 54.0 48.2 56.1 39.3 59.9 67.6 65.5 DAIRY QUEEN 43.2 107 44.9 38.1 43.7 42.0 40.2 48.5 26.9 49.5 55.0 49.9
OVERALL OVERALL CASUAL FOOD MENU LIKELY TO LIKELY TO CHAIN SCORE* RANK QUALITY VALUE CLEANLINESS SERVICE VARIETY REPUTATION ATMOSPHERE CRAVEABILITY RECOMMEND RETURN
FROZEN TREATS
COMPLETE RANKINGS BY SUBSEGMENT (BLUE BOLDFACE: HIGHEST SCORE IN ATTRIBUTE CATEGORY)
LIMITED-SERVICE RESTAURANTS
GODFATHER’S PIZZA 64.5 11 69.4 59.4 61.9 63.8 63.5 68.2 53.9 63.1 70.1 64.5 PAPA MURPHY’S TAKE ‘N’ BAKE PIZZA 63.4 17 76.8 70.0 65.0 61.7 50.5 66.7 35.6 59.6 73.1 77.2 MARCO’S PIZZA 60.8 36 69.9 58.4 64.3 62.2 52.4 54.6 45.3 62.2 71.1 64.8 ROUND TABLE PIZZA ** 59.2 42 78.5 44.7 51.3 57.1 49.1 59.0 50.0 66.1 72.8 63.3 JET’S PIZZA 57.8 50 74.6 50.0 49.9 55.9 48.9 63.2 36.0 62.6 77.4 68.2 PAPA JOHN’S PIZZA 56.9 56 68.0 54.5 54.9 54.9 47.3 61.0 38.0 57.7 66.1 63.2 HUNGRY HOWIE’S PIZZA ** 56.2 59 57.3 56.3 53.8 55.3 51.1 58.2 40.6 57.4 69.8 67.8 SBARRO 55.7 62 63.2 51.5 53.3 53.2 53.3 54.7 46.3 60.8 60.2 52.2 PIZZA HUT 54.5 68 62.5 51.5 51.3 50.7 51.4 57.0 40.2 55.7 65.9 64.2 DOMINO’S 52.9 78 55.0 58.3 49.8 57.0 49.6 53.4 32.9 53.1 60.9 65.2 FAZOLI’S 51.4 82 53.6 47.2 54.3 54.4 46.5 47.0 45.7 53.0 56.7 49.5 CICI’S PIZZA 47.2 95 38.7 70.4 39.4 44.2 48.0 44.2 42.7 42.1 53.5 56.2 LITTLE CAESARS PIZZA 45.5 101 37.8 76.6 44.9 52.1 22.5 40.2 26.7 40.2 57.6 63.1 CHUCK E. CHEESE’S 32.4 112 28.3 20.3 29.9 35.3 22.1 45.2 47.0 25.1 45.5 43.5
OVERALL OVERALL CASUAL FOOD MENU LIKELY TO LIKELY TO CHAIN SCORE* RANK QUALITY VALUE CLEANLINESS SERVICE VARIETY REPUTATION ATMOSPHERE CRAVEABILITY RECOMMEND RETURN
PIZZA
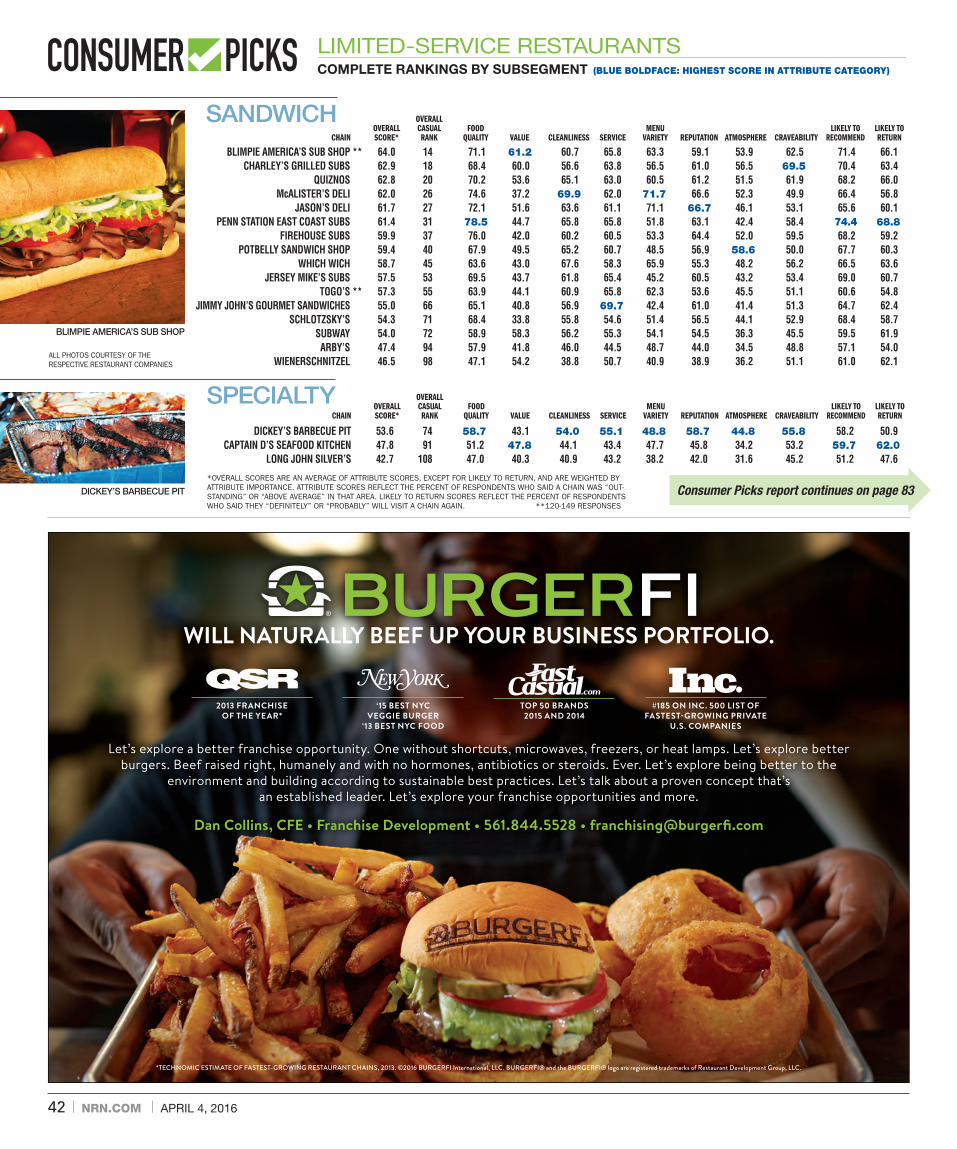
*OVERALL SCORES ARE AN AVERAGE OF ATTRIBUTE SCORES, EXCEPT FOR LIKELY TO RETURN, AND ARE WEIGHTED BY ATTRIBUTE IMPORTANCE. ATTRIBUTE SCORES REFLECT THE PERCENT OFRESPONDENTS WHO SAID A CHAIN WAS “OUTSTANDING” OR “ABOVE AVERAGE” IN THAT AREA. LIKELY TO RETURN SCORES REFLECT THE PERCENT OF RESPONDENTS WHO SAID THEY “DEFINITELY” OR “PROBABLY” WILL VISIT A CHAIN AGAIN. **120-149 RESPONSES
40 | NRN.COM | APRIL 4, 2016
IN-N-OUT BURGER
BEN & JERRY’S
RUBIO’S
GODFATHER’S PIZZA
PHOTOS COURTESY OF THE RESPECTIVE RESTAURANT COMPANIES; BEN & JERRY’S: JAMIE MCCARTHY/GETTY IMAGES
42 | NRN.COM | APRIL 4, 2016
*OVERALL SCORES ARE AN AVERAGE OF ATTRIBUTE SCORES, EXCEPT FOR LIKELY TO RETURN, AND ARE WEIGHTED BY ATTRIBUTE IMPORTANCE. ATTRIBUTE SCORES REFLECT THE PERCENT OF RESPONDENTS WHO SAID A CHAIN WAS “OUT-STANDING” OR “ABOVE AVERAGE” IN THAT AREA. LIKELY TO RETURN SCORES REFLECT THE PERCENT OF RESPONDENTS WHO SAID THEY “DEFINITELY” OR “PROBABLY” WILL VISIT A CHAIN AGAIN. **120-149 RESPONSES
COMPLETE RANKINGS BY SUBSEGMENT (BLUE BOLDFACE: HIGHEST SCORE IN ATTRIBUTE CATEGORY)
LIMITED-SERVICE RESTAURANTS
Let’s explore a better franchise opportunity. One without shortcuts, microwaves, freezers, or heat lamps. Let’s explore better
burgers. Beef raised right, humanely and with no hormones, antibiotics or steroids. Ever. Let’s explore being better to the
environment and building according to sustainable best practices. Let’s talk about a proven concept that’s
an established leader. Let’s explore your franchise opportunities and more.
Dan Collins, CFE • Franchise Development • 561.844.5528 • [email protected]
WILL NATURALLY BEEF UP YOUR BUSINESS PORTFOLIO.
2013 FRANCHISE
OF THE YEAR*
‘15 BEST NYC
VEGGIE BURGER
‘13 BEST NYC FOOD
TOP 50 BRANDS
2015 AND 2014
#185 ON INC. 500 LIST OF
FASTEST-GROWING PRIVATE
U.S. COMPANIES
*TECHNOMIC ESTIMATE OF FASTEST-GROWING RESTAURANT CHAINS, 2013. ©2016 BURGERFI International, LLC. BURGERFI® and the BURGERFI® logo are registered trademarks of Restaurant Development Group, LLC.
DICKEY’S BARBECUE PIT 53.6 74 58.7 43.1 54.0 55.1 48.8 58.7 44.8 55.8 58.2 50.9 CAPTAIN D’S SEAFOOD KITCHEN 47.8 91 51.2 47.8 44.1 43.4 47.7 45.8 34.2 53.2 59.7 62.0 LONG JOHN SILVER’S 42.7 108 47.0 40.3 40.9 43.2 38.2 42.0 31.6 45.2 51.2 47.6
OVERALL OVERALL CASUAL FOOD MENU LIKELY TO LIKELY TO CHAIN SCORE* RANK QUALITY VALUE CLEANLINESS SERVICE VARIETY REPUTATION ATMOSPHERE CRAVEABILITY RECOMMEND RETURN
SPECIALTY
BLIMPIE AMERICA’S SUB SHOP ** 64.0 14 71.1 61.2 60.7 65.8 63.3 59.1 53.9 62.5 71.4 66.1 CHARLEY’S GRILLED SUBS 62.9 18 68.4 60.0 56.6 63.8 56.5 61.0 56.5 69.5 70.4 63.4 QUIZNOS 62.8 20 70.2 53.6 65.1 63.0 60.5 61.2 51.5 61.9 68.2 66.0 McALISTER’S DELI 62.0 26 74.6 37.2 69.9 62.0 71.7 66.6 52.3 49.9 66.4 56.8 JASON’S DELI 61.7 27 72.1 51.6 63.6 61.1 71.1 66.7 46.1 53.1 65.6 60.1 PENN STATION EAST COAST SUBS 61.4 31 78.5 44.7 65.8 65.8 51.8 63.1 42.4 58.4 74.4 68.8 FIREHOUSE SUBS 59.9 37 76.0 42.0 60.2 60.5 53.3 64.4 52.0 59.5 68.2 59.2 POTBELLY SANDWICH SHOP 59.4 40 67.9 49.5 65.2 60.7 48.5 56.9 58.6 50.0 67.7 60.3 WHICH WICH 58.7 45 63.6 43.0 67.6 58.3 65.9 55.3 48.2 56.2 66.5 63.6 JERSEY MIKE’S SUBS 57.5 53 69.5 43.7 61.8 65.4 45.2 60.5 43.2 53.4 69.0 60.7 TOGO’S ** 57.3 55 63.9 44.1 60.9 65.8 62.3 53.6 45.5 51.1 60.6 54.8 JIMMY JOHN’S GOURMET SANDWICHES 55.0 66 65.1 40.8 56.9 69.7 42.4 61.0 41.4 51.3 64.7 62.4 SCHLOTZSKY’S 54.3 71 68.4 33.8 55.8 54.6 51.4 56.5 44.1 52.9 68.4 58.7 SUBWAY 54.0 72 58.9 58.3 56.2 55.3 54.1 54.5 36.3 45.5 59.5 61.9 ARBY’S 47.4 94 57.9 41.8 46.0 44.5 48.7 44.0 34.5 48.8 57.1 54.0 WIENERSCHNITZEL 46.5 98 47.1 54.2 38.8 50.7 40.9 38.9 36.2 51.1 61.0 62.1
OVERALL OVERALL CASUAL FOOD MENU LIKELY TO LIKELY TO CHAIN SCORE* RANK QUALITY VALUE CLEANLINESS SERVICE VARIETY REPUTATION ATMOSPHERE CRAVEABILITY RECOMMEND RETURN
SANDWICH
BLIMPIE AMERICA’S SUB SHOP
DICKEY’S BARBECUE PIT
ALL PHOTOS COURTESY OF THE RESPECTIVE RESTAURANT COMPANIES
Consumer Picks report continues on page 83

APRIL 4, 2016 | NRN.COM | 83
1. The Cheesecake Factory SEGMENT WINNER: Varied menu
TOP SCORE: Food Quality • Menu Variety
Reputation • Likely to Recommend
2. The Melting Pot TOP SCORES: Service • Atmosphere
3. Bonefish Grill SEGMENT WINNER: Seafood TOP SCORE: Cleanliness
4. Red Lobster5. Romano’s Macaroni Grill SEGMENT WINNER: Italian/Pizza 6. Carrabba’s Italian Grill7. Olive Garden8. Ninety Nine Restaurant & Pub** TOP SCORES: Value • Likely to Return
9. Mellow Mushroom Pizza Bakers10. Chevys Fresh Mex11. P.F. Chang’s China Bistro
12. BJ’s Restaurant & Brewhouse13. Texas Roadhouse SEGMENT WINNER: Steak 14. Mimi’s Cafe15. Buca di Beppo16. Johnny Carino’s/Carino’s Italian17. Genghis Grill** TOP SCORE: Craveability
18. Cheddar’s Scratch Kitchen19. Hard Rock Cafe20. Old Chicago Pizza & Taproom21. Lone Star Steakhouse22. LongHorn Steakhouse23. Outback Steakhouse24. Joe’s Crab Shack25. California Pizza Kitchen26. O’Charley’s27. Red Robin Gourmet Burgers & Brews
28. Famous Dave’s29. TGI Fridays30. Beef ‘O’ Brady’s**
31. Applebee’s Neighborhood Grill & Bar32. Sonny’s Real Pit Bar-B-Q**33. Hooters34. Dave & Buster’s35. Chili’s Grill & Bar36. Uno Chicago Grill/Uno Pizzeria & Grill37. On the Border Mexican Grill & Cantina38. Ruby Tuesday39. Logan’s Roadhouse40. Buffalo Wild Wings Grill & Bar
September 19, 2016
Closing: August 16, 2016 • Materials Due: August 19, 2016
Start planning now for the SEPTEMBER Franchise Focus
Contact: Leslie Wolowitz
212-204-4399 ¥ [email protected]
FranchFocus3colx2_625_new.indd 1 3/16/16 2:20 PM
1. The Cheesecake Factory
27. Red Robin Gourmet Burgers & Brews
31. Applebee’s Neighborhood Grill & Bar
40. Buffalo Wild Wings Grill & Bar
BRANDS RANKED BY OVERALL SCORECASUAL-DINING RESTAURANTS
ALL PHOTOS COURTESY OF THE RESPECTIVE RESTAURANT COMPANIES** 120-149 RESPONSES

84 | NRN.COM | APRIL 4, 2016
TEXAS ROADHOUSE 67.5 13 78.5 55.7 60.2 72.6 63.6 70.0 66.1 63.6 73.9 60.2 LONE STAR STEAKHOUSE 65.4 21 70.5 48.1 73.9 65.0 62.8 65.2 63.4 61.2 73.7 60.6
LONGHORN STEAKHOUSE 65.2 22 78.2 37.7 72.0 71.4 62.8 67.3 62.0 57.3 69.6 58.7 OUTBACK STEAKHOUSE 65.1 23 75.3 42.8 69.0 71.9 62.2 68.3 62.3 57.7 66.7 58.6 LOGAN’S ROADHOUSE 54.9 39 63.6 41.0 51.1 55.7 50.9 57.2 59.4 46.1 65.0 53.7
OVERALL OVERALL CASUAL FOOD MENU LIKELY TO LIKELY TO CHAIN SCORE* RANK QUALITY VALUE CLEANLINESS SERVICE VARIETY REPUTATION ATMOSPHERE CRAVEABILITY RECOMMEND RETURN
STEAK
*OVERALL SCORES ARE AN AVERAGE OF ATTRIBUTE SCORES, EXCEPT FOR LIKELY TO RETURN, AND ARE WEIGHTED BY ATTRIBUTE IMPORTANCE. ATTRIBUTE SCORES REFLECT THE PERCENT OF RE-SPONDENTS WHO SAID A CHAIN WAS “OUTSTANDING” OR “ABOVE AVERAGE” IN THAT AREA. LIKELY TO RETURN SCORES REFLECT THE PERCENT OF RESPONDENTS WHO SAID THEY “DEFINITELY” OR “PROBABLY” WILL VISIT A CHAIN AGAIN. **120-149 RESPONSES
BONEFISH GRILL 71.7 3 83.3 38.5 84.0 72.7 66.4 83.2 74.5 58.2 77.6 60.5
RED LOBSTER 71.1 4 81.9 43.2 73.5 75.5 69.3 75.5 69.3 70.1 72.8 60.1 JOE’S CRAB SHACK 64.9 24 67.5 52.3 60.7 70.1 61.1 69.3 65.2 62.3 73.8 58.0
OVERALL OVERALL CASUAL FOOD MENU LIKELY TO LIKELY TO CHAIN SCORE* RANK QUALITY VALUE CLEANLINESS SERVICE VARIETY REPUTATION ATMOSPHERE CRAVEABILITY RECOMMEND RETURN
SEAFOOD
ROMANO’S MACARONI GRILL 70.5 5 77.3 48.2 83.1 74.8 66.1 69.0 75.7 62.2 70.8 62.6 CARRABBA’S ITALIAN GRILL 70.4 6 80.7 42.1 77.2 75.7 70.8 74.6 71.8 61.6 71.7 59.3 OLIVE GARDEN 70.0 7 74.8 53.4 74.5 74.0 68.1 73.1 69.5 64.7 74.8 64.2
MELLOW MUSHROOM PIZZA BAKERS 69.0 9 78.6 43.8 68.6 65.9 71.5 76.3 70.9 69.2 76.3 61.7 BUCA DI BEPPO 66.8 15 78.6 53.1 62.7 68.5 69.1 67.0 67.7 57.0 74.9 61.4JOHNNY CARINO’S/CARINO’S ITALIAN 66.4 16 70.8 50.3 73.9 71.6 62.8 65.2 64.7 58.5 71.3 63.5
OVERALL OVERALL CASUAL FOOD MENU LIKELY TO LIKELY TO CHAIN SCORE* RANK QUALITY VALUE CLEANLINESS SERVICE VARIETY REPUTATION ATMOSPHERE CRAVEABILITY RECOMMEND RETURN
ITALIAN/PIZZA
VARIED MENU
ROMANO’S MACARONI GRILL
BONEFISH GRILL
TEXAS ROADHOUSE
THE CHEESECAKE FACTORY
COMPLETE RANKINGS BY SUBSEGMENT (BLUE BOLDFACE: HIGHEST SCORE IN ATTRIBUTE CATEGORY)
CASUAL-DINING RESTAURANTS
OVERALL OVERALL CASUAL FOOD MENU LIKELY TO LIKELY TO CHAIN SCORE* RANK QUALITY VALUE CLEANLINESS SERVICE VARIETY REPUTATION ATMOSPHERE CRAVEABILITY RECOMMEND RETURN
THE CHEESECAKE FACTORY 74.2 1 83.5 43.3 81.6 73.6 81.6 83.3 73.1 66.8 77.8 62.4 THE MELTING POT 73.0 2 78.9 48.7 75.1 76.4 63.2 79.7 80.8 69.6 74.9 55.4NINETY NINE RESTAURANT & PUB** 69.9 8 73.7 65.9 72.3 73.5 69.8 69.7 65.9 63.9 73.5 71.1
CHEVYS FRESH MEX 68.9 10 69.0 60.2 70.6 72.2 68.5 68.2 63.6 65.5 71.6 62.9 P.F. CHANG’S CHINA BISTRO 68.3 11 74.5 40.6 75.3 67.2 70.1 74.9 73.4 63.1 71.7 60.1 BJ’S RESTAURANT & BREWHOUSE 68.0 12 75.8 45.0 74.3 66.5 77.5 68.8 70.8 55.3 72.1 66.4 MIMI’S CAFE 66.9 14 75.4 55.2 65.8 73.3 71.0 67.4 66.2 58.1 66.2 61.5 GENGHIS GRILL** 66.2 17 71.1 53.2 68.6 62.3 66.7 63.6 63.9 72.3 72.5 67.9 CHEDDAR’S SCRATCH KITCHEN 66.0 18 72.5 59.2 69.4 65.2 67.6 68.5 65.9 52.2 68.9 57.3 HARD ROCK CAFE 65.9 19 68.5 52.5 66.1 66.3 59.2 73.4 75.2 60.4 66.3 59.1 OLD CHICAGO PIZZA & TAPROOM 65.6 20 68.1 50.5 64.7 69.9 68.3 65.5 65.0 64.6 69.4 62.4 CALIFORNIA PIZZA KITCHEN 63.1 25 77.8 39.4 66.0 65.7 62.3 65.6 58.8 60.3 64.9 59.4 O’CHARLEY’S 62.7 26 73.5 47.8 66.2 60.4 64.5 62.2 60.1 55.6 70.3 62.9 RED ROBIN GOURMET BURGERS & 62.3 27 73.7 42.1 64.9 67.0 62.8 61.1 59.8 60.8 63.6 56.4 FAMOUS DAVE’S 61.8 28 71.6 46.5 58.7 64.4 58.8 66.4 62.9 58.1 62.5 50.8 TGI FRIDAYS 61.6 29 66.5 49.3 63.5 68.0 67.9 62.1 54.6 50.5 65.9 60.6 BEEF ‘O’ BRADY’S** 60.4 30 60.1 57.9 65.6 64.1 58.0 56.8 57.5 49.6 69.3 65.0 APPLEBEE’S NEIGHBORHOOD GRILL 58.8 31 65.7 45.4 62.1 61.1 63.4 60.1 58.0 46.9 62.4 56.1 SONNY’S REAL PIT BAR-B-Q** 58.3 32 69.8 58.5 56.0 50.7 47.6 64.0 48.3 59.8 69.2 59.3 HOOTERS 58.0 33 55.3 46.5 58.3 68.0 46.8 64.6 70.0 49.9 57.6 56.3 DAVE & BUSTER’S 57.3 34 54.2 37.9 58.2 58.9 60.7 62.3 69.6 48.8 66.2 55.3 CHILI’S GRILL & BAR 56.8 35 62.8 42.0 56.2 60.4 67.1 55.7 51.3 49.1 63.0 56.5UNO CHICAGO GRILL/UNO PIZZERIA 56.7 36 63.5 42.9 62.5 59.8 56.6 54.8 55.9 49.1 64.2 57.9ON THE BORDER MEXICAN GRIL 56.3 37 58.1 45.4 58.1 54.7 62.4 53.4 55.7 53.8 62.5 50.0 RUBY TUESDAY 55.7 38 62.5 40.7 56.6 59.3 61.9 53.0 55.2 48.0 60.3 50.9 BUFFALO WILD WINGS GRILL & BAR 54.3 40 58.5 38.3 55.2 58.3 45.9 59.0 59.7 52.7 56.1 53.6
THE CHEESECAKE FACTORY THE MELTING POT NINETY NINE RESTAURANT & PUB ** CHEVYS FRESH MEX P.F. CHANG’S CHINA BISTRO BJ’S RESTAURANT & BREWHOUSE MIMI’S CAFE GENGHIS GRILL ** CHEDDAR’S SCRATCH KITCHEN
HARD ROCK CAFE OLD CHICAGO PIZZA & TAPROOM CALIFORNIA PIZZA KITCHEN
O’CHARLEY’S RED ROBIN GOURMET BURGERS & BREWS FAMOUS DAVE’S TGI FRIDAYS BEEF ‘O’ BRADY’S ** APPLEBEE’S NEIGHBORHOOD GRILL & BAR SONNY’S REAL PIT BAR-B-Q ** HOOTERS DAVE & BUSTER’S CHILI’S GRILL & BARUNO CHICAGO GRILL/UNO PIZZERIA & GRILLON THE BORDER MEXICAN GRILL & CANTINA RUBY TUESDAY BUFFALO WILD WINGS GRILL & BAR
ALL PHOTOS COURTESY OF THE RESPECTIVE RESTAURANT COMPANIES

86 | NRN.COM | APRIL 4, 2016
1. Cracker Barrel Old Country Store TOP SCORES: Service • Reputation • Atmosphere
2. First Watch** TOP SCORES: Cleanliness • Likely to Recommend
3. Shari’s Cafe and Pies** TOP SCORES: Menu Variety • Likely to Return
4. Original Pancake House TOP SCORES: Food Quality • Craveability
5. Bob Evans Restaurants
6. Shoney’s TOP SCORE: Value
7. Coco’s Bakery Restaurant8. Johnny Rockets9. IHOP10. Big Boy11. Perkins Restaurant & Bakery12. Village Inn13. Huddle House**14. Denny’s15. Friendly’s16. Waffle House
CRACKER BARREL OLD COUNTRY STORE 68.0 72.4 53.8 70.4 70.9 72.0 73.6 69.0 58.5 70.5 58.0 FIRST WATCH ** 65.5 72.0 50.7 70.5 64.9 66.8 72.5 59.6 53.8 72.0 59.0 SHARI’S CAFE AND PIES ** 64.3 58.4 53.3 66.3 67.8 72.5 62.0 61.7 60.3 67.7 65.2
ORIGINAL PANCAKE HOUSE 64.0 76.5 59.3 59.1 65.9 65.9 63.8 52.9 60.7 66.1 59.3 BOB EVANS RESTAURANTS 62.9 67.0 57.6 65.9 64.5 69.3 64.3 53.6 50.4 69.0 64.4 SHONEY’S 61.0 62.7 60.6 62.0 65.9 64.9 56.4 51.9 54.3 65.1 55.2 COCO’S BAKERY RESTAURANT 59.9 61.4 46.3 68.2 62.8 62.8 56.8 53.4 53.2 67.4 59.9 JOHNNY ROCKETS 57.3 61.3 44.6 58.8 64.1 56.6 54.5 59.6 53.7 55.5 48.3 IHOP 57.2 61.0 49.3 54.6 59.0 65.9 57.4 47.8 57.7 63.5 54.2 BIG BOY 55.4 57.6 52.1 54.0 57.8 55.4 60.2 48.8 51.7 58.8 57.8 PERKINS RESTAURANT & BAKERY 55.0 52.0 49.1 62.4 60.8 64.9 52.0 44.2 48.0 55.9 54.6 VILLAGE INN 54.2 51.4 56.6 54.3 59.6 64.8 51.1 44.7 45.4 55.2 51.8 HUDDLE HOUSE ** 52.9 53.1 52.8 53.0 57.1 54.2 46.3 43.7 48.9 61.6 56.2 DENNY’S 51.9 51.7 56.3 49.2 55.5 65.4 46.2 41.0 44.0 51.8 52.8 FRIENDLY’S 48.6 50.2 47.2 53.5 47.6 50.2 47.3 35.6 46.2 55.3 53.6 WAFFLE HOUSE 42.9 40.0 57.5 32.7 46.5 46.5 34.8 31.1 46.0 49.9 56.1
OVERALL FOOD MENU LIKELY TO LIKELY TO CHAIN SCORE* QUALITY VALUE CLEANLINESS SERVICE VARIETY REPUTATION ATMOSPHERE CRAVEABILITY RECOMMEND RETURN
ORIGINAL PANCAKE HOUSE
COMPLETE RANKINGS (BLUE BOLDFACE: HIGHEST SCORE IN ATTRIBUTE CATEGORY)
1. Cracker Barrel Old Country Store
*OVERALL SCORES ARE AN AVERAGE OF ATTRIBUTE SCORES, EXCEPT FOR LIKELY TO RETURN, AND ARE WEIGHTED BY ATTRIBUTE IMPORTANCE. ATTRIBUTE SCORES REFLECT THE PERCENT OF RESPONDENTS WHO SAID A CHAIN WAS “OUTSTANDING” OR “ABOVE AVERAGE” IN THAT AREA. LIKELY TO RETURN SCORES REFLECT THE PERCENT OF RESPONDENTS WHO SAID THEY “DEFINITELY” OR “PROBABLY” WILL VISIT A CHAIN AGAIN. **120-149 RESPONSES
ALL PHOTOS COURTESY OF THE RESPECTIVE RESTAURANT COMPANIES
1. Morton’s the Steakhouse TOP SCORES: Atmosphere • Craveability • Value
2. Ruth’s Chris Steak House TOP SCORES: Food Quality • Cleanliness • Service •
Menu Variety • Reputation • Likely to Recommend
3. The Capital Grille**
TOP SCORE: Likely to Return
4. Fleming’s Prime Steakhouse & Wine Bar
5. McCormick & Schmick’s**
1. Morton’s the Steakhouse
OVERALL FOOD MENU LIKELY TO LIKELY TO CHAIN SCORE* QUALITY VALUE CLEANLINESS SERVICE VARIETY REPUTATION ATMOSPHERE CRAVEABILITY RECOMMEND RETURN
MORTON’S THE STEAKHOUSE 79.9 84.1 68.8 82.3 82.8 73.9 75.9 84.8 79.6 79.6 70.7 RUTH’S CHRIS STEAK HOUSE 79.7 91.5 53.5 87.0 84.8 75.0 82.0 80.3 74.0 82.5 70.1 THE CAPITAL GRILLE ** 75.9 84.9 62.0 76.3 82.3 72.6 76.0 75.0 68.6 77.5 71.4
FLEMING’S PRIME STEAKHOUSE & WINE BAR 75.7 83.0 58.6 80.2 75.1 72.4 75.8 75.5 75.4 77.7 71.3 McCORMICK & SCHMICK’S ** 75.0 77.1 61.5 75.4 79.8 71.5 81.6 78.8 70.2 72.5 64.8
FINE DINING
COMPLETE RANKINGS (BLUE BOLDFACE: HIGHEST SCORE IN ATTRIBUTE CATEGORY)
RUTH’S CHRIS STEAK HOUSE
FAMILY DINING
BRANDS RANKED BY OVERALL SCOREFAMILY-DINING AND FINE-DINING RESTAURANTS

88 | NRN.COM | APRIL 4, 2016
BRANDS LISTED RECEIVED THE HIGHEST OVERALL SCORES ACROSS ALL SEGMENTS PHOTOS: THINKSTOCK
Men and women have a lot in common in their restaurant preferences.They care a lot about FOOD QUALITY, SERVICE, CLEANLINESS and VALUE
But there are some differences.
DEMOGRAPHIC TRENDS
WOMEN
Women care even more than men (who already care a lot) about CLEANLINESSWomen tend to favor SAVORY restaurants.These are the brands women like best:• The Cheesecake Factory• P.F. Chang’s China Bistro• Chick-fil-A• Carrabba’s Italian Grill• Red Lobster
And men care more than women whether a restaurant was likely to be RECOMMENDED Men have more of a SWEET tooth. These are the brands men like best:• Ben & Jerry’s• The Melting Pot• Bonefish Grill• Johnny Carino’s/ • Carino’s Italian• Häagen-Dazs
THE GENDER GAP
MEN
Consumer Picks respondents rated the survey’s attributes by importance and also scored their favorite brands, and results were then categorized by demographic group. Insights represent areas where importance rankings between groups differed by a statistically significant margin (+/- 5 points).

90 | NRN.COM | APRIL 4, 2016
BRANDS LISTED RECEIVED THE HIGHEST OVERALL SCORES ACROSS ALL SEGMENTS PHOTOS: PEOPLE & LOBSTER: THINKSTOCK; CAKE: THE CHEESECAKE FACTORY; TACOS: RUBIO’S
Restaurant consumers of all ages have a lot in common on restaurant preferences. They all care a lot about:FOOD QUALITY, CLEANLINESS, VALUE and SERVICE
But brand preferences vary widely.Here’s a look at what restaurant brands resonate most with consumers of various age groups.
DEMOGRAPHIC TRENDS
Customers in their teens and early twenties gave the highest scores to Casual- and Family-Dining brands.
• Red Lobster
• Cracker Barrel Old Country Store
• First Watch
Brands specializing in sweet treats had the highest scores among customers in their late 20s, 30s and early 40s.
• Häagen-Dazs
• Ben & Jerry’s
• Ninety Nine Restaurant & Pub
Middle-aged consumers favored savory Casual- Dining chains, but their top-ranked brand is also known for its signature desserts.
• The Cheesecake Factory
• Romano’s Macaroni Grill
• Olive Garden
For the oldest consumers in the survey, Limited- Service chains took the top scores.
• Rubio’s• Corner Bakery Cafe
• Jet’s Pizza
THE IMPACT OF AGE
AGES 18-24 AGES 25-44 AGES 45-64 AGES 65-75

92 | NRN.COM | APRIL 4, 2016
PHOTOS: THINKSTOCK
Consumers in all income groups care relatively equally about:FOOD QUALITY, CLEANLINESS, SERVICE,MENU VARIETY, REPUTATION, CRAVEABILITY
DEMOGRAPHIC TRENDS
LESS THAN $50,000 A YEAR
• Ben & Jerry’s• The Melting Pot• Cracker Barrel Old Country Store
MORE THAN $100,000 A YEAR• Häagen-Dazs• The Cheesecake Factory• Shari’s Cafe and Pies
$50,000-$99,999 A YEAR• In-N-Out Burger• The Melting Pot• First Watch
MONEY MATTERS
Household income had a big impact on brand preferences as well.
Here are the top-scoring Limited-Service, Casual-Dining and Family-Dining brands in each income bracket:
Consumers in the lower income group care more about VALUE than those in higher income brackets.
Consumers in the higher income group care more about whethera brand is likely to be RECOMMENDED
EARN LESS THAN $50K A YEAR
EARN MORE THAN $100K A YEAR
But there are a few areas where their preferences diverge.

94 | NRN.COM | APRIL 4, 2016
Understanding the numbers
The Consumer Picks survey, now in its sixth year, is a joint venture of WD Partners and Nation’s Restaurant News. Each year, the number of brands reviewed in the survey
has grown, creating a more complete picture of restaurant brand strength and customer preferences.
This year’s report includes 173 brands, one more than last year — newcomer Pollo Tropical — and 34 more chains than the first survey in 2011.
Importantly, the survey instrument itself has remained consistent allow-ing for multi-year comparisons, which enable users to gain insight to a brand’s increasing — or decreasing — compet-itive position in the perspective of the consumer.
Interpreting the resultsIn Consumer Picks — or any other statistical survey of its type — small differences in ratings are not materi-al and closely ranked ratings should
be considered statistically equiva-lent. When two or more brands ap-pear tied in the report with similar scores, the order of listing is based on the next level of decimal point(s).
One question I am often asked is why the Overall Score is not the math-ematical average of a brand’s reported individual attribute scores. The an-swer is that the Overall Score for each brand is calculated by weighting attri-butes by how important respondents say they are to the dining experience. This gives us an Overall Score for each evaluation that more accurately re-flects how the person rates the brand. These weighted individual overall scores are then used to obtain the brand’s average Overall Score.
For more information on how the survey is conducted, see the detailed methodology below.
Drawing comparisonsAs in prior years, brands are grouped into four major categories: Limited
Service, Casual Dining, Fine Dining and Family Din-ing. Both Limited Service and Casual Dining have a number of subcategories by menu focus. The survey’s design allows a user to com-pare any brand to any other subsegment within the larg-er segment, without loss of accuracy, so long as they do not compare across the four main segments. Crossing these primary categories will introduce some error in the overall scores, as they are weighted by the importance attributes for their respective segments.
To do a multi-year comparison, do not look just at the difference in a brand’s scores from year to year, as you run the risk of drawing incorrect conclusions. This approach does not take into account the time difference between the two studies as well as so-cial factors that took place during the
year that may have impact-ed consumers’ responses. A better process is to compare one brand’s performance against the average score for an identical group of com-petitors for both this year and prior years.
Another option is to consider the difference in ranking from year to year. However, this approach will lose some of the insights as to the magnitude of year-to-changes.
A copy of survey results can be downloaded at NRN.com, and addi-tional materials are also available from WD Partners.
WD Partners and NRN hope you find Consumer Picks 2016 to be a useful and valuable tool. n
Dennis Lombardi is a consultant to WD Partners on the Consumer Picks project and president of Insight Dynamics LLC.
METHODOLOGY
The Consumer Picks survey was developed by WD Partners’ Insights group and is designed to pro-vide relative benchmarks on major attribute ratings
across restaurant brands.The survey was conducted online in January, and
respondents were given a list of restaurant chains orga-nized into groups depending on the chain’s service model and the respondent’s location. Respondents were asked to identify which restaurants they had patronized in the last six months, or since July 1, 2015, and how many times they visited during that time period. Respondents were then asked to rate their experiences for up to eight of the restaurants they had patronized in that six-month period. The six-month time frame is designed to increase the likelihood of reasonable recall by respondents and ensure that respondents would represent a broad range of consumers.
Responses were screened for inconsistent answers; “straight lining,” or selecting the same response repeat-edly; and excessive haste in completing the questionnaire. This scrubbing process reduced the number of acceptable
responses to 4,805 from a total of 5,171. The 173 restau-rant chains in this year’s Consumer Picks received a total of 37,339 individual ratings from those respondents.
Restaurants that received fewer than 100 ratings are not included in this report. This year all the included restaurant brands had 120 or more ratings. The restau-rant brands with 120 to 149 responses are noted in rankings with a “**”. All other brands had 150 or more responses. Seventy-eight restaurant brands had 200 or more respondents.
The questionnaire was designed and tested by WD Partners. To administer it, the firm worked with Instantly Inc., which supplied panel respondents, and SurveyGiz-mo, which provided the survey administration software.
The survey addresses ten attributes: Atmosphere, Cleanliness, Craveability, Food Quality, Likelihood to Rec-ommend, Likelihood to Return, Menu Variety, Reputation, Service and Value.
Results are shown as the percentage of top-two-box ratings received, based on a standard five-box scale. For most attributes, scores are the percentage of respondents who said a brand was “outstanding” or “above average” in that area. For Likely to Return and
Likely to Recommend, scores are the percentage re-spondents who “definitely” or “probably” will recom-mend the brand or visit again. Brands’ Overall Scores are a weighted average of attribute scores, weighted by the importance of each attribute to customers in their respective segments.
Restaurant chains with similar scores should be consid-ered statistically equivalent.
Demographic information on the respondents was ob-tained to align the survey results with the U.S. population based on reports from the U.S. Census Bureau’s 2015 Current Population Survey.
Detailed data is available for purchase, and additional survey results such as percentage of top-box scores and custom data analysis are available by contacting Mary Rea at [email protected].
WD Partners is a Dublin, Ohio-based firm specializing in the customer experience that helps global food and retail brands innovate through strategy and design. Research conducted by WD Partners’ Insights group is part of the company’s integrated approach to enhancing the perfor-mance of foodservice brands.
DennisLombardi
INSIGHTS AND METHODOLOGY


![letscount.hocext.co.uk · Web viewSplotch loves art, Doc loves history, Digit loves maths, Scribble loves English and Scout loves geography. [Enter school name] is taking part in](https://img.dokumen.tips/doc/110x75/6148dd5c2918e2056c22f771/web-view-splotch-loves-art-doc-loves-history-digit-loves-maths-scribble-loves.jpg)