Embed Size (px)
Citation preview

FACULTY OF BIOSCIENCE ENGINEERING
Academic year 2011-2012
Consumer perception on environmental information on food labels
Promoter : Prof. dr. ir. Wim Verbeke
Co-promoter: Dr. ir. Zuzanna Pieniak
Tutor : Ir. Ellen Van Loo
Student : Nguyen Hoang Diem My
Master’s dissertation submitted in partial fulfillment of the requirements for the degree of Master of Science in Nutrition and Rural Development, main subject:
Rural Economics and Management

Master’s Dissertation Declaration/Copyright I, Nguyen Hoang Diem My, certify that this master’s dissertation is my original works and
there is no previous submission for a degree or other purposes, which have been made here or
elsewhere. Other sources of information, which have been used, are acknowledged by the list
of references to the corresponding authors. Permission for consulting or copying parts of the
Master’s Dissertation for personal use is given by the author and the promoters. Use of the
Master’s Dissertation for other purposes is subject to the copyrights laws, more specifically it
is obligatory to cite the source when using Master’s Dissertation results.
The Master’s Dissertation was done under the guidance of Prof. dr. ir. Wim Verbeke, Dr. ir.
Zuzanna Pieniak, and Ir. Ellen Van Loo, at Ghent University.
Gent, 20 August 2012
PROMOTER
Prof. dr. ir. Wim VERBEKE
Signature: ...............................................
Email: [email protected]
CO-PROMOTER
Dr. ir. Zuzanna PIENIAK
Signature:
...............................................
Email: [email protected]
TUTOR
Ir. Ellen VAN LOO
Signature:
..............................................
Email: [email protected]
AUTHOR
Nguyen Hoang Diem My
Signature:
..............................................
Email: [email protected]

i
ABSTRACT
Objective
The objective of the master’s dissertation is to investigate the consumers’ perception towards
environmental information on food labels, more specific on organic information. Four
research questions were established. Firstly, how consumers recognize, use, understand the
organic logos on food labels. Secondly, how consumers rank for environmental information
on food labels. Thirdly, how consumers express their attitude and behaviour towards this
information. Finally, how much consumers are willing to pay for buying yoghurt with
environmental information on its label.
Methodology
The data was collected via a cross-sectional consumer survey in the Northern Dutch speaking
part of Belgium (Flanders) in March 2012 and to be analyzed by using SPSS 19.0. First, the
construct validity of attitude and behavioural items was checked. Then, other tests such as
descriptive, independent sample T-test, cross tabulation, one-way ANOVA, correlation,
regression, and cluster analysis were applied to test the hypotheses of the study.
Findings
Consumers were more aware of Belgian “Biogarantie” logo in comparison to the EU organic
logo, which resulted from the fact that EU organic logo has been introduced recently.
Consumers’ attitude, intention and behaviour towards organic yoghurt were explored. Women
had a higher frequency of buying organic yoghurt and were considered to use organic logos
more often than men when buying yoghurt.
Next, consumers’ eating intention and purchase frequency of organic yoghurt are mostly
determined by the frequency of using of organic logos. In addition, consumers’ attitude
towards organic yoghurt, which in turn influences the frequency of purchasing, was affected
by “taste”, then followed by “healthiness”, “trustworthiness” (i.e. consumers’ belief that those
items of organic yoghurt was worse/better than conventional yoghurt).
Furthermore, three segments were identified based on the consumers’ concerns variables.
Those segments include “low concerned consumers”, “medium concerned consumers”, and
“very concerned consumers”. The “very concerned consumers” showed more positive
attitude, stronger belief that organic yoghurt is better than conventional yoghurt in terms of
“taste”, “healthiness”, “quality”, “trustworthiness”. In addition, the “very concerned
consumers” used organic logos more often, had higher perceived consumer effectiveness

ii
(PCE) and higher buying frequency of organic yoghurt in comparison to the other two groups.
Finally, on average, consumers were willing to pay €0.33 (22%) extra for a yoghurt with an
organic label.
Research implications/limitations
Communication actions should focus to increase the use of organic logos when buying
yoghurt via an informational campaign targeted to those who are never or not frequently use
of organic logos. In addition, it is important to strengthen consumers’ belief that organic
yoghurt is tastier, healthier, more trustworthy than conventional yoghurt through a
promotional campaign to enhance the attitude of consumers towards organic yoghurt.
Furthermore, food marketers were suggested to increase the purchase frequency especially for
the low and medium concerned segments by promoting the use of organic logos, and
enhancing the consumers’ belief that their actions could contribute for a positive change in the
environment (i.e. PCE).
The Master’s Dissertation has some limitations including the generalization of the results to
other products or other countries, and the use of self-reported technique. Future research to
explore actual perception and behaviour of the consumers towards more specific types of
organic yoghurt (e.g. drinking or spoon, low fat, fruit or plain organic yoghurt) is
recommended.
Keywords
Food, Labels, Logos, Consumer, Attitude, Intention, Behaviour, Consumers’ concerns,
Organic, Environmental, WTP

iii
ACKNOWLEDGEMENT
I would like to express my sincere gratitude to my promoter Prof. dr. ir. Wim Verbeke for
creating the excellent conditions, especially the financial support for the data collection for
my research, as well as giving me a very precious opportunity to work in a professional
environment with excellent experts. His precious academic advices have given great values
for me to complete this master’s dissertation.
My very special thank you to my co-promoter dr. ir. Zuzanna Pieniak and my tutor ir. Ellen
Van Loo. You are the most enthusiastic and wonderful experts that I have worked with. I
would like to say that working with you is the precious opportunity that I have had in my life.
Thank you for guiding me steps by steps, giving and stimulating me great academic ideas,
encouraging me all the time that I have made my master’s dissertation.
In addition, I would like to say thank you to all lecturers in the Division of Agro Food
Marketing, who had given me useful advices during the students’ master’s dissertation
meetings, especially dr. ir. Filiep Vanhonacker who helped me with valuable advices for the
literature as well as technical analysis.
I wish to send my special thank you to my coordinators Mie and Marian. You are the most
honest, enthusiastic, helpful coordinators that I have had. Thank you for always helping me
during the two years studying at Ghent University. Especially, I would like to send my
warmly thank you to my coordinator Mie, who always encourages me, gives me precious
advices for studying and for living in Gent.
The financial support from the Belgian Technical Cooperation (the BTC) for giving me the
opportunity to do the master program in Belgium is sincerely acknowledged.
Finally, I would like to say thank you to my family and my friends for always being with me,
encouraging me in my life.

iv
TABLE OF CONTENTS
ABSTRACT ............................................................................................................................... i
ACKNOWLEDGEMENT ........................................................................................................ iii
TABLE OF CONTENTS ......................................................................................................... iv
LIST OF TABLES .................................................................................................................. vii
LIST OF FIGURES ................................................................................................................ viii
LIST OF ABBREVIATIONS .................................................................................................. ix
Chapter 1 Introduction ............................................................................................................... 1
1.1 General introduction, Problem identification, Research objectives .................................... 1
1.1.1 General introduction and Problem identification ............................................................. 1
1.1.2 Research Objectives ......................................................................................................... 1
1.2 Conceptual framework of study .......................................................................................... 2
1.2.1 The position of “product label” in the consumer decision-making process ..................... 2
1.2.2 Aspects influence the behaviour of the consumer ............................................................ 3
Chapter 2 Literature Study ........................................................................................................ 4
2.1 General information on food labels ..................................................................................... 4
2.1.1 The importance of food labels to consumers .................................................................... 4
2.1.2 The regulations of EU food labeling ................................................................................ 4
2.1.3 Problem of overloading information ................................................................................ 5
2.2 Theory related to environmental information on food labels .............................................. 5
2.3 Consumer perception on environmental information on food labels .................................. 6
2.3.1 Consumers’ recognition, knowledge and ability to understand environmental information on food labels ......................................................................................................... 6
2.3.1.1 Consumers’ recognition and knowledge of environmental information on food labels 6
2.3.1.2 Consumers’ ability to understand environmental information on food labels .............. 7
2.3.2 Consumer priority ranking for environmental information on food labels ...................... 8
2.3.3 Consumers’ attitude and behaviour towards environmental information on food labels . 9

v
2.3.3.1 Frequency of buying and consumption ......................................................................... 9
2.3.3.2 Attitude and behaviour of consumers towards environmental attributes on food labels10
2.3.4 Consumers’ willingness to pay for environmental labeling food products .................... 14
2.3.4.1 Results of consumers’ WTP from previous studies .................................................... 14
2.3.4.2 Factors affecting consumers’ WTP ............................................................................. 14
2.3.4.3 Methods of calculating of the WTP ............................................................................. 15
Chapter 3 Materials and Methods ............................................................................................ 16
3.1 Data collection and participants ........................................................................................ 16
3.2 Measures ............................................................................................................................ 17
3.2.1 Consumers’ recognition, use and understanding of the food labels ............................... 17
3.2.2 Consumption behaviour .................................................................................................. 18
3.2.3 Attitude and organic food involvement .......................................................................... 18
3.2.4 Consumers’ willingness to pay ....................................................................................... 20
3.3 Data analysis ...................................................................................................................... 21
3.3.1 Framework of the hypotheses ......................................................................................... 21
3.3.2 Research questions and hypotheses of the study ............................................................ 22
3.3.2.1 Research questions ...................................................................................................... 22
3.3.2.2 Hypotheses of the study ............................................................................................... 22
3.3.3 The statistical methods ................................................................................................... 23
Chapter 4 Results and Discussion ........................................................................................... 24
4.1 Recognition, understanding of the organic logos .............................................................. 24
4.2 Ranking .............................................................................................................................. 25
4.3 Attitude and behaviour ...................................................................................................... 28
4.3.1 Construct validity ........................................................................................................... 28
4.3.2 Use of organic logos when buying yoghurt .................................................................... 30
4.3.2.1 Consumers’ possible motives and barrier depending on User categories ................... 30
4.3.2.2 Consumers’ concerns and involvement depending on User categories ...................... 32
4.3.2.3 Consumers’ perceived behavioural control depending on User categories ................. 32
4.3.2.4 Consumers’ behavioural intention, frequency of consumption and frequency of buying depending on User categories ...................................................................................... 32

vi
4.3.3 Correlation analysis ........................................................................................................ 32
4.3.3.1 Correlation matrix of “general attitude” and belief items ........................................... 32
4.3.3.2 Correlation matrix of “frequency of buying” and other variables ............................... 33
4.3.4 Attitudinal and behavioural variables depending on socio demographic characteristics35
4.3.4.1 The frequency of using organic logos by gender ........................................................ 35
4.3.4.2 Behavioural variables depending on socio demographic characteristics .................... 35
4.3.5 Regression Analysis ....................................................................................................... 36
Theoretical framework ............................................................................................................ 36
Model 1 .................................................................................................................................... 37
Model 2 .................................................................................................................................... 38
Model 3 .................................................................................................................................... 39
Discussion of the three models ................................................................................................ 41
4.3.6 Cluster analysis ............................................................................................................... 42
4.3.6.1 Means rating of the segments on the classification variables ...................................... 42
4.3.6.2 Profile of the segments on attitude and behaviour variables ....................................... 43
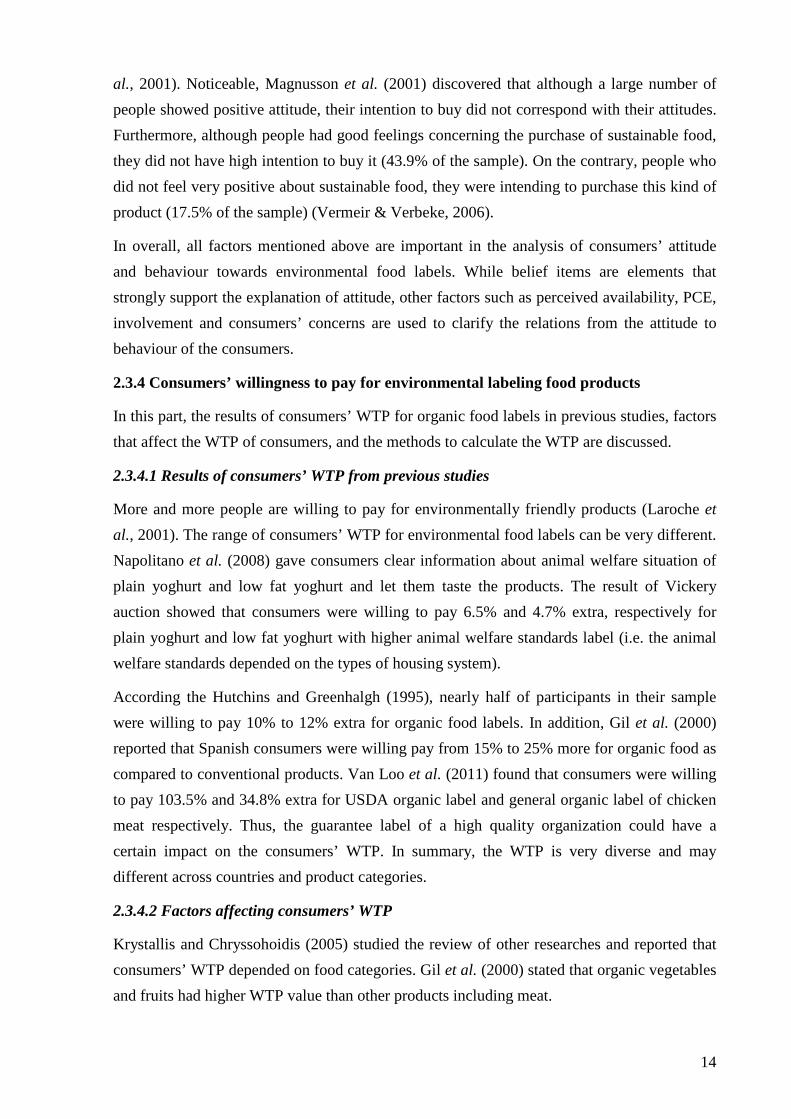
4.3.6.3 Socio demographics profile of the segments ............................................................... 45
4.3.7 Willingness to pay .......................................................................................................... 46
4.3.7.1 Consumers’ WTP value ............................................................................................... 46
4.3.7.2 Percentage of respondents for each level of the WTP ................................................. 47
4.3.7.3 Consumers’ WTP depending on User categories ........................................................ 47
4.3.7.4 Consumers’ WTP depending on socio demographics characteristics ......................... 48
4.3.7.5 Correlation of consumers’ WTP and other attitudinal and behavioural variables ...... 48
4.4 Location of buying ............................................................................................................ 50
4.5 Confirmation of the hypotheses ......................................................................................... 50
Chapter 5 Conclusions ............................................................................................................. 52
References ............................................................................................................................... 55
Appendix 1
Appendix 2

vii
LIST OF TABLES
Table 3.1 Socio demographic characteristics of the sample .................................................... 16
Table 3.2 Hypotheses of the study .......................................................................................... 22
Table 4.1 Consumers’ recognition of EU organic logo and Belgian “Biogarantie” logo ....... 24
Table 4.2 Consumers’ understanding of the meaning of EU organic logo ............................. 25
Table 4.3 Percentage of respondents for the frequency of objective knowledge .................... 25
Table 4.4 Correlation between “Environmental friendliness” and “Provided with an organic label” ........................................................................................................................................ 27
Table 4.5 Mean value of some variables used in the study ..................................................... 27
Table 4.6 Factor loading and reliability estimates for construct measures related to consumers’ concerns................................................................................................................ 29
Table 4.7 Consumers’ possible motives, barrier, concerns, perceived behavioural control and behaviour depending on User categories ................................................................................. 31
Table 4.8 Correlation matrix of “general attitude” and belief items ....................................... 34
Table 4.9 Correlation matrix of “frequency of buying” and other variables ........................... 34
Table 4.10 Consumers’ behaviour depending on gender and responsible food shoppers ....... 35
Table 4.11 Regression result of Model 2 if include PCE ........................................................ 38
Table 4.12 Correlation of PCE with other items that significant in Model 2 .......................... 39
Table 4.13 Multiple linear regression results of the three models .......................................... 40
Table 4.14 Means rating of the segments on the classification variables................................ 42
Table 4.15 Profile of the segments on attitude and behaviour variables ................................. 44
Table 4.16 Socio demographics profile of the segments ......................................................... 46
Table 4.17 Consumers’ WTP value ......................................................................................... 46
Table 4.18 Consumers’ WTP across User categories.............................................................. 48
Table 4.19 Consumers’ WTP across Gender........................................................................... 48
Table 4.20 Correlation matrix of consumers’ WTP and other variables ................................. 49
Table 4.21 Mean scoring for appropriate location of buying organic yoghurt........................ 50
Table 4.22 Confirmation of the hypotheses of the study ......................................................... 51

viii
LIST OF FIGURES
Figure 1.1 The position of “product label” in the consumer decision-making process ............ 2
Figure 1.2 Individual characteristics in shaping consumer decision-making ........................... 3
Figure 2.1 Conceptual framework of the perception of consumer on environmental information on food labels ......................................................................................................... 6
Figure 2.2 Conceptual framework for analyzing attitude and behaviour of consumers towards environmental information on food labels .............................................................................. 10
Figure 2.3 Framework for the analysis of consumers’ concerns ............................................ 13
Figure 3.1 Framework of the hypotheses ................................................................................ 21
Figure 4.1 Ranking the importance of product attributes ....................................................... 26
Figure 4.2 The distribution of male and female across User categories of organic logos ...... 35
Figure 4.3 Theoretical framework of regression models ........................................................ 36
Figure 4.4 Relations of regression models .............................................................................. 37
Figure 4.5 Willingness to pay extra for 500 g yoghurt with an organic label compared to one without (reference price €1.5) for each level ........................................................................... 47

ix
LIST OF ABBREVIATIONS
Abbreviations Meaning
BE Belgium
EU European Union
EEC European Economic Community
GMO Genetic modified organism
PBC Perceived behavioural control
PCE Perceived consumer effectiveness
SD Standard deviation
SE Standard error
VIF Variance inflation factor
WTP Willingness to pay

1
Chapter 1 Introduction
1.1 General introduction, Problem identification, Research objectives
1.1.1 General introduction and Problem identification
Food labeling has become more important in supplying information for the consumers to
make their buying decision (Verbeke, 2005). The labeling of food can be seen at the three
levels including consumers’ usage, companies’ practices, and the government policies and
regulations for those labels. The focus on consumers’ perception on the food labels, especially
environmental aspects of the product was discussed.
The use of information on food labels is crucial to consumers since it helps consumers to
make informed decisions when buying an environmentally friendly product. Since
environmental concern has received more and more attention, consumers’ perception on
environmental information on food labels has not yet received adequate research as often as
other information such as nutrition facts, ingredients. Consequently, analyzing environmental
information on food labels in relation to consumer behaviour is considered very important in
giving possible solutions to increase the awareness and behaviour of consumers towards a
greener life. Thus, this master’s dissertation focuses on analyzing consumer perception
towards environmental information on food labels, more specific with organic food labels.
The total expenditure of Belgian households on organic food in 2010 was estimated with 421
million euro, a 20% increase compared to 2009 (GfK Panel Services Benelux, 2011) (Figure
A-1 ANNEX). On average, a Belgian spent €4.7 for buying organic dairy product including
organic yoghurt, which took the second place after vegetables with €6.6 per capita (Figure A-
2 ANNEX). In addition, organic dairy products had a market share of 1.7% in Belgium in the
total food spending of consumer in 2010 (Figure A-3 ANNEX). Furthermore, on average, the
price of organic yoghurt was 29% more expensive than the conventional yoghurt in 2010
(Figure A-4 ANNEX).
1.1.2 Research Objectives
Several research objectives were identified. Firstly, consumers’ recognition, use and
understanding of the environmental information on food labels were checked. Secondly,
consumers’ ranking for environmental food labels compared to other attributes was assessed.

2
Thirdly, consumers’ attitude and behaviour towards the use of environmental information as
well as the interaction of endogenous factors within attitudinal and behavioural items were
analyzed, which contains most of important contents of the study. Fourthly, the willingness to
pay of consumers for food product with environmental information on its label was
calculated. Furthermore, factors affecting the willingness to pay were examined. Socio
demographics characteristics were taken into account for further explanation of the results.
1.2 Conceptual framework of study
1.2.1 The position of “product label” in the consumer decision-making process
The position of “product label” in the consumer decision-making process is explored in the
Figure 1.1. The consumer decision-making process includes several steps such as problem
recognition, information search, alternative evaluation, and choice making (Engel et al.,
1968). The information search includes the internal and external search (Bettman, 1979). The
external search relates several sources namely personal sources, media sources, impersonal
and independent sources and product label (Pieniak, 2008). Thus, information from the
product label is considered as an external source which is used by the consumers during their
decision making. In addition, the consumers’ decision-making is affected by environmental
factors, person-related factors and properties of the food (Steenkamp, 1997; Verbeke, 1999).
(1) Steenkamp (1997), and Verbeke (1999); (2) Pieniak (2008); (3) Bettman (1979); (4) Engel et al. (1968)
Figure 1.1 The position of “product label” in the consumer decision-making process
Influencing factors
Environmental factors
Memory
Decision-making process Information processing
Properties of the food
Person-related factors
Problem recognition
External search
Choice/ behaviour
Alternative evaluation
Information search
Internal search
Personal sources
Media sources
Impersonal and independent sources
Product label
Use trust
(1)
(4)
(3)
(2)
(2)
(2)

3
1.2.2 Aspects influence the behaviour of the consumer
According to Engel et al. (1995), individual characteristics (see Figure 1.2) such as
consumers’ resource, the motivation and involvement of consumers, consumers’ knowledge,
the attitude of consumers, the personality, values and lifestyle of consumers, might explain
most of the consumers decision-making process.
Engel et al. (1995); (1) Pieniak (2008); (2) Bettman (1979)
Figure 1.2 Individual characteristics in shaping consumer decision-making
Consumer resource refers to the resources that consumers need to purchase the product such
as income level which could afford consumers to buy the product. Next, the motivation and
involvement of consumers to the product are different for each individual. Several types of
motivation could be seen such as health, safety, ethical, and environmental aspects. In
addition, the involvement level of consumers towards organic food was considered as an
important characteristic that could affect consumer perception towards this product.
Furthermore, the knowledge of consumers for the product is another factor that impacts on
consumer behaviour towards organic product. Finally, the attitude and behaviour variables are
very important to understand consumer perception on the environmental information on the
food labels. Based on the frame of individual differences (Figure 1.2) in the consumer
decision-making process, most of those variables were measured.
Need recognition
Information search
External search
Post purchase alternative evaluation
Satisfaction Divestment
Individual differences • Consumer resource • Motivation and
involvement • Knowledge • Attitude • Personality, values and
lifestyle
Environmental influences
Dissatisfaction
Pre-purchase Alternative evaluation
Purchase
Consumption
Product label
(2)
(1)

4
Chapter 2 Literature Study
The literature study consists of three parts. The first part introduces the general information on
food labels. The second part presents the theory related to environmental information on food
labels. The third part discusses consumer perception on environmental information on food
labels.
2.1 General information on food labels
In this part, the necessity of food labels, the regulations of EU food labeling and the problem
of overloading information are discussed respectively.
2.1.1 The importance of food labels to consumers
Providing food labeling information is very important to consumers as they have rights to
have accurate data on the food labels. According to the European Commission, consumers
must be provided with “easy access to understandable, relevant, credible information” through
many ways including labeling information on the products, websites, public organizations,
non-governmental organizations (Green paper on integrated product policy, 2001).
There are several reasons why label information is significant to consumers. Firstly, the
information on food labels can help consumers to understand and use products in a correct
way. Secondly, according to Gualiardo (2001), people should have the freedom access to
know what is present in their food, how these foods are produced and with which production
methods. This can be related to environmental aspects of food labels such as genetic modified
foods, and organic food. Thus, Gualiardo (2001) suggests that information on food labels
should be provided accurately, truthful to the consumers concerning the food products and the
production process. Thirdly, if consumers have adequate data from the labels, they can choose
the products according to their preferences and make their buying decision in an ideal way.
2.1.2 The regulations of EU food labeling
The EU has established the new regulation on the legislation of food labeling. This regulation
is applied for several types of information such as nutrition data of process food; origin of
fresh meat label; announcements for possible allergens in the ingredients; and the minimum
size of the text on the label. In addition, a new law has introduced with the combination of

5
two directives including the legislation for labeling, presentation and advertising of foodstuffs
(2000/13/EC), and the nutrition labeling for foodstuffs (90/496/EEC)1.
2.1.3 Problem of overloading information
A problem arising today is that consumers are given a huge amount of information through
many different sources such as advertising, logos, and labels. Therefore, firstly, they may
have difficulty to find the information that is actually significant to them. This problem relates
to the bounded rational characteristics of consumers, which means the limitation of cognitive
capability of people (Verbeke, 2005). Furthermore, consumers may not totally understand the
meaning of the labels, logos, symbols, and other information on products which leads to extra
costs for searching more information (Salaun & Flores, 2001). Thirdly, consumers may not
utilize the information from the labels under time pressure, thus the labels information does
not really support buyers much in direct shopping (Caswell & Padberg, 1992). When
consumers do not receive sufficient data as well as not having enough time, their ability to
process the information might be limited. Consequently, this problem may affect consumers’
purchase decision making.
2.2 Theory related to environmental information on food labels
According to Sirieix et al. (2011), environmental or sustainable food labels can include the
following characteristics: quality signs, organic signals, fair trade, low carbon food print,
natural, bio production, animal welfare and other information related to sustainable
consumption.
In this master’s dissertation, the focus is paid on two types of environmental information on
food labels, the EU organic logo and the private Belgian organic logo Biogarantie2.
The new organic logo of EU (Figure A-5, ANNEX) was applied as obligatory from July 2010
for all organic food packages of the countries in the EU. In addition, the old logo is still being
used from 1990s as voluntary basis. It is, however, gradually replaced by the new one
(Questions & answers on EU organic logo, 2010).
The Biogarantie logo of Belgium3 (Figure A-5, ANNEX) ensures that the product is
organically produced. In Belgium, this is controlled by Ecocert and Blik-Integra with the code
BE-1 and BE-2 respectively. The similar characteristic of the EU organic logo and
Biogarantie logo is that for process product, at least 95% of ingredients related agriculture are
organic. Examples of environmental food labels were provided (Figure A-5, ANNEX).
1 http://ec.europa.eu/food/food/labellingnutrition/foodlabelling/proposed_legislation_en.htm 2 http://www.bioforum.be/bio/fr/consommateurs.php?id=6 3 http://www.organic-bio.com/en/labels/

6
Belgium was classified as an emerging country according to the stage of organic market
development (Padel & Midmore, 2005) (Table A-1, ANNEX). The organic sales of Belgium
in 2008 was 305 million euro and the share of organic products of Belgium in the entire food
market of the Europe was 1.3% (Schaack, 2010) (Figure A-6 & Figure A-7, ANNEX). In
terms of the growth of organic farmland in Belgium4, the statistical data showed that, organic
farmland in 2010 in Flanders was 0.6% which consisted of 3,829 ha of the total 620,161 ha;
this figure in Wallonia in the same year was 6.02% which accounted for 44,878 ha of the total
747,840 ha. Remarkably, this growth was mostly due to the increase in the number of cattle
and poultry. More specifically, 84% of the 44,878 ha was grassland and belonged to the cattle
industry for extracting meat and dairy.
2.3 Consumer perception on environmental information on food labels
The framework of the study was presented in accordance to the four research questions of the
master’s dissertation (Figure 2.1).
Note: “env-label”: environmental label
Figure 2.1 Conceptual framework of the perception of consumer
on environmental information on food labels
2.3.1 Consumers’ recognition, knowledge and ability to understand environmental
information on food labels
2.3.1.1 Consumers’ recognition and knowledge of environmental information on food
labels
4 http://www.bioforumvlaanderen.be/biosector/marktinformatie/cijfers
Organic food with
environmental information on its label
- EU organic logo - Biogarantie logo
Participants
Characteristics
CO
NS
UM
ER
PE
RC
EP
TIO
N
Consumers’ - Recognition - Use - Understand
Consumers’ priority
for env-label
Consumers’ attitude
and behaviour
Consumers’ WTP
for env- label

7
In terms of consumers’ recognition of environmental information on the labels, Grankvist et
al. (2004) showed that the recognition of the existence of an eco product is very important. In
addition, Thøgersen (2000) stated that the availability of products and the capability of
consumers in recognizing and understanding some eco-label products were associated with
the attention of buyers towards these products. Nonetheless, the recognition of a label does
not necessarily translate in understanding its meaning. Some examples of recognition levels
were, 94% of Germany knew the “Bio-Siegel” label, of which 90% of consumers confirmed
that this label related to organic food. In addition, 59% of Turkish consumers recognized the
governmental logo and 64% among those mentioned that this logo referred to organic
products (Mutlu, 2007).
Together with the recognition of consumers, the analysis of knowledge of the environmental
information on the label is very important to understand consumer behaviour. Verbeke (2008)
mentioned that knowledge could have a significant impact on the way consumers utilize the
information to make their decision towards buying and using products. D’ Souza et al. (2007)
found that Australian consumers had a very limited knowledge of environmental labels and
types of label which were certified by different parties. They were only aware of the general
labels that used some terms like “biodegradable”, “recyclable” which were labeled by the
firms, and not by the third parties.
Park et al. (1994) distinguished two types of knowledge including objective and subjective
knowledge. Objective knowledge is the knowledge gained from the long-term memory of
consumers while subjective knowledge is formed from the subjective interpretation of the
consumers based on what they know. In addition, subjective knowledge had a positive and
strong relation to attitude and choice towards organic products while this link was weak for
objective knowledge. Pieniak et al. (2010) found that subjective knowledge was more
important to explain organic vegetable consumption than objective knowledge. In case of
organic food, many researches showed that the higher degree of awareness and knowledge on
organic food, the higher choice for these products. Furthermore, some studies revealed that
consumers’ knowledge had positive impacts on personal search which might be of importance
to consumers’ choice (Pieniak et al., 2007).
2.3.1.2 Consumers’ ability to understand environmental information on food labels
According to Hoogland et al. (2007), consumers might be familiar with organic logos,
however, they may not fully understand these logos. In addition, buyers were misidentifying
the term “organic” with other terms such as environmental, sustainable, green, ecological or
natural (Aarset et al., 2004). Given that consumers may know about the characteristics of
organic production, they may not totally understand the cost associated with organic farming
practices. Therefore, if people know more about the insight information, they may be willing

8
to pay more for organic labels (Pieniak et al., 2010). Thøgersen (2002) found that consumers
had difficulties and needed time to understand the meaning of environmental information on
the labels. In the same manner, according to Sirieix et al. (2011), time is important for people
to get to know and understand the label because buyers have diverse desire values and
characteristics.
The source of information to get the knowledge is also very important in promoting and
raising the awareness of consumers towards using environmental food labels. Information of
environmental issues on food labels could be distributed through the TV, the Internet,
advertising, magazines, newspapers, family and friends, and experts. Nilsson et al. (2004)
showed that Swedish consumers preferred to get more information on the labels regarding the
concepts, the production practices and the environmental characteristics. Even though the
information may be available on the Internet, they may not know much about it. Thus, the
labeling parties have to put further efforts by using other communication ways to make more
consumers know and understand the information on the labels.
In general, the recognition of consumers for environmental information on the food labels was
very important. In addition, knowledge and understanding the meaning of this information are
also very crucial since the level of understanding of consumers towards environmental labels
is still problematic. Many misidentifying signals appeared to consumers when they interacted
with the information as mentioned above.
2.3.2 Consumer priority ranking for environmental information on food labels
Hoogland et al. (2007) mentioned that value priorities played a crucial role in demonstrating
the extent that consumers concentrated on the environmental information on organic labels
and how they ranked for this attribute. In addition, Thøgersen (2000) reported that the use of
environmental labels depended on consumers’ priorities for environmental issues and the way
they expressed these priorities through their buying behaviour.
According to Leire and Thidell (2005), several studies tried to explain why people did not
choose environmental labels. They detected that consumers tended to give priority for other
aspects of products e.g. price, quality, buying habits, time. Furthermore, taste, quality and
healthiness, personal experience were ranked as four most important attributes respectively
while environmental consequence was ranked as the second least important (Grankvist &
Biel, 2001). Bonny (2006) found that in 2001 in Belgium, food safety was ranked quite high,
followed by nature, taste, animal welfare, origin and not genetic modified products (Figure A-
8, ANNEX). Leire and Thidell (2005) suggested that the visual view of the environmental
labels and the information announcements on environmental products in the shop could be
studied in further researches.

9
Based on previous studies, many criteria were taken into the consideration of consumers’
priorities. These criteria included environmental attributes, taste, healthiness, quality, food
safety, and price.
2.3.3 Consumers’ attitude and behaviour towards environmental information on food
labels
First, frequency of buying and consumption is presented, followed by factors related to
attitude and behavior, such as general attitude and belief, perceived behavioural control (PBC)
including perceived availability and perceived consumer effectiveness (PCE), involvement,
consumers’ concerns, and behavioural intention.
2.3.3.1 Frequency of buying and consumption
People usually buy food products based on their habit which could be called as routine
decision making (Sirieix et al., 2011). Magnusson et al. (2001) reported that a small
percentage of people bought organic food frequently, ranging from 8% to 16%. Similarly,
Van Loo et al. (2010) found that among consumers in the sample, 3.3% always and 12% often
bought organic chicken meat. Krystallis and Chryssohoidis (2005) mentioned that the
frequency of buying organic food was quite low and different among products, ranging from
1.8% to 36%, especially for processed food such as organic tinned foods, biscuits and cured
meat. The frequency of purchase was highest for some products such as organic fruits,
vegetables.
Many factors were identified to influence the consumption and buying frequencies of
consumers. In terms of consumption behaviour, demographics characteristics such as gender
had significant impact in explaining the frequency of consuming products. A study of Lowe
and Worsley (2003) on the consumption of yoghurt of women in Beijing, China, showed that
42% of those women usually consumed yoghurt (i.e. once a week or several times a week),
26% of them consumed this product for sometimes, and 32% never consumed this product.
Thus, according to Lowe and Worsley (2003) women in Beijing had high level of yoghurt
consumption. In contrast, Van Loo et al. (2010) found that gender, education, number of
children and marital status did not have a relationship with the consumption of organic
chicken.
Regarding purchasing frequencies, Magnusson et al. (2003) showed that the consumers’
health concern and environmentally friendly actions were important variables in considering
the frequency of buying. Furthermore, Nilsson et al. (2004) revealed that consumers who
bought organic food either often or not often considered environmental aspect, chemicals,
safety, health, quality, and animal welfare as the positive aspects of the labeled products.
Finally, Grankvist and Biel (2001) detected that the higher relative frequency of buying eco
food labels such as bread, milk, meat, potatoes had paired relation to some positive specific

10
beliefs in products, e.g. environment, health, quality. In addition, the belief on price was
shown, a more expensive product tended to have a weak correlation to frequency of
purchasing, nevertheless, this relationship still depended on the economic status of buyers.
2.3.3.2 Attitude and behaviour of consumers towards environmental attributes on food
labels
According to Grankvist et al. (2004), no “straight and simple” relationship was found between
attitude and pro-environmental behaviour. In general, many factors were shown to be related
to the attitude of consumers. According to Engel et al. (1995), consumers’ attitude could be
identified by testing their beliefs and feelings. In addition, some factors namely involvement,
behavioural control including perceived consumer effectiveness (PCE) and perceived
availability were taken into the analysis of the attitude and behavioral intention gap (Vermeir
& Verbeke, 2006). Furthermore, consumers’ concerns were found to have effects on
consumers’ attitude (Magnusson et al., 2003; Michaelidou & Hassan, 2008). As a result, the
framework of consumers’ attitude and behaviour is described in the Figure 2.2.
Figure 2.2 Conceptual framework for analyzing attitude and behaviour of consumers
towards environmental information on food labels
General attitude and belief
Pieniak et al. (2010) studied the general attitude of consumers towards organic vegetables
consumption. Results pointed that the general attitude of consumers was considered as “a
mediator” between subjective knowledge, objective knowledge and behaviour of consumers.
In addition, general attitude had significant strong positive relationship with organic
vegetables consumption.
(1) Engel et al. (1995); (2) Vermeir and Verbeke (2006); (3) Michaelidou and Hassan (2008); (4) Magnuson et al. (2003); (5) Aizen (1991)
Belief items
Attitude Behavioural
intention
Perceived behavioural control
Personal needs and motivations
Perceived
availability
Perceived consumer
effectiveness
Involvement
Consumers’
concerns
(1) (2) (2) (2) (3,4)
(2) (2)
(5)
Behaviour (5)

11
Next, belief is a very important factor in the above framework to explain consumers’ attitude
towards products. According to Nayga Jr (1999), consumer perception and belief on specific
information could be related to many factors including personal characteristics, situational,
consumers’ attitude and behaviour, and types of product that consumers purchase.
Taste, price, animal friendliness, nature and environmental friendliness were showed as
factors that could affect consumers’ belief in some types of foods (Hoogland et al., 2007). In
addition, taste, healthiness, safety, trustworthiness, quality, availability, and acceptability
were found to be drivers and barriers of consumers in pro-welfare behaviour (Vanhonacker &
Verbeke, 2009). Nilsson et al. (2004) showed that vast consumers believed that organic label
could benefit for the environment. Sirieix et al. (2011) mentioned that an organic label with
nice design and text choice (i.e. nice packaging) could attract consumers even they did not
find familiarity to the label.
More specifically, previous studies on organic yoghurt showed that “taste” and “health” were
important factors that affect consumers’ attitude and behaviour towards organic yoghurt.
Firstly, an exploratory study using laddering technique of Howlett et al. (2002), on the
consumer perception towards organic yoghurt, found that “health” concern was one of the
most important drivers for the purchase of organic yoghurt. Secondly, Toschi et al. (2012)
studied on the product development issue, found that organic yoghurt had more acceptable
“taste” in comparison to the conventional yoghurt samples.
Perceived behavioural control (PBC)
According to Aizen (1991), PBC is a very important factor of the theory of planned
behaviour. PBC is the perception of people about the easy and difficulty level to do
behaviour. Additionally, PBC is the element to distinguish between the theory of planned
behaviour and the theory of reasoned action. Bamberg and Moser (2007) discovered that
awareness and knowledge about environmental problems could affect the extent of perceived
behavioural control and the attitude of consumers towards their “pro-environmental
behaviour”. PBC includes perceived availability and perceived consumer effectiveness (PCE).
Perceived availability
The level of easy or difficult that consumers found to do behaviour may depend on how
consumers judge the importance of the availability of resources, and chances that they can
have to make their real behaviour. For example, if people want to purchase a food product,
they may consider whether the product is easy available on the market (i.e. supermarkets or
shopping stores) to buy or not. This means that product’s availability may influence
consumers’ attitude and real behaviour. According to Bonny (2006), 11% of the respondents
in the sample within European countries faced the problem of low availability (i.e. difficulty

12
in finding the products in the market to buy) while purchasing organic products (Figure A-5,
ANNEX).
Furthermore, Vermeir and Verbeke (2006) found that people, who might have positive
attitude, but did not have intention to buy sustainable food, think that it was not easy to find
these products on the market. Additionally, consumers with higher perceived availability had
better attitude and intention to buy sustainable products. In the same vein, Krystallis and
Chryssohoidis (2005) mentioned that the availability of some organic products, e.g. milk,
pasta, bread, might be a barrier for consumers’ purchase frequency in Greek market.
Perceive consumer effectiveness (PCE)
PCE is the extent that people believe that their behaviour or actions contribute to solve a
problem (Ellen et al., 1991). Several studies showed that the high PCE value could lead
consumers to the transition from attitude to purchase behaviour (Vermeir & Verbeke, 2006).
Hence, if the consumers are convinced that their behaviour could have certain impacts on the
environment, they may have some changes in their purchase intention or behaviour.
Vanhonacker and Verbeke (2009) measured PCE by four statements related to consumer
actions towards animal welfare of chicken products. Results showed that people with higher
PCE had higher levels of “pro-welfare behaviour”.
Personal needs and motivations
Involvement
According to Vermeir and Verbeke (2006), involvement is an important factor which affects
consumer decision-making process. Involvement, which is also called as the perceived
personal importance, is a particular type of motivation. Involvement occurs when a
commodity is recognized or perceived as a tool to meet the needs or values of consumers. The
more people are involved in a product, the more effort they spend on searching information
and the longer time to make the decision (Beharrell & Denison, 1995; Verbeke & Vackier,
2004). Involvement can affect consumers’ belief, attitude, and behavioral intention. Thus,
studying involvement is important to understand consumers’ behaviour.
Consumers’ concerns
The framework for the analysis of consumers’ concerns was presented in Figure 2.3.
Magnusson et al. (2003) categorized two types of consumers’ concerns or motives including
egoistic and altruistic motives that affect consumers’ attitude. The egoistic motives are more
related to food safety concerns whereas the altruistic motives are reflected by environmental
concern and animal welfare. In addition, the egoistic motives seem to be driven by individual
reasons while the altruistic motives tend to be derived from the social reasons.

13
Two opposite results were shown in the studies of Magnusson et al. (2003) and Michaelidou
and Hassan (2008). On the one hand, the egoistic motives were considered to be better and
stronger predictors of attitude and buying intention for food than altruistic motives
(Magnusson et al., 2003). This conclusion means that consumers pay more attention to their
own benefit than the benefit of the society. On the other hand, Michaelidou and Hassan
(2008) found that “ethical self-identity” - an altruistic motive, had much stronger effects on
attitude and buying intention than “food safety concern”- an egoistic motive. In addition,
environmental concern was supposed to affect positively the purchase intention of consumer
towards green label energy product (Hartmann & Apaolaza-Ibáñez, 2011).
Figure 2.3 Framework for the analysis of consumers’ concerns
Michaelidou and Hassan (2008) suggested that future research should not pay much focus on
the egoistic motives, instead, more concentration should be put on the altruistic motives. The
findings from Michaelidou and Hassan (2008) were that ethical self-identity positively
affected the attitude and behavioural intention of consumers towards organic products; food
safety concern positively predicted the attitude of consumers, but not behavioural intention. In
addition, Stolz et al. (2011) detected that the higher degree that people agreed that organic
fruit yoghurt was safer, which meant “free from artificial additives and flavours”, the more
likely that they chose this product.
Behavioural intention
Previous studies found some relationships between demographics characteristics of
consumers and their behavioural intention towards organic food. Women reported higher
purchase intention of organic or sustainable products than men (Rimal et al., 2005; Vermeir &
Verbeke, 2006). In addition, older people displayed lower level of buying organic food than
the younger, which resulted from the less disposable income (Rimal et al., 2005). However,
age groups were not influencing the buying behaviour of consumers (Davies et al., 1995). The
presence of children was not affecting the intention to buy organic products (Magnusson et
(2)
(2)
(3)
(2)
(3)
(2)
Consumers’ concerns
Ethical self-identity
Food safety concern
Environmental concern
Attitude
Altruistic motives
Egoistic motives
Behavioural intention
(1) Magnusson et al. (2003); (2) Michaelidou and Hassan (2008); (3) Hartmann and Apaolaza-Ibáñez (2011)
(1)
14
al., 2001). Noticeable, Magnusson et al. (2001) discovered that although a large number of
people showed positive attitude, their intention to buy did not correspond with their attitudes.
Furthermore, although people had good feelings concerning the purchase of sustainable food,
they did not have high intention to buy it (43.9% of the sample). On the contrary, people who
did not feel very positive about sustainable food, they were intending to purchase this kind of
product (17.5% of the sample) (Vermeir & Verbeke, 2006).
In overall, all factors mentioned above are important in the analysis of consumers’ attitude
and behaviour towards environmental food labels. While belief items are elements that
strongly support the explanation of attitude, other factors such as perceived availability, PCE,
involvement and consumers’ concerns are used to clarify the relations from the attitude to
behaviour of the consumers.
2.3.4 Consumers’ willingness to pay for environmental labeling food products
In this part, the results of consumers’ WTP for organic food labels in previous studies, factors
that affect the WTP of consumers, and the methods to calculate the WTP are discussed.
2.3.4.1 Results of consumers’ WTP from previous studies
More and more people are willing to pay for environmentally friendly products (Laroche et
al., 2001). The range of consumers’ WTP for environmental food labels can be very different.
Napolitano et al. (2008) gave consumers clear information about animal welfare situation of
plain yoghurt and low fat yoghurt and let them taste the products. The result of Vickery
auction showed that consumers were willing to pay 6.5% and 4.7% extra, respectively for
plain yoghurt and low fat yoghurt with higher animal welfare standards label (i.e. the animal
welfare standards depended on the types of housing system).
According the Hutchins and Greenhalgh (1995), nearly half of participants in their sample
were willing to pay 10% to 12% extra for organic food labels. In addition, Gil et al. (2000)
reported that Spanish consumers were willing pay from 15% to 25% more for organic food as
compared to conventional products. Van Loo et al. (2011) found that consumers were willing
to pay 103.5% and 34.8% extra for USDA organic label and general organic label of chicken
meat respectively. Thus, the guarantee label of a high quality organization could have a
certain impact on the consumers’ WTP. In summary, the WTP is very diverse and may
different across countries and product categories.
2.3.4.2 Factors affecting consumers’ WTP
Krystallis and Chryssohoidis (2005) studied the review of other researches and reported that
consumers’ WTP depended on food categories. Gil et al. (2000) stated that organic vegetables
and fruits had higher WTP value than other products including meat.

15
According to Laroche et al. (2001), five factors have impacts on the WTP of consumers.
Those include socio demographics characteristics, consumers’ knowledge, values, attitudes
and behaviour. In terms of demographics factors, age, gender, education, and financial status
were considered as important factors that affect the WTP of consumers (Govindasamy &
Italia, 1999). Van Loo et al. (2011) found that the WTP of consumers for organic chicken
meat was higher for females and increased with age and household income level, nonetheless,
it was lower for households with children. In addition, Laroche et al. (2001) showed that
females, who were married and have children, were willing to pay more for environmentally
friendly products. On the contrary, Krystallis and Chryssohoidis (2005) found that gender,
age, education, number of children, employment do not significantly influence consumers’
willingness to pay for organic products.
Beside demographic profile, knowledge, values, attitudes and behaviour are other factors that
affect the WTP of consumers. “Quality and security”, “trust” were important factors in
determining the WTP of consumers for organic food products (Krystallis & Chryssohoidis,
2005). In addition, consumers have more interest in the brand name of some products such as
organic meat, milk, feta cheese. Loureiro and Lotade (2005) found that environmental attitude
positively impacts consumers’ WTP for fair trade and organic coffee labels.
Next, price negatively influences the consumers’ utility: when the price increases, consumers’
utility will decrease and consequently reduce the probability of buying (Van Loo et al, 2011).
Van Loo et al. (2010) discovered that price was the strongest factor that limited the organic
meat purchase behaviour and the WTP may be different according to the frequency of buying.
However, in another study, price was considered not to be a powerful determinant of organic
buying behaviour (Krystallis & Chryssohoidis, 2005).
2.3.4.3 Methods of calculating of the WTP
Many methods can be applied to calculate consumers’ WTP for environmental food labels.
Several studies applied the percentage or price premium above the regular price that
consumers were willing to pay for environmental food products (e.g. Krystallis &
Chryssohoidis, 2005). Loureiro and Lotade (2005) used the payment card format to
investigate the WTP of consumers for fair trade, shade grown, organic coffee. Furthermore,
Van Loo et al. (2011) used a choice experiment using Multinomial Logit Model (MNL) and
Random Parameter Logit model (RPL) to calculate the WTP.

16
Chapter 3 Materials and Methods
3.1 Data collection and participants
The data was collected via a cross-sectional consumer survey in the Northern Dutch speaking
part of Belgium (Flanders) in March 2012. In order to collect the data, a questionnaire was
developed originally in English. It was then translated to Dutch and delivered online to the
consumers by a market research agency. The total sample size was 404 respondents who were
randomly selected from the consumer panel data of the agency using a convenience sampling
procedure. This panel consists of consumers who have been recruited through off-line
recruitment methods (e.g. random walk or street contact procedures) and who agreed to take
part in future surveys. The socio demographic characteristics of the sample were characterized
by many items including gender, age, education, living status, perceived financial status and
main responsible food shopper (Table 3.1).
Table 3.1 Socio demographic characteristics of the sample
Items % of total Valid N
Gender 396
Male 38.1
Female 61.9
Age 395
<25 17.5
25 – 55 61.7
>55 20.8
Education 398
Elementary school 1.3
High school 23.8
Higher education (not University) 42.0
University 32.9
Status of living 396
Alone 14.6
Copartner 85.4
Financial status 398
Difficult to less than Average 12.3
Moderate 35.7
More than Moderate to Well off 52.0
Respondents with main responsible food shopping 46.3 397

17
Firstly, 38% of people in the sample were male and 62% were female. Secondly, three age
groups were identified, 17% were under 25 years old, most people aged from 25 to 55 (62%)
and the rest 21% belonged to the third group, which was higher than 55 years old. The third
socio demographics characteristics was education, four education groups were distinguished,
including 1.3% had elementary education, 23.8% had high school level, most people (42%)
had higher education but not university, and the rest 33% had university degree. Hence, our
sample was biased towards higher educated people. Status of living was another characteristic
of the sample, 85% of the people in the sample were copartner with other. Next, perceived
financial status was classified into three categories, 12% households had below average
income level, 36% and 52% had moderate and more than moderate income level respectively.
Additionally, 46% respondents were the main household food shoppers. In general, the
sample was biased towards gender with more female than male.
3.2 Measures
The questionnaire for the consumer survey contains several parts namely (1) consumers’
recognition, use and understanding of the label, (2) consumption behaviour, (3) consumers’
attitude and organic food involvement, and (4) consumers’ willingness to pay. The description
of the detail measures are presented below.
3.2.1 Consumers’ recognition, use and understanding of the food labels
The information of consumers’ recognition was collected by providing consumers with the
two logos including EU organic logo and Belgian private organic logo “Biogarantie”.
Respondents were asked if they could recognize these logos by using nominal scale “yes” or
“no” as the measurement. Next, an aided recall test was employed, the four statements were
presented related to the meaning of each logo of which they were asked to select the correct
one. The four statements using for each logo are presented in Table 4.1.
Next, consumers’ understanding of the EU organic label was detected by evaluating their
objective knowledge. Four statements were used for this question, to be identified as “true”
and “false” scale (1) “At least 95% of the ingredients are organic” (this is a correct answer5),
(2) “At least 70% of the ingredients are organic” (this is not correct), (3) “This product can
contain up to 20% of genetic modified materials” (this is not correct because it is absolutely
prohibit the use of this logo for product which contains GMOs6), (4) “It can be used for
products derived from fishing and hunting wild life activities” (this is not correct due to
compromising with the key messages and slogans of organic produce of the EU)7. The option
of “do not know” was not included because we wanted to force participants to think and make
5 http://ec.europa.eu/agriculture/organic/consumer-confidence/logo-labelling_en 6 http://ec.europa.eu/agriculture/organic/consumer-confidence/logo-labelling_en 7 http://ec.europa.eu/agriculture/organic/toolbox/messages-slogans_en

18
up their choice towards those statements. The objective knowledge of consumers, which were
measured by the four statements and registered as “true” and “false”, was further recoded into
“1” with the correct response and “0” with the incorrect response. Then, the four options were
summated to count the number of correct answers per person. This was considered as a new
variable which had the value from 0 to 4, and to be acted as a continuous variable for further
analysis.
Additionally, the use of organic logos was investigated by asking consumers the frequency
that they search for organic logos when buying yoghurt. The measurement of five point scales
ranging from “1= never” to “5= always” was applied.
3.2.2 Consumption behaviour
The data on consumption behaviour included information on frequency of eating and buying,
location of buying, and behaviour intention.
Firstly, the eating behaviour with respect to yoghurt was investigated by asking the consumers
how frequently they eat yoghurt. The answer was registered on a 6-point scale ranging from
“never”, “less than monthly”, “monthly”, “weekly”, “2 to 4 times per week”, “daily or almost
daily”. The consumption variable was recoded with “never = 0”, “less than monthly = 0.12”,
“monthly = 0.25”, “weekly = 1”, “2 to 4 times per week = 3”, “daily or almost daily = 6.5”.
Next, consumers’ frequency of buying organic yoghurt was identified by asking consumers
“On 10 times that you buy the following food item, how often do you choose one with an
organic label?”. A 11-point scale ranging from 0 to 10 was used.
Thirdly, the location of buying was collected through requesting participants to state how
appropriate that they find several places such as supermarket, natural/organic store, local
farms, farmers’ market were. The 7-point scale measurement was applied for this question
with “1 = totally disagree”, “4= neither agree nor disagree”, “7 = totally agree”.
Finally, consumer behavioural intention with respect to the consumption of organic yoghurt
was measured. Respondents were asked, in three separated questions, how likely or unlikely it
is that they “expect”, “plan”, “desire” to eat organic yoghurt in the next 7 days. A 7-point
interval scale was used for the measurement of this question. The two bound of those scales
are “unlikely/likely” (Pérez-Cueto et al., 2011).
3.2.3 Attitude and organic food involvement
Most of the questions in the measurement questionnaire were responded on a 7-point scale.
According to Krosnick et al. (2005), the use of 7-point scale makes it easier for consumers to
understand the meaning of the scale point such as “dislike a great deal, dislike a moderate
amount, dislike a little, neither like nor dislike, like a little, like a moderate amount, like a

19
great deal”. In addition, the reliability of 4, 5 or 7-point scale could be considered to have
similar reliability (Krosnick et al., 2005; Alwin & Krosnick, 1991).
Important characteristics of product
The important characteristics of yoghurt when consumers are buying this product were
assessed. Adapted from the two studies of Grankvist and Biel (2001), Bonny (2006),
consumers were asked to judge the importance of yoghurt characteristics when buying this
product. Items included were “quality, taste, price, environmental friendliness, brand name,
nutritional value, packaging, trustworthiness, availability, provided with an organic label”. A
7-point interval scale was used with “1 = totally not important”, “4 = neutral”, “7 = very
important”.
General attitude and belief
General attitude
Consumers’ attitude towards organic yoghurt was measured by asking consumers “Please
indicate which words best describe your feeling of organic yoghurt as compared to
conventional yoghurt”. A 7-point semantic differential interval scale was used, with bipolar
adjectives including “bad/good”, “unpleasant/pleasant”, “negative/positive”. Those scales had
been used in the previous studies (Shepherd & Raats, 1996; Pieniak et al., 2010).
Belief
Adapted from the studies of Hoogland et al. (2007), Vanhonacker and Verbeke (2009),
consumers were asked to evaluate the following aspects when comparing organic yoghurt
with conventional yoghurt which means, “Organic yoghurt scores (worse/better) than
conventional yoghurt.” Some criteria were provided such as “taste, healthiness, price,
environmental friendliness, safety, quality, availability, trustworthiness, packaging”. A 7-
point interval scale was applied for the measurement of the answer, with “1= much worse”,
“4= same”, “7= much better”.
Perceived consumer effectiveness (PCE)
According to Ellen (1991) and Vanhonacker and Verbeke (2009), PCE was collected through
the establishment of some messages and requested consumers to rate on those messages.
Adapt from those studies, some statements were formulated for this study. Consumers were
asked to indicate to what extent they agree with different statements including (1) “One
person alone can do very little for the environment”, (2) “Efforts concerning the environment
by one person are useless as long as other people do not want to do something”, (3) “An
individual person can make a difference for the environment by carefully selecting the
products”. Those statements were answered on a 7-point Likert scale of agreement, with “1=
totally disagree”, “4= neither agree nor disagree”, “7= totally agree”.

20
Ethical self-identity, food safety concern and environmental concern
Ethical self-identity and Food safety concern
To collect ethical self-identity data, consumers were asked to indicate their opinion on some
statements. Those statements were presented in Table 4.6, to be answered on a 7-point Likert
scale of agreement, with “1= totally disagree”, “4= neither agree nor disagree”, “7= totally
agree” (Michaelidou & Hassan, 2008). Consumers’ food safety concern was collected by
asking the extent they agree with several statements (See Table 4.6). A 7-point Likert scale of
agreement was used, with “1= totally disagree”, “4= neither agree nor disagree”, “7= totally
agree” (Michaelidou & Hassan, 2008).
Environmental concern
Adapt from the study of Hartmann and Apaolaza-Ibáñez (2011), respondents were provided
some statements related to environmental concern (See Table 4.6). A 7-point Likert scale of
agreement was applied, with “1= totally disagree”, “4= neither agree nor disagree”, “7=
totally agree”.
Organic food involvement
Based on Zaichkowsky’s (1985) study of the measurement of involvement scales and
Pieniak’s (2008) study on health involvement of fish consumption, consumers were asked to
indicate their opinion on four statements related to organic food involvement. Those
statements were (1) “Organic food means a lot to me”, (2) “I care a lot about organic food”,
(3) “Organic food is very important to me”, (4) “I appreciate organic food very much”. These
were answered on a 7-point Likert scale of agreement, with “1= totally disagree”, “4= neither
agree nor disagree”, “7= totally agree”.
3.2.4 Consumers’ willingness to pay
Consumers were provided with a hypothetical scenario “Suppose that you want to purchase
500 g yoghurt. The average price for 500 g regular yoghurt is about €1.5. Please indicate how
much you are willing to pay extra for a yoghurt with an organic label”. A range of price was
given to respondents ranging from
(10) €0.90 (11) €1.00 (12) €1.10 (13) €1.20 (14) €1.30 (15) €1.40 (16) €1.50 (17) I would buy a regular yoghurt independent on the price
(1) €0.00 (2) €0.10 (3) €0.20 (4) €0.30 (5) €0.40 (6) €0.50 (7) €0.60 (8) €0.70 (9) €0.80

21
3.3 Data analysis
3.3.1 Framework of the hypotheses
The framework of hypotheses of the study is described in Figure 3.1, which was established
from the framework of the study in the literature part. Six parts of information were used
including consumers’ attitude, consumers’ behaviour, consumers’ behavioural intention,
consumers’ willingness to pay, consumers’ knowledge, and the socio demographic
characteristics of the consumers.
Figure 3.1 Framework of the hypotheses
Consumers’ knowledge Objective knowledge
Consumers’ attitude General attitude Possible motives Possible barrier PBC Important of env.ch Involvement Consumers’ concerns
Consumers’ behaviour Frequency of buying Use of organic logos Consumption frequency
Willingness to pay
Behavioural intention
H0_1 H0_2 H0_4
H0_1 H0_2
Socio demographic characteristics Gender, Age, Household size, Education, Occupation, Responsible for food shopping
H0_1 H0_6
H0_3
H0_3
H0_6
H0_5
H0_4
H0_5
H0_5
H0_4
H0_2 H0_4
H0_4
H0_4
H0_6H0_6
Use for cluster analysis
Use for WTP analysis
- Possible motives: organic yoghurt is worse/better than conventional yoghurt in terms of taste, healthiness, safety, quality, trustworthiness, and packaging - Possible barrier include price - Perceived behavioural control (PBC) include PCE and perceived availability - “env.ch”: environmental characteristics - Consumers’ concerns include ethical self-identity, food safety concern, and environmental concern
Use for other analysis e.g. descriptive, regression analysis

22
3.3.2 Research questions and hypotheses of the study
3.3.2.1 Research questions
Food perception could be influenced by personal characteristics, food attributes and
environmental factors (Steenkamp, 1997). In order to analyze the consumers’ perception on
environmental information on food labels, four research questions were established. First,
how consumers recognize, use, understand the organic logos on food labels. Second, how
consumers rank for environmental information on food labels. Third, how consumers express
their attitude and behaviour towards this information. Finally, how much consumers are
willing to pay for buying a product with environmental information on its label, and which
factors could affect the willingness to pay of the consumers.
3.3.2.2 Hypotheses of the study
According to the research questions, hypotheses of the study were set.
Table 3.2 Hypotheses of the study
Hypotheses Descriptions
Hypotheses within attitudinal and behavioural variables
H0_1 There is no correlation between attitudinal and behavioural items with “Frequency of buying” of the consumers.
H0_2 There is no difference in the mean of consumers’ attitudinal and behavioural items across different User of organic logos categories.
H0_3 Hypotheses related to socio demographic characteristics
H0_3(a) There is no difference in the mean behavioural intention, buying frequency, consumption frequency for the two samples including male and female.
H0_3(b) There is no difference in the distribution of male and female across different User of organic logos categories.
Hypotheses for Regression Analysis
H0_4 There was no association between dependent variable (i.e. “general attitude” for model 1, “behavioural intention” for model 2, “frequency of buying” for model 3) and other attitudinal and behavioural items in the model.
H0_5 Hypotheses for Cluster Analysis
H0_5(a) There is no difference in the attitudinal and behavioural items for different segments of consumers’ concerns.
H0_5(b) There is no difference in the distribution of age, occupation across different segments of consumers’ concerns.
H0_6 Hypotheses for the WTP analysis
H0_6(a) There is no difference in the mean WTP across different User of logos categories.
H0_6(b) There is no correlation between WTP and other attitudinal and behavioural variables.
H0_6(c) There is no difference in the mean WTP for male and female group.

23
3.3.3 The statistical methods
The data was analyzed using the SPSS 19.0 (SPSS Inc., Chicago, IL). Furthermore, several
types of tests were applied including descriptive statistics, cross tabulation, one-way ANOVA
F-test, independent sample T-test, factor analysis, reliability test, regression analysis, and
cluster analysis. Firstly, descriptive statistics were used to show the mean value of the items
and to make comparison across variables, for example the ranking of the important
characteristics of yoghurt. Secondly, cross tabulation with chi-square test was performed to
distinguish the difference in the distribution of some characteristics of consumers across one
categorical variable. Thirdly, one-way ANOVA F-test was applied to test the difference in the
mean value of attitudinal and behavioural variables across equal or more than three groups
such as the frequent use of organic logos with three user categories. Additionally two post hoc
tests were used in two separate cases. If the p-value of the test of homogeneity was equal or
larger than 0.05, then the null hypothesis which stated that equal variances were assumed has
been accepted, thus, the results of Scheffe post hoc test were employed. On the contrary, if the
test of homogeneity yielded a p-value smaller than 0.05, then the results of Dunnett T3 post
hoc test were used. Next, independent sample T-test was used to identify the mean difference
of some interest variables for two groups such as male and female. In addition, factor analysis
and reliability tests were used to identify whether the measurements of a construct share high
proportion of the variance or have convergent validity. In terms of regression analysis, the
items to be entered in the model were derived from the theoretical model of attitude and
behaviour of consumers as indicated in the literature study. Next, stepwise method was used
to perform the regression models.
For cluster analysis, several steps were applied (Vanhonacker et al., 2010). Firstly, reliability
test was performed to check the cronbach’s alpha value for the internal reliability consistency
of the segmentation items. The optimal number of clusters was decided by separately running
the model with different cluster numbers, comparing the size of segments and cluster centers.
Secondly, hierarchical clustering with Wards’ method, and follow by a K-means method were
used to differentiate the segments. Furthermore, descriptive statistics, one-way ANOVA F-
tests with Scheffe post hoc multiple comparisons, and cross tabulation with chi-square
statistics were conducted to profile the segments on the consumers’ socio demographics
characteristics, attitudinal and behavioural variables. Most of the tests were performed at 5%
level of significance (p-value <0.05), unless notices were provided.
The steps of evaluation and analysis of the dataset in SPSS was presented in Table A-2
ANNEX.

24
Chapter 4 Results and Discussion
4.1 Recognition, understanding of the organic logos
Consumers’ recognition of the EU organic logo and Belgian “Biogarantie” logo was
conducted by first confronting consumers with the images of the two logos, and then asking
them whether they were aware of those logos, the answers were registered as “yes” and “no”.
Approximately 30% consumers were aware of EU organic logo and 55% respondents were
aware of Belgian “Biogarantie” logo. The low proportion of those who were aware of EU
organic logo could be explained by the fact that EU organic logo had been introduced recently
(1 July 2010)8, thus, consumers were still not very aware of it. Next, an aided recall test was
employed, for each logo, the four definitions were given. In total, 80% of people selected
correctly the definition for EU organic logo and 82.9% people selected correctly the definition
for Belgian “Biogarantie” logo (Table 4.1). This result revealed that most people could
identify correctly which were the organic logos on the product labels when they wanted to
buy the products.
Table 4.1 Consumers’ recognition of EU organic logo and Belgian “Biogarantie” logo
Statements
EU
organic logo
Belgian
“Biogarantie” logo
Correct
answer
Valid
percent
(%)
Correct
answer
Valid
percent
(%)
1. It is the EU label to indicate that it is genetic modified food 5.8 0.0
2. It is the EU label to indicate that is organic food x 79.9 16.8
3. It is a logo to indicate the approved use of pesticides 0.0 0.3
4. It is the Belgian label to indicate that is organic food 14.3 X 82.9
Total 100.0 100.0
Valid N 399 404
Consumers’ understanding of the meaning of EU organic logo was presented in Table 4.2.
Most of people knew that the logo showed that this product could not contain up to 20%
genetic modified materials. On the contrary, only over one third of people agreed that it was
wrong to state that organic logo meant that the product contained at least 70% organic
8 http://ec.europa.eu/agriculture/organic/home_en

25
ingredient. In reality, the EU organic logo was applied for products, which were produced
with at least 95% organic ingredients.
Table 4.2 Consumers’ understanding of the meaning of EU organic logo
Statements Correct
answer
Correct
response
(%)
Wrong
response
(%)
Total
(%)
1. At least 95% of the ingredients are organic True 53.0 47.0 100.0
2. At least 70% of the ingredients are organic False 38.3 61.7 100.0
3. This product can contain up to 20% of genetic
modified materials False 81.1 18.9 100.0
4. The logo can be used for products derived from
fishing and hunting wild life activities False 72.2 27.8 100.0
Next, the percentage of respondents with the measurement frequency of correct responses of
objective knowledge of the EU organic logo was explored in Table 4.3. Most people (37.2%)
had two correct answers, while about over one fifth of the sample had four correct answers.
Furthermore, only 4.5% of people in the sample answered wrong to the statements. Those
results indicated that about 40% of the respondents in the sample did have good objective
knowledge (i.e. having equal and above three correct answers) towards the meaning of EU
organic logo.
Table 4.3 Percentage of respondents for the frequency of objective knowledge
Number of correct answers Frequency Percent (%)
0 16 4.5
1 52 14.7
2 132 37.2
3 69 19.4
4 86 24.2
Total 355 100.0
4.2 Ranking
The ranking order of yoghurt attributes including two items related to environmental
characteristics: “environmental friendliness” and “provided with an organic label” are
presented in Figure 4.1 and Table A-3 ANNEX. “Taste” and “quality” were assigned as the
most important attributes. This result confirmed the findings of Toschi et al. (2012) who
found that “taste” was an important factor which could influence the success of a product in
an organic market. Furthermore, “taste” of organic yoghurt was more likely to be accepted by
the consumers than the “taste” of conventional yoghurt. Next, “trustworthiness”, “nutritional
value”, “price” and “availability” scored above the neutral points, which meant those
attributes were considered important to the consumers. The ranking of “price” as an important
attribute confirmed the study of Valli and Traill (2005) who found that consumers who were

26
conscious about the price of the products, scored low for the perceived importance of
“organic” and “bio-bifidus” yoghurt attributes.
1 2 3 4 5 6 7
10. Provided with an organic label
9. Brand name
8. Packaging
7. Environmental friendliness
6. Availability
5. Price
4. Nutritional value
3. Trustworthiness
2. Quality
1. Taste
The attributes are scored on the 7-point scale of importance degree with “1 = totally not important”, “7 = very important”
Figure 4.1 Ranking the importance of product attributes
Furthermore, “environmental friendliness” was considered as relatively important attribute of
yoghurt. Exploratory research of Howlett et al. (2002) suggested that consumers valued high
for the environmental attribute of organic yoghurt, although they had not yet showed the
connection between environmental concern and their buying behaviour towards organic
yoghurt. The other attributes including “packaging”, “brand name”, “provided with an organic
label” were perceived as relatively not important to respondents.
In this study, the environmental attributes of yoghurt were described by the two items
including “environmental friendliness” and “provided with an organic label”. There was a
small contradiction concerning those variables since respondents scored quite high on
“environmental friendliness”, while “provided with an organic label” was much lower. In
order to explain this finding, a correlation analysis was performed between “environmental
friendliness” and “provided with an organic label”. There was a very strong positive
significant correlation between those items (Table 4.4). The more important people
considered “environmental friendliness” as a product attribute, the more they felt that it was
important to provide this product with an organic label. Therefore, it was not a contradiction
concerning different scoring for the two items since these two items had the same tendency in
supporting environmental aspects of the product.
Importance degree of yoghurt attributes

27
Table 4.4 Correlation between “Environmental friendliness” and “Provided with an
organic label”
Items Mean SD 1 2
1. Environmental friendliness a 4.64 1.67 1.00
2. Provided with an organic label b 3.78 1.82 0.64** 1.00
** Correlation is significant at the 0.01 level (2-tailed).
a, b: those items illustrated the importance degree of yoghurt attributes
Next, the mean value of some variables used in the study was presented in Table 4.5.
Table 4.5 Mean value of some variables used in the study
Items Mean SD Valid N
General attitude and Belief items
General attitude 4.97 1.30 377
Taste 4.45 1.05 398
Healthiness 5.12 1.00 397
Price 2.69 0.95 398
Environmental friendliness a 4.98 1.02 397
Safety 4.56 0.98 398
Quality 4.77 1.02 398
Trustworthiness 4.50 1.02 396
Packaging 4.06 0.80 395
Perceived behavioural control
PCE 4.41 1.60 397
Perceived availability 3.44 0.94 398
Consumers’ concerns and involvement
Ethical self-identity 4.47 1.27 403
Food safety concern 4.60 1.26 400
Environmental concern 5.72 1.06 391
Involvement 4.04 1.62 399
Intention and behaviour
Frequency of consumption yoghurt 3.10 2.65 403
Behavioural intention 3.06 2.16 399
Use of organic logos 2.08 1.27 402
Frequency of buying organic yoghurt 2.49 3.14 402
a: this item illustrated that consumers believe that organic yoghurt scores worse/better than conventional yoghurt in terms of “environmental friendliness”. This variable will be used in further analysis.
On average, respondents had positive attitude towards organic yoghurt. They believed that
organic yoghurt was tastier, healthier, more environmentally friendly, had better quality, and
was more trustworthy. Respondents did believe that the price of organic yoghurt was more
expensive and the availability was not as good as compared to conventional yoghurt. In
addition, consumers believed that their action could contribute to make a positive change for
the environment (i.e. the score for PCE was above the neutral point). Additionally, consumers
showed high concern for ethical self-identity, food safety issue, and environmental aspect. In
terms of behaviour, most people consumed yoghurt 2 to 4 times per week, and had relatively

28
low intention to consume organic yoghurt. Furthermore, they rarely used organic logos when
buying yoghurt and had low frequency in purchasing organic yoghurt.
4.3 Attitude and behaviour
In this section firstly, construct validity of the measurement was assessed. Secondly, the
relations of frequency of using of organic logos when buying with attitudinal and behavioural
variables were conducted. Thirdly, the correlations of attitudinal and behavioural variables
were evaluated. Fourthly, consumer attitude and behaviour depending on socio demographic
characteristics were explored. Next, regression analysis was applied, and cluster analysis was
performed. Finally, consumers’ willingness to pay towards organic yoghurt was identified.
4.3.1 Construct validity
In order to identify whether the measurements of a construct share high proportion of the
variance or have convergent validity, factor analysis and reliability tests were performed for
several attitudinal and behavioural variables. The steps of the assessment of the convergent
validity were mentioned in Hair et al. (2006). Firstly, the standardize factor loading was
applied. Next, reliability tests and the extracted variance were used. In order to check the
validity of some items such as “general attitude”, “behavioural intention”, “PCE”,
“involvement”, “perceived importance of environmental characteristics”, reliability tests were
performed. Furthermore, the validity of the consumers’ concerns items, which had the same
tendency in the meaning, were constructed by the two steps including factor analysis and
reliability tests.
Constructs of General attitude, Behavioural intention, PCE, Involvement, Perceived
importance of environmental characteristics
The reliability tests for “general attitude”, “behavioural intention” and PCE were conducted.
Cronbach’s alpha value for the general attitude items was 0.958, for behavioural intention was
0.977, and for PCE variable was 0.771, thus new variables named “general attitude”,
“behavioural intention” and PCE could be created.
“ Involvement” variable was identified by the four statements of involvement in organic food.
The cronbach’s alpha value for the four items was 0.962. Thus, the aggregate score of those
items could be made to obtain the variable “involvement”. Furthermore, the variable
“perceived importance of environmental characteristics” was composed by the six items
related to the environment. The reliability test for the six items included (1) The importance
of environmental friendliness of yoghurt, (2) The importance of providing with an organic
label for yoghurt, (3) Consumers’ belief that organic yoghurt was more “environmental
friendliness” than conventional yoghurt, items (4) to (6) described of environmental concerns
(See Table 4.6). The cronbach’s alpha value for the six items was 0.742. Thus, a new variable

29
which named “perceived importance of environmental characteristics” of the product could be
created from the six items above.
Constructs of consumers’ concerns variables
Consumers’ concerns included three items namely “environmental concern”, “ethical-self
identity”, and “food safety concern”. Each item was measured by several statements (Table
4.6). The results from KMO and Barlette’s test confirmed that it was meaningful to perform
factor analysis for consumers’ concerns items.
Findings of factor analysis by means of principle component analysis were presented in Table
4.6. A three-factor solution, explaining 73.3% the variance of the data had been suggested.
The loadings of each item on the construct were significant, ranging from 0.70 to 0.90. Factor
1 included environmental concern items, factor 2 related to ethical self-identity, and factor 3
stated of food safety concern. The last item of food safety concern loaded also on component
2, with 0.44, which was quite low as compared to the loading on component 3 with 0.71.
Thus, the loading of 0.44 was not taken into account. All the results above confirmed the
constructs as assumed.
Table 4.6 Factor loading and reliability estimates for construct measures related to
consumers’ concerns
Items Factor
1 2 3
Environmental concern
1. Mankind is severely abusing the environment 0.84
2. There are limits to growth beyond which our industrialized society cannot
expand 0.82
3. Humans must live in harmony with nature in order to survive 0.70
Ethical self- identity
4. I think of myself as an ethical consumer 0.90
5. I think of myself as someone who is concerned about ethical issues 0.84
Food safety concern
6. Nowadays most foods contain residues from chemical sprays and fertilizers 0.81
7. The quality and safety of food concerns me 0.80
8. I am very concerned about the amount of artificial chemicals in food 0.44 0.71
% Variance explained 25.51 23.90 23.90
Cronbach’s alpha internal reliability 0.75 0.84 0.76
Kaiser-Meyer-Olkin measure of sampling adequacy 0.77
Bartlett's test of sphericity P < 0.001
The reliabilities of “environmental concern”, “ethical self-identity”, and “food safety
concern” were assessed by using cronbach’s alpha value. The three variables included
“environmental concern”, “ethical self-identity”, and “food safety concern” had sufficient

30
internal reliability consistency with the cronbach’s alpha of 0.75, 0.84, and 0.76, respectively.
Consequently, the aggregate scores of the respondents for the three factors were calculated.
In conclusion, factor analysis and reliability tests confirmed that the variables above had the
assumed constructs and sufficient internal reliabilities for further analysis.
4.3.2 Use of organic logos when buying yoghurt
The degree of using of organic logos was classified into three user categories including “Non-
users”, “Occasional users” and “Habitual users” of organic logos when buying yoghurt. The
original variable was recoded with “1 = Non-users”, “2 & 3 = Occasional users”, “4 & 5 =
Habitual users”. As a result, almost half of respondents never used organic logos when buying
yoghurt (49%), about one-third (32%) not frequently used those logos, and 19% frequently
used organic logos.
4.3.2.1 Consumers’ possible motives and barrier depending on User categories
Results of comparing means of those items across three user groups were showed in Table
4.7. The post hoc test results for “general attitude”, “taste”, “healthiness”, “quality”,
“trustworthiness” and “packaging” were significantly different over the three user of organic
logos categories (P<0.001). Firstly, consumers, who used organic logos more frequently when
buying yoghurt, held more positive attitude towards this product compared to the other two
groups (P<0.001).
Next, consumers, who used organic logos more frequently, agreed that organic yoghurt was
tastier, healthier, had better quality, was more trustworthy, and had more attractive package
than those who did not frequently use and those who never used organic logos (P < 0.001).
The detection that consumers had stronger belief that organic yoghurt was healthier and tastier
as compared to conventional yoghurt confirmed the findings of Howlett et al. (2002) and
Toschi et al. (2012). Howlett et al. (2002) used laddering technique for exploratory research
found that “health” concern was one of the most important drivers for the purchase of organic
yoghurt. In addition, Toschi et al. (2012) studied the product development issue, identified
that the “taste” of organic yoghurt had high acceptability level as compared to conventional
yoghurt. This indicated the preferences of consumers for the taste of organic yoghurt.
Additionally, respondents who used the organic logos more often, thought that organic
yoghurt was more environmentally friendly and safer than those who never used those logos
(P<0.001). In addition, people, who occasional used organic logos, did not have significantly
different scoring for environmental aspect as compared to the other two groups. No
significant difference was found in the scoring for “safety” between the non-users and
occasional users of organic logos.

31
Table 4.7 Consumers’ possible motives, barrier, concerns, perceived behavioural control
and behaviour depending on User categories
Items
Use of organic logos when buying
F P Non-
users
Occasional
users
Habitual
users
Possible motives
1. General attitude* 4.31a 5.27b 6.23c 86.72 < 0.001
2. Taste 4.07e 4.50f 5.33g 49.18 < 0.001
3. Healthiness 4.78a 5.20b 5.88c 39.14 < 0.001
4. Environmental friendliness 4.83e 4.98e,f 5.36f 7.35 < 0.002
5. Safety 4.45e 4.53e 4.92f 6.57 < 0.002
6. Quality 4.45a 4.81b 5.56c 37.75 < 0.001
7. Trustworthiness 4.24e 4.53f 5.16g 24.74 < 0.001
8. Packaging 3.89e 4.10f 4.43g 13.31 < 0.001
Possible barrier
Price 2.51a 2.67a 3.17b 14.09 < 0.001
Possible concerns and involvement
Ethical self-identity 4.04e 4.69f 5.25g 31.68 < 0.001
Food safety concern 4.20a 4.72b 5.45c 31.48 < 0.001
Environmental concern 5.49a 5.81b 6.19c 12.77 < 0.001
Involvement 3.20e 4.42f 5.57g 92.92 < 0.001
Perceived behavioural control
PCE 4.13a 4.55a,b 4.88b 6.80 < 0.001
Perceived availability 3.28a 3.41a 3.87b 11.11 < 0.001
Intention and behaviour
Behavioural intention ** 1.75e 3.43f 5.83g 199.09 < 0.001
Frequency of consumption *** 2.76a 3.19a,b 3.76b 4.05 <0.05
Frequency of buying **** 0.31e 3.00f 7.29g 440.60 < 0.001
Price was identified as a possible barrier for the consumers in eating organic yoghurt.
Respondents, who used the organic logos more often, had stronger belief that the price of
organic yoghurt was not much expensive as compared to conventional yoghurt, than the
occasional users and non-users of organic logos. No significant difference was found in the
scoring for “price” between the non-users and occasional users of organic logos.
a, b, c indicate significantly different means using Scheffe Post Hoc; e, f, g indicate significantly different means using Dunnett T3 Post Hoc; *“General attitude” was measured on a 7-point semantic bipolar scale; **“Behavioural intention” was measured on 7-point scale (1= very unlikely, 7= very likely); *** “Frequency of consumption” was measured on 6-point scale (from 0 = never, to 6.5 = daily or almost daily); **** “Frequency of buying” was measured on an 11-point scale (from 0 to 10); Other possible motives and barrier were measured on a 7-point interval scale (1= much worse, 7= much better); All the other scales were measured on a 7-point Likert scale of agreement (1= totally disagree, 7= totally agree)

32
4.3.2.2 Consumers’ concerns and involvement depending on User categories
The four items namely “ethical self-identity”, “food safety concern”, “environmental
concern”, and “involvement” in organic food, were significantly different for all users of
organic logos categories (Table 4.7). Consumers, who used organic logos more frequently,
were more concerned for ethical self-identity, food safety issue, environmental aspect of the
product and were more involved in organic food in comparison to those who did not use
organic logos frequently or at all (P<0.001).
4.3.2.3 Consumers’ perceived behavioural control depending on User categories
The post hoc test results showed that consumers, who frequently used the organic logos,
scored higher for the PCE than those who never used organic logos when buying yoghurt
(Table 4.7). This meant that consumers, who used organic logos more frequently, had stronger
belief that their activity could contribute to make a positive change related to the environment
than those who never used organic logos. The occasional users of organic logos did not have
significantly different scoring for the PCE compared to the other two groups. Next,
respondents, who used the organic logos more often, found that it was not so much difficult to
find this product in the market compared to the occasional users and those who never used
organic logos.
4.3.2.4 Consumers’ behavioural intention, frequency of consumption and frequency of
buying depending on User categories
The mean intention of consumers in eating organic yoghurt across different user groups was
displayed in Table 4.7. The higher intention of eating organic yoghurt, the more likely that
people belonged to higher frequently use of organic logos group when buying the product.
Next, the mean consumption frequency of yoghurt and mean buying frequency of organic
yoghurt for different user categories of organic logos were reported (Table 4.7). People, who
used the organic logos more frequently, displayed higher frequency of eating yoghurt than
those who never used organic logos. Consumers, who did not frequently use of organic logos,
did not have significantly different scoring for the frequency of consumption in comparison to
the other two groups. In addition, the scoring for the frequency of buying organic yoghurt was
clearly significantly different over the three user categories of organic logos. Respondents,
who frequently used organic logos, were likely to buy organic yoghurt more often than those
who did not often use and who never used organic logos (P<0.001).
4.3.3 Correlation analysis
4.3.3.1 Correlation matrix of “general attitude” and belief items
The relationship between consumers’ general attitude and belief items were explored via the
performance of correlation test (Table 4.8). High correlation coefficients were found between

33
general attitude and taste, healthiness, quality, trustworthiness (i.e. correlation coefficients
were equal or higher than 0.48). Consumers with a more positive attitude towards organic
yoghurt had very strong belief that organic yoghurt was tastier, healthier, had better quality
and was more trustworthy than conventional yoghurt. In addition, “price” and “perceived
availability” displayed positive significant associations with “general attitude”, however, the
correlation coefficients were not too strong, which indicated that respondents who reported
positive feelings for organic yoghurt, agreed that organic yoghurt was not much expensive
and not difficult to find the market in comparison to conventional yoghurt. Furthermore,
people with positive attitude believed that organic yoghurt was safer and had more attractive
package than conventional yoghurt.
4.3.3.2 Correlation matrix of “frequency of buying” and other variables
Firstly, “frequency of buying” had a very strong positive significant relation with the “use of
organic logos” when purchasing, which indicated that people, who used the organic logos
more frequently, were likely to buy the product more often (Table 4.9). Secondly, a positive
relation between “frequency of buying” and “frequency of consumption” was detected, which
meant that the more often respondents consumed yoghurt, the more frequently they bought
the organic yoghurt. Next, the higher intention to eat organic yoghurt people reported, the
more frequently they bought it, which confirmed foundations of the theory of planned
behaviour (Aizen, 1991).
Fourthly, the more frequently people bought organic yoghurt, the more they were willing to
pay higher extra amount for this product. Additionally, people, who purchased organic
yoghurt more frequently, held more positive attitude towards organic yoghurt, and thought
that it was not difficult to find organic yoghurt in the market in comparison to the
conventional yoghurt. Next, PCE was positively related with “frequency of buying”, thus,
people, who had stronger belief that their activity could contribute for a positive change in the
environmental issues, were likely to buy this product more often. This result confirmed the
finding by Vanhonacker and Verbeke (2009).
Furthermore, people, who were more concerned about ethical self-identity and food safety
issue, were likely to buy organic yoghurt more often. These results confirmed the findings of
Michaelidou and Hassan (2008) and Stozl et al. (2011). The last two items were “perceived
importance of environmental characteristics” and “involvement” in organic food, both items
were positively associated with “frequency of buying”. This showed that the more people
perceived the environmental characteristics of a product is important, the higher frequency
that they bought organic yoghurt. In addition, the stronger people were involved in organic
food, the more frequently they bought organic yoghurt. This result confirmed the finding by
Vermeir and Verbeke (2006).

34
Table 4.8 Correlation matrix of “general attitude” and belie f items
Items Mean SD 1 2 3 4 5 6 7 8 9
1. General attitude 4.97 1.30 1.00
2. Taste 4.45 1.05 0.60 1.00
3. Healthiness 5.12 1.00 0.58 0.57 1.00
4. Price 2.69 0.95 0.15 0.21 0.19 1.00
5. Safety 4.56 0.98 0.31 0.32 0.51 0.18 1.00
6. Quality 4.77 1.02 0.54 0.60 0.68 0.27 0.64 1.00
7. Perceived availability 3.44 0.94 0.16 0.25 0.16 0.36 - 0.24 1.00
8. Trustworthiness 4.50 1.02 0.48 0.46 0.57 0.26 0.64 0.67 0.20 1.00
9. Packaging 4.06 0.80 0.30 0.35 0.26 0.27 0.22 0.29 0.19 0.29 1.00
Table 4.9 Correlation matrix of “frequency of buying” and ot her variables
Items Mean SD 1 2 3 4 5 6 7 8 9 10 11 12
1. Frequency of buying 2.49 3.14 1.00
2. Use of organic logos 2.08 1.27 0.86 1.00
3. Frequency of consumption 3.10 2.65 0.11* 0.12* 1.00
4. Behavioural intention 3.06 2.16 0.75 0.72 0.25 1.00
5. WTP 0.33 0.33 0.42 0.38 0.12* 0.33 1.00
6. General attitude 4.97 1.30 0.58 0.56 0.10* 0.53 0.39 1.00
7. Perceive availability 3.44 0.94 0.25 0.24 - 0.19 0.13* 0.16 1.00
8. PCE 4.41 1.60 0.20 0.19 - 0.12* 0.19 0.24 - 1.00
9. Ethical self-identity 4.47 1.27 0.37 0.37 - 0.30 0.26 0.38 - 0.39 1.00
10. Food safety concern 4.60 1.26 0.39 0.37 0.11* 0.34 0.26 0.40 0.21 0.16 0.45 1.00
11. Perceived importance of
environmental characteristics
5.10 0.94 0.58 0.53 - 0.53 0.43 0.60 0.24 0.34 0.54 0.52 1.00
12. Involvement 4.04 1.62 0.56 0.57 - 0.53 0.44 0.60 0.18 0.40 0.58 0.55 0.67 1.00
All coefficients are significant at the 0.01 level (2-tailed), * Correlation is significant at the 0.05 level (2-tailed). Table 4.8 all items were measured on 7-point scale Table 4.9 item 1: 11- point scale (from 0 to 10); item 2: 5- point scale; item 3: 6- point scale ; item 5: 16-point scale (from €0.00 to €1.50); items 4, 6 � 12: 7- point scale

35
4.3.4 Attitudinal and behavioural variables depending on socio demographic
characteristics
4.3.4.1 The frequency of using organic logos by gender
Consumers’ use of organic logos by gender was identified in Figure 4.2 and Table A-4
ANNEX (Cross tabulation, Chi-Square test, Pearson2χ = 8.86, P<0.05). A significant
difference in the distribution of gender across the three user categories of organic logos was
detected. Female were considered to use organic logos more often than male when buying
organic yoghurt. This result had to take into account the fact that our sample was biased
towards higher number of females as compared to males.
0.00%
10.00%
20.00%
30.00%
40.00%
50.00%
60.00%
70.00%
Non-users Occasional users Habitual users
Male
Female
Figure 4.2 The distribution of male and female across User categories of organic logos
4.3.4.2 Behavioural variables depending on socio demographic characteristics
The difference in the mean scoring for frequency buying and frequency of consumption of
male and female was investigated (Table 4.10). On average, female had a higher frequency of
buying organic yoghurt and higher frequency of consumption of yoghurt than male. The mean
yoghurt consumption of female in our sample was 3.42/6.50, which meant women in our
sample had relatively high level of yoghurt consumption (i.e. 2 to 4 times per week on
average). This result supported the findings of Lowe and Worsley (2003) who discovered that
women in Beijing, China had high level of yoghurt consumption.
Table 4.10 Consumers’ behaviour depending on gender and responsible food shoppers
Items Gender T P Responsible food shoppers F P
Male Female Main Together Others
Frequency of buying 1.89 2.84 -3.04 < 0.05 - - - - -
Frequency of consumption 2.61 3.42 -2.99 < 0.05 3.46a 2.89a,b 2.29b 4.59 < 0.05
Behavioural intention 2.61 3.33 -3.38 < 0.05 - - - - -
a, b, c indicate significantly different means using Scheffe Post Hoc;
Furthermore, the difference in the mean consumption frequency of different groups of
responsible food shoppers was examined. Consumers, who were the main responsible for

36
food shopping, were likely to consume yoghurt more often than the case that other people
took responsibility for food shopping. There was no significant difference in the scoring for
frequency of consumption between people who co-responsible shopping and other two
groups. Finally, female had more intention in eating organic yoghurt than male. This result
confirmed the findings of Rimal et al. (2005), and Vermeir and Verbeke (2006). In addition,
age was found not to be a significant prediction of behavioural intention of consumers (P =
0.127, one-way ANOVA F test), which was the same as a finding of Davies et al. (1995).
4.3.5 Regression Analysis
Theoretical framework
The theoretical framework (Figure 4.3) of regression analysis was conducted based on the
framework that was presented in the literature study (see Figure 2.2) with more elaborated
items of information search including knowledge and frequency of using organic logos. The
behavioural variables were detailed with frequency of consumption of yoghurt and frequency
of buying organic yoghurt.
Figure 4.3 Theoretical framework of regression models
(1) Engel et al. (1995); (2) Vermeir and Verbeke (2006); (3) Michaelidou and Hassan (2008); (4) Magnuson et al. (2003); (5) Aizen (1991); (6) Bettman (1979)
QTSH: Quality, trustworthiness, safety, healthiness
Belief Taste QTSH Price
Packaging
Attitude Behaviour
Perceived behavioural control
Personal needs and motivations
Perceived
availability
Perceived consumer
effectiveness
Involvement
Consumers’
concerns
(1)
(2) (2) (2) (3,4)
(2) (2)
(5)
Frequency of buying
Use of organic logos
Frequency of consumption
Knowledge
Information search
Internal search
Memory
External search
Product labels
Items put in the model
Show the reasoning for some items e.g. Knowledge, Use of organic logos
Behavioural intention
(6) (6)
(5)

37
The results of three regression models using stepwise method were presented. Model 1
showed the regression of the “general attitude” as a dependent variable. Model 2 presented the
regression of “behavioural intention” as dependent variable. Model 3 displayed regression of
“frequency of buying” as dependent variable.
Model 1
In the first model, the “general attitude” had been entered as the dependent variable, whereas
independent variables were: price, taste, trustworthiness, healthiness, safety, quality,
perceived availability, packaging, which stated that the organic yoghurt scores worse/better
than conventional yoghurt for those items. The regression result showed that the general
attitude towards organic yoghurt was largely affected by “taste”, and then followed by
“healthiness” and “trustworthiness”; together those variables explained 45% of the variance of
general attitude of consumers (Figure 4.4 and Table 4.13).
Figure 4.4 Relations of regression models
Taste
Healthiness
Price
Safety
Quality
Availability
Trustworthiness
Packaging
General attitude
R2 = 0.45
Frequency of buying
R2 = 0.79
Use of organic logos when
buying
Behavioural intention R2 = 0.63
Frequency of consumption
Perceived importance of
env.ch
Ethical self-identity
Food safety concern
Involvement in organic
food
Objective knowledge
n.s
n.s
β = 0.14**
β = 0.12*
β = 0.08*
β = 0.17**
β = 0.53**
β = 0.57**
β = 0.24**
β = 0.07*
β = 0.10**
n.s
n.s
n.s n.s
Bel
ief i
tem
s
Consumer’ concerns and personal motivations Behaviour
n.s
β = 0.10*
β = 0.36**
β = 0.15**
β = 0.29**
Show significant variables in model 1
Show significant variables in model 2
Show significant variables in model 3
* indicatedβ significant at 0.05 level (2-tailed); * * indicatedβ significant at 0.01 level (2-tailed); n.s: not significant
- General attitude (7-point scale); Behavioural intention (7-point scale, “very unlikely” to “very likely”); Frequency of buying organic yoghurt (11- point scale, from 0 to 10); - Price, Taste, Trustworthiness, Healthiness, Safety, Quality, Perceived Availability, Packaging (7-point scale, 1= much worse, 7= much better); - Ethical self-identity, Food safety concern, Involvement in organic food (7-point scale, 1= totally disagree, 7= totally agree); Perceived importance of environmental characteristics (env.ch) (7-point scale); Objective knowledge (ranging from 0 = 0 correct answer, 4= 4 correct answers); Frequency of consumption (6-point scale, from 0 to 6.5); Use of organic logos when buying (5-point scale, with 1= never, 5= always)

38
Model 2
The second model used the “behavioural intention” as the dependent variable, the independent
variables were all the belief items as mentioned in the first model, general attitude, ethical
self-identity, food safety concern, involvement in organic food, perceived importance of
environmental characteristics, objective knowledge, consumption frequency, and frequently
use of organic logos. It is clearly that the intention to eat organic yoghurt was mostly
influenced by the “use of organic logos”, and then followed by the “frequency of
consumption”, “involvement”, “perceived importance of environmental characteristics” of the
product, and “healthiness”. The total variance explained by the model 2 was 63% (Figure 4.4
and Table 4.13).
There were several reasons why the perceived consumer effectives (PCE) was not put in the
model. The PCE was first introduced to the model 2, nevertheless, the findings showed that
this variable had a negative coefficient (Table 4.11), while it had positive correlations with
other items in the model 2. Several tests were applied. Firstly, multicolinearity was tested
(Table 4.11 and Table 4.12). The correlation coefficients of PCE and other items that
significant in model 2, were below 0.5 (Table 4.12), and the variance inflation factor (VIF) of
the items in the model 2 had values far less than 10 and the tolerance was above 0.1 for each
item (Table 4.11)9. In addition, PCE was significant (i.e. had a p-value less than 0.05) in the
model 2 (Table 4.11) and the sample size was quite large (N= 404). Thus, there seemed to be
no problem of multicolinearity of the PCE with other variables in the model.
Table 4.11 Regression result of Model 2 if include PCE
Items Beta T Collinearity Statistics Correlations
Tolerance VIF Zero-order Partial
Use of organic logos 0.52** 11.38 0.59 1.70 0.74 0.55
Involvement 0.18** 3.37 0.45 2.23 0.60 0.19
Frequency of consumption 0.18** 5.08 0.98 1.02 0.25 0.29
Perceived importance of
env.ch***
0.14** 2.80 0.52 1.92 0.55 0.16
Healthiness 0.11* 2.56 0.71 1.42 0.45 0.15
PCE -0.11** -2.90 0.85 1.18 0.12 -0.17
*P ≤ 0.05; ** P ≤ 0.01; *** env.ch: environmental characteristics; Dependent variable: “Behavioural intention”
Secondly, suppressor effect was examined. In this case, the PCE variable had the reverse sign
which meant negative beta coefficient with behavioural intention, while the Pearson
correlation was positive. Table 4.12 showed that PCE higher correlated with independent
variables (X) including “use of organic logos”, “involvement”, “perceived importance of
environmental characteristics”, “healthiness”; but weakly correlated with the dependent
variable “behavioural intention” (Y). More specifically, there was weak correlation (0.12) at
9 http://www.ats.ucla.edu/stat/spss/webbooks/reg/chapter2/spssreg2.htm (UCLA Academic Technology services)

39
5% level of significance between PCE and behavioural intention, while correlations of PCE
and other variables were higher and significance at 1% level (Table 4.12). According to
Darmawan and Keeves (2006), all those signals together could be link to the net suppression.
Table 4.12 Correlation of PCE with other items that significant in Model 2
Items Mean SD 1 2 3 4 5 6 7
1. PCE 4.41 1.60 1.00
2. Use of organic logos 2.08 1.27 0.19 1.00
3. Involvement 4.04 1.62 0.40 0.57 1.00
4. Frequency of consumption 3.10 2.65 - 0.12* - 1.00
5. Perceived importance of en.ch** 5.10 0.94 0.34 0.53 0.67 - 1.00
6. Healthiness 5.12 1.00 0.24 0.42 0.52 - 0.50 1.00
7. Behavioural intention 3.06 2.16 0.12* 0.72 0.53 0.25 0.53 0.44 1.00
All coefficients are significant at the 0.01 level (2-tailed); *Correlation is significant at the 0.05 level (2-tailed);
**env.ch: environmental characteristics
An additional way to identify the suppressor variable was when the partial correlation higher
than zero-order correlation, or there was the opposite sign (positive versus negative) of zero-
order correlation (or Pearson’ r) and partial correlation10. Table 4.11 showed the reverse sign
of those two correlations for PCE variable. Consequently, it may be concluded that PCE was
more likely to be a suppressor variable.
The suppressor variable could be checked by adding and not adding the tested variable in the
model and reporting the differences in the two cases11. Firstly, the PCE was included in the
model 2, its correlation was negative which had no meaning for the explanation of the
dependent variable. Secondly, this variable was not included in the model 2, the coefficients
of other variables were more or less the same and the model was meaningful. Thus, we
decided not to include this variable in the model 2 and model 3.
Furthermore, the “frequency of consumption” had a partial correlation higher than zero-order
correlation (Table 4.11), thus, it could be a suppressor variable. We first included it in the
model, it had significant correlation and meaningful to the model. Secondly, the model 2 was
analyzed without this variable, the coefficient of other variables were more or less the same
while the R square reduced to 0.60. Thus, we decided to keep this variable in the model since
it was an important significant variable and could contribute to the explanation of the model.
The regression result without the use of PCE variable was described in Figure 4.4.
Model 3
Model 3 was the main model to be presented. The dependent variable was “frequency of
buying” of organic yoghurt, the independent variables included all variables in the model 1
and model 2, general attitude, and behavioural intention. After running the regression model, 10 http://www.umich.edu/~ed793/labs/lab04_w04.doc (The course note of the University of Michigan) 11 http://www.umich.edu/~ed793/labs/lab04_w04.doc

40
the achieve variables were the “use of organic logos” (X1), “behavioural intention” (X2),
“price” (X3) (i.e. consumers’ belief that the price of organic yoghurt was worse/better than
conventional yoghurt), “perceived importance of environmental characteristics” (X4),
“general attitude” (X5). Regression equation for model 3 was indicated.
0 1 1 2 2 3 3 4 4 5 5Y X X X X Xβ β β β β β ε= + + + + + +
The results of regression analysis were reported in Table 4.13. The interpretation of regression
coefficients was presented.
Table 4.13 Multiple linear regression results of the three models
Items
Standardized
Coefficients
Beta (β ) T R F-test
General attitude towards organic yoghurt (Model 1) 0.45 101.34**
Taste 0.36** 7.33
Healthiness 0.29** 5.61
Trustworthiness 0.15** 3.14
Behavioural intention (Model 2) 0.63 102.72**
Frequency of using of organic logos 0.53** 11.61
Frequency of consumption 0.17** 4.89
Involvement 0.14** 2.75
Perceived importance of the env.ch 0.12* 2.53
Healthiness 0.10* 2.47
Frequency of buying organic yoghurt (Y) (Model 3) 0.79 233.36**
Frequency of using of organic logos (X1) 0.57** 13.77
Behavioural intention (X2) 0.24** 5.92
Price (X3) 0.10** 3.65
Perceived importance of env.ch (X4) 0.08* 2.13
General attitude (X5) 0.07* 2.02
* P ≤ 0.05 ** P ≤ 0.01
Standardized coefficients were used because those coefficients had accounted for different
scales of the variables. Firstly,1 0.57β = , which indicated that keeping all the items in the
equation constant, if the use of organic logos when buying increases one unit, the frequency
of buying organic yoghurt will increase with 0.57 unit. Secondly, 2 0.24β = , this showed that
keeping all other items constant, if the eating intention of organic yoghurt rises one unit, the
frequency of buying will grow with 0.24 unit. Next,3 0.10β = , which meant that keeping all
the items constant, if increase one unit in the belief of people that the price of organic yoghurt
is not so expensive as compared to conventional yoghurt, the frequency of buying will
increase with 0.10 unit. Fourthly,4 0.08β = , indicated that if people perceived for the
importance of environmental characteristics of the product increase one unit, the frequently

41
buying will increase with 0.08 unit. Finally,5 0.07β = , showed that if the general attitude or
feelings of consumers towards organic yoghurt increase one unit, which mean to the positive
trend, the frequency of buying will increase with 0.07 unit. All the five variables are
significant at the 5% level. The variables in model 3 together explained 79.4% of the variance
of frequency of buying of the consumers.
These results show that the frequency of buying organic yoghurt is mostly influenced by the
frequency of using of organic logos, then by the intention to eat organic yoghurt. Next, the
frequency of purchasing organic yoghurt is affected by price, then followed by the perceived
importance of environmental characteristics, and the general attitude of consumers towards
organic yoghurt to a lesser degree of influence.
Objective knowledge was included in the model, however, even it did not appear (not
significant) in the model, it actually did contribute to the higher explanation of the model.
This could be explained by the positive correlation of objective knowledge with some items
such as “taste”, “food safety concern”, “perceived availability”, and their interaction could
support the model.
Discussion of the three models
“Taste” had the high coefficient in model 1 towards the general attitude of consumers. Thus,
keeping all other variables in model 1 constant, if consumers had stronger belief that organic
yoghurt was tastier than conventional yoghurt, they will have more positive attitude towards
organic yoghurt. The same findings were identified for “healthiness”, “trustworthiness”. The
three variables including “taste”, “healthiness”, “trustworthiness” appeared in the model 1
with “general attitude” as dependent variables, could be explained by the fact that the
correlation of each variable with “general attitude” was very high (equal or larger than 0.48)
(See Table 4.8). Consequently, a policy implication could be the communication of the
quality attributes such as “taste”, “healthiness”, “trustworthiness” of organic yoghurt to the
consumers. Stolz et al. (2011) conducted a study on the consumer attitude towards organic
versus regular milk, yoghurt and apple and concluded that the communication of quality
attributes or credence attributes towards those products may improve the attitude of
consumers towards organic product consumption.
The results from model 2 and model 3 showed that the “use of organic logos” had a very high
coefficient on the behavioural intention (i.e. intention of eating organic yoghurt) and
frequency that people buy organic yoghurt. Thus, if one wants to increase the intention to eat
organic yoghurt or frequency that people buy organic yoghurt, he/she should focus on the
communication of the organic logos to the consumers. Since the frequency of using organic
logos is an important variable which contributed much to the changing of buying frequency,
the exploration of the frequency of using organic logos was presented.

42
The result of frequency using of organic logos when buying yoghurt showed that 49% of
people never used organic logos when buying yoghurt, 16.9% rarely, 15.2% sometimes,
14.4% regularly and only 4.5% always use those logos. This result indicated that there are a
large proportion of people who never and not frequent use of organic logos when buying
yoghurt. Thus, food marketers are encouraged to increase the use of organic logos when
buying yoghurt through an informational campaign targeted to those who are never or not
frequently use of organic logos. For example, organic logos could be introduced by many
means of media such as TV, websites, newspapers, and magazines to reach different kinds of
consumers. Another example could be the campaign such as the integration of the knowledge
of organic logos in some game shows which could help consumers in recognizing and using
the organic logos easier, and thus facilitating conditions to increase their consumption towards
organic yoghurt.
Comparing the three models, it could be seen that model 1 with attitudinal variables had the
lowest total explanation for the dependent variable “general attitude”. As we increased the
attitudinal and behavioural variables in model 2, the total variance explained increased for
“behavioural intention” as dependent variable. Finally, model 3 used of “frequency of
buying” organic yoghurt as a dependent variable, and added all the variables from the two
previous models, yielding the highest total variance explained for the dependent variable.
Therefore, the results of those step-running models confirmed the theoretical framework that
was assumed based on consumers attitudinal and behavioural variables towards organic
yoghurt.
4.3.6 Cluster analysis
4.3.6.1 Means rating of the segments on the classification variables
The three variables identified with the factor analysis (Table 4.6) were further used for cluster
analysis. The result of clusters analysis with three clusters solution was shown in the Table
4.14. Three segments were identified including (1) Low concerned consumers, (2) Medium
concerned consumers, and (3) Very concerned consumers. The key characteristics of the three
segments were described.
Table 4.14 Means rating of the segments on the classification variables
Items
Segment 1
Low concerned
consumers
Segment 2
Medium concerned
consumers
Segment 3
Very concerned
consumers
F P
Valid N (Total N = 387) 91 173 123
Size (% of the sample) 23.5 44.7 31.8
Environmental concern 4.67 5.72 6.51 131.70 < 0.001
Ethical self-identity 2.99 4.43 5.61 255.76 < 0.001
Food safety concern 3.39 4.40 5.76 197.65 < 0.001

43
Segment 1 constituted of 23.5% of the sample. Respondents in this segment showed the
lowest concerns for ethical self-identity and food safety issue. They considered themselves as
less environmental concern than consumers in segment 2 and segment 3. Thus, we named this
segment as “Low concerned consumers”.
Segment 2 accounted for 44.7% of the sample which was the largest segment among the three
segments. Consumers in segment 2 perceived themselves as having better concern for
environmental aspect as compared to consumers in segment 1. In addition, consumers in
segment 2 indicated a medium concern for ethical self-identity and food safety issue (i.e. the
scoring of ethical self-identity and food safety issue are above neutral points). Consequently,
we referred to this segment as “Medium concerned consumers”.
Segment 3 accounted for 31.8% of the sample. Consumers in this segment had high concern
for ethical self-identity and food safety issue compared to the other two segments. At the
same time, consumers in segment 3 had a very high concern for environmental aspect as
compared to consumers in segment 1 and segment 2. Therefore, those respondents were
referred to as “Very concerned consumers”.
4.3.6.2 Profile of the segments on attitude and behaviour variables
The three segments were significantly different in the mean “general attitude”, PCE,
“involvement”, “use of organic logos” when buying, “behavioural intention”, and “frequency
of buying” (Table 4.15).
First, the “very concerned consumers” reported higher positive feelings towards organic
yoghurt, and stronger belief that their activities could contribute for the positive change in the
environment, than the medium and low concerned consumers (P<0.001). Secondly,
respondents who were very concerned for ethical self-identity, food safety and environmental
issues, tended to involve more in organic food, and use organic logos more frequently than
those who had medium concerned and low concerned (P<0.001). Furthermore, the “very
concerned consumers” had higher intention to eat organic yoghurt, higher frequency of
buying this product than the medium and low concerned consumers (P<0.001). Next, the
“very concerned consumers” were willing to pay more for organic yoghurt than the medium
and low concerned respondents. No significant difference was found in the scoring for the
WTP between the low and medium concerned consumers.
The findings that the “very concerned consumers” (i.e. segment 3), perceived themselves as
more effective, more frequently use of organic logos, and at the same time they reported
higher buying frequency for organic yoghurt in comparison to the consumers in other
segments, leaded to the implications for food marketers. In order to increase the frequency of
buying organic yoghurt, food marketers could try to increase the PCE and the use of organic
logos for consumers in segment 1 and 2. Firstly, in order to increase the PCE for consumers in

44
segment 1 and 2, different types of media such as TV, the Internet could be used to increase
consumers’ belief that their daily consumption behaviour could contribute to the conservation
for the environment. Secondly, as specified in the regression result, the frequently use of
organic logos was very important in affecting the frequency of buying of consumers. Since
the frequency of using organic logos of segment 1 and 2 were lower than segment 3, food
marketers may need to focus on improving the use of organic logos when buying for those
consumers through an informational campaign.
Table 4.15 Profile of the segments on attitude and behaviour variables
Items
Segment 1
Low
concerned
consumers
Segment 2
Medium
concerned
consumers
Segment 3
Very
concerned
consumers
Total
(N=387)A F P
Attitude and behavioural items
General Attitude* towards
organic yoghurt 4.13e 4.93f 5.67g 4.96 40.59 < 0.001
PCE 3.56a 4.43b 5.03c 4.41 23.44 < 0.001
Involvement in organic food 2.60a 3.90b 5.23c 4.02 106.57 < 0.001
Use of organic logos** 1.37e 1.97f 2.68g 2.06 33.73 < 0.001
WTP*** 0.21e 0.31e 0.42f 0.33 10.01 < 0.001
Behavioural intention**** 1.88e 3.03f 3.85g 3.02 24.61 < 0.001
Frequency of buying***** 0.92e 2.06f 4.06g 2.43 33.38 < 0.001
Belief items
Taste 3.92e 4.44f 4.82g 4.44 20.72 < 0.001
Healthiness 4.70e 5.02f 5.58g 5.12 23.75 < 0.001
Environmental friendliness 4.81e 4.85e 5.34f 4.99 10.26 < 0.001
Safety 4.23e 4.48e 4.92f 4.56 14.64 < 0.001
Quality 4.28e 4.66f 5.24g 4.75 27.17 < 0.001
Perceived availability 3.28a 3.36a,b 3.61b 3.42 3.89 < 0.05
Trustworthiness 4.13e 4.43f 4.89g 4.50 15.91 < 0.001
Packaging 3.82e 4.02e 4.31f 4.06 10.16 < 0.001
Price 2.40a 2.65a 2.92b 2.67 8.34 < 0.001
a, b, c indicate significantly different means using Scheffe Post Hoc
e, f, g indicate significantly different means using Dunnett T3 Post Hoc
*using 7-point scale; **using 5 point-scale (1= never, 5= always); ***using 16 point-scale (€0.00 to
€1.50);****using 7 point scale (1= very unlikey, 7= very likely); *****using 11 point-scale (0 to 10);
PCE and “involvement” use the 7-point scale (1 = totally disagree, 7= totally agree);
All belief items which stated that organic yoghurt scored worse/better than conventional yoghurt use 7 point-
scale (1=much worse, 7=much better); A note that the total sample for cluster analysis was 387 (resulted from taking the valid value for all three
variables of consumers’ concerns, see Table 4.14)

45
Profile of the segments on belief variables
The mean values of belief items were compared across three segments in Table 4.15. The
scoring for “taste”, “healthiness”, “quality”, “trustworthiness” were significantly different for
all three segments. The “very concerned consumers” had stronger belief that organic yoghurt
was tastier, healthier, had better quality, and was more trustworthy than conventional yoghurt,
compared to the medium and low concerned consumers.
Since the “very concerned consumers” (i.e. segment 3), who had stronger belief that organic
yoghurt was tastier, healthier, had better quality, and was more trustworthy than conventional
food, tended to buy organic yoghurt more frequently than consumers in other segments did,
implications could be drawn. If one wants to increase the frequency of buying of organic
yoghurt of consumers in segment 1 and 2, he/she should improve the belief of people in those
segments, that organic yoghurt was tastier, healthier, had better quality, and was more
trustworthy than the conventional yoghurt. The recommendation for food marketers is the
concentration on the communication of product attributes such as offering consumers chances
to taste organic yoghurt. Additionally, further information on the healthiness and quality
attributes of organic yoghurt should be provided to the consumers, using many means of
communication (e.g. TV, websites, newspapers, magazines) that were suitable for those
consumers as they were younger than people in segment 3 (See Table 4.16).
Next, the “very concerned consumers”, had stronger belief that organic yoghurt was more
environmentally friendly, safer and not so expensive, had more attractive package compared
to the medium and low concerned consumers. Finally, the “very concerned consumers”
thought that it was not much difficult to find organic product in the market than the “low
concerned consumers”. “Medium concerned consumers” did not have significant difference in
the scoring for “perceived availability” compared to the other two groups.
4.3.6.3 Socio demographics profile of the segments
The segments were described in some following socio demographics variables including
mean age, age classes, and occupation (Table 4.16).
The mean age of low concerned consumers, was lower as compared to the medium and very
concerned consumers. Thus, it could be seen that older people were likely to have higher
concerned. Additionally, consumers aged from 25 to 55 years shared largest proportion in
each segment. Finally, the “full time paid work” made up highest proportion in each segment.
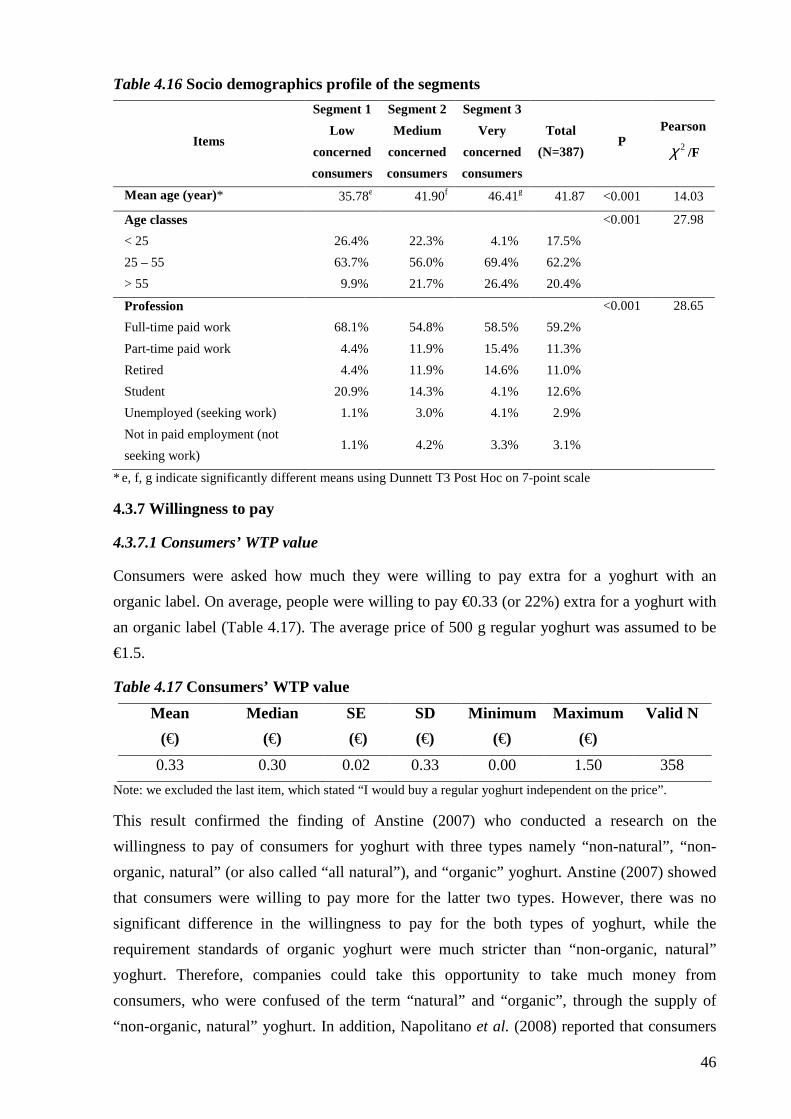
46
Table 4.16 Socio demographics profile of the segments
Items
Segment 1
Low
concerned
consumers
Segment 2
Medium
concerned
consumers
Segment 3
Very
concerned
consumers
Total
(N=387) P
Pearson
2χ /F
Mean age (year)* 35.78e 41.90f 46.41g 41.87 <0.001 14.03
Age classes <0.001 27.98
< 25 26.4% 22.3% 4.1% 17.5%
25 – 55 63.7% 56.0% 69.4% 62.2%
> 55 9.9% 21.7% 26.4% 20.4%
Profession <0.001 28.65
Full-time paid work 68.1% 54.8% 58.5% 59.2%
Part-time paid work 4.4% 11.9% 15.4% 11.3%
Retired 4.4% 11.9% 14.6% 11.0%
Student 20.9% 14.3% 4.1% 12.6%
Unemployed (seeking work) 1.1% 3.0% 4.1% 2.9%
Not in paid employment (not
seeking work) 1.1% 4.2% 3.3% 3.1%
* e, f, g indicate significantly different means using Dunnett T3 Post Hoc on 7-point scale
4.3.7 Willingness to pay
4.3.7.1 Consumers’ WTP value
Consumers were asked how much they were willing to pay extra for a yoghurt with an
organic label. On average, people were willing to pay €0.33 (or 22%) extra for a yoghurt with
an organic label (Table 4.17). The average price of 500 g regular yoghurt was assumed to be
€1.5.
Table 4.17 Consumers’ WTP value
Mean
(€)
Median
(€)
SE
(€)
SD
(€)
Minimum
(€)
Maximum
(€)
Valid N
0.33 0.30 0.02 0.33 0.00 1.50 358
Note: we excluded the last item, which stated “I would buy a regular yoghurt independent on the price”.
This result confirmed the finding of Anstine (2007) who conducted a research on the
willingness to pay of consumers for yoghurt with three types namely “non-natural”, “non-
organic, natural” (or also called “all natural”), and “organic” yoghurt. Anstine (2007) showed
that consumers were willing to pay more for the latter two types. However, there was no
significant difference in the willingness to pay for the both types of yoghurt, while the
requirement standards of organic yoghurt were much stricter than “non-organic, natural”
yoghurt. Therefore, companies could take this opportunity to take much money from
consumers, who were confused of the term “natural” and “organic”, through the supply of
“non-organic, natural” yoghurt. In addition, Napolitano et al. (2008) reported that consumers

47
were actual willing to pay 6.5% and 4.7% extra, respectively for plain yoghurt and low fat
yoghurt with higher animal welfare standards label, which was related to the ethical
motivations when buying yoghurt.
4.3.7.2 Percentage of respondents for each level of the WTP
The percentage of respondents for each level of the willingness to pay was presented in Figure
4.5 and Table A-5 ANNEX. Nearly 23.3% of consumers were not willing to pay extra for
yoghurt with an organic label. Next, 54.2% of the consumers would pay up to €0.5 extra (or
33%) compared to the original price. Additionally, 8.9% of respondents would pay from €0.6
(40%) to €1.0 (67%) extra for the organic label.
0
5
10
15
20
25
Note: Item 17 “I would buy a regular yoghurt independent on the price”
Figure 4.5 Willingness to pay extra for 500 g yoghurt with an organic label compared to
one without (reference price €1.5) for each level
Furthermore, 2.2% people were willing to pay from €1.1 (73%) to €1.5 (100%) extra
premium for yoghurt with an organic label. In addition, approximately 11.4% of the
respondents chose the option “I would buy a regular yoghurt independent on the price”
indicating that those consumers prefer buying regular yoghurt than yoghurt with an organic
label. From the Figure 4.5, a large percentage of people (22%) would pay €0.5 (33%) extra
for the product.
4.3.7.3 Consumers’ WTP depending on User categories
The mean value of consumers’ willingness to pay was different across three user categories of
organic logos as classified in the previous parts (Table 4.18).
Level of willingness to pay (Euro)
Per
cen
tag
e o
f res
po
nden
ts (
%)

48
Table 4.18 Consumers’ WTP across User categories
Items Use of organic logos when buying
F P Non-users Occasional users Habitual users
Mean (€) 0.22e 0.34f 0.55g 29.27 <0.001
SD (€) 0.25 0.30 0.41
e, f, g indicate significantly different means using Dunnett T3 Post Hoc on 16-point scale (from €0.00 to €1.50)
On average, consumers frequently using the organic logos were willing to pay €0.55 (37%)
extra for the organic label, whereas those not often using organic logos were likely to pay
€0.34 (23%) extra, and those never using organic logos were willing to pay €0.22 or 15%
extra for the organic label of yoghurt. Thus, the more frequently people used organic logos
when buying yoghurt, the more willing they were to pay a premium for organic yoghurt.
4.3.7.4 Consumers’ WTP depending on socio demographics characteristics
Consumers’ willingness to pay value was significantly different for men and women (Table
4.19). On average, women were willing to pay more for the organic yoghurt than men. This
result supported the findings of Van Loo et al. (2011).
Table 4.19 Consumers’ WTP across Gender
Items Gender Mean
Difference T P
Male Female
Mean (€) 0.25 0.37 -0.12 -3.54 <0.001
SD (€) 0.28 0.34
Furthermore, there was significantly different in the willingness to pay of people who had
children and those who did not have children (T-test, T=2.00, P<0.05). Consumers with
children were willing to pay more for the organic yoghurt than those without children. In
addition, education, occupation types did not have a significant relation with willingness to
pay for organic yoghurt (one-way ANOVA F test, P = 0.695, and P = 0.641), which
confirmed the findings of Loureiro and Lotade (2005), Krystallis and Chryssohoidis (2005).
Financial situation did not have a significant effect on the willingness to pay of consumers
(one-way ANOVA F test, P=0.263).
4.3.7.5 Correlation of consumers’ WTP and other attitudinal and behavioural variables
The correlation between the willingness to pay of consumers and other attitudinal and
behavioural variables was presented in Table 4.20.

49
Table 4.20 Correlation matrix of consumers’ WTP and other variables
Items 1 2 3 4 5 6 7 8 9 10 11 12 13 14 15 16 17 18
1. WTP 1.00
2. General attitude 0.39 1.00
3. Taste 0.35 0.60 1.00
4. Healthiness 0.41 0.58 057 1.00
5. Price 0.30 0.15 0.21 0.19 1.00
6. Safety 0.28 0.31 0.32 0.51 0.18 1.00
7. Quality 0.36 0.54 0.60 0.68 0.27 0.64 1.00
8. Perceived availability 0.13* 0.16 0.25 0.16 0.36 - 0.24 1.00
9. Trustworthiness 0.35 0.48 0.46 0.57 0.26 0.64 0.67 0.20 1.00
10. Packaging 0.16 0.30 0.35 0.26 0.27 0.22 0.29 0.19 0.29 1.00
11. PCE 0.19 0.24 0.23 0.24 0.10* 0.22 0.20 - 0.16 0.18 1.00
12. Ethical self-identity 0.26 0.38 0.32 0.27 0.17 0.25 0.28 - 0.26 0.20 0.39 1.00
13. Food safety concern 0.26 0.40 0.35 0.35 0.19 0.20 0.34 0.21 0.24 0.16 0.16 0.45 1.00
14. Environmental concern 0.17 0.39 0.23 0.30 0.18 0.29 0.31 0.11* 0.35 0.18 0.23 0.41 0.36 1.00
15. Involvement 0.44 0.60 0.51 0.52 0.32 0.34 0.52 0.18 0.45 0.34 0.40 0.58 0.55 0.40 1.00
16. Behavioural intention 0.33 0.53 0.47 0.44 0.25 0.19 0.41 0.19 0.35 0.27 0.12* 0.30 0.34 0.24 0.53 1.00
17. Consumption frequency 0.12* 0.10* - - - - - - - - - - 0.11* - - 0.25 1.00
18. Frequency of buying 0.42 0.58 0.47 0.45 0.31 0.22 0.44 0.25 0.40 0.30 0.20 0.37 0.39 0.26 0.56 0.75 0.11* 1.00
All coefficients are significant at the 0.01 level (2-tailed), * Correlation is significant at the 0.05 level (2-tailed).
Item 1: 16-point scale (from €0.00 to €1.50); Items 2: 7- point scale
Items 3 � 10: 7- point scale (1= much worse, 7= much better) Items 11 � 15: 7- point scale (1= totally disagree, 7= totally agree) Items 16: 7- point scale (1= very unlikely, 7= very likely) Item 17: 6- point scale (from 0 to 6.5) Item 18: 11-point scale (from 0 to 10)

50
Firstly, consumers’ WTP had a significantly positive association with “general attitude”, and
other belief items. This indicated that people with a more positive attitude and stronger belief
that organic yoghurt was tastier, healthier, not so much expensive, safer, had better quality
than conventional yoghurt, were willing to pay more for organic yoghurt. This result
confirmed the findings of Stolz et al. (2011) who found that consumers, who preferred the
organic food more than conventional food including yoghurt, were willing to pay a higher
price for food which had better quality.
Secondly, a positive significant relationship was detected between consumers’ WTP and PCE,
which showed that people, who had stronger belief that their action could contribute to make
a positive change for the environment, were willing to pay higher extra amount for yoghurt
with an organic label. Next, people, who were more concerned for ethical self-identity, or
food safety issue, or environmental aspect, or who involved more in organic food, were
willing to pay a higher extra amount for yoghurt with an organic label. Furthermore,
consumers, who had higher intention to eat organic yoghurt and consumed yoghurt more
frequently, were willing to pay higher premium for organic yoghurt. Finally, the more
frequently consumers bought organic yoghurt, the more they were willing to pay higher extra
amount for this product.
4.4 Location of buying
The degree of appropriate place of buying organic yoghurt was described in the Table 4.21. In
general, consumers agreed that the four places including natural/ organic store, supermarket,
local farms, and farmers’ market were all appropriate to buy organic yoghurt. Natural/organic
store were agreed as the most appropriate place to buy this product.
Table 4.21 Mean scoring for appropriate location of buying organic yoghurt
Places Mean SD
Supermarket 5.95 1.46
Natural/organic store 6.62 1.07
Local farms 5.89 1.55
Farmers’ market 5.56 1.60
4.5 Confirmation of the hypotheses
The confirmation of the hypotheses of the study were presented in Table 4.22.

51
Table 4.22 Confirmation of the hypotheses of the study
Hypotheses Descriptions Confirmation
of H1
Hypotheses within attitudinal and behavioural variables
H0_1 There is no correlation between attitudinal and behavioural items with
“Frequency of buying” of the consumers.
Yes
H0_2 There is no difference in the mean of consumers’ attitudinal and
behavioural items across different User of organic logos categories.
Yes
H0_3 Hypotheses related to socio demographic characteristics
H0_3(a) There is no difference in the mean behavioural intention, buying frequency,
consumption frequency for the two samples including male and female.
Yes
H0_3(b) There is no difference in the distribution of male and female across
different User of organic logos categories.
Yes
Hypotheses for Regression Analysis
H0_4 There was no association between dependent variable (i.e. “general
attitude” for model 1, “behavioural intention” for model 2, “frequency of
buying” for model 3) and other attitudinal and behavioural items in the
model.
Yes/No*
H0_5 Hypotheses for Cluster Analysis
H0_5(a) There is no difference in the attitudinal and behavioural items for different
segments of consumers’ concerns.
Yes
H0_5(b) There is no difference in the distribution of age, occupation across
different segments of consumers’ concerns.
Yes
H0_6 Hypotheses for the WTP analysis
H0_6(a) There is no difference in the mean WTP across different User of logos
categories.
Yes
H0_6(b) There is no correlation between WTP and other attitudinal and behavioural
variables.
Yes
H0_6(c) There is no difference in the mean WTP for male and female group. Yes
* Confirmation “Yes” for the following items including:
- “Taste”, “trustworthiness”, “healthiness” for model 1 - “Healthiness”, “involvement in organic food”, “perceived importance of environmental characteristics”, “frequency of consumption”, “use of organic logos” for model 2 - “Price”, “general attitude”, “behavioural intention”, “perceived importance of environmental characteristics”, “use of organic logos” for model 3

52
Chapter 5 Conclusions
The objective of the master’s dissertation is to explore the consumer perception on yoghurt
with an organic label, in order to find possible implications for food marketers towards
enhancing the purchase frequency of this product. The analysis was focused on the attitude
and behaviour of consumers towards organic yoghurt, using the data collected via a cross-
sectional consumer survey in the Northern Dutch speaking part of Belgium (Flanders) in
March 2012. Several findings were detected.
Consumers were more aware of Belgian “Biogarantie” logo in comparison to the EU organic
logo, which resulted from the fact that the EU organic logo has been introduced recently (1
July 2010), thus, respondents were still not very aware of it. In addition, 40% of consumers in
the sample had good objective knowledge towards EU organic logo. Furthermore, only 4.5%
of people in the sample answered wrong to the statements of EU organic logo.
Next, consumers’ frequently use of organic logos when purchasing yoghurt was examined.
Findings indicated that consumers who frequently used organic logos held more positive
attitude towards organic yoghurt compared to other users’ categories. The habitual users
showed stronger belief that organic yoghurt was better than conventional yoghurt in terms of
taste, healthiness, trustworthiness, quality, packaging. Furthermore, they reported higher
concerned for ethical self-identity, food safety issue, environmental aspect, and involved more
in organic food. Additionally, the habitual users showed higher intention to eat organic
yoghurt than the occasional and non-users of organic logos.
Socio demographic differences in attitude and behaviour towards organic yoghurt were
detected. Women bought organic yoghurt more frequently, had higher frequency of
consumption yoghurt as well as higher intention to eat organic yoghurt, and used organic
logos more often than men when buying yoghurt.
The associations between consumers’ attitude and behaviour variables were explored.
Consumers with a more positive attitude towards organic yoghurt had very strong belief that
organic yoghurt was much tastier, healthier, had better quality and was more trustworthy than
conventional yoghurt. Furthermore, respondents who bought organic yoghurt more
frequently, used organic logos more often. Additionally, they had high intention to eat this
product, cared more for environmental food characteristics, were more involved in organic
food, and were willing to pay higher premium for organic yoghurt.

53
Next, the determinants of consumers’ attitude and behaviour towards organic yoghurt were
identified. Conceptual framework has been developed based on the literature review and
tested by three models with different dependent variables: “general attitude” for model 1,
“behavioural intention” for model 2, and “frequency of buying” organic yoghurt for model 3.
Findings showed that consumers’ eating intention and purchase frequency of organic yoghurt
were mostly influenced by the “frequency of using of organic logos”. In addition, the general
attitude of consumers towards organic yoghurt was affected by taste, healthiness,
trustworthiness. Hence, food marketers should enhance or reinforce the communication
strategy focusing on those elements of organic yoghurt.
While regression models accounted for the determinants of consumer attitude and behaviour
towards organic yoghurt, cluster analysis contributed to the exploration insight of the
consumers’ concerns segments on the socio demographic characteristics, and attitudinal and
behavioural variables, to give possible targeted marketing actions. Three segments were
identified. Firstly, “low concerned consumers” were people who showed low concerns for
ethical self-identity, food safety and environmental issues. Secondly, “medium concerned
consumers” was the largest segment who held medium concerns for ethical self-identity and
food safety issue, and higher concerned for environmental aspect compared to the “low
concerned consumers”. Thirdly, the “very concerned consumers” displayed higher concerns
for those issues in comparison to the other two segments.
Marketing actions were suggested to increase the purchase frequency of organic yoghurt
especially for the low and medium concerned segments by concentrating on promoting the
use of organic logos, enhancing the consumers’ belief that their actions could contribute for a
positive change in the environment (i.e. PCE). In order to increase the PCE for low and
medium concerned consumers, different types of media such as TV, the Internet, newspapers
could be used to increase consumers’ belief that their daily consumption behaviour could
contribute to the conservation for the environment. Furthermore, it is necessary to strengthen
the belief that organic yoghurt is tastier, healthier, has better quality, and is more trustworthy
than the conventional yoghurt for low and medium concerned consumers. This could be done
though a promotional campaign such as offering consumers chances to taste organic yoghurt,
providing further information on the healthiness and quality attributes of organic yoghurt to
the consumers, using many means of communication (e.g. TV, websites, newspapers,
magazines) that were suitable for those consumers as they were younger than the “very
concerned consumers”.
Finally, the willingness to pay of the consumers was explored. On average, consumers were
willing to pay €0.33 (22%) extra for a yoghurt with an organic label. Women and consumers
who frequently use organic labels were willing to pay more for organic yoghurt. In addition,

54
people with a stronger belief that their action could contribute to make a positive change for
the environment (i.e. higher PCE), were willing to pay a higher price for organic yoghurt.
To this end, throughout the master’s dissertation, the frequency of using organic logos was
displayed as an important factor that could strongly stimulate the intention and purchase
frequency of the consumers towards organic yoghurt. Hence, food marketers are encouraged
to increase the use of organic logos when buying yoghurt through an informational campaign
targeted to those who are never or not frequently use of organic logos. This campaign can be
done using advertisements of organic logos on TV, the Internet, leaflets. Additionally, food
marketers should pay attention to promote the environmental characteristics of the products
since the buying frequency of consumers towards organic yoghurt was significantly
influenced by the “perceived importance of environmental characteristics” of the product.
Furthermore, strengthening the belief that organic yoghurt is much tastier, healthier, and more
trustworthy than conventional yoghurt through a promotional campaign is very important in
enhancing the attitude of consumers towards organic yoghurt, which in turn influences the
purchase frequency of the consumers.
Of course, these results do not necessarily mean that all the factors mentioned above totally
determined the attitude and purchase behaviour of the consumers towards organic yoghurt. In
reality, the buying behaviour of consumers can be more complex due to the interaction of
different aspects related to consumers’ characteristics, the properties of the food itself, and the
situational factors or environmental factors. Nevertheless, these findings served as evidence
and contributed to give the implications for food marketers who are responsible for promoting
the purchase of organic yoghurt. Finally, a food marketer should have a comprehensive view
on the factors that affecting consumers’ attitude and behaviour towards organic yoghurt,
considering those factors mentioned above, and make right decisions on the marketing actions
to increase the frequency of buying of organic yoghurt.
Limitations and recommendations for future research
Firstly, the cross sectional data gather for the study only applies for organic yoghurt in
Belgium, thus, the study might have limitations in generalization of the results on other
products or other countries. Secondly, the questionnaire of the study used self-reported
technique, thus, the response may different from the actual action due to the social desirability
and other reasons related to the consumer consonance or dissonance (Pieniak, 2008). Since
the research has just focused on organic yoghurt in general, as the consumers’ demand on
dairy product today is more diverse, future research to discover actual perception and
behaviour of the consumers towards more specific types of organic yoghurt (e.g. drinking or
spoon, low fat, fruit or plain organic yoghurt) is recommended.

55
References
Aarset, B., Beckmann, S., Bigne, E., Beveridge, M., Bjorndal, T., Bunting, J., McDonagh, P.,
Mariojouls, C., Muir, J., Prothero, A., Reisch, L., Smith, A., Tveteras, R., & Young, J.
(2004). The European consumers’understanding and perceptions of the “organic” food
regime: The case of aquaculture. British Food Journal, 106(2), 93-105.
Aizen, I. (1991). The theory of planned behaviour. Organizational Behaviour and Human
Decision Process, 50, 179-211.
Alwin, D.F., & Krosnick, J.A. (1991). The reliability of survey attitude measurement. The
influence of question and respondent attributes. Sociological Methods & Research, 20(1),
139-181.
Anstine, J. (2007). Organic and all natural: Do consumers know the difference. Journal of
Applied Economics and Policy, 26(1), 15-27.
Bamberg, S., & Moser, G. (2007). Twenty years after hines, hungerford, and tomera: A new
meta-analysis of psycho-social determinants of pro-environmental behaviour. Journal of
Environmental Psychology, 27, 14-25.
Beharrell, B., & Denison, T.J. (1995). Involvement in a routine food shopping context. British
Food Journal, 97(4), 24-29.
Bettman, J. (1979). An information processing theory of consumer choice. Journal of
Marketing, 43(3), 124-126.
Bonny, S. (2006). Organic farming in Europe: situations and prospects. Notre Europe, 1-28.
Caswell, J.A., & Padberg, D.I. (1992). Towards a more comprehensive theory of food labels.
American Journal of Agricultural Economics, 74(2), 460-468.
Darmawan, I.G.N., & Keeves, J.P. (2006). Suppressors variables and multilevel mixture
modeling. International Education Journal, 7(2), 160-173.
Davies, A., Titterington, A.J., & Cochrane, C. (1995). Who buys organic food? A profile of
the purchasers of organic food in Northern Ireland. British Food Journal, 97(10), 17-23.
D’Souza, C., Taghian, M., Lamb, P., & Peretiatko, R. (2007). Green decisions: demographics
and consumer understanding of environmental labels. International Journal of Consumer
Studies, 31, 371-376.

56
Ellen, P.S., Wiener, J.L., & Cobb-Walgren, C. (1991). The role of perceived consumer
effectiveness in motivating environmentally conscious behaviors. J. Public Policy Mark,
10(2), 102–117.
Engel, J., Blackwell, R., & Miniard, P. (1968). Consumer behaviour. Fort Worth: Dryden
Press.
Engel, J., Blackwell, R., & Miniard, P. (1995). Consumer behaviour. Fort Worth: Dryden
Press.
Gil, J.M., Gracia, A., & Sánchez, M. (2000). Market segmentation and willingness to pay for
organic products in Spain. International Food and Agribusiness Management Review, 3,
207-226.
Govindasamy, R., & Italia, J. (1999). Predicting willingness-to-pay a premium for organically
grown fresh produce. Journal of Food Distribution Research, 30(2), 44-53.
Grankvist, G., & Biel, A. (2001). The importance of beliefs and purchase criteria in the choice
of eco-labeled food products. Journal of Environmental Psychology, 21, 405-410.
Grankvist, G., Dahlstrand, U., & Biel, A. (2004). The impact of environmental labeling on
consumer preference: Negative vs. positive labels. Journal of Consumer Policy, 27, 213-
230.
Green paper on integrated product policy. (2001). Commission of the European Communities.
1-27.
Gualiardo, A. (2001). Reexamining food labels: A proposal for labeling environmental
information on food products. 1-32.
Hair, J., Black, W., Babin, B., Anderson, R., & Tatham, R. (2006). Multivariate data analysis.
New Jersey: Pearson Education, Inc.
Hartmann, P., & Apaolaza-Ibáñez, V. (2011). Consumer attitude and purchase intention
towards green energy brands: The roles of psychological benefits and environmental
concern. Journal of Business Research, 1-10.
Hoogland, C.T., de Boer, J., & Boersema., J.J. (2007). Food and sustainability: Do consumers
recognize, understand and value on-package information on production standards?
Appetite, 49, 47-57.
Howlett, B., McCarthy, M., & O'Reilly, S. (2002). An examination of consumers’ perceptions
of organic yoghurt. Agribusiness Discussion Paper No.38, Department of Business and
Development, National University of Ireland, Cork, 3-27.
Hutchins, R.K., & Greenhalgh, L.A. (1995). Organic confusion: sustaining competitive
advantage. Nutrition and Food Science, 6, 11-14.

57
Krosnick, J.A., Judd, C.M., & Wittenbrink, B. (2005). The measurement of attitudes. In
Albarracin, D., Johnson, B.T., & Zanna (Eds.), M.P. The handbook of attitudes. Mahwah,
NJ: Lawrence, Erlbaum.
Krystallis, A., & Chryssohoidis, G. (2005). Consumers’ willingness to pay for organic food.
Factors that affect it and variation per organic product type. British Food Journal, 107(5),
320-343.
Laroche, M., Bergeron, J., & Barbaro-Forleo, G. (2001). Targeting consumers who are willing
to pay more for environmentally friendly products. Journal of Consumer Marketing,
18(6), 503-520.
Leire, C., & Thidell, Å. (2005). Product-related environmental information to guide consumer
purchases- a review and analysis of research on perceptions, understanding and use among
Nordic consumers. Journal of Cleaner Production, 13, 1061-1070.
Loureiro, M.L., & Lotade, J. (2005). Do fair trade and eco-labels in coffee wake up the
consumer conscience? Ecological Economics, 53, 129-138.
Lowe, A., & Worsley, A. (2003). “Social drivers” as predictors of yoghurt consumption in
China. Food Australia, 55(1-2), 42-44.
Magnusson, M. K., Arvola, A., Hursti, U-K.K, Åberg, L., & Sjödén, P-O. (2001). Attitudes
towards organic foods among Swedish consumers. British Food Journal, 103(3), 209-226.
Magnusson, M.K., Arvola, A., Hursti, U-K.K., Åberg, L., & Sjödén, P-O. (2003). Choice of
organic foods is related to perceived consequences for human health and to
environmentally friendly behaviour. Appetite, 40, 109-117.
Michaelidou, N., & Hassan, L.M. (2008). The role of health consciousness, food safety
concern and ethical identity on attitudes and intentions towards organic food.
International Journal of Consumer Studies, 32, 163-170.
Mutlu, N. (2007). Consumer attitude and behaviour towards organic food: Cross-cultural
study of Turkey and Germany. Master thesis. Universitat Hohenheim, Institute for
Agricultural policy and Markets.
Nayga Jr, R.M. (1999). Towards an understanding of consumers’ perceptions of food labels.
International Food and Agribusiness Management Review, 2(1), 29-45.
Napolitano, F., Pacelli, C., Girolami, A., & Braghieri, A. (2008). Effect of information about
animal welfare on consumer willingness to pay for yoghurt. Journal of Dairy Science, 91,
910-917.
Nilsson, H., Tuncer, B., & Thidell, Å. (2004). The use of eco-labeling like initiatives on food
products to promote quality assurance – is there enough credibility? Journal of Cleaner
Production, 12, 517-526.

58
Padel S., & Midmore, P. (2005). The development of the European market for organic
products: Insights from a Delphi study. British Food Journal, 107(8), 626-647.
Park, C.W., Mothersbaugh, D.L., & Feick, L. (1994). Consumer knowledge assessment.
Journal of Consumer Research, 21(1), 71-82.
Pérez-Cueto, F.J.A., Pieniak, Z., & Verbeke, W. (2011). Attitudinal determinants of fish
consumption in Spain and Poland. Nutr Hosp, 26(6), 1412-1419.
Pieniak, Z., Verbeke, W., Scholderer, J., Brunsø, K., & Olsen, S.O. (2007). European
consumers’ use and trust in information sources about fish. Food Quality and Preference,
18, 1050-1063.
Pieniak, Z. (2008). Information and health-related beliefs as determinants of fish
consumption. Doctoral thesis. Ghent University.
Pieniak, Z., Aertsens, J., & Verbeke, W. (2010). Subjective and objective knowledge as
determinants of organic vegetable consumption. Food Quality and Preference, 21, 581-
588.
Question & Answers – Version 1. (30/03/2010). Question number 14.
(http://ec.europa.eu/agriculture/organic/eu-policy/logo_en)
Rimal, A.P., Moon, W., & Balasubramanian, S. (2005). Agro-biotechnology and organic food
purchase in the United Kingdom. British Food Journal, 107(2), 84-97.
Salaun, Y., & Flores, K. (2001). Information quality: meeting the needs of the consumer.
International Journal of Information Management, 21, 21-37.
Schaack, D. (2010). Agricultural market information services. Organic area and sales in
Europe 2008. BioFach Nuremberg.
Sirieix, L., Delanchy, M., Remaud, H., & Zepeda, L. (2011). How do consumers react in front
of individual and combined sustainable food labels? A UK focus group study. Working
Paper - Moisa 2011-1, 1-23.
Shepherd, R., & Raats, M.M. (1996). Attitude and beliefs in food habits. In Meiselman, H.L.,
& MacFie (eds), H.J.H. Food choice, acceptance and consumption. London, UK: Blakie
Academic & Professional.
Steenkamp, J.B.E.M. (1997). Dynamics in consumer behavior with respect to agricultural and
food products. In Wierenga, B., van Tilburg, A., Grunert, K., Steenkamp, J.B., & Wedel
(eds), M. Agricultural marketing and consumer behavior in a changing world. Dordrecht.
Kluwer Academic, 143–188.
Stolz, H., Stolze, M., Janssen, M., & Hamm, U. (2011). Preferences and determinants for
organic, conventional and conventional-plus products – The case of occasional organic
consumers. Food Quality and Preference, 22, 772-779.

59
Thøgersen, J. (2000). Psychological determinants of paying attention to eco-labels in purchase
decisions: Model development and multinational validation. Journal of Consumer Policy,
23, 285-313.
Thøgersen, J. (2002). Promoting “green” consumer behavior with eco-labels. In: Dietz, T., &
Stern (Eds.), P.C. New tools for environmental protection. Washington, DC: National
Academy Press, 88 - 90.
Toschi, T.G., Bendini, A., Barbieri, S., Valli, E., Cezanne, M.L., Buchecker, K., & Canavari,
M. (2012). Organic and conventional nonflavoured yoghurts from the Italian market:
study on sensory profiles and consumer acceptability. Journal Science of Food and
Agriculture, 1-8.
Valli, C., & Traill, W.B. (2005). Culture and food: a model of yoghurt consumption in EU.
Food Quality and Preference, 16, 291-304.
Van Loo, E., Caputo, V., Nayga Jr, R.M., Meullenet, J-F., Crandall, P.G., & Ricke, S.C.
(2010). Effects of organic poultry purchase frequency on consumer attitudes towards
organic poultry meat. Journal of Food Science, 75(7), 384-397.
Van Loo, E.J., Caputo, V., Nayga Jr, R.M., Meullenet, J-F., & Ricke, S.C. (2011).
Consumers’ willingness to pay for organic chicken breast: Evidence from choice
experiment. Food Quality and Preference, 22, 603-613.
Vanhonacker, F., & Verbeke, W. (2009). Buying higher welfare poultry products? Profiling
Flemish consumers who do and do not. Poultry Science Association Inc, 2702-2711.
Vanhonacker, F., Pieniak, Z., & Verbeke, W. (2010). Fish market segmentation based on
consumers’ motives, barriers, and risk perception in Belgium. Journal of Food Products
Marketing, 16(2), 166-183.
Verbeke, W. (1999). Factors influencing the consumer decision-making process towards
meat. Doctoral thesis. Ghent University.
Verbeke, W., & Vackier, I. (2004). Profile and effects of consumer involvement in fresh meat.
Meat Science, 67, 159-168.
Verbeke, W. (2005). Agriculture and the food industry in the information age. European
Review of Agriculture Economics, 32(3), 347-368.
Verbeke, W. (2008). Plenary lecture: Impact of communication on consumers’ food choices.
Proceedings of the Nutrition Society, 67, 281-288.
Verbeke, W., & Roosen, J. (2009). Market differentiation potential of country-of-origin,
quality and traceability labeling. The Estey Centre Journal of International Law and
Trade Policy, 10(1), 20-35.

60
Vermeir, I., & Verbeke, W. (2006). Sustainable food consumption: Exploring the consumer
“attitude and behavioral intention” gap. Journal of Agricultural and Environmental
Ethics, 19, 169-194.
Zaichkowsky, J.L. (1985). Measuring the involvement construct. Journal of Consumer
Research Inc, 12(3), 341-352.
Website
(All websites accessed online on 1 May 2012)
Website of Bioforum of Belgium
http://bioforum.bioadmin.be/sites/default/files/ConsumptieVlaanderen2010.doc#overlay-
context=biosector/marktinformatie/cijfers%3Fq%3Dbiosector/marktinformatie/cijfers
http://www.bioforum.be/bio/fr/consommateurs.php?id=6
http://www.bioforumvlaanderen.be/biosector/marktinformatie/cijfers
Website of European Commission, Agriculture and Rural Development, Organic Farming
http://ec.europa.eu/agriculture/organic/home_en
http://ec.europa.eu/agriculture/organic/toolbox/messages-slogans_en
http://ec.europa.eu/food/food/labellingnutrition/foodlabelling/proposed_legislation_en.htm
Other websites
http://www.organic-bio.com/en/labels/
http://www.ats.ucla.edu/stat/spss/webbooks/reg/chapter2/spssreg2.htm (UCLA Academic
Technology services)
http://www.umich.edu/~ed793/labs/lab04_w04.doc (The course note of the University of
Michigan)

61
APPENDIX 1
ANNEX
List of Figures
Figure A-1 Total spending on organic products by Belgian households (in million Euro)
(http://bioforum.bioadmin.be/sites/default/files/ConsumptieVlaanderen2010.doc#overlay-context=biosector/marktinformatie/cijfers%3Fq%3Dbiosector/marktinformatie/cijfers)
Figure A-2 Spending per organic categories in Belgium
(in euros per capita of total population)
Source: Bioforum, GfK Panel Services Benelux
(http://bioforum.bioadmin.be/sites/default/files/ConsumptieVlaanderen2010.doc#overlay-
context=biosector/marktinformatie/cijfers%3Fq%3Dbiosector/marktinformatie/cijfers)
2,7 2,8 2,7 3,8 4,3 4,70,4 0,4 0,40,6 0,6 0,72,6 2,4 2,4
2,83,1
3,62,4 2,5 2,4
3,13,5
4,4
4,0 3,8 3,5
3,9
5,2
6,6
2,71,9 1,9
2,6
2,5
3,3
0,40,3 0,3
0,4
0,5
0,5
0,80,6 0,6
0,7
0,8
1,0
0,9
0,7 0,9
1,2
1,2
1,6
1,0
1,0 0,9
1,1
1,3
1,5
0,5
0,4 0,5
0,9
1,0
1,3
0,0
5,0
10,0
15,0
20,0
25,0
30,0
35,0
2005
2006
2007
2008
2009
2010
in e
uro
per
cap
ita
Overige
Eieren
Gevogelte/wild totaal
Vleeswaar
Vleesvervangers
Vlees
Groenten
Fruit
Brood
Aardappelen*
Zuivel
0
100
200
300
400
500
600
700
2001 2002 2003 2004 2005 2006 2007 2008 2009 2010
mio
eu
ro
+29%+12%
+20%
Food (fresh, diepviers and groceries), and non-food drogmetica Source: Bioforum, GfK Panel Services Benelux

62
Figure A-3 Market share of bio segment in 2010 (% of spending)
Source: Bioforum, GfK Panel Services Benelux (http://bioforum.bioadmin.be/sites/default/files/ConsumptieVlaanderen2010.doc#overlay-
context=biosector/marktinformatie/cijfers%3Fq%3Dbiosector/marktinformatie/cijfers)
Figure A-4 Price differences for some organic versus conventional products in Belgium
(with the price of conventional product = 100)
Source: Bioforum, GfK Panel Services Benelux (http://bioforum.bioadmin.be/sites/default/files/ConsumptieVlaanderen2010.doc#overlay-
context=biosector/marktinformatie/cijfers%3Fq%3Dbiosector/marktinformatie/cijfers)
1,7%
4,8%
2,7%
3,0%
1,7%
1,2%
20,9%
0,6%
1,5%
8,3%
1,8%
0% 5% 10% 15% 20% 25%
aardappelen
groenten
fruit
brood
zuivel
vlees
vleesvervangers
vleeswaren
gevogelte
eieren
Totaal
161
129
136
174
127
202
127
135
201
124
130
175
130
137
176
134
182
129
150
171
119
132
164
129
138
176
141
157
130
159
175
102
133
100 150 200 250
Halfvolle melk
Yoghurt
Geitenkaas
Eieren
Tomaten
Aardappel
Brood
Varkenskotelet
Braadkip
Groenteburger
Totaal bio
2010
2009
2008

63
Figure A-5 Examples of environmental food labels
Type of label
Logo
EU organic logo (new)
Private Belgian organic logo - Biogarantie
EU organic logo (old)
Fair trade
Rain forest alliance
Carbon reduction label
On-pack recycling label
(Source: www.direct.gov.uk and http://ec.europa.eu/agriculture/organic/eu-policy/logo_en and
http://tebiki.be/2011/04/12/whats-that-logo-volume-2-european-organic-logo/)

64
Figure A-6 Organic sales in European countries in 2008 (Unit: million euro)
Source: Schaack, D. (2010). Agricultural market information services. Organic area and sales in Europe 2008. BioFach Nuremberg.
Figure A-7 Share of organic products in the entire food market in Europe in 2008
Unit: %
Source: Schaack, D. (2010). Agricultural market information services. Organic area and sales in Europe 2008. BioFach Nuremberg.

65
Figure A-8 The rating for buying motives of European consumers for organic products
in 2008
in 2001
Note: rated from 1 to 7, 7 = highest important Source: Bonny, S. (2006). Organic farming in Europe: Situations and Prospects.
Notre Europe, p8.
Figure A-9 Main reasons for not purchasing organic products by the world regions
Note: Sample of 21261 people from 38 countries (500 or 1000 people per country), answering via the Internet
from 11 April to 10 May 2005 (in % of respondents) (ACNielsen, 2005) Source: Bonny, S. (2006). Organic farming in Europe: Situations and Prospects.
Notre Europe, p13.

66
List of Tables
Table A-1 Countries group by the stage of market development
Established Growing Emerging
Austria, Denmark, Germany,
Switzerland, UK
Finland, France, Italy, The
Netherlands, Norway, Portugal,
Sweden
Belgium, Czech Republic,
Greece, Ireland, Slovenia, Spain
Source: Padel S., & Midmore P. (2005). The development of the European market for organic products: Insights
from a Delphi study. British Food Journal, 107(8), p631.
Table A-2 Steps of evaluation and analysis of the dataset in SPSS
Steps Description
Labeling, recoding,
transforming the variables
Labeling, recoding, transforming the variables used
Running Frequency Checking the number of valid observations and missing values of the
data
Performing corresponding
analysis
1. Factor analysis
(Construct validity)
Conducting first for the variables that has the same dimensions (before
making other following analysis)
2. Reliability test
(Construct validity)
Testing the internal reliabilities of the variables used in the analysis
(before making other following analysis)
3. Frequencies analysis Testing frequencies of the variables
4. Descriptive analysis Testing mean value, SD of the variables
5. Cross tabulation Testing the distribution of consumers’ characteristics across one
categorical variable
6. Comparing means (Independent
Sample T-test)
Testing the difference in the mean values of some variables between two
groups
7. Comparing means
(one-way ANOVA F-Test)
Testing the difference in the mean values of some variables among three
or more than three groups
8. Correlation Testing the Pearson Correlation between variables involved
9. Regression analysis Testing the relation between the variables used in the regression models
10. Cluster analysis • Segmentation analysis according the consumers’ concerns variables
to identify the segments
• Profile the segments on socio demographic, attitudinal and
behavioural variables

67
Table A-3 Raking of importance of product characteristics
Items Mean SD Valid N 1. Taste 6.44 1.04 403 2. Quality 6.18 1.16 402 3. Trustworthiness 5.73 1.36 401 4. Nutritional value 5.35 1.54 402 5. Price 5.34 1.44 402 6. Availability 5.23 1.49 401 7. Environmental friendliness 4.64 1.67 403 8. Packaging 3.87 1.77 401 9. Brand name 3.80 1.84 400 10. Provided with an organic label 3.78 1.82 402
Table A-4 The distribution of Male and Female across Users of organic logos categories
Gender Use of organic logos when buying Total
Non-users Occasional users
Habitual users
Male Count 88 41 21 150 % within gender 58.7% 27.3% 14.0% 100.0% % within categories use 45.4% 32.3% 28.8% 38.1% Female Count 106 86 52 244 % within gender 43.4% 35.2% 21.3% 100.0% % within categories use 54.6% 67.7% 71.2% 61.9% Total Count 194 127 73 394 % within gender 49.2% 32.2% 18.5% 100.0% % within categories use 100.0% 100.0% 100.0% 100.0%
Table A-5 Percentage of respondents for each level of WTP
Level Frequency Valid Percent Cumulative Percent €0.00 94 23.3 23.3 €0.10 26 6.4 29.7 €0.20 57 14.1 43.8 €0.30 36 8.9 52.7 €0.40 12 3.0 55.7 €0.50 88 21.8 77.5 €0.60 3 0.7 78.2 €0.70 8 2.0 80.2 €0.80 4 1.0 81.2 €0.90 2 0.5 81.7 €1.00 19 4.7 86.4 €1.10 0 0.0 0.0 €1.20 0 0.0 0.0 €1.30 1 0.2 86.6 €1.40 0 0.0 0.0 €1.50 8 2.0 88.6
Item 17. 46 11.4 100.0
Total 404 100.0 Note: Item 17. I would buy a regular yoghurt independent on the price

68
APPENDIX 2
QUESTIONNAIRE
Dear participant, Thanks to participate in this questionnaire. In this survey, we would like to ask about your opinion with respect to yoghurt and meat related issues and about some behavioural and demographic characteristics. This research is part of a research project of the Agro-food marketing and consumer behavior research team of Ghent University. It should take about 20 minutes to complete the questionnaire12. Please read carefully the basic guidelines provided below to help you answering this questionnaire:
� In most cases, a brief introduction will precede each question. Before answering the questions, we recommend that you read through this carefully.
� For most questions, your answers will be given on a scale, for instance from 1 to 7. Please have a look at the exact meaning of the scale before answering the question.
� In some cases, the questions may seem similar or repetitive. Please just give your answer as it really is.
� There are no right or wrong answers. We just want to know your opinion.
� All answers will be treated with the upmost confidentiality.
Thank you for your cooperation and support.
12 The 20 minutes to be answered include all the parts of organic yoghurt and chicken meat questions

69
PART 1: RECOGNITION, USE AND UNDERSTAND OF THE LABE L Recognition of the label/awareness 1. Do you recognize this symbol?
O Yes O No
2. What is according to you, the meaning of this logo?
o It is the EU label to indicate that it is genetic modified food o It is the EU label to indicate that is organic food o It is a logo to indicate the approved use of pesticides o It is the Belgian label to indicate that is organic food
3. Do you recognize this symbol?
O Yes O No
4. What is according to you, the meaning of this logo?
o It is the EU label to indicate that it is genetic modified food o It is the EU label to indicate that is organic food o It is a logo to indicate the approved use of pesticides o It is the Belgian label to indicate that is organic food
Understand the label 5. Indicate if the following statements about this logo are true or false ���� objective knowledge
T F At least 95% of the ingredients are organic O O At least 70% of the ingredients are organic O O This product can contain up to 20% of genetic modified materials O O The logo can be used for products derived from fishing and hunting wild life activities O O
Use of the label 6. How often do you search for organic logos when buying the following types of food?
Never Rarely Sometimes Regularly Always
Yoghurt O O O O O PART 2: CONSUMPTION BEHAVIOUR 7. How often do you eat the following products?
Never Less than monthly
Monthly Weekly 2 to 4 times per week
Daily or almost daily
Yoghurt O O O O O O

70
Frequency of buying different organic food products 8. On 10 times that you buy the following food item, how often do you choose one with an organic label?
0 1 2 3 4 5 6 7 8 9 10
Yoghurt O O O O O O O O O O O Location of buying organic food products 9. Please indicate in which degree you find the following selling locations appropriate as selling locations for
organic yoghurt ? …. is an appropriate location for selling organic yoghurt.
Totally disagree
Neither disagree
nor agree
Totally agree
Supermarket O O O O O O O Natural/organic store O O O O O O O Local farms O O O O O O O Farmers’ market O O O O O O O
10. Please indicate how likely is it that during the coming 7 days you expect, plan, desire to eat organic yoghurt,
including today? � behavioral intention Very unlikely Very likely 1 2 3 4 5 6 7 I expect to eat organic yoghurt in the coming 7 days
O O O O O O O
I plan to eat organic yoghurt in the coming 7 days
O O O O O O O
I desire to eat organic yoghurt in the coming 7 days
O O O O O O O
PART 3: ATTITUDES Importance of food characteristics of yoghurt
11. How important are the following product characteristics for you when making choices concerning yoghurt
Totally
not important
Neutral Very important
Quality O O O O O O O Taste O O O O O O O Price O O O O O O O Environmental friendliness O O O O O O O Brand name O O O O O O O Nutritional value O O O O O O O Packaging O O O O O O O Trustworthiness O O O O O O O Availability O O O O O O O Provided with an organic label O O O O O O O

71
General attitudes and belief towards organic yoghurt 12. Please indicate which word best describes your feeling of organic yoghurt as compared to conventional
yoghurt. 1 2 3 4 5 6 7
Bad O O O O O O O Good Unpleasant O O O O O O O Pleasant Negative O O O O O O O Positive
13. How would you evaluate the following aspects when comparing organic yoghurt with conventional
yoghurt? “Organic yoghurt scores (worse/better) than conventional yoghurt.”
Much worse
Worse Somewhat worse
same Somewhat better
Better Much better
Taste O O O O O O O Healthiness O O O O O O O Price O O O O O O O Environmental friendliness O O O O O O O Safety O O O O O O O Quality O O O O O O O Availability O O O O O O O Trustworthiness O O O O O O O Packaging O O O O O O O
14. Suppose that you want to purchase 500 g yoghurt. The average price for 500 g regular yoghurt is about €1.5 Please indicate how much you are willing to pay extra for a yoghurt with an organic label.
(1) €0.00 (2) €0.10 (3) €0.20 (4) €0.30 (5) €0.40 (6) €0.50 (7) €0.60 (8) €0.70 (9) €0.80 (10) €0.90 (11) €1.00 (12) €1.10 (13) €1.20 (14) €1.30 (15) €1.40 (16) €1.50 (17) I would buy a regular yoghurt independent on the price.
15. Please indicate to what extent you agree with the following statements ���� PCE Totally
disagree Neither
disagree nor agree
Totally agree
One person alone can do very little for the environment O O O O O O O
Efforts concerning the environment by one person are useless as long as other people do not want to do something
O O O O O O O
An individual person can make a difference for the environment by carefully selecting the products
O O O O O O O

72
Consumers’ concerns 16. Please indicate to what extent do you agree with those following statements Totally
disagree Neither
disagree nor
agree
Totally agree
Ethical self-identity I think of myself as someone who is concerned about ethical issues O O O O O O O
I think of myself as an ethical consumer O O O O O O O Food safety concern I am very concerned about the amount of artificial chemicals in food O O O O O O O
The quality and safety of food concerns me O O O O O O O Nowadays most foods contain residues from chemical sprays and fertilizers O O O O O O O
Environmental concern Mankind is severely abusing the environment. O O O O O O O There are limits to growth beyond which our industrialized society cannot expand. O O O O O O O
Humans must live in harmony with nature in order to survive. O O O O O O O
Organic food involvement 17. Please indicate to what extent do you agree with those following statements Totally
disagree Neither
disagree nor agree
Totally agree
Organic food means a lot to me O O O O O O O I care a lot about organic food O O O O O O O Organic food is very important to me O O O O O O O I appreciate organic food very much O O O O O O O
PART 4: PERSONAL DATA 1. What is your gender? 2. In which year were you born? 19|__|__| 3. Are you living alone or together with others?
� Living alone � Co-habiting (with partner, parents, children, friends, etc.) 4. How many adults (including yourself) and children of 15 years and older are living in your household? (A household is defined as the total amount of people, living at a common place and sharing a budget.)
|__|__| adults and children aged 15 or older
5. How many children (0-14 years old) are living in your household?
|__|__| children younger than 15
� Male � Female

73
6. What is the highest level of education that you have completed? 7. What is your working status?
8. On a scale from 1 to 7, with 1 being “difficult”, 4 being “average”, and 7 for “well-off”, how would you estimate the financial situation of your family?
1: difficult 2 3 4: average 5 6 7: well-off
9. Are you the main responsible person for the grocery shopping for your household?
O I am the main responsible O I am responsible together with someone else O Other people from the household are the main responsible
Thank you for completing the questionnaire !
Elementary school � High school � Higher education (not university) � University �
Full-time paid work �
Part-time paid work �
Retired �
Student �
Unemployed (seeking work) �
Not in paid employment (not seeking work) (houseman, housewife) �