Embed Size (px)
Citation preview

University of Rhode Island University of Rhode Island
DigitalCommons@URI DigitalCommons@URI
Human Development and Family Science Faculty Publications Human Development and Family Science
2021
Consumer Financial Knowledge and Cashless Payment Behavior Consumer Financial Knowledge and Cashless Payment Behavior
for Sustainable Development in Poland for Sustainable Development in Poland
Beata Świecka
Paweł Terefenko
Tomasz Wiśniewski
Jing Jian Xiao
Follow this and additional works at: https://digitalcommons.uri.edu/hdf_facpubs

sustainability
Article
Consumer Financial Knowledge and Cashless PaymentBehavior for Sustainable Development in Poland
Beata Swiecka 1 , Paweł Terefenko 2,* , Tomasz Wisniewski 3 and Jingjian Xiao 4
�����������������
Citation: Swiecka, B.; Terefenko, P.;
Wisniewski, T.; Xiao, J. Consumer
Financial Knowledge and Cashless
Payment Behavior for Sustainable
Development in Poland. Sustainability
2021, 13, 6401. https://doi.org/
10.3390/su13116401
Academic Editor: Andrea Pérez
Received: 9 April 2021
Accepted: 31 May 2021
Published: 4 June 2021
Publisher’s Note: MDPI stays neutral
with regard to jurisdictional claims in
published maps and institutional affil-
iations.
Copyright: © 2021 by the authors.
Licensee MDPI, Basel, Switzerland.
This article is an open access article
distributed under the terms and
conditions of the Creative Commons
Attribution (CC BY) license (https://
creativecommons.org/licenses/by/
4.0/).
1 Institute of Economy and Finance, University of Szczecin, 71-101 Szczecin, Poland; [email protected] Institute of Marine and Environmental Sciences, University of Szczecin, 70-383 Szczecin, Poland3 Institute of Management, University of Szczecin, 71-004 Szczecin, Poland; [email protected] Department of Human Development and Family Science, University of Rhode Island,
Kingston, RI 02881, USA; [email protected]* Correspondence: [email protected]; Tel.: +48-91-444-23-54
Abstract: Financial knowledge is the main element of financial literacy, which is important for thesustainable development of individuals and society. Sustainability is a complex concept that spansmany fields, including financial knowledge for all ages. Financial knowledge requires significantscientific research showing its impact on individuals and the economy, including non-cash payments.Consumer payment knowledge and its association with consumer financial behavior have longbeen a matter of widespread interest by researchers, but no in-depth, empirically based scientificresearch has been completed for Poland. The objective of this study was to examine factors associatedwith cashless payment behavior with an emphasis on the role of consumer financial knowledge. Atotal of 1100 interviews were carried out with Polish nationals aged 15 and above. The collecteddata were analyzed with the use of statistical methods, including analysis of variances (ANOVA),in order to examine consumers’ financial knowledge by basic economic and non-economic factors.Additionally, a data-mining method known as Random Forests was implemented for finding thevariable importance in correlations between consumer financial knowledge and preferred methodsof payment. The results revealed the diversity of factors influencing consumer behavior. Among theconsumers’ personal traits, financial knowledge was one of the most important determinants of theirpayment choices. The results have implications for the design of payment processes. The results canbe used by central banks to determine the directions of financial inclusion, as well as for stakeholdersin the payments market.
Keywords: consumer behavior; payment behavior; financial literacy; financial knowledge; cash-less payment
1. Introduction
Financial knowledge is a key element of financial literacy, which undoubtedly has animpact on the quality of life and is a key to sustainable development highlighted in the 2030Agenda by the United Nations in 2015 [1–4]. The 2030 Agenda distinguishes 17 SustainableDevelopment Goals, several of which are relevant to cashless payments. The SustainableDevelopment Goals (SDGs) are a collection of interlinked global goals designed to be a“blueprint to achieve a better and more sustainable future for all”. The 17 SDGs are: (1) NoPoverty, (2) Zero Hunger, (3) Good Health and Well-being, (4) Quality Education, (5) GenderEquality, (6) Clean Water and Sanitation, (7) Affordable and Clean Energy, (8) DecentWork and Economic Growth, (9) Industry, Innovation and Infrastructure, (10) ReducingInequality, (11) Sustainable Cities and Communities, (12) Responsible Consumption andProduction, (13) Climate Action, (14) Life Below Water, (15) Life On Land, (16) Peace,Justice and Strong Institutions, and (17) Partnerships for the Goals. The importance offinancial knowledge is in line with goal 3 concerning well-being and goal 4 concerningthe importance of quality education. Goal 10 on inequality re-education is also relevant.
Sustainability 2021, 13, 6401. https://doi.org/10.3390/su13116401 https://www.mdpi.com/journal/sustainability

Sustainability 2021, 13, 6401 2 of 18
The level of financial knowledge can be translated into the financial stability of consumers,households, enterprises and national economies and may be related to many topics infinance, including payments that have high dynamics of developments, as well as largeproduct differentiations—from cash to payment cards and digital payment. For manyyears, it has been seen how dynamically the payment market is developing around theworld, including in Poland. Although cash plays a significant role, it can be seen thatcash is gradually being replaced by non-cash payments. The research presented in thisarticle shows the importance of knowledge in the selection of non-cash payments, whichcan be translated into the implementation of goals of sustainable development. The levelof financial knowledge may result in rational financial decisions, including responsibleconsumption, financial management, financial stability and well-being. Knowledge ofpayment systems is not cultivated enough, so it is important to mention it in relation tofinancial literacy, and thus the achievement of SDG 4 on quality education. Educationincreasing knowledge, including financial knowledge, enables upward socio-economicmobility and is a key to escaping poverty. In addition, the introduction of new solutions innon-cash payments, such as digital payment, excludes older or less-knowledgeable peoplefrom the market, which is why financial knowledge of payment systems is important. Thus,increasing payment knowledge may facilitate the implementation of SDG 10 concerningreducing inequality. Reducing inequalities and ensuring no one is left behind are critical toachieve sustainable development goals.
The world of payments is fundamentally changing. Increasingly, new payment so-lutions are becoming even more complex as new market players, new technologies andfinally changing customer expectations are influencing the payment industry stakeholders.At the end of 2019, nearly 43 million payment cards were in circulation in Poland. After thedecrease in the number of cards in 2015 (the first decrease in the number of cards issuedin Poland since 2010), the number of cards in 2016 increased above the level from 2014,in 2017 it reached the level above one card per capita for the first time (1.02), and in 2019this number increased even more (1.12). The number of payment cards per inhabitant ofPoland systematically increased over the following years from 0.38 in 2001 to 0.86 in 2009,while in the years 2010–2011 it slightly decreased to 0.83 and continued to grow until 2014,when the index reached 0.94. In 2015, the indicator slightly decreased to the level of 0.92payment cards per capita. The following years saw a systematic increase in the number ofcards per capita to 1.12 in 2019. The difference between Poland and the EU average slightlyincreased from 0.55 in 2018 to 0.56 in 2019. In 2019, the indicator of issued payment cardsper capita (1.12) placed Poland at the end of the European Union countries (24th place outof 28 countries). Compared to 2018, Poland did not change its place in the ranking [5].These facts indicate that there are factors that contribute to this not very optimistic result,which is why the authors decided to research how the knowledge of payments affectsthe use of non-cash payments by consumers in Poland. In 2019, there were 592 ATMsper 1 million inhabitants in Poland. In relation to other European Union countries, thisindicator shows that there are significantly fewer ATMs in Poland than the EU average,despite the fact that since 2001, the number of ATMs per 1 million inhabitants in Poland hasincreased by 423 (an increase by 250%), and only by 156 in the EU (an increase of 23%) [5].
In Poland, compared to the European Union countries, on average, fewer paymentsare still made with payment cards than in Denmark, Great Britain, Sweden, Finland, theNetherlands, Estonia and many other countries. Despite being below the EU average, in2019 Poland recorded one of the highest growth rates in the European Union in terms ofthe number of card transactions. The growth rate of the number of card transactions inPoland compared to individual EU countries in 2019 was quite high (Poland ranked 6thout of 28). Such a high increase in cashless transactions in Poland may be the result ofthe growing popularity of non-cash payments with cards with the contactless function,which enables the most convenient and fast payment method for the payment instrumentholder. Another reason is the 100% acceptability of this form of payment, i.e., all POSterminals in Poland accept contactless payments. Due to the importance of payment cards

Sustainability 2021, 13, 6401 3 of 18
in consumer payments in Poland, it indicates the need to study factors associated withthis phenomenon. One of the least studied factors is financial literacy which, according tothe above discussion, plays a significant role, especially in the era of transformation andnew solutions emerging where objective financial knowledge is crucial. While contactlesscard payments are very common, newer solutions, such as telephone payments, arouseconcerns about the lack of knowledge regarding the operation of digital payments. Havingknowledge is a key element in the development of cashless payments in Poland. Thisstudy, as one of the few in this area and the only one in Poland, allows for deepening theknowledge in this area and may be helpful for all stakeholders of the payments market,including central banks.
In 2019, the number of cashless card transactions per capita in Poland was 149. Nev-ertheless, an EU resident still performs more cashless transactions with payment cardsthan a Pole. The average for the European Union countries in 2019 was 168.3 transactionsper capita. It should be noted that the number of card transactions in Poland is system-atically increasing, and the growth rate is much faster than the average growth rate forthe European Union countries. For comparison, the growth rate in Poland in 2018–2019was 21.4%, while the average growth rate for the European Union in the same period wasalmost two times lower, 11.6%. Moreover, it is worth pointing out that in 2006, the averagePole made only 9.3 payments with payment cards. Three years later, in 2009, this was twiceas many, 18.5; in 2012, 31.5; and in 2019, already 149.0. In 2013, this indicator for Polandaccounted for 41% of the average of the entire European Union, and in 2019 it was already88.5%. In the ranking in terms of the indicator in question, Poland ranks 13th among the28 EU countries. In 2012, Poland made 31.5 transactions per capita, and advanced in theranking by two places in 2013, and by three places every year in 2014, 2015 and 2016. Itshould be noted that the result of Poland is over 2.5 times lower than that of Denmark (386)or Great Britain (370). It is worth paying attention to Estonia, where the rate in questionreached 280 transactions in 2019. This is all the more noteworthy as Estonia is below theEU average in the number of cards per capita. In 2019, the number of payment cards percapita in Finland was slightly above the EU average, and in Denmark it was slightly belowthe EU average; despite this, the average Finnish resident performed an average of 353non-cash card transactions, and a Danish resident as many as 386 transactions [5].
Fundamental transformation requires consumers to adapt to these changes. Ultimatebeneficiaries, such as consumers, are now forced to develop and increase their knowledgein this area, in order not to feel banking exclusion and to be able to use the solutions offeredby the market. Therefore, there is a need for in-depth, empirically based scientific researchover the state of knowledge in the field of payments and its impact on consumer financialbehavior. In this research, we assume that the quality of consumers’ financial decisionsdepends on the level of financial knowledge. This allows them to understand the maintopics relevant to consumer wealth. As the financial knowledge covers a range of financialaspects, it may concern payments issues as well as taxes, insurance, financial management,capital market, loans or savings and others. Here, we focus on knowledge of payments,particularly cash and cashless payment types, which constitute the most important day-to-day transactions in financial markets. As consumer awareness became a crucial element inunderstanding technological solutions in finance, it is important to know what types ofpayment are affected by different levels of financial knowledge. Therefore, in this article,we present a classification of financial knowledge and its levels as well as an analysis of itscorrelation with payment types used. The objective of this study was to explore factorsassociated with consumer payment behavior with an emphasis on the role of consumerfinancial knowledge. The analysis is based on results of primary research, carried outfor the Foundation for Development of Cashless Payments (FROB) in cooperation withthe National Bank of Poland and the Ministry of Entrepreneurship and Technology ofPoland. Relations of consumers’ financial knowledge by basic economic and non-economicfactors were examined with the use of descriptive statistics, several relationships statisticalindicators such as Cramér’s V coefficient, Kendall’s Tau technique and Spearman’s rank

Sustainability 2021, 13, 6401 4 of 18
correlation coefficient. Furthermore, ANOVA was performed along with a data-miningmethod known as Random Forests for finding the variable importance in the correlationbetween financial knowledge and payment behavior. The research results are relevant forall payment market stakeholders, especially for central banks that issue banknotes andcoins, payment card issuers, FinTech companies, as well as acquires and merchants. Theresults have implications for the design of payment processes and can be used by centralbanks to determine the directions of financial inclusion, as well as for stakeholders in thepayments market.
2. Previous Research
The research on the association between consumer financial knowledge and paymentbehavior is unique. This paper is most closely related to the work of Henry et al. [6] whoused the 2017 Methods-of-Payment Survey in Canada and found that persons with higherfinancial literacy in terms of a standard measure tended to have smaller cash holdings intheir wallets and used cashless payment methods. Fujiki [7] showed that households withthe following characteristics tend to be credit card users rather than cash-only users forday-to-day transactions: (1) better financial knowledge, (2) a higher disposable income,(3) greater financial assets, (4) a younger household head, (5) a female household head,(6) higher educational attainment, (7) not being self-employed, (8) living in a large cityand (9) living in areas with more inhabitants per kilometer. It also shows that, holdinghousehold characteristics constant, households with better financial knowledge tend tohave a larger amount of cash holdings. The studies on cashless payment methods alsoshow that households with a younger household head and higher educational attainmenttend to use cashless payment methods rather than cash. Similar studies were carried out byEsselink and Hernández [8] for the Eurozone; Greene et al. [9] and Koulayev et al. [10] forthe US, Chen et al. [11] for Canada, Kadoya and Khan [12] for Japan and Jonker et al. [13]for the Netherlands. However, Henry et al. [6] is the only study that includes a standardmeasure of financial literacy in which financial knowledge is one of the parts [7].
Hamid and Locke [14] examined the relationship between socio-economic factors,financial literacy, money management skills, overspending and impulsiveness on creditcard repayment decisions in Malaysia and showed that socio-economic factors related toeducation, income, ethnicity, marital status and number of credit cards had influences oncredit card repayment decisions. The findings of that study support the argument thatfinancial education and behavioral intervention that inculcate good money managementskill are important in shaping individuals’ behavior.
Understanding the relationship between knowing personal financial concerns andthe corresponding financial behavior is increasingly recognized as an area of critical fi-nancial importance [15,16]. The need to research financial knowledge has been noticedby researchers in recent decades. Financial knowledge is both as a synonym of financialliteracy as well as an element of financial capability, and the economic importance offinancial literacy is documented in a large and growing empirical literature [17–20]. Inearly stages of literature development, several researchers considered financial literacy assynonymous with financial knowledge [21–23]. However, due to the rapid development ofliterature, there are trends indicating that financial knowledge is an important componentof financial literacy/capability [24–26]. Financial knowledge supports that consumerscompare financial products and services and make appropriate, well-informed financialdecisions. A basic knowledge of financial concepts and the ability to apply numeracy skillsin a financial context ensures that consumers can navigate financial matters with greaterconfidence and react to news and events that may have implications for their financialwell-being [26]. Organisation for Economic Co-operation and Development (OECD) con-siders three components as the main elements of financial literacy: (i) individuals’ levelof financial knowledge (the cognitive aspect); (ii) attitudes toward saving; (iii) financialbehaviors [27]. This research adopts the OECD definition and focuses specifically on thecognitive element, financial knowledge and the links between financial knowledge and

Sustainability 2021, 13, 6401 5 of 18
particular behaviors. Knowledge has been a subject of human inquiry since ancient times.From Plato and Aristotle, scientists are trying to answer this fundamental question: “Whatis knowledge?” [28]. Now, it is used in various fields, including economics.
How is financial knowledge defined? Financial knowledge involves many topics infinance and financial management [22]. Huston [21] argued that in-depth financial literacyassessment should adequately represent its key domains, which she considered to be:the basic concept of money, including interest rates and inflation; borrowing, includingmortgages; saving and investment, including investment diversification; and resourceprotection, including insurance [29]. Financial knowledge includes knowledge of bankingproducts, stock markets [30], retirement planning [31–34] and payments. Hilgert et al. [22]explore the connection between knowledge and behavior—what consumers know andwhat they do, focusing on four financial management activities: cash-flow management,credit management, saving and investment. The importance of financial knowledge isconfirmed by many researchers. Financial knowledge has a significant impact on householdwealth. Financial knowledge is of great significance for life and finance. Consumers’financial decisions are largely dependent upon their knowledge and understanding of theirpersonal finances [18,35], just as the quality of financial decisions made by individualsdepends on their financial knowledge, skills and attitudes [36]. Agarwalla et al. [37]confirm that in view of the complexity of financial products and services, it is necessary forconsumers to develop understanding in the area of finance, raise their level of financialknowledge and achieve sound foundations for rational financial decisions concerningconsumption, indebtedness, savings and investment [38] (Swiecka, 2018). The notion offinancial knowledge is a significant component of both financial literacy [18] and financialcapability [39,40]. Financial knowledge affects a number of aspects of life, includingfinancial satisfaction [41,42].
In psychology, the concept of knowledge has two meanings, a general meaning anda specific one. Inspired by the classification of knowledge by Aristotle [43], we dividefinancial knowledge into “general” and “specialist” financial knowledge. General financialknowledge refers to many areas of consumers’ financial life, while specialist financialknowledge in this study denotes payment knowledge (Figure 1). Aristotle introduced thedivision of knowledge into theoretical and practical [43]. This division has an importantmeaning in the field of financial knowledge. It is not sufficient to have knowledge ofconcepts and theories; it is necessary to know how to apply them in practice. However,accepting that knowledge should be verifiable, we propose a distinction between objectiveand subjective knowledge. In this article, we use the concept of objective financial knowl-edge, which can be assessed by the number of correct answers respondents give in a test.These answers show what the respondent knows about finance or about a given branchof finance. Subjective financial knowledge is the self-assessment of one’s knowledge of agiven financial topic. It is something an individual thinks he or she knows and he or shethinks is true. Subjective financial knowledge is an opinion based on one’s beliefs about atopic. Assessing subjective financial knowledge can involve asking, for example, whether arespondent knows how to set up a bank account online, how to withdraw money from anATM or how to use mobile phones to pay for goods and services [4]. In general, subjectivefinancial knowledge seems to positively influence consumers’ decision-making, but thiseffect is not always evident.
Findings from previous research demonstrate the strong relationship between finan-cial knowledge and the behavior of consumers [15,18,22], and both subjective and objectivefinancial knowledge contribute to consumer financial behavior [15,44]. Engaging in respon-sible financial behavior is positively linked to financial knowledge [45] (Babiarz and Robb,2014). Robb [46] shows that financial knowledge is an important factor in decision-makingconcerning the use of credit cards. Students who rated higher in terms of personal financialknowledge are more likely to use credit cards responsibly. Hancock, Jorgensen and Swan-son [47] investigated the influence of financial knowledge on the credit card behavior ofstudents from seven universities, taking into consideration their interactions with parents,

Sustainability 2021, 13, 6401 6 of 18
years of professional experience, attitudes towards credit card use and some personalityfeatures. It is worth noting here that the use of credit cards and other forms of cashlesspayment is also influenced by factors other than financial knowledge, among them parents,whose role in the education of their children is significant. The significance of this role isalso confirmed in a study of 15-year-olds in Poland and Germany [48]. Kim, Anderson andSeay [49] demonstrate the role of financial knowledge in short- and long-term financialbehaviors. They found positive relationships between financial knowledge and short- andlong-term financial behaviors such as making monthly credit card repayments, planningfor retirement, making other timely payments and maintaining lower costs of credit forcredit cards and mortgages.
Sustainability 2021, 13, x FOR PEER REVIEW 6 of 18
responsible financial behavior is positively linked to financial knowledge [45] (Babiarz and Robb, 2014). Robb [46] shows that financial knowledge is an important factor in deci-sion-making concerning the use of credit cards. Students who rated higher in terms of personal financial knowledge are more likely to use credit cards responsibly. Hancock, Jorgensen and Swanson [47] investigated the influence of financial knowledge on the credit card behavior of students from seven universities, taking into consideration their interactions with parents, years of professional experience, attitudes towards credit card use and some personality features. It is worth noting here that the use of credit cards and other forms of cashless payment is also influenced by factors other than financial knowledge, among them parents, whose role in the education of their children is signifi-cant. The significance of this role is also confirmed in a study of 15-year-olds in Poland and Germany [48]. Kim, Anderson and Seay [49] demonstrate the role of financial knowledge in short- and long-term financial behaviors. They found positive relationships between financial knowledge and short- and long-term financial behaviors such as mak-ing monthly credit card repayments, planning for retirement, making other timely pay-ments and maintaining lower costs of credit for credit cards and mortgages.
Figure 1. Types of financial knowledge.
The research described in literature considers only one form of the cashless pay-ment—credit cards. Our research shows a much wider spectrum of cashless payments, which will be discussed below. Cashless payments are developing rapidly, resulting from the development of non-cash transactions, the availability of infrastructure and the grow-ing awareness of the need to deepen the knowledge of consumers in this area. Among forms of cashless payment, debit cards hold the largest share of the market, but payments with proximity cards are growing rapidly. Moreover, mobile payments made with the use of mobile phone applications are more slowly making their way into the market. The choice of payment method is influenced by a number of factors, including the cost of the given method in terms of money, transaction speed, ease of use, the loyalty programs attached to selected payment instruments and other factors [50–57]. Many countries fea-ture extensive promotional programs that use cashless turnover, which serves as a form of financial education and influences the growth of financial knowledge and change in financial behavior associated with payments [57–59].
3. Material and Methods From the methodological point of view, this research is unique. In the previous stud-
ies cited above, researchers examined the level of financial knowledge in general, referring to the knowledge in terms of interest rates, inflation, the price of money across time, sav-ings, investments, etc. The OECD methodology measures the levels of basic financial knowledge, focusing on responses to seven questions designed to test different aspects of
Figure 1. Types of financial knowledge.
The research described in literature considers only one form of the cashless payment—credit cards. Our research shows a much wider spectrum of cashless payments, whichwill be discussed below. Cashless payments are developing rapidly, resulting from thedevelopment of non-cash transactions, the availability of infrastructure and the growingawareness of the need to deepen the knowledge of consumers in this area. Among formsof cashless payment, debit cards hold the largest share of the market, but payments withproximity cards are growing rapidly. Moreover, mobile payments made with the useof mobile phone applications are more slowly making their way into the market. Thechoice of payment method is influenced by a number of factors, including the cost of thegiven method in terms of money, transaction speed, ease of use, the loyalty programsattached to selected payment instruments and other factors [50–57]. Many countriesfeature extensive promotional programs that use cashless turnover, which serves as a formof financial education and influences the growth of financial knowledge and change infinancial behavior associated with payments [57–59].
3. Material and Methods
From the methodological point of view, this research is unique. In the previous studiescited above, researchers examined the level of financial knowledge in general, referringto the knowledge in terms of interest rates, inflation, the price of money across time,savings, investments, etc. The OECD methodology measures the levels of basic financialknowledge, focusing on responses to seven questions designed to test different aspects ofknowledge that are widely considered to be useful to individuals when making financialdecisions [26]. Our study differs from the others in that besides examining total financialknowledge, knowledge of cashless payments, mobile payments, contactless payments,PayPal, Pay Per Call, PayU, prepaid cards, charge, credit, debit cards and virtual cardswere also examined. Thus, this article presents a specialized approach to financial literacy,measuring specifically the knowledge of consumers in terms of digital payments and itspotential impact on payment behavior based on primary research.
Sustainability 2021, 13, 6401 7 of 18
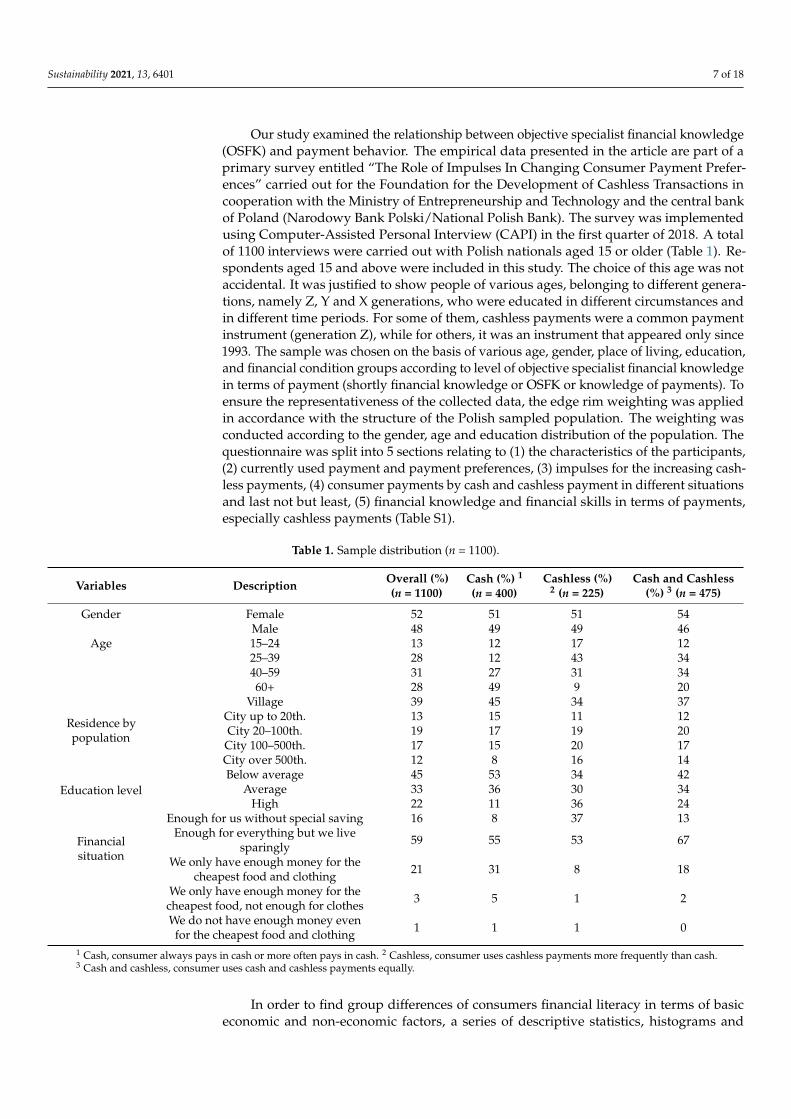
Our study examined the relationship between objective specialist financial knowledge(OSFK) and payment behavior. The empirical data presented in the article are part of aprimary survey entitled “The Role of Impulses In Changing Consumer Payment Prefer-ences” carried out for the Foundation for the Development of Cashless Transactions incooperation with the Ministry of Entrepreneurship and Technology and the central bankof Poland (Narodowy Bank Polski/National Polish Bank). The survey was implementedusing Computer-Assisted Personal Interview (CAPI) in the first quarter of 2018. A totalof 1100 interviews were carried out with Polish nationals aged 15 or older (Table 1). Re-spondents aged 15 and above were included in this study. The choice of this age was notaccidental. It was justified to show people of various ages, belonging to different genera-tions, namely Z, Y and X generations, who were educated in different circumstances andin different time periods. For some of them, cashless payments were a common paymentinstrument (generation Z), while for others, it was an instrument that appeared only since1993. The sample was chosen on the basis of various age, gender, place of living, education,and financial condition groups according to level of objective specialist financial knowledgein terms of payment (shortly financial knowledge or OSFK or knowledge of payments). Toensure the representativeness of the collected data, the edge rim weighting was appliedin accordance with the structure of the Polish sampled population. The weighting wasconducted according to the gender, age and education distribution of the population. Thequestionnaire was split into 5 sections relating to (1) the characteristics of the participants,(2) currently used payment and payment preferences, (3) impulses for the increasing cash-less payments, (4) consumer payments by cash and cashless payment in different situationsand last not but least, (5) financial knowledge and financial skills in terms of payments,especially cashless payments (Table S1).
Table 1. Sample distribution (n = 1100).
Variables Description Overall (%)(n = 1100)
Cash (%) 1
(n = 400)Cashless (%)
2 (n = 225)Cash and Cashless
(%) 3 (n = 475)
Gender Female 52 51 51 54Male 48 49 49 46
Age 15–24 13 12 17 1225–39 28 12 43 3440–59 31 27 31 3460+ 28 49 9 20
Residence bypopulation
Village 39 45 34 37City up to 20th. 13 15 11 12City 20–100th. 19 17 19 20
City 100–500th. 17 15 20 17City over 500th. 12 8 16 14
Education levelBelow average 45 53 34 42
Average 33 36 30 34High 22 11 36 24
Financialsituation
Enough for us without special saving 16 8 37 13Enough for everything but we live
sparingly 59 55 53 67
We only have enough money for thecheapest food and clothing 21 31 8 18
We only have enough money for thecheapest food, not enough for clothes 3 5 1 2
We do not have enough money evenfor the cheapest food and clothing 1 1 1 0
1 Cash, consumer always pays in cash or more often pays in cash. 2 Cashless, consumer uses cashless payments more frequently than cash.3 Cash and cashless, consumer uses cash and cashless payments equally.
In order to find group differences of consumers financial literacy in terms of basiceconomic and non-economic factors, a series of descriptive statistics, histograms and

Sustainability 2021, 13, 6401 8 of 18
standard box plots were examined. Additionally, several relationship statistical methodshave been introduced to evaluate the variability of influencing factors.
For data analyses, Pearson’s chi-squared tests were used to examine the indepen-dence of the polynomial features. A multivariate contingency table was built to calculatecorrelations between interested variables. The respondents’ personal data were used toshow associations between the level of financial knowledge and a wide range of paymentinstruments. The statistics were calculated based on the association table, which wasdetermined from the formula:
χ2 =w
∑i=1
k
∑j=1
(nij −ˆnij)
2
nij=
w
∑i=1
k
∑j=1
ˆnij
2
ˆnij
− N (1)
whereˆnij =
ni. × n.j
N(2)
Furthermore, having the statistical significance of the relationship between the vari-ables calculated, the data interpretation was supplemented by Cramér’s V coefficient inorder to verify the strength of the discovered associations. This measure of associationbetween two nominal variables gives a value between 0 and 1.
V =
√χ2
Nmin((w− 1), (k− 1)(3)
where k represents the number of columns, w denotes the number of lines and n is thetotal number. Finally, in the case of the functional relationship, V = 1, while in stochasticindependence of features, it equals zero.
In order to define whether the correlation is positive or negative, a statistical technique,Kendall’s Tau (W), which measures associations based on the ranks of the data, wasimplemented.
W = 12(∑N
i=1 T2i )−
(∑Ni=1 Ti)
2
Nm2(N4 − N2)
(4)
Additionally, results were confirmed by Spearman’s (rho) rank correlation coefficient.Both correlation coefficients can range from −1 to +1. The positive correlation signifies thatthe ranks of both the variables are increasing. The negative correlation signifies that whilethe rank of one variable is increased, the rank of the other variable is decreased.
The data were further analyzed using ANOVA (Table 2). ANOVA is a method ofmeasuring the overall significance of differences in means widely used in economic analysis,especially for financial literacy analysis [60,61]. It provides no insights into the sizes ofeffects and does not indicate which groups caused the differences to be significant. ANOVAalso tests whether or not the means of several groups are equal:
H0: µ1 = µ2 = µ3 = .... (5)
Typically, with the intention to reject H0 in order to provide evidence that the alter-native hypothesis (H1: Not H0) is more likely. Such a finding means that the analyzedgroups differ significantly from each other. The calculation is presented in Table 2 (wheren is the number of observations and k is the number of analyzed groups). If F0 is greaterthan F(k − 1, n − k), the hypothesis H0 will be rejected, which indicates that the analyzedgroups differ significantly. Otherwise, there is no reason to reject H0. We thoroughly ana-lyzed associations between financial knowledge of payments and a set of selected variables.The survey included knowledge tests comprising a total of 23 questions (Table S1). Bothtests allowed assessments of financial knowledge in terms of cashless payments. Moreover,we used three levels of objective specialist financial knowledge defined below:

Sustainability 2021, 13, 6401 9 of 18
low level: γ∈ <0−7>;average level: γ∈ <8−15>;and high level: γ∈ <16−23>;
which were calculated according to the formula: γ = ∑12i=1 αi + ∑11
j=1 β j, where α, β arecorrect answers from knowledge tests (Table S1). For each item of the questionnaire,the respondents were rated based on whether they chose the correct answer in bothknowledge tests. Respondents who refused to give answers were eliminated from thesample. Robb et al. [41] assessed objective financial knowledge based on 6 objectivequestions concerning financial knowledge and examined its association with consumers’financial satisfaction. However, the questions they used are general questions aboutfinancial aspects, not focusing on payments. Furthermore, they rated the respondents’subjective perception on a scale from 1 (very low) to 7 (very high). In our study, subjectiveknowledge was measured by one item, while the objective knowledge was measured by23 items in the knowledge tests.
Table 2. Analysis of variance (ANOVA).
Source Degrees ofFreedom Sum of Squares (SS) Mean Square (MS) Test F
Groups K − 1SS Groups =
∑groups ni(xi − x)2 MSG =SS Groups
k−1 F =MS Groups
MSE
Error(Within) N − k SSE =∑groups (ni − 1)s2
iMSE = SSE
k−1
Total N − 1SS Total =
∑values
(xij − x
)2
Finally, in this study, we introduced a machine learning technique to define variableimportance measurement. Random Forest (RF) is powerful tool that has recently been usedto solve the problems of prediction and variable importance measurement [16,62,63]). Forthis study, we used decision trees [64–66]), more specifically, classification and regressiontrees [67]. In general, the algorithm identifies the most important predictors within the setof covariates, by means of the computation of some variable importance measures. Thismethod is an example of an ensemble learner built on decision trees. In machine learningimplementations of decision trees, each node in the tree splits the data into two groupsusing a cutoff value within one of the features. The algorithm continues making furthersplits by searching all possible options and choosing the one that minimizes the error ofthe model. It is repeated until achieving a specified number of splits.
As the variables of interest (financial knowledge aspects) are discrete, the majorityprediction of the regression trees in the model is the prediction of the whole RandomForest. In this situation, the number of splits as well as the number of trees are importantparameters that can be manually set during the analysis process. Here, we generate200 forests of regression trees, each containing up to 20 splits, with the size of the trainingdata defined at one-third of the full dataset. For the analysis, we calculate “out-of-bag”error, as well as the average estimates of predictor importance, which are based on thenumber and position of splits using those predictors inside the trees.
For the purposes of the article, the following hypotheses and research questions wereused. (a) Consumers with a higher level of objective specialist financial knowledge are morelikely to make cashless payments. (b) There are significant differences between consumerswith the "average" and "high" levels of objective specialist financial knowledge in terms ofconsumer payment behavior. (c) Women have a higher level of objective specialist financialknowledge than men. (d) Payment behaviors differ by several socioeconomic factors.

Sustainability 2021, 13, 6401 10 of 18
4. Results and Discussion
Age is a significant factor in the banking penetration and in the choice of payment.Two age groups have the lowest banking penetration rate: the youngest (aged 15–24)and the oldest (aged 60 and above), for whom cashless payments were not natural fromthe onset and who commonly use cash. As for the place of living, quite surprising isthe percentage share of the country inhabitants. It turns out that 34% of them, i.e., thelargest number compared to other locations, are people making cashless payments. Thismay be because these rural villages are suburbs of big cities where people often makecashless payments quite naturally. These are often suburbs of medium (20,000–100,000people) and big (100,000–500,000 people) cities whose inhabitants often work in big citieswhere cashless shopping is widespread and suitable infrastructures exist. In the medium-sized and big cities, the percentages of people (apart from the villages) who use cashlesspayment methods are 19% and 20%, respectively. Education is a less significant factor. Itis distributed evenly in all the education groups. As the level of education increases, thepercentage of cash payments decreases. This study used three levels of financial knowledge:low, average and high. The results of objective knowledge are astonishing and significantlydifferent from the results demonstrating subjective financial knowledge. Objectively, only14% of consumers have a low level of knowledge, while 44% have average knowledgeand 42% have high knowledge. This result is surprisingly high. Figure 2 shows a closerelationship between the level of objective specialist financial knowledge and the use ofcashless payments. The number of cashless transactions increases with the increase inknowledge. This finding is confirmed by the results of the analysis of variance (ANOVA)in Table 2, showing the results of individual groups according to the level of OSFK. Table 3shows that the value of F (Fisher) is definitely higher than the theoretical value of the testwith a low p-value (below 0.05) at the same time. Therefore, it can be clearly stated thatconsumers with a higher level of objective specialist financial knowledge make cashlesspayment more often than people with a low level of knowledge. Moreover, there aresignificant differences between the “average” and “high” levels of objective specialistfinancial knowledge. It also shows a relatively high F-test value with a small p-value,which confirms the hypothesis of differences in payments made between these two groups.
Sustainability 2021, 13, x FOR PEER REVIEW 11 of 18
Figure 2. Relationship between OSFK and a form of payment.
Table 3. Analysis of variance for all OSFK groups.
Source SS df MS F p-Value Test F Groups 738.28 2 369.14 228.4844 <0.0001 3.003928
Error (Within) 1772.316 1097 1.615603 Total 2510.596 1099
Respondents answered behavior questions on a scale of 1–5: (1, very rarely; 2, rarely; 3, neither rarely nor often; 4, often; 5, very often). The results are presented using a seman-tic differential (Figure 3). Certainly, it can be stated that in diverse situations, people with a lower level of financial knowledge make cash payments more often than people with a medium and higher level of knowledge. This applies both to the purchase of goods and services and the payment of bills or in offices. Table 4 shows the answers to the questions concerning the financial situation in terms of number of people (quantity and percentage) of a given level of financial knowledge. A slight improvement can be observed in the fi-nancial situation along with the increase in level of knowledge, especially in the group which reports its financial situation as the best (3.9% to 22.9%). The fact of differentiation between the groups is also confirmed by analyses of variances (ANOVA) (Table 4) for all groups of the level of financial knowledge in relation to their self-assessment of the finan-cial situation (high value of F statistics in relation to the theoretical value of the F test with a low p-value).
Figure 2. Relationship between OSFK and a form of payment.

Sustainability 2021, 13, 6401 11 of 18
Table 3. Analysis of variance for all OSFK groups.
Source SS df MS F p-Value Test F
Groups 738.28 2 369.14 228.4844 <0.0001 3.003928
Error (Within) 1772.316 1097 1.615603
Total 2510.596 1099
Respondents answered behavior questions on a scale of 1–5: (1, very rarely; 2, rarely; 3,neither rarely nor often; 4, often; 5, very often). The results are presented using a semanticdifferential (Figure 3). Certainly, it can be stated that in diverse situations, people with alower level of financial knowledge make cash payments more often than people with amedium and higher level of knowledge. This applies both to the purchase of goods andservices and the payment of bills or in offices. Table 4 shows the answers to the questionsconcerning the financial situation in terms of number of people (quantity and percentage)of a given level of financial knowledge. A slight improvement can be observed in thefinancial situation along with the increase in level of knowledge, especially in the groupwhich reports its financial situation as the best (3.9% to 22.9%). The fact of differentiationbetween the groups is also confirmed by analyses of variances (ANOVA) (Table 4) forall groups of the level of financial knowledge in relation to their self-assessment of thefinancial situation (high value of F statistics in relation to the theoretical value of the F testwith a low p-value).
Sustainability 2021, 13, x FOR PEER REVIEW 12 of 18
Figure 3. Semantic differential presenting differences in the frequency of cash payments for different groups of OSFK. Answered on a scale of 1–5: 1, very rarely; 2, rarely; 3, neither rarely nor often; 4, often; 5, very often.
Table 4. Analysis of variance for all groups of OSFK—financial situation.
Source SS df MS F p-Value Test F Groups 6945.348 2 3472.674 60.25147 <0.00001 3.003928
Error (Within) 63,227.06 1097 57.63634 Total 70,172.41 1099
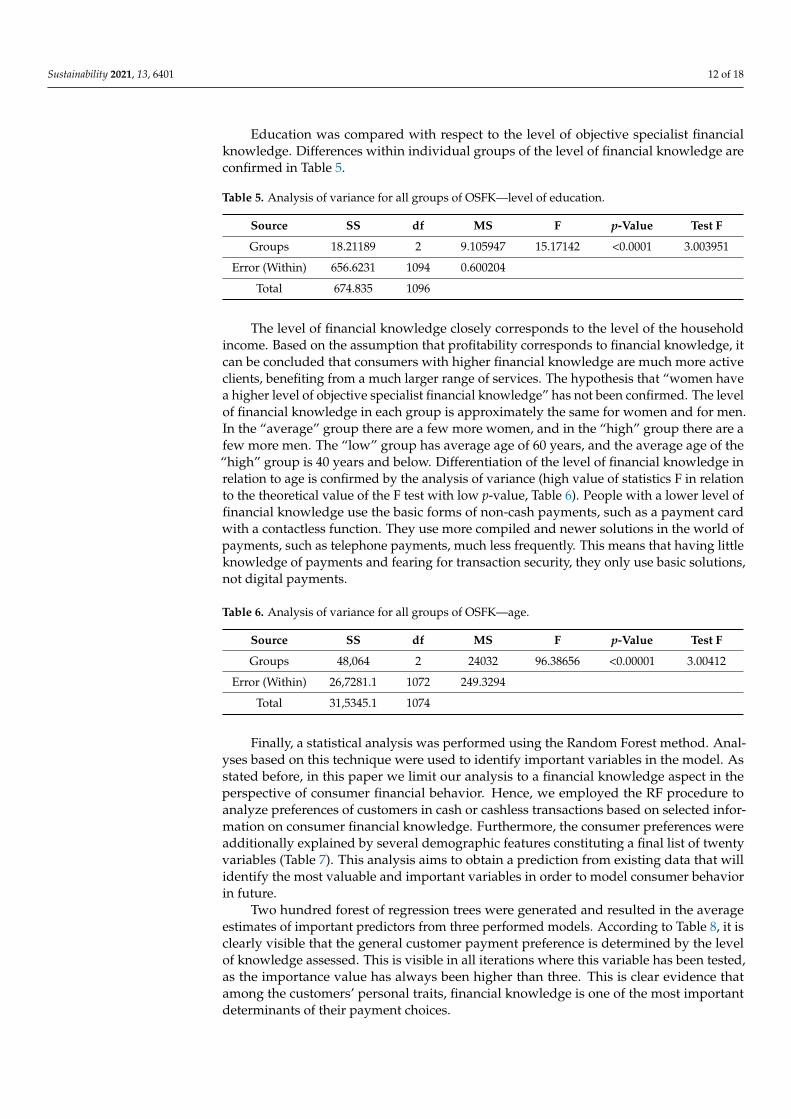
Education was compared with respect to the level of objective specialist financial knowledge. Differences within individual groups of the level of financial knowledge are confirmed in Table 5.
Table 5. Analysis of variance for all groups of OSFK—level of education.
Source SS df MS F p-Value Test F Groups 18.21189 2 9.105947 15.17142 <0.0001 3.003951
Error (Within) 656.6231 1094 0.600204 Total 674.835 1096
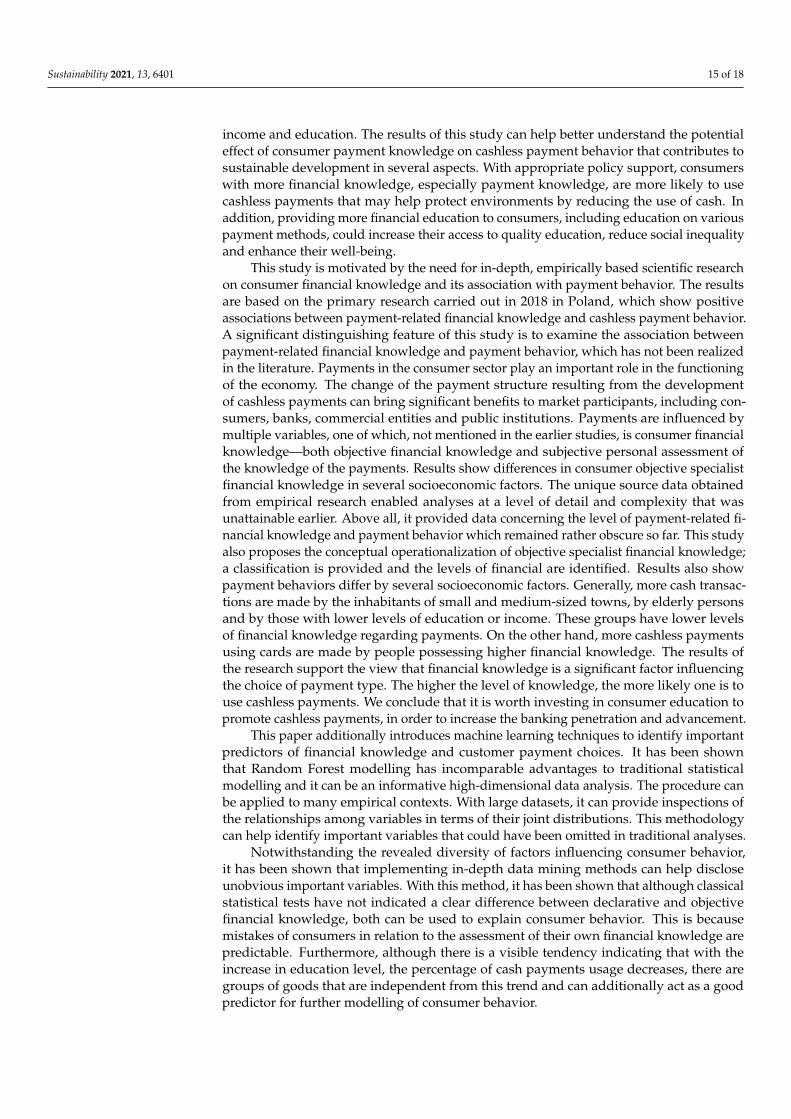
The level of financial knowledge closely corresponds to the level of the household income. Based on the assumption that profitability corresponds to financial knowledge, it can be concluded that consumers with higher financial knowledge are much more active clients, benefiting from a much larger range of services. The hypothesis that “women have a higher level of objective specialist financial knowledge” has not been confirmed. The level of financial knowledge in each group is approximately the same for women and for men. In the “average” group there are a few more women, and in the “high” group there are a few more men. The “low” group has average age of 60 years, and the average age of the “high” group is 40 years and below. Differentiation of the level of financial knowledge in relation to age is confirmed by the analysis of variance (high value of statistics F in relation to the theoretical value of the F test with low p-value, Table 6). People with a lower level of financial knowledge use the basic forms of non-cash payments, such as a payment card with a contactless function. They use more compiled and newer solutions in the world of payments, such as telephone payments, much less frequently. This means that having little knowledge of payments and fearing for transaction security, they only use basic solutions, not digital payments.
Figure 3. Semantic differential presenting differences in the frequency of cash payments for differentgroups of OSFK. Answered on a scale of 1–5: 1, very rarely; 2, rarely; 3, neither rarely nor often; 4,often; 5, very often.
Table 4. Analysis of variance for all groups of OSFK—financial situation.
Source SS df MS F p-Value Test F
Groups 6945.348 2 3472.674 60.25147 <0.00001 3.003928
Error (Within) 63,227.06 1097 57.63634
Total 70,172.41 1099
Sustainability 2021, 13, 6401 12 of 18
Education was compared with respect to the level of objective specialist financialknowledge. Differences within individual groups of the level of financial knowledge areconfirmed in Table 5.
Table 5. Analysis of variance for all groups of OSFK—level of education.
Source SS df MS F p-Value Test F
Groups 18.21189 2 9.105947 15.17142 <0.0001 3.003951
Error (Within) 656.6231 1094 0.600204
Total 674.835 1096
The level of financial knowledge closely corresponds to the level of the householdincome. Based on the assumption that profitability corresponds to financial knowledge, itcan be concluded that consumers with higher financial knowledge are much more activeclients, benefiting from a much larger range of services. The hypothesis that “women havea higher level of objective specialist financial knowledge” has not been confirmed. The levelof financial knowledge in each group is approximately the same for women and for men.In the “average” group there are a few more women, and in the “high” group there are afew more men. The “low” group has average age of 60 years, and the average age of the“high” group is 40 years and below. Differentiation of the level of financial knowledge inrelation to age is confirmed by the analysis of variance (high value of statistics F in relationto the theoretical value of the F test with low p-value, Table 6). People with a lower level offinancial knowledge use the basic forms of non-cash payments, such as a payment cardwith a contactless function. They use more compiled and newer solutions in the world ofpayments, such as telephone payments, much less frequently. This means that having littleknowledge of payments and fearing for transaction security, they only use basic solutions,not digital payments.
Table 6. Analysis of variance for all groups of OSFK—age.
Source SS df MS F p-Value Test F
Groups 48,064 2 24032 96.38656 <0.00001 3.00412
Error (Within) 26,7281.1 1072 249.3294
Total 31,5345.1 1074
Finally, a statistical analysis was performed using the Random Forest method. Anal-yses based on this technique were used to identify important variables in the model. Asstated before, in this paper we limit our analysis to a financial knowledge aspect in theperspective of consumer financial behavior. Hence, we employed the RF procedure toanalyze preferences of customers in cash or cashless transactions based on selected infor-mation on consumer financial knowledge. Furthermore, the consumer preferences wereadditionally explained by several demographic features constituting a final list of twentyvariables (Table 7). This analysis aims to obtain a prediction from existing data that willidentify the most valuable and important variables in order to model consumer behaviorin future.
Two hundred forest of regression trees were generated and resulted in the averageestimates of important predictors from three performed models. According to Table 8, it isclearly visible that the general customer payment preference is determined by the levelof knowledge assessed. This is visible in all iterations where this variable has been tested,as the importance value has always been higher than three. This is clear evidence thatamong the customers’ personal traits, financial knowledge is one of the most importantdeterminants of their payment choices.

Sustainability 2021, 13, 6401 13 of 18
Table 7. List of variables used for machine learning modelling with the Random Forest methodology.
Variable Abbreviation Variable Description
T Transaction type chosen most often
K1 Financial knowledge self-esteem
K2 Financial knowledge level
P1 Gender
P2 Age
P3 Education
P4 Place of living
T1 The most common method of payment for groceries
T2 The most common method of payment for expensive goods
T3 The most common method of payment for services
T4 The most common method of payment for orders from Internet
T5 The most common method of payment for utility bills
T6 The most common method of payment in public offices
T7 Paid in cash although there was possibility to pay it cashless
K3 I know how to set up an account on the Internet
K4 I know how to use mobile phone for payments
K5 I know how to use card for payments
K6 I know how to withdraw money from ATMs with card
K7 I know how to use card for payments on the Internet
K8 I know how to book a hotel online
Interesting information for future modelling can also be found in datasets correspond-ing to financial knowledge itself. Although the ANOVA results show that there are noclear differences between declarative and objective financial knowledge, the importance ofvariables K1 and K2 compromising self-assessed and tested knowledge in RF analyze arevery high importance reaching up to value of 5.865. This suggests that although accordingto earlier analysis, the noticeable large group of respondents made a mistake in relation tothe assessment of their financial knowledge, the type of error is predictable.
Notwithstanding the clear importance of presented earlier variables, important infor-mation for future modelling can also be found in datasets corresponding to more detailedaspects of financial knowledge. The importance of variables K3 to K8 compromisingselected in-depth questions corresponding with cashless payments knowledge appear tohave the most significant importance reaching, depending on the model, value up to 7.920.
The results show that the information on type of payment in different places/differenttype of purchased good (variables T1–T7) has a much lower importance. They generallyextend from −0.224 to 1.674 with two exceptions. Decisions of customers on specific smallpurchases such as groceries and utility bills appear to have significant importance, reachingvalues of 3.854 and 4.537, respectively.
Diversified influence on the model can be observed in analyzed demographic datasets.For instance, the gender (P1) can be totally neglected in future modelling. In fact, severalvariables such as age, education and place of living are not very helpful for predictingcustomer knowledge level, but at the same time they represent high importance withinvariables corresponding with transaction types preferred by customers.

Sustainability 2021, 13, 6401 14 of 18
Table 8. Results of Random Forest modelling.
Variable of Interest
T K1 K2
Importance
T - 3.619 2.317
K1 2.496 - 6.025
K2 4.909 5.865 -
P1 0.170 0.306 0.103
P2 4.249 1.412 1.572
P3 5.319 0.463 0.309
P4 4.584 1.049 0.601
T1 0.586 2.233 3.854
T2 1.085 1.078 1.476
T3 1.347 1.018 1.674
T4 −0.223 0.523 0.814
T5 1.417 1.620 4.537
T6 0.877 −0.224 −0.148
T7 2.618 1.348 1.067
K3 3.925 1.169 2.844
K4 2.553 3.887 3.485
K5 4.820 2.000 0.756
K6 5.161 1.944 −1.442
K7 7.898 3.089 6.009
K8 7.920 7.298 2.574
These findings are new contributions to the literature of financial literacy. This studyused an innovative approach, the Random Forest method, to explore important factorsrelated to consumer payment behavior and generated some interesting findings. The resultsshow that financial knowledge measured both objectively and subjectively are associatedwith consumer financial behavior, which is consistent with previous research [15,44].Unlike previous research that shows the association between general financial knowledgeand general financial behavior, in this study, financial knowledge is specifically relatedto payment choices, which suggests that specific financial knowledge is associated withspecific financial behavior. In addition, this method also found that factors associated withfinancial behavior may not be associated with financial knowledge, which are informativefor policy interventions when they have different policy targets.
5. Conclusions
Changes in the economy lead to changes in consumer behavior in the financial mar-kets. The pace of these changes exceeds the knowledge, awareness and readiness ofconsumers to change and their ability to understand the processes taking place. Sincecashless payments have gained favor with consumers, companies operating in the IT andbanking industries have been developing new solutions that dynamize the developmentof products and services in this area. However, in order for payments to be safe both onthe part of the consumer and the institutions issuing the product, as well as the entirepayment system, it is necessary to conduct relevant research to better understand thisfield. Taking into account the dynamics of market development, as well as the resultingchanges in consumer expectations, this study examined the level of financial knowledgeregarding payments and explored group differences in relation to age, financial situation,
Sustainability 2021, 13, 6401 15 of 18
income and education. The results of this study can help better understand the potentialeffect of consumer payment knowledge on cashless payment behavior that contributes tosustainable development in several aspects. With appropriate policy support, consumerswith more financial knowledge, especially payment knowledge, are more likely to usecashless payments that may help protect environments by reducing the use of cash. Inaddition, providing more financial education to consumers, including education on variouspayment methods, could increase their access to quality education, reduce social inequalityand enhance their well-being.
This study is motivated by the need for in-depth, empirically based scientific researchon consumer financial knowledge and its association with payment behavior. The resultsare based on the primary research carried out in 2018 in Poland, which show positiveassociations between payment-related financial knowledge and cashless payment behavior.A significant distinguishing feature of this study is to examine the association betweenpayment-related financial knowledge and payment behavior, which has not been realizedin the literature. Payments in the consumer sector play an important role in the functioningof the economy. The change of the payment structure resulting from the developmentof cashless payments can bring significant benefits to market participants, including con-sumers, banks, commercial entities and public institutions. Payments are influenced bymultiple variables, one of which, not mentioned in the earlier studies, is consumer financialknowledge—both objective financial knowledge and subjective personal assessment ofthe knowledge of the payments. Results show differences in consumer objective specialistfinancial knowledge in several socioeconomic factors. The unique source data obtainedfrom empirical research enabled analyses at a level of detail and complexity that wasunattainable earlier. Above all, it provided data concerning the level of payment-related fi-nancial knowledge and payment behavior which remained rather obscure so far. This studyalso proposes the conceptual operationalization of objective specialist financial knowledge;a classification is provided and the levels of financial are identified. Results also showpayment behaviors differ by several socioeconomic factors. Generally, more cash transac-tions are made by the inhabitants of small and medium-sized towns, by elderly personsand by those with lower levels of education or income. These groups have lower levelsof financial knowledge regarding payments. On the other hand, more cashless paymentsusing cards are made by people possessing higher financial knowledge. The results ofthe research support the view that financial knowledge is a significant factor influencingthe choice of payment type. The higher the level of knowledge, the more likely one is touse cashless payments. We conclude that it is worth investing in consumer education topromote cashless payments, in order to increase the banking penetration and advancement.
This paper additionally introduces machine learning techniques to identify importantpredictors of financial knowledge and customer payment choices. It has been shownthat Random Forest modelling has incomparable advantages to traditional statisticalmodelling and it can be an informative high-dimensional data analysis. The procedure canbe applied to many empirical contexts. With large datasets, it can provide inspections ofthe relationships among variables in terms of their joint distributions. This methodologycan help identify important variables that could have been omitted in traditional analyses.
Notwithstanding the revealed diversity of factors influencing consumer behavior,it has been shown that implementing in-depth data mining methods can help discloseunobvious important variables. With this method, it has been shown that although classicalstatistical tests have not indicated a clear difference between declarative and objectivefinancial knowledge, both can be used to explain consumer behavior. This is becausemistakes of consumers in relation to the assessment of their own financial knowledge arepredictable. Furthermore, although there is a visible tendency indicating that with theincrease in education level, the percentage of cash payments usage decreases, there aregroups of goods that are independent from this trend and can additionally act as a goodpredictor for further modelling of consumer behavior.

Sustainability 2021, 13, 6401 16 of 18
Supplementary Materials: The following are available online at https://www.mdpi.com/article/10.3390/su13116401/s1, Table S1: Knowledge test.
Author Contributions: Conceptualization, B.S. and J.X.; formal analysis, B.S.; methodology and datacuration, B.S., P.T. and T.W.; writing the original and revised drafts, B.S., P.T. and J.X.; visualization andvalidation, B.S. and P.T. All authors have read and agreed to the published version of the manuscript.
Funding: This research was co-financed within the framework of the program of the Ministry ofScience and Higher Education under the name “Regional Excellence Initiative” during the period2019–2022; project number 001/RID/2018/19; the amount of financing PLN 10,684,000.00.
Institutional Review Board Statement: Not applicable.
Informed Consent Statement: Not applicable.
Data Availability Statement: The data presented in this study are available on request from thecorresponding author.
Conflicts of Interest: The authors declare no conflict of interest.
References1. Bryant, J.H. Economic Growth and Sustainability Rooted in Financial Literacy. In Practicing Sustainability; Madhavan, G., Oakley,
B., Green, D., Koon, D., Low, P., Eds.; Springer: New York, NY, USA, 2013.2. Warner, C.K.; Agnello, M.F. Intergenerational Financial Literacy: The case for teaching sustainable financial decision making in
schools. Citizsh. Soc. Econ. Educ. 2012, 11, 202–2012. [CrossRef]3. Rahmandoust, M.; Shah, I.M.; Norouzi, M.; Hakimpoor, H.; Khani, N. Teaching financial literacy to entrepreneurs for sustainable
development. OIDA Int. J. Sustain. 2011, 2, 6166.4. Swiecka, B.; Yesildag, E.; Özen, E.; Grima, S. Financial literacy. Case of Poland. Sustainability 2020, 12, 700. [CrossRef]5. NBP. Comparison of Selected Elements Polish Payment System with Systems of Other Countries European Union for 2019; National Polish
Bank: Warsaw, Poland, 2020.6. Henry, C.S.; Huynh, K.P.; Welte, A. Method-of-Payments Survey Results; Staff Discussion Paper 2018-17; Bank of Canada: Ottawa,
ON, Canada, 2017.7. Fujiki, H. Cash Demand and Financial Literacy: A Case Study Using Japanese Survey Data, Japan and the World Economy; Elsevier:
Amsterdam, The Netherlands, 2020; Volume 54, p. 100998.8. Esselink, H.; Hernández, L. The Use of Cash by Households in the Euro Area; Occasional Paper Series, No. 201; European Central
Bank: Frankfurt am Main, Germany, 2017.9. Greene, C.; O’Brien, S.; Schuh, S. U.S. Consumer Cash Use, 2012 and 2015: An Introduction to the Diary of Consumer Payment Choice;
Research Data Reports Paper, No. 17-6; Federal Reserve Bank of Boston: Boston, MA, USA, 2017.10. Koulayev, S.; Rysman, M.; Schuh, S.; Stavins, J. Explaining adoption and use of payment instruments by U.S. consumers. RAND J.
Econ. 2016, 47, 293–325. [CrossRef]11. Chen, H.; Felt, M.-H.; Huynh, K.P. Retail payment innovations and cash usage: Accounting for attrition by using refreshment
samples. J. R. Stat. Soc. Ser. A 2017, 180, 503–530. [CrossRef]12. Kadoya, Y.; Khan, M. What determines financial literacy in Japan? J. Pension Econ. Finance 2019, 19, 1–19. [CrossRef]13. Jonker, N.; Hernandez, L.; Vree, R.D.; Zwaan, P. From Cash to Cards: How Debit Card Payments Overtook Cash in the
Netherlands. In Proceedings of the International Cash Conference 2017—War on Cash: Is There a Future for Cash? Island ofMainau, Germany, 25–27 April 2017.
14. Hamid, F.S.; Loke, Y.J. Financial literacy, money management skill and credit card repayments. Int. J. Consum. Stud. 2020, 45,235–247. [CrossRef]
15. Robb, C.A.; Woodyard, A.S. Financial knowledge and best practice behavior. J. Financ. Couns. Plan. 2011, 22, 60–70.16. Swiecka, B.; Terefenko, P.; Paprotny, D. Transaction factors’ influence on the choice of payment by Polish consumers. J. Retail.
Consum. Serv. 2021, 58, 102264. [CrossRef]17. Kaiser, T.; Lusardi, A.; Menkhoff, L.; Urban, C. Financial Education Affects Financial Knowledge and Downstream Behaviors; Wharton
Penson Research Council Working Paper No. 2020-07; National Bureau of Economic Research: Philadelphia, PA, USA, 2020;pp. 1–40.
18. Lusardi, A.; Oggero, N.; Yakoboski, P. The TIAA Institute-GFLEC Personal Finance Index: A New Measure of Financial Literacy; TheGeorge Washington University of Business and Global Financial Literacy Excellence Centre: New York, NY, USA, 2017.
19. Hastings, J.S.; Madrian, B.C.; Skimmyhorn, W.L. Financial literacy, financial education, and economic outcomes. Ann. Rev. Econ.2013, 5, 347–373. [CrossRef] [PubMed]
20. Lusardi, A.; Mitchell, O.S. The economic importance of financial literacy: Theory and evidence. J. Econ. Lit. 2014, 52, 5–44.[CrossRef]
21. Huston, S.J. Measuring financial literacy. J. Consum. Aff. 2010, 44, 296–316. [CrossRef]

Sustainability 2021, 13, 6401 17 of 18
22. Hilgert, M.A.; Hogarth, J.M.; Beverly, S.G. Household financial management: The connection between knowledge and behavior.Fed. Reserve Bull. 2003, 89, 309–322.
23. Lusardi, A.; Mitchell, O.S. Financial literacy around the world. An overview. J. Pension Econ. Financ. 2011, 10, 497–508. [CrossRef]24. Remund, D.L. Financial literacy explicated: The case for a clearer definition in an increasingly complex economy. J. Consum. Aff.
2010, 44, 276–295. [CrossRef]25. Warmath, D.; Zimmerman, D. Financial literacy as more than knowledge: The development of a formative scale through the lens
of bloom’s domains of knowledge. J. Consum. Aff. 2019, 53, 1602–1629. [CrossRef]26. OECD. OECD/INFE 2020 International Survey of Adult Financial Literacy; OECD: Paris, France, 2020; pp. 1–78.27. Atkinson, A.; Messy, F. Measuring Financial Literacy: Results of the OECD/International Network on Financial Education (INFE)
Pilot Study; OECD Working Papers on Finance, Insurance and Private Pensions, No. 15; OECD Publishing: Paris, France, 2012.[CrossRef]
28. Bolisani, E.; Bratianu, C. The Elusive Definition of Knowledge. In Emergent Knowledge Strategies: Strategic Thinking in KnowledgeManagement; Bolisani, E., Bratianu, C., Eds.; Springer International Publishing: Cham, Switzerland, 2018; pp. 1–22.
29. Ranyard, R.; McNair, S.; Nicolini, G.; Duxbury, D. An item response theory approach to constructing and evaluating brief andin-depth financial Literacy scales. J. Consum. Affairs 2020, 54, 1–36. [CrossRef]
30. Van Rooij, M.; Lusardi, A.; Alessie, R. Financial literacy and stock market participation. J. Finan. Econ. 2011, 101, 449–472.[CrossRef]
31. Van Rooij, M.; Lusardi, A.; Alessie, R. Financial literacy and retirement planning in the Netherlands. J. Econ. Psychol. 2011, 32,593–608. [CrossRef]
32. Lusardi, A.; Mitchell, O.S. Financial Literacy and Retirement Planning. New Evidence from the American Life Panel; Paper Number: WP2007–157; University of Michigan, Michigan Retirement Research Centre Research: Ann Arbor, MI, USA, 2007.
33. Lusardi, A.; Mitchell, O.S. Financial literacy and retirement planning in the United States. J. Pension Econ. Financ. 2011, 10,509–525. [CrossRef]
34. Lusardi, A.; Mitchell, O. (Eds.) Financial Literacy and Planning: Implications for Retirement Well-being. In Financial Literacy:Implications for Retirement Security and the Financial Marketplace; Oxford University Press: Oxford, UK, 2011; pp. 17–39.
35. Lusardi, A.; Michaud, P.; Mitchell, O. Optimal Financial Knowledge and Wealth Inequality; NBBR Working Paper No. 18669; NationalBureau of Economic Research: Cambridge, MA, USA, 2013; pp. 1–48.
36. Felipe, I.; Ceribeli, H.; Lana, T. Investigating the level of financial literacy of university students. RACE 2017, 16, 845–866.[CrossRef]
37. Agarwalla, S.; Barua, S.; Varma, J. Financial literacy among working young in urban India. Word Dev. 2015, 67, 101–109. [CrossRef]38. Swiecka, B. Financial literacy as a factor of cashless payments development. Results of survey. Eur. J. Serv. Manag. 2018, 27,
467–473. [CrossRef]39. Xiao, J.J.; Chen, C.; Chen, F. Consumer financial capability and financial satisfaction. Soc. Indic. Res. 2014, 118, 415–432. [CrossRef]40. Xiao, J. Consumer Financial Capability and Financial Wellbeing. In Handbook of Consumer Finance Research; Xiao, J., Ed.; Springer
International Publishing: Cham, Switzerland, 2016; pp. 3–18.41. Robb, A.; Chatterjee, S.; Porto, N.; Cude, B. The Influence of student loan debt on financial satisfaction. J. Fam. Econ. Issues 2018,
40, 51–73. [CrossRef]42. Xiao, J.J.; Porto, N. Financial education and financial satisfaction: Financial literacy, behavior, and capability as mediators. Int. J.
Bank Mark. 2017, 35, 805–817. [CrossRef]43. Arystoteles. Etyka Nikomachejska. In Dzieła wszystkie 5; Wydawnictwo Naukowe PWN: Warsaw, Poland, 1996; pp. 109–110.44. Xiao, J.J.; Tang, C.; Serido, J.; Shim, S. Antecedents and consequences of risky credit behavior among college students: Application
and extension of the theory of planned behavior. J. Public Policy Mark. 2011, 30, 239–245. [CrossRef]45. Babiarz, P.; Robb, C. Financial literacy and emergency saving. J. Fam. Econ. Issues 2014, 35, 40–50. [CrossRef]46. Robb, A. Financial knowledge and credit card behavior of college students. J. Fam. Econ. Issues 2011, 32, 690–698. [CrossRef]47. Hancock, A.; Jorgensen, B.; Swanson, M. College students and credit card use: The role of parents, work experience, financial
knowledge, and credit card attitudes. J. Fam. Econ. Issues 2013, 34, 369–381. [CrossRef]48. Swiecka, B.; Grzesiuk, A.; Korczak, D.; Kaniwska, O.W. Financial Literacy and Financial Education. Theory and Survey; De Gruyter:
Berlin, Germany, 2019.49. Kim, K.; Anderson, S.; Seay, M. Financial knowledge and short-term and long-term financial behaviours of millennials in the
United States. J. Fam. Econ. Issues 2018, 40, 1–15.50. Humphrey, D.B.; Kim, M.; Vale, B. Realizing the gains from electronic payments: Costs, pricing and payment choice. J. Money
Credit. Bank. 2001, 33, 216–234. [CrossRef]51. Stavins, J. Effect of consumer characteristics on the use of payment instruments. N. Engl. Econ. Rev. 2001, 3, 21–31.52. Zinman, J. Why Use Debit Instead of Credit? Consumer Choice in a Trillion Dollar Market; Staff Report, 191; FDR Federal Reserve Bank
of New York: New York, NY, USA, 2004; pp. 1–50.53. Jonker, N. Payment instruments as perceived by consumers, results from a household survey. De Economist 2007, 155, 271–303.
[CrossRef]54. Ching, A.T.; Hayashi, F. Payment card rewards programs and consumer payment choice. J. Bank. Financ. 2010, 34, 1773–1787.
[CrossRef]

Sustainability 2021, 13, 6401 18 of 18
55. Kim, Y.; Lee, M. A model of debit card as a means of payment. J. Econ. Dyn. Control 2010, 34, 1359–1368. [CrossRef]56. Simon, J.; Smith, K.; West, T. Price incentives and consumer payment behaviour. J. Bank. Financ. 2010, 34, 1759–1772. [CrossRef]57. Polasik, M.; Marzec, J.; Fiszeder, P.; Górka, J. Modelowanie Wykorzystania Metod Płatnosci Detalicznych na Rynku Polskim. Materiały i
Studia, nr 265 (Modeling the Use of Retail Payment Methods on the Polish Market. Materials and Studies, No 265); National Polish Bank:Warsaw, Poland, 2012; pp. 1–92.
58. Van Hove, L. On the war on cash and its spoils. Int. J. Electron. Bank. 2008, 1, 36–45. [CrossRef]59. Górka, J. Koszty Społeczne i Prywatne Instrumentów Płatniczych. Materiały i Studia, 231 (Social and Private Costs of Payment Instruments.
Materials and Studies, 231); National Bank of Poland: Warsaw, Poland, 2009; pp. 1–42.60. Ansong, A.; Gyensare, M.A. Determinants of university working-students’ financial literacy at the university of Cape coast,
Ghana. Int. J. Bus. Manag. 2012, 7, 1–8. [CrossRef]61. Mouna, A.; Anis, J. Financial literacy in Tunisia: Its determinants and its simplications on investment behavior. Res. Int. Bus.
Financ. 2017, 39, 568–577. [CrossRef]62. Luca, D.D.; Rivieccio, G.; Zuccolotto, P. Combining random forest and copula function. A heuristic approach for selecting assets
from a financial crisis perspective. Intell. Syst. Account. Financ. Manag. 2010, 17, 91–109. [CrossRef]63. Levantesi, S.; Zacchia, G. Machine learning and financial literacy: An exploration of factors influencing financial knowledge in
Italy. J. Risk Financ. Manag. 2021, 14, 120. [CrossRef]64. Breiman, L. Bagging predictors. Mach. Learn. 1996, 26, 123–140. [CrossRef]65. Breiman, L. Random forests. Mach. Learn. 2001, 45, 5–32. [CrossRef]66. Archer, K.J.; Kimes, R.V. Empirical characterization of random forest variable importance measures. Comput. Stat. Data Anal.
2008, 52, 2249–2260. [CrossRef]67. Breiman, L.; Friedman, J.H.; Olshen, R.A.; Stone, C.J. Classification and Regression Trees; Chapman & Hall: New York, NY,
USA, 1984.