Embed Size (px)
Citation preview
CONSUMER ENERGY USE &
CUSTOMER EDUCATION IN
NIGERIA FAROUK BELLO
NERC/NARUC
DEC 2014
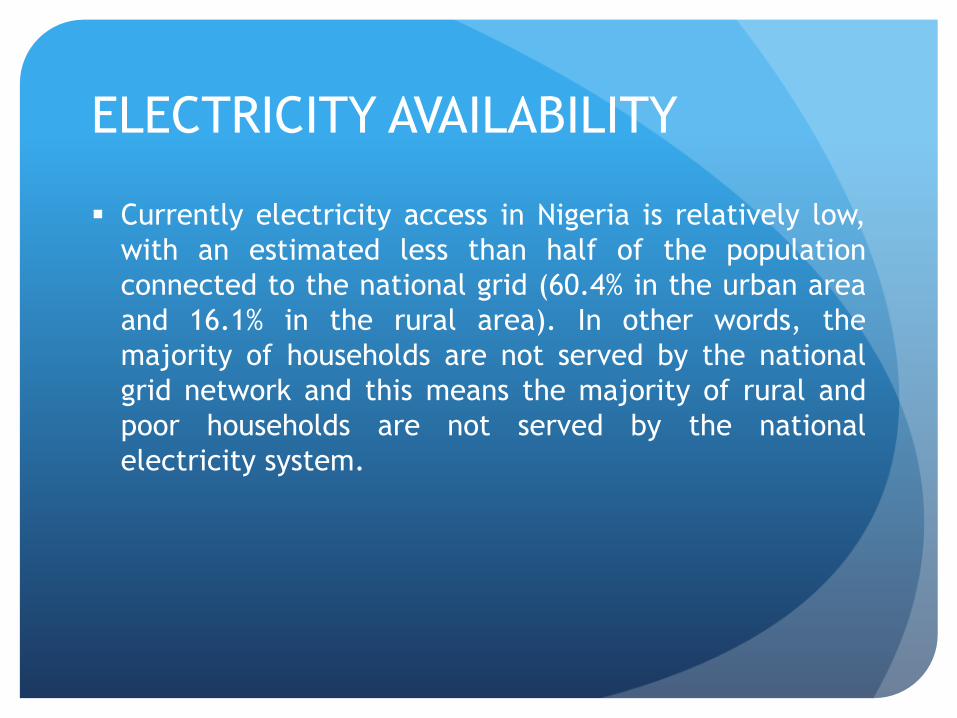
ELECTRICITY AVAILABILITY
Currently electricity access in Nigeria is relatively low,
with an estimated less than half of the population
connected to the national grid (60.4% in the urban area
and 16.1% in the rural area). In other words, the
majority of households are not served by the national
grid network and this means the majority of rural and
poor households are not served by the national
electricity system.
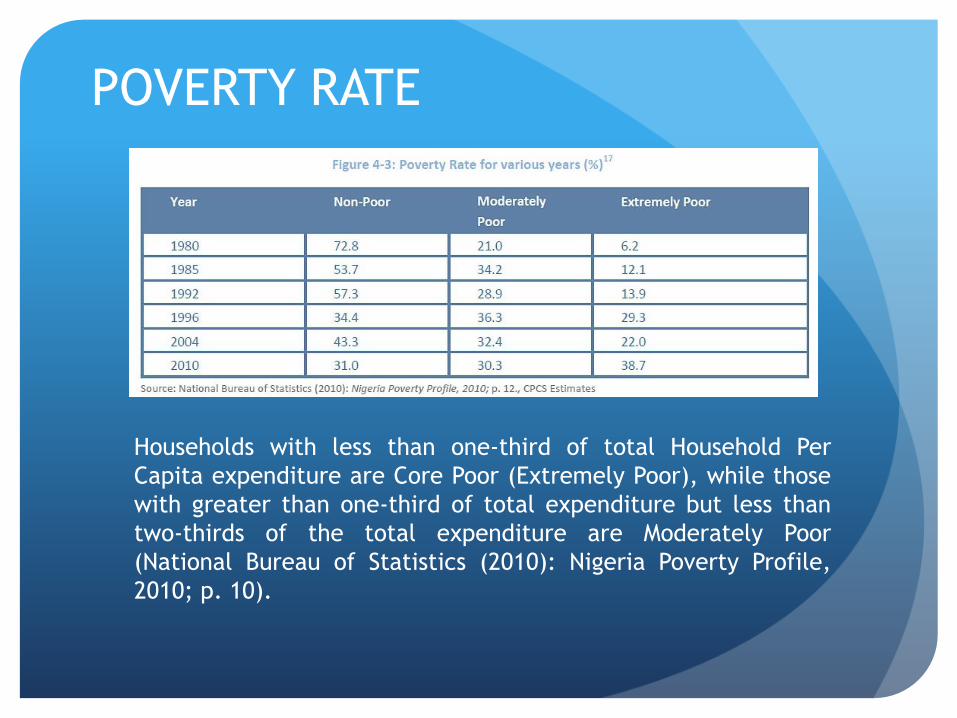
POVERTY RATE
Households with less than one-third of total Household Per
Capita expenditure are Core Poor (Extremely Poor), while those
with greater than one-third of total expenditure but less than
two-thirds of the total expenditure are Moderately Poor
(National Bureau of Statistics (2010): Nigeria Poverty Profile,
2010; p. 10).
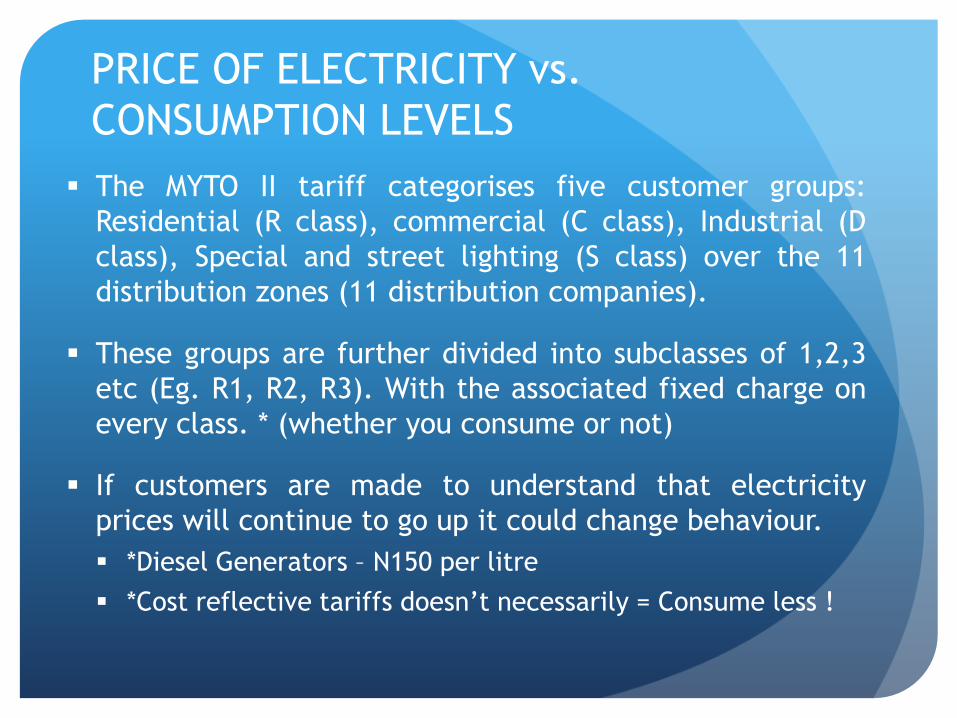
PRICE OF ELECTRICITY vs.
CONSUMPTION LEVELS
The MYTO II tariff categorises five customer groups:
Residential (R class), commercial (C class), Industrial (D
class), Special and street lighting (S class) over the 11
distribution zones (11 distribution companies).
These groups are further divided into subclasses of 1,2,3
etc (Eg. R1, R2, R3). With the associated fixed charge on
every class. * (whether you consume or not)
If customers are made to understand that electricity
prices will continue to go up it could change behaviour.
*Diesel Generators – N150 per litre
*Cost reflective tariffs doesn’t necessarily = Consume less !

ENERGY USE PATTERNS
Household energy usage is intimately linked to the
lifestyle and associated cultural and demographic
factors relating to the household.
These factors are very subjective and not easily defined
with any degree of precision.
Nonetheless, there are broad patterns or trends
discernible amongst household in particular regions of
the country. (More cooling in hot northern states, More
industrial activities in the south western states)
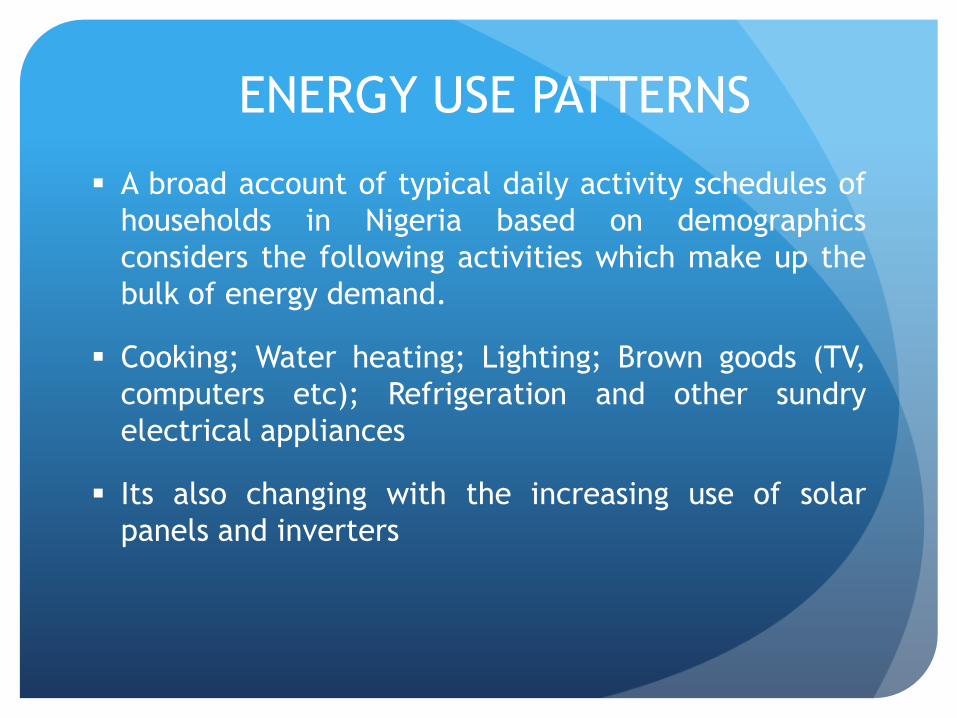
A broad account of typical daily activity schedules of
households in Nigeria based on demographics
considers the following activities which make up the
bulk of energy demand.
Cooking; Water heating; Lighting; Brown goods (TV,
computers etc); Refrigeration and other sundry
electrical appliances
Its also changing with the increasing use of solar
panels and inverters
ENERGY USE PATTERNS
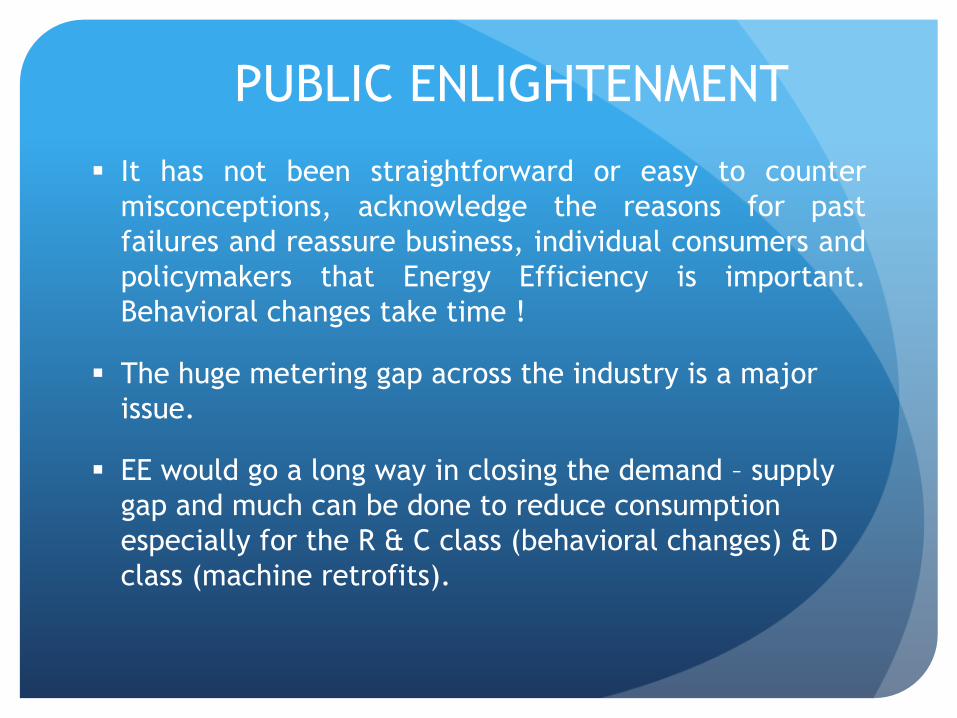
PUBLIC ENLIGHTENMENT
It has not been straightforward or easy to counter
misconceptions, acknowledge the reasons for past
failures and reassure business, individual consumers and
policymakers that Energy Efficiency is important.
Behavioral changes take time !
The huge metering gap across the industry is a major
issue.
EE would go a long way in closing the demand – supply
gap and much can be done to reduce consumption
especially for the R & C class (behavioral changes) & D
class (machine retrofits).
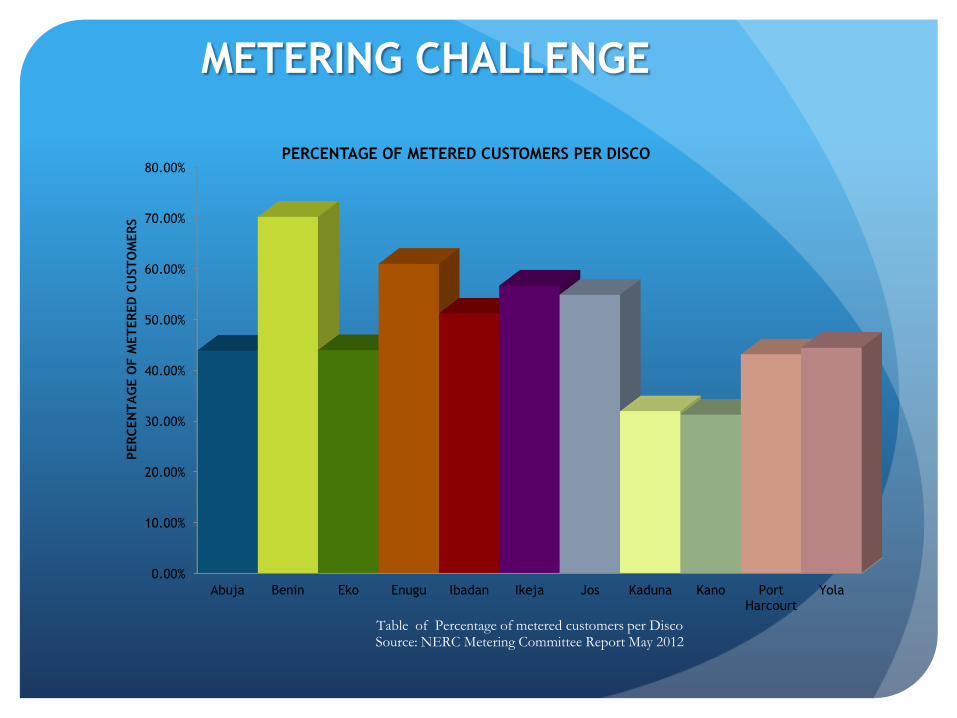
METERING CHALLENGE
0.00%
10.00%
20.00%
30.00%
40.00%
50.00%
60.00%
70.00%
80.00%
Abuja Benin Eko Enugu Ibadan Ikeja Jos Kaduna Kano Port Harcourt
Yola
PER
CEN
TA
GE O
F M
ET
ER
ED
CU
ST
OM
ER
S
Table of Percentage of metered customers per Disco Source: NERC Metering Committee Report May 2012
PERCENTAGE OF METERED CUSTOMERS PER DISCO
8
CONSUMER BEHAVIOUR
A lot of energy is wasted because households, public and private
offices and industries use more energy than is actually necessary to
fulfil their needs. The reason is that many Nigerians exhibit
unwholesome practices that lead to energy wastage.
For example Nigerians rarely turn off their outdoor lighting during
the day. This is particularly very common in commercial and
residential areas of major cities including public institutions such as
universities, government ministries, hospitals etc.
SUSTAINED CONSUMER ELIGHTENMENT IS VERY ESSENTIAL!
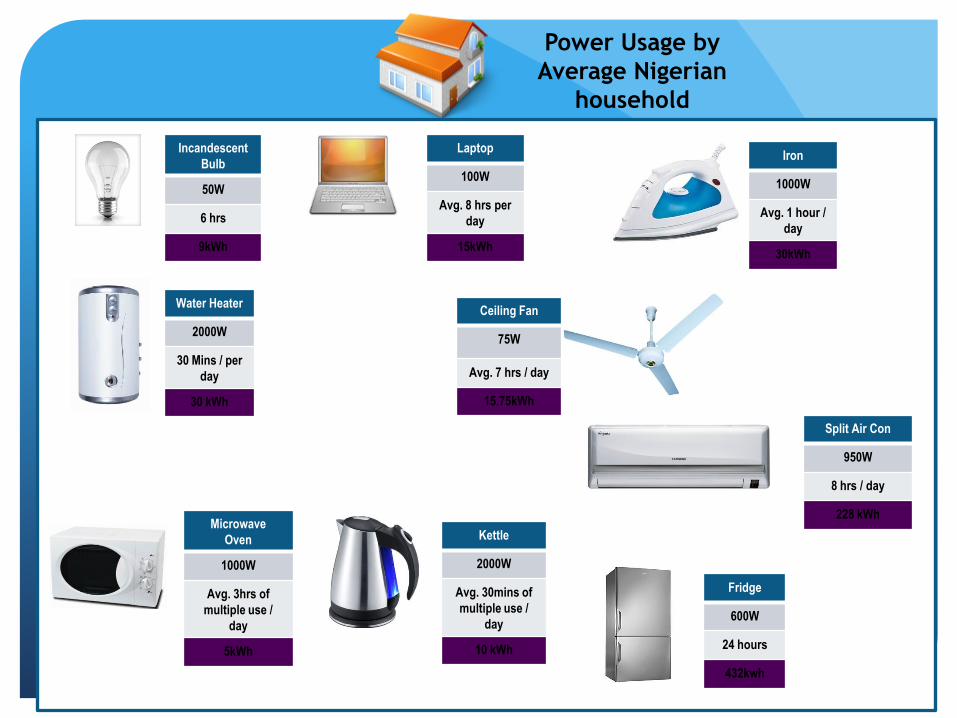
Water Heater
2000W
30 Mins / per
day
30 kWh
Incandescent
Bulb
50W
6 hrs
9kWh
Microwave
Oven
1000W
Avg. 3hrs of
multiple use /
day
5kWh
Kettle
2000W
Avg. 30mins of
multiple use /
day
10 kWh
Laptop
100W
Avg. 8 hrs per
day
15kWh
Ceiling Fan
75W
Avg. 7 hrs / day
15.75kWh
Split Air Con
950W
8 hrs / day
228 kWh
Fridge
600W
24 hours
432kwh
Iron
1000W
Avg. 1 hour /
day
30kWh
Power Usage by
Average Nigerian
household
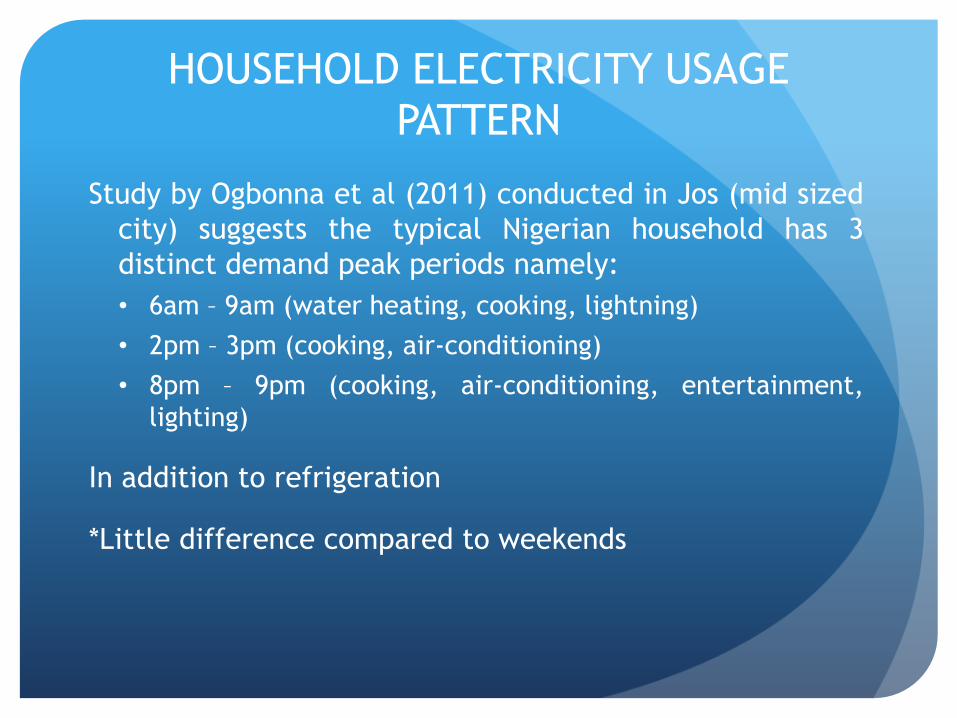
HOUSEHOLD ELECTRICITY USAGE
PATTERN
Study by Ogbonna et al (2011) conducted in Jos (mid sized
city) suggests the typical Nigerian household has 3
distinct demand peak periods namely:
• 6am – 9am (water heating, cooking, lightning)
• 2pm – 3pm (cooking, air-conditioning)
• 8pm – 9pm (cooking, air-conditioning, entertainment,
lighting)
In addition to refrigeration
*Little difference compared to weekends

BOTTLENECKS TO IMPLEMENTING EE
PROGRAMS
No National Policy on EE & DSM yet.
Efficiency of Appliances
Bad habits of wasting electricity
Poor building design
Inefficient lighting
Little financial incentives to consumers
Pricing of Energy Efficient CFLs and appliances
Further exacerbated by the proliferation of inexpensive and inferior counterfeit, imported appliances with no standards or labels.
NERC EFFORTS & OUTREACH INITIATIVES
Recently commissioned an EE/DSM consultancy and
survey.
Power Consumer Assemblies (Town hall meetings) – used
to enlighten the public on the reforms as well as
efficient use of electricity.
Radio & Tv adverts - regularly used by the Commission
to sensitise the public on Energy Efficiency and other
matters.
Planning a National Efficiency Labelling System derived
from a clear energy efficiency framework.

SOLUTIONS ?
Including an EE charge on customer bills wouldn’t
be a good idea at this point in the reform.
Engaging stakeholders such as NOA, Discos,
Customers etc is very necessary in order to shift
public opinion and consumption behavior.
Making it an issue of National Pride to consume
less energy.

THANK YOU
Electricity on Demand 15