Embed Size (px)
Citation preview

Segment Outlook Report, August 2017
CONSUMER ELECTRONICS TELECOMMUNICATIONS

Televisions Radios
Digital Cameras Speakers
Headphones
Mobile Phones
Laptops and
Tables
Desktop PCs
PC Monitors
and Projectors
Keyboards
Printers and
Copiers Storage Units
TV, Radio und
Multimedia
Computing
Consumer Electronics market overview
Telecommunication hardware segment
The market segment Telecommunication hardware includes landline and mobile phones. Mobile phones comprises phones without Internet connectivity as well as feature phones with Internet connectivity and smartphones. Both B2C and B2B sales are included.
Telecommunication hardware sales in Europe and North America
Statista // July 17 1: CAGR = Compound Annual Growth Rate Source: Statista Consumer Market Outlook 2017
2
Annual revenues from telecommunication hardware are rising while sales development remains steady
Telecommunication
Landline Phones
Revenues
Volume sales
161bn $ in 2016
400m units in 2016
CAGR1 2010-2016
+5.7%
CAGR1 2010-2016
+0.1%
Consumer Electronics revenues by segments in Europe and North America in 2016

Per capita volume sales telephones1 in 2016
Comparison by country
Statista // July 17 3
Switzerland and Norway have the highest per capita sales of telephones
0.26 0.60
1: Comprises Landline and mobile phones Source: Statista Consumer Market Outlook 2017

Revenues in million $
Market KPI comparison
Statista // July 17 1: CAGR = Compound Annual Growth Rate Source: Statista Consumer Market Outlook 2017
4
Phone sales in Europe from 2016 to 2017 are only increasing by 0.6%
unit 2010 2011 2012 2013 2014 2015 2016 2017 2018 2019 2020 CAGR1 '10/'20
CAGR1 ‘16/‘17
Total m $ 55,290 62,088 68,703 74,173 78,973 81,870 84,557 86,885 88,843 90,499 91,885 5.2% 2.8%
Mobile phones
m $ 53,412 60,201 66,813 72,278 77,092 80,016 82,689 85,024 86,989 88,651 90,041 5.4% 2.8%
Landline phones
m $ 1,878 1,887 1,890 1,895 1,881 1,854 1,869 1,861 1,854 1,848 1,844 -0.2% -0.4%
unit 2010 2011 2012 2013 2014 2015 2016 2017 2018 2019 2020 CAGR1 '10/'20
CAGR1 ‘16/‘17
Total m units 197 205 211 215 218 218 220 221 222 223 224 1.3% 0.6%
Mobile phones
m units 163 172 179 184 188 189 191 193 195 196 197 1.9% 1.0%
Landline phones
m units 34 33 32 31 30 29 28 28 27 27 27 -2.4% -1.8%
Sales in million units
Europe

Revenues in million $
Market KPI comparison
Statista // August 17 1: CAGR = Compound Annual Growth Rate Source: Statista Consumer Market Outlook 2017
5
Overall revenues and volume sales of phones in the US are declining from 2016 to 2017
unit 2010 2011 2012 2013 2014 2015 2016 2017 2018 2019 2020 CAGR1 '10/'20
CAGR1 ‘16/‘17
Total m $ 55,670 59,735 61,465 65,622 67,544 67,036 67,379 67,068 66,135 64,629 62,642 1.2% -0.5%
Mobile phones
m $ 54,644 58,795 60,608 64,847 66,833 66,390 66,754 66,467 65,552 64,062 62,086 1.3% -0.4%
Landline phones
m $ 1,025 940 857 774 710 645 625 601 583 568 556 -5.9% -3.7%
Sales in million units
unit 2010 2011 2012 2013 2014 2015 2016 2017 2018 2019 2020 CAGR1 '10/'20
CAGR1 ‘16/‘17
Total m units 187 179 179 178 177 169 165 161 156 150 144 -2.6% -2.6%
Mobile phones
m units 167 161 161 162 162 155 152 148 143 138 132 -2.3% -2.6%
Landline phones
m units 20 19 17 16 15 14 13 13 13 12 12 -4.7% -2.8%
U.S.

Share of households with landline phones by age and region
Landline and mobile phone penetration
Statista // July 17 “Which of the following devices do you have in your household?“;multiple response; n=1.013, all persons surveyed Source: Statista Survey Telecommunications 2017, UK N=1.021, U.S. N=1.027, Germany N=1.013
6
Landline phones are more common among older target groups, mobile phones among younger groups
77%
61%55%
90%87%
95%97%
79%
Germany U.S. UK
61%
18 to 29 years 60 years and older 30 to 59 years
99%98%100%
89%91%94%
75%75%77%
Germany U.S. UK
Share of households with smartphones by age and region
30 to 59 years 60 years and older 18 to 29 years

Mobile Phone sales in Europe and North America Development of the mobile phone market
In 1994, IBM brought the first smartphone to market, but only 13 years later – on January 9, 2007 – did Apple propel a new era of telecommunications by launching the iPhone. In the past years, smartphones have become synonymous with mobile Internet and have triggered a wave of innovations that has reached software firms, computer manufacturers, raw material suppliers and above all social media, and continues to drive them until today.
Between 2010 and 2016, revenues from mobile phones increased by 41%. In 2016, a turnover of 158 billion US Dollars was generated with mobile phones. In the same period, volume sales of mobile phones in Europe and North America only increased by 4% to 357 million units – more expensive smartphones are substituting the previous feature phones.
While 2016 saw mobile phone volume sales of 357 million units, in 2017 the number decreased to 355 million units, suggesting that the limits of growth have been reached. A high number of consumers in Europe and the US own advanced smartphones while the number of competitors on the market has risen remarkably.
Market overview Mobile Phones
Statista // July 17 Source: Statista Consumer Market Outlook 2017 7
Revenues from mobile phones in Europe and North America increased sharply until 2014
40$
100$
0$
m units
150
350
300
250
200
20$
100
50
0
80$
140$
180$
120$
160$
60$
2020
162bn $
344 349
2018
353 355 352 344
158bn $
113bn $
342 357 358
2016 2014
363 358
2012 2010
Revenue in bn US $ Volume sales in m

Volume sales and revenues per capita in 2016
Per capita sales of mobile phones, by country
Statista // July 17 8
Switzerland and Norway have the highest annual revenues per capita from mobile phones
385$
0.3
150$
0.0
0.4
0.2
0$
350$
250$
0.5
400$
100$
200$
50$
300$
0.6
0.1
No
rwa
y
Sw
itze
rla
nd
0.53
166$
0.46
178$
0.41 0.43
Ita
ly
185$
205$
Fra
nce
192$
203$
0.52 0.47
Gre
at
Bri
tain
Ca
na
da
0.38
Ne
the
rla
nd
s
U.S
.
244$
376$
0.57
Po
lan
d
Est
on
ia
Lit
hu
an
ia
Ru
ma
nia
100$
102$
0.29 0.26
104$
0.25 0.27
Sp
ain
104$
152$
0.33
Sw
ed
en
151$
0.36 P
ort
ug
al
151$
0.36
Au
stri
a
140$
0.33
Ge
rma
ny
114$
0.35
Gre
ece
0.34
Cze
ch R
ep
ub
lic
106$
165$
0.28 0.22
Fin
lan
d
164$
0.39
De
nm
ark
159$
0.35
Ire
lan
d
156$
0.30
Be
lgiu
m
Bu
lga
ria
90$
0.27 0.27
Hu
ng
ary
La
tvia
93$
0.26 0.22
88$
0.23
Cro
ati
a
98$
Slo
va
kia
76$
83$
0.23
Slo
ve
nia
Volume sales per capita Revenues per capita in US $
Source: Statista Consumer Market Outlook 2017

Reasons to buy a new smartphone, by region
Purchase drivers smartphones
Statista // July 17 „In general terms, for what reasons can you imagine buying a new smart phone? “; multiple response; n=1.013, all respondents Source: Statista Survey Telekommunikation 2017, UK N=1.021, U.S. N=1.027, Germany N=1.013
9
To substitute a broken smartphone is the most important reason for buying a new device
26%
33%31%31%
36%
60%
34%
43%36%
69%
18%
28%31%
29%
34%
59%
Need a bigger memory
17%
New model is launched
24%
Cheap offer for a more modern phone
Mobile phone is lost/stolen
Deteriorating battery performance
Smartphone/mobile phone is broken
UK Germany U.S.

Agreement Top 2 („totally agree“, „rather agree“)
0% 10% 20% 30% 40% 50% 60% 70% 80% 90% 100%
There is a trend back towards conventional mobile phones without Internet access
I cannot imagine a life without smartphones
Smartphones destroy face-to-face communication
Smartphones are too expensive
Mobile data for smartphones should be cheaper
71%
56%
43%
14%
87%
80%
55%
61%
25%
81%
18%
59%
54%
81%
79%
Opinions on smartphones
Statista // July 17 10
61% of US Americans cannot imagine a life without smartphones
Germany UK USA
„Please state to what extent you agree with the following statements“, matrix question; Survey DE n=1013, all respondents; Survey UK n=1021, all respondents; Survey US n= 1027, all respondents Source: Statista Survey Telecommunications 2017, UK N=1.021, U.S. N=1.027, Germany N=1.013

Brand use smartphones
Statista // July 17 „Which brand is your smartphone?“; single response; n=1.013, all respondents Source: Statista Survey Telecommunications 2017
11
Share of smartphone brands owned by region, 2017
In Germany, the UK and the US, Samsung and Apple have a market share of 60% of phone ownership
20%
Apple
7%
4% 3%
LG
Sony
2%
other
Windows
HTC
Huawei
43%
6%
15%
Samsung
Windows
19%
other
5%
LG
2%
2% 3%
Huawei
Apple
2%
Samsung
38% Sony
30%
HTC
UK U.S. Germany
Samsung
13% LG
2% HTC
Sony 16%
Huawei
1% 34%
Apple
33%
1%
other
1%
Windows
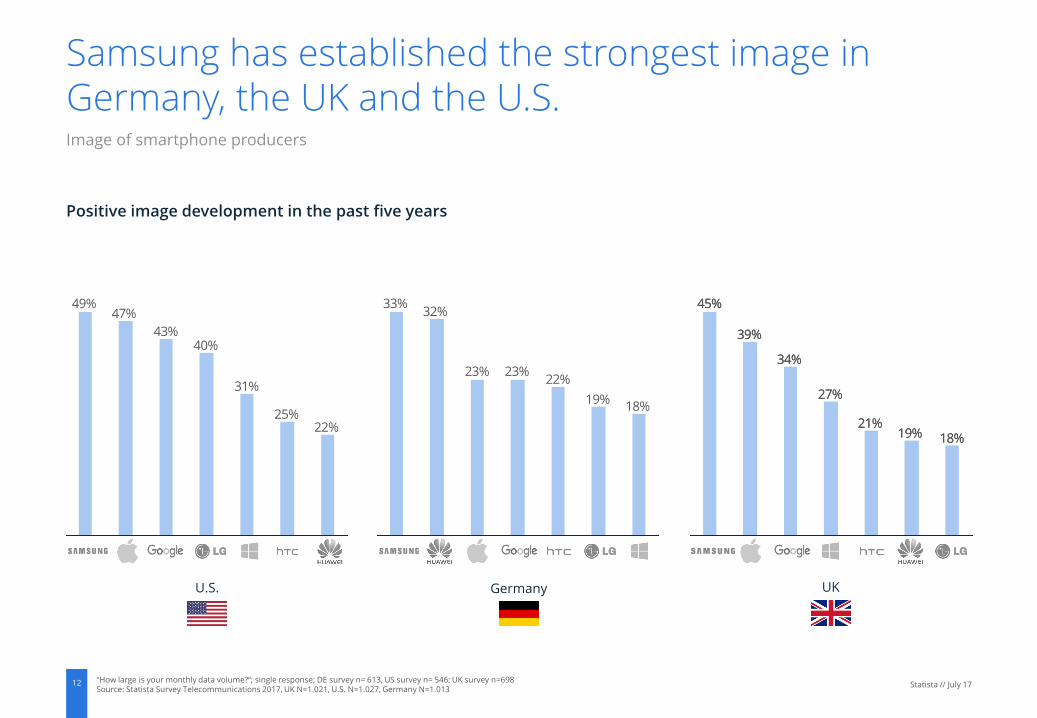
Image of smartphone producers
Statista // July 17 “How large is your monthly data volume?“; single response; DE survey n= 613, US survey n= 546; UK survey n=698 Source: Statista Survey Telecommunications 2017, UK N=1.021, U.S. N=1.027, Germany N=1.013
12
Positive image development in the past five years
Samsung has established the strongest image in Germany, the UK and the U.S.
22%25%
31%
40%43%
47%49%
19%
22%23%23%
32%33%
18%
U.S. Germany
18%19%21%
27%
34%
39%
45%
UK
18%19%21%
27%
34%
39%
45%

Share of smartphone users with the respective data volume per month
Mobile data use
Statista // July 17 “How large is your monthly data volume?“;single response; DE survey n= 613, US survey n= 546; UK surves n=698 Source: Statista Survey Telecommunications 2017, UK N=1.021, U.S. N=1.027, Germany N=1.013
13
Over a quarter of smartphone users in the UK and the US have data volumes of more than 3 GB/month
7%7%6%
18%17%
9%
17%
21%
8%
15%
23%
12%
26%
13%
27%
>3000MB <500MB <300MB <3000MB <1000MB
U.S. Germany UK

Trends and innovations in the smartphone industry
Digital ecosystems and virtual reality
Growth has reached its limits in the mobile phone market. Companies like Apple, Amazon and Google have to develop new strategies to generate revenues. Digital ecosystems are a driving force for new growth – a value-added chain that binds customers in the long run.
The ecosystems are open and diverse – from fitness bracelets, watches and glasses through to skin patches and intelligent clothing. Similar to the development of feature phones to smartphones, wearables advance from goal-oriented devices to platforms. In 2016, the wearables market in Europe increased by 45%, with sales of 13 million units.1
Virtual Reality (VR) could become the key application. Along with Facebook’s Oculus VR, Google is also investing heavily in VR. In 2016, Android’s version “Nougat”, which includes a VR mode, was introduced together with the VR platform Daydream.2 Aside from Virtual Reality, Google is also focusing on Augmented Reality (AR). The AR technology “Tango”3 was integrated into a smartphone for the first time. Tango makes it possible to draw a 3D-map of your surroundings relative to your current positon without using GPS.
VR and AR offer possibilities to develop ecosystems further and fuel market growth.
Statista // August 17 1: GfK, Quantitative online survey among more than 4,900 Internet users 15 years and older in 16 countries currently recording their health or fitness data, 2016 2: https://www.android.com/intl/de_de/versions/nougat-7-0/; https://vr.google.com/intl/de_de/daydream/smartphonevr/ 3: https://get.google.com/tango/
14
Integrated ecosystems and virtual reality are key technologies for market success

Development of the landline phones market
The advancements in the mobile phone industry have put high pressure on the market for Landline phones. Signs for a stabilization in Europe and North America have only become apparent since 2016.
Modern Landline phones are usually wireless and use the DECT standard (Digital Enhanced Cordless Telecommunications). The devices are characterized by long battery lives and a variety of convenience functions like calendars, e-mail access and voice transmission in HD quality. For consumers, Landline phones nowadays stand for comfortable phone calls from home. (see page 17)
Between 2010 and 2016, revenues from Landline phones in Europe and North America fell by 16% to 2.64 billion US Dollars. Sales amounted to 43 million units in 2016, representing a minus of 24% compared to 2010.
Market overview Landline Phones
Sales of Landline Phones in Europe and North America
Statista // July 17 Source: Statista Consumer Market Outlook 2017 15
Revenues and volume sales of Landline phones fell between 2010 and 2016
2.5$ 45
m units
30
15
0
3.5$
1.5$
1.0$
2.0$
0.5$
3.0$
2020
2.5$
41 44
2014
47 50
2012
52 55
2010
3.1$
57
2.6$
2016
42 42
2018
41 43
Volume sales in m Revenues in bn US $

Volume sales and revenues from Landline phones
Per capita sales of landline phones, by country
Statista // August 17 Source: Statista Consumer Market Outlook 2017 16
Italy and Switzerland have the highest sales per capita of Landline phones
0.03
0$
0.07
0.06
0.05
0.04
5$
0.02
0.01
0.00
6$
4$
3$
2$
1$
Ca
na
da
3.5 $
0.06
Lit
hu
an
ia
3.5 $
0.06
Fra
nce
0.06
5.9 $
0.07
Ita
ly
5.1 $
0.06
Sw
itze
rla
nd
4.7 $
0.07
Sw
ed
en
4.2 $
0.06
Ne
the
rla
nd
s
4.1 $
0.05
Au
stri
a
0.06
De
nm
ark
3.1 $
0.05
Fin
lan
d
3.1 $
0.04
Ire
lan
d
3.1 $
0.05 S
lova
kia
3.1 $
0.04
Be
lgiu
m
2.9 $
3.4 $
Ge
rma
ny
3.8 $
0.06
Sp
ain
3.5 $
0.05
UK
3.5 $
0.05
Po
lan
d
0.04
1.5 $
La
tvia
0.03
1.7 $
Ro
ma
nia
0.04
1.8 $
Hu
ng
ary
0.03
1.9 $
Cro
ati
a
0.06
1.9 $
US
A
0.04
1.9 $
Cze
ch R
ep
ub
lic
0.04
2.0 $
No
rwa
y
0.02
2.1 $
Est
on
ia
0.05
2.1 $
Slo
ve
nia
0.05
2.2 $
Bu
lga
ria
0.06
2.4 $
Po
rtu
ga
l
0.04
2.5 $
Gre
ece
0.05
2.6 $
Revenues per capita in US $ Volume Sales per capita

Purchase drivers: Reasons for/against owning a Landline phone (in addition to a mobile phone)
Purchase drivers and barriers for Landline phones
Statista // August 17 "For you, what reasons would speak in favor of having a landline phone besides a cellphone?”, multiple response; DE n=893; US n=647; UK n=844 "Why don’t you have a landline phone?”, Mehrfachnennung; DE n=120; US n=380; UK n=177 Source: Statista Survey Telecommunications 2017, UK n=1.021, U.S. n=1.027, DE n=1.013
17
44% of Germans have a Landline in addition to their mobile phone to make more comfortable calls
34%
35%
37%
27%
42%
40%
27%
44%
49%
48%
48%
17%
14%
27%
39%
33%
43%
Weak battery power of mobile phone 21%
More comfortable to the ear
More comfortable phone calls
To call people without mobile phones
It is simply a must/standard
Cheaper prices for calls
UK U.S. Germany
3%
7%
12%
20%
81%
6%
6%
13%
80%
12%
6%
6%
10%
13%
22%
83%
No fixed-line connection at home
Did not manage to get one
8% Phone is
too expensive
Monthly charges too expensive
Don’t want a fixed-line phone
Use the mobile phone for all calls
Drivers Barriers
20%

Alcoholic Drinks
Clothes
Non-Alcoholic Drinks
Footwear
Hot Drinks Eyewear
Tobacco Products
Accessories
Food Toys and Games
Cosmetics and Personal Care
Consumer Electronics
Home and Laundry Care
Household Appliances
Tissue and Hygiene Paper
Furniture
OTC Pharmaceuticals
Passenger Cars
17 consumer markets with 155 product segments
The CMO presents the key performance indicators sales, revenues and prices – of the most important consumer markets worldwide. Our specialized analysts’ comparable market calculations are based on data from validated sources.
Revenues, sales, prices and forecasts
More than 150 product categories in up to 40 countries
Covering the period 2010 to 2021
Product overview CMO
Statista // August 17 Source: Statista Consumer Market Outlook 2017 18
Consumer Market Outlook (CMO)
More information

W W W . S T A T I S T A . C O M
Imprint Statista ▪ Johannes-Brahms-Platz 1 ▪ 20355 Hamburg ▪ +49 40 413 49 89 0 ▪ www.statista.com Disclaimer This study is based on survey and research data from the previously mentioned sources. The forecasts and market analysis presented were researched and prepared by Statista with great care. For the presented survey data, estimations, and forecasts Statista cannot assume any warranty of any kind. Surveys and forecasts contain information not naturally representing a reliable basis for decisions in individual cases and may be in need of further interpretation. Therefore, Statista is not liable for any damage arising from the use of statistics and data provided in this report.
MADELEINE BRINCKMANN Analyst
Johannes-Brahms-Platz 1
20355 Hamburg
19
+49 40 284 841 864