Embed Size (px)
Citation preview

http://www.jstor.org
Consumer Discrimination and Self-EmploymentAuthor(s): George J. Borjas and Stephen G. BronarsSource: The Journal of Political Economy, Vol. 97, No. 3, (Jun., 1989), pp. 581-605Published by: The University of Chicago PressStable URL: http://www.jstor.org/stable/1830456Accessed: 14/08/2008 20:49
Your use of the JSTOR archive indicates your acceptance of JSTOR's Terms and Conditions of Use, available at
http://www.jstor.org/page/info/about/policies/terms.jsp. JSTOR's Terms and Conditions of Use provides, in part, that unless
you have obtained prior permission, you may not download an entire issue of a journal or multiple copies of articles, and you
may use content in the JSTOR archive only for your personal, non-commercial use.
Please contact the publisher regarding any further use of this work. Publisher contact information may be obtained at
http://www.jstor.org/action/showPublisher?publisherCode=ucpress.
Each copy of any part of a JSTOR transmission must contain the same copyright notice that appears on the screen or printed
page of such transmission.
JSTOR is a not-for-profit organization founded in 1995 to build trusted digital archives for scholarship. We work with the
scholarly community to preserve their work and the materials they rely upon, and to build a common research platform that
promotes the discovery and use of these resources. For more information about JSTOR, please contact [email protected].

Consumer Discrimination and Self-Employment
George J. Borjas and Stephen G. Bronars University of California, Santa Barbara
Self-employment rates and incomes differ significantly by race. We show that these differentials arise in markets with consumer dis- crimination and incomplete information about the price of the good and the race of the seller. Equilibrium income distributions have two properties: mean black incomes are lower than mean white incomes, and the returns to ability are lower for black than for white sellers. Able blacks, therefore, are less likely to self-select into the self- employment sector than able whites. Using the 1980 census data, we find that observed racial differences in the self-employment income distributions are consistent with the theoretical predictions.
I. Introduction
After a long period of neglect, economists have recently begun to systematically analyze the role that self-employment plays in the labor market. This developing literature has already established a few in- teresting empirical regularities regarding the determinants of self- employment rates and the compensation of self-employed persons. For example, Blau (1987) finds that changes in tax laws and technol- ogy account for a large fraction of the observed increase in self- employment rates over the last two decades; Lazear and Moore (1984) document that the age/earnings profiles of self-employed persons are
We are grateful to Stephen Trejo, to seminar participants at the Labor Summer Institute of the National Bureau of Economic Research and the University of Chicago, and to a referee for helpful comments. The research was supported by a grant from the Economic Development Administration, U.S. Department of Commerce, and by a grant from the National Science Foundation (grant SES-8604973).
Journal of Political Economy, 1989, vol. 97, no. 31 ) 1989 by The University of Chicago. All rights reserved. 0022-3808/89/9703-0008$01.50
581

582 JOURNAL OF POLITICAL ECONOMY
substantially flatter than the age/earnings profiles of salaried workers; and Evans and Leighton (1987) show that the transition rates into and out of self-employment are independent of age and labor market experience.
It is also well known (Moore 1983; Borjas 1986) that sizable differ- ences exist in the characteristics of the self-employment sector across ethnic/racial groups. In particular, whites have larger self-employ- ment rates and incomes than blacks or Hispanics. This fact is hard to interpret in the traditional framework of an employer discrimination model since self-employed persons have no reason to discriminate against themselves.' This paper presents a theoretical and empirical analysis of the differences in both self-employment rates and incomes across racial groups. Our maintained hypothesis is that these differ- ences are generated by consumer discrimination, whereby white con- sumers dislike purchasing goods and services from blacks and other minorities (Becker 1971).
The simplest consumer discrimination model assumes perfect in- formation (i.e., consumers costlessly know the price of the good and the race of the sellers) and generates an equilibrium of complete segregation (Cain 1986). Racial differences in self-employment rates and incomes in this model can be created only by differences across black and white consumers and/or sellers. In particular, black and white consumers have to differ in their preferences for goods or incomes, or there must be racial variation in endowments (of skills or wealth) of sellers. The theoretical analysis, therefore, then depends on a number of extraneous assumptions about heterogeneity between the black and white populations.2
A more powerful analysis results if consumers can obtain infor- mation about the price of the good and the race of' the seller only at a cost. The existence of imperfect information yields two impor- tant implications about the population income distributions of self- employed blacks and whites. First, the mean income level of blacks will be smaller than that of whites because of consumer discrimina- tion. Second, the relative gains of entering the self-employment sector are reduced for able blacks. Intuitively, high-ability self-employed blacks are more likely to expand the scale of their firm and cater to the larger white market. This expansion, however, requires that high-
' In fact, if employers are the only source of racial discrimination in the marketplace, one would expect that self-employment rates for minorities would be higher since these groups would find it less profitable to be in salaried Jobs.
2 For example, if we assume that white and black consumers are "perfect substitutes" in the marketplace (i.e., they have equal incomes and identical preferences), the black self-employment sector would be a mirror image of the white self-employment sector, though on a smaller scale.

CONSUMER DISCRIMINATION 583
ability blacks lower their prices in order to "compensate" white con- sumers for their disutility. Our empirical analysis uses the 1980 U.S. census and shows that indeed blacks and other minorities are nega- tively selected into self-employment but that whites are not.3
Section II presents a search model with consumer discrimination that generates equilibrium price and income distributions for white and black sellers. This model implies that skill wage differentials in the self-employed sector will be narrower for blacks than for whites. The empirical implications of the theory are tested in Section 1II. Our analysis documents a fundamental difference between whites and other racial groups in the self-selection mechanism that generates the pool of self-employed workers. Finally, Section IV summarizes the results of the study.
II. Theory
A. Consumer Behavior
Suppose that there are two types of sellers, black (b) and white (w), producing a homogeneous good. The fraction of black sellers in the population is 0, where 0 is assumed to be less than one-half through- out the analysis. There are also black and white buyers, and, for simplicity, we assume that the fraction of black buyers in the popula- tion is also given by H Finally, we assume that all consumers max- imize utility, are risk neutral, have a zero discount rate, and have an infinite time horizon.
In order to focus on the essential aspects of consumer discrimina- tion, we assume that white consumers have a taste for discrimination against black sellers but that black buyers are indifferent about the race of the seller.5 This implies that if black sellers charge price P, a white buyer will perceive the price as being P1(I - d), where d is the discrimination coefficient. Define R to be the consumer's valuation of the good. The maximum price white consumers are willing to pay for a unit of the good purchased from a black seller is R(1 - d). White consumers who purchase from white sellers and black consumers who
Blau (1985) examines the choice between self-employment and salaried jobs in a self-selection model in which individuals differ in their managerial ability. IHis model, however, does not generate predictions about the types of selection that are expected to arise.
4 The assumption that the percentage black among consumers equals the percentage black among sellers is not necessary for the theoretical analysis. It only simplifies the notation and the presentation.
5 The model can be generalized by allowing black buyers to discriminate against white sellers. This extension complicates the presentation of the analysis without funda- mentally changing the nature of the results. This generalization will be discussed in more detail below.
584 JOURNAL OF POLITICAL ECONOMY
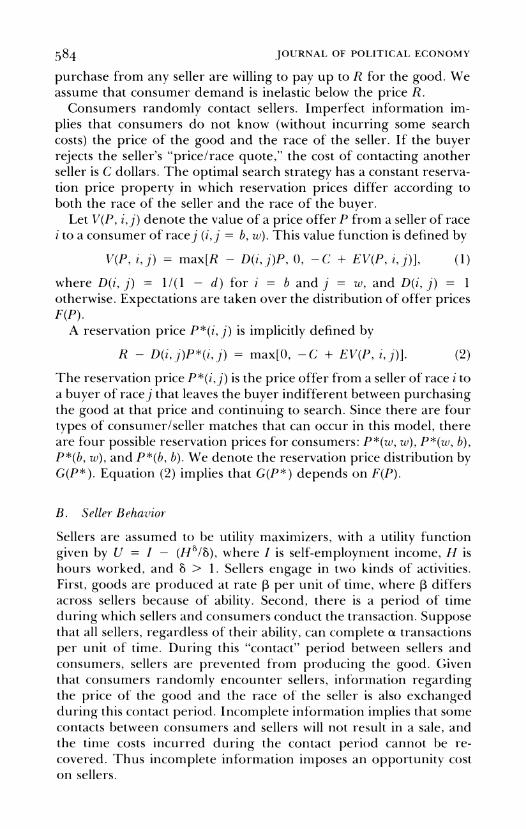
purchase from any seller are willing to pay up to R for the good. We assume that consumer demand is inelastic below the price R.
Consumers randomly contact sellers. Imperfect information im- plies that consumers do not know (without incurring some search costs) the price of the good and the race of the seller. If the buyer rejects the seller's "price/race quote," the cost of contacting another seller is C dollars. The optimal search strategy has a constant reserva- tion price property in which reservation prices differ according to both the race of the seller and the race of the buyer.
Let V(P, i,j) denote the value of a price offer P from a seller of race i to a consumer of race (i,j - b, w). This value function is defined by
V(P, i, j) = max[R -D(i, j)P, O, -C + EV(P, i,j)], (1)
where D(i, j) = 1/(1 - d) for i = b and j = w, and D(i, j) = 1 otherwise. Expectations are taken over the distribution of offer prices F(P).
A reservation price P*(i, J) is implicitly defined by
R - D(i, j)P*(i, j) = max[O, -C + EV(P, i, )] (2)
The reservation price P*(i,j) is the price offer from a seller of race i to a buyer of race that leaves the buyer indifferent between purchasing the good at that price and continuing to search. Since there are four types of consumer/seller matches that can occur in this model, there are four possible reservation prices for consumers: P*(w, w), P*(zw, b), P*(b, w), and P*(b, b). We denote the reservation price distribution by G(P*). Equation (2) implies that G(P*) depends on F(P).
B. Seller Behavior
Sellers are assumed to be utility maximizers, with a utility function given by U = I - (H818), where I is self-employment income, H is hours worked, and 8 > 1. Sellers engage in two kinds of activities. First, goods are produced at rate P3 per unit of time, where 13 differs across sellers because of ability. Second, there is a period of time during which sellers and consumers conduct the transaction. Suppose that all sellers, regardless of their ability, can complete ax transactions per unit of time. During this "contact" period between sellers and consumers, sellers are prevented from producing the good. Given that consumers randomly encounter sellers, information regarding the price of' the good and the race of' the seller is also exchanged during this contact period. Incomplete information implies that some contacts between consumers and sellers will not result in a sale, and the time costs incurred during the contact period cannot be re- covered. Thus incomplete information imposes an opportunity cost on sellers.

CONSUMER DISCRIMINATION 585
Let T be the fraction of contacts that result in a sale. Sellers offer a price/race quote that leads to one of three possible selling strategies: (a) sell to all consumers (T = 1), (b) sell only to blacks (T = 0), and (c) sell only to whites (T = 1 - 0). Let s be the fraction of the workday spent in production. Efficiency requires that sf3H = otT(l - s)H; hence s = ctT/(cxT + 3) 6
The price charged by the seller, P(T), is a function of the segrega- tion behavior chosen: P(T) must be less than or equal to the reserva- tion prices of all the consumers it chooses to serve. The objective of the seller, therefore, is to choose H and v so as to maximize
U = cxT P(T)H 16 (3)
The maximization of (3) is easier to conduct in two stages. First, consider the seller's optimization over H. For a given price, P(r), the seller's indirect utility function is given by
U* = (+ )t A4 P(T)I P) Y (4)
where E = 8/(8 - 1), and y is the income level associated with utility- maximizing behavior. The second stage of the maximization process involves the choice of segregation behavior by the seller. The indirect utility function in (4) can be evaluated at the three alternative values of T, and a seller chooses the value of T that maximizes utility. The functional form in (3) implies that utility maximization leads to the same segregation behavior as income maximization.7 This is easily verified since U*(T) > U*(T') if and only if y(T) > y(T'), for 7 $ 7'.
As noted earlier, sellers differ in their ability to produce output (as measured by the parameter 3). For simplicity, we assume that there are two types of sellers (within each race group). High-ability sellers are indexed by the productivity parameter Psh, low-ability sellers are indexed by f1 (Ph > rl), and the fraction of high-ability sellers in the population is n. We assume the same ability distribution for both race groups so that any income differentials in the model cannot be attrib- uted to skill differences.
6 Invoking the law of large numbers, we assume that sellers making n contacts with consumers contact exactly On blacks and (1 - O)n whites. Allowing the number of consumers of each race group to be a random variable to the firm does not alter the important results of our model but simply generates variation in income and output across firms of the same race and ability level. In addition, we focus on a "steady-state" equilibrium of the model in which the number of consumers leaving the market in each period just equals the number of new consumers entering the market. For simplicity, we also assume that each consumer who is searching makes exactly one contact in the period.
7 This property follows from the assumption that utility is additively separable in income and leisure (Scitovsky 1943).

586 JOURNAL OF POLITICAL ECONOMY
The four types of sellers in the market generate the offer price distribution F(P) over the prices Puh, Pwb, Pbh, and Pbl, where offer prices are indexed over the race and ability of the seller. Since sellers can charge no more than the minimum reservation price of all the consumers it chooses to serve, F(P) will depend on G(P*), the distribu- tion of reservation prices of consumers.
C. Equilibrium Price and Income Distributions
Because of imperfect information, the offer price distribution is likely to be nondegenerate. We therefore must characterize the properties of the equilibrium price distribution in the market (as in Reinganum [1979] and Carlson and McAfee [1983]) before analyzing income dif- ferentials across sellers. We use a Nash equilibrium concept so that in equilibrium no seller has an incentive to alter his offer price, and no buyer has an incentive to alter his reservation price, taking the actions of other agents as given. We define an equilibrium price distribution as a set of offer prices and segregation strategies for sellers, and reservation prices for consumers, such that given F(P) consumers choose optimal reservation prices P*(i, j) that collectively generate G(P*); and given G(P*), sellers choose utility-maximizing price, out- put, and segregation strategies that collectively generate F(P).
Several important properties of an equilibrium price distribution follow from our assumptions about preferences and technology and the definition of an equilibrium.
i) The price sellers charge is the minimum of the reservation prices of the consumers they choose to serve. Sellers will be unable to sell to all the consumers they wish to serve if they charge a price higher than the minimum reservation price; and, given inelastic demand, sellers have no incentive to reduce the price below the minimum reservation price.
ii) Reservation prices are ordered as follows:
P*(w, w) - P*(w, b) = P*(b, b) > P*(b, w) = (1 - d)P*(w, w). (5)
The (maximum) price whites are willing to pay white sellers, P*(w, w), is at least as great as the price blacks are willing to pay white sellers, P*(w, b): White buyers set higher reservation prices if they contact a white seller because their potential gains from search are reduced by the possibility of encountering a black seller in their next contact. Further, since blacks are indifferent to the seller's race, blacks have a single reservation price, P*(w, b) = P*(b, b). Third, the price blacks are willing to pay a black seller, P*(b, b), is higher than the price whites

CONSUMER DISCRIMINATION 587
are willing to pay a black seller, P*(b, w).8 Finally, our definition of' consumer discrimination implies that P*(b, w) = (1 - d)P*(w, w).
iii) If sellers serve a segregated market, it will be of the same racial group as the seller. Equation (5) indicates that sellers of race i must charge the same or a lower price in order to attract buyers of race j (i # J). Sellers of race i, therefore, have no incentive to cater solely to buyers of race j.
iv) High-ability sellers of any race group segregate only if' low- ability sellers of that race group have also segregated. This result is implied by the production technology since the opportunity costs of' "wasted contacts" (i.e., contacts that do not result in a sale) are greater the more able the seller. This behavior implies that the offer price distribution can be ordered as
Pwi/ ? Puwh ' Ph. ' Pbh/ (6)
This ranking follows from the fact that the lowest price a white seller will ever charge is the black reservation price, and this is the highest price that a black seller can ever charge. Further, since within each race group high-ability sellers are more likely to integrate, they can- not charge a higher price than low-ability sellers if' they want to cater to all consumers.
In order to assess the impact of' consumer discrimination on eco- nomic welfare, it is essential to compare the income distributions of' black and white sellers. Equation (4) shows that income levels will depend on the offer price distribution. It is impossible to derive a single equilibrium price distribution for all ranges of parameter values (a, P3i, 13X, 0, d, and C). Nevertheless, the model allows us to characterize the first two moments of' the equilibrium income distri- butions regardless of the specific price distribution observed in the market. Equation (4) implies that the utility-nmaximizing level of' in- come for a seller of race i and ability level k (k = h, 1) is
Y Fk = _ (T k), (7)
Y O=L Tlk
13Pk I~
(?kI where Tik is the segregation strategy chosen by the seller, and P(Tik) Pik is the price associated with that segregation strategy.
It is easy to show that the mean income of' black sellers is lower than the mean income of white sellers. A white seller of' ability k can always opt to charge the price Pbk and retain at least as many contacts as a black seller of ability k. Moreover, equation (6) shows that even if'
t Note that the ordering in eq. (5) implies that there can be at most three prices in the equilibrium distribution. The fact that black and white sellers may charge the same price implies that price alone is not a perfect signal for the race of the seller.

5883 JOURNAL OF POLITICAL ECONOMY
black sellers are retaining all contacts, white sellers can, in general, charge a higher price and also retain all contacts. Therefore, white sellers can always do better than black sellers.
Consumer discrimination also affects the variances of the popula- tion income distributions. The variance of log incomes for race group
i is given by 'r( 1 - -r)[ln(y,,/y11) , where rr is the fraction of sellers that are high-ability. Note that since the variance of log incomes depends on the ratio of high- to low-ability incomes, higher variances are asso- ciated with higher returns to ability for that race group. Define A =
(Yzh'Ywu) - (Ybhlybl). A necessary and sufficient condition for the vari- ance of the white log income distribution to exceed the variance of the black log income distribution is A > 1. It can be shown that, under certain conditions, consumer discrimination leads to the result A > 1, so that white sellers have a higher return to ability than black sellers.
Define -y1, as the ratio of the high-ability white seller's income to the income he would have received had he chosen the same segregation strategy as a low-ability white seller, and yb as the ratio of the low- ability black seller's income to the income he would have received had he chosen the same segregation strategy as a high-ability black seller.9 By construction, the "selection biases" wyzt and Yby are greater than or equal to one since each seller selected the segregation strategy that maximized indirect utility. Furthermore, -y,, and Yb are strictly greater than unity if low-ability workers choose a segregation strategy differ- ent from that of high-ability workers within each race group. The ratio A can be written as
Yb7u'( ___ _
+ pi Tbh + Ph (8)
0tT1i ? 1pi, 0tTbh ? pi~
The discussion above and inspection of' (8) leads to the following result.
PROPOSITION. The equilibrium income distributions of black and white self-employed workers have the following properties: (i) Mean white income exceeds mean black income. (ii) If low-ability whites retain more contacts than high-ability blacks (-Trl > Tbh), the white income distribution has more variance than the black income distribu- tion. If low-ability whites retain as many contacts as high-ability blacks (Tzl = Tbh), the white income distribution has more variance than the black income distribution if, for at least one race group, there are differences in the segregation behavior of high- and low-ability sellers
' The precise definitions of y,,, and Wy are given by
{ [(OtTchIh)1(cT.,h + 1h)]P(T71,h) | [(CLTbll)/(rTb ? I31)]P(Tbl) 1
[(OtTct,/p)j/(ctTe, + fh)]P(Tt,,) | [(rtTbhl)/(rtbh + f)]P(Thh) J

CONSUMER DISCRIMINATION 589
(i.e., either Yb or y, exceeds unity). (iii) If low-ability whites retain fewer contacts than high-ability blacks (Xr/, < Tbh), A is bounded from below by
A > -Yb'wY(1 - I ), (9)
where YbYW ' 1 with a strict inequality if, for at least one race group, there are differences in the segregation behavior of high- and low- ability sellers.
These results are quite intuitive. Suppose, for instance, that both low-ability whites and high-ability blacks integrate. Consumer dis- crimination reduces the relative incomes of high-ability blacks be- cause they must charge a lower price in order to retain white custom- ers. If high-ability blacks segregate, they must discard more contacts than white sellers regardless of the segregation strategy of whites. The opportunity cost of segregation is clearly highest for high-ability blacks, and hence the black income distribution is compressed relative to the white income distribution.
Suppose, on the other hand, that r,, < Tbh. This implies that high- ability blacks integrate but low-ability whites segregate. High-ability blacks must lower prices in order to retain white consumers. Low- ability whites could have integrated (and charged a higher price than high-ability blacks) but chose not to because their incomes are raised by segregating. In effect, this reduces white income inequality, and thus the impact of consumer discrimination on the ratio of variances can- not be determined. The lower bound in equation (9), however, im- plies that as long as blacks are a small minority, it is unlikely that the black income distribution has less variance than the white income distribution.
Our result that the returns to ability are lower for black sellers than for white sellers has important implications for the sorting of individ- uals between self-employment and other sectors of the labor mar- ket.10 In particular, able blacks have less incentive to be self-employed than able whites. Consumer discrimination and incomplete informa- tion, therefore, have an impact not only on the relative size of the black self-employment sector but also on the composition of sellers in
10 Although the proposition has been derived under the assumption that contacts are random and that each seller's probability of encountering a consumer of race equals the population proportion of consumers of race, we can generalize our results to allow for racial "ghettos." The existence of racial ghettos implies that although contacts between buyers and sellers are random, sellers encounter a larger fraction of consum- ers of their same race than the overall population proportions. It is easv to show that the proposition still holds given the alternative values of T that result from racial ghettos, although ghettoizationn" does increase the incentives for both whites and blacks to segregate.

590 JOURNAL OF POLITICAL ECONOMY
that sector.'1 Moreover, this prediction of the impact of consumer discrimination does not follow from a simpler complete information model.
Zero search costs imply that buyers and sellers are sorted perfectly by race and that a single price will prevail in the market. Since con- sumers can costlessly identify the price of the good and the race of the seller in all firms, there are no "wasted contacts." Equation (7) implies that the income of a seller of race i and ability k is given by
Yik (t~k P
(1 0) ((t + Pk) 10
where P is the market price. With equation (10), it is easy to verify that the ratio of standard deviations of white to black incomes is unity. Consumer discrimination in a complete information model, there- fore, does not lead to racial differences in the returns to ability.'2
D. Employer Discrimination
Our analysis of consumer discrimination in the self-employment sec- tor shows that the population income distribution for blacks will be more compressed than the population income distribution for whites. These population income distributions are the ones that would be observed if every person in the labor market became self-employed. The choice of self-employment, however, is endogenous and is based on a comparison of income opportunities in the self-employed and salaried sectors. The actual composition of persons in the self- employed pool, therefore, will also depend on the characteristics of the salaried income distribution. Hence it is necessary to determine whether employer discrimination in salaried jobs leads to the same
" Throughout this section we have used a very simple form of consumer discrimina- tion by ignoring the possibility that black consumers prefer to purchase from black sellers. It can be shown that the key result that the black income distribution (under certain conditions) is more compressed than the white income distribution holds even in the general case in which both types of consumers have a taste for discrimination. The ranking of black and white mean incomes, however, depends on the relative strengths of discrimination by the two types of consumers and on the percentage black in the marketplace.
12 The discussion implicitly assumes that white and black buyers are "perfect substi- tutes" in terms of their demands for the good. Suppose instead that black buyers have less income and therefore a lower demand for the good. High-ability black sellers may not be able to attain their optimal level of output by catering to only blacks and will have to lower their price to P(1 - d) in order to attract white buyers. Competition among black sellers reduces the price in all black firms to P(I - d). This leads to lower black self-employment incomes, but it is easy to show that the ratio of standard deviations of white and black incomes is still unity.

CONSUMER DISCRIMINATION 591
types of income compression as consumer discrimination in self- employed jobs.' 3
Suppose that within each race group there are two types of work- ers, high- and low-ability, with wage rates r4, and ri, (i = b, w), and that labor can be measured in efficiency units, 13, such that Ph > I,. 1
Competition in the labor market requires that for each racial group the price of an efficiency unit of labor (r/J3) be the same for all skill groups. This implies that rdh/rl = NAf (i b, w). It follows im- mediately that the black/white wage ratio is independent of' skill level. Labor market competition, therefore, ensures that employer discrimi- nation does not lead to any compression or widening of skill differen- tials within each race group. 15
It has been argued that affirmative action raises the demand for black skilled workers relative to other blacks (Leonard 1984). There is, however, little economic reason for this to occur. Suppose, for example, that a law mandates that 0 percent blacks be hired at the same wage as whites. A profit-maximizing firm will meet this require- ment by hiring the cheapest possible black labor available, namely low-skilled black workers. This result follows from the fact that affirmative action programs are specified in terms of' the relative number of blacks hired, and not in terms of efficiency units. Hence the simplest model of employer discrimination suggests that, if any- thing, there may be an increase in the relative demand of unskilled black workers.
In summary, consumer discrimination reduces the returns to ability for blacks (relative to whites) in the self-employment sector. Employer discrimination (in the absence of affirmative action) does not change the relative returns to ability for blacks in the salaried sector. These theoretical implications, therefore, suggest that the skill composition of self-employed and salaried workers will differ by race. In particu- lar, skilled blacks have more incentives to enter the salaried sector than skilled whites, and unskilled blacks have more incentives to enter self-employment than unskilled whites. Therefore, blacks are more likely than whites to be negatively selected into self-employment and positively selected into salaried jobs.
13 See Goldberg (1982) for a modern treatment of the Becker model of employer discrimination.
14 By efficiency units we mean that one unit of' high-ability labor is a perfect substitute for fhm/ units of low-ability labor.
5 An extension of' Reinganum's (1979) search model to the case of' employer dis- crimination under incomplete information reveals that, tinder some conditions, wage skill differentials remain independent of race. The returns to ability f'or blacks, how- ever, may be reduced in more general formulations of the model that allow for differ- ential search costs by ability level.
592 JOURNAL OF POLITICAL ECONOMY
III. Empirical Analysis
A. Framework
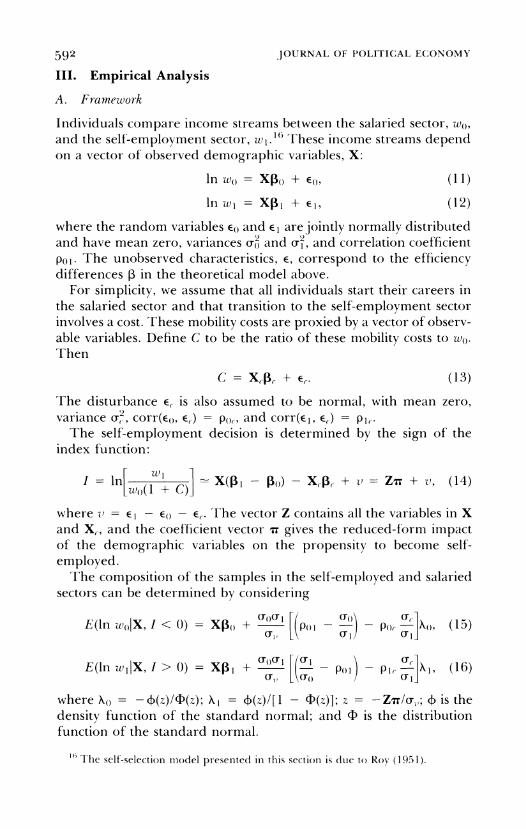
Individuals compare income streams between the salaried sector, w0, and the self-employment sector, w . "3 These income streams depend on a vector of observed demographic variables, X:
in w() Xp() + E0, (11)
InwA = XPI + El, (12)
where the random variables E0 and A are jointly normally distributed and have mean zero, variances (2 and &2, and correlation coefficient pol. The unobserved characteristics, E, correspond to the efficiency differences f3 in the theoretical model above.
For simplicity, we assume that all individuals start their careers in the salaried sector and that transition to the self-employment sector involves a cost. These mobility costs are proxied by a vector of observ- able variables. Define C to be the ratio of these mobility costs to W(). Then
C = Xci + E,. (13)
The disturbance E,. is also assumed to be normal, with mean zero, variance u2, corr(E0, E.) p(),, and corr(E1, Ec) = PI,.
The self-employment decision is determined by the sign of the index function:
I m In I( X(|1 1 - )) X6,P(. + v ZZr + v, (14) [w(1( + C)j
where v = ELI - E0 - Ec. The vector Z contains all the variables in X and XC, and the coefficient vector rr gives the reduced-form impact of the demographic variables on the propensity to become self- employed.
The composition of the samples in the self-employed and salaried sectors can be determined by considering
E(ln w0,X, I < 0) =X,1 + PTo-
- Xo, (15) Xpo + ~~ o I
PocI
E(ln wIjX, I > 0) = Xi + ? I I PoI - PI 1 6)
where ,() = -(z)/(P(z); XA = 4(z)/[I - 4)(z)]; z = -Zrr/o1,,; 4 is the density function of the standard normal; and PD is the distribution function of the standard normal.
Sk The self-selection model presented in this section is due to Roy (1951).

CONSUMER DISCRIMINATION 593
The implications of the model are best understood in the special case in which po, = pi, = 0. As long as PoI is positive (i.e., able persons do well in both self-employed and salaried jobs), positive selection into self-employment occurs if 0l/0() > pol, and negative selection occurs otherwise. Therefore, when the income distribution is compressed in the self-employment sector relative to the salaried sector, it is likely that the most able persons stay in the salaried sector and that low- ability persons (in terms of E) become self-employed.
In the more general case in which the costs of entering the self- employment sector and earnings are correlated, the coefficients of the selection variable in (15) and (16) also depend on the correlation co- efficients po, and P 1 and on the variance i. Though little is known about these parameters, negative selection into self-employment is still more likely among blacks than among whites as long as the black income distribution in the self-employment sector has less variance than the white income distribution.
B. Data
The empirical analysis uses individual data from the 1/ 1(00 B sample of the 1980 U.S. Census of Population. In order to focus on self- employment in the nonagricultural sector, our data consist of obser- vations of white, black, Asian, and Hispanic men (aged 25-64), resid- ing in metropolitan areas, who are not employed in the agricultural industry. The data include all observations in the 1/100 random sam- ple for individuals who are minority and self-employed, and random samples for other groups.'7 We use the census definition of a self- employed person as one whose main job is in that sector. There are other ways of defining self-employment, and our use of alternative definitions of self-employment did not lead to different results. Fi- nally, the income measure used throughout the study is the logarithm of weekly income in 1979.18
17 Our sample consists of 3.3 percent of white salaried workers; 33 percent of white self-employed workers and black and Hispanic salaried workers; all Asian salaried workers; and all black, Hispanic, and Asian self-employed workers in the 198() censtus data. Because of the stratified sampling technique, the probit regressions reported below are weighted (and their standard errors corrected) to reflect the sample composi- tion. Finally, in order to match the individual data with SMSA-specific characteristics, we restrict the sample to persons residing in the 75 largest standard metropolitan statistical areas. The source of these SMSA-specific and local labor market variables is the U.S. Bureau of the Census (1986).
18 A small number of self-employed workers reported negative earnings in 1979. Rather than deleting these observations, we experimented with a number of alternative specifications of the (ln) earnings functions. Generally, the results were insensitive to the alternative specifications. In the results reported below, we set the logarithm of weekly incomes for these individuals equal to the minimum self-employment income reported by workers with positive incomes.

594 JOURNAL OF POLITICAL ECONOMY
TABLE 1
SUMMARY STATISTICS
ln(WEEKLY EARNINGS)
SELF-EMPLOYMENT Self-Employment Salaried GROUP PROBABILITY Sector Sector
Whites .1 18 5.842 5.849 Blacks .045 5.371 5.466 Hispanics .070 5.558 5.465 Asians .119 5.792 5.646
Table 1 presents summary statistics for these data and shows that self-employment rates differ substantially across racial and ethnic groups. White males are nearly three times as likely as black males to be self-employed. Hispanic men are also much less likely to be self- employed than whites, while Asians have self-employment rates that are nearly identical to whites. Mean self-employment incomes, like salaried incomes, display considerable variation across groups. For instance, blacks earn about 38 percent less than whites in the salaried sector and about 47 percent less than whites in the self-employment sector. Hispanics earn about 38 percent less than whites in the sala- ried sector and about 28 percent less in the self-employment sector. Thus, among blacks and Hispanics, the income gap between minori- ties and whites in self-employment incomes is nearly as large as (if not larger than) the gap in the salaried sector.
Table 2 presents the means of' some demographic variables for self- employed and salaried workers. Self-employed persons are signifi- cantly more likely to be college-educated than salaried persons. For instance, 38 percent of' self-employed whites are college-educated, but only 29 percent of salaried whites are. Even among blacks, 19 percent of self-employed persons are college-educated, while only 12 percent of salaried blacks are. Table 2 also indicates a large age differential between workers in the two sectors: Self'-employed workers are about 3-5 years older than salaried workers. Finally, self-employed workers are more likely to be married with a spouse present in the household than salaried workers. Among whites, for example, 82 percent of self- employed persons are married, spouse present, but only 76 percent of salaried persons are. Among blacks, the respective statistics are 68 and 61 percent.
C. Results
Table 3 presents the probit regressions on the determinants of the self-employment probability for each of the groups. These regres-

_C "I - < t<'
u:~~~' C4 t. ' -
- rr r- r~ ro c~i C
bm~~~~~~I t- O?CsCA't C(,
v:~~ ~~~ . . ...
cc ~ ~ ~ ~ ~~o
cr
v z t
r P1- *0 1 - C, 0) cC O -0 t
O~ a- G'C N P- '-> N-N X S:L
010 O
c/c 6i t S i t C L t tG z .?~
-* c<- oi Ci c - Ci C -) 1Z cnC
- x ~ccm c, -Ni o c-tpo -c' tE _ AC S -t ?X*
ct t sc~~~C S~~~~~~~~~~c Ci -X
t-t X t cGc-- _t cc c-'-c t -. X ?'2~~
<0~~~
? cc c ,c Ec cc C t ,) C Cr E

TABLE 3
PROBIT REGRESSIONS ON SELF-EMPLOYMENT PROBABILITY
Variable Whites Blacks Hispanics Asians
Education: < 12 years -.074 -.039 -.114 -.016
(-.95) (-.44) (-1.37) (-.17) 12 years -.060 -..034 - .026 -.007
(-.92) (-.41) (-.31) (-.(9) 16 + years .139 .180 .154 .074
(2.15) (1.86) (1.68) (1.08) Age .061 .083 .087 .082
(3.43) (3.62) (3.98) (3.93) Age squared - .0005 - .001 - .001 - .001
(- 2.47) (- 2.91) (- 3.53) (- 3.03) Immigrant - .174 - .036 - .189 - .159
(-.65) (-.13) (-1.53) (-1.84) Years in United States .018 -.004 .020 .024
(if immigrant) (.75) (-.13) (1.69) (2.91) Years in United States squared -.0003 .0003 -.0003 -.0003
(-.58) (.40) (-1.18) (-1.56) Married, spouse absent .148 -.083 -.048 .047
(1.51) (-.84) (-.43) (.36) Married, spouse present -.253 -.393 -.200 .060
(-1.53) (-2.09) (-1.53) (.47) Wife's education .035 .032 .023 .009
(3.20) (2.39) (2.46) (1.10) Health limits work .144 .138 .183 .198
(1.59) (1.35) (1.62) (1.37) Veteran .148 .051 .088 .155
(3.04) (.84) (1.30) (2.33) Region:
Northeast .012 .172 - .130 - .321 (.15) (1.30) (-.74) (-2.22)
North Central - .021 .121 .161 - .002 (- .23) (.85) (.75) (- .01)
West -.(011 .055 -.111 -.095 (- .12) (.38) (-.81) (-.64)
Fraction black .247 1.219 - .378 - 1.016 (.47) (1.61) (-.31) (-1.10)
Fraction Hispanic .397 .470 .376 1.187 (1.07) (.88) (.93) (2.09)
Fraction Asian 1.104 2.247 .424 .326 (1.57) (1.49) (.58) (.95)
Constant -3.141 -4.435 -4.394 -.224 (-4.04) (-4.21) (-3.09) (-.19)
X 2 168.4 83.8 136.2 222.4
P .118 .105 .120 .154
NOTE-The t-ratios are presented in parentheses. The regressions also included measures of the SMSA's unem- ployment rate, the population growth rate between 1970 and 1980, the crime rate, the level of local government expenditures, and the mean income and education levels in the local labor market. In addition, the Hispanic regression included dummy variables for Mexican, Cuban, and "other" Hispanic origin.

CONSUMER DISCRIMINATION 597
sions estimate the parameters of the reduced-form index function in equation (14). Like the descriptive statistics in table 2, the regressions indicate that more educated and older persons are more likely to be self-employed. In addition, higher education levels for the wife in- crease the probability of self-employment. In general, the qualitative effects of these explanatory variables are essentially the same for all the groups.
The probit regressions in table 3 also include measures of the ethnic/racial composition of the labor market's population. These variables are defined by the fraction of the SMSA's population that is black, Hispanic, or Asian. In general, these "enclave" variables have a weak impact on self-employment propensities. The only "own" effect that is even marginally significant is the positive impact of percentage black on the black self-employment rate. The regressions also include a number of other local labor market characteristics (e.g., the crime rate or population growth). These variables proxy for labor market- specific differences in the costs of becoming self-employed. In gen- eral, the coefficients of these variables differ in terms of statistical significance as well as sign across the ethnic/racial groups. To con- serve space, therefore, the coefficients of these additional local labor market variables are not presented in table 3.
The white probit regression can be used to predict what the average self-employment rate of the various minority groups would be if the same mechanism that determined self-employment rates for whites generated minority self-employment rates. This predicted probability is presented in the last row of table 3 and is calculated using'9
N A, 4>(Z,;t) (17)
where Z- is the vector of variables (for individual i) included in the probit, *ft, is the vector of probit coefficients estimated in the white sample, and N is the sample size. The summation in (17) is conducted over all persons in the particular ethnic/racial group.
The predicted probabilities show that the self-employment rates of blacks and Hispanics would be almost identical to those of whites if the minority groups faced the same structure determining self- employment, while the self-employment rate of Asians would exceed that of whites. For example, the average black has a predicted self- employment rate of 10.5 percent (as compared to the actual 4.5 per- cent self-employment rate), and the average Hispanic has a predicted rate of 12.0 percent (as compared to the actual 7.0 percent self-
19 This formula ensures that the predicted probability in the white sample is identical to the observed self-employment rate of whites (see Maddala 1983, p. 26).

598 JOURNAL OF POLITICAL ECONOMY
employment rate). Both blacks and Hispanics, therefore, would have self-employment rates remarkably close to the 11.8 percent self- employment rate of whites if the groups faced the same structure. This implies that differences in characteristics across groups cannot explain the large variation in observed self-employment rates. In- stead, the observed variation in self-employment rates is due to differ- ences in the mechanism that selects the self-employment pool in each of the racial/ethnic groups.
The probit regressions in table 3 are used to estimate selectivity- corrected earnings functions in each of the two sectors for each of the groups. 2( The earnings regressions are presented in table 4 for the self-employed sector and in table 5 for the salaried sector. Before we turn to the selectivity variables, it is instructive to briefly analyze the impact of the demographic variables on incomes in each sector. One striking result is that the impact of the demographic variables is basi- cally the same for self-employment and salaried incomes for all racial groups. There are, of course, differences in the magnitudes of the coefficients by race and by sector, but the overall comparisons of the earnings equations do not support the hypothesis that earnings deter- mination in the two sectors is qualitatively different.21
Of course, the main focus of the study is the determination of the kinds of selections that generate the pools of self-employed and sala- ried workers. The type of selection is determined by the sign of the coefficients of the selectivity variables. One key result in table 4 is that the coefficient of the selectivity variable in the self-employment in- come regression is positive for whites but zero or negative for all minority groups. Since, as defined in equation (16), the selectivity variable in the self-employment sector (XI) is positive, this result im- plies that there is positive selection into self-employment in the white sample, negative selection into self-employment among Hispanics and Asians, and zero selection into self-employment among blacks.
The same dramatic differences in the selectivity coefficients are observed in the regressions estimated in the salaried sample (table 5). In particular, this coefficient is positive for whites but negative and significant for all minority groups. Since the selectivity variable (A0) is negative in the salaried sector, the coefficients imply that there is negative selection in the composition of the salaried sample for whites
20 The aggregate labor market characteristics listed in the notes to table 3, which proxy for mobility costs, are omitted from the earnings functions.
21 Tables 4 and 5 can also be used to assess the impact of' "enclave" effects on earnings. The comparison of the relevant coefficients across the two sets of' regressions, however, does not provide any evidence that enclave effects have a differential impact on self-employment salaried incomes.

TABLE 4
EARNING(,S FUNCTIONS OF SELF-EMPLOYED MEN
(Dependent Variable = In Weekly Income)
Variable Whites Blacks Hispanics Asians
Education: < 12 years -.401 -.314 -.176 - .129
(-3.74) (-2.30) (- 1.35) (- .64) 12 years -.344 -.284 .067 -..050
(-3.78) (-2.15) (.(6) (- .27) 16 + years .411 .469 .272 .241
(4.36) (2.75) (1.99) (1.45) Age .173 .092 .027 .040
(5.72) (1.78) (.59) (.58) Age squared - .002 - .(( 1 - .0004 - .(001
(-5.51) (-1.86) (-.77) (-.88) Immigrant - .562 - .276 - .247 - .439
(- 1.54) (-.64) (-1.30) (-2.03) Years in United States .059 .043 .016 .023
(if immigrant) (1.84) (.87) (.91) (.97) Years in United States squared -.(0(1 -.(0(1 -..0003 -.(0(1
(-1.92) (-.97) (-.74) (-1.35) Married, spouse absent .239 .072 .483 -..079
(1.67) (.45) (3.00) ( - .25) Married, spouse present .614 .196 .329 .067
(4.94) (1.52) (2.68) (.32) Health limits work -.488 -.433 -.716 -.736
(-4.09) (-2.71) (-4.32) (-2.24) Veteran -.220 -.141 .038 .116
(-2.92) (-1.47) (.39) (.66) Fraction black .248 2.693 4.479 -.716
(.43) (2.68) (3.84) (-.45) Fraction Hispanic .695 - .195 - .409 -2.529
(1.60) (-.32) (-1.22) (-1.75) Fraction Asian 1.625 - .187 .631 .321
(1.97) (-.11) (.68) (.71) Region:
Northeast - .073 .013 .017 - .013 (-.93) (.10 () (.11) (-.07)
North Central -..076 .348 .050 .226 (- .07) (2.41) (.23) (.74)
West - .059 .350 .173 .072 (- .59) (1.88) (1.41) (.22)
XI 1.132 .031 -.988 -1.330 (3.22) (.06) (-2.12) (-1.86)
Constant -.802 2.723 6.118 7.697 (- .63) (1.24) (3.64) (2.65)
Sample size 2,056 1,022 1,033 609 R2 ..083 .(81 .125 .108
NOTE.-The t-ratios are presented in parentheses. Ihe standard errors were corrected fOr the heteroscedasticitN introduced by the selectivity variable. lThe Hispanic regression also inclu(lded d(unliv variables for Mcxican, Cuban, and "other" Hispanic origin.

TABLE 5
EARNINGS FUNCTIONS OF SALARIED MEN (Dependent Variable = in Weekly Income)
Variable Whites Blacks Hispanics Asians
Education: < 12 years -.263 -.237 -.216 -.294
(- 7.00) (- 6.93) (- 5.59) (- 7.85) 12 years -.055 -.056 -.079 -.078
(-1.76) (-1.77) (-2.19) (-2.38) 16 + years .226 .179 .(11 .272
(6.22) (3.88) (.23) (9.19) Age .106 .032 -.000 .053
(10.96) (2.86) (- .( 1) (4.86) Age squared -.001 -.0004 -.000 -.001
(-10.49) (- 3.07) (- .02) (- 5.23) Immigrant -.494 -.412 -.308 -.392
(-3.92) (-3.85) (-5.82) (-10.03) Years in United States .028 .045 .013 .028
(if immigrant) (2.28) (3.33) (2.39) (6.20) Years in United States squared - .0003 - .001 - .0001 - .001
(- 1.21) (-3.42) (-1.01) (-5.94) Married, spouse absent .109 .159 .153 .104
(2.34) (4.32) (3.41) (2.00) Married, spouse present .325 .298 .247 .158
(8.68) (9.86) (7.53) (5.11) Health limits work -.211 -.227 -.298 -.306
(- 4.27) (-4.91) (-5.28) (-4.20) Veteran -.040 .116 .108 .124
(- 1.48) (4.77) (3.57) (3.97) Fraction black .798 .239 1.236 -.005
(3.70) (.94) (3.55) (-.02) Fraction Hispanic .197 - .423 -.568 - .646
(1.12) (-2.45) (-5.06) (-2.39) Fraction Asian .507 1.945 .313 .179
(1.29) (2.46) (1.03) (2.35) Region:
Northeast .023 .046 .002 -.063 (.74) (1.38) (1.03) (- 1.64)
North Central .119 .203 .115 -.058 (3.49) (5.97) (1.66) (- .96)
West .114 .078 .100 -.051 (2.82) (.12) (2.69) (- 1.11)
Xo .424 -1.695 -1.860 -.999 (1.36) (-2.96) (-4.07) (-3.24)
Constant 3.146 4.510 5.204 4.529 (16.01) (20.51) (24.92) (20.20)
N 3,861 5,533 4,506 4,511 R 2 .152 .098 .113 .182
NOTE.-The t-ratios are presented in parentheses. The standard errors were corrected for the heteroscedasticity introduced by the selectivity variable. The Hispanic regression also included dummy variables for Mexican, Cuban, and "other" Hispanic origin.

CONSUMER DISCRIMINATION 6o1
TABLE 6
SELECTIVITY COEFFICIENTS BY OCCUPATION
PROFESSIONAL OTHER
GROUP Self-employed Salaried Self-employed Salaried
Whites .856 .156 1.549 1.032 (2.28) (.45) (4.17) (3.01)
Blacks -.407 -1.886 .202 - 1.440 (-.71) (-2.68) (.38) (- 2.34)
Hispanics - .699 -2.148 .218 -.993 - 1.91) (-4.74) (.68) (-3.01)
Asians -1.356 -1.347 -1.014 -.331 (-1.86) (-4.30) (-1.37) (-1.01)
NOTE.-The t-ratios are presented in parentheses.
but that there is positive selection generating the salaried samples of minorities.
Among whites, therefore, we observe that the most able persons enter self-employment and that the least skilled persons remain in the salaried sector. Among the various minority groups, however, essen- tially the opposite result is observed: the most able persons remain in the salaried sector and the least skilled become self-employed. It is important to note that this empirical result is exactly what is predicted by our theoretical model. In particular, the existence of consumer discrimination reduces the gains from self-employment for the most able members of a minority group.
Remarkably, these findings persist even when the self-employment and salaried sectors are stratified into two major occupation groups: professionals and others.22 Table 6 presents the coefficients of the se- lectivity variables in each of the two sectors by occupation group. White self-employed persons are positively selected regardless of oc- cupation, while minority self-employed workers are never positively selected and are often negatively selected. Conversely, white salaried persons are not positively selected, while minority salaried persons are always positively selected.
Our theoretical model is based on the premise that personal con- tacts between consumers and sellers are essential for the presence of
22 The professional category includes all persons working in managerial and profes- sional specialty occupations according to the 1980 census occupation codes. All other workers are in the residual category, which includes the sales, service, crafts, operator, and laborer occupations. The fraction of salaried workers who are in the professional occupation group is 31.2 percent for whites, 14.2 percent for blacks, 14.0 percent for Hispanics, and 34.3 percent for Asians. The fraction of self-employed workers who are in the professional occupation group is 46.7 percent for whites, 29.6 percent for blacks, 34.1 percent for Hispanics, and 52.4 percent for Asians.

602 JOURNAL OF POLITICAL ECONOMY
TABLE 7
ESTIMATED STANDARD DEVIATIONS OF (In) WEEKLY INCOMES
TRUNCATED u POPULATION (r
Self- Self- GROUP employed Salaried Ratio employed Salaried Ratio
Whites 1.27 .65 1.95 1.63 .69 2.36 Blacks 1.35 .81 1.68 1.35 1.07 1.26 Hispanics 1.14 .75 1.52 1.46 1.15 1.27 Asians 1.31 .69 1.89 1.78 .88 2.03
consumer discrimination. To the extent that the degree of personal contact differs by occupation group, it seems reasonable to expect that the intensity of selection would differ by occupation. However, it is unclear a priori which occupation group has more contact with its consumers: Do accountants and lawyers have more personal contact with their clients than salespeople and plumbers? Moreover, disag- gregating the sample into two broadly defined occupations may not be sufficient to capture the subtle variations in selection that arise as the degree of personal contact varies. Unfortunately, any further disaggregation leads to increasingly smaller samples and to less robust estimation of the parameters.
The selectivity results presented in this section arise because the variance in self-employment incomes (relative to the variance in sala- ried incomes) is reduced for minorities because of consumer discrimi- nation. This implication of the model can be tested directly by cal- culating the standard deviation of the population income distributions in each of the two sectors. Table 7 presents estimates of the standard deviations of log incomes in the two sectors by race. The predicted population standard deviation (i.e., the variation that would arise if all individuals entered the sector after we control for differences in de- mographic variables) is calculated using the formula suggested by Heckman (1980, p. 217). Table 7 also presents the (square root of the) truncated mean square error from the selectivity-corrected ordinary least squares earnings regressions.
A key prediction of our model is that there will be less income inequality among self-employed minorities than among self- employed whites. Table 7 indicates that the population standard devi- ations of self-employment income are indeed lower among blacks and Hispanics than among whites. Selection, however, is determined by the ratio of population standard deviations between the self-employ- ment and the salaried sectors. The results in table 7 reveal that the ratio of the standard deviation of self-employment incomes to

CONSUMER DISCRIMINATION 603
TABLE 8
DECOMPOSITION OF RACIAL WAGE DIFFERENTIALS
SELF-EMPLOYMENT SECTOR SALARIED SECTOR
Actual Wage Predicted Actual WagePredicted Differential Differential Differential Differential
between if Minority between if' Minority Whites and Group Faced Whites and Group Faced
Minority White Minority White GROUP Groups StruCture Groups Structure
Blacks .469 .194 .385 .116 Hispanics .276 .048 .394 .176 Asians .053 - .270 .209 .067
salaried incomes is always greater for whites than for minority groups (particularly blacks and Hispanics). For example, the predicted popu- lation standard deviation ratio for whites is 2.4 but only 1.3 for blacks and Hispanics.
These ratios differ by race, in part, because in the salaried sector the minority income distributions exhibit more dispersion than the white income distribution. We do not know why this result arises since there has been little study of' racial differences in the second moment of wage distributions. 23 Nevertheless, it is important to note that this result is not simply generated by the algebra underlying the construc- tion of the population standard deviation because it is also f'ouLnd in the simpler mean square error-based measure of income inequality.
The results in table 7, therefore, are consistent with the selection patterns indicated by the earnings functions in tables 4 and 5. Al- though the measures of' income inequality in table 7 are generated from the same earnings functions as the selectivity coefficients, the sorting patterns observed in the data are not derived from our esti- mates of' the population variances. There is nothing in the statistical procedure that forces the pattern of' selectivity coefficients and popu- lation variances to be consistent with each other.
Finally, we use the earnings functions in tables 4 and 5 to decom- pose the observed wage differential between whites and the various minority groups in each of the two sectors. This decoln position, pre- sented in table 8, is conducted by setting the selectivity variables (X() and XI) equal to zero so that, in effect, we are comparing means of, population income distributions. T'he results for blacks and Hispanics reveal that even after we control for differences in demographic char-
23 Welch and Smith (1979) present an analysis of income inequality by race and also find that the black income distribution in the salaried sector exhibits sulbstantially more dispersion than the white income distributions.

604 JOURNAL OF POLITICAL ECONOMY
acteristics, the income gap between minorities and whites remains. Self-employed blacks, for example, have 19 percent lower mean in- comes than whites. This result is consistent with the implication of our theoretical model. The theoretical prediction that self-employed minorities have lower incomes than whites, however, is not confirmed by the analysis of the Asian data since in this case Asians actually earn more than whites, on average.
IV. Summary
This paper presents a theoretical and empirical analysis of racial dif- ferences in self-employment propensities and incomes. The theoreti- cal model is based on the hypothesis that white consumers dislike purchasing goods from self-employed minority workers and that it is costly to acquire information about the price offers and racial charac- teristics of sellers. Our equilibrium search model not only implies the existence of price dispersion in the marketplace but also yields two interesting predictions: First, minority self-employed workers have lower incomes than white self-employed workers. Second, the income distribution of self-employed minority workers has less variance than the income distribution of self-employed whites. The latter result implies that the gains to self-employment for able minorities are rela- tively smaller than the gains to self-employment for able whites. Therefore, able minorities have much lower incentives to become self-employed, and minorities are more likely than whites to be nega- tively selected into self-employment.
The empirical analysis used the 1980 U.S. census and showed large differences in both self-employment rates and incomes across the ethnic/racial groups. The self-employment rates of blacks and His- panics, for example, were found to be at least 50 percent lower than those of whites, and the earnings differential between self-employed whites and blacks (or Hispanics) was almost as large as (if not larger than) the racial wage differential in the salaried sector. In addition, our analysis revealed that minorities are negatively selected into self- employment whereas whites exhibit positive selection. Conversely, whites are negatively selected into salaried jobs, whereas the most able minorities remain in the salaried sector. The theory of consumer discrimination, therefore, provides unique insights into the composi- tion of the pool of workers who self-select between the two employ- ment sectors.
References
Becker, Gary S. The Economics of Discrimination. 2d ed. Chicago: Univ. Chicago Press, 197 1.

CONSUMER DISCRIMINATION 605
Blau, David M. "Self-Employment and Self-Selection in Developing Country Labor Markets." Southern Econ. J. 52 (October 1985): 351-63.
. "A Time-Series Analysis of Self-Employment in the United States." J.P.E. 95 (June 1987): 445-67.
Borjas, George J. "The Self-Employment Experience of Immigrants."J. Hu- man Resources 21 (Fall 1986): 485-506.
Cain, Glen G. "The Economic Analysis of Labor Market Discrimination: A Survey." In Handbook of Labor Economics, vol. 1, edited by Orley C. Ashen- felter and Richard Layard. Amsterdam: North-Holland, 1986.
Carlson, John A., and McAfee, R. Preston. "Discrete Equilibrium Price Dis- persion."J.P.E. 91 (June 1983): 480-93.
Evans, David S., and Leighton, Linda S. "Self-Employment and Earnings over the Life Cycle." Manuscript. New York: Fordham Univ., 1987.
Goldberg, Matthew S. "Discrimination, Nepotism, and Long-Run Wage Dif- ferentials." Q.J.E. 97 (May 1982): 307-19.
Heckman, James J. "Sample Selection Bias as a Specification Error with an Application to the Estimation of Labor Supply Functions." In Female Labor Supply: Theory and Estimation, edited by James P. Smith. Princeton, N.J.: Princeton Univ. Press, 1980.
Lazear, Edward P., and Moore, Robert L. "Incentives, Productivity, and Labor Contracts." Q.J.E. 99 (May 1984): 275-96.
Leonard, Jonathan S. "Employment and Occupational Advance under Affir- mative Action." Rev. Econ. and Statis. 66 (August 1984): 377-85.
Maddala, G. S. Limited Dependent and Qualitative Variables in Econometrics. New York: Cambridge Univ. Press, 1983.
Moore, Robert L. "Employer Discrimination: Evidence from Self-employed Workers." Rev. Econ. and Statis. 65 (August 1983): 496-50 1.
Reinganum, Jennifer F. "A Simple Model of Equilibrium Price Dispersion." J.P.E. 87 (August 1979): 851-58.
Roy, Andrew D. "Some Thoughts on the Distribution of Earnings." Oxford Econ. Papers 3 (June 1951): 135-46.
Scitovsky, Tibor. "A Note on Profit Maximisation and Its Implications." Rev. Econ. Studies 11, no. 1 (1943): 57-60.
U.S. Bureau of the Census. State and Metropolitan Area Book, 1986. Washing- ton: Government Printing Office, 1986.
Welch, Finis, and Smith, James P. "Inequality: Race Differences in the Distri- bution of Earnings." Internat. Econ. Rev. 20 (June 1979): 515-26.


![Discrimination in Black Employment [2013]:](https://img.dokumen.tips/doc/110x75/55683454d8b42ab7198b52d4/discrimination-in-black-employment-2013.jpg)
