Embed Size (px)
Citation preview

08-061
Consumer Demand for Prize-Linked Savings: A Preliminary Analysis
Peter Tufano Nick Maynard Jan-Emmanuel De Neve
Copyright © 2008 by Peter Tufano, Nick Maynard and Jan-Emmanuel De Neve
Working papers are in draft form. This working paper is distributed for purposes of comment and discussion only. It may not be reproduced without permission of the copyright holder. Copies of working papers are available from the author.

- 2 -
Consumer Demand for Prize-Linked Savings: A Preliminary Analysis
Peter Tufano* Harvard Business School, NBER, and D2D Fund
Nick Maynard
D2D Fund
Jan-Emmanuel De Neve Harvard Business School
Abstract: This paper reports on a small-scale survey of the potential American demand for prize-linked savings accounts, an account that awards prizes as part of the saving product’s return. In October 2006, Centra Credit Union launched a prize-linked savings pilot. As part of that initiative, we conducted a mall intercept survey of over 500 people in Clarksville, Indiana, the community where the program was launched. This preliminary data suggests that low-to-moderate income Americans may have substantial demand for prize-linked savings, with a majority of survey participants expressing an interest in opening a prize-linked savings account. As predicted by theory and international experience, interest in prize-linked savings is greatest among people who do not have regular saving habits, who have little actual savings, who play lotteries extensively, and who are optimistic about their futures. * Corresponding author contact information: Peter Tufano, Harvard Business School, Soldiers Field, Boston MA 02140 ([email protected]), NBER and D2D Fund; Nick Maynard, D2D Fund, 1127 Harrison Ave. Roxbury, MA 02119 ([email protected]); Jan-Emmanuel De Neve, Harvard Business School, Soldiers Field, Boston, MA 02140 ([email protected]). This analysis of survey data complements the report “Prize-Based Savings: Product Innovation to Make Saving Fun” by Nick Maynard. We would like to thank Emily McClintock Ekins, Nan Morrow, and Denise Gabel
- 3 -
Prize-linked savings (“PLS”) products offer savers a return in the form of the
chance to earn large prizes, rather than in more traditional forms of interest or dividend
income or capital appreciation. The probability of winning is typically determined by
account balances, and the aggregate prize pool can be set to deliver market returns to all
savers. Prize-linked assets are offered in over twenty countries around the world—
including the U.K., Sweden, South Africa and many Latin American and Middle Eastern
countries—but are not available in the United States, where state laws and federal
regulations make the offering of prize-linked programs problematic. However, the
demand for lotteries in the US suggests that demand for a savings vehicle offering
chances to win a high payoff prize could be substantial. If so, prize-linked savings
products could help raise aggregate savings among low- to-moderate income families.
Categorizing savings programs on a spectrum from coercive to exciting, Tufano
and Schneider (2007) consider prize-linked savings a program that could make saving
exciting, by leveraging the excitement generated by gambling and lotteries. This overlap
between prize-linked savings and lotteries is important as survey results show that low-
income American families believe they are more likely to build wealth by playing the
lottery than by traditional saving with compound interest (Holton, 2000; Consumer
Federation of America, 2006).
Despite their long and successful history, prize-linked savings are relatively
unstudied by scholars with a few exceptions. Guillen and Tschoegl (2002) survey
programs around the world, describing Latin American programs in some detail. They
report that in Latin America, PLS products appealed to low income and unbanked
individuals. In South Africa, the Million-a-Month Account offered by South Africa’s
- 4 -
First National Bank (Cole et al., 2007) generated 750,000 accounts and raised over 1.2
billion Rand in two years time (Mabuza, 2007). The product reportedly has appealed to a
wide cross section of South Africans.
Recent work examines the U.K. Premium Bond program (Lobe and Höltzl, 2007;
Tufano, 2007), one of the longest continuously operated programs with over £31.1 billion
outstanding as of March 2006. Tufano (2008) reports that demand for Premium Bonds is
stronger among lower income households than is their demand for alternative products,
like stocks and shares. Premium Bond sales over nearly four decades are related to
savings factors (the aggregate interest rate paid on the product relative to comparable
rates) as well as to gambling factors (the size of the largest prize.) Furthermore, sales are
higher when aggregate savings is lower, contrary to other savings products.
All together, this work paints a picture of a savings vehicle that may appeal to
people with little savings and little interest in traditional savings products. While
international evidence suggests a nearly universal appeal for PLS, one might wonder
whether PLS would appeal to US consumers, and if so, which ones. A more fundamental
question is whether PLS would increase overall household savings, and if so, would it
draw funds away from consumption, gaming or some other. This short note addresses the
first of these issues—likely demand—by using market research survey techniques.

- 5 -
The Centra Credit Union Super Savings Pilot
In 2007, Indiana-based Centra Credit Union launched “Super Savings,” the first
ever prize-linked savings product in the United States across all of its 22 branches.1 Prior
to the full launch, in October 2006, a pilot and associated survey were launched in
Clarksville, Indiana at a new credit union branch. The Clarksville Centra branch is
located inside a Wal-Mart store, and the survey was conducted in the store by Centra
contractors working in conjunction with the D2D Fund2. Table 1 lists the demographic
characteristics of Clark County, the location of the pilot, and compares it with national
US data. In brief, the county has a mean income 13% lower than the US mean and can
provide some insight into PLS demand among low income populations. We are aware
however, that the results from Clarksville may not be nationally representative.
As part of the pre-pilot market research, 547 surveys were completed by
intercepting Wal-Mart customers during the mid-November to December 2006 period.
The principal question asked—which is a brief description of the Super Saver account—
was the following:
Would you be interested in a savings account that awarded chances to win
prizes based on the amount of money you save? The account would also have
no fees, no minimum balance, and still earn interest.
This sentence-long description provided the essence of the product (prizes for savings)
but obviously did not give the details, e.g., the number, size, or odds of winning the
prizes, nor the relevant interest rate. It captures general interest for the product type as
1 See Maynard 2007 for more detail on the Centra Super Savings experiment. 2 D2D Fund is a non-profit organization that works to expand access to financial services, especially asset building opportunities, for low-income families by creating, testing and deploying innovative financial products and services (http://www.d2dfund.org/).

- 6 -
opposed to the specific product features. In addition to collecting potential interest in the
product, the survey gathered demographic information. The Appendix reproduces the
survey, and Table 2 reports the results of the survey.
In total, 58% of participants expressed a positive interest in the PLS accounts,
26% were not interested, and 16% answered “I don’t know.” The simple PLS concept
appealed to a majority of the surveyed Wal-Mart customers in Clarksville, IN, but this
finding is subject to three important caveats. First, as noted above, this population is not
nationally representative but rather concentrated among low-income families. Second,
since the program had not been fully marketed, this survey reflects indications of interest,
not executed transactions. Finally, since the survey did not indicate the precise terms,
e.g., what interest rate would be set in conjunction with the prizes, or what the prizes
would be, it cannot inform about the precise demand. Nevertheless, we found that even
this bare-bones description of the product was more appealing to some customers than to
others, which we analyze below.
The Potential Appeal of Prize-Linked Savings.3
While delivering higher returns—e.g., higher rates of return or interest—may
increase demand, psychological factors can be a potent stimulator of demand as well.
Researcher in behavioral economics and behavioral finance are finding that certain
systematic psychological biases can explain a great deal of consumer decisions. In this
instance, the popularity of the PLS product may lie in its blend of the guarantee of no
principal loss with a large, but low probability gain. PLS accounts are a textbook
3 This section is adapted from Tufano 2008.

- 7 -
application of certain behavioral economics principles. In particular, the product
structure is engineered to appeal to people who are “loss averse,” i.e., who will pay more
to avoid a loss than to guarantee a gain of the same size. In particular, the PLS product
guarantees no principal loss. However, unlike the traditional products that guarantee no
principal loss (such as bank deposits, CDs, bonds), PLS leverages the behavioral
phenomena that investors may avoid large gambles, but will take on small ones, in this
case, the forgone interest on their invested funds. Finally, PLS reflects the behavioral
factor that people often misestimate the probabilities of low-probability events (e.g.
accidents or winning gambles). For a theoretical discussion of PLS products, see
Pfiffelmann 2006.
The popularity of PLS products also reflects their functional properties.
Alternative products with no principal loss and good liquidity are typically low-yielding
demand deposit accounts. The power of compound interest provides little incentives to
savers with short and uncertain savings horizons and small principal balances that
generate meager amounts of interest. Instead of receiving a certain but small payout, the
PLS saver gets a small chance at a large payoff. This preference mirrors the opinions
revealed by a recent survey by the Consumer Federation of America (CFA) and the
Financial Planning Association (FPA), which that “more than one-fifth of Americans
(21%)—38% of those with incomes below $25,000—think that winning the lottery
represents the most practical way for them to accumulate several hundred thousand
dollars.”4
4 http://www.americasaves.org/downloads/www.americasaves.org/01.09.2006.pdf

- 8 -
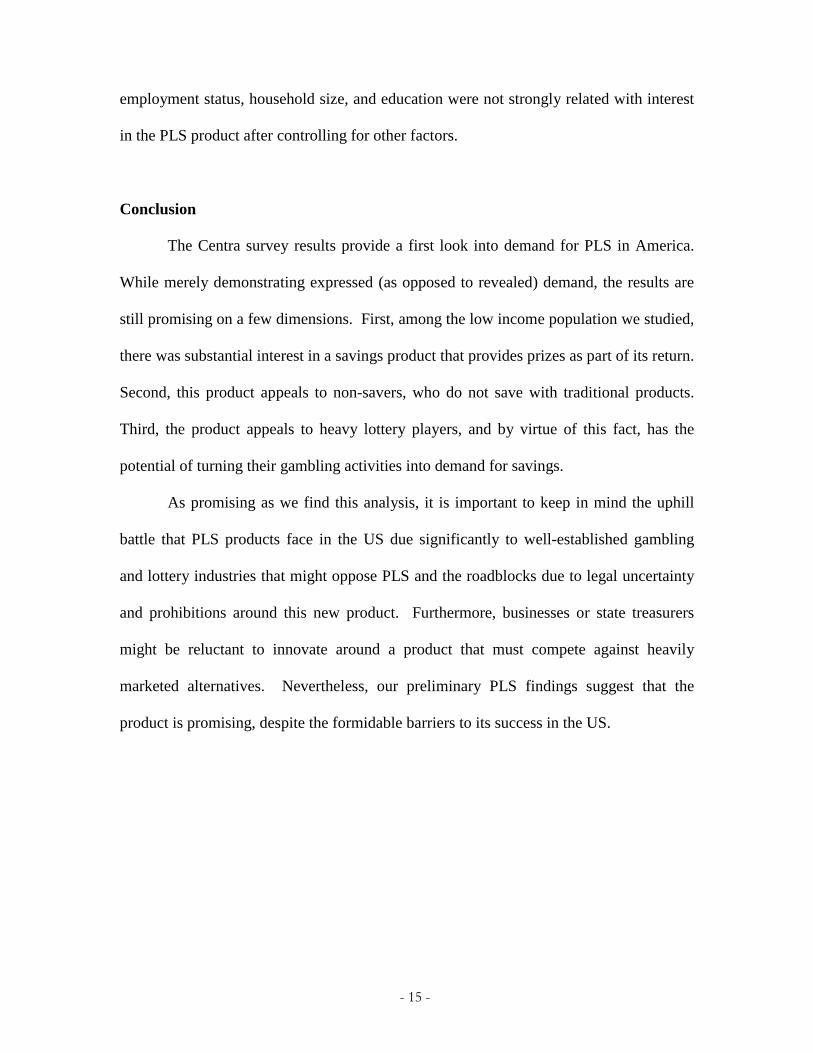
Bankers offering prize-linked savings around the globe suggested that the
products might particularly appeal to “non-savers,” (i.e., those who had not previously
been attracted to existing savings or investing products). To test this conjecture, we
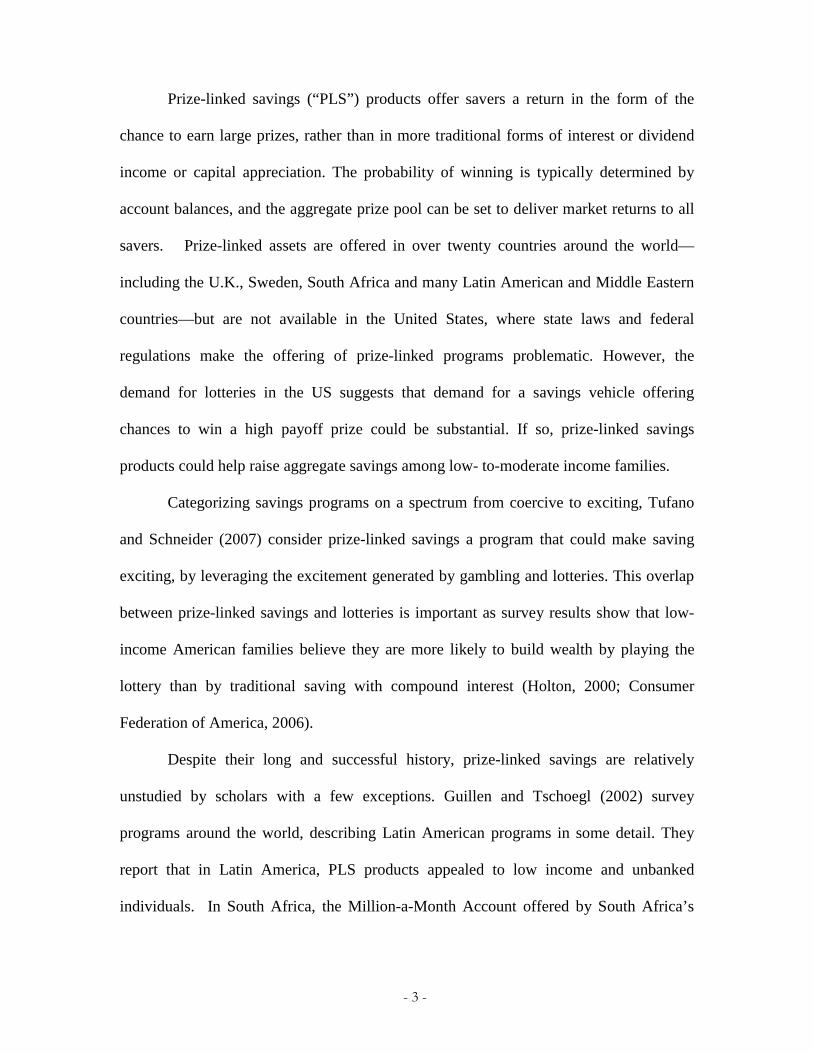
sought to see if the PLS structure appealed to non-savers. We considered savers to be
those individuals with some form of a savings plan. They might plan to save the income
of one family member, spend one’s regular income but save other forms of income, or
save regularly by putting money aside each month. We considered non-savers to be (for
parallelism to last sentence) people who indicated that they had no regular savings plan,
either spending more than their income or spending about as much as their income.
Based on this categorization, 61% of all survey participants were non-savers (see Table
2). Among non-savers, 65% expressed an interest in the PLS product. Among savers,
only 48% expressed an interest. Figure 1 illustrates this result graphically.
Writing about PLS accounts in Latin America, Guillén and Tschoegl (2002)
conclude that “[T]he bankers we spoke with believe that (the products) are especially
successful with low-income depositors.” This observation is consistent with evidence on
the demographics of gambling; the 1999 National Gambling Impact Study showed that
80% of gambling revenue comes from households with income less than $50K; the same
report indicates that households with incomes less than $10K spent 3 times as much
gambling—in aggregate real dollars—as those with incomes greater than $50K. To test
if PLS is especially demanded by low income and low wealth persons, the survey
collected information on financial assets, including checking, savings, and money market
accounts; CDs; IRAs; 401(k)s; 403(b)s; Keoghs; mutual funds; savings bonds; stocks;
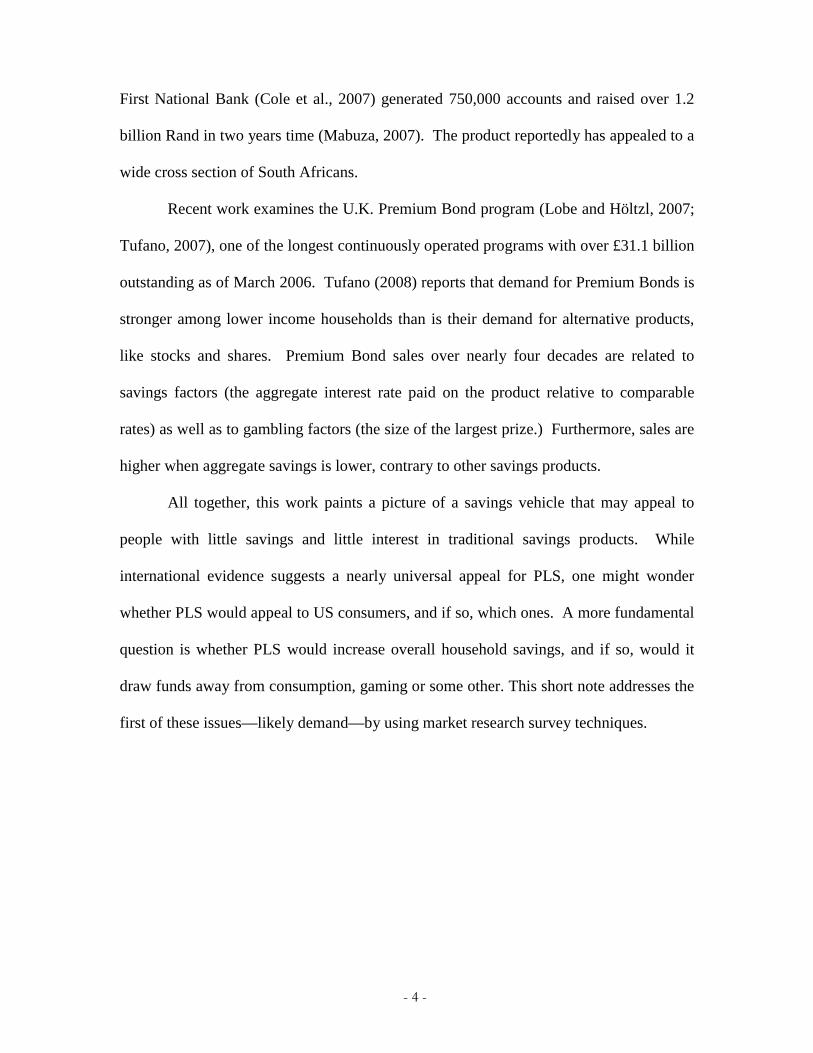
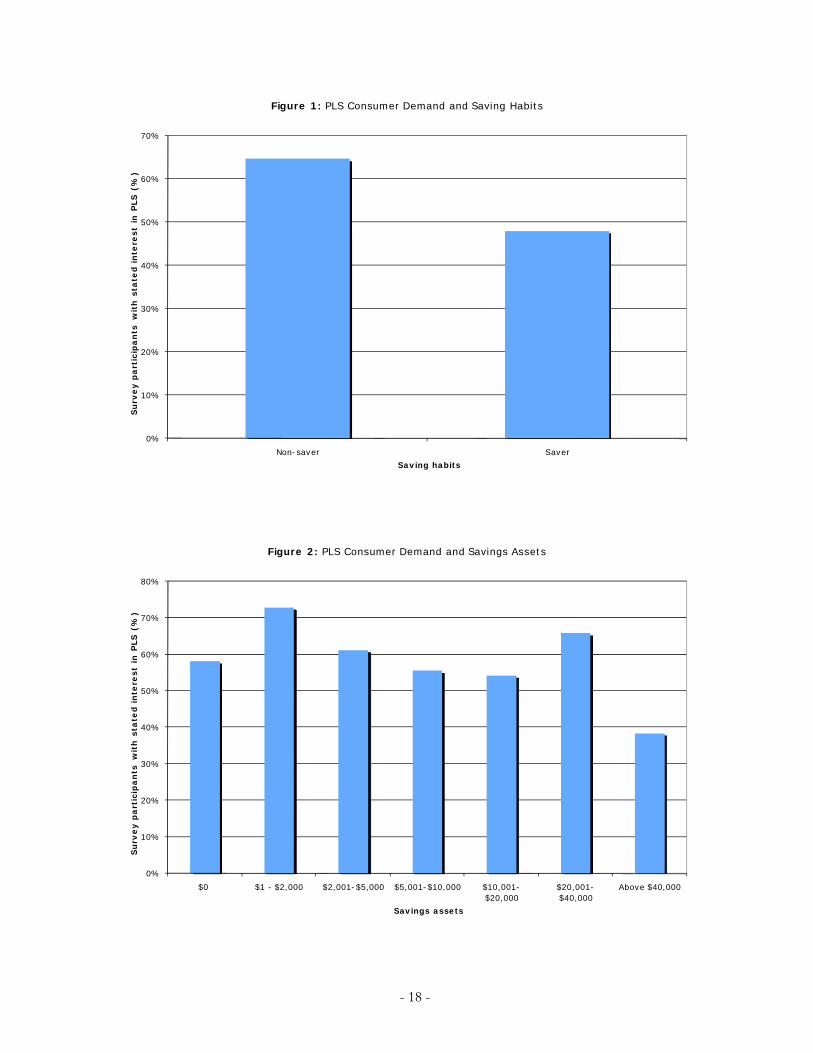
bonds; and any cash saved at home. The survey results by savings assets range are
- 9 -
shown in Table 2 and illustrated in Figure 2. In these simple cuts, the product was most
demanded among people with less savings. Among participants reporting between $1
and $2,000 in savings assets, 73% expressed interest in the PLS offer. In contrast, only
38% of those with $40,000 in savings were interested.
The survey also gauged the participants’ estimate of their earnings relative to the
other people in the Clarksville, IN area. In general, the participants represented the full
range of relative incomes. Among those participants that considered their earnings to be
substantially less relative to the Clarksville population, 62% showed interest in the PLS
product that was offered, while for those who thought they earned substantially more than
the other people in Clarksville, IN, only 48% showed interest in the PLS offer. Table 2
also gives the results for the intermediate categories.
Because the PLS customer cannot improve the odds of winning (apart from
saving more), one might expect that this activity, like gambling, may be attractive to
optimistic individuals Puri and Robinson (2007) provide evidence that optimism is
related to a wide range of economic decisions that include portfolio choices and labor
market decisions. They find that “Optimistic people are more likely to believe that their
income will grow over the next five years, even controlling for past income growth.” In
our survey we measure optimism by asking participants about their future expectations of
their financial well-being as compared to the previous five years. We consider optimists
to be those participants that replied “improve” as compared to those that considered their
future expectations to either remain the same or become worse than it has been over the
previous five years. Some 60% of survey participants were optimistic about their future
income and only 5% were pessimistic about their future income. Among these

- 10 -
optimistic participants, 65% showed interest in the PLS product, but only 33% of the
pessimists were interested. See Table 2 and Figure 4.
Because PLS products combine saving with the thrill of winning prizes (but
without the risk of losing principal), we hypothesized that PLS would appeal to lottery
players and gamblers. We measure gambling and lottery activity by whether survey
participants had spent over $100 in the past 6 months on any combination of the
following games: scratch-offs or pull tabs, Daily 3, Daily 4, Lucky 5, Pick 3, or Pick 4;
lotteries such as Hoosier Lottery, Kentucky Cash, or Powerball, and gambling activities
such as casino games or slots; and betting on horse-racing. Among all survey participants
11% reported to have spent over $100 in the past 6 months on such games. Among this
subsample of heavy lottery spenders, 75% showed interest in the PLS offer. In contrast,
only 56% of the people spending less than $100 were interested. Table 2 provides the
data, and Figure 3 illustrates graphically.
Even a small substitution effect between lottery spending and prize-linked savings
would lead to an increase in aggregate savings. In 2003 alone, U.S. residents spent nearly
$80 billion on legalized forms of gambling (Kearney, 2005) and $90 billion by 2007.
This amount outweighs the combined expenditure on movie tickets, recorded music,
spectator sports, video games, and theme parks. Though large shares of the U.S.
population engage in some form of gambling annually, evidence suggests that “on
average, low-income households spend a larger percentage of their wealth on lottery
tickets than other households” (Kearney, 2005: 16). If PLS can tap into this substantial
demand, it might appeal to new savers.
- 11 -
The survey also asked for the participants’ willingness to bear financial risk.
While the product has certain low risk attributes (the absence of principal loss) it also has
a more risky payout (the prizes). Consistent with the notion that low income families
tend to be financially risk averse, the majority of those surveyed people indicated that
they were either not willing to take any financial risk or only average financial risk.
Among these participants, the interest in the PLS product offer was, respectively, 54%
and 59%. Among the fraction of participants that reported that they would be willing to
take substantial risks, some 72% indicated interest in the PLS product (see Table 2).
Guillen and Tschoegl (2002) in their review of PLS programs around the world
also note that the products appealed to “people outside the banking system. The Spanish
banks believe, though no systemic studies exist, that [Lottery-linked deposit accounts]
enabled them to grow in those Latin American countries where they introduced the
accounts by attracting new customers as well as stealing customers from other banks.”
To test if these factors are replicated in Indiana, we hypothesized that PLS might be
especially appealing to people who are unbanked or underbanked. We judged as
unbanked or underbanked those participants that typically cash checks at either cashing
outlets, grocery stores, Wal-Mart, convenience stores, or any other way. Banked are those
survey participants that cash most of their checks at either a bank or a credit union.
Among the survey participants, 20% are underbanked, of which 62% expressed interested
in the PLS product. Among the 80% of survey participants that are “banked,” 58%
showed interest. Table 2 provides the data.
A number of other factors might relate to the demand for PLS. A number of
authors, e.g., Campbell (2006), Agarwal, Driscoll, Gabaix and Laibson (2007), and

- 12 -
Barber and Odean (2001) have found that financial decision making varies with
education, age and gender. These traits may capture a variety of factors, ranging from
financial sophistication, risk taking, or unobserved long-run wealth and income. To
assess these qualities, we also collected data on gender, age, employment status,
education, marital status, household size, and financial literacy. These are reported in
Table 2 as well. In these simple cross tabs, there is slightly stronger demand among
younger persons, men, employed people, less educated persons and certain types of
households.
Expressed Preferences: Multivariate Analyses
The discussion above reports univariate differences between people who
expressed a positive interest in PLS versus those expressing a negative interest.
However, many of the variables are correlated with one another. For example, the level
of savings is negatively correlated with being a non-saver (ρ=-0.26). Optimistic income
expectations drop with increases in age among survey participants (ρ=-0.38). Being full-
time employed correlates positively with optimistic income expectations (ρ=0.31). These
correlations require a multivariate analysis.
Table 3 shows the results of a multivariate logistic regression of expressed interest
in the offered PLS account using the explanatory variables discussed above that reflect
demographic and socio-economic characteristics. We report two analyses, one that
compares the interested individuals with those that were either not interested or replied
that they didn’t know (full sample). The second panel contrasts the interested individuals
directly with those that were not interested, ignoring those who expressed no opinion (the

- 13 -
restricted sample). The logistic form produces odds ratios that allow for the prediction of
an individual’s propensity to take up PLS products.
As predicted by international anecdotal evidence, the product appeals to non-
savers in this expanded analysis. First, the expressed preference is stronger for people
who do not claim to have regular savings plans, i.e., those who either state that they do
not save or merely save if they happen to have money that they haven’t spent that month.
As compared to individuals or households with a savings plan (i.e. they save the income
of one family member, put money aside regularly each month, etc.), a non-saver is 70%
more likely to show interest in the PLS product. This large result is statistically
significant at the 5% level.
In addition to being related to savings plans, PLS demand is related to the level of
savings, with the product appealing most to people with almost no savings. As compared
to participants that reported having $50,000 or more in financial assets, participants
whose financial assets are in the $1-$2,000 range show a propensity for interest in the
offered PLS product that is 2.5 times greater, significant at 5% and 10% levels for the
two samples.
A third predictor for interest in PLS accounts is optimism, measured by the belief
that one’s financial well-being will improve over the next five years. Optimistic
participants are 2.1 to 2.5 times more likely to show interest in the PLS product than
those who foresee no change in their income over the coming five years. This positive
correlation is significant at the 1% level for both data panels. Conversely, individuals that
held negative expectations on their future income levels had similar levels of interest to

- 14 -
those who expected no growth in future income. The result is consistent with emerging
academic work on the relationship between optimism and financial decision-making.
Another factor associated with strong demand in the PLS product is being a heavy
spender on lottery and gambling activities. Participants that had spent $100 or more over
the past 6 months on such games had interest levels 2.9 or 2.6 times higher than those
participants that had spent less than $100. An important question for future research is
whether this interest in PLS would add to or substitute for demand for lottery play by
these individuals.
A few other explanatory variables are related to demand. Persons in the 55-64 age
group are less interested in the PLS account with an odds ratio of 0.4 or 0.3 as compared
to the youngest age group in our sample (18-24). Separated individuals show
substantially more interest in the PLS product compared to married individuals (the odds
ratio stands at 9.3 and shows significance at the 5% level). Counter to our joint measure
for lottery and gambling expenses, the stand-alone activity of gambling (measured in the
survey by playing the casino and horse-races) produces an odds ratio that predicts only
half as much interest (0.49) relative to non-gamblers. This result is significant at the 10%
level for the full sample only. While it is mere supposition, PLS may be closer in form to
the “tame” gaming embodied in lottery play than to the more active gambling of casino
or horse-racing.
In the multivariate specifications shown in Table 3, a number of variables are not
significant, notwithstanding theoretical conjectures that they could be important. These
include the stated financial risk profile of the survey participants and the self-assessed
relative earnings. Furthermore, access to financial services, financial literacy, gender,
- 15 -
employment status, household size, and education were not strongly related with interest
in the PLS product after controlling for other factors.
Conclusion
The Centra survey results provide a first look into demand for PLS in America.
While merely demonstrating expressed (as opposed to revealed) demand, the results are
still promising on a few dimensions. First, among the low income population we studied,
there was substantial interest in a savings product that provides prizes as part of its return.
Second, this product appeals to non-savers, who do not save with traditional products.
Third, the product appeals to heavy lottery players, and by virtue of this fact, has the
potential of turning their gambling activities into demand for savings.
As promising as we find this analysis, it is important to keep in mind the uphill
battle that PLS products face in the US due significantly to well-established gambling
and lottery industries that might oppose PLS and the roadblocks due to legal uncertainty
and prohibitions around this new product. Furthermore, businesses or state treasurers
might be reluctant to innovate around a product that must compete against heavily
marketed alternatives. Nevertheless, our preliminary PLS findings suggest that the
product is promising, despite the formidable barriers to its success in the US.

- 16 -
Sources
Agarwal, S., Driscoll, J., Gabaix, X. and Laibson, D. (2007) "The Age of Reason: Financial Decisions Over the Lifecycle". MIT Department of Economics Working Paper No. 07-11 Available at SSRN: http://ssrn.com/abstract=973790
Campbell, J. (2006) “Household Finance.” The Journal of Finance, Vol. LXI, No. 4,
August. Cole, S., Tufano, P., Schneider, D., and Collins, D. (2007) "First National Bank's Golden
Opportunity,” Harvard Business School Case 208-072. Consumer Federation of America (2006) "How Americans View Personal Wealth vs.
How Financial Planners View This Wealth." Consumer Federation of America, Washington, D.C.
Guillen, M. and Tschoegl, A. (2002) “Banking on Gambling: Banks and Lottery-Linked
Deposit Accounts,” Journal of Financial Services Research, Vol. 21, No. 3. Holton, L. (2000) "Redefining the Rainy Day." American Demographics 22:6. Kearney, M. (2005) "The Economic Winners and Losers of Legalized Gambling."
National Tax Journal, 58:281-302. Lange, M. (2007) “States That Allow Gambling Soak the Poorest Residents,” Deseret
Morning News, May 6. Lobe, Sebastian and Alexander Hölzl. 2007. "Why are British Premium Bonds so
Successful? The Effect of Saving With a Thrill." Available at SSRN: http://ssrn.com/abstract=992794
Mabuza, E. (2007) “FNB ‘Lottery’ Still on Pending New Appeal.” Business Day
(Johannesburg), April 18. Maynard, N. (2007) “Prize-Based Savings: Product Innovation to Make Saving Fun”
Doorways to Dreams Fund Report. Available at http://www.d2dfund.org/downloads/2007_12_PrizeBasedSavings-CreditUnions-Final.pdf (visited January 22, 2008).
National Gambling Impact Study Commission. June 18, 1999. National Gambling Impact
Study Final Report. Washington DC. Odean, T. and Barber, B. (2001) "Boys will be Boys: Gender, Overconfidence, and
Common Stock Investment,” Quarterly Journal of Economics, February, Vol. 116, No. 1, 261-292.

- 17 -
Pfiffelmann, M. (2006) “Which optimal design for LLDAs?” Laboratoire de Recherche en Gestion et en Economie Working Paper 2006-78.
Puri, M. and Robinson, D. (2007) “Optimism and Economic Choice.” Journal of
Financial Economics, 86: 71-99.
Tufano, P. (2008) “Saving whilst Gambling: An Empirical Analysis of U.K. Premium Bonds.” American Economic Review, May 2008 (Papers and Proceedings).
Tufano, P. and Schneider, D. (2007) “Using Financial Innovation to Support Savers:
From Coercion to Excitement.” Forthcoming in Access, Assets and Poverty, ed. Rebecca Blank and Michael Barr (Russell Sage).
- 18 -
0%
10%
20%
30%
40%
50%
60%
70%
Non-saver Saver
Su
rve
y p
art
icip
an
ts w
ith
sta
ted
in
tere
st
in P
LS
(%
)
Saving habits
Figure 1: PLS Consumer Demand and Saving Habits
0%
10%
20%
30%
40%
50%
60%
70%
80%
$0 $1 - $2,000 $2,001-$5,000 $5,001-$10,000 $10,001-$20,000
$20,001-$40,000
Above $40,000
Su
rve
y p
art
icip
an
ts w
ith
sta
ted i
nte
rest
in P
LS
(%
)
Savings assets
Figure 2: PLS Consumer Demand and Savings Assets

- 19 -
0%
10%
20%
30%
40%
50%
60%
70%
80%
>$100 in past 6 months <100$ in past 6 months
Su
rve
y p
art
icip
an
ts a
nd
sta
ted
in
tere
st
in P
LS
(%
)
Lottery spending
Figure 3: PLS Consumer Demand and Lottery Spending
0%
10%
20%
30%
40%
50%
60%
70%
Improve About the Same Worse
Su
rve
y p
art
icip
an
ts w
ith
sta
ted
in
tere
st
in P
LS (
%)
Future income expectations
Figure 4: PLS Consumer Demand and Future Income Expectations

- 20 -
0%
10%
20%
30%
40%
50%
60%
70%
80%
18-24 25-34 35-44 45-54 55-64 65+
Su
rve
y p
art
icip
an
ts w
ith
sta
ted
in
tere
st
in P
LS
(%
)
Age
Figure 5: PLS Consumer Demand and Age

- 21 -
Table 1. Demographic characteristics of Clark County, Indiana versus USA, 2006 Census
Clark County USA
POPULATION 103,569 299,398,485 INCOME AND BENEFITS (IN 2006 INFLATIONADJUSTED DOLLARS) Total households 44,464 111,617,402 Less than $10,000 3,565 8% 8,898,696 8% $10,000 to $14,999 2,885 6% 6,639,877 6% $15,000 to $24,999 5,832 13% 12,721,628 11% $25,000 to $34,999 5,920 13% 12,446,822 11% $35,000 to $49,999 7,864 18% 16,511,457 15% $50,000 to $74,999 8,458 19% 21,221,889 19% $75,000 to $99,999 5,968 13% 13,214,551 12% More than $100,000 3,972 9% 19,962,482 18% Median household income $41,719 $48,451 Mean household income $50,860 $65,527 EDUCATIONAL ATTAINMENT Population 25 years and over 70,693 195,932,824 Less than 9th grade 3,294 5% 12,743,555 7% 9th to 12th grade, no diploma 8,789 12% 18,502,540 9% High school graduate (includes equivalency) 26,147 37% 59,123,954 30% Some college, no degree 16,908 24% 38,185,678 19% Associate's degree 4,856 7% 14,486,202 7% Bachelor's degree 7,568 11% 33,496,187 17% Graduate or professional degree 3,131 4% 19,394,708 10% MARITAL STATUS Males 15 years and over 40,116 116,327,232 Never married 11,675 29% 39,401,560 34% Now married, except separated 21,609 54% 60,955,218 52% Separated 774 2% 2,194,345 2% Widowed 1,665 4% 2,959,354 3% Divorced 4,393 11% 10,816,755 9%
Females 15 years and over 43,252 122,258,450 Never married 10,642 25% 33,385,649 27% Now married, except separated 20,167 47% 59,211,138 48% Separated 1,491 3% 3,210,647 3% Widowed 5,326 12% 12,223,537 10% Divorced 5,626 13% 14,227,479 12% RACE White 91,844 89% 221,331,507 74% Black or African American 7,557 7% 37,051,483 12% American Indian and Alaska Native 87 0% 2,369,431 1% Asian 228 0% 13,100,095 4% Hispanic or Latino (of any race) 2,760 3% 44,252,278 15% Source: http://factfinder.census.gov/ (last visited on December 6, 2007)

- 22 -
Table 2. Results from the Centra Credit Union survey in Clarksville, Indiana, November-December 2006 Shows the number and percentage results of the survey broken down by the characteristics of the respondents. The survey question asked: "Would you be interested in a savings account that awarded chances to win prizes based on the amount of money you save? The account would also have no fees, no minimum balance, and still earn interest."
Percentage of Group by Preference
Sample
(number) Yes, I’m
interested No. I’m not interested
Don’t know
All Respondents: 547 58% 26% 16%
Respondents by characteristics: Saving habits Non-saver1 331 65% 21% 14% Saver 215 48% 33% 19%
Savings assets $0 55 58% 29% 13% $1 - $2,000 144 73% 15% 13% $2,001-$5,000 80 61% 28% 11% $5,001-$10,000 54 56% 26% 19% $10,001-$20,000 59 54% 20% 25% $20,001-$40,000 44 66% 20% 14% Above $40,000 94 38% 41% 20%
Earnings relative to Clarksville, IN population
Substantially more 31 48% 39% 13% Little more 112 58% 25% 17% About the same 262 59% 26% 15% Little less 94 56% 24% 19% Substantially less 42 62% 24% 14%
Future income expectations Improve 392 65% 20% 15% About the Same 126 41% 40% 19% Worse 27 33% 44% 22%
Lottery spending More than $100 in past 6 months 59 75% 15% 10% Less than 100$ in past 6 months 488 56% 27% 17%
Investment risk profile
High financial risk profile 25 72% 24% 4% Above average financial risk profile 67 61% 27% 12% Average financial risk profile 217 59% 24% 18% No financial risk 232 54% 28% 17%
Financial services Banked2 431 58% 26% 17% Unbanked 112 62% 25% 13% Financial literacy3 More literate 225 56% 28% 16% Less literate 320 59% 24% 16%

- 23 -
Table 2 (continued) Percentage of group by preference
Sample
(number) Yes, I’m interested
No. I’m not interested
Don’t know
All Respondents 547 58% 26% 16% Age groups 18-24 74 74% 14% 12% 25-34 87 59% 23% 18% 35-44 120 68% 16% 17% 45-54 135 58% 25% 17% 55-64 81 42% 43% 15% 65+ 49 37% 47% 16%
Gender Male 160 62% 26% 13% Female 386 56% 26% 18%
Employment status Full-Time 315 63% 20% 17% Part-Time 56 63% 30% 7% Student 13 38% 23% 38% Retired 79 44% 41% 15% Work in the Home 24 50% 33% 17% Unemployed 60 57% 28% 15%
Marital Status Married 255 51% 30% 18% Living with a partner 65 68% 15% 17% Widowed 28 50% 39% 11% Divorced 78 58% 28% 14% Separated 23 74% 9% 17% Never Married 98 68% 19% 12%
Education No high school degree 40 55% 25% 20%
High school degree 199 62% 24% 15% Some College 157 59% 24% 18% Associate and technical degree 70 59% 24% 17%
College and postgraduate degree 81 49% 37% 14%
Household size
Household with 5 or more members 73 52% 22% 26%
Household with 4 members 77 69% 16% 16%
Household with 3 members 115 60% 23% 17%
Household with 2 members 184 52% 34% 14%
Household with 1 member 98 64% 24% 11%

- 24 -
Notes to Table 2
1 Savers are those survey participants that show saving habits that are indicative of some form of savings plan. This could be saving habits that save income of one family member, that spend regular income but save other forms of income, or save regularly by putting money aside each month. Non-savers are survey participants that have no regular savings plan by either spending more than their income or about as much as their income.
2 Banked are those survey participants that cash most of their checks at either a bank or a credit union. Unbanked are those participants that typically cash checks at either cashing outlets, grocery stores, Wal-Mart, convenience stores, or any other way.
3 Participants deemed more financially literate are considered to be those survey participants that knew the answer to the following question: "Imagine that the interest rate on your savings account was 1% per year and inflation was 2% per year. After 1 year, would you be able to buy more than today, exactly the same as today, or less than today with the money in this account?"

- 25 -
Table 3. Multivariate logistic regression of expressed interest in Centra Credit Union PLS account on demographic and socio-economic characteristics.
The full sample compares those expressing a positive interest to all others (that are those without an interest and those selecting “don’t know” as their interest). The sample “expressing opinions” excludes those who selected “Don’t know.” The discrete variables that were omitted for fixed effects can be identified by comparison with Table 2. This table produces odds ratios with levels of statistical significance indicated as follows: *** p<0.01, ** p<0.05, * p<0.1. Variable Full sample Sample expressing
Opinions Saving habits Non-saver1 1.687 ** 1.834 ** Savings assets $0 1.523 1.004 $1 - $2,000 2.456 ** 2.184 * $2,001-$5,000 1.561 1.272 $5,001-$10,000 1.258 1.198 $10,001-$20,000 1.341 1.528 $20,001-$40,000 2.409 ** 2.453
Earnings relative to Clarksville, IN population
Substantially more 0.672 0.420 Little more 0.848 0.673 About the same 0.871 0.716 Little less 0.829 0.776
Future income expectations Improve 2.108 *** 2.454 *** Worse 0.641 0.748 Lottery spending More than 100$ in past 6 months 2.893 *** 2.578 **
Financial risk profile
High financial risk 1.741 1.093 Above average financial risk 1.232 0.880 Average financial risk 1.266 1.201
Financial services Banked2 0.832 0.837 Financial literacy3 Less financially literate 1.141 1.243 Age groups 25-34 0.548 0.461 35-44 0.931 0.916 45-54 0.635 0.519 55-64 0.440 * 0.315 ** 65+ 0.445 0.354 Gender Male 0.896 0.799

- 26 -
Table 3 (continued) Employment status Full-Time 1.126 1.309 Part-Time 1.294 0.876 Marital Status Widowed 1.066 0.910 Divorced 1.096 1.110 Separated 2.400 9.255 ** Never Married 1.099 1.079 Education
High school degree 1.083 0.967 Some college 0.839 0.760 Associate and technical degree 0.633 0.428 College and postgraduate degree 0.885 0.736
Household size
Large household (5 or more members) 0.858 0.959 Observations 511 430 Pseudo R2 0.128 0.174 1 Savers are those survey participants that show saving habits that are indicative of some form of savings plan. This could be saving habits that save income of one family member, that spend regular income but save other forms of income, or save regularly by putting money aside each month. Non-savers are survey participants that have no regular savings plan by either spending more than their income or about as much as their income.
2 Banked are those survey participants that cash most of their checks at either a bank or a credit union. Unbanked are those participants that typically cash checks at either cashing outlets, grocery stores, Wal-Mart, convenience stores, or any other way.
3 Participants deemed more financially literate are considered to be those survey participants that knew the answer to the following question: "Imagine that the interest rate on your savings account was 1% per year and inflation was 2% per year. After 1 year, would you be able to buy more than today, exactly the same as today, or less than today with the money in this account?"

- 27 -
Appendix: Survey Question 1 Do you currently have an account at Centra Credit Union? A. Yes B. No Question 2 Would you be interested in a savings account that awarded chances to win prizes based on the amount of money you save? The account would also have no fees, no minimum balance, and still earn interest? A. Yes B. No C. Don’t know Question 3 Over the last six months, where did you go to cash most of your checks? A. Credit Union B. Bank C. Check Cashing Outlet D. Grocery Store E. Wal-Mart F. Convenience Store G. Other Question 4 Which of the following statements best describes your saving habits?
A. Usually spend more than income B. Usually spend about as much as income C. Save whatever is left over at the end of the month--No regular plan D. Save income of one family member, spend the other E. Spend regular income, save other income F. Save regularly by putting money aside each month
Question 5 Some investments offer higher returns but are more risky. Risk means you could lose some of the money you invested. Which of the statements below best describes the amount of financial risk that you [and your spouse] are willing to take when you save or make investments?
A. Take substantial risks expecting to earn substantial returns B. Take above average financial risks expecting to earn above average returns. C. Take average financial risks expecting to earn average returns. D. Not willing to take financial risks.

- 28 -
Question 6 If you [and your spouse] were to add up all of your savings accounts and financial assets today (including checking, savings, and money market accounts; CDs; IRAs; 401(k)s; 403(b)s; Keoghs; Mutual Funds; Savings Bonds; Stocks; Bonds; or any cash saved at home), approximately how much would they amount to?
A. $0 B. $1 to $2,000 C. $2001 to $5,000 D. $5001 to $10,000 E. $10,001 to $20,000 F. $20,001 to $40,000 G. Above $40,000
Question 7 Imagine that the interest rate on your savings account was 1% per year and inflation was 2% per year. After 1 year, would you be able to buy more than today, exactly the same as today, or less than today with the money in this account? [Or you don’t know?] A. More than today B. Exactly the same C. Less than today D. Don’t Know Question 8 Relative to all the people here in Clarksville and around this area, do you think you earn substantially more, a little more, about the same, a little less, or substantially less? A. Substantially more B. Little more C. About the same D. Little less E. Substantially less Question 9 I'd like to ask you about your expectations for the future. Over the next five years, do you expect your financial well being to improve, become worse, or remain the same as it has over the previous five years? A. Better B. Worse C. About the same Question 10 Where do you go for the latest news and traffic updates?
A. Internet B. Cell Phone C. Radio D. TV E. Newspaper
Question 11 Which radio station do you listen to most?
A. 840 AM (WHAS) B. 97.5 (WAMZ) C. 90.9 (WKUE) D. 105.1 (WLRS) E. 102.3 (WXMA) F. Other G. I don't listen to the radio

- 29 -
Question 12 Which newspaper do you read most often?
A Louisville Courier-Journal B. Jeffersonville Evening News C. New Albany Tribune. D. Other local paper E. Other national paper F. I don't read the newspaper
Question 13 If you read the newspaper, which section do you like the most?
A. Main News B. Sports C. Life Style D. Velocity / Entertainment E. Editorial
Questions 14-18 (HAVE THE SAME ANSWER CHOICES)
A. Yes, regularly B. Yes, somewhat regularly C. Yes, but rarely D. No
Question 14 Do you play scratch-offs or pull tabs? Question 15 Do you play games like Daily 3, Daily 4, Lucky 5, Pick 3, or Pick 4? Question 16 Do you play the Lottery, such as Hoosier Lottery, Kentucky Cash, or Powerball? Question 17 Do you play games or slots at riverboat casinos? Question 18 Do you bet on horse-racing? Question 19 In the last six months, about how much do you think you have spent on these games?
A. $0 B. Less than $50 C. $50-$100 D. $101-200 E. $201 +
Question 20 What is your age group?
A. 18-24 B. 25-34 C. 35-44 D. 45-54 E. 55-64 F. 65 +

- 30 -
Question 21 Are you currently married, living with a partner, separated, divorced, widowed, or have you never been married?
A. Married B. Living with a partner C. Widowed D. Divorced E. Separated F. Never Married
Question 22 How many people [including YOURSELF] live in your household?
A. 1 B. 2 C. 3 D. 4 E. 5+ (Five or More)
Question 23 What was your last grade completed?
A. Less than high school B. High school C. Some college D. Associates degree E. Bachelors F. Post-Graduate degree G. Technical degree
Question 24 Are you employed:___________?
A. Full time B. Part time C. I’m a student D. I'm a retired E. I work in the home
F. Unemployed
![Deutsche Tax Saving Fund - Kotak Mahindra Bank · Deutsche Tax Saving Fund [An Equity Linked Savings Scheme (ELSS)] Deutsche Tax Saving Fund is an open ended equity linked saving](https://img.dokumen.tips/doc/110x75/5f020ac97e708231d40249fb/deutsche-tax-saving-fund-kotak-mahindra-deutsche-tax-saving-fund-an-equity-linked.jpg)


![Untitled-1 [] · Two 1st & tour 2nd prize 1st prize & one 2Mi prize 1st prize 2nd prize 2nd prize 1st prize 1st prize 1st prize ... One Gou and a one Silver rvÞdal in Kota & Kumata](https://img.dokumen.tips/doc/110x75/5e8e6ac11f64bb4cdd67c7a4/untitled-1-two-1st-tour-2nd-prize-1st-prize-one-2mi-prize-1st-prize.jpg)