Embed Size (px)
Citation preview

Construction industry study Implications for cost escalation in road building, maintenance and operation
NZIER final report to the Ministry of Transport, November 2013


L13 Grant Thornton House, 215 Lambton Quay | PO Box 3479, Wellington 6140 Tel +64 4 472 1880 | [email protected]
© NZ Institute of Economic Research (Inc) 2013. Cover image © Dreamstime.com NZIER’s standard terms of engagement for contract research can be found at www.nzier.org.nz.
While NZIER will use all reasonable endeavours in undertaking contract research and producing reports to ensure the
information is as accurate as practicable, the Institute, its contributors, employees, and Board shall not be liable (whether in
contract, tort (including negligence), equity or on any other basis) for any loss or damage sustained by any person relying on
such work whatever the cause of such loss or damage.
About NZIER
NZIER is a specialist consulting firm that uses applied economic research and analysis to provide a wide range of strategic advice to clients in the public and private sectors, throughout New Zealand and Australia, and further afield.
NZIER is also known for its long-established Quarterly Survey of Business Opinion and Quarterly Predictions.
Our aim is to be the premier centre of applied economic research in New Zealand. We pride ourselves on our reputation for independence and delivering quality analysis in the right form, and at the right time, for our clients. We ensure quality through teamwork on individual projects, critical review at internal seminars, and by peer review at various stages through a project by a senior staff member otherwise not involved in the project.
Each year NZIER devotes resources to undertake and make freely available economic research and thinking aimed at promoting a better understanding of New Zealand’s important economic challenges.
NZIER was established in 1958.
Authorship This paper was prepared at NZIER by Nick Allison and Chris Parker. It was quality approved by Jean-Pierre de Raad.
The assistance of Simon Whiteley GHD, Michael Bealing, Killian Destremau, Shamubeel Eaqub, Sarah Spring and Jessica Mathewson is gratefully acknowledged.
Thanks We wish to thank the organisations and stakeholders that supplied us with data and discussed their thoughts with us. These include Ministry of Transport, NZ Transport Agency, Ministry of Business, Innovation and Employment, Treasury, Roading NZ, NZ Contractors Federation, Auckland Transport, and a range of stakeholders in the physical works sector.
NZIER report – Civil construction industry study i
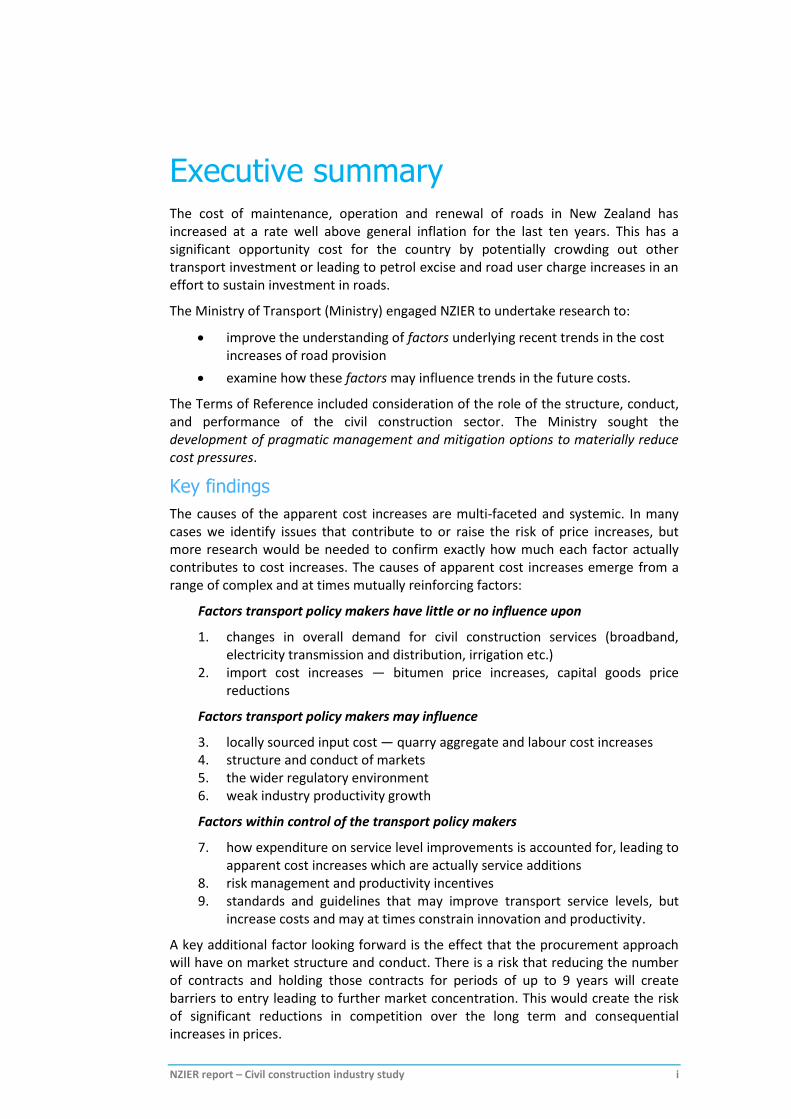
Executive summary The cost of maintenance, operation and renewal of roads in New Zealand has increased at a rate well above general inflation for the last ten years. This has a significant opportunity cost for the country by potentially crowding out other transport investment or leading to petrol excise and road user charge increases in an effort to sustain investment in roads.
The Ministry of Transport (Ministry) engaged NZIER to undertake research to:
improve the understanding of factors underlying recent trends in the cost increases of road provision
examine how these factors may influence trends in the future costs.
The Terms of Reference included consideration of the role of the structure, conduct, and performance of the civil construction sector. The Ministry sought the development of pragmatic management and mitigation options to materially reduce cost pressures.
Key findings
The causes of the apparent cost increases are multi-faceted and systemic. In many cases we identify issues that contribute to or raise the risk of price increases, but more research would be needed to confirm exactly how much each factor actually contributes to cost increases. The causes of apparent cost increases emerge from a range of complex and at times mutually reinforcing factors:
Factors transport policy makers have little or no influence upon
1. changes in overall demand for civil construction services (broadband, electricity transmission and distribution, irrigation etc.)
2. import cost increases — bitumen price increases, capital goods price reductions
Factors transport policy makers may influence
3. locally sourced input cost — quarry aggregate and labour cost increases 4. structure and conduct of markets 5. the wider regulatory environment 6. weak industry productivity growth
Factors within control of the transport policy makers
7. how expenditure on service level improvements is accounted for, leading to apparent cost increases which are actually service additions
8. risk management and productivity incentives 9. standards and guidelines that may improve transport service levels, but
increase costs and may at times constrain innovation and productivity.
A key additional factor looking forward is the effect that the procurement approach will have on market structure and conduct. There is a risk that reducing the number of contracts and holding those contracts for periods of up to 9 years will create barriers to entry leading to further market concentration. This would create the risk of significant reductions in competition over the long term and consequential increases in prices.

NZIER report – Civil construction industry study ii
Unpacking contributions to cost increases
It is not possible to unpack the contributions of the above factors to increasing costs for variety of reasons, in particular a lack of information. For example, it is not possible to separate out the underlying cost escalation in the road programme from costs arising from service level improvements in the programme.
Also, markets for road maintenance are materially shaped by local rather than national factors and thus drivers of cost escalation can vary significantly between and within regions. We make several recommendations on improving the quality of information provided to the market.
Four of the factors discussed above represent policy and funding levers as depicted in Figure 1. These are within the control of national and local transport policy makers. They can be used to influence construction sector performance and output price pressures. We have based our recommendations around strengthening these levers and ensuring information is available to support the functioning of a healthy civil construction sector market.
Figure 1 The influence of policy levers on cost escalation
Source: NZIER
Performance and productivity
Recent measurement adjustments by Statistics New Zealand have revised the picture of declining productivity in the construction sector. While there are still challenging measurement issues, it appears the productivity performance of the sector has flat-lined for 20 years and there is still a growing productivity deficit relative to Australia; there is scope for improvement. The productivity performance is likely to have its root cause in a range of systemic issues, rather than under-investment in capital.
The civil construction sector is closely coupled to government as central and local government are by far the major purchasers of civil works. Government policies, regulations and procurement systems influence the productivity performance of the
Service level
improvements
Performance incentives
Standards and innovation
Procurement strategy
Policy and funding levers
Industr
y s
tructu
re a
nd
conduct
Pro
ductivity p
erf
orm
ance
Cost e
scala
tio
n
Market information
Regulatory environment

NZIER report – Civil construction industry study iii
sector. Improving performance therefore requires a coordinated approach between government and the industry.
Service level improvement
NZTA and local authorities have made substantial investments in improving service levels on the road network over the last decade. Examples include installing crash barriers, widening road shoulders and adding skid resistant pavements, and investing in traffic management systems. These investments benefit road users; however they can also increase future maintenance and network operation costs.
Service level investments are not easily visible within the activity outputs classes that form the basis of national funding. This makes it difficult to identify the drivers of cost increases. Local authorities, on the other hand, have been required to distinguish between service level improvements and investment in new capacity-driven additional demand since 2002. We recommend the activity classes for the national funding of roads is changed to make investment in service level improvements more transparent, and that a consistent approach is taken between central and local government.
This recommendation is not just about an improved visibility of cost escalation; it is about facilitating more strategic investment choices. The Government could, for example, consider pulling back on service level improvements to fund new capacity expansion, or mitigate excise increases. Managing budgets on service level improvements could support better scrutiny of their value for money also.
Risk management and productivity incentives
Unlike many other sectors in the economy, the land transport construction sector has been insulated from inflationary pressures by the contractual policy framework of road controlling authorities. Road contractors are comprehensively compensated for movement in input prices, including the cost of labour. This is likely to dampen performance incentives throughout the entire construction market supply chain.
Other jurisdictions focus cost compensation on a few inputs with volatile world prices such as bitumen. As far we have been able to ascertain, international practice is for transport departments to stand in the market as last resort insurers of unforeseeable prices shocks, for example input price changes exceeding 15% arising from unforeseeable market disruptions. Normal price risks are shared along supply chains maintaining risk management and productivity incentives.
While precise price compensation reimbursement figures for New Zealand are not available, annual payments could exceed $130 million and are likely to affect industry conduct and performance. If a change of policy led to even a small gain in productivity of, say, 0.5% per annum this could be worth $5 billion in present value terms over 30 years; a 1% p.a. sustained productivity improvement would correspond to $10 billion in benefits.
These benefits do not rely on who covers price inflation — RCAs or contractors — as this is a transfer; the benefits arise from incentivising risk management behaviours that improve long-term productivity. We recommend the contract input price indexation policy be reviewed without delay.

NZIER report – Civil construction industry study iv
Standards and innovation
There are 533 active standards and guidelines on the NZTA “register process manual for network standards and guidelines”. The standards and guidelines often come in the form of manuals of detailed standards and guidance, developed through a consultative process with local authorities and industry. They can contain many specific technical standards, manufacturing processes and work procedures.
NZIER was advised by the construction industry that the standards can act as significant constraint on productivity performance and contribute significantly to cost escalation. The industry scores poorly in national measures of innovation. It is, however, important to recognise properly constructed and managed standards systems can also have productivity benefits for the economy, and benefit road users.
We were not able to verify claims that cost escalation is caused by enhanced standards, due to data constraints. However, it appears that it is much easier to establish a standard than vary it. We note that standards are not routinely subject to cost-benefit analysis, although a business case and cost-benefit analysis is required to justify variations during projects. This kind of rigidity in allowing variations in the way standards apply does not support innovation, which is the engine for productivity improvement.
We recommend changes are made to the standard and guidelines processes to ensure that the value for money of new and existing standards is robustly and transparently demonstrated to road users and ratepayers, and that more rapid innovation is supported.
The most important challenge is to create on-going mechanisms that promote and facilitate industry innovation in applying standards to support continuous productivity improvement.
Industry structure
Our key findings on the structure of markets are:
the size of firms (by employees) in the New Zealand civil sector is proportionally much larger than their counterparts in Australia
markets such as roads physical works, aggregates, and asphalt are localised, not national, and they differ by the type of road physical works and by the value of the contract
only two roads physical works providers (Fulton Hogan and Downer EDI Works) have a presence across the country; the rest compete regionally, and some regions have dominant players that are unique to their regions
the asphalt market is highly concentrated (often only one or two regional suppliers), as is the bitumen storage supply. The concrete sector is a duopoly with some contestability evident from imports
nearly all regions have highly concentrated roads physical works markets, and this industry concentration has increased over the last 15 years
at a gate value of over $200 million a year aggregate is a more important input in the supply chain than has been commonly understood, and can double in cost after 30 km of cartage

NZIER report – Civil construction industry study v
the quarry market is local and highly concentrated, and concentration has increased over the last decade. This has occurred through acquisitions, quarry closures and the regulatory environment making it harder to open and operate quarries
there is a possible correlation between quarry market concentration and the extent of aggregate price increases that should be researched further
there is a high degree of vertical integration (i.e. the same players throughout the supply chain), and this has generally increased in recent years (Bay of Plenty is a notable exception).
Market concentration is not sufficient to demonstrate market power or its misuse, because other factors can discipline prices in principle. However, it is often associated with market power, and the increase in market concentration has increased over the same period that the civil construction sector’s performance has flat-lined relative to Australia’s continued improvement.
The extent of vertical integration is such that it risks increasing concentration, and thus market power, at each level of the supply chain, with negative consequences in other sectors of the economy too (such as commercial and residential construction).
Conduct of markets
Our key findings on the conduct of markets are:
the conduct of roads physical works suppliers is opaque, and the understanding of the operation and conduct of markets as a whole is poor
we constructed a database of tender information from manual reporting of some 75 road controlling authorities that covers 15 years of data from 1995/96 to 2009/10. However, there are questions about the accuracy, completeness, and timeliness of the data; for instance we can account for only $11.5 billion of spending, which is about half of what was actually spent. Data for 2010/11 onwards has been unavailable
thus there are significant knowledge deficiencies about how much work each roads physical works supplier gets; for what kind of work; what is subcontracted to whom; or who else is bidding and how
competition, as measured by numbers of tenders, appears to have decreased since 2004/05 for contracts above $4 million
to accurately assess the level of competition in the road markets would require a substantial improvement of the current national tender database
there is evidence that smaller firms have successfully entered local markets and challenged major incumbents.
Our findings on the risk of collusion and tacit collusion are:
the conditions that support cartels generally hold in the New Zealand roads physical works markets, particularly for larger scale works
the breadth, quality, and necessary timeliness of the national tender data is insufficient to monitor, identify and action suspected bid rigging.
NZIER report – Civil construction industry study vi
It is important to note that our research should not be read as having identified collusion or even possible industry collusion; this kind of investigation was not within the scope of the research.
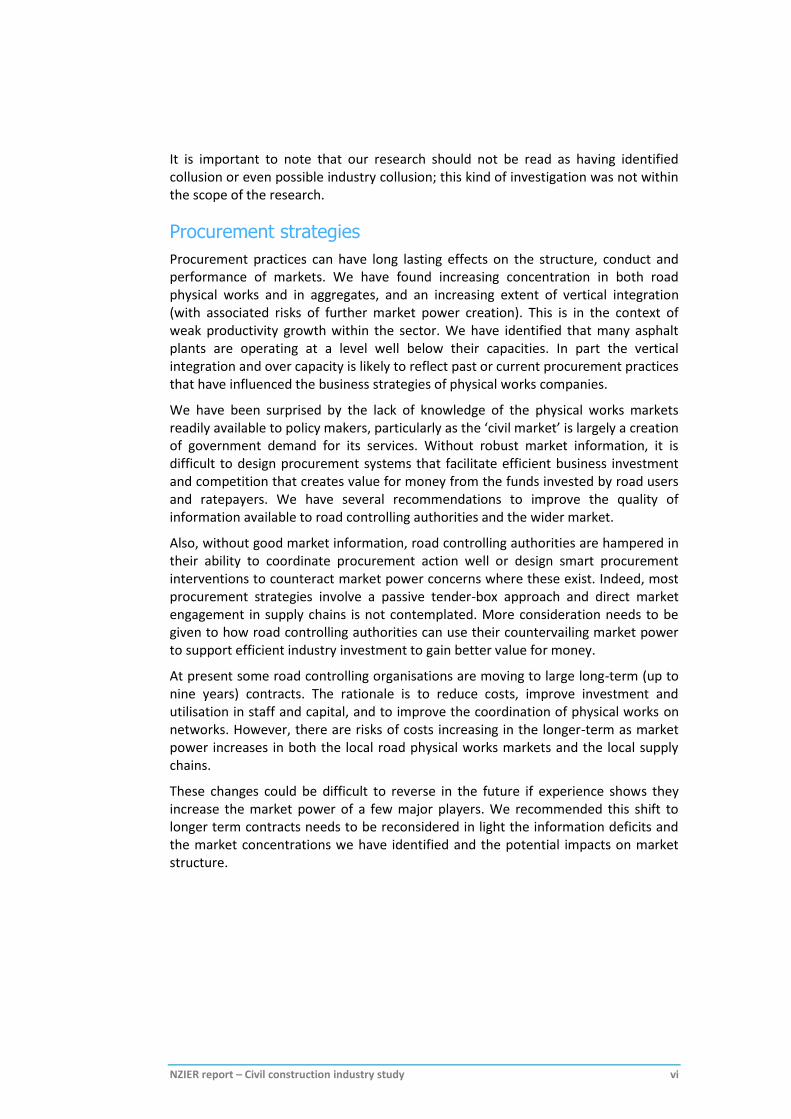
Procurement strategies
Procurement practices can have long lasting effects on the structure, conduct and performance of markets. We have found increasing concentration in both road physical works and in aggregates, and an increasing extent of vertical integration (with associated risks of further market power creation). This is in the context of weak productivity growth within the sector. We have identified that many asphalt plants are operating at a level well below their capacities. In part the vertical integration and over capacity is likely to reflect past or current procurement practices that have influenced the business strategies of physical works companies.
We have been surprised by the lack of knowledge of the physical works markets readily available to policy makers, particularly as the ‘civil market’ is largely a creation of government demand for its services. Without robust market information, it is difficult to design procurement systems that facilitate efficient business investment and competition that creates value for money from the funds invested by road users and ratepayers. We have several recommendations to improve the quality of information available to road controlling authorities and the wider market.
Also, without good market information, road controlling authorities are hampered in their ability to coordinate procurement action well or design smart procurement interventions to counteract market power concerns where these exist. Indeed, most procurement strategies involve a passive tender-box approach and direct market engagement in supply chains is not contemplated. More consideration needs to be given to how road controlling authorities can use their countervailing market power to support efficient industry investment to gain better value for money.
At present some road controlling organisations are moving to large long-term (up to nine years) contracts. The rationale is to reduce costs, improve investment and utilisation in staff and capital, and to improve the coordination of physical works on networks. However, there are risks of costs increasing in the longer-term as market power increases in both the local road physical works markets and the local supply chains.
These changes could be difficult to reverse in the future if experience shows they increase the market power of a few major players. We recommended this shift to longer term contracts needs to be reconsidered in light the information deficits and the market concentrations we have identified and the potential impacts on market structure.

NZIER report – Civil construction industry study vii
Recommendations
The Ministry for Transport has sought an improved understanding of the factors underlying recent cost pressures in roading, and pragmatic policy measures for the mitigation and management of future cost increases. Our recommendations are:
1. Restructure activity classes: modify the National Land Transport Fund activity class structure to identify expenditure in the following categories:
operations
maintenance
renewals
service level improvements to road users
capacity expansion to meet increased demand.
2. Disclose market information routinely: regularly publish information in a readily accessible format on the state and performance of the local and state highway physical works markets, including:
analysis of national and regional tender outcomes, including market shares categorised by kind of work
value of work allocated through contract variations and indexation annually
materials (including bitumen, asphalt, aggregate, and concrete) supply chain price ranges and regional variations
market shares and industry concentration metrics at a national and regional level, including subcontracted work
market benchmark information on the costs per lane km for different profiles of roads (e.g. rural/urban split)
occasional and relevant market survey data, for example information on skilled labour supply and demand outlook.
This information will help enable the Road Maintenance Taskforce’s drive to improve the capability of benchmarking road asset performance.
3. Improve monitoring for the possibility of collusion: the monitoring system of tender data should be markedly improved and promptly analysed for the possibility of collusion.
4. Expose suppliers to market price signals: the practice of compensating suppliers for input price change should be reviewed, with the aim of moving towards compensating only for very large and uncontrollable price disruptions, as is common overseas.
5. Improve practice for standards and guidelines: all new and existing national network standards and guidelines should be subjected to cost-benefit analysis, and a mechanism to promote industry innovation in the way standards are applied should be established.
6. Review procurement strategies in light of their impact on the structure, conduct and performance of localised markets: plans to shift to smaller numbers of all-encompassing long-term maintenance and operations contracts should be reconsidered, unless impacts on markets have been adequately assessed and measures have been taken to mitigate risks.
NZIER report – Civil construction industry study viii
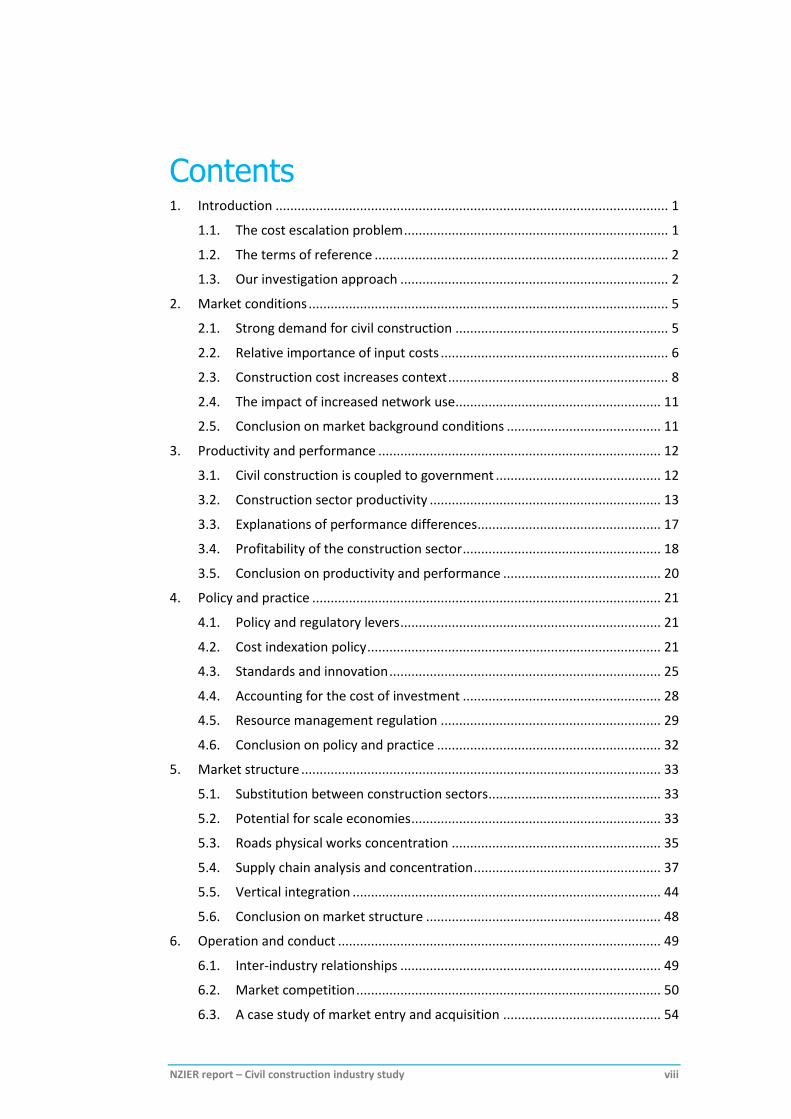
Contents 1. Introduction ........................................................................................................... 1
1.1. The cost escalation problem ........................................................................ 1
1.2. The terms of reference ................................................................................ 2
1.3. Our investigation approach ......................................................................... 2
2. Market conditions .................................................................................................. 5
2.1. Strong demand for civil construction .......................................................... 5
2.2. Relative importance of input costs .............................................................. 6
2.3. Construction cost increases context ............................................................ 8
2.4. The impact of increased network use ........................................................ 11
2.5. Conclusion on market background conditions .......................................... 11
3. Productivity and performance ............................................................................. 12
3.1. Civil construction is coupled to government ............................................. 12
3.2. Construction sector productivity ............................................................... 13
3.3. Explanations of performance differences .................................................. 17
3.4. Profitability of the construction sector ...................................................... 18
3.5. Conclusion on productivity and performance ........................................... 20
4. Policy and practice ............................................................................................... 21
4.1. Policy and regulatory levers ....................................................................... 21
4.2. Cost indexation policy ................................................................................ 21
4.3. Standards and innovation .......................................................................... 25
4.4. Accounting for the cost of investment ...................................................... 28
4.5. Resource management regulation ............................................................ 29
4.6. Conclusion on policy and practice ............................................................. 32
5. Market structure .................................................................................................. 33
5.1. Substitution between construction sectors ............................................... 33
5.2. Potential for scale economies .................................................................... 33
5.3. Roads physical works concentration ......................................................... 35
5.4. Supply chain analysis and concentration ................................................... 37
5.5. Vertical integration .................................................................................... 44
5.6. Conclusion on market structure ................................................................ 48
6. Operation and conduct ........................................................................................ 49
6.1. Inter-industry relationships ....................................................................... 49
6.2. Market competition ................................................................................... 50
6.3. A case study of market entry and acquisition ........................................... 54

NZIER report – Civil construction industry study ix
6.4. Monitoring of collusion .............................................................................. 55
6.5. Procurement policy and practice ............................................................... 57
6.6. Conclusion on conduct ............................................................................... 62
7. Bibliography ......................................................................................................... 63
Figures
Figure 1 The influence of policy levers on cost escalation .......................................................... ii Figure 2 Unit costs vs general price level inflation ...................................................................... 1 Figure 3 NZIER market structure, conduct and performance model........................................... 3 Figure 4 Construction expenditures ............................................................................................ 5 Figure 5 National Land Transport Fund (NLTF) investment in roads ........................................... 6 Figure 6 Quarry output values ..................................................................................................... 8 Figure 7 Capital goods price index relative to 2000 .................................................................... 9 Figure 8 Bitumen and aggregate price indices compared to CPI ............................................... 10 Figure 9 Change in prices for aggregate by region .................................................................... 10 Figure 10 Vehicle kilometres travelled by heavy and light vehicles .......................................... 11 Figure 11 Heavy and civil sector sales income and infrastructure expenditure ........................ 12 Figure 12 Construction labour productivity: NZ & Australia ..................................................... 15 Figure 13 Australia - New Zealand comparison input cost increases ........................................ 16 Figure 14 Material costs in Australia and New Zealand 2012 ................................................... 17 Figure 15 Construction profit margin (2005-2011).................................................................... 18 Figure 16 Changes in income and expenses .............................................................................. 19 Figure 17 Compensation price trigger points in US states ........................................................ 24 Figure 18 Survey of information and communications technology outcomes .......................... 28 Figure 19 Change in number of quarries 1998 – 2011 .............................................................. 30 Figure 20 Industry changes in freight intensity 1996 - 2007 ..................................................... 31 Figure 21 Average firm size by subsector (2012) ....................................................................... 34 Figure 22 Regional HHI change for roads physical works markets ............................................ 36 Figure 23 HHI for roads physical works markets 2007–2010 .................................................... 37 Figure 24 Regional HHI change for quarries .............................................................................. 41 Figure 25 Increase in quarry concentration in Hawke’s Bay ..................................................... 42 Figure 26 Correlation of HHI and price increase for quarries .................................................... 43 Figure 27 New Zealand cement market share estimate ............................................................ 44 Figure 28 Regional vertical integration index — roads and quarries ........................................ 46 Figure 29 Regional vertical integration — roads, quarries, asphalt ......................................... 47 Figure 30 Regional road market concentration and vertical integration .................................. 48 Figure 31 Market differentiation by size and number of bids ................................................... 52 Figure 32 Average tender numbers by contract size annually .................................................. 52 Figure 33 Gisborne market shares ............................................................................................. 54

NZIER report – Civil construction industry study x
Tables
Table 1 Input weights for construction and maintenance in Australia ....................................... 7 Table 2 Labour productivity: New Zealand versus Australia in 2011......................................... 15 Table 3 Mean wage earnings 2000-2012 ................................................................................... 19 Table 4 Illustration of proposed activity class structure of infrastructure expenditure ............ 29 Table 5 Construction sector firm size Australia and New Zealand ............................................ 34 Table 6 Bitumen installations facility ownership ....................................................................... 38 Table 7 Asphalt plants ............................................................................................................... 40 Table 8 Top three suppliers in each region, and the change over time .................................... 53 Table 9 Conditions that support cartels .................................................................................... 56 Table 10 Asphalt plant capacities .............................................................................................. 58

NZIER report – Civil construction industry study 1
1. Introduction
1.1. The cost escalation problem The cost of maintenance, operation and renewal of roads in New Zealand has increased more than the general inflation rate for the last ten years. Figure 2 shows the divergence of maintenance, operations and renewals compared to inflation. Expressed in per kilometre of network terms, the costs have increased by 58%, while consumer prices have increased by 28% over 10 years.
Figure 2 Unit costs vs general price level inflation
Nominal terms
Source: NZIER, Statistics NZ Consumer Price Index, NZ Transport Agency
The comparison to the rate of consumer price inflation (CPI) provides a useful reference or benchmark point against which to consider the scale of the cost increases. It illustrates how the road maintenance, operations and renewal costs have moved relative to the bundle of other costs faced by the typical household.
This escalation imposes an opportunity cost on society by either reducing other transport investment or increasing rates, fuel excise duties and road user charges. The Government has recently decided to increase petrol excise at three cents annually for three years to meet the current and future costs of transport construction, maintenance, operations, and renewal.
0%
10%
20%
30%
40%
50%
60%
02/03 03/04 04/05 05/06 06/07 07/08 08/09 09/10 10/11 11/12
State highway MOR per km ($)
Local road MOR per km ($)
CPI inflation

NZIER report – Civil construction industry study 2
1.2. The terms of reference The Ministry for Transport (the Ministry) has sought an improved understanding of the factors underlying recent cost pressures in ‘roading provision’, and possible options for mitigating or better managing these cost pressures.
NZIER was asked to research sources of road construction cost pressures and have regard to the role of the:
market structure and operation of the construction industry
degree of factor substitutability within the construction sub-sectors
interaction between construction cycles and cost escalation
effects of procurement practice and regulatory regimes.
We were asked to identify and recommend pragmatic policy measures for the mitigation and management of future cost increases.
1.3. Our investigation approach We applied a market structure, conduct and performance framework (see Figure 3). The model provides a framework for systematically examining:
market background conditions shaping demand and supply, for example, understanding government demand for civil construction and identifying the contribution of international and domestic cost pressures
construction industry structure describing issues such as how industry vertical integration and market concentration might affect performance
conduct such as competition, acquisitions and market entry
performance of the sector, such as productivity and profit margins
the role of public policy in shaping the market, such as health and safety guidelines, resource management regulatory requirements, and procurement practices.
The framework includes feedback loops between each component. The report is broadly structured around this framework, but we take some liberty to reorder component parts so that we can communicate the most coherent story possible.
In applying the model we focused on the materiality of:
internal factors – within industry or government control or influence
external factors – outside industry’s ability to control or influence
location factors – that shape the mobility of factors of production.
This emphasis supplemented the conduct and performance model and assisted us to identify practical mitigation and management options. The research used a wide array of quantitative data sets supplemented with industry interviews.

NZIER report – Civil construction industry study 3
Figure 3 NZIER market structure, conduct and performance model
The report focuses on the most relevant aspects of this framework that have an evidence base.
Source: NZIER
Product innovation
Product differentiation and service bundling
Profitability
Innovation
PerformanceAllocative efficiency
Productive efficiency
Profitability
Innovation
Dynamic efficiency
Product variety
Export/import substitution
ConductPricing and output
Bidding strategies
Investment
R&D
Market entry and mergers
Input substitution
Competitive behaviour
StructureSegmentation of sub-sectors
Seller concentration
Buyer concentration
Scale / scope economies
Barriers to entry
Product differentiation
Vertical integration
Location of the factors of
production
Public policyLand Transport Management Act
Procurement practice
Resource Management Act
Occupation Safety and Health
regulations
Competition policy
Tax policy
Standards
Background conditions
Demand Supply
Price elasticity Geography
Income elasticity Technology
Variability Transport costs
Geography Import potential
Entry, exit and consolidation

NZIER report – Civil construction industry study 4
1.3.1. Caveats on combining disparate data
To analyse and shed light on the issues, we have purchased customised data sets from Statistics New Zealand, combined data sets from different sources, and developed new metrics of analysis.
An important caveat with disparate data sources is that they are not always directly comparable. Rather than judging this as a weakness, we view it as strength as it provides new insights and raises new policy issues and further research questions. We have stated our assumptions and uncertainties concerning the use of various data sets throughout the report.
Also, regardless of their rigour, official statistics can cause confusion due to changes in standards or classifications. For example, revisions to productivity statistics following the adoption of new industrial classification1 lead to some aspects of construction that were previously counted in government investment or in property services to be counted in the construction sector. As a result, construction sector productivity estimates were revised from showing a slump in recent years, to a flat line performance.
1.3.2. Report structure
The report begins on the subject of the background conditions that have affected cost escalation before considering performance, including productivity. This helps to set the scene and motivation for the remainder of the report. We then consider public policy settings that may have influenced performance, prior to discussion of market structure and conduct issues.
1 To ANZSIC06.

NZIER report – Civil construction industry study 5
2. Market conditions
2.1. Strong demand for civil construction The construction sector accounts for 9% of gross domestic product. It contains around 49,000 business enterprises, and has an employee head count of approximately 118,000 staff. The majority of employees are found in construction services accounting for 54% of employees. The next largest employer is the civil construction sector (24%), followed by residential building (13%) and non-residential building (8%).2
Figure 4 Construction expenditures
Annual expenditure expressed in 2012/13 prices, March years
Source: Statistics NZ gross domestic product expenditure on construction
Figure 4 provides a profile of how annual expenditure has varied across the construction sub-sectors (residential, non-residential and civil) across the period 1989 – 2013. Over the last 12 years several confounding influences have contributed to increased demand-side pressure in the construction market. The main contributing factors in overall demand for construction were:
steady to strong economic growth 2000 – 2007
buoyant commercial sector construction through to 2006/07
housing boom, followed by the crash in building consents in 2008
rapid growth in government expenditure on road infrastructure from 2004/05 through to 2010/11, and now continuing to expand
2 Statistics New Zealand Expenditure on Gross Domestic Product actual volume series expressed in 1995/96 prices.
$0
$2
$4
$6
$8
$10
$12
1989 1991 1993 1995 1997 1999 2001 2003 2005 2007 2009 2011 2013
Bill
ion
s, $
Residential Construction
Non-residential Construction
Civil Construction*
*Road, rail and electricity and other civil infrastructure

NZIER report – Civil construction industry study 6
$5 billion transmission grid upgrade (2006/07 onwards), followed by $1.35 billion support for ultra-fast broadband which is still on-going3
Christchurch earthquake response and the rebuild now coming on-stream.
The civil construction sector grew relative to the residential and non-residential construction sectors from 1989 to 2012, increasing from 19% to 33% of total construction expenditure. The non-residential construction share of total expenditure decreased from 40% to 29% and residential building decreased from 41% to 38%. Civil construction shifted from the smallest share of the market to being in second place just behind residential building.
Central government investment in road infrastructure increased from $800 million to around $2 billion between 2000/01 and 2011/12 (Figure 5).
Figure 5 National Land Transport Fund (NLTF) investment in roads
Millions, nominal. Note the NLTF expenditure does not include the local government share.
Source: Ministry of Transport, NZ Transport Agency, NZIER
Overall government investment in the transport sector (including passenger transport) equated to only 1% of GDP in 1999/2000, but by 2010/11 it equated to nearly 2% of GDP. The total NLTF is programing in the order of $12.2 billion for the period of 2012-2015, which is 13% more than invested in the 2009-2012 period.4
2.2. Relative importance of input costs Understanding the sources of programme cost escalation requires an understanding of the relative importance of inputs to the construction and maintenance of roads. We found that labour, capital equipment, aggregate, and bitumen and asphalt are the most important elements. Aggregate is more important in understanding costs than seems to have been previously understood.
3 The Business Growth Agenda Progress Reports ‘Building Infrastructure’ 2012, page 8, 21.
4 The Business Growth Agenda Progress Reports ‘Building Infrastructure’ 2012, page 8.
NZIER report – Civil construction industry study 7
It has not been straightforward to identify the proportions of different input costs in road maintenance and construction to ascertain their relative importance. We reviewed estimates of input cost contributions to road projects provided in the 2009 Ministerial Advisory Group Report, the recent Road Maintenance Taskforce report, and those implied by the NZTA contract cost compensation indices, based on several Statistics New Zealand indices.
We found all of these lacking either in coverage or specificity of cost contributions relevant to understanding sources of possible cost increases. For instance, while we agree with the Taskforce estimate that around $200 million is spent on bitumen this equates to only 13% of national expenditure on maintenance and renewals. The Taskforce report was silent on the role of aggregate and it did not cover items such as plant and equipment hire.
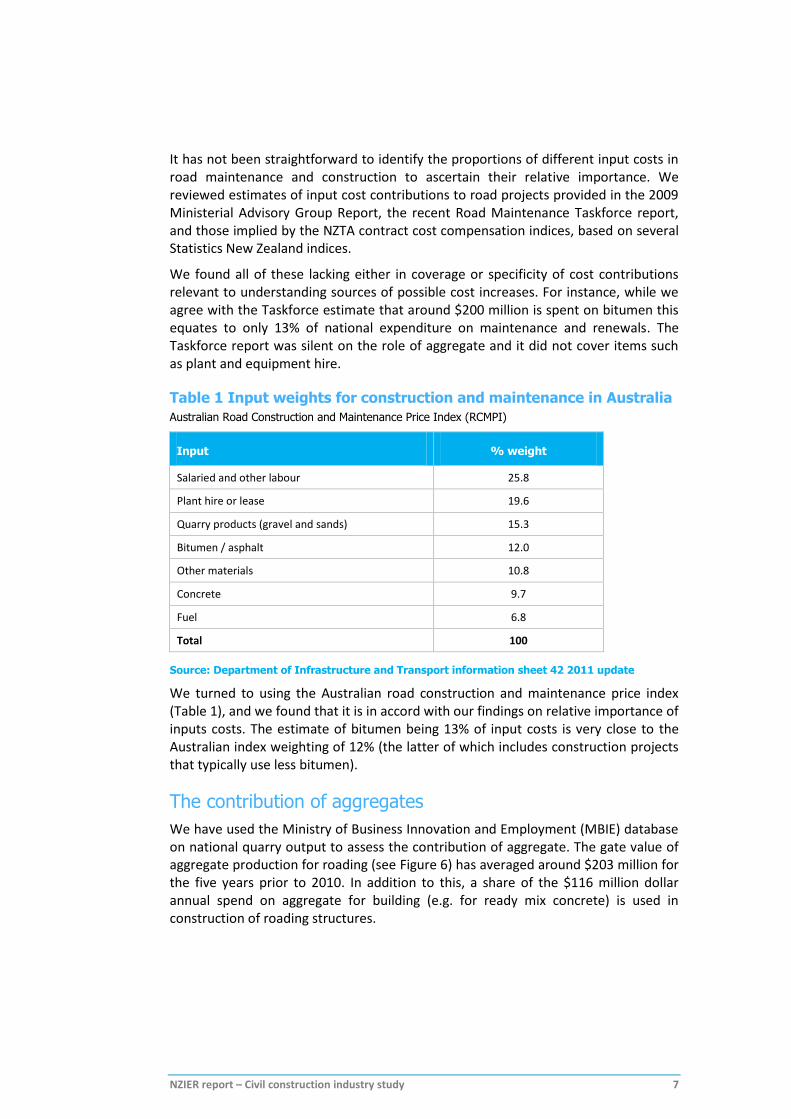
Table 1 Input weights for construction and maintenance in Australia
Australian Road Construction and Maintenance Price Index (RCMPI)
Input % weight
Salaried and other labour 25.8
Plant hire or lease 19.6
Quarry products (gravel and sands) 15.3
Bitumen / asphalt 12.0
Other materials 10.8
Concrete 9.7
Fuel 6.8
Total 100
Source: Department of Infrastructure and Transport information sheet 42 2011 update
We turned to using the Australian road construction and maintenance price index (Table 1), and we found that it is in accord with our findings on relative importance of inputs costs. The estimate of bitumen being 13% of input costs is very close to the Australian index weighting of 12% (the latter of which includes construction projects that typically use less bitumen).
The contribution of aggregates
We have used the Ministry of Business Innovation and Employment (MBIE) database on national quarry output to assess the contribution of aggregate. The gate value of aggregate production for roading (see Figure 6) has averaged around $203 million for the five years prior to 2010. In addition to this, a share of the $116 million dollar annual spend on aggregate for building (e.g. for ready mix concrete) is used in construction of roading structures.

NZIER report – Civil construction industry study 8
Figure 6 Quarry output values
Based on gate prices
Source: Ministry of Business Innovation and Employment
The importance of the cost of aggregate to roading is multiplied through supply chains due to cartage costs. The industry rule of thumb is that the delivered the price of aggregate is twice that of the quarry gate price if it is carted 30 km. As aggregate is used in the production of asphalt (largely a mix of aggregate and bitumen) the delivered cost of asphalt also increases relatively quickly as it travels further.5
2.3. Construction cost increases context The drivers of cost increases cannot be explained as simply being due to the general level of price inflation or increases in international oil prices. Figure 7 shows that the real6 costs of transport equipment and plant, which are largely imported, have been falling. However, the local cost of civil construction and land improvements have not followed this pattern suggesting domestic input cost pressures. Nor have these sub-sectors followed the downturns in residential and non-residential building price pressures.
5 Roading New Zealand describes that because of better manufacturing technologies and modern handling methodologies,
the distance asphalt can be transported is now greatly extended. An example of this is that while there is an asphalt plant in Greymouth, where significant quantities are required on the West Coast, it is usually sourced from one of the Christchurch plants. The same plant happens to service the Ashburton market, where there are three local, but small, production facilities.
6 That is, net of general price inflation.
-
50
100
150
200
250
300
350
400
450
1998 1999 2000 2001 2002 2003 2004 2005 2006 2007 2008 2009 2010 2011
$ M
illio
ns
Value of Rock, sand and gravel for roading Value of Rock, sand and gravel for building
Value of Rock, sand, gravel and clay for fill Value of Protection and Reclamation

NZIER report – Civil construction industry study 9
Figure 7 Capital goods price index relative to 2000
Source: Statistics NZ, NZIER
2.3.1. Key input cost increases
The industry stressed in interviews that labour was one of the largest sources of input cost increase, which we confirm in section 3.4 when discussing changes in industry profit margins.
As shown in Figure 8, bitumen and aggregate prices have tracked above CPI for significant periods. Between 2002 and 2011 the bitumen price index increased by 140%. During the same period the CPI increased by 28% (2.8% p.a.). So the cost of bitumen increased more than 4 times faster than consumer prices per annum. Over the period of 2002 to 2011 the cost of aggregate increased by an average 4.2%, which is also above the rate of inflation.

NZIER report – Civil construction industry study 10
Figure 8 Bitumen and aggregate price indices compared to CPI
% change in the price indices relative to 2002
Source: NZIER, Statistics NZ CPI, MBIE annual quarry survey, NZ Transport Agency bitumen
cost index
Although aggregate prices increased at national level, increases varied considerably between regions as depicted in Figure 9. This variation is relevant in considering the effects of industry concentration, vertical integration, and reducing number of major quarries considered in later sections of the report.
Figure 9 Change in prices for aggregate by region
Price per cubic metre of roading aggregate (at the quarry gate)
Source: NZIER using MBIE annual quarry survey data
-40%
-20%
0%
20%
40%
60%
80%
100%
120%
140%
160%
2002 2003 2004 2005 2006 2007 2008 2009 2010 2011
CPI NZIER Quarry Price Index NZTA Bitumen Cost Index
$-
$2
$4
$6
$8
$10
$12
$14
$16
$18
$20
1998-2001 2007-2010
NZIER report – Civil construction industry study 11
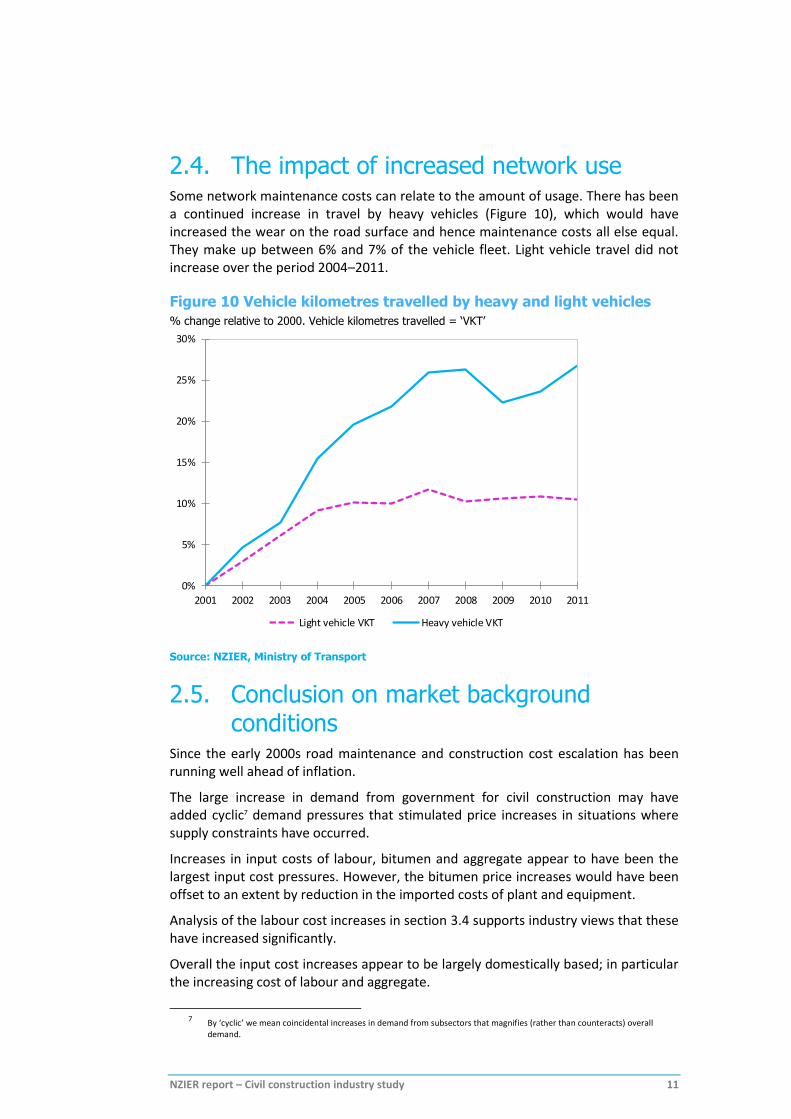
2.4. The impact of increased network use Some network maintenance costs can relate to the amount of usage. There has been a continued increase in travel by heavy vehicles (Figure 10), which would have increased the wear on the road surface and hence maintenance costs all else equal. They make up between 6% and 7% of the vehicle fleet. Light vehicle travel did not increase over the period 2004–2011.
Figure 10 Vehicle kilometres travelled by heavy and light vehicles
% change relative to 2000. Vehicle kilometres travelled = ‘VKT’
Source: NZIER, Ministry of Transport
2.5. Conclusion on market background conditions
Since the early 2000s road maintenance and construction cost escalation has been running well ahead of inflation.
The large increase in demand from government for civil construction may have added cyclic7 demand pressures that stimulated price increases in situations where supply constraints have occurred.
Increases in input costs of labour, bitumen and aggregate appear to have been the largest input cost pressures. However, the bitumen price increases would have been offset to an extent by reduction in the imported costs of plant and equipment.
Analysis of the labour cost increases in section 3.4 supports industry views that these have increased significantly.
Overall the input cost increases appear to be largely domestically based; in particular the increasing cost of labour and aggregate.
7 By ‘cyclic’ we mean coincidental increases in demand from subsectors that magnifies (rather than counteracts) overall
demand.
0%
5%
10%
15%
20%
25%
30%
2001 2002 2003 2004 2005 2006 2007 2008 2009 2010 2011
Light vehicle VKT Heavy vehicle VKT

NZIER report – Civil construction industry study 12
3. Productivity and performance Increases in civil construction productivity are required if consumers (road users and ratepayers) are to receive continually improving service at least cost. To tackle productivity performance we begin by recognising the large role government plays in the sector, prior to considering how the firms themselves are performing.
3.1. Civil construction is coupled to government
The civil construction sector is heavily underpinned by central and local government purchases. How government goes about engaging with the civil construction sector is therefore a key determinant of performance and profitability of the sector.
Expenditure on road infrastructure and local authority infrastructure services (water, waste water solid waste) make up about half of total civil construction spending, and about 60% by 2010/11 (Figure 11). Add to this spending by crown agencies and companies in electricity transmission, rail line improvements and ultrafast broadband, and government becomes a much more significant buyer of civil construction than is shown in Figure 11.
Figure 11 Heavy and civil sector sales income and infrastructure expenditure
$ Millions
Source: NZIER, Statistics NZ local authority financial statistics, Ministry of Transport, NZ
Transport Agency
Central government expenditure is an increasingly important for the civil sector, with the NLTF share of heavy and civil construction sector sales income having increased
0%
10%
20%
30%
40%
50%
60%
70%
80%
90%
$0
$1,000
$2,000
$3,000
$4,000
$5,000
$6,000
$7,000
$8,000
$9,000
2005/06 2006/07 2007/08 2008/09 2009/10 2010/11
Local authority expenditure* (LHS)
Total NLTF spending on road infrastructure (LHS)
Total heavy and civil sector income (LHS)
Local authority* and NLTF expenditure as a % of civil construction sales (RHS)
*Expenditure on local roads, water supply, waste water, property, environmental protection and solid waste.

NZIER report – Civil construction industry study 13
from 24% in 2004/05 to 34% by 2010/11. In this context, NZTA’s procurement and infrastructure standards policies can also shape or influence how local authorities operate in the other civil sector sub-sectors. For example adoption of NZTA traffic safety management systems for broadband cable duct and pipe installation in roads.
3.2. Construction sector productivity There is an extensive literature on New Zealand productivity, with some of it analysing or commenting on construction sector productivity.8 Findings for the construction sector are generally that it:
performs poorly relative to other NZ industry for both labour productivity and multi-factor productivity9
has deteriorating relative productivity performance over time (note this work was prior to recent official statistics revisions used in this report)
performs poorly relative to the industry in Australia and the UK.
As noted in section 1.3.1 recent revisions to the way in which the construction sector is defined have changed the productivity picture from showing a slump in recent years, to a flat-line performance. While this shows an improved performance picture, it still appears to underperform compared to other sectors.
GDP output growth in the construction industry has averaged 1.7% per year, with both labour and capital input driving this growth, contributing 0.9% and 0.8% per year, respectively over 15 years to 2011. However, labour productivity growth in the construction sector was the second lowest of all measured sector industries, rising at 0.5% per year, and its growth in multi-factor productivity was negligible.
3.2.1. Productivity measurement issues
It is important to note that published productivity data do not provide sufficient detail to understand the causes and consequences of productivity performance within the civil construction sector. Construction productivity estimates are for the entire sector at the national level. However, productivity could vary significantly at a regional level due to, for example, supply chain transport costs. Thus detailed sub-sector analysis needs to be treated with caution.
8 2025 Taskforce, 2010 Focusing on Growth, Second Report, Treasury, Wellington
Mason, Geoff & M Osborne, 2007, “Productivity, Capital-intensity and Labour Quality at Sector Level in New Zealand and the UK”, WP 07/01, Treasury,
NZIER, 2011, “Industry productivity and the Australia-New Zealand income gap”, NZIER Working Paper 2011/3, NZIER, Wellington.
NZIER, 2011, “Construction productivity: An evidence base for research and policy issues”. NZIER report to the Building & Construction Sector Productivity Partnership 2 July 2013
Statistics NZ and MSI, 2011, Research and Development in New Zealand: 2010, Statistics New Zealand, Wellington.
Davis, Nick, 2007, Construction Sector Productivity Scoping Report, Martin Jenkins, Wellington.
9 ‘Multi-factor productivity is also known as ‘total factor productivity’, and it relates to the contribution of technological progress to economic growth. This is where more can be achieved with the same combination of inputs of given productivities.
NZIER report – Civil construction industry study 14
Isolating components of construction sector productivity
Cohen (2012)10 outlines problems with the ability of official statistics to accurately isolate civil construction data from data relevant to the rest of industry, and the recent revision to statistics data provide a good example of this problem. This civil sector is also dependent on inputs from mining (quarry aggregate) and the transport and storage sectors. So the choice of ‘sector’ definition will influence measurement results.
Roading New Zealand (Olsen 2010) suggests that labour productivity in the ‘road sub-sector’ increased by 23% from 2000/01 to 2008/09. Olsen used NZTA and local road expenditures and assumed that maintenance is twice as labour intensive as construction to allocate labour against expenditures. This is a reasonable attempt to try and isolate road sub-sector performance within the civil construction sector.
However, such an increase in the road sub-sector productivity, given its share of the civil sector, then implies a substantial reduction in productivity of ‘other’ heavy and civil engineering construction. This result seems unlikely as firms that undertake road maintenance are very often the same firms undertaking other infrastructure works in the road corridor, using the same staff and sometimes common equipment. Isolating labour productivity ‘road sector’ is fraught with difficulties.
Improvements in asset quality are not measured well
Productivity measures also fail to pick up improvements in the quality of assets produced by the civil sector. So while maintenance and renewals costs have been escalating, this could be justified if it leads to extended asset lives or lower maintenance requirements.
We discussed this possibility with NZTA and gained input from GHD experts. We found disagreement over whether asset lives are being extended and there is little consensus on the matter. In part this is because road asset managers tend to be risk averse, and thus make early maintenance interventions to avoid asset degradation. As such it is difficult to gauge if asset life is extending.
3.2.2. Productivity comparison with Australia
To abstract from the detailed problems with measurement, it is useful to benchmark performance against Australia. If a very large gap in performance emerges, using the same official metrics, then this provides a useful point of comparison to try and understand causes of performance differences. It also provides a useful set of goal posts against which to target performance improvement.
Construction productivity growth in New Zealand is about half the rate of Australia. Over the 15 years to 2011 (which is the period where reliable data overlaps) construction labour productivity growth averaged 0.8% p.a. in New Zealand, whereas it was 1.6% p.a. in Australia.
10 Cohen, Claire (2012) Productivity in Civil Construction: A Contracting Industry Perspective, New Zealand Contractors
Federation.

NZIER report – Civil construction industry study 15
Figure 12 Construction labour productivity: NZ & Australia
Index, 1989=1000. Australia only included from 1995
Source: Statistics New Zealand, ABS, NZIER estimates for 2012 and 2013
We also compared the labour productivity between the two countries for construction sub-sectors (Table 2). This shows that:
the New Zealand construction sector suffers from a productivity deficit relative to Australia (13% to 28% behind), which is similar to the productivity deficit observed between the two economies as a whole (16% to 30% behind)
the heavy and civil is the worst productivity performer within the construction sector (at 33% – 44% behind).
Table 2 Labour productivity: New Zealand versus Australia in 2011
Gross valued added, $000 per employee, unless otherwise stated
Australia NZ NZ % difference
NZ$ PPP NZ$ @0.83 NZ$ NZ$ PPP NZ$ @0.83
All 89 107 75 -16% -30%
Construction 86 104 75 -13% -28%
– Building construction
114 137 84 -26% -39%
– Heavy and civil 115 139 77 -33% -44%
– Construction services
74 89 70 -6% -22%
Source: ABS, Statistics NZ, RBNZ, NZIER11
11 Notes: (1) the PPP exchange rate estimated by the OECD is close to 1; (2) we convert the A$ values using the long run
average NZD/AUD exchange rate of 0.83.
900
1000
1100
1200
1300
1400
1500
1600
1978 1983 1988 1993 1998 2003 2008 2013
New Zealand Australia

NZIER report – Civil construction industry study 16
3.2.3. Price comparison with Australia
Patterns of pricing across regions or internationally can shed some light on overall market performance. Australia appears to have faced similar road construction and maintenance input price pressures as New Zealand (Figure 13). This comparison provides another useful benchmark. It is important to note that the indices are not identical in their composition and they provide only indicative information on the relative price pressures.
Figure 13 Australia - New Zealand comparison input cost increases
Percentage change relative 2002, year ending June
Source: NZIER, NZTA cost of construction indices, Statistics NZ, Departure of Infrastructure
and Transport Australia
Accurate data on civil construction input costs that control for different quality and compositions is difficult to obtain. In the absence of such, we sourced a number of key material inputs used in the industry from various sources (Figure 14). We find that New Zealand prices (at $NZ PPP equivalent) appear to be close to or within the range observed in Australia, but concrete paving prices New Zealand appear to be higher.
0%
5%
10%
15%
20%
25%
30%
35%
40%
45%
50%
2002 2003 2004 2005 2006 2007 2008 2009 2010 2011
NZTA construction and maintenance Index
BITRE road construction and maintence index

NZIER report – Civil construction industry study 17
Figure 14 Material costs in Australia and New Zealand 2012
In situ cost per unit ($NZ, PPP equivalent)
Source: NZIER, Rawlinsons and OECD
The material prices are ‘in situ’ (as constructed) and are thus not tradable commodities, containing substantial non-traded local inputs. To the extent that New Zealand’s material costs are higher, the country’s international competitiveness with Australia is reduced. This is because infrastructure costs ultimately feed into the cost of producing exports. We note however, more comprehensive benchmarking of material prices is required to draw firm conclusions on country differences.
3.3. Explanations of performance differences Previous research by NZIER12 showed that 70% of the aggregate gap in productivity between Australia and New Zealand is due to underperformance of New Zealand’s industries, rather than a difference in the industrial structure of the two countries. New Zealand’s principal problem is multifactor productivity — the quality of management, organisational innovation, the production process, and the quality of labour and capital. Simply investing in more capital may not lead to significant productivity improvements.
Indeed we show in section 6.5.1 that asphalt plants across the country are operating at levels well below their capacities, and in section 4.3 we show that the construction industry as a whole performs poorly in terms of innovation measures. The analysis points to more systemic causes of performance including:
procurement systems and policies used by the public sector
availability of market information on which industry can base investment decisions and government agencies develop procurement strategies
the regulatory and legal environment in which the sector operates
public sector rules governing work practices and infrastructure standards
weak industry management skills and capabilities
12 NZIER, 2011, “Industry productivity and the Australia-New Zealand income gap”, NZIER Working Paper 2011/3, NZIER,
Wellington. http://nzier.org.nz/publications/industry-productivity-and-the-australia-new-zealand-income-gap-nzier-working-paper-2011
0
10
20
30
40
50
60
70
80
90
100
Au
s
NZ
Au
s
NZ
Au
s
NZ
Au
s
NZ
Au
s
NZ
Au
s
NZ
Basecourse(sqm)
Asphalt (sqm) Chipseal (sqm) Pre-cast culvet(100mm)
Kerb & channel(m)
Concretepaving (sqm)

NZIER report – Civil construction industry study 18
industry structure and transport logistics.
We explore many of these areas in later sections of the report and focus on those areas where policy changes might be able to improve performance.
3.4. Profitability of the construction sector Profit margins13 rise and fall with economic cycles and can also be indicative of the ability of firms to raise prices in response to cost pressures.
Figure 15 presents the profit margins for construction subsectors over the period 2005 – 2011. The profit margins of the heavy and civil and construction-services sectors are suggestive of limited competitive pressure. However, the margins fell substantially after the global financial crisis and from our discussions with industry we understand civil margins are still relatively low compared to the past levels.
The only information we have available on the profitability of quarrying comes from analysis of Input-Output Tables 2007, which suggests profit margins of around 20%; higher than margins in the construction sectors. There is no information available on the profitability of asphalt plants, which are owned by road construction companies.
Figure 15 Construction profit margin (2005-2011)
PBT/Operating sales
Source: Statistics New Zealand, NZIER
13
Defined as profit before tax as a ratio of sales
0%
2%
4%
6%
8%
10%
12%
14%
16%
18%
20%
2005 2006 2007 2008 2009 2010 2011
Residential Building Non-residential Building
Heavy and civil Construction services

NZIER report – Civil construction industry study 19
3.4.1. Civil sector profit margin falls
The fall in margins appears to stem from continued wage bill growth occurring in the absence of firms generating sufficient labour productivity to offset this. As presented in Figure 16, firms appear to have lacked the flexibility to cut operating expenses or contain wage growth in the context of slow income growth. A possible explanation is that maybe firms sought to retain more expensive and experienced staff, while waiting for the economy to pick up again. Further research would be needed to understand the cause of this increase in wage growth.
Figure 16 Changes in income and expenses
2005 -2011
Source: NZIER, Statistics NZ Annual Enterprise Survey
Of note, wages in the civil construction sector have increased by more than all industries (63% compared to 53% see Table 3).
Table 3 Mean wage earnings 2000-2012
Source: NZIER, Statistics NZ Linked Employer-Employee Dataset
+5%
+42%
+22%
-16%
-57%
-80% -60% -40% -20% 0% 20% 40% 60%
Total income
Salaries and wages
Operating costs
Other expenses
Surplus before income tax
Mean earnings growth 2000-2012 Relative % change since 2000
Equivalent annual growth rate (%)
Residential building construction 59% 3.7%
Non-residential building construction
63% 3.8%
Heavy and civil engineering construction
63% 3.8%
All industries 53% 3.3%
NZIER report – Civil construction industry study 20
3.5. Conclusion on productivity and performance
Our key conclusions on productivity and performance are:
labour productivity improvements in the civil construction sector in New Zealand have lagged behind the rest of our economy and behind improvements in the Australian civil construction sector (which tellingly may have faced similar input cost pressures, such as for bitumen)
there are significant measurement issues that limit our ability to neatly dissect and analyse the performance of sub-sectors within civil construction
civil sector operating profit margins have declined significantly as firms have been unable to contain wage growth and operating costs
the civil construction is dominated by government investment and its performance is likely to be dependent on how government goes about investing in infrastructure.
The causes of the lacklustre productivity performance are likely to arise from systemic issues. These may relate to industry structure, management skills or to factors outside of the control of the industry such as government regulation.

NZIER report – Civil construction industry study 21
4. Policy and practice Policies, regulation and practices are influential in shaping construction sector conduct and performance. We saw in section 3.1 the reliance the civil construction sector has on government investment expenditure. What government decides to invest in and how government decides to procure influences and may sometime constrain the performance of the civil construction sector.
4.1. Policy and regulatory levers Policy and regulatory levers that influence performance include:
financial assistance rate policy, under which central government funds local road works at an average rate of 50%
NZTA and local authority procurement policies and strategies
health and safety regulation that compels employers to take reasonable steps to ensure a safe working environment
resource management planning and consenting regulatory regimes operated by local authorities
NZTA and local authority standards and guidelines.
Procurement policy is covered in section 6.5 when we discuss conduct. It was not possible, within the scope of this research, to investigate the influence of all of the policy and regulatory levers. We focussed on areas that:
we assessed had the potential to materially affect productivity; or
industry advised are significant drivers of costs increases and
are within control of transport policy makers and are not currently being addressed.
This meant that while we report on, for example, the impacts of the Resource Management Act, we do not recommend any mitigation and management action as substantial legislative change is already underway.
4.2. Cost indexation policy NZTA and local authorities compensate suppliers for national average changes in the cost of their inputs. They appear to believe that it is cheaper for government to carry the risk of changes in the market prices for inputs, than it is for suppliers.
If we assume the indexation policy is applied as stated to the National Land Transport Programme, this is equivalent to paying out up to $130 million per annum for notional price increases.14
The indexation policy potentially distorts market price signals, which is likely to have a material impact on conduct and performance. This is because input price
14 The data on annual contract compensation payments is not publicly available, but applies to most contracts. We assumed the
average index movement of 4.5% that has occurred over the last 5 years, and that all contracts received this regardless of duration. We understand the default is to index contracts but there is not reliable information available on exceptions to this policy. Thus the $130 million is a maximum as we can’t take into account exceptions. The estimate excludes public transport and other expenditures that may also be indexed, but fall outside of the road expenditure that uses civil construction sector services.

NZIER report – Civil construction industry study 22
movements, such as wage and salary movements, should be linked directly to the productivity of labour within the sector. The index not only uncouples this relationship — it also dilutes market incentives to efficiently manage risk.
4.2.1. The cost indexation policy
The cost index that is used to adjust the payments to suppliers is based on fluctuations in the average cost of labour and materials. Quarterly indices have been developed for each of the following kinds of contract using data published by Statistics NZ:
maintenance
construction
resealing
bridges
professional services
public transport services.
In principle, contract cost compensation works in two ways — contractors are compensated for inflation, and when prices fall (i.e. deflation) they are paid less. In practice, however, with few exceptions, inflation of input costs has been the norm since 2000. We also note that the indices used do not appear to contain price changes for imported plant and equipment, which, as outlined in chapter 3, have consistently fallen for over a decade.
NZTA’s guidance on applying cost indexation has changed from being a procurement option in 1997 (Transfund) to a recommended best practice by 201115. This practice is now applied to the majority, if not all, state highway and local road contracts longer than a year in duration.
4.2.2. Policy rationale for cost indexation
The indexation policy largely mitigates or removes the risk of price fluctuations in materials and labour costs for a construction company over the life of the contract. The general principles of risk sharing are:
first principle: the party who can assess and manage the risk should bear it
second principle: if none of the parties can assess or manage the risk, the party who can absorb it most easily, or could procure the insurance from the market the cheapest, should bear it.
The first principle is evident in NZTA’s stated rationale for cost indexation:
“With best practice risk management, risks that cannot be managed by suppliers, such as inflation, should not be passed to suppliers. An approved organisation that does not apply cost fluctuation
15 The changes can be seen in examining Transfund Manual for Competitive Pricing Procedures published in 1997 page 6-29,
and page 6-29, Procurement manual, March 2011.

NZIER report – Civil construction industry study 23
adjustment to its contracts (and passes cost fluctuation risk on to the supplier) may pay more as a result.”16
The Road Maintenance Taskforce (page 27) says:
“The Task Force notes that RCAs [road controlling authorities] are often strongly motivated to be risk averse. In some instances the best approach to managing risk will require an RCA to be more risk embracing. Contractors, in particular, advise that there are many instances where risk is passed to a supplier in a way that contravenes the principle that risk should be managed by the party best able to manage it. Risks that no party can control are best retained by the RCA.”
The belief is that it is unreasonable to ask contractors to bear the risk of inflation and to do so will result in suppliers adding significant premium to bids.
This however is an over-simplified application of risk management principles. The reason it is desirable for the party who can assess and manage the risk to do so is this creates incentives to perform better. This includes innovations that reduce reliance on inputs subject to large price fluctuations and the spreading of risk along supply chains. There are many innovative ways for the civil construction industry to manage input price risk and in process become more productive,17 whereas road users need to cut consumption of travel or expenditure on other goods to pay for petrol excise increases that result from cost escalation.
Implementation of the second principle would see road controlling authorities carry or insure the residual risk: levels of input price fluctuation that industry could not reasonably be expected to manage without adding excessive price risk premiums to bids. Road controlling authorities would not insure the full risk of price changes.
4.2.3. International practice
New Zealand appears to have the most comprehensive contract price indexation mechanism in the world. The index compensates contractors for movements in not only international prices for fuels, but also the cost of local labour. The labour component makes up 50% of the index payment for maintenance and 80% for professional services. We could not identify any other country using a contract compensation mechanism like New Zealand’s.
Where indexing of contracts is used internationally, it is applied to a limited range of inputs. In the United States price percentage change trigger points need to be breached before additional contract payments are made. This shares and caps risk; retaining incentives for innovation and risk management consistent with risk management principles. The state transportation department provides insurance for disruptive price events markets that cannot be managed by firms.
16 Page 6-29, NZTA Procurement Manual, March 2011.
17 For example, one importer of bitumen we spoke to hedges against bitumen price movements by using swaps for heavy fuel oil.

NZIER report – Civil construction industry study 24
The range of price indexation trigger points for US local state departments of transport are provided in Figure 17 below. For asphalt price indexation:
one state has a zero trigger like NZ, although this may have limitations on its use; for example the qualifying size of contract is often a criterion
three states have no price adjustment mechanism
26 states’ triggers are higher than 5%
two states have triggers higher than 20%.
Figure 17 Compensation price trigger points in US states
Number of US states and percentage trigger points before compensation is paid to suppliers
Source: NZIER, NCHRP Project 20-07, Task274, Price Indexing in Transportation Construction
Contracts, National Cooperative Highway Research Program 2011
It is not unreasonable to expect, as the NZTA “best practice” policy indexation assumes, that without indexation bid prices would increase as contractors passed some risk in the form of higher contract bid prices. Statistical analysis to detect whether indexing affected bid prices in the United States found, however, that:
Unfortunately, the statistical analysis conducted in this study cannot conclusively answer the central question of whether these clauses [lower contract price indexation triggers] result in lower bid prices or increased the number of bidders.18
Unduly focussing on the risk of higher contract premiums misses the central reason for efficient sharing of risk; which is to provide the right incentives for productivity gains as suppliers try to minimise and spread risk up-stream and down-stream.
4.2.4. Potential dynamic efficiency gains
The New Zealand price indexation policy passes all price inflation risk to road users and ratepayers, who are unable to mitigate or manage this risk other than by
18 Page 67 NCHRP Project 20-07, Task274, Price Indexing in Transportation Construction Contracts, National Cooperative
Highway Research Program 2011
0
2
4
6
8
10
12
14
16
18
20
0-3% 5-7.5% 10% 15% 20+% None Unknown
Fuel Asphalt/bitumen products

NZIER report – Civil construction industry study 25
reducing transportation usage in the economy. Sharing price risk by suppliers would change their incentives to manage this risk throughout the upstream supply chain.
The benefits of this management of risk to reduce exposure would compound over time. This is an example of what economists call ‘dynamic efficiency’, which can be shown to have disproportionately large effects on industry productivity and ultimately economic growth.19
There are many ways construction firms can manage risk, including:
choose to use existing production techniques that are less dependent on inputs that are expected to have higher prices in future
develop new or improved products that reduce exposure to high prices (such as from supply shortages) for certain inputs in future
increase pressure on their suppliers, and their suppliers’ suppliers, to innovate to reduce vulnerabilities to the price risks of various inputs
use products in the marketplace to hedge against price increases for key inputs if doing so stacks up under a cost-benefit analysis.
If suppliers are simply compensated for input price risks the incentives for them to innovate and raise productivity are at least significantly dampened.
To illustrate the importance of potential for these dynamic productivity gains, we assume that we used a price change trigger point policy of around 5% annually. At this trigger point the need for most price change contract compensation would be removed, other than for economic disruptions such as an oil price shock. If we assume, for example, the price risk management actions result in a 0.5%–1% per annum productivity gain, the net present value of these gains is in the order of $5 billion – $10 billion.20
In the context of long term poor productivity performance of the sector we recommend that the contract cost indexation policy should be reviewed.
4.3. Standards and innovation There are 533 active standards and guidelines on the NZTA “register process manual for network standards and guidelines” (we refer to as ‘the register of standards’). The standards and guidelines often come in the form of manuals themselves. They can contain many specific technical standards, required manufacturing processes and work processes to follow; for example the processes to be followed to inspect a bridge. The vast majority of the standards and guidelines appear to be locally developed and a small number come from Austroads.21
The standards and guidelines appear to govern nearly every aspect of the construction and maintenance of roads. Hence the productivity of the civil construction providers and associated professional services is heavily dependent on them.
19
For instance, Romer, P (1994) New goods, old theory, and the welfare costs of trade restrictions. Journal of Development Economics, 43 pp 5–38
20 Assuming currently forecasted (and extrapolated) NLTP expenditure (net of items like Police, public transport etc), inclusion of local share contribution, a discount rate of 6%, and a 30 year time horizon.
21 Austroads is the association of Australian and New Zealand road transport and traffic authorities.

NZIER report – Civil construction industry study 26
While the guidelines may be intended to be flexible, in practice they are often rigid in the way they are applied. The construction industry is reasonably risk averse when it comes to departures from published guidelines that are referenced or implied in contracts.
4.3.1. Benefits, costs and risks of standards
In principle, standards can provide a wide range of economic benefits. They can:
prevent information asymmetries, enabling construction companies to compete fairly on a ‘level playing field’
provide an open-source platform for innovation, particularly with standards that are performance-based
improve efficiency though reducing transaction costs as construction companies know what performance is expected of them.
Road users also benefit from service level standards that mean, for example, they can expect reasonably consistent stopping distances when braking due to standards that govern road surface roughness.
Poorly designed or inappropriately used standards can, however, stifle innovation and productivity. The most common explanation given to us by the construction sector for cost escalation was the rigid use of standards and guidelines.
Examples of how standards can affect costs provided to us through industry interviews include:
the choice of base course: the price of cement treated base course (GAP 65 + 2%) is around double the price of ‘regular’ high grade base course (GAP 65)22, and the alternative product (foamed asphaltic concrete) also carries a similar price premium
recent restrictions on the use of smooth river run aggregate in favour of faced-aggregate that requires crushing can double aggregate costs
increased safety standards and guidelines for road works that can include comprehensive traffic management systems
the use of special skid resistant aggregate recently developed (which can be sourced from very few quarries and slag from steel mix waste) can be several times the delivered cost of standard road aggregate. This can add significantly to maintenance costs, for example, NZTA advised us that in the Napier physical works contracts 20% extra is allowed for smelter slag23
the introduction of the M10 specification for better asphalt durability has increased the cost of making asphalt.
If these standards are applied in the circumstances they were designed for, or tailored to fit specific circumstances, they can produce significant benefits for road users and also occupational safety and health benefits. The risk is that they become conventional practices and become generally applied.
22 GAP 65 is $15.17 per tonne in Auckland and (GAP 65 + 2% cement) is priced at around $30 per tonne.
23 A form of anti-skid material

NZIER report – Civil construction industry study 27
There can sometimes be alternatives to applying standards, for example lowering a speed limit on a bend rather than using expensive skid resistant material. We were told of several instances like this where the industry considered there was an inappropriate use of standards, costing road user and ratepayers. We have not however been able to test the veracity of these claims within the scope of research.
As noted above most standards are New Zealand based, rather than internationally sourced, an example of which is a unique standard for bitumen (M1). We were advised that fewer refineries outside of New Zealand now produce to the M1 standard, and imported M1 bitumen is sourced from Asia. This raises the question as to whether New Zealand pays a premium for having a unique standard rather than accepting a range of recognised international standards.
There should be a demonstration of net benefit that warrants continuing with standards, and a means to challenge standards with new innovations. How such an industry innovation system or forum would operate is beyond the scope of this research, but appears to be urgent need of development.
4.3.2. Development, review and approval of standards
The risk of the inappropriate use of standards and guidelines leading to cost increases can be offset if it is easy to vary them to support innovations. The register of standards sets out the process for development, approval and variations to standards and guidelines. In summary inclusion of a new standard or guideline involves:
consultation undertaken with affected parties, which varies depending on whether the standard affects state highway or local roads
consideration of value for money and whether the standard is aligned to investment policies.
There is currently no requirement to assess costs and benefits or impacts on the product supply markets for which the standard relates.
In contrast if the need for a variation to standards and guidelines is identified in the course of a project, a change proposal requires the development of a “business case, including cost benefit analysis of the variations”.24
It appears that it is much easier to establish a guideline than vary it, and this is consistent with industry views expressed to us in the course of the research.
4.3.3. Innovation indicators
The construction sector as a whole is typically slow to adopt technology. Behaviour of respondents to the Business Operations Survey suggests that there is a low level of engagement with innovation and change (see Figure 18). The main finding is that the construction sector performs poorly on all measures of business innovation.
24 See pages 29 to 36 of the Register process manual for network standards and guidelines
http://www.nzta.govt.nz/resources/process-manual-network-standards-guidelines

NZIER report – Civil construction industry study 28
Figure 18 Survey of information and communications technology outcomes
% of firms, 2012
Source: Statistics New Zealand
4.4. Accounting for the cost of investment One of the significant drivers of cost escalation over the last decade has been investment in maintaining and increasing levels of service. NZTA is responsive to maintaining service levels to road users; however it does not account well for sometimes large investments in improving the levels of service of the network.
NZTA and local authorities have made substantial investment in improving service levels on the road network over the last decade. Examples include installing crash barriers, widening road shoulders, adding skid resistant pavements, and investing in traffic management systems. These investments benefit road users; however they can also increase future maintenance and network operation costs.
We propose the activity class structure of NZTA for investment in roads be expanded from three activity classes on the left of Table 4 to the five on the right-hand column. The mock-up of dollar values in the proposed activity classes in Table 4 was based on reallocation of NZTA work categories that are attributed to the existing activity classes. In undertaking this work it became evident that existing work categories are not all suited for the revised activity classes. They would require significant revision to give effect to our suggested structure and produce reliable estimates of activities.
The proposed activity class structure splits shown in Table 4 not only accounts for service level investment but also provides a more strategic management tool for Ministers, NZTA and the Ministry. The Government could, for example, consider pulling back on service level improvements to fund new capacity expansion, or mitigate excise increases. Capping budgets on level of service improvements can support better scrutiny of their value for money also.
0 10 20 30 40
Improved efficiency of production processes
Improved management of quality
Improved management information systems
Reduced costs of entering new markets
Shifted activities to other businesses
Improved collaboration with other businesses
None of the above
Construction Overall

NZIER report – Civil construction industry study 29
Table 4 Illustration of proposed activity class structure of infrastructure expenditure
This table includes NLTF expenditure only. Local government expenditure on roads is excluded
Source: NZIER, NZ Transport Agency Annual Report 2011/12, NZTA analysis of expenditure
under the proposed activity class structure
An example of a large service level investment is in the development of the Joint Transport Operations Centre (JTOC) for Auckland. This costs around $61 million annually, and operates 24/7 with around 60 staff. We also understand investment in safety barriers creates significant on-going maintenance costs. These service level investments reflect the demands of managing busier networks, but are not well accounted for in NZTA activity class structure. They are however, accounted for by local authorities who under the Local Government Act are required to report on investment in service level improvements.
4.5. Resource management regulation The quarry industry advised us that they had seen a large number of quarry site closures over the last couple of decades and an overall reduction in the number of quarries. We were told this was driven by a range of factors including:
resource exhaustion
the costs of meeting consent conditions aimed at limiting the impacts of heavy traffic on neighbours
the inability to open new sites in some localities or take river-run gravel due to resource management rules
higher NZTA standards’ specifications that cannot always be met by some quarries
Existing activity class
structure
(incl. actual expenditure – NZTA
Annual Report)
` Proposed activity class
structure
(incl. indicative expenditure levels based analysis by NZTA)
Maintenance and operations ($637m in 2011/12)
Maintenance
(approx. $261m in 2011/12)
Operations
(approx. $191 in 2011/12)
Renewal of roads
($388m in 2011/12)
Renewal to existing standard
(approx. $708m in 2011/12)
Service level improvements to road users
(approx. $461m in 2011/12) New and improved infrastructure
($1,004m in 2011/12)
New roads and capacity expansion to meet increased demand
(approx. $375m in 2011/12)

NZIER report – Civil construction industry study 30
The industry consensus appears to be that the development of a greenfield site in or near Auckland is close to impossible due to regulatory restrictions. The industry is making an effort to get provision made in the unitary plan for a future quarry site.
We tested the industry’s claims by analysing the change in the number of quarries between 1998 and 2011 that produced up to 85% of regional output (Figure 19). There has been a 58% reduction in the number of quarries that produced this level of output (161 down to 67), and thus it is evident that industry concerns appear to be correct. This has significant potential knock-on productivity effects for not only civil construction, but also other construction sectors that depend on aggregate.
Figure 19 Change in number of quarries 1998 – 2011
Number of quarries per region producing up to 85% of regional output
Source: NZIER analysis of MBIE quarry database
As a rule of thumb, the cost of aggregate doubles in price after the first 30 km of cartage. The more the road industry draws from fewer quarries the more costly maintenance of roads will become due to cartage costs. It also appears that regulations may be one factor facilitating increasing levels of industry concentration discussed in chapter 5, which can also lead to increases in market power25.
25 Market power can be defined as the ability to sustain prices for goods and services that exceed the market’s short-run
marginal cost.
10 9
6 5
12
16
19
26
6 7
25
5 4
9
2 4
6 7
3 2
7 6
10
2 2
9
4 2 2 1
1998 2011
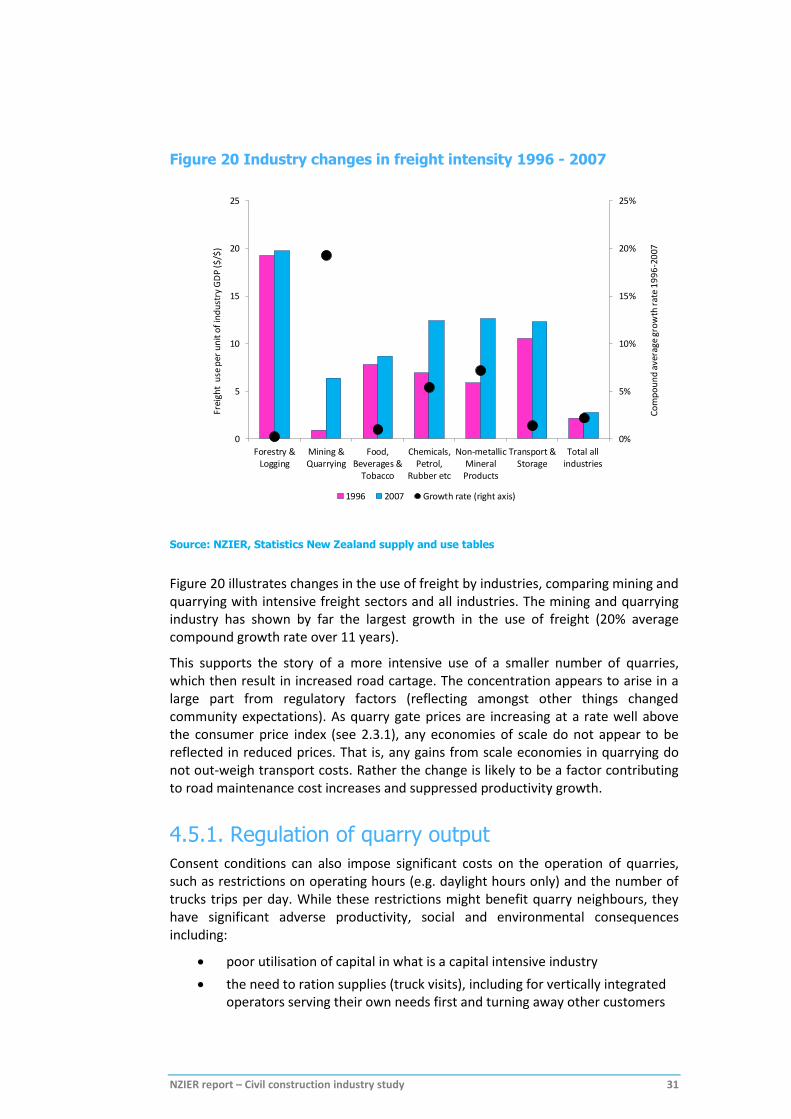
NZIER report – Civil construction industry study 31
Figure 20 Industry changes in freight intensity 1996 - 2007
Source: NZIER, Statistics New Zealand supply and use tables
Figure 20 illustrates changes in the use of freight by industries, comparing mining and quarrying with intensive freight sectors and all industries. The mining and quarrying industry has shown by far the largest growth in the use of freight (20% average compound growth rate over 11 years).
This supports the story of a more intensive use of a smaller number of quarries, which then result in increased road cartage. The concentration appears to arise in a large part from regulatory factors (reflecting amongst other things changed community expectations). As quarry gate prices are increasing at a rate well above the consumer price index (see 2.3.1), any economies of scale do not appear to be reflected in reduced prices. That is, any gains from scale economies in quarrying do not out-weigh transport costs. Rather the change is likely to be a factor contributing to road maintenance cost increases and suppressed productivity growth.
4.5.1. Regulation of quarry output
Consent conditions can also impose significant costs on the operation of quarries, such as restrictions on operating hours (e.g. daylight hours only) and the number of trucks trips per day. While these restrictions might benefit quarry neighbours, they have significant adverse productivity, social and environmental consequences including:
poor utilisation of capital in what is a capital intensive industry
the need to ration supplies (truck visits), including for vertically integrated operators serving their own needs first and turning away other customers
0%
5%
10%
15%
20%
25%
0
5
10
15
20
25
Forestry &Logging
Mining &Quarrying
Food,Beverages &
Tobacco
Chemicals,Petrol,
Rubber etc
Non-metallicMineralProducts
Transport &Storage
Total allindustries
Co
mp
ou
nd
ave
rage
gro
wth
rat
e 1
99
6-2
007
Frei
ght
use
per
un
it o
f in
du
stry
GD
P ($
/$)
1996 2007 Growth rate (right axis)

NZIER report – Civil construction industry study 32
downstream knock-on impacts of adding logistics, handling and storage costs to keep concrete, asphalt and night work operations (such as road maintenance) going
a substantially larger volume of truck kilometres on Auckland roads when aggregate needs to be sourced from further afield as regulatory production constraints are hit.
We were advised that when Auckland was going through rapid construction sector growth (2000 – 2008), prices increased significantly and aggregate was being carted from as further afield as South Waikato as truck restrictions were hit.
4.6. Conclusion on policy and practice Our key conclusions on policy and practice are that:
contract input cost indexation policies inappropriately pass most if not all input price risk onto road users and ratepayers, and there are significant opportunities to more efficiently share risk and improved productivity in the long run
changes to standards may have been an important source of cost escalation; however, more importantly, industry needs a more dynamic means both to stimulating innovation and challenging aging standards
significant cost increases are likely to have come from investment in improved network service levels for road users but these and their associated operating costs are not well accounted for in activity funding classes
there appears to be a reliance on fewer quarries to serve road maintenance and construction and the additional cartage costs and handling will be factor in maintenance cost escalation.

NZIER report – Civil construction industry study 33
5. Market structure The market structure can be thought of as a scaffold for business transactions. It can support commerce efficiently or act as an obstacle to productivity. We look at the civil construction sector within the context of the whole construction sector, prior to outlining the road construction sector’s key supply chains and how concentration might influence pricing and productivity.
5.1. Substitution between construction sectors Not all labour, capital, and technology within the construction sector is directly substitutable in the short to medium term.
Civil works in road construction, telecommunications and water infrastructure use some common labour skills, in particular:
traffic management within the road corridor (including safety management)
trenching and pavement replacement.
Thus several of the companies operating in road maintenance also have large workforces in other areas such as water infrastructure and in supporting the roll-out of ultrafast broadband. In our engagement with industry they advised us a key common skillset is traffic management. A further small overlap is in the area of land improvement where constructors who clear and consolidate land can also bid to do some forms of civil works in the road construction sector.
Vertical construction, in contrast, uses a host of building, plumbing and other skills that overlap with residential building. The overlap that vertical construction has with the roading sector is in the building of concrete structures. Thus, while Fletcher Building does not generally appear in road maintenance, it is occasionally seen in major highway construction projects involving concrete structures, particularly as a joint venture partner.
Firm and skill specialisations mean the construction sector has some internal rigidity around firm and labour mobility. However, over the longer term labour will be more mobile and will move to sub-sectors with higher pay rates.
5.2. Potential for scale economies Firm size can affect productivity through economies of scale — the phenomenon of average costs reducing as output increases. There are clear differences in firm sizes across the different sub-sectors as depicted in Figure 21. The civil construction sector has by far the largest average firm size: three times the size of non-residential sector firms and four times the size of the typical firm in the economy.
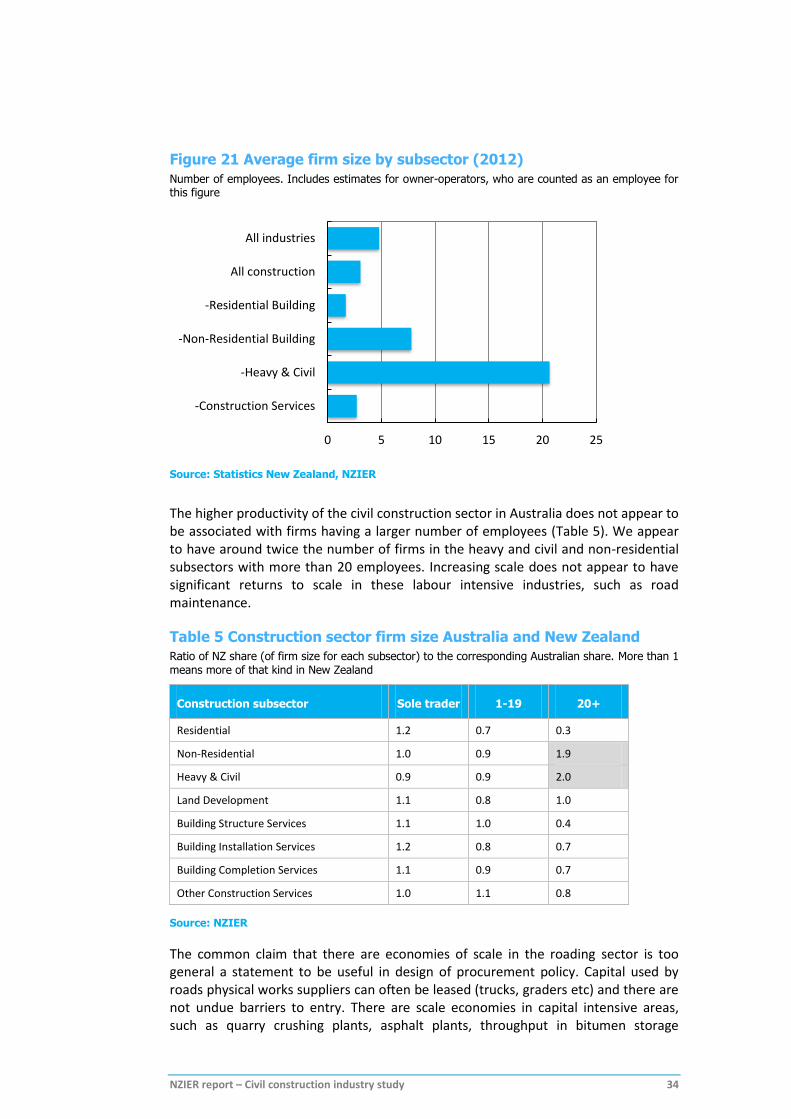
NZIER report – Civil construction industry study 34
Figure 21 Average firm size by subsector (2012)
Number of employees. Includes estimates for owner-operators, who are counted as an employee for this figure
Source: Statistics New Zealand, NZIER
The higher productivity of the civil construction sector in Australia does not appear to be associated with firms having a larger number of employees (Table 5). We appear to have around twice the number of firms in the heavy and civil and non-residential subsectors with more than 20 employees. Increasing scale does not appear to have significant returns to scale in these labour intensive industries, such as road maintenance.
Table 5 Construction sector firm size Australia and New Zealand
Ratio of NZ share (of firm size for each subsector) to the corresponding Australian share. More than 1 means more of that kind in New Zealand
Construction subsector Sole trader 1-19 20+
Residential 1.2 0.7 0.3
Non-Residential 1.0 0.9 1.9
Heavy & Civil 0.9 0.9 2.0
Land Development 1.1 0.8 1.0
Building Structure Services 1.1 1.0 0.4
Building Installation Services 1.2 0.8 0.7
Building Completion Services 1.1 0.9 0.7
Other Construction Services 1.0 1.1 0.8
Source: NZIER
The common claim that there are economies of scale in the roading sector is too general a statement to be useful in design of procurement policy. Capital used by roads physical works suppliers can often be leased (trucks, graders etc) and there are not undue barriers to entry. There are scale economies in capital intensive areas, such as quarry crushing plants, asphalt plants, throughput in bitumen storage
0 5 10 15 20 25
All industries
All construction
-Residential Building
-Non-Residential Building
-Heavy & Civil
-Construction Services
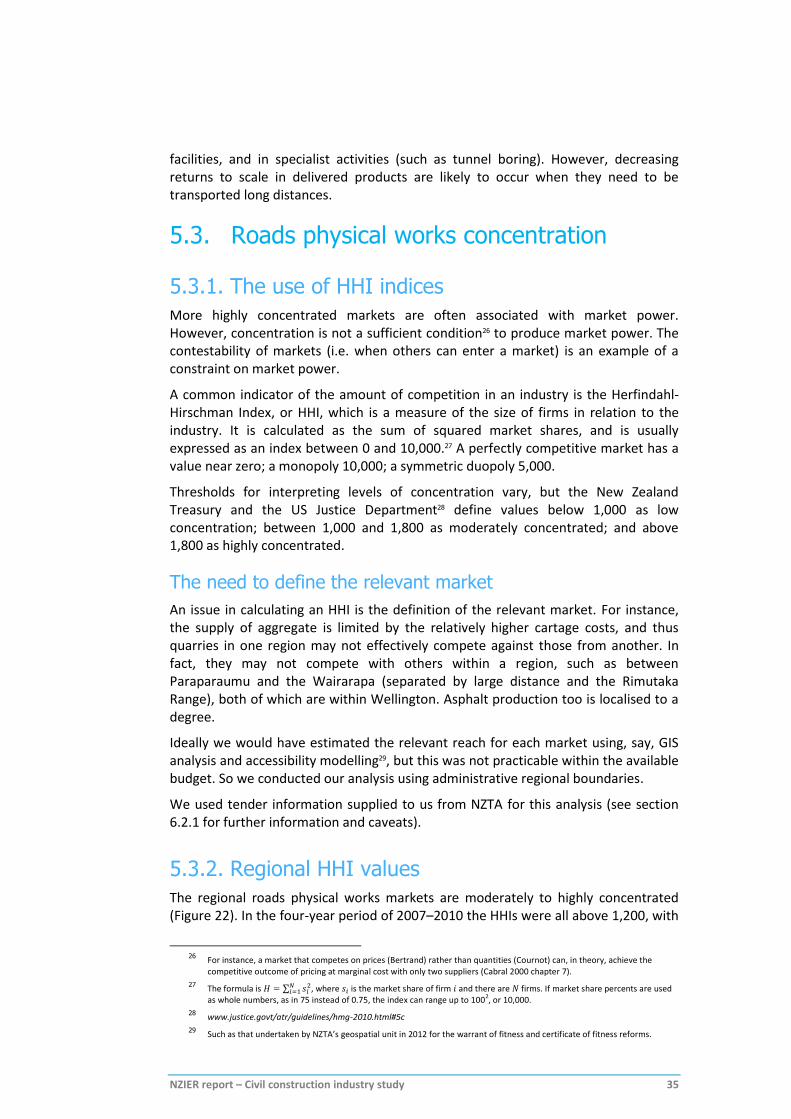
NZIER report – Civil construction industry study 35
facilities, and in specialist activities (such as tunnel boring). However, decreasing returns to scale in delivered products are likely to occur when they need to be transported long distances.
5.3. Roads physical works concentration
5.3.1. The use of HHI indices
More highly concentrated markets are often associated with market power. However, concentration is not a sufficient condition26 to produce market power. The contestability of markets (i.e. when others can enter a market) is an example of a constraint on market power.
A common indicator of the amount of competition in an industry is the Herfindahl-Hirschman Index, or HHI, which is a measure of the size of firms in relation to the industry. It is calculated as the sum of squared market shares, and is usually expressed as an index between 0 and 10,000.27 A perfectly competitive market has a value near zero; a monopoly 10,000; a symmetric duopoly 5,000.
Thresholds for interpreting levels of concentration vary, but the New Zealand Treasury and the US Justice Department28 define values below 1,000 as low concentration; between 1,000 and 1,800 as moderately concentrated; and above 1,800 as highly concentrated.
The need to define the relevant market
An issue in calculating an HHI is the definition of the relevant market. For instance, the supply of aggregate is limited by the relatively higher cartage costs, and thus quarries in one region may not effectively compete against those from another. In fact, they may not compete with others within a region, such as between Paraparaumu and the Wairarapa (separated by large distance and the Rimutaka Range), both of which are within Wellington. Asphalt production too is localised to a degree.
Ideally we would have estimated the relevant reach for each market using, say, GIS analysis and accessibility modelling29, but this was not practicable within the available budget. So we conducted our analysis using administrative regional boundaries.
We used tender information supplied to us from NZTA for this analysis (see section 6.2.1 for further information and caveats).
5.3.2. Regional HHI values
The regional roads physical works markets are moderately to highly concentrated (Figure 22). In the four-year period of 2007–2010 the HHIs were all above 1,200, with
26 For instance, a market that competes on prices (Bertrand) rather than quantities (Cournot) can, in theory, achieve the
competitive outcome of pricing at marginal cost with only two suppliers (Cabral 2000 chapter 7).
27 The formula is ∑
, where is the market share of firm and there are firms. If market share percents are used as whole numbers, as in 75 instead of 0.75, the index can range up to 100
2, or 10,000.
28 www.justice.govt/atr/guidelines/hmg-2010.html#5c
29 Such as that undertaken by NZTA’s geospatial unit in 2012 for the warrant of fitness and certificate of fitness reforms.

NZIER report – Civil construction industry study 36
about two thirds near or above the 1,800 threshold. In most regions there has been an increase in concentration compared to the 1998–2001 four year period, with the exceptions of Northland, Bay of Plenty, and Nelson / Marlborough30.
Figure 22 Regional HHI change for roads physical works markets
Source: NZIER, tender database
Regions in the South Island are more concentrated than in the North Island, with the remoter areas of Taranaki and Gisborne the most concentrated in the north (Figure 23).
30 Note the Nelson-Marlborough combines two regions. We found that a different picture of concentration emerged in the
quarry sector when these two regions are separated, and a similar impact would be expected here.
-
500
1,000
1,500
2,000
2,500
3,000
3,500
1998-2001 2007-2010
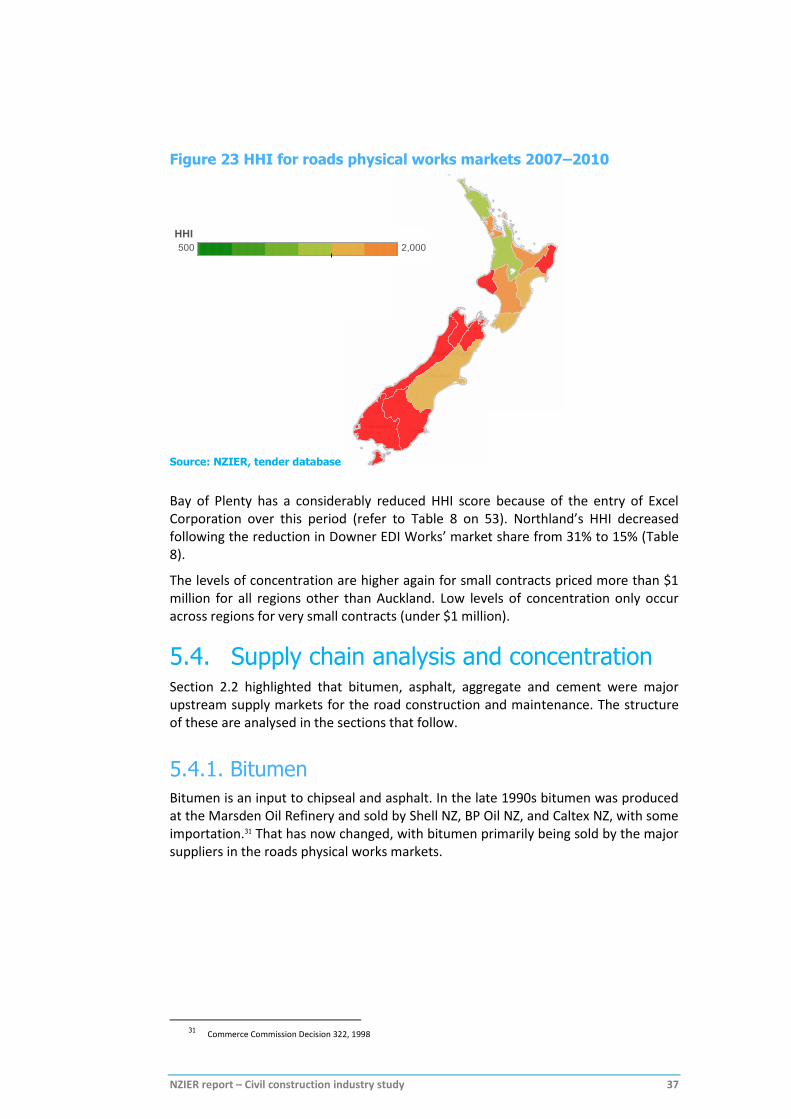
NZIER report – Civil construction industry study 37
Figure 23 HHI for roads physical works markets 2007–2010
Source: NZIER, tender database
Bay of Plenty has a considerably reduced HHI score because of the entry of Excel Corporation over this period (refer to Table 8 on 53). Northland’s HHI decreased following the reduction in Downer EDI Works’ market share from 31% to 15% (Table 8).
The levels of concentration are higher again for small contracts priced more than $1 million for all regions other than Auckland. Low levels of concentration only occur across regions for very small contracts (under $1 million).
5.4. Supply chain analysis and concentration Section 2.2 highlighted that bitumen, asphalt, aggregate and cement were major upstream supply markets for the road construction and maintenance. The structure of these are analysed in the sections that follow.
5.4.1. Bitumen
Bitumen is an input to chipseal and asphalt. In the late 1990s bitumen was produced at the Marsden Oil Refinery and sold by Shell NZ, BP Oil NZ, and Caltex NZ, with some importation.31 That has now changed, with bitumen primarily being sold by the major suppliers in the roads physical works markets.
31
Commerce Commission Decision 322, 1998

NZIER report – Civil construction industry study 38
Table 6 Bitumen installations facility ownership
Location Owner / operator
Wynyard Auckland Stalthaven on behalf of Z Energy
Mount Maunganui Three tanks – Downer, Fulton Hogan and Delta (Blacktop)
New Plymouth Downer
Napier Higgins
Nelson Fulton Hogan
Lyttelton Downer and Fulton Hogan
Timaru Delta (Blacktop)
Dunedin Fulton Hogan
Bluff Downer
Source: Roading NZ
5.4.2. Asphalt plants
Most regions are served by at least one asphalt plant that is in reasonably close proximity (
Table 7), based on registrations to Roading New Zealand’s Asphalt Plant Accreditation Scheme (APAS) programme. Fulton Hogan is the leading producer and deliverer of asphalt products and services across New Zealand with 14 plants around the country, followed by Higgins Group (6), and Downer EDI Works (7). Some 89% of the plants are owned by three parties.
Roading New Zealand is aware of a few other plants scattered around the country, but these are owned by organisations that are not their members and are typically small production facilities.32 Roading New Zealand advises that there is excess capacity in asphalt plants (for more see section 6.5.2 on page 58).
Roading New Zealand advises that where larger volume jobs arise, the small regional production operations often are unable to keep up with the demand of modern pavers and laying methods. When this occurs, it is not uncommon to set up a mobile plant for the duration of the project. Roading New Zealand is aware of several mobile plants that are used for such purposes, but only one of them is registered with the APAS Programme.
5.4.3. Aggregate
As described in section 2.2 on page 6, aggregate is a key input to the construction sector, either directly or as an intermediate input to concrete and asphalt.
MBIE supplied data from its annual survey of quarry output for a period of fifteen years from 1998 to 2011. The information has been provided on a confidential basis, and only regional or national summaries are provided in this report. We are unable to disclose detailed data relating to individual quarries or their owners.
32 We are informed by Roading NZ that it is doubtful that any of these small facilities would be used for any major roading projects, but rather are used for small patching jobs, perhaps footpaths, car parks, tennis courts and driveways etc.

NZIER report – Civil construction industry study 39
However, we can disclose some high-level insights on their ownership structures that we obtained either from publicly available information or directly from industry stakeholders. We understand:
Fulton Hogan own about 40 quarry sites, mainly in the South Island possibly producing the majority of the aggregate in the South Island
Winstone Aggregates (owned by Fletcher Building) owns about 25 quarry sites nationwide, with three servicing Auckland from the south
Holcim New Zealand operates Kiwi Point Quarry (owned by Wellington City Council), one in Bombay (south of Auckland) and one in Hastings (Hawke’s Bay), supplying 1.2 million tonnes of aggregates annually, primarily to the concrete and roading markets
Higgins owns several quarries, one located in Meremere and others in central to lower North Island
Stevensons has a large quarry South of Auckland (Drury) and a quarry in the Waikato
Downer EDI Works owns fewer quarries than its competitors because the quarries that were owned by its forbear (the Ministry of Works) were sold separately prior to full privatisation.

NZIER report – Civil construction industry study 40
Table 7 Asphalt plants
The following list of asphalt plants are all registered to participate in Roading New Zealand’s APAS as at May 2013.
Total
Allied Asphalts (Fulton Hogan and
Downer EDI Works)
Ashburton Contracting
Blacktop Construction
City Care Downer EDI
Works Fulton Hogan
Higgins Group
Isaac Construction
Auckland 5 14%
1
1 2 1
Christchurch 3 8%
1
1
1
Hamilton 3 8%
1 1 1
Wellington 3 8%
1 1 1
Ashburton 2 6%
1
1
Dunedin 2 6%
1 1
Invercargill 2 6%
1 1
Nelson 2 6%
1 1
Tauranga 2 6% 1
1
Blenheim 1 3%
1
Central Otago 1 3%
1
Gisborne 1 3%
1
Greymouth 1 3%
1
Masterton 1 3%
1
Napier 1 3%
1
New Plymouth 1 3%
1
Palmerston North 1 3%
1
Rotorua 1 3% 1
Taupo 1 3%
1
Timaru 1 3%
1
Whangarei 1 3%
1
Total 36 2 1 1 1 7 14 9 1
6% 3% 3% 3% 19% 39% 25% 3%
Source: Roading New Zealand
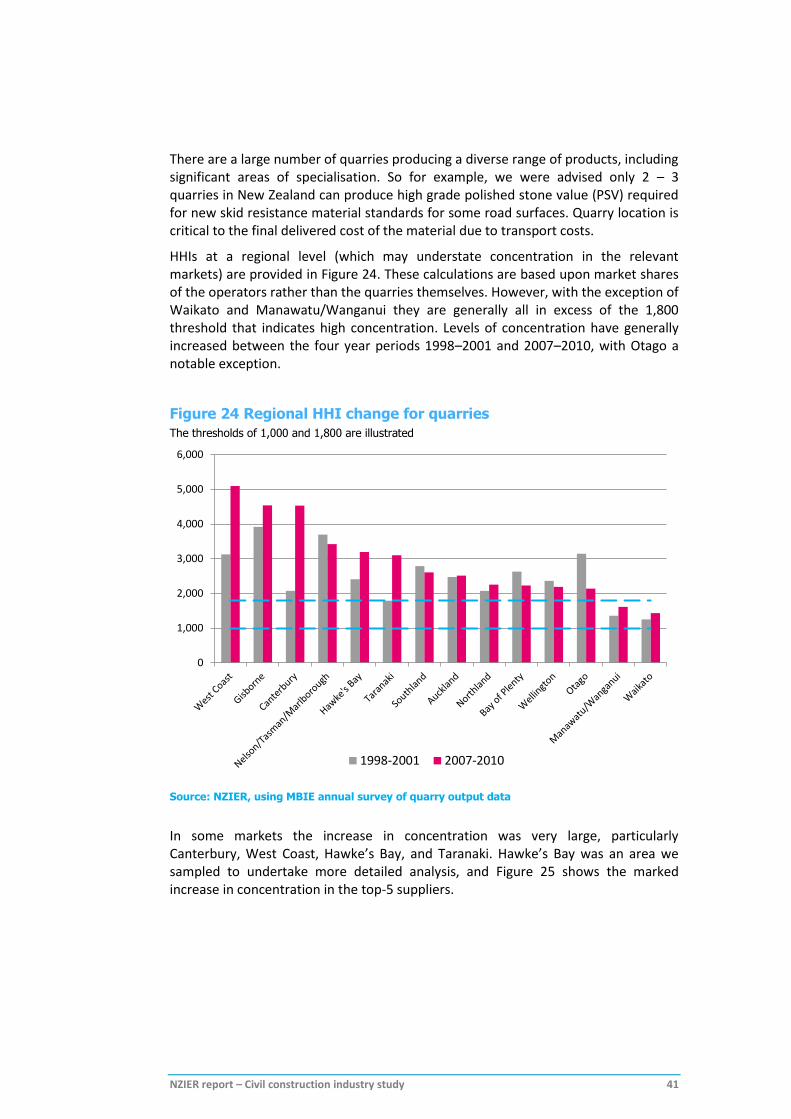
NZIER report – Civil construction industry study 41
There are a large number of quarries producing a diverse range of products, including significant areas of specialisation. So for example, we were advised only 2 – 3 quarries in New Zealand can produce high grade polished stone value (PSV) required for new skid resistance material standards for some road surfaces. Quarry location is critical to the final delivered cost of the material due to transport costs.
HHIs at a regional level (which may understate concentration in the relevant markets) are provided in Figure 24. These calculations are based upon market shares of the operators rather than the quarries themselves. However, with the exception of Waikato and Manawatu/Wanganui they are generally all in excess of the 1,800 threshold that indicates high concentration. Levels of concentration have generally increased between the four year periods 1998–2001 and 2007–2010, with Otago a notable exception.
Figure 24 Regional HHI change for quarries
The thresholds of 1,000 and 1,800 are illustrated
Source: NZIER, using MBIE annual survey of quarry output data
In some markets the increase in concentration was very large, particularly Canterbury, West Coast, Hawke’s Bay, and Taranaki. Hawke’s Bay was an area we sampled to undertake more detailed analysis, and Figure 25 shows the marked increase in concentration in the top-5 suppliers.
0
1,000
2,000
3,000
4,000
5,000
6,000
1998-2001 2007-2010

NZIER report – Civil construction industry study 42
Figure 25 Increase in quarry concentration in Hawke’s Bay
Market shares of quarry operators, 1998 and 2011. Operators are defined by organisation, not by quarry.
Source: NZIER, using MBIE annual survey of quarry output data
A number of factors are likely to produce a trend of increasing concentration of ownership and reduced competition of supply:
industry perceptions and the realities of the difficulty of establishing greenfield sites around major urban conurbations (section 4.5)
a significantly reduced number of quarries near major urban centres due to a large number of closures in major sites over the last decade (section 4.5)
resource consent conditions restricting opening hours and numbers of truck trips (section 4.5)
demand for highly specialised aggregates, for example for skid resistance that can only be sourced from a limited number of quarries (refer to section 4.3 for more)
the strategies of major players in the maintenance market to vertically integrate from “source to seal” (section 5.5 below).
Figure 9 on page 10 showed the increase in regional prices for roading aggregate between the two periods 1998–2001 and 2007–2010. There appears to be a possible positive relationship between increased prices and market concentration (Figure 26). A careful regression analysis that accounts for all possible explanatory factors and cause-effect relationships needs to be undertaken before too much is read into this graph. However, this relationship warrants further research.
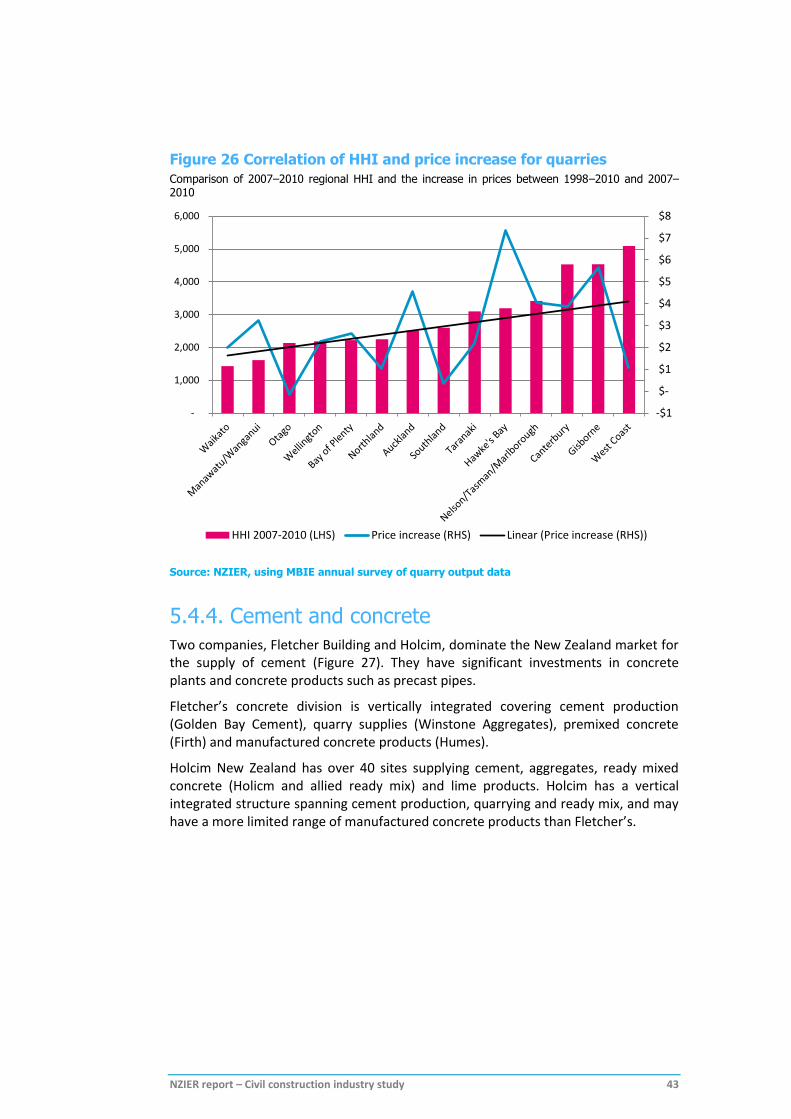
NZIER report – Civil construction industry study 43
Figure 26 Correlation of HHI and price increase for quarries
Comparison of 2007–2010 regional HHI and the increase in prices between 1998–2010 and 2007–2010
Source: NZIER, using MBIE annual survey of quarry output data
5.4.4. Cement and concrete
Two companies, Fletcher Building and Holcim, dominate the New Zealand market for the supply of cement (Figure 27). They have significant investments in concrete plants and concrete products such as precast pipes.
Fletcher’s concrete division is vertically integrated covering cement production (Golden Bay Cement), quarry supplies (Winstone Aggregates), premixed concrete (Firth) and manufactured concrete products (Humes).
Holcim New Zealand has over 40 sites supplying cement, aggregates, ready mixed concrete (Holicm and allied ready mix) and lime products. Holcim has a vertical integrated structure spanning cement production, quarrying and ready mix, and may have a more limited range of manufactured concrete products than Fletcher’s.
-$1
$-
$1
$2
$3
$4
$5
$6
$7
$8
-
1,000
2,000
3,000
4,000
5,000
6,000
HHI 2007-2010 (LHS) Price increase (RHS) Linear (Price increase (RHS))

NZIER report – Civil construction industry study 44
Figure 27 New Zealand cement market share estimate
Source: NZIER, Fletcher Building
Parts of the cement market can be contested depending on the exchange rate. Importation of cement from Asia has recently increased due to the strong New Zealand dollar and relatively low shipping costs.33 In 2003 Golden Bay and Holcim alleged material injury from dumped imports. The then Ministry of Economic Development (MED) concluded that while the goods under investigation were being dumped, they did not consider that any injury the domestic industry faced was material.
The rationale for MED’s conclusion is largely redacted in the publicly available version of the report. The volume of imports were small, sensitive to exchanges rates, and they would have probably have faced some distribution challenges given the integrated supply chain structure within the concrete industry.
5.5. Vertical integration Highly concentrated supply chains give rise to the phenomenon of ‘double marginalisation’. This is where suppliers with market power add their own mark-ups, with the end price being higher than what would maximise a monopoly’s profit if they owned the entire supply chain34.
When supply chains are highly concentrated, vertical integration (when suppliers own their supply chains) can — holding all else equal — increase consumer welfare by setting a lower price than results under double marginalisation.35 The vertically integrated supplier chooses where to take their margin. We find that the construction sector, particularly the supply chain relating to the physical works of roads, is highly vertically integrated, and has become more so in recent years.
It should be noted, however, that vertical integration is not necessarily the best approach to address double marginalisation. An alternative is for purchasers to use their countervailing power to bargain prices down for the supply of inputs to be provided on a non-preferential basis to the roading supplier market. This is considered further in section 6.5 on procurement.
33
Concrete analyst’s presentation, Malpass Mark, Chief of Concrete Division May 2012
34 Thus the saying ‘the only thing worse than a monopoly is a chain of monopolies’.
35 Tirole (2002) page 177.
Holcim, 43%
Golden Bay, 54%
Imports, 3%

NZIER report – Civil construction industry study 45
The principal issue is whether increasing vertical integration has caused increased market power in any or all of the markets in the supply chain. In order to properly assess this would require further detailed case study analysis.
5.5.1. The use of ‘vertical HHI’ indices
To conduct the analysis of the effects of vertical integration in the roading sector we used a variation of the HHI index, where instead of squaring a firm’s market share in one market, we multiply their market shares in the upstream and downstream market.36 This allows for the similar insights to be had; for instance zero means either (or both) of the markets are perfectly competitive; 10,000 means a monopolist owns both markets; above 1,800 means there are firms that have large market shares in each of the markets they operate in.
In some respects it would be remarkable if this analysis produced high indices. This would require both markets to be moderately to highly concentrated and for major commonalities to exist between those two markets.
We are unaware of this metric being used elsewhere, and so the size of the thresholds are not standardised. We thus focused on broad patterns and the comparative HHI vertical indicators to be interpreted alongside other information.
The analysis is based on data matching firms across the tender database we constructed from NZTA data and from the MBIE survey data on quarry output. We checked the ownership structure of the most significant firms in both databases using the Companies Office records. There is an element of approximation in this analysis.
5.5.2. Vertical integration of roads and quarries
Figure 28 shows a moderate to high degree of vertical integration between road physical works suppliers and quarries in about half of the regions over the period 2007–2010.
Auckland has a low result because the dominant players (such as Fulton Hogan, Downer EDI Works, and HEB, Table 8 page 53) had very little, if any, market share in quarry outputs for the roading sector in Auckland over this period. Quarrying was primarily Winstones Aggregates, whose owner Fletcher Building had minimal market share in roads physical works in this period according to the tender database.37
The level of vertical integration has generally increased compared to the 1998–2001 period, where only four regions had indices of about 1,000 or higher. Bay of Plenty is a notable exception, with its index decreasing from 2,087 to 697. This change was driven by Excel Corporation’s entry into Bay of Plenty’s roading sector (Table 8 page 53).
36
The formula is ∑
, where
is the market share of firm in market 1, is the market share of firm in market
2, and is the number of firms in total across both markets. If market share percents are used as whole numbers, as in 75 instead of 0.75, the index can range up to 1002, or 10,000.
37 Note that the tender data we report on throughout this report did not account for subcontracted work, and so we do not have a full picture of who exactly did the work in each region.

NZIER report – Civil construction industry study 46
Figure 28 Regional vertical integration index — roads and quarries
‘Vertical HHI’, periods 1998–2001 and 2007–2010. Sum of the product of each firm’s market share in each of roads and quarries (roading outputs) in each region.
Source: NZIER, tender database and MBIE annual survey of quarry output data
Using the data on asphalt plant ownership, as outlined in section 5.4.2, we have created a 3-way vertical ‘HHI’ index, shown in Figure 29.38 The indices are smaller than the two-level index above, but it is remarkable how many regions still have large numbers, and thus are highly vertically integrated.
The changes in vertical integration could be a reflection of the success of the market in finding the most efficient structural arrangement, or a warning sign of emerging market power that may be an artefact of government procurement strategies. More detailed case study work would be required to establish whether the trend is beneficial.
38
Only 2011 data for regional asphalt plant ownership was able to be used for this analysis.
1,918
735
2,074
857
447
-
2,087
1,127
479
28 35
236
61 9
2,126
1,743
1,584 1,488
1,156
976
697 647
376
82 62 58 41 - -
500
1,000
1,500
2,000
2,500
1998-2001 2007-2010

NZIER report – Civil construction industry study 47
Figure 29 Regional vertical integration — roads, quarries, asphalt
‘Vertical HHI’, period 2007–2010. Sum of the product of each firm’s market share in each of roads, quarries (roading outputs), and asphalt production in each region.
Source: NZIER, tender database, MBIE survey of quarry output, Roading NZ asphalt survey
Figure 30 combines the two ‘vertical-HHI’ indices from above with the HHI for roads from Figure 23. The level of roading market concentration is not a good predictor of the extent that a region’s roading sector is vertically integrated. Note that Gisborne and Northland occupy each end of the spectrum, and so a small market effect is not necessarily the key driver.
There are a range of questions that arise from Figure 30 that warrant further investigation. For instance, is the lack of vertical integration leading to double marginalisation in the regions to the right of the graph? Has high vertical integration reduced the ability for market entry and led to increased market power in the regions to the left of the graph? Affirmative answers to either of these questions means consumers (ratepayers and road users) are disadvantaged.
2,126
1,147
559
743
1,097
369
208 323
85 - 30 16 9 -
-
500
1,000
1,500
2,000
2,500

NZIER report – Civil construction industry study 48
Figure 30 Regional road market concentration and vertical integration
Combination of Figure 22, Figure 28, and Figure 29 for period 2007–2010.
Source: NZIER, tender database, MBIE survey of quarry output, Roading NZ asphalt survey
5.6. Conclusion on market structure Our key conclusions on market structure are that:
the level of substitution between the civil construction sector and residential and commercial building suppliers is not large in the short term, and where they do interact it is more to complement rather than substitute work
civil industry players are large and it is not clear this is leading to any additional efficiencies
nearly all regions have highly concentrated roads physical works markets, and that concentration has increased over the last 15 years
the quarry market is localised and highly concentrated, and concentration has increased over the last decade. There is a possible correlation between quarry market concentration and the extent of aggregate price increases
the asphalt market is highly concentrated (often only regional supplier), as is the bitumen storage market. The concrete sector is a duopoly with some contestability evident from imports
there is a high degree of vertical integration, and this has generally increased in recent years (Bay of Plenty is a notable exception)
the extent of vertical integration has risks of increasing concentration, and thus market power; however further research would be required to establish whether this is indeed the case because concentration is an ambiguous indicator of market power.
-
500
1,000
1,500
2,000
2,500
3,000
3,500
HHI (roads) V-HHI (roads, quarries) V-HHI (roads, quarries, asphalt)

NZIER report – Civil construction industry study 49
6. Operation and conduct In this chapter we outline: the close working relationships between players in the civil sector; how they compete; market entry and acquisitions; monitoring of bid rigging; and how procurement practice might affect the conduct, structure and performance of markets.
6.1. Inter-industry relationships Examples of the close working personal relationships within the civil construction industry are as follows:
joint ventures of quarries (for example Horokiwi, which is owned half each by Fulton Hogan and Higgins Group Holdings, and Winstone and Fulton Hogan have a joint venture quarry to the north of Auckland)
many long standing personal relationships. The Commerce Commission’s survey39 of the commercial construction sector found that:
relationships with peers were fluid, as the same businesses may be competitors, partners, or sub-contract to one another at different times
relationships with staff and competitors were close, some of which span decades
firms work together to win large commercial contracts, for example:
Waterview Connection (Fletcher Construction, McConnell Dowell Constructors, Parsons Brinckerhoff, Beca Infrastructure, Tonkin and Taylor, and Japanese construction company Obayashi Corporation)
Auckland Motorway Alliance (Fulton Hogan, Opus, Beca, Resolve Group and Armitage Systems Ltd)
Transmission Gully PPP (procurement still in progress):
Leighton Contractors Pty (lead), HEB Construction, InfraRed Infrastructure, Bank of Tokyo–Mitsubishi UFJ, and Accident Compensation Corporation
John Laing Investments, Fulton Hogan, Fletcher Construction, Macquarie Group Holdings NZ, Woodward Infrastructure
apparent strategic alignments, such as between Higgins and HEB
dominant competitors also collaborate — e.g. Allied Asphalts JV between Fulton Hogan and Downer EDI Works, supplied by feedstock from their quarries.
There is a significant flux of people moving between local authorities, NZTA and the private sector, particularly from professional services companies. The value of these close working relationships is that information readily flows within industry networks improving productivity; the risks are that these relationships may heighten the risk of inappropriate market conduct and tacit collusion.
39 www.comcom.govt.nz/business-competition/anti-competitive-practices/construction-sector/construction-sector-research-
key-findings

NZIER report – Civil construction industry study 50
6.2. Market competition We focus in this section on physical works, rather than professional services. The Auditor General report NZ Transport Agency: Delivering maintenance and renewal work on the state highway network (September 2011) highlighted the dominance of Opus (65% market share, page 13) in professional services for highway maintenance and renewal. They recommended that specific strategies be developed to increase competition to increase the quality and value for money of the services provided (page 7). We assume that pragmatic management and mitigation options are already in progress to address issues in professional services.
6.2.1. The roads physical works tender database
We were supplied by NZTA with tender data for a period of fifteen years from 1995/96 to 2009/10. This contained information on the number of tenders received per contract; who won it; the price; the road controlling organisation (RCA) that procured it (75 RCAs, including Transit NZ/NZTA); the term (length of life) of the contract; and the activity classification. With some additional work the region could be established too. Data was not able to be supplied to us for the 2010/11, 2011/12 or 2012/13 years.
It took considerable effort to manually standardise the data so that we could analyse it in detail. We understand this was the first time the data had been cleaned up in this way. The database contains about 12,900 contracts totalling $11.6 billion of work. There is no other source of similar data available on the total state of the combined markets for local roads and state highways.
We judge that the dataset is fit for expressing patterns and trends, but there several limitations, including40:
the amount of spending over this period for roads physical works is actually something closer to $22.5 billion, which means half is not recorded in this database
we cannot split out the activity classes (capital, maintenance etc) because of inconsistent or null reporting.
The reason for the considerable difference in the value of work in the tenders database and actual spend could relate to: untendered work not being reported; contract variations being excluded; contract cost increase compensation being over and above the original contract prices; and general data entry errors. We note that Opus (2012) described that for maintenance and operations works about half of the contracts were over budget because of ‘additional work’ and ‘scope creep’, implying significant contract variations.
40 Other problems include:
• data on term details is missing in many instances, particularly for state highways; an irony given those projects are generally the biggest
• there could be considerable variation in how the suppliers within each RCA each year interpreted and formatted their data submissions
• the data does not include out-turn costs and contract variations and the like, and it is not clear whether direct commissions were always included or not
• it does not include data on subcontractors • it does not describe who else tendered and what the price of each of those tenders were (except for a limited period in
the 1990s).
NZIER report – Civil construction industry study 51
6.2.2. Road physical works competition monitoring results
Subject to the caveats expressed above, key findings from the analysis of the tender database are:
There are different markets depending on the size of contracts. The classifications we have used, as illustrated in Figure 31 below are:
under $1 million is ‘very small’
under $4 million are ‘small’
under $25 million are ‘medium’
above $25 million are ‘large’.
Bidding behaviours for medium to large size projects have changed since 2004/05 (about when the road spending boom started):
there continues to be high contestability for projects less than $4m, with the range of bids up to 15 for very small projects down to about 7 for $4m projects
the bidding has changed significantly for projects between $4m and $25m:
for the 10-year period 1995/96–2004/05 most projects were under $12m, and there were between 1–14 bids
since 2004/05 there have been about 1–5 bids regardless of the size
the bidding has changed significantly for projects over $25m:
before 2004/05 the range of bids was 3–5
it has usually been 2–3 since.
Two firms dominate (Fulton Hogan and Downers EDI Works), and the second tier compete only regionally
these two increased their combined market share from about one third in the late 1990s to about half the market in the 2000s
they compete successfully across the range of contract sizes
where any other suppliers compete it is only on a regional basis.
We would expect that different patterns in tender volumes would be evident in selected markets such as asphalt and road surfacing depending on the extent of vertical integration with asphalt plants and bitumen storage. However, the lack of work categorisation in the database prevented us from considering that further. If the database could be refined to have better work categorisation it might reveal further variation in competition.

NZIER report – Civil construction industry study 52
Figure 31 Market differentiation by size and number of bids
Source: NZIER
Annual trends in the average number of bids by each size of contract are shown in Figure 32 below. Generally there are more bids the smaller the contract, and the number of bids over the second half of the 2000s is lower than the previous ten years. There was an increase in bidding in 2008/09 and 2009/10 as the recession hit presumably because suppliers from other markets contested the road physical works sector.41 Larger contracts were uncommon in the late 1990s.
Figure 32 Average tender numbers by contract size annually
Source: NZIER
41
In 2010 NZTA carried out a physical works sector health check and capability review following the increased competition observed following the economic downturn from early 2008. They found that margins dropped to ‘unsustainable’ levels as suppliers endeavoured to secure work volume to sustain their personnel resource.
Source: NZTA, State Highway Maintenance and Operations Review, Consultation Document. July 2012, page 8.
0
5
10
15
20
25
0 10 20 30 40 50 60 70 80 90 100
Nu
mb
er
of
co
nfo
rmin
g t
en
ders
Contract price (annualised basis) $ millions
Pre 2004/05 2004/05 and later
0
2
4
6
8
10
Large (>$25m) Medium (<$25m) Small (<$4m) Very Small (<$1m)

NZIER report – Civil construction industry study 53
Table 8 Top three suppliers in each region, and the change over time
Regions ordered by the highest to the lowest increase in the top-3 market share over the period. * Note the Nelson-Marlborough combines two regions; a different picture of concentration emerges in supply chains (quarries) when these are separated, and a similar impact would be expected here. Percentages may not add up due to rounding
Canterbury Auckland Taranaki Manawatu-Wanganui Southland West Coast Gisborne
1998-2001
Fulton Hogan 27% Downer 24% Downer 28% Higgins 17% Fulton Hogan 29% Fulton Hogan 35% Downer 36%
Downer 12% Fulton Hogan 17% Hurlstone 11% Downer 13% Southroads Ltd 27% G J Beynon 14% Fulton Hogan 24%
Ashburton 5% Bitumix Ltd 6% D & L Crow Ltd 11% Tararua Roading 10% Bitumix Ltd 11% Ferguson Bros 9% Bitumix Ltd 18%
TOTAL 45% 46% 50% 40% 67% 58% 78%
2007-2010
Downer 25% Fulton Hogan 36% Downer 42% Higgins 38% Downer 45% Fulton Hogan 42% Downer 47%
Fulton Hogan 24% HEB Constr. 15% Inframax Constr 14% Downer 9% Fulton Hogan 25% Ferguson Bros 19% Fulton Hogan 32%
City Care Ltd 16% Downer 13% Fulton Hogan 10% Infracon Ltd 8% Southroads Ltd 10% WestReef 7% HEB Constr 8%
TOTAL 65% 64% 65% 55% 80% 68% 87%
Increase 20% 17% 15% 15% 13% 11% 9%
Hawkes Bay Wellington Otago Waikato Bay of Plenty Nelson-Marlborough* Northland
1998-2001
Higgins 23% Fulton Hogan 29% Fulton Hogan 40% Downer 24% Fulton Hogan 39% Downer 38% Downer 31%
Downer 21% Higgins 9% Downer 21% Fulton Hogan 19% Downer 14% Fulton Hogan 31% McBreen Jenkins 24%
United Contr. 8% Oldfield 8% Southroads 14% Tanlaw Corp 5% Bitumix Ltd 7% Excel Corp 9% Fulton Hogan 19%
TOTAL 52% 47% 74% 48% 60% 77% 74%
2007-2010
Higgins 28% Fulton Hogan 24% Fulton Hogan 49% Downer 27% Fulton Hogan 25% Downer 28% HEB Constr. 17%
Downer 19% Downer 18% Downer 16% HEB Constr. 10% Excel Corp. 15% Fulton Hogan 19% Downer 15%
Infracon Ltd 13% Oldfield 11% Hawkins 10% Fulton Hogan 10% Fletcher 15% HEB Constr. 10% Fulton Hogan 14%
TOTAL 59% 53% 74% 47% 54% 58% 47%
Increase 8% 6% -1% -1% -6% -19% -27%
Source: NZIER, tenders database
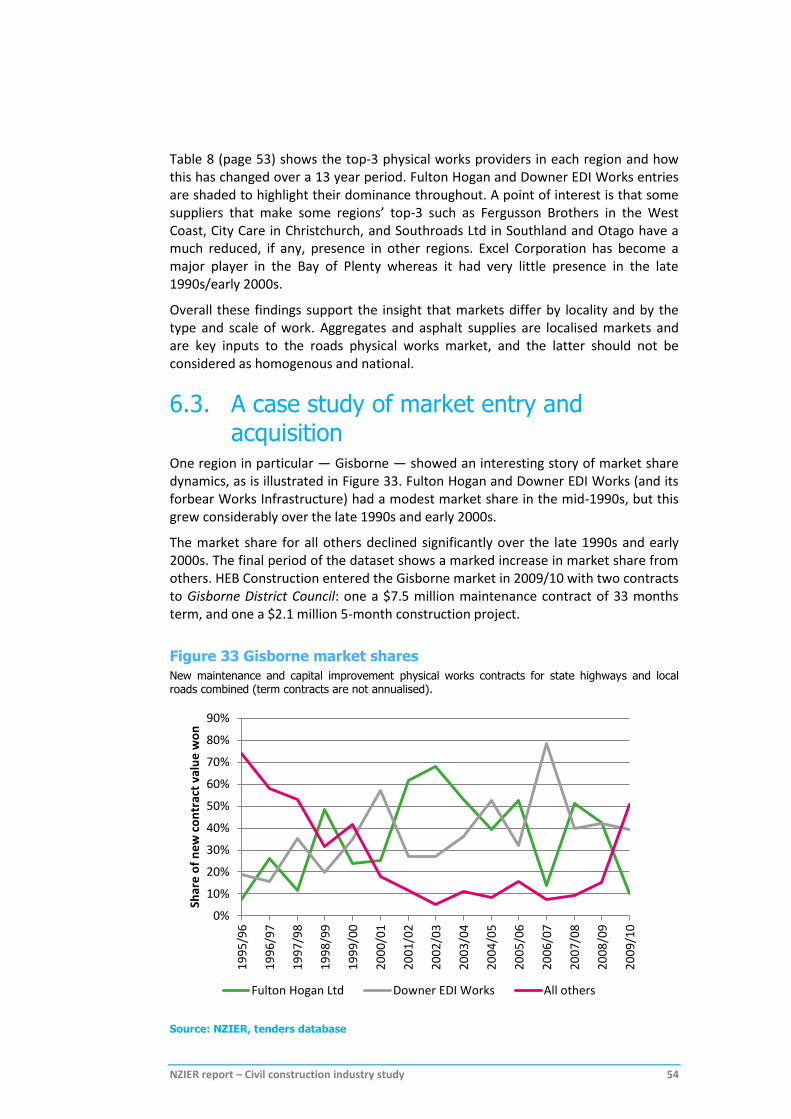
NZIER report – Civil construction industry study 54
Table 8 (page 53) shows the top-3 physical works providers in each region and how this has changed over a 13 year period. Fulton Hogan and Downer EDI Works entries are shaded to highlight their dominance throughout. A point of interest is that some suppliers that make some regions’ top-3 such as Fergusson Brothers in the West Coast, City Care in Christchurch, and Southroads Ltd in Southland and Otago have a much reduced, if any, presence in other regions. Excel Corporation has become a major player in the Bay of Plenty whereas it had very little presence in the late 1990s/early 2000s.
Overall these findings support the insight that markets differ by locality and by the type and scale of work. Aggregates and asphalt supplies are localised markets and are key inputs to the roads physical works market, and the latter should not be considered as homogenous and national.
6.3. A case study of market entry and acquisition
One region in particular — Gisborne — showed an interesting story of market share dynamics, as is illustrated in Figure 33. Fulton Hogan and Downer EDI Works (and its forbear Works Infrastructure) had a modest market share in the mid-1990s, but this grew considerably over the late 1990s and early 2000s.
The market share for all others declined significantly over the late 1990s and early 2000s. The final period of the dataset shows a marked increase in market share from others. HEB Construction entered the Gisborne market in 2009/10 with two contracts to Gisborne District Council: one a $7.5 million maintenance contract of 33 months term, and one a $2.1 million 5-month construction project.
Figure 33 Gisborne market shares
New maintenance and capital improvement physical works contracts for state highways and local roads combined (term contracts are not annualised).
Source: NZIER, tenders database
0%
10%
20%
30%
40%
50%
60%
70%
80%
90%
19
95
/96
19
96
/97
19
97
/98
19
98
/99
19
99
/00
20
00
/01
20
01
/02
20
02
/03
20
03
/04
20
04
/05
20
05
/06
20
06
/07
20
07
/08
20
08
/09
20
09
/10
Shar
e o
f n
ew
co
ntr
act
valu
e w
on
Fulton Hogan Ltd Downer EDI Works All others
NZIER report – Civil construction industry study 55
The reduction in market share from other suppliers followed Works Infrastructure’s acquisition of Bitumix, which was one of the top-3 suppliers according to Table 8 (page 53) with a market share of about 18%. This acquisition followed a favourable Commerce Commission decision No. 322 dated 7 April 1998.
The Commerce Commission defined the market not regionally but nationally because the three companies Work Infrastructure, Fulton Hogan and Bitumix operated on a nationwide basis. Their decision was also made in the following contexts:
bitumen was provided by Shell NZ, BP Oil NZ, and Caltex NZ
Local Authority Trading Enterprises (LATEs) were expanding into different regions
local authorities owned more of the quarries than they do now.
The situation has now changed as Fulton Hogan and Downer EDI Works are now the main owners of bitumen storage facilities and local authorities have sold quarries.
6.4. Monitoring of collusion Collusion involves illegal agreements between competitors not to compete with each other, such as price fixing, the restriction of outputs, the allocation of customers, suppliers or territories, and bid rigging.42 This can lead to increased prices and reductions in choice, innovation and quality.
Cartels are an explicit and institutional form of collusion (Cabral 2000, page 127). They are prohibited by the Commerce Act. Tacit collusion does not arise from explicit agreements and can arise from historical reasons or because of natural focal points. For instance, competitors may settle on a coordinated approach to pricing or carving up the market that increases their joint profits.
The Commerce Commission (ComCom) provides a range of guidelines to inform and advise market participants and purchasers, including the patterns and warning signs to look for when bid rigging might be involved.43
ComCom advises44, amongst other things, that procurers:
learn about the market (gather information about the market and collect information about past tenders)
ensure the largest number of potential bidders, and avoid preferential treatment of certain classes of suppliers, or companies that have contracts up for renewal, which can discourage other suppliers from bidding
keep a database of past and present tenders to assist in the detection of bidding patterns.
Likewise the Australian Competition and Consumer Commission (ACCC)45 advise that procurers study the bidding patterns of successive winning and losing tenders over time. This is because it is usually the only way to detect tender rotation.
42 Commerce Commission www.comcom.govt.nz/the-commission/commission-policies/cartel-leniency-policy
43 www.comcom.govt.nz/business-competition
44 www.comcom.govt.nz/business-competition/fact-sheets-3/how-to-deter-bid-rigging-2
45 www.accc.gov.au/publications/cartels-deterrence-detection-a-guide-for-government-procurement-officers

NZIER report – Civil construction industry study 56
Present practice in New Zealand falls short of adhering to this advice fully, as illustrated by the problems we have encountered with the tenders data (see 6.2.1 above) and the lack of previously documented knowledge on the state of the regional markets and supply chains. Moreover, as to be discussed in section 6.5 further below on procurement, the changes in procurement to concentrate markets may discourage other suppliers from bidding upon renewal of the contracts.
The ACCC also provides a range of market risk factors that make it easier for cartels to operate, including:
Table 9 Conditions that support cartels
Assessment of the market conditions in New Zealand as they relate to the roads physical works markets
ACCC conditions that make it easier for cartels to
operate
Comment on New Zealand market
conditions
Long-established firms have come to dominate the market
True
The industry is specialised or capital intensive; therefore, it is costly and difficult for new firms to set up
This is not generally true of road physical works sector, but it is more so for upstream sectors such as quarries, asphalt plants, bitumen storage, and specialist activities (e.g. tunnel boring)
Many competitors are unable or unwilling to supply because of geographic isolation
True, because markets appear to be localised
It is essential and has few or no alternatives True
Demand is stable and predictable True
It is a standard ‘off the shelf’ product or service and the same for all providers and buyers
True, particularly given the prevalence of prescriptive standards
The product or service is highly technical or specialised For larger scale works this could be true
Purchasing activities are regular and predictable True
Purchasing activities are open and transparent (e.g. Government tendering)
True
Source: ACCC Cartels Deterrence Detection A Guide For Government Procurement Officers and
NZIER
The conditions the ACCC list that make cartels easier to operate mostly hold in the New Zealand roads physical works markets, particularly for larger scale works. There would appear a clear need to monitor tenders data more rigorously than is done at present, given the risk indicators of market structure given by the ACCC.

NZIER report – Civil construction industry study 57
6.5. Procurement policy and practice Procurement is a primary lever for influencing the competitiveness of markets and its productivity (and thus cost escalation). It does this by affecting the structure and conduct of markets.
In this section we first refer to the chapters above to outline how procurement can affect the conduct, structure, and performance of markets. We commence with conduct rather than structure, as procurement in the first instance relates to bidding strategies, market entry, competitive behaviour and the like, which in the longer run affects the structure of markets.
We then review the capabilities and policies (existing and emerging) of purchasing organisations.
6.5.1. Procurement and the conduct of markets
Procurement practice can affect markets via the size, scope, duration and number of contracts that come to market, and the conditions46 as to who can be awarded them. Procurement strategies can, in principle, explicitly relate to the upstream supply markets, such as aggregate and asphalt, which directly affects the conduct and structure of the supply chains, and thus their overall performance.
Procurement practice can affect the risks of suppliers colluding, such as through:
purchasers’ capability and credibility to monitor, detect, follow up on suspicious bidding patterns, bidding behaviour, pricing and other conduct
creating ‘patches’ or turfs that are salient and help to support tacit collusion47.
Although large long-term contracts may support investment by suppliers in staff and capital, it comes at the trade-off of risking the market becoming less contestable at the time of contract renewal.
We noted in the previous section that ComCom advises that procurement be designed in a way that minimises advantages to companies that have contracts up for renewal. When large long-term contracts come up for renewal potential new entrants may not be attracted to bid because incumbents have a real and/or perceived advantage. For instance, incumbents could:
be vertically integrated, meaning they have tied up the suppliers of production inputs
have developed excess capacity in their localised production processes and specialist sites, meaning they could win most wars of attrition
have won all rights of renewals that were available, signalling clearly that the purchaser has been satisfied with their performance to date.
46 Such as ‘resource requirements’ (the need to have certain capabilities), track record requirements (that one must be an
incumbent supplier), and prequalification (which will have its own pre-set conditions in order to short-list suppliers).
47 Barrus (2011) found “that in 94 out of 120 counties there was evidence of bid coordination or tacit collusion with increases in bid levels. There is evidence that 25 of the 31 Kentucky asphalt paving firms refuse to bid against their rivals in their rival’s territories. This refusal by firms to bid against each other resulted in single-bid contracts that were some $70 million above the competitive level.”

NZIER report – Civil construction industry study 58
6.5.2. Procurement and the structure of markets
Procurement policies can shape the evolution of markets
Requirements and incentives for suppliers to be structured in particular ways can shape the long-term structure of markets. The current use of asphalt plants is a possible example. As Table 10 below shows, the asphalt plants across the country are operating at a level well below their capacities.48
Table 10 Asphalt plant capacities
Regions Estimated utilisation compared to
estimated total annual capacities
Canterbury and West Coast 40.0%
Rest of South Island 17.1%
Wellington, Wairarapa, Manawatu and Taranaki 23.3%
Waikato, Bay of Plenty and East Coast 17.8%
Auckland and Northland 42.0%
Source: Roading New Zealand
We tested a range of possible explanations for this with industry, and their prevailing view was that this is a product of procurement policy history, as illustrated in the following statement from Roading NZ:
Historical reasons contribute heavily to the position we find ourselves in today. 20 years ago the industry worked under separate asphalt supply, asphalt laying and chip sealing contracts for the substantial number of borough and city councils our members carried out work for. This in some situations resulted in over-investment in the local community — a contracting company could not get an asphalt contract if it did not have a plant in that town for example. This has resulted in the legacy of numerous ‘old’ plants that have been maintained in a serviceable condition. The new contract models currently being introduced may promote change? (Roading NZ)
Historical policies well may play a role, as outlined above, but there remain questions as to how an industry can sustain in the long-run such levels of underutilisation and why competition has not rationalised it. Either the returns from running at these low levels are sufficient (or else more would have closed), or these plants must be key parts in wider strategies of market interactions between these vertically integrated suppliers in the context of local authority and NZTA procurement strategies.
48
Refer to section 5.4.2 on page 33 for the number of asphalt plants and their ownership.

NZIER report – Civil construction industry study 59
Market concentration, vertical integration, and barriers to entry
Sections 5.3, 5.4, 4.5, and 5.5 respectively describe: the extent of increasing concentration in the road physical works markets; the increasing concentration in upstream supply markets; the reducing numbers of quarries in each region; and the considerable extent of vertical integration in about half of the regions across the country.
Large long-term contracts also encourage suppliers to appropriate their supply channels (vertically integrate), thus further reducing the ability of new entrants at the time of contract renewal. The risk is that potential entrants would have less choice in obtaining their inputs, and may need to buy from the incumbent competitor (who can choose where to take their margin across the supply chain).
Opus (2012 p4) suggests a possible trend towards larger and more aggregated road maintenance contracts over the past few years. This coincides with the increased concentration and vertical integration found in the market.49
6.5.3. Procurement and the performance of markets
The performance of markets is intended to be centre-stage in procurement design. The Land Transport Management Act (section 25) establishes that procurement procedures must be “designed to obtain the best value for money” and that competition is desirable because it drives value for money in the long term as well as in the short term. This is reflected in the NZTA Procurement Manual, providing procedures and guidelines that local authorities and HNO must follow in procurement. Thus NZTA policies tend to shape local authorities’ procurement conduct across the country, and hence construction industry supply strategies and logistics.
Procurement that leads to increased concentration within layers in the supply chain risks worsening long-term performance of markets. If poorly managed, prices could be higher in the long-run, choices fewer, and quality reduced. The problem spills over to other sectors that use the supply chains too, such as the commercial building sector’s use of aggregates from quarries operated by roading contractors. Thus road procurers’ strategies can cause negative externalities in other markets.
6.5.4. Countervailing power
A key to mitigating these risks is for purchasers to use their countervailing bargaining power. This can occur by directly contracting upstream supply markets to make available cheaper products on a non-preferential basis, and thereby support competition in the roading market.50 This maybe be a superior mitigation strategy
49 Larger, longer-term contracts may promote concentrated and vertically integrated markets, but we have not investigated
whether there is evidence of a cause-effect relationship. When considering correlations one needs to consider whether the cause-effect goes the other way (or something else causes both). Thus there is a question of whether a more concentrated and vertically integrated market is influencing the trend towards larger longer-term contracts.
50 Note this does not need to preclude the ability for some vertical integration. That is, not all suppliers need to be party to the negotiation.

NZIER report – Civil construction industry study 60
than allowing vertical integration because it is more likely to result in a less concentrated roading supply market.
A well-known alternative to negotiating prices for using countervailing power to mitigate market power is for purchasers to own parts of the supply chain themselves, such as quarries. Wellington City Council, for example, owns Kiwipoint quarry, which supplies aggregate to the whole market on a non-preferential basis.51
6.5.5. Procurement policies and capabilities of RCAs
Procurement capabilities and practice
NZTA’s Highway and Network Operations (HNO) group has substantial procurement capability and has led the market by introducing many innovative procurement approaches over the last 15 years. These have included a move to collaborative and early contractor engagement models in construction, and the use of alliances and performance based contracts for maintenance. NZTA are now venturing into New Zealand’s first potential private-public partnership of a transport project for the construction of Transmission Gully.
Auckland Transport (AT) has also built significant procurement capability following the merger of the former Auckland local authorities. AT has developed a comprehensive procurement strategy approved by the NZTA board. They are now in the process of progressively tendering up to 8-year-long road maintenance contracts across 9 maintenance areas in the Auckland road network; a reduction from 24 contracts previously. Their tender strategy places constraints on how many areas can be won by a bidder in order to maintain the competition in the longer run.
There are significant challenges for small local authorities in building and sustaining procurement capabilities. The recent report of the Local Government Infrastructure Efficiency Expert Advisory Group noted the recurring theme is around the difficulties and cost for small councils in maintaining infrastructure expertise. The Advisory Group has recommended that Councils move delivery of land transport infrastructure to a regional level through the use of, for example, joint council controlled organisations.52
New procurement approach
The NZTA’s HNO group is planning considerable change to its procurement. It plans to move to 23 bundled (‘fence to fence’), long-term (5+2+2 years, depending on performance) contracts for maintenance across the national state highway network.53 Like Auckland Transport, other local authorities are likely to follow this kind of approach to a greater or lesser extent.
51
Wellington City Council (March 2010) Procurement Strategy Transport Assets
52 Page 17 Local Government Infrastructure Efficiency Expert Advisory Group March 2013
53 One of these is the existing Auckland Motorway Alliance; 22 will be new contracts.

NZIER report – Civil construction industry study 61
According to the NZTA’s Consultation Document54 the rationale for each element is as follows:
for such long-term contracts:
reduce costs of re-tendering, and
“enable better allocation of resources and long-term investment in learning and development. For the NZTA, it encourages greater competitiveness at tender time and will underpin future strengthening of our partnership/collaboration with industry to deliver better outcomes”
for so few contracts (‘contract aggregation’):
maintenance cost per kilometre reduces as the geographic coverage of contracts increases, up to an optimum of 500–1000km
“reduce administrative and tendering overhead costs, enable optimal utilisation of resource (including plant), and support enhanced capability building across the industry through more strategic allocation of people and expertise”
for such all-encompassing contracts (‘fence-to-fence’):
greater supplier ownership and accountability for the overall performance of the network
improve road users’ experience by ensuring coordinated programming of works.
We have the following observations to make regarding the above rationale in light of the analysis in this paper on the structure, conduct and performance of markets:
for such long-term contracts:
the cost of tendering is a necessary cost of a market economy, and although retendering annually may be excessive, retendering up to every nine years is an opposite extreme
we have seen no evidence that there is a suboptimal allocation of resources and long-term investment in learning and developing arising from the current length contracts; the lack of productivity in the sector may be explained by other factors considered in this report
we are unaware of analysis that robustly supports a hypothesis that there will be greater competition at tender time; in fact, our analysis points to a risk of the opposite arising in the long-run
strengthening partnership/collaboration with industry may work if this was how NZTA exploited its countervailing power; however, it is unclear how strongly NZTA would act on behalf of consumers (road users) to maximise the long-term gains of trade to consumers at the expense of suppliers
tying up the maintenance and operations sector away for such long periods of time removes policy flexibility, which may, in time, become regrettable
54
NZTA, State Highway Maintenance and Operations Review, Consultation Document. July 2012
NZIER report – Civil construction industry study 62
for so few contracts:
the analysis is underpinned by pages 10–11 of a document called “Maintenance and Operations Review; Procurement Task Group – Discussion Paper”
the case is unproven that larger area contracts will lead to efficiencies
further analysis is needed that carefully controls for other factors that drive costs such as widely varying aggregate prices
the outcomes observed, which are founded on current market structure, may not hold once the market structure has been changed by the policy55, particularly if market power increases
for such all-encompassing contracts (‘fence-to-fence’):
the references to fence-to-fence contracts per se in the MOR Procurement Task Group Discussion Paper relate to comparisons of hybrid contracts to traditional contracts, which is not the same comparison
the analysis of hybrids versus traditional (figure 7, pages 5–6) also need to control for the factors that caused each form of contract to be chosen before one can compare them
the benefits of better coordinating activities to minimise road user disruption and costs is good, but can they be obtained through other ways that less impact upon the structure and conduct of markets?
6.6. Conclusion on conduct Our key conclusions on market conduct are:
procurement practice can affect the structure, conduct and performance of markets, but yet this does not seem to be well considered in the current trend towards very long-term, all-encompassing and wide area contracts
the conduct of road physical works suppliers sector is opaque, and there is limited understanding of the operation and conduct of markets as a whole (combined local roads and state highways)
the breadth, quality, and necessary timeliness of centralised tender data is insufficient to monitor, identify and action suspected bid rigging
competition, as measured by numbers of tenders, has decreased since the road construction boom started in 2004/05 for contracts from $4 million
there is evidence that smaller firms have successfully challenged major incumbents within some regions.
55
This is called the Lucas Critique. en.wikipedia.org/wiki/Lucas_critique

NZIER report – Civil construction industry study 63
7. Bibliography Advisory Group on Roading Costs. 2006. ‘Final Report by the Ministerial Advisory
Group on Roading Costs’. Wellington: Ministry of Transport.
Aggregate & Quarry Association of NZ. ‘“The Tyranny of Distance” Counting the Cost of Transporting Aggregates’.
Auckland Transport. 2012. ‘Procurement Strategy July 2012-June 2015’. PR02 - 01 (Jul 12 ). Auckland: Auckland Transport.
Australia. Bureau of Transport, Infrastructure and Regional Economics [BITRE]. 2011. ‘BITRE Road Construction and Maintenance Price Index 2011 Update’. Information Sheet 42. Canberra: BITRE.
Barrus, David R. 2011. ‘Firm Bidding Behavior in Highway Procurement Auctions: An Analysis of Single-bid Contracts, Tacit Collusion, and the Financial Impact on Kentucky’. University of Kentucky. http://uknowledge.uky.edu/gradschool_diss/191/.
Braconier, Henrik, Mauro Pisu, and Bloch. 2013. ‘The Performance of Road Transport Infrastructure and Its Links to Policies’. OECD Economics Department Working Paper No. 1016. Paris: OECD Publishing. http://www.memofin.fr/uploads/library/pdf/5k4c0dldmgr2[1].pdf.
BRANZ. 2011. ‘Construction Industry Segmentation’. BRANZ Study Report SR 266.
Building and Construction Productivity Partnership. 2012. ‘Auckland’s Procurement Forum : Proactive Engagement of Auckland’s Building and Construction Industry’. Auckland Pipeline report no. 2. Wellington: Ministry of Business, Innovation and Employment.
Cohen, Claire. 2011. ‘Productivity in Civil Construction: a Contracting Industry Perspective’. Wellington: New Zealand Contractors Federation.
Commerce Commission. 1998. ‘Commerce Commission Decision No. 322 : Works Civil Construction Limited and Bitumix Limited’. Wellington: Commerce Commission.
Davis, Nick. 2007. ‘Construction Sector Productivity’. A MartinJenkins scoping report prepared for the Department of Building and Housing. http://www.martinjenkins.co.nz/documents/ConstructionSectorProductivityScopingReport-FINALREPORT13December2007.pdf.
Devine, Hilary, Tinh Doan, Kris Lyer, Penny Mok, and Philip Stevens. 2012. ‘Competition in New Zealand Industries: Measurement and Evidence’. Wellington: Ministry of Economic Development.
Gill, D., and J Zuccollo. 2012. ‘Role and Limits of Performance Measures. Report of the Performance Measurement Research Project for the Technical Working Group’. Report to Road Maintenance Task Force - Better Asset Management, Planning and Delivery. Wellington: NZIER.
Government Procurement Experts’ Group. 2006. ‘Review of the APEC Non-Binding Principles (NBPs) on Government Procurement’. APEC.
NZIER report – Civil construction industry study 64
Grout, Paul, Sylvia Sonderegger, and Great Britain. 2005. ‘Predicting Cartels’. Economic Discussion Paper OFT 773. Office of Fair Trading. http://www.oft.gov.uk/shared_oft/reports/comp_policy/oft773.pdf.
International Transport Forum. 2013a. ‘Spending on Transport Infrastructure 1995-2011: Trends, Policies, Data’. Paris: OECD.
———. 2013b. ‘Understanding the Value of Transport Infrastructure : Guidelines for Macro-level Measurement of Spending and Assets’. Task Force on Measuring Transport Infrastructure Spending and Assets. Paris: OECD.
Local Government Infrastructure Efficiency Expert Advisory Group. 2013. ‘Performance Based Contracts’. Wellington: Department of Internal Affairs.
Local Government Infrastructure Efficiency, and Expert Advisory Group. 2013. ‘Report of the Local Government Infrastructure Efficiency Expert Advisory Group’. Wellington: Department of Internal Affairs.
Malpass, Mark. 2012. ‘Concrete Analyst’s Presentation’ presented at the Fletcher Building May 2012 meeting.
Mason, Geoff, and Matthew Osborne. 2007. ‘Productivity, Capital-intensity and Labour Quality at Sector Level in New Zealand and the UK’. New Zealand Treasury working paper 07/01. Wellington: New Zealand Treasury. http://www.uquebec.ca/observgo/fichiers/28540_DE3.pdf.
Ministry of Business, Innovation & Employment. 2012. ‘Residential Construction Sector Market Study : Issues Paper’. Wellington: Ministry of Business, Innovation & Employment.
Ministry of Economic Development. 2003. Portland Cement from Thailand: Non-Confidential Final Report Dumping and Countervailing Duties Act 1988 Dumping Investigation. Wellington: Ministry of Economic Development.
Ministry of Transport. 2007. ‘Improving Input Cost Escalation Estimation : Scoping Phase’. Report no. WL00067. Wellington: Ministry of Transport.
National Infrastructure Advisory Board & National Infrastructure Unit. 2012. ‘Infrastructure 2012: National State of Infrastructure Report: A Year on from the National Infrastructure Plan’. Wellington: New Zealand Treasury.
New Zealand Government. 2012. ‘Connecting New Zealand : A Summary of the Government’s Policy Direction for Transport’.
New Zealand, and Office of the Auditor-General. 2013. Transport Sector: Results of the 2011/12 Audits. Wellington [N.Z.]: Office of the Auditor-General.
NZ Transport Agency. 2010a. ‘Cost Indices for Infrastructure’. In Procurement Manual. Wellington: NZ Transport Agency.
———. 2010b. ‘State Highway Portfolio Procurement Strategy 2010’. Wellington: NZ Transport Agency.
———. 2011. ‘NZ Transport Agency Annual Report and the National Land Transport Forum Annual Report for the Year Ended 30 June 2011’. Wellington: NZ Transport Agency.

NZIER report – Civil construction industry study 65
———. 2012a. ‘HNO Environmental and Social Responsibility Manual’. SP/M/023 Version 1. Wellington: NZ Transport Agency.
———. 2012b. ‘Root Cause Analysis’. Wellington: NZ Transport Agency.
———. 2012c. ‘State Highway Maintenance and Operations Review Consultation Document’. Wellington: NZ Transport Agency.
———. 2012d. ‘Super Clients and Super Contractors’.
NZIER. 2007. ‘Building Construction Material Costs and Labour Costs. Part 1: Trends (Final Report)’. Report to Department of Building and Housing. Wellington: NZIER.
———. 2011. ‘Industry Productivity and the Australia - New Zealand Income Gap’. NZIER public discussion document 2011/3. Wellington: NZIER.
———. 2013. ‘NZIER Construction Productivity An Evidence Base for Research and Policy Issues’. NZIER report to the Building & Construction Sector Productivity Partnership.
O’Brien, J. 2006. ‘Planning for Growth? The Determinants of Aggregates Demand in New Zealand’. IPENZ Engineering TreNz 003.
Office of the Auditor-General. 2010. New Zealand Transport Agency: Information and Planning for Maintaining and Renewing the State Highway Network. Wellington: Office of the Auditor-General.
———. 2011. New Zealand Transport Agency: Delivering Maintenance and Renewal Work on the State Highway Network. Wellington: Office of the Auditor-General.
———. 2012a. Local Government: Results of the 2011/12 Audits. Wellington [N.Z.]: Office of the Auditor-General.
———. 2012b. Matters Arising from the 2012-22 Local Authority Long-term Plans. Wellington, [N.Z.]: Controller and Auditor-General.
Olsen, Chris. 2013a. ‘Performance Based Contracts; Proven Value for Money’. Contractor Magazine.
———. 2013b. ‘Productivity and Procurement in the Transport Sector : Lessons Learnt’. Presentation to the Ministry of Transport.
OPUS. 2012. ‘Opus SH Network Physical Works Procurement Survey’.
Page, I. C., and M. D. Curtis. 2011. ‘Firm Productivity Variations’. BRANZ Study Report No. SR 254.
Portland Cement Association. 2012. ‘The New Paving Realities: The Impact of Asphalt Cost Escalator Clauses on State Finances’.
PwC. 2011. ‘Valuing the Role of Construction in the New Zealand Economy’. A report to the Construction Strategy Group. Auckland: PwC.
———. 2012. ‘Evaluating Different Approaches to Maintenance and Operations Procurement’. Report prepared for the New Zealand Transport Agency.
Road Maintenance Taskforce. 2012. ‘Review of Road Maintenance Regime’. Wellington: NZ Transport Agency.

NZIER report – Civil construction industry study 66
Rotemberg, Julio J., and Garth Saloner. 1990. ‘Collusive Price Leadership’. The Journal of Industrial Economics 39 (1) (September 1): 93–111. doi:10.2307/2098369.
Skolnik, Jonathon. 2011. ‘Price Indexing in Transportation Construction Contracts’. Prepared for The Transportation Research Board AASHTO Standing Committee on Highways.
Statement of Evidence of Richard Spencer English. 2011 UNDER the Resource Management Act 1991 IN THE MATTER OF the Proposed Canterbury Regional Policy Statement (2011) A N D IN THE MATTER of Submissions and Further Submissions by Fulton Hogan Ltd , Winstone Aggregates Ltd and the Aggregate & Quarry Association of New Zealand. Before the Canterbury Regional Council.
Statistics New Zealand. 2010. ‘Industry Productivity Statistics 1978-2008’. Wellington: Statistics New Zealand.
UK. Cabinet Office. 2011. ‘Government Construction Strategy’. London. https://www.gov.uk/government/uploads/system/uploads/attachment_data/file/61152/Government-Construction-Strategy_0.pdf.
———. 2012. ‘Making Government Business More Accessible to SMEs – One Year On’. Progress report on enabling more SMEs to tender for government procurements. London.
US. Office of Transportation Economics. 2011. ‘Construction Aggregate Supply Limitations Some Estimates of Economic Impact’.
Wellington City Council. 2010. ‘Procurement Strategy : Transport Assets’. Wellington: Wellington City Council.