Embed Size (px)
Citation preview
Construction FinancingConstruction Financing
William GietemaWilliam Gietema
Arcadia RealtyArcadia Realty
Dallas, TexasDallas, Texas

Construction LoansConstruction Loans
Money Moves DifferentlyMoney Moves Differently
Short TermShort Term
Transaction IntensiveTransaction Intensive
Process IntensiveProcess Intensive
Overhead IntensiveOverhead Intensive
Fee DrivenFee Driven
Expensive / ProfitableExpensive / Profitable

Sources of Construction LendingSources of Construction Lending
Commercial Banks Commercial Banks – Short Term Loans match Short Term LiabilitiesShort Term Loans match Short Term Liabilities– High Returns Present Competitive AdvantagesHigh Returns Present Competitive Advantages– Local Knowledge:Local Knowledge:
Real Estate MarketReal Estate Market
Construction MarketConstruction Market
Personal Relationships with BorrowersPersonal Relationships with Borrowers
– Syndication of Loans Between MarketsSyndication of Loans Between Markets

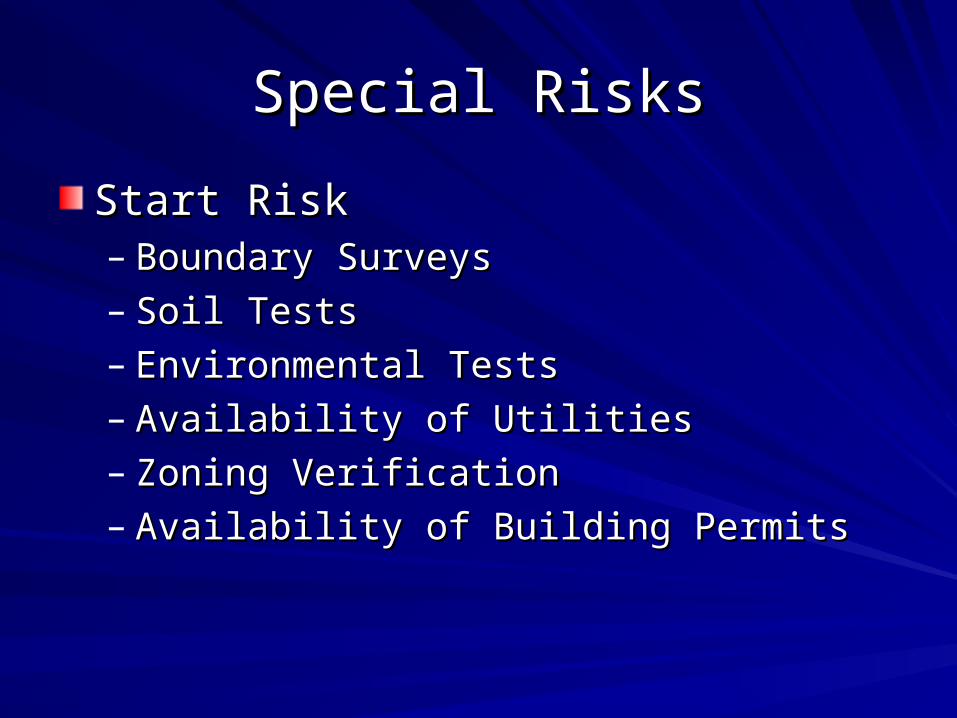
Special RisksSpecial Risks
Takeout RiskTakeout Risk– Opportunity CostOpportunity Cost– Risk of LossRisk of Loss
Commitment for Permanent FinancingCommitment for Permanent Financing– Type of CommitmentType of Commitment– Sponsorship of CommitmentSponsorship of Commitment– ContingenciesContingencies
Delivery DateDelivery DateSpecificationsSpecificationsEconomicEconomic
Special RisksSpecial Risks
Start RiskStart Risk– Boundary SurveysBoundary Surveys– Soil TestsSoil Tests– Environmental TestsEnvironmental Tests– Availability of UtilitiesAvailability of Utilities– Zoning VerificationZoning Verification– Availability of Building PermitsAvailability of Building Permits

Special RisksSpecial Risks
Completion RiskCompletion Risk– Quality of DesignQuality of Design– Quality of BudgetsQuality of Budgets– Quality of ConstructionQuality of Construction– Financial Strength of ContractorsFinancial Strength of Contractors– Hold Back / RetainageHold Back / Retainage– Contingency BudgetContingency Budget– Quality of ContractsQuality of Contracts
Sponsorship RiskSponsorship Risk– Experience of BorrowerExperience of Borrower– Financial Strength of BorrowerFinancial Strength of Borrower
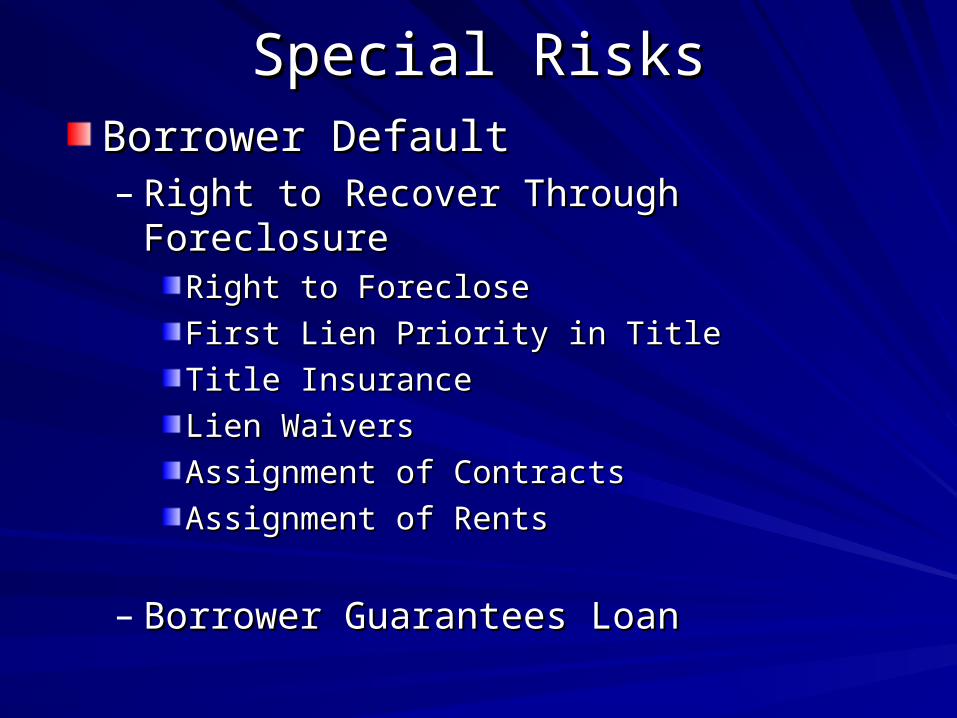
Special RisksSpecial RisksBorrower DefaultBorrower Default– Right to Recover Through ForeclosureRight to Recover Through Foreclosure
Right to Foreclose Right to Foreclose
First Lien Priority in TitleFirst Lien Priority in Title
Title InsuranceTitle Insurance
Lien WaiversLien Waivers
Assignment of ContractsAssignment of Contracts
Assignment of RentsAssignment of Rents
– Borrower Guarantees LoanBorrower Guarantees Loan

Construction Loans Construction Loans VsVs
Land Development LoansLand Development Loans
Primary Difference between a Construction Primary Difference between a Construction Loan and a Land Development Loan are the Loan and a Land Development Loan are the sources of repayment.sources of repayment.
Construction Loans - Taken-Out (Wholesale)Construction Loans - Taken-Out (Wholesale)
Land Development Loans – Sold-Out (Retail)Land Development Loans – Sold-Out (Retail)Subdivision of Lien and Partial Release of LoanSubdivision of Lien and Partial Release of Loan

Retailing LandRetailing Land

Land Development LoanLand Development Loan
Construction Lender now Responsible for all Construction Lender now Responsible for all Underwriting AnalysisUnderwriting Analysis
Incremental Repayment Over Sales PeriodIncremental Repayment Over Sales Period
Loan Performance Tied to Project Loan Performance Tied to Project Performance in the Market PlacePerformance in the Market Place
Longer Term = Extended Risk HorizonLonger Term = Extended Risk Horizon
More Interest Rate SensitiveMore Interest Rate Sensitive
Quality of Collateral Subject To ChangeQuality of Collateral Subject To Change
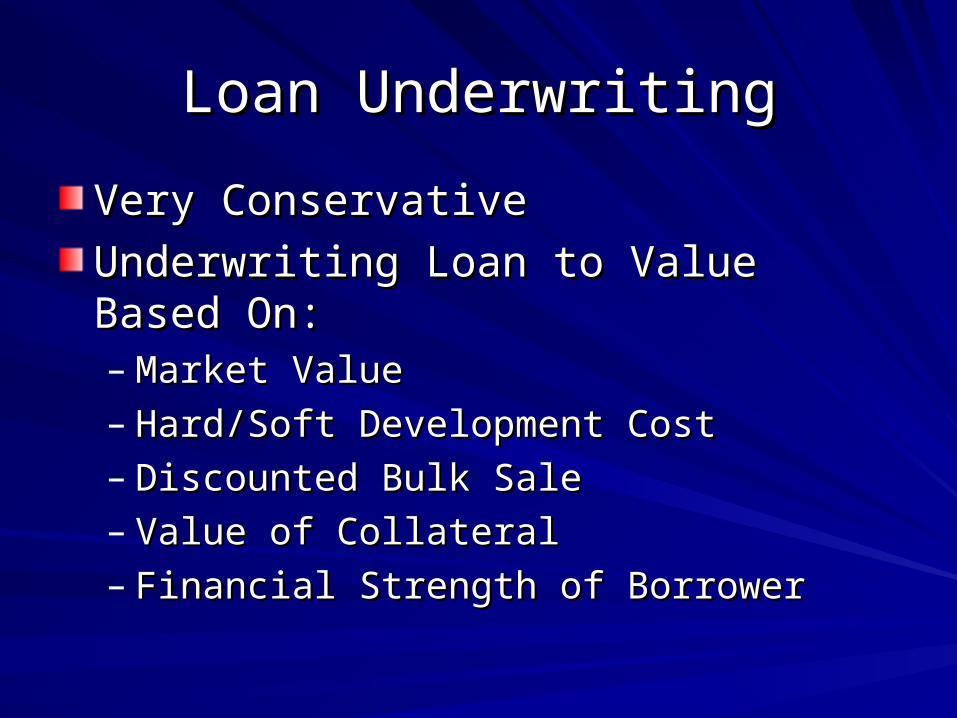
Loan UnderwritingLoan Underwriting
Very ConservativeVery Conservative
Underwriting Loan to Value Based On:Underwriting Loan to Value Based On:– Market ValueMarket Value– Hard/Soft Development CostHard/Soft Development Cost– Discounted Bulk SaleDiscounted Bulk Sale– Value of CollateralValue of Collateral– Financial Strength of BorrowerFinancial Strength of Borrower

Dendritic AcresArea 100 AcresLand Price 20,000$ Per AcreLand Value 2,000,000$
Total Lots 300 Lots Density 3.00 Lots/AcrePaper Lot Value 6,666.67$ Per Lot
Development Cost 60,000$ Per AcreTotal Dev Cost 6,000,000$ Dev Cost Per Lot 20,000$ Per Lot
Total Cost 8,000,000$ Total Lot Cost 26,667$ Per Lot
Retail Market Value 35,000$ Per Lot
Gross Retail Margin 31%
Market ValueLoan to Value Total Market Value Loan Amount Implied Equity Hard Equity Loan as % Cost
75% 10,500,000$ 7,875,000$ 2,625,000$ 125,000$ 98.44%
Percentage of Development CostLoan to Dev Cost Total Market Value Loan Amount Implied Equity Hard Equity Loan as % Cost
75% 10,500,000$ 4,500,000$ 6,000,000$ 3,500,000$ 56.25%
Discounted Bulk Sale ValueLoan to Dev Cost 80% Retail Value Loan Amount Implied Equity Hard Equity Loan as % Cost
75% 8,400,000$ 6,300,000$ 4,200,000$ 1,700,000$ 78.75%

Time and RiskTime and Risk
Longer Term = Extended Risk HorizonLonger Term = Extended Risk Horizon
Incremental Repayment Over Sales Incremental Repayment Over Sales PeriodPeriod
Loan Performance Tied to Project Loan Performance Tied to Project Performance in the Market PlacePerformance in the Market Place
Quality of Collateral Subject To ChangeQuality of Collateral Subject To Change

Release PriceRelease Price
Determines the Amount of Principal Determines the Amount of Principal Repayment Made with Each Lot Sale.Repayment Made with Each Lot Sale.
Intended to Accelerate Loan RepaymentIntended to Accelerate Loan Repayment
Shorten Risk Horizon = Reduce RiskShorten Risk Horizon = Reduce Risk

Dendritic Acres: Release PriceArea 100 AcresLand Price 20,000$ Per AcreLand Value 2,000,000$
Total Lots 300 Lots Density 3.00 Lots/AcrePaper Lot Value 6,667$ Per Lot
Development Cost 60,000$ Per AcreTotal Dev Cost 6,000,000$ Dev Cost Per Lot 20,000$ Per Lot
Total Cost 8,000,000$ Total Lot Cost 26,667$ Per Lot
Retail Market Value 35,000$ Per Lot
Gross Retail Margin 31%
Percentage of Loan AmountRelease Price Loan Amount Loan Per Lot Release Price RP as % Cost Loan Retired % Sell-Out
100% 6,300,000$ 21,000$ 21,000$ 100.00% 300 Lots 100%
Market ValueRelease Price Loan Amount Lot Value Release Price RP as % Cost Loan Retired % Sell-Out
100% 6,300,000$ 35,000$ 35,000$ 131.25% 180 Lots 60%95% 6,300,000$ 35,000$ 33,250$ 124.69% 189 Lots 63%90% 6,300,000$ 35,000$ 31,500$ 118.13% 200 Lots 67%85% 6,300,000$ 35,000$ 29,750$ 111.56% 212 Lots 71%75% 6,300,000$ 35,000$ 26,250$ 98.44% 240 Lots 80%

Developer’s RiskDeveloper’s Risk
Value of InventoryValue of Inventory– Anti-Cherry Picking Clause in Builder ContractsAnti-Cherry Picking Clause in Builder Contracts– CC&R’s Including Architectural RegulationsCC&R’s Including Architectural Regulations
Cost Overruns and Completion RiskCost Overruns and Completion Risk– Contract as much away as possibleContract as much away as possible– Architects, Engineers, Contractors, LendersArchitects, Engineers, Contractors, Lenders– Have Hard Cost Contingency in LoanHave Hard Cost Contingency in Loan

Developer’s RiskDeveloper’s Risk
Builder’s PerformanceBuilder’s Performance– Take Down ScheduleTake Down Schedule– Specific Performance ClauseSpecific Performance Clause– High Initial Lot Deposit High Initial Lot Deposit – Burn Down of DepositBurn Down of Deposit– Onsite and Marketing Performance ClausesOnsite and Marketing Performance Clauses– Quick Remedies Through Default ClauseQuick Remedies Through Default Clause
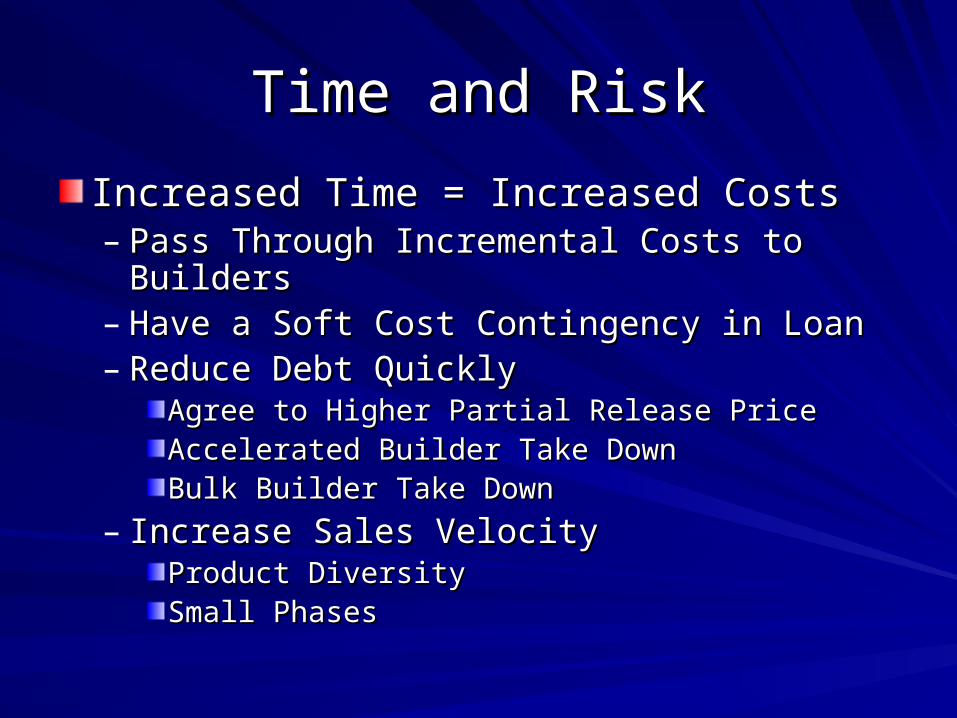
Time and RiskTime and Risk
Increased Time = Increased CostsIncreased Time = Increased Costs– Pass Through Incremental Costs to BuildersPass Through Incremental Costs to Builders– Have a Soft Cost Contingency in Loan Have a Soft Cost Contingency in Loan – Reduce Debt QuicklyReduce Debt Quickly
Agree to Higher Partial Release PriceAgree to Higher Partial Release PriceAccelerated Builder Take DownAccelerated Builder Take DownBulk Builder Take DownBulk Builder Take Down
– Increase Sales Velocity Increase Sales Velocity Product DiversityProduct DiversitySmall PhasesSmall Phases

Single ProductSingle Product

Dendritic Acres: Sales VelocityArea 100 AcresLand Price 20,000$ Per AcreLand Value 2,000,000$
Total Lots 300 Lots Density 3.00 Lots/AcrePaper Lot Value 6,667$ Per Lot
Development Cost 60,000$ Per AcreTotal Dev Cost 6,000,000$ Dev Cost Per Lot 20,000$ Per Lot
Total Cost 8,000,000$ Total Lot Cost 26,667$ Per Lot
Retail Market Value 35,000$ Per Lot
Gross Retail Margin 31%
Lot Type Retail Market Value Sales Rate Per Quarter
80X120 35,000$ 15
Absorption TableQuarter 1 2 3 4 5 6 7 8 9 1080X120 15 15 15 15 15 15 15 15 15 15Cumulative 15 30 45 60 75 90 105 120 135 150
Percentage Sold 5% 10% 15% 20% 25% 30% 35% 40% 45% 50%
ContinuedAbsorption TableQuarter 11 12 13 14 15 16 17 18 19 2080X120 15 15 15 15 15 15 15 15 15 15Cumulative 165 180 195 210 225 240 255 270 285 300
Percentage Sold 55% 60% 65% 70% 75% 80% 85% 90% 95% 100%

Product DiversityProduct Diversity

Pleasant Town: Sales VelocityArea 100 AcresLand Price 20,000$ Per AcreLand Value 2,000,000$
Total Lots 300 Lots Density 3.00 Lots/AcrePaper Lot Value 6,667$ Per Lot
Development Cost 60,000$ Per AcreTotal Dev Cost 6,000,000$ Dev Cost Per Lot 20,000$ Per Lot
Total Cost 8,000,000$ Total Lot Cost 26,667$ Per Lot
Retail Market Value 35,000$ Per Lot
Gross Retail Margin 31%
Lot Type Retail Market Value Total Sales Rate Per Quarter100X120 55,000$ 20 280X120 45,000$ 50 655X110 35,000$ 110 1240X110 30,000$ 60 8Townhomes 25,000$ 60 8
Average/Total 35,000$ 300 36
Absorption TableQuarter 1 2 3 4 5 6 7 8 9 10100X120 2 2 2 2 2 2 2 2 2 280X120 6 6 6 6 6 6 6 6 2 055X110 12 12 12 12 12 12 12 12 12 240X110 8 8 8 8 8 8 8 4 0 0Townhomes 8 8 8 8 8 8 8 4 0 0Cumilative 36 72 108 144 180 216 252 280 296 300
Percentage Sold 12% 24% 36% 48% 60% 72% 84% 93% 99% 100%

Project Phasing and RiskProject Phasing and Risk

The Worst Case Scenario:The Worst Case Scenario: Lender Declares Default Lender Declares Default
What Happens Next Depends on the What Happens Next Depends on the Guarantee the Developer SignedGuarantee the Developer Signed– Guarantee to Repay the LoanGuarantee to Repay the Loan– Guarantee to Repay all LossesGuarantee to Repay all Losses– Guarantee to Repay Lost Principal Amounts Guarantee to Repay Lost Principal Amounts – Completion GuaranteeCompletion Guarantee
The Loan Must Give the Borrower the The Loan Must Give the Borrower the Rights to Cure and ExtendRights to Cure and Extend

EquityEquitySweat/Earned EquitySweat/Earned Equity– Unrealized Value Created through the Unrealized Value Created through the
Development Process Development Process
Hard EquityHard Equity– Cash or Value Which Fills the Gap Between Cash or Value Which Fills the Gap Between
Total Loan Amounts and Total Cost.Total Loan Amounts and Total Cost.– It has Ownership and Participates in Profits It has Ownership and Participates in Profits
and Losses.and Losses.– It Deserves High Rates of ReturnIt Deserves High Rates of Return– It Should NEVER be GuaranteedIt Should NEVER be Guaranteed– It Should NEVER be the Developer’sIt Should NEVER be the Developer’s

SummarySummary
Construction and Land Development LoansConstruction and Land Development Loans– Structurally Different from Other Kinds of LoansStructurally Different from Other Kinds of Loans– Process IntensiveProcess Intensive– Extremely Time SensitiveExtremely Time Sensitive– ExpensiveExpensive
The Borrower Can Manage RisksThe Borrower Can Manage Risks– Conservative UnderwritingConservative Underwriting– Product Mix and PhasingProduct Mix and Phasing– Allocate Risk to OthersAllocate Risk to Others– Aggressively Negotiate Guarantees, Extensions Aggressively Negotiate Guarantees, Extensions
and Rights to Cureand Rights to Cure

Things To RememberThings To Remember
You are Responsible for the Amount of Risk You are Responsible for the Amount of Risk you Assumeyou Assume
You are Responsible for Managing your RiskYou are Responsible for Managing your Risk
Negotiate Risk Away from You.Negotiate Risk Away from You.
Never Use Your Own MoneyNever Use Your Own Money
Never Use Your Own MoneyNever Use Your Own Money
Never Use Your Own MoneyNever Use Your Own Money
Never Use Your Own MoneyNever Use Your Own Money

Thank YouThank You
Arcadia RealtyArcadia RealtyDallas, TexasDallas, Texas

Single ProductSingle Product

Product DiversityProduct Diversity

Diversified EconomyYear 1 Year 2 Year 3 Year 4 Year 5 Year 6 Year 7 Year 8 Year 9 Year 10 Total Sales
New Sales 1,000 1,000 1,000 1,000 1,000 1,000 1,000 1,000 1,000 1,000 10,000
Used Sales 100 200 300 400 500 600 700 800 900 1,000 5,500
Total Car Sales 1,100 1,200 1,300 1,400 1,500 1,600 1,700 1,800 1,900 2,000 15,500
Resale -3 Months 25 50 75 100 125 150 175 200 225 250
Sedan 2.5 5.0 7.5 10.0 12.5 15.0 17.5 20.0 22.5 25.0
Silver Sedan 0.25 0.50 0.75 1.00 1.25 1.50 1.75 2.00 2.25 2.50
Minivan EconomyYear 1 Year 2 Year 3 Year 4 Year 5 Year 6 Year 7 Year 8 Year 9 Year 10 Total Sales
New Sales 1,000 1,000 1,000 1,000 1,000 1,000 1,000 1,000 1,000 1,000 10,000
Used Sales 100 200 300 400 500 600 700 800 900 1,000 5,500
Total Car Sales 1,100 1,200 1,300 1,400 1,500 1,600 1,700 1,800 1,900 2,000 15,500
Resale
3 months 25 50 75 100 125 150 175 200 225 250