Embed Size (px)
Citation preview

Construction and Long‐Term Performance of Transportation Infrastructure Constructed Using EPS Geofoam on Soft Soil
Sit i S lt L k V ll Ut hSites in Salt Lake Valley, Utah
S. Bartlett, E. Lawton, C. Farnsworth, D. Negussey, A. Stuedlein, M. Perry

Objectives (UDOT contract)j ( )• Monitor the long-term performance of geofoam embankments and compare its settlement performance with other embankment systems.
• Measure the differential settlement in MSE wall transition zones• Measure the differential settlement in MSE wall transition zones.• Measure the vertical stress distribution that develops in the geofoam embankment.• Measure the vertical and horizontal stress that develops in aMeasure the vertical and horizontal stress that develops in a typical bridge abutment.
• Develop and calibrate a numerical model (FLAC) for predicting the vertical and horizontal static stress distribution in the geofoam mass for gthe instrumented embankment and abutment areas.• Use the FLAC model to predict the seismic response and sliding stability of typical geofoam configurations.• Evaluate the possible magnitude of the vertical stress transfer that is occurring to the tilt-up panel wall at 3500 South using FLAC.• Measure the temperature profile in the pavement section.

Objectives
• Long Term Monitoring• Construction Settlement• Post-Construction Settlement• Transition Zones• Settlement Performance Comparison
d d li f f• Assessment and Modeling of Performance Data• Settlement• Pressure Distribution
• Vertical• Vertical• Horizontal
• Connections and Panel Walls• Seismic DesignSeismic Design• General Design

UDOT Reports
• Bartlett, S.F., Lawton, E.C., Farnsworth, C.B., and Newman, M.P., 2011,“Design and Evaluation of Geofoam Embankment for the I-15 Reconstruction Project Salt Lake City Utah Prepared for the UtahReconstruction Project, Salt Lake City, Utah, Prepared for the Utah Department of Transportation Research Division, Report No. UT-???, Oct. 2011, 184 p.
• Bartlett, S.F. and Farnsworth, C.B., 2004. “Monitoring and Modeling of Innovative Foundation Treatment and Embankment Construction Used on the I-15 Reconstruction Project, Project Management Plan and Instrument j j gInstallation Report,” UDOT Research Report No. UT-04.19, 202 p.
• Farnsworth, C. B. and Bartlett, S. F. (2008). “Evaluation of Rapid Construction and Settlement of Embankment Systems on Soft Foundation Soils.” UDOT Research Report No. UT-08.05, Utah Department of Transportation, Salt Lake City, Utah.

Papers•Farnsworth C. F., Bartlett S. F., Negussey, D. and Stuedlein A. 2008, “Construction and Post-Construction Settlement Performance of Innovative Embankment Systems, I-15 Reconstruction Project, Salt Lake City, Utah,” Journal
f G h i l d G i l E i i ASCE (V l 134 289of Geotechnical and Geoenvironmental Engineering, ASCE (Vol. 134 pp. 289-301).
• Newman M P Bartlett S F Lawton E C 2010 “Numerical Modeling of• Newman, M. P., Bartlett S. F., Lawton, E. C., 2010, Numerical Modeling of Geofoam Embankments,” Journal of Geotechnical and GeoenvironmentalEngineering, ASCE, February 2010, pp. 290-298.
• Bartlett, S. F. and Lawton E. C., 2008, “Evaluating the Seismic Stability and Performance of Freestanding Geofoam Embankment,” 6th National Seismic Conference on Bridges and Highways, Charleston, S.C., July 27th – 30th 2008, 17 g g y , , , y ,p.
• Bartlett, S. F., Negussey, D., Farnsworth, C. B., and Stuedlein, A., 2011, “Construction and Long-Term Performance of Transportation Infrastructure Constructed Using EPS Geofoam on Soft Soil Sites in Salt Lake Valley, Utah,” EPS 2011 Geofoam Blocks in Construction Applications, Oslo Norway.

Papers (cont.)
• Bartlett, S. F., Trandafir, A. C., Lawton E. C. and Lingwall, B. N., 2011, “Applications of EPS Geofoam in Design and Construction of Earthquake Resilient Infrastructure,” EPS 2011 Geofoam Blocks in ConstructionResilient Infrastructure, EPS 2011 Geofoam Blocks in Construction Applications, Oslo Norway.
• Bartlett S. F., Farnsworth, C., Negussey, D., and Stuedlein, A. W., 2001, “Instrumentation and Long-Term Monitoring of Geofoam Embankments, I-15 Reconstruction Project, Salt Lake City, Utah,” EPS Geofoam 2001, 3rd
International Conference, Dec. 10th to 12th, 2001, Salt Lake City, Utah, 23 p.
• Negussey, D., Stuedlin, A. W., Bartlett, S. F., Farnsworth, C., “Performance of Geofoam Embankment at 100 South, I-15 Reconstruction Project, Salt Lake Cit Ut h ” EPS G f 2001 3rd I t ti l C f D 10th t 12thCity, Utah,” EPS Geofoam 2001, 3rd International Conference, Dec. 10th to 12th, 2001, Salt Lake City, Utah, 22 p.

Primary Uses of Geofoam on the I‐15 Project
• Reduce Settlement to Protect Buried Utilities• Improve Slope Stability of Embankments• Improve Slope Stability of Embankments• Rapid Construction in Time Critical Areas

EPS Density
Property ASTMTest
Type XI Type I Type VIII* Type II Type IXTestC 578
NominalDensity(kg/m3)
C303 / D1622
12 16 20 24 32
MinimumDensity(k / 3)
C303 / D1622
11 15 18 22 29
(kg/m3)
* Type VIII was used for I-15 Reconstruction

Objectives
• Long Term Monitoring• Construction Settlement• Post-Construction Settlement• Transition Zones• Settlement Performance Comparison
d d li f f• Assessment and Modeling of Performance Data• Settlement• Pressure Distribution
• Vertical• Vertical• Horizontal
• Connections and Panel Walls• Seismic DesignSeismic Design• General Design

Geotechnical Instrumentation
LEVEL 4
LEVEL 6
LEVEL 0
LEVEL 4
LEVEL 2

Geotechnical Instrumentation

Geotechnical InstrumentationSurveyingy g

Geofoam Placement Areas
• 500 N• 500 N
• 100 S
• 400 S400 S
• 900 S
• 1300 S
• State St
• 2100 S
• 3300 S

100 South Array(Construction)( )

100 South Array(cross‐section view)( )

100 South Array(profile view)(p )

100 South Array(Load and Pressure Cells)( )

100 South Array(Vertical Strain)( )

100 South Array(Creep Settlment)( p )

3300 South Instrumentation Array
• 500 N3300 S h • 500 N
• 100 S
• 400 S
3300 South
400 S
• 900 S
• 1300 S
• State St
• 2100 S
• 3300 S

3300 South Array(Construction)( )

3300 South Geofoam Array(Cross‐Sectional View)( )

3300 South Array(Load and Pressure Cells)( )

3300 South Array(Vertical Settlement / Strain)( / )
1 % vertical strain (end of construction)

3300 South Array(Settlement in Transition Zones)( )
Transition slope3.5 H : 1 V
25 0t
face of wall5/30/00
face of wall3/18/01
15 0
20.0
25.0
n Se
ttlem
ent 3/18/01
inside edge ofmoment slab5/30/00inside edge of
5 0
10.0
15.0
Con
stru
ctio
n(m
m) g
moment slab3/18/01 outside edgeof emergencylane 5/30/00outside edge
0.0
5.0
2534
0
2535
0
2536
0
2537
0
2538
0
2539
0
2540
0
2541
0
2542
0
2543
0
2544
0
2545
0
2546
0
2547
0
2548
0
2549
0
Post
-C outside edgeof emergencylane 3/18/01
baseline survey completed on 11/10/99.
2 2 2 2 2 2 2 2 2 2 2 2 2 2 2 2
Mainline Stationing (m)

3300 South Array(Creep Settlement)( p )

State Street Instumentation
• 500 NState Street • 500 N
• 100 S
• 400 S
State Street
400 S
• 900 S
• 1300 S
• State St
• 2100 S
• 3300 S

State Street Construction
State Street Array

State Street Array

State Street Array(Pressure Cells Measurements)( )

Geotechnologies’ Settlement Performance

Conclusions
• EPS geofoam exhibited the best overall settlement performance of the I-15 geotechnologies
• Compression, seating and inter-block gap closure of EPS produced about 1 percent vertical deformation during construction loading.
• Vertical pressure levels are in reasonable agreement withVertical pressure levels are in reasonable agreement with allowable design limits of about 30 kPa.
I 15 EPS b k t h d b t 0 2 t 0 4 t•I-15 EPS embankment has undergone about 0.2 to 0.4 percent creep deformation in a 10-year post construction period.
•The 10-year design criterion has been met and the 50-year design criterion of 1.5 percent total strain will most likely be met.

Objectives
• Long Term Monitoring• Construction Settlement• Post-Construction Settlement• Transition Zones• Settlement Performance Comparison
• Assessment and Modeling of Performance Data• Settlement• Pressure Distribution
• Vertical• Vertical• Horizontal
• Connections and Panel Walls• Seismic DesignSeismic Design• General Design

Bi‐linear Settlement Model

Modeling of Vertical Displacementwith EPS Embankment
3300 South 100 South

Modeling of Vertical Pressure
3300 South 100 South(No pressure cells in EPS)

Modeling of Horizontal Stresses( )(State Street Array)

Modeling of Horizontal Stresses
State Street Array

Connections
Damaged Connection
• Approximately 1% loading strain can be expected.expected.
• Strain due to seating of untrimmed block and elastic compressionelastic compression.
• Damaged connection was later repaired by dowels.
• Rigid connect should be avoided.

Objectives
• Long Term Monitoring• Construction Settlement• Post-Construction Settlement• Transition Zones• Settlement Performance Comparison
• Assessment and Modeling of Performance Data• Settlement• Pressure Distribution
• Vertical• Vertical• Horizontal
• Connections and Panel Walls• Seismic DesignSeismic Design• General Design
Horizontal Acceleration Response S tSpectra
Response Spectra (5% Damping)
S 2.0
2.5
pectral Acce
1.5
2.0
leration (g)
0.5
1.0
0.00 1 2 3 4 5
Motion 1 Motion 2 Motion 3 Motion 4 Motion 5 Motion 6 Motion 7 Motion 8Period (sec)
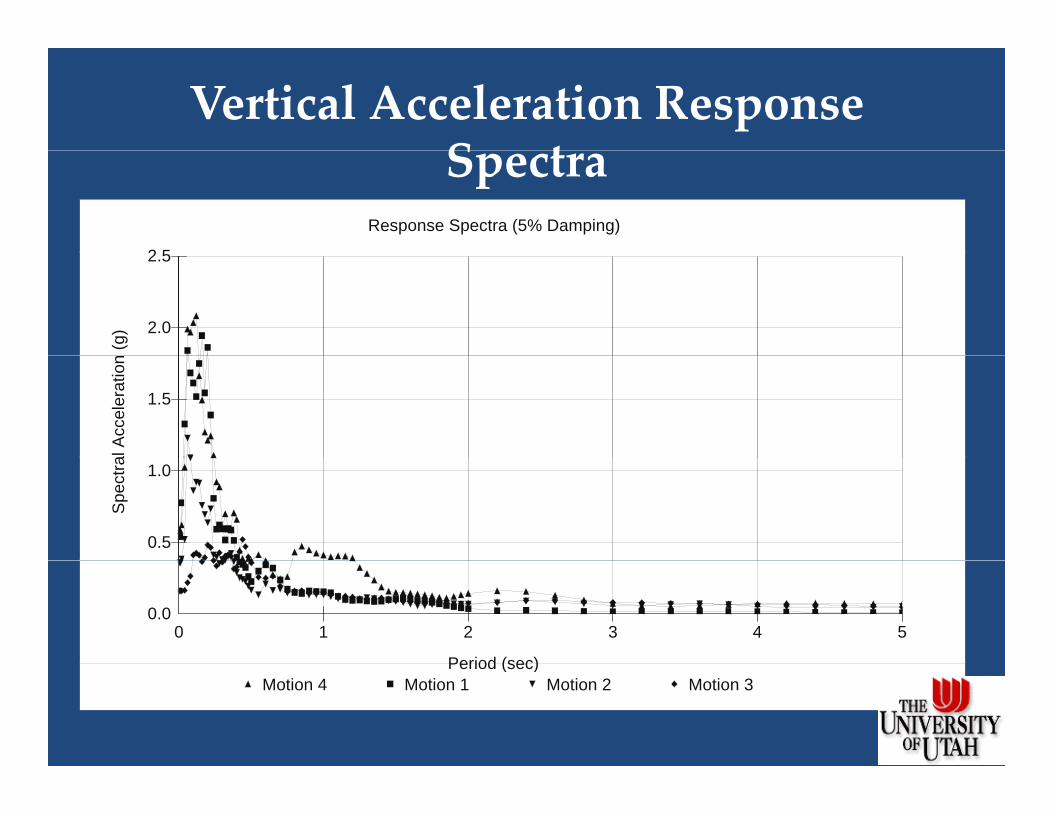
Vertical Acceleration Response S tSpectra
Response Spectra (5% Damping)
2 5
(g) 2.0
2.5
al A
ccel
erat
ion
1.5
Spe
ctra
0.5
1.0
Period (sec)
0.00 1 2 3 4 5
Motion 4 Motion 1 Motion 2 Motion 3Period (sec)

Numerical Modeling Approachg pp
• FLAC (Fast Lagrangian Analysis of Continua)
• 2D or 3D
• Explicit Finite Difference Method
• Large Strain Mode
• Sliding and Separation at Nodal Interfaces
• Nonlinear Modeling capability
• Elasto-Plastic Model w/ Mohr-Coulomb Failure Criteria and Plastic Post-Yield Behavior
• Hysteretic damping

Sliding Evaluations
To = 0.5 s
(8 m high x 20 m wide)
Combined cap
geofoam Interfaces
soilFree-field (infinite) boundary)
Quiet boundary (non-reflective) base

Elastic Properties for Sliding E l tiEvaluations
M t i l T Layer ρ (k / 3 E K (MP )7
G (MP )Material Type Layer
No. (kg/m3
)4
E (MPa)5 K (MPa)7 (MPa)
8
F d tiFoundation Soil 1-10 1840 174 0.4 290.0 62.1
Geofoam 11-18 18 10 0.103 4.2 4.5
UTBC1 19 2241 570 0.35 633 211
LDS2 & PCCP3 19 2401 30000 0.18 15625 12712
1 Untreated base course, 2 Load distribution slab, 3 Portland concrete cement pavement, 4Mass density, 5 Initial Young’s modulus, 6 Poisson’s ratio, 7 Bulk modulus, 8 Shear modulus
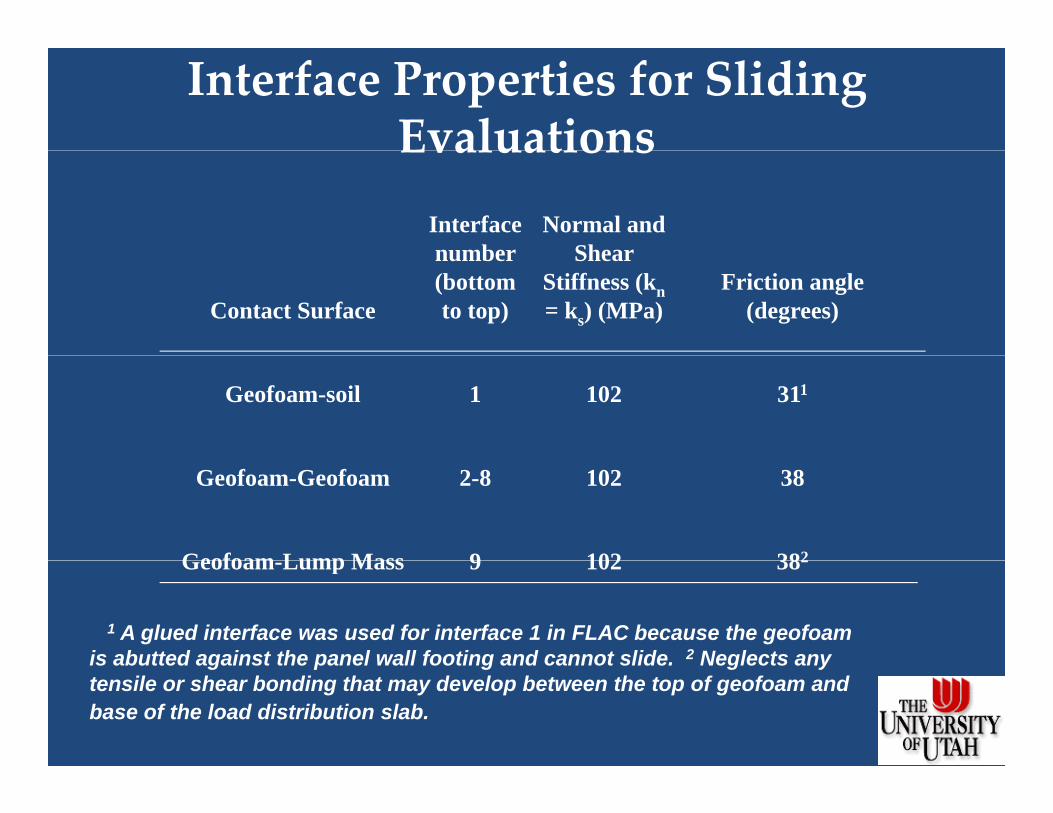
Interface Properties for Sliding EvaluationsEvaluations
Interface number
Normal and Shear
Contact Surface
number (bottom to top)
Shear Stiffness (kn= ks) (MPa)
Friction angle (degrees)
Geofoam-soil 1 102 311
Geofoam-Geofoam 2-8 102 38
Geofoam Lump Mass 9 102 382Geofoam-Lump Mass 9 102 382
1 A glued interface was used for interface 1 in FLAC because the geofoam is abutted against the panel wall footing and cannot slide. 2 Neglects anyis abutted against the panel wall footing and cannot slide. Neglects any tensile or shear bonding that may develop between the top of geofoam and base of the load distribution slab.

Displacement Vectors from FLAC
Video

Relative and Total Sliding Di l tDisplacement

H i t l Di l t
Sliding Displacement SummarySliding Displacement SummaryCase Horizontal
Motion Vertical Motion Displacement (m)
1a1 Not applied 0.061 1 0.06
1b1 1 0.06
2a2 Not applied 0.01
2b2 1 0.05
33 Not applied 0.06
3a3b
3 2 0.06
4a4 Not applied 1.3
4b4 2 1.3
4b5a
5 Not applied 0.005
5b5 3 0.01
6a6 Not applied 0.056 3 0 066a
6b6 3 0.06
7a7 Not applied 0.5
7b7 4 0.68 Not applied 0 6
8a8 Not applied 0.6
8b8 4 0.5

Shear Keys to Prevent SlidingShear Keys to Prevent Sliding

Rocking/Uplift and Sway Evaluations
Model Modifications
• interface nodes removed (no sliding between layers)
• overlying concrete was “bonded” to geofoam
• basal sliding prohibited
• M-C model with hysteretic damping including tensile, compression d h ti ifi dand shear properties specified
• both vertical and horizontal component present

Rocking and Uplift ResultsM lif (l f ) M lif ( i hCase Max. uplift (left corner)
(m)Max. uplift (right
corner) (m)
1b 0.06 0.05
2b 0.02 0.04
3b 0 2 0 23b 0.2 0.2
4b 0.2 ? rotation due to tensile yielding
5b 0.01 0.01
6b 0.03 0.03
7b ? rotation due to tensile yielding 0.2
8b 0.25 0.25

Sliding Calculations (simplified)

Conclusions• Modeling offers insight into dynamic behavior of EPS
embankments subjected to large, nearby earthquake and can be used for design and improving constructioncan be used for design and improving construction practices.
• Interlayer sliding is possible for large, near source earthq akes and is sensiti e to long period p lses in theearthquakes and is sensitive to long‐period pulses in the input motion.
• Shear keys can be employed to prevent such sliding.• Rocking and uplift do not appear to governing failure
modes.• Yielding (tension) appears to be possible in some basalYielding (tension) appears to be possible in some basal
layers, if sliding is prohibited.

Objectives
• Long Term Monitoring• Construction Settlement• Post-Construction Settlement• Transition Zones• Settlement Performance Comparison
• Assessment and Modeling of Performance Data• Settlement• Pressure Distribution
• Vertical• Vertical• Horizontal
• Connections and Panel Walls• Seismic DesignSeismic Design• General Design - Allowable Stress in EPS

2 Layer Model
FLAC (Version 5 00)
JOB TITLE : .
FLAC (Version 5.00)
LEGEND
11-Jul-11 10:44 step 0 -1.667E-01 <x< 1.167E+00 -1.167E+00 <y< 1.667E-01
XXXXXX
-0.200
0.000
bulk_mod 1.670E+06 1.670E+09
Grid plot
0 2E -1
Net Applied Forcest 3 283E 03
XXXXXXXX
-0.600
-0.400
max vector = 3.283E+03
0 1E 4
Fixed Gridpoints
XXXXXXX
BBBBBBBBBBBBBBBBBBBBB B B B B B B B B B B
X X-direction B Both directions
-1.000
-0.800
0.000 0.200 0.400 0.600 0.800 1.000
Steven F. Bartlett University of Utah

V ti l St (kP )
Vertical Stress Distributions18 kip tire dual tire load
0.000 100 200 300 400 500 600 700 800
Vertical Stress (kPa)
‐0.20
‐0.10
0 50
‐0.40
‐0.30
h (m
)
‐0.70
‐0.60
‐0.50
Dep
th
2V:1H
homogeneous
10:1
‐0.90
‐0.80
100:1
1000:1
6" LDS
‐1.00

3 Layer Model
FLAC (Version 5.00)
LEGENDXX
0.000
JOB TITLE : .
11-Jul-11 8:59 step 0 -1.667E-01 <x< 1.167E+00 -1.167E+00 <y< 1.667E-01
bulk_mod 1.670E+06 1.670E+08 1.670E+09
Grid plot
0 2E 1
XXXXXXXXXX
-0.400
-0.200
Thin base
FLAC (Version 5.00)
X X 0.000
JOB TITLE : .
0 2E -1
Net Applied Forcesmax vector = 3.283E+03
0 1E 4
Fixed Gridpoints
XXXXXXXX
BBBBBBBBBBBBBBBBBBBBB B B B B B B B B B B
X X-direction B Both directions
-1.000
-0.800
-0.600
LEGEND
11-Jul-11 9:49 step 27421 -1.667E-01 <x< 1.167E+00 -1.167E+00 <y< 1.667E-01
bulk_mod 1.670E+06 1.670E+08 1.670E+09
Grid plot
X XX XX XX XX XX XX XX XX XX XX X
-0.400
-0.200
0.000
0.000 0.200 0.400 0.600 0.800 1.000
Steven F. Bartlett University of Utah
Base withp
0 2E -1
Net Applied Forcesmax vector = 3.283E+03
0 1E 4
Fixed Gridpoints
XX XX XX XX XX XX XX XX XX XBBBBBBBBBBBBBBBBBBBB B B B B B B B B B B B
X X-direction B Both directions
-1.000
-0.800
-0.600
Base with CLSM
0.000 0.200 0.400 0.600 0.800 1.000
Steven F. Bartlett University of Utah

V ti l St (kP )
Vertical Stress Distributions18 kip tire dual tire load
0.000 100 200 300 400 500 600 700 800
Vertical Stress (kPa)
‐0.20
‐0.10
0 50
‐0.40
‐0.30
h (m
)
‐0.70
‐0.60
‐0.50
Dep
th
homogeneous 1000:100:1
‐0.90
‐0.80 1000:100:100:1
‐1.00
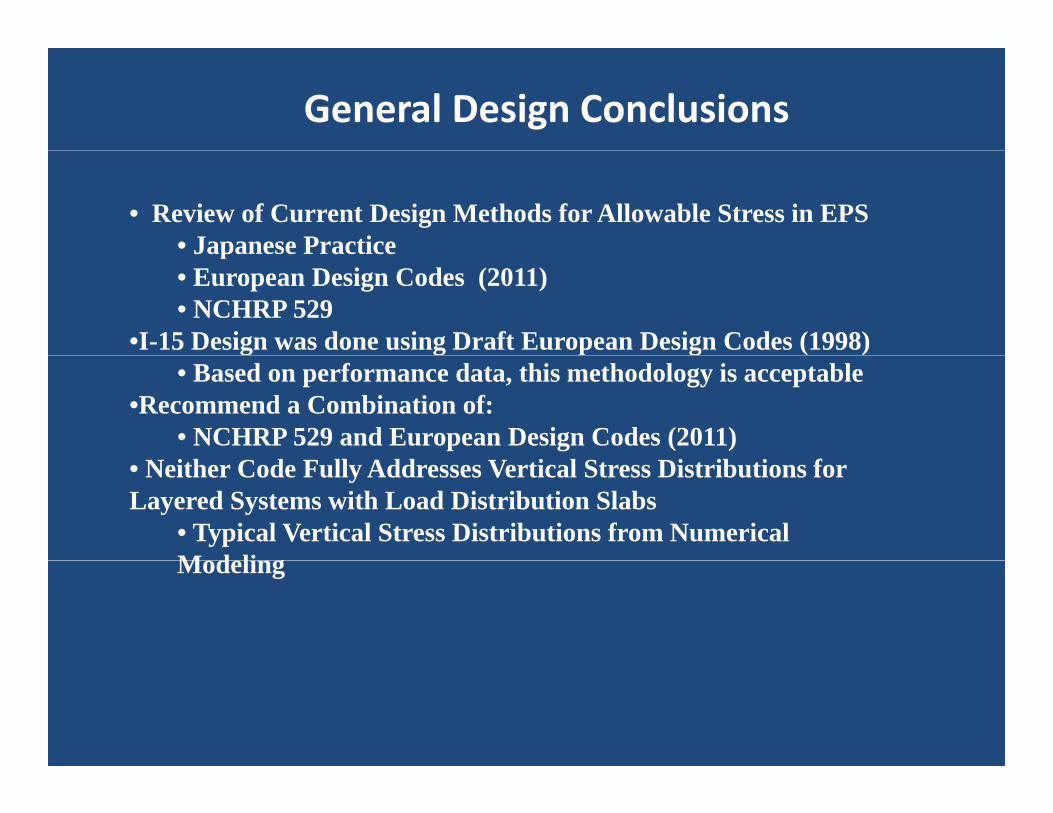
General Design Conclusions
• Review of Current Design Methods for Allowable Stress in EPS• Japanese PracticeJapanese Practice• European Design Codes (2011)• NCHRP 529
•I-15 Design was done using Draft European Design Codes (1998)• Based on performance data, this methodology is acceptable
•Recommend a Combination of:• NCHRP 529 and European Design Codes (2011)
• Neither Code Fully Addresses Vertical Stress Distributions for Layered Systems with Load Distribution Slabs
• Typical Vertical Stress Distributions from Numerical M d liModeling

Questions