Embed Size (px)
Citation preview

Constructing an atlas of the human metabolome to enable phenotyping, genome mapping and understanding genetic disease
Michael Milburn, Ph.D. - CSO, Metabolon, Inc.

Metabolon is the global leader in metabolomics
2
Our technology is advancing life sciences research & improving health
• Founded in 2002• Over 180 employees worldwide with
expertise in biochemistry, mass spectrometry and software development
• 54,000 sq. ft. facility in Research Triangle Park, NC & Sacramento
• CLIA-certified/CAP-accredited lab• >5,000 studies, >800 clients worldwide,
>700 publications

3
DNA RNA
Risk of DiseaseGenes suggest what might be
Actionable Information to prevent, diagnose & treat disease
ProteinsSmallMolecules(metabolites)
Disease Treatment & Mechanism
Metabolomics & molecular phenotyping
• 3 billion base pairs• Ongoing discoveries of
gene function• Larger detailed data sets• Improving clinical
relevance
• Over 2,000 metabolites• Biochemistry well defined• Current health state• Accounts for external
factors (diet, environment, microbiota)
An integrative approach for deciphering the phenotype
Metabolomics
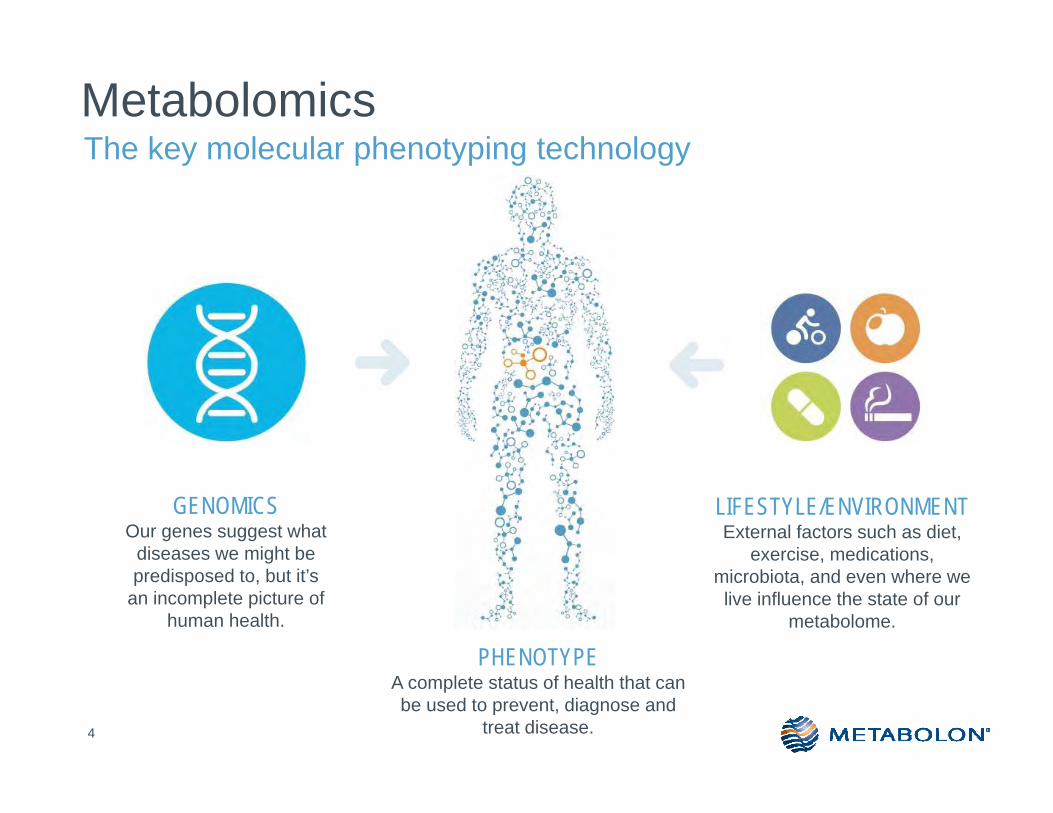
4
The key molecular phenotyping technology
GENOMICSOur genes suggest what
diseases we might be predisposed to, but it’s
an incomplete picture of human health.
LIFESTYLE/ENVIRONMENTExternal factors such as diet,
exercise, medications, microbiota, and even where we live influence the state of our
metabolome.
PHENOTYPEA complete status of health that can be used to prevent, diagnose and
treat disease.

BiomarkersMechanistic understanding
Drug MoACellular characteristics
Interpretation• >4000 Studies
•Institutional Knowledge•Expert Biochemists•~525 Publications
Interpretation• >4000 Studies
•Institutional Knowledge•Expert Biochemists•~525 Publications
Discovery HD4TM platform launched in April 2014 Statistical AnalysisStatistical Analysis
Eliminate Noise
Data Reduction
Library SearchRT, Mass, MS/MS
QA/QC
BiochemicalExtraction
UHPLC (HILIC)-MS/MS
40,000 ion features
40,000 ion features
40,000 ion features
40,000 ion features
UHPLC-MS/MS (+ESI) 2
UHPLC-MS/MS (+ESI) 1
UHPLC-MS/MS (-ESI)

Metabolon’s Technology Continuously Improves
8
Innovations (2003 - 2016)
2005(48)
2007(18)
2009(10)
2011(10)
2013(7)
2014(<5%)
Data quality continues to improve (RSDs in plasma)Data coverage
2015(<4.5%)
0500
10001500200025003000
'05 '06 '08 '12 '14 '15 '16
# metabolites in plasma

About 200 molecules are derived from bacterial metabolism
aromatic amino acid metabolism
bile acid metabolism
xenobiotic metabolism
choline metabolism
polyamine metabolism
lipid metabolism
vitamins
energy metabolism
Short chain FA:valerateIsovalerateMethylpropionate
Lipids: Lyso-PC, lyso-PEMonacylglycerolcholesterol
trimethylamine-n-oxidebetainedimethylglycine
riboflavinpyridoxinefolate
cadaverineputrescinespermidinespermine
phenyllactatephenylacetate p-cresol sulfate 3-(4-hydroxyphenyl)lactate 4-hydroxyphenylpyruvate 4-hydroxyphenylacetate 3-hydroxyphenylacetate 3,4-dihydroxyphenylacetate phenylacetylglutamine phenylacetylglycine2-(4-hydroxyphenyl)propionate 3-(3-hydroxyphenyl)propionate 3-(4-hydroxyphenyl)propionate 3-phenylpropionate phenol sulfate 4-hydroxycinnamate indolelactate indoleacetate indole-3-carboxylic acid n-acetyltryptophan 3-indoxyl sulfate indolepropionate skatol indoleacetylglutamine
lactateformate,succinateglucoseureacreatinecreatinineketoisovalerate
2nd bile acids:cholate dehydrocholate ursodeoxycholate deoxycholate glycodeoxycholate ketodeoxycholate glycolithocholate sulfatetaurolithocholatetaurolithocholate sulfatelithocholate diketolithocholate ketolithocholate hyocholate glycocholenate sulfatetaurocholenate sulfate* glycoursodeoxycholate tauroursodeoxycholate
hippurate 2-hydroxyhippurate3-hydroxyhippurate 4-hydroxyhippurate 3-hydroxybenzoate 4-hydroxybenzoate3,4-dihydroxybenzoate 2,4,6-trihydroxybenzoatep-hydroxybenzaldehyde methyl-4-hydroxybenzoate 3-(2-hydroxyphenyl)propionate vitexin daidzein genistein
• Exclusively or mainly contributed by bacteria metabolism • Contributed by both mammalian cells and bacteria
10
1
3
Study design
4
5
Metabolomic data
Key finding
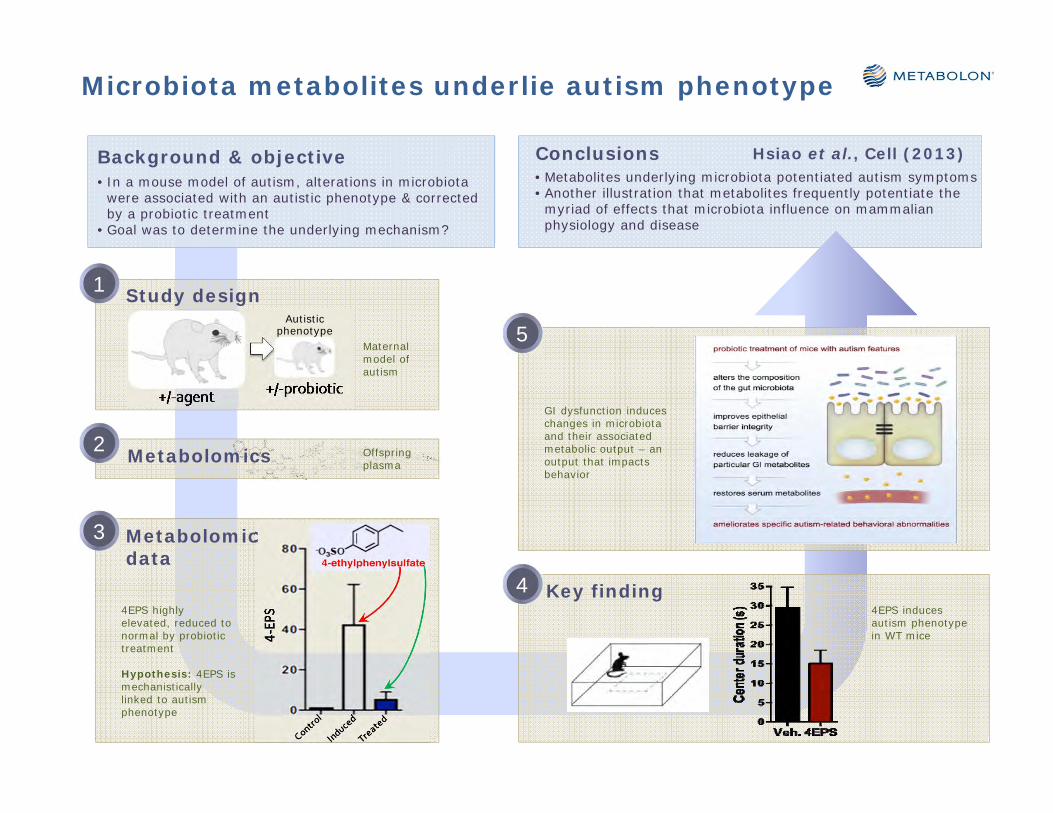
Background & objective Conclusions• Metabolites underlying microbiota potentiated autism symptoms• Another illustration that metabolites frequently potentiate the
myriad of effects that microbiota influence on mammalian physiology and disease
• In a mouse model of autism, alterations in microbiota were associated with an autistic phenotype & corrected by a probiotic treatment
• Goal was to determine the underlying mechanism?
Microbiota metabolites underlie autism phenotype
Hsiao et al., Cell (2013)
4EPS induces autism phenotype in WT mice
GI dysfunction induces changes in microbiota and their associated metabolic output – an output that impacts behavior
4EPS highly elevated, reduced to normal by probiotictreatment
Hypothesis: 4EPS is mechanistically linked to autism phenotype
2 Metabolomics
Maternal model of autism
Offspring plasma
Autistic phenotype

Discovery HD4™ Platform
ExtensiveMetabolite
LibraryHigh resolution biochemistry surveys central metabolism & peripheral pathways that drive
attributes of phenotype.
Biomarkers for: Oxidative stressInflammation
Mitochondrial functionSignaling
Cell traffickingCell activationMethylation
Gut microbiome
Atlas of the Human MetabolomeHelmholtz Zentrum MünchenKing’s College LondonMetabolon, Inc.

14
Key publications applying Metabolon’smetabolomics in large population genetic studies
• Human metabolic individuality in biomedical and pharmaceutical research. Nature 477, 54‐60 (2011)• Mining the Unknown: A Systems Approach to Metabolite Identification Combining Genetic and Metabolic Information. Plos Genetics
8, e1003005 (2012)• Metabolomic Markers Reveal Novel Pathways of Ageing and Early Development in Human Populations. International Journal of
Epidemiology 42, 1111‐1119 (2013)• Biomarkers for type 2 diabetes and impaired fasting glucose using a non‐targeted metabolomics approach. Diabetes, 62, 4270‐4276
(2013)• Associations between Metabolomic Compounds and Incident Heart Failure among African‐Americans: the Atherosclerosis Risk in
Communities (ARIC) Study. American Journal of Epidemiology, 178, 534‐542(2013)• Metabolomics and Incident Hypertension Among Blacks: the Atherosclerosis Risk in Communities Study. Hypertension 62, 398‐403
(2013)• Genome‐Wide Association Study of a Heart Failure Related Metabolomic Profile Among African Americans in the Atherosclerosis
Risk in Communities (ARIC) Study. Genet Epidemiol. 37, 840‐5 (2013)• Long term conservation of human metabolic phenotypes and link to heritability, Metabolomics, 10, 1005‐1017 (2014)• An atlas of genetic influences on human blood metabolites. Shin, S. et al., Nature Genetics 46, 543‐550 (2014)• Genetic Determinants Influencing Human Serum Metabolome among African Americans. PLoS Genet, 10, e1004212 (2014)• Metabolomic patterns and alcohol consumption in African Americans in the Atherosclerosis Risk in Communities Study. Am J Clin
Nutr. 99, 1470‐1478 (2014)• Human Metabolome Associates With Dietary Intake Habits Among African Americans in the Atherosclerosis Risk in Communities
Study. American Journal of Epidemiology ; 179, 1424‐33 (2014)• Serum Metabolomic Profiling and Incident CKD among African Americans. Clin J Am Soc Nephrol. 9, 1410‐7 (2014)• Epigenetics meets metabolomics: an epigenome‐wide association study with blood serum metabolic traits. Hum. Mol. Genet., 23,
534‐545 (2014)• Novel genetic associations with serum level metabolites identified by phenotype set enrichment analyses. Hum. Mol. Genet., 23,
5841‐5857 (2014)• Whole genome sequencing identifies common, low‐frequency, and rare variants associated with human blood metabolome. Nature
Genetics, in press

More than 100 years ago, Archibald Garrod already suggested a link
between chemical individuality and predisposition to disease.
Genetic Origins of Individual Variations in Metabolism
15

TwinsUK• = p-values that are plotted out of range
Association with Metabolite Concentration Ratios
Associations with metabolite concentrations (not shown) demonstrated similar concordance.
Concordance Between Cohorts
16
1,052 samples
1,768 samples

Study Results (Nature Genetics, 46, 543-550, 2014)
17
Medical and pharmacological relevance of metabolomic associations
• 26 genes associated with IEMs• Potential for novel biomarkers
• 10 genes are targets of 45 drugs• Rest are targets of ~400 drugs in dev
• 36 genes linked to complex diseasetraits or drug responses
• Involvement in other aspects of human health and disease

Match Between Gene Function & GIM
Gene Function Associates With…SCD delta-9 fatty acid desaturase C16:0 / C16:1FADS1 delta-5 fatty acid desaturase C20:3 / C20:4PRODH proline dehydrogenase prolineGLS2 glutaminase 2 glutamineOPLAH 5-oxoprolinase 5-oxoprolinePHGDH serine biosynthesis serineIVD isovaleryl-CoA dehydrogenase isovalerylcarnitineNT5E 5'-nucleotidase inosineACE peptidyl-dipeptidase dipeptidesNAT8 N-acetyltransferase N-acetylornithine
18
In the examples shown, the metabolite is a substrate or product of the enzyme encoded by the gene listed.

19
• SCAD is a key enzyme β-oxidation.
• P-value<10-305
• Increased levels of short-chain acyl-carnitines are diagnostic for SCAD deficiency.
SCAD Locus & Butyryl-carnitine:Propionylcarnitine
NAT8 Locus &N-acetylornithine
• N-acetyltransferase function of NAT8matches the associating metaboliteN-acetylornithine.
• Association with glomerular filtrationand CKD.
Concordance Between Cohorts

A Snapshot of Biochemical Concentrations Can Phenotype The System
20
Since biology is driven to maintain metabolic homeostasis
• Whether a phenotype is driven by a single mutation or a combination of genetic differences, environmental influences or the microbiota, metabolism provides a systems-level diagnostic.

21
Whole genome sequencing identifies common, low-frequency, and rare variants associated with human blood metabolome Nature Genetics, in press
1,960 twins on three time points
whole genome sequencing
metabolomics
mapping gene variance to metabolite levels

22
Heritability of serum metabolites and their associations with high and low frequency mutations• 644 metabolites have consistent heritability (h2 > 0.6: 136 metabolites, h2 > 0.3: 427 metabolites) • 246 metabolite associations mapped to common and low frequency variant (90 novel findings).
New insights on biomarkers and pathways associated various diseases.

Mapping Rare Mutations• 17 metabolite associations mapped to 347 rare gene variants, affecting ~10% of the study population.
• The detected metabolic abnormalities were the results of heterozygous rare variants on inborn errors of metabolism, commonly accepted as autosomal recessive diseases.

24
Dimethylglycine and DMGDH
BIOCHEMICAL SUPER.PATHWAY SUB.PATHWAY heritability GWAS.loci pathway.genes OMIM.gene rare.func.gene
dimethylglycine Amino AcidGlycine, Serine and Threonine Metabolism
0.75 DMGDH BHMT2,BHMT,DMGDH,CHDH DMGDH DMGDH
Outlier twins genotype MAF variant function mutation
15821;15822 0/1 2/3918 chr5_79021608_T_G stop_lost 12/12|c.1841A>C|p.*614Ser15821;15822;33381;33382 0/1 16/3918 chr5_79044400_G_A missense 6/16|c.898C>T|p.Leu300Phe
56031;56032 0/1 4/3918 chr5_79033302_T_A stop_gained 8/16|c.1300A>T|p.Lys434*

25
Short-chain Acyl-CoA Dehydrogenase and Ethylmalonate

Gene penetrance: 3905• High sorbitol and fructose level, indicating that fructose metabolism was disrupted in
this subject.
• WES sequencing priority list from computer analysis did not report an aldolase B mutation.
• We recommended a careful review of the sequencing data for ALDOB. A mutation was found that could account for the patient showing signs of fructose intolerance.
• Patient was called in and dietary planning recommended as persistent fructose intolerance can lead to various adverse symptoms including damages to liver and kidney.
26
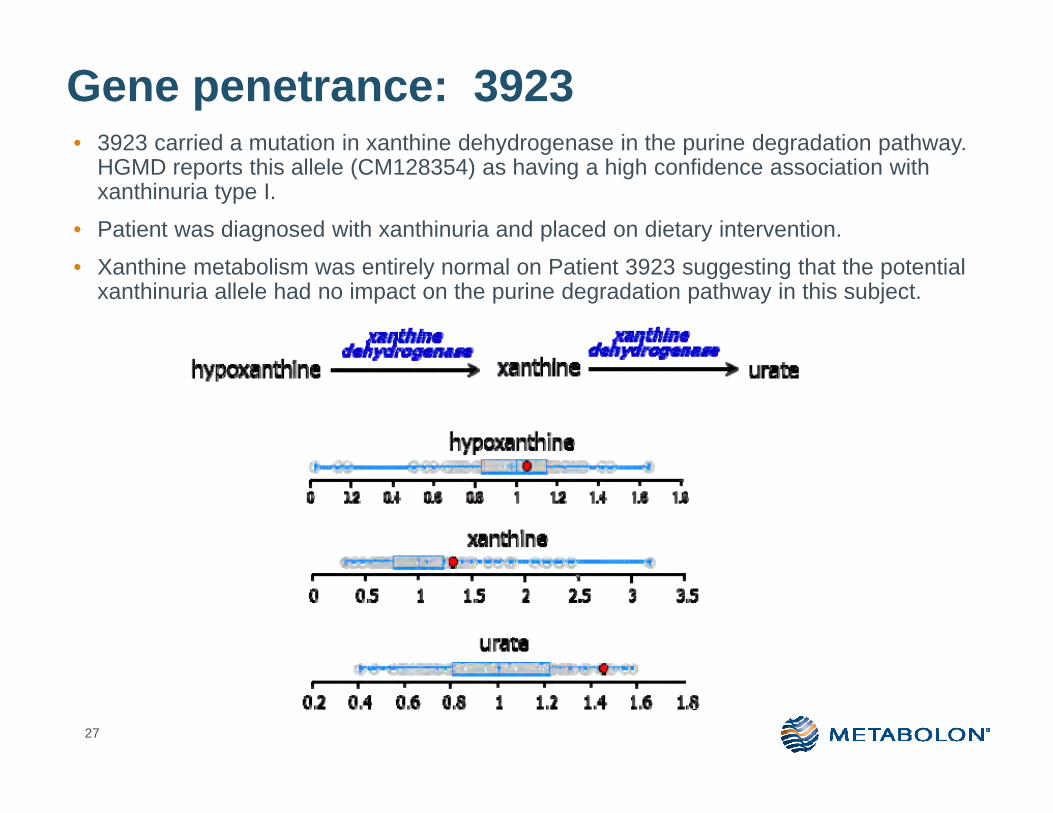
Gene penetrance: 3923• 3923 carried a mutation in xanthine dehydrogenase in the purine degradation pathway.
HGMD reports this allele (CM128354) as having a high confidence association with xanthinuria type I.
• Patient was diagnosed with xanthinuria and placed on dietary intervention.
• Xanthine metabolism was entirely normal on Patient 3923 suggesting that the potential xanthinuria allele had no impact on the purine degradation pathway in this subject.
27

Sensitivity to acetaminophen-induced toxicity
28

Clinical Applications
29
Clinical Diagnostic Tests
• Quantose IR• Quantose IGT• accuGFR
Precision Medicine
• Meta IMD• GHA• Undiagnosed Disease• Gene Penetrance Assessment
LC/MS platform HD4 platform
Inborn Errors of MetabolismDr. Art Beaudet, Baylor College of Medicine

Design of study
• 200 patients - blood and urine samples were sent to Metabolon blinded
• Some with defined disease and some previously determined unaffected
• Challenge: run them through the platform and determine who is diseased and who is unaffected, and determine what disease they have
31

Correct disease assessment
32

Maple Syrup Urine Disease
33
a(A) + b(B) + c(C) + d(D) + e(E) + f(F) = Diseasescoreg(G) + h(H) + i(I) + j(J) + k(K)

Phenylketonuria DiseaseJ. Inherited Metabolic Disease

Severity of Argininemia
35
Patient 1 is the most affected in multiple analytes suggesting a more severe form of argininemia. Patient had been admitted 3 times in past three months due to acute decompensation associated with hyperammonemic events. Other patients had no acute events.
Effect is not seen in arginine, but in other more distal biomarkers.
J. Inherited Metabolic Disease

Isovaleric Acidemia
36
Leucine
2‐ketoisocaproic acid
Isovaleryl‐CoA
3‐methylcrotonyl‐CoA
Isovalerylglycine
Isovalerylcarnitine
Isovalerate3‐hydroxyisovalerate
2‐ketoglutaratetransaminase
BCAA ketoacidDecarboxylase
Isovaleryl‐CoADehydroxgenase
Glycine‐N‐acylase
Acyltransferase
OxidationDe‐esterification
ATP, HCO3
ADP
3‐methylglutaconyl‐CoA
3‐methylcrotonyl‐CoAcarboxylate
3‐methylcrotonylglycine
3‐HydroxyisovalerateHydroxyisovalerylcarnitine
3‐methylglutarate3‐methylglutarylcarnitine
3‐methylglutaconate
AcetoacetateAcetyl‐CoA
HMG‐CoA Lyase
3‐hydroxy‐3‐methylglutaryl‐CoA

3-methylcrotonyl CoA carboxylase deficiency
37
Leucine
2‐ketoisocaproic acid
Isovaleryl‐CoA
3‐methylcrotonyl‐CoA
Isovalerylglycine
Isovalerylcarnitine
Isovalerate3‐hydroxyisovalerate
2‐ketoglutaratetransaminase
BCAA ketoacidDecarboxylase
Isovaleryl‐CoADehydroxgenase
Glycine‐N‐acylase
Acyltransferase
OxidationDe‐esterification
ATP, HCO3
ADP
3‐methylglutaconyl‐CoA
3‐methylcrotonyl‐CoAcarboxylate
3‐methylcrotonylglycine
3‐HydroxyisovalerateHydroxyisovalerylcarnitine
3‐methylglutarate3‐methylglutarylcarnitine
3‐methylglutaconate
AcetoacetateAcetyl‐CoA
HMG‐CoA Lyase
3‐hydroxy‐3‐methylglutaryl‐CoA
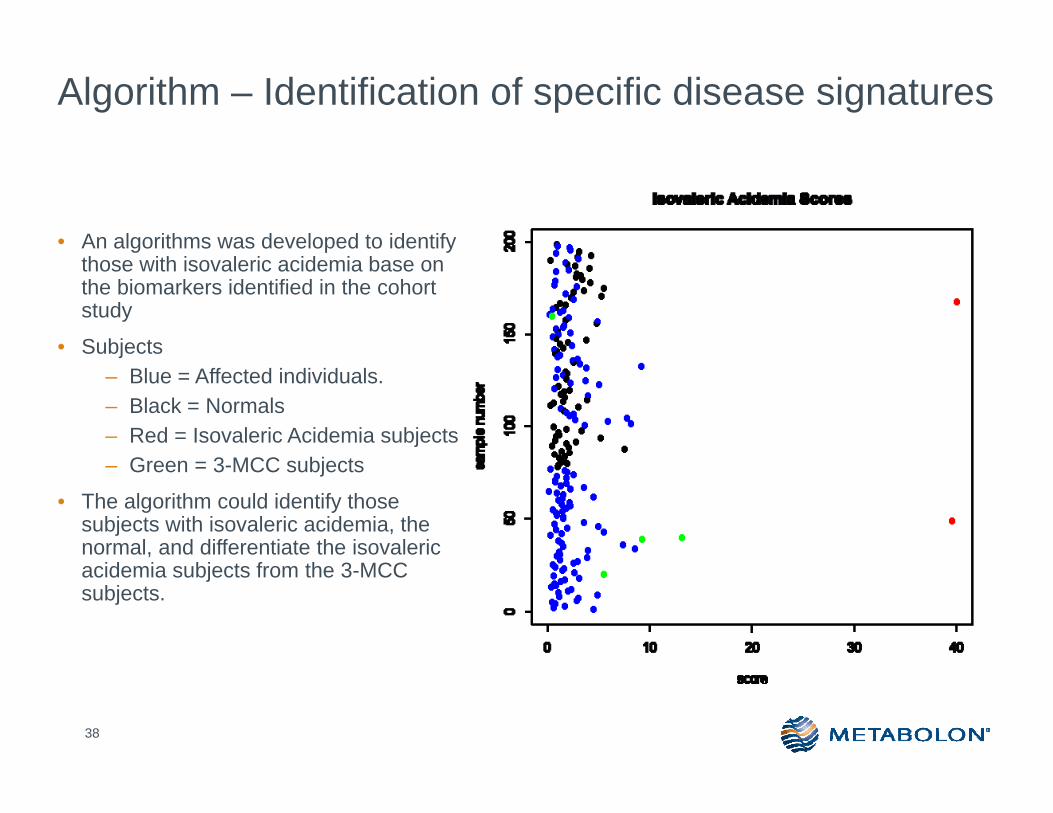
Algorithm – Identification of specific disease signatures
• An algorithms was developed to identify those with isovaleric acidemia base on the biomarkers identified in the cohort study
• Subjects– Blue = Affected individuals. – Black = Normals– Red = Isovaleric Acidemia subjects– Green = 3-MCC subjects
• The algorithm could identify those subjects with isovaleric acidemia, the normal, and differentiate the isovaleric acidemia subjects from the 3-MCC subjects.
38

• 70 unaffected cases were scored as unaffected
• 129 of 130 diseased were called correctly
• The one patient missed was on therapy and not showing symptoms
39
Results

3/3/2017 40
METABOLOMIC PROFILING FOR DNA VARIANTS OF UNKNOWN SIGNIFICANCE (VUS)
Whole exome sequencing and metabolomic analyses as complements for diagnosis

3/3/2017 41
Case Study
• Clinical presentation and family history:• Developmental delay• Intellectual disability, speech delay• Static encephalopathy and epilepsy (seizures with onset
at birth)• Mild ataxia
• Prior work-up: Normal CMA, normal metabolic tests• Exome sequencing revealed variants in SLC13A5:
c.997C>T (p.R333X) pathogenic variantc.680C>T (p.T227M) predicted pathogenic variant
• SLC13A5 is a sodium/dicarboxylate cotransporter• Translocates Krebs cycle intermediates such as succinate, citrate,
and alpha-ketoglutarate across plasma membranes

Citrate transporter deficiency

Metabolomic analysis confirms exome findings of
citrate transporter deficiency
EXOME findings• trans mutations in SLC13A5
•c.997C>T (p.R333X)•c.680C>T (p.T227M)
•Disorder: citrate transporter def.
TCA cycle
Citrate
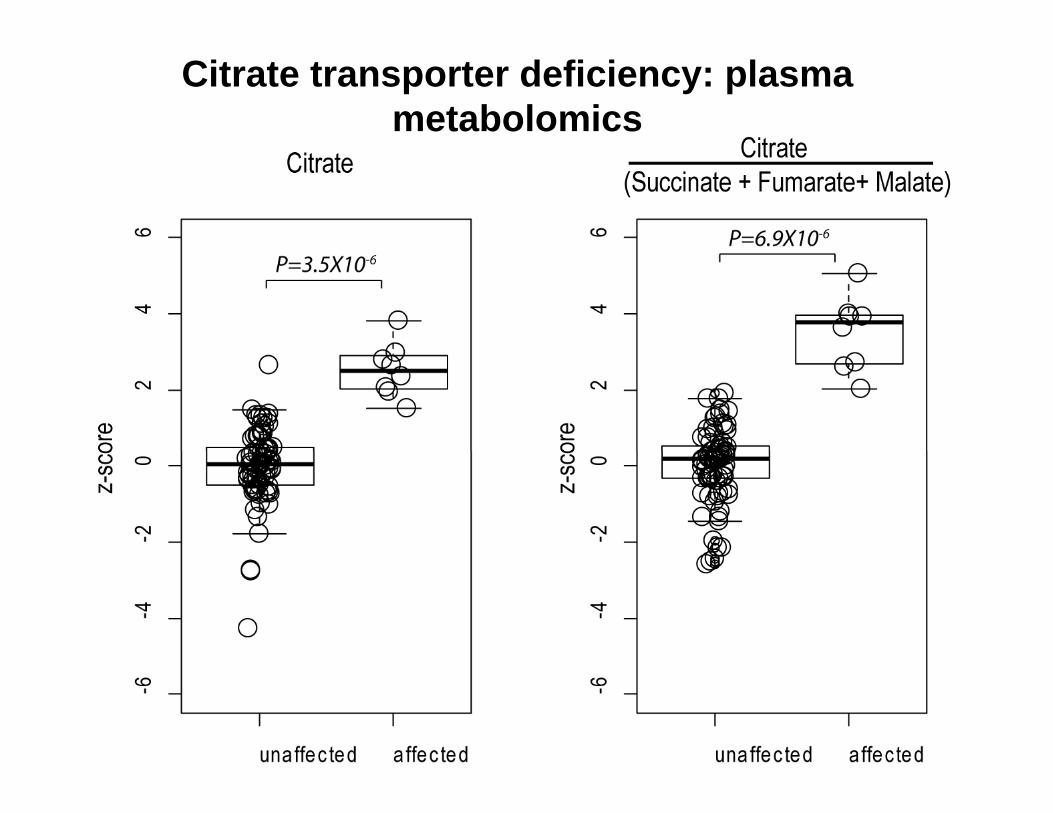
Citrate transporter deficiency: plasma metabolomics

45
Meta IMD Report


