Embed Size (px)
Citation preview
2 Constraints on mineralization, fluid-rock interaction, and mass
3 transfer during faulting at 2–3 km depth from the SAFOD drill hole
4 Anja M. Schleicher,1,2 Sara N. Tourscher,1 Ben A. van der Pluijm,1 and Laurence N. Warr3
5 Received 13 September 2008; accepted 2 January 2009; published XX Month 2009.
6 [1] Mineralogical and geochemical changes in rock cuttings from two segments of the7 San Andreas Fault Observatory at Depth (SAFOD) drill hole (3066–3169 and8 3292–3368 m measured depth) are analyzed in this study. Bulk rock samples and9 hand-picked fault-related grains characterized by polished surfaces and slickensides were10 investigated by X-ray diffraction, electron microscopy, and geochemical analysis. The11 elemental changes in fault-related grains along the sampled San Andreas Fault are12 attributed to dissolution of detrital grains (particularly feldspar and quartz) and local13 precipitation of illite-smectite and/or chlorite-smectite mixed layers in fractures and veins.14 Assuming ZrO2 and TiO2 to be immobile elements, systematic differences in element15 concentrations show that most of the elements are depleted in the fault-related16 grains compared to the wall rock lithology. Calculated mass loss between the bulk rock17 and picked fault rock ranges from 17 to 58% with a greater mass transport in the18 shallow trace of the sampled fault that marks the upper limit the fault core. The relatively19 large amount of element transport at temperatures of �110–114�C recorded20 throughout the core requires extensive fluid circulation during faulting. Whereas21 dissolution/precipitation may be partly induced by the disequilibrium between fluids and22 rocks during diagenetic processes, stress-induced dissolution at grain contacts is proposed23 as the main mechanism for extensive mineral transformation in the fault rocks and24 localization of neomineralization along grain interface slip surfaces.
25 Citation: Schleicher, A. M., S. N. Tourscher, B. A. van der Pluijm, and L. N. Warr (2009), Constraints on mineralization, fluid-rock
26 interaction, and mass transfer during faulting at 2–3 km depth from the SAFOD drill hole, J. Geophys. Res., 114, XXXXXX,
27 doi:10.1029/2008JB006092.
29 1. Introduction
30 [2] Fluids associated with the formation of clay minerals31 are increasingly recognized as an important factor in shal-32 low crustal faulting at depths of <10 km [Wu et al., 1975;33 Carter et al., 1990; Sibson, 1994; Vrolijk and van der34 Pluijm, 1999]. Their circulation along faults and shear zones35 can enhance mineral dissolution, element transport, mineral36 precipitation and rock deformation, depending on the tem-37 poral and spatial variations in temperature, pressure and38 element activities [Beach, 1976; Hulsebosch and Frost,39 1989; Manatschal et al., 2000; Hayman, 2006]. At low40 temperatures, such dynamic changes often lead to the41 crystallization of hydrous clay minerals in the faulted host42 rock, which influences permeability and fluid flow, and can43 transform the fault into a fluid conduit or fluid barrier.44 Potential sources of fluids in shallow faults include mete-
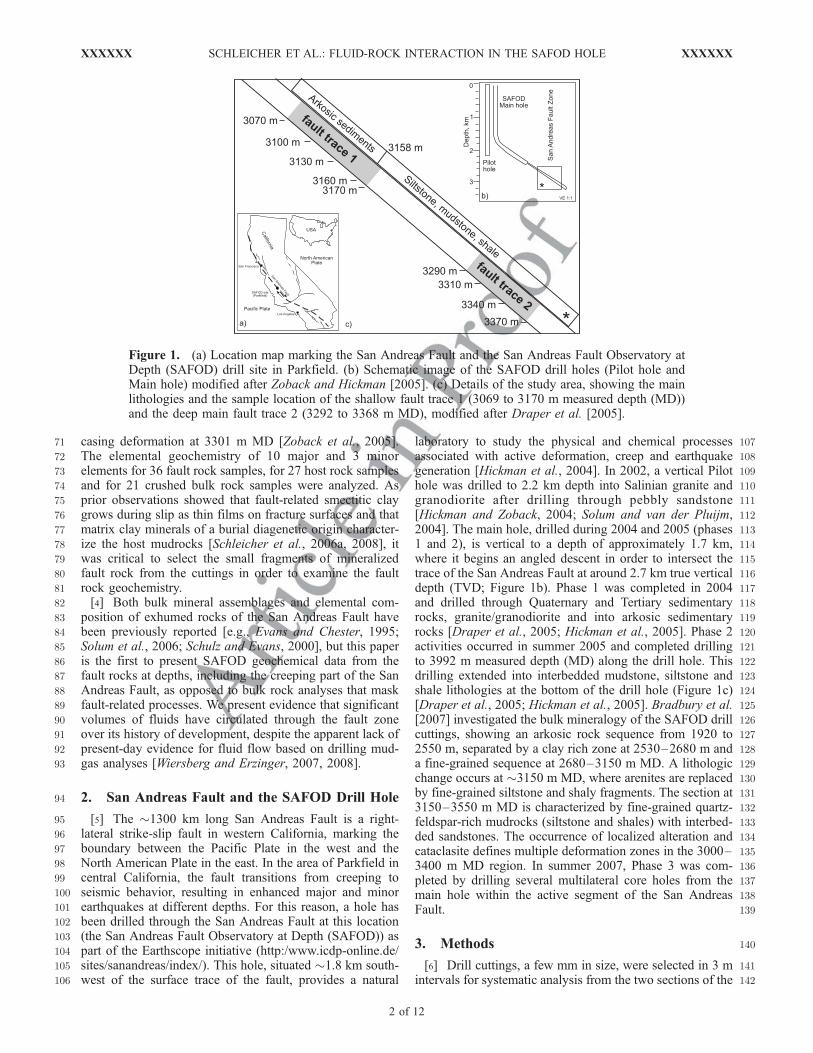
45oric, connate, basinal, metamorphic, and hydrothermal46fluids [McCaig, 1984, 1997; Forster and Evans, 1991;47Marquer and Burkhard, 1992]. Whereas fluids in faults48and fractures play a key role in the formation of clay49minerals and vice versa [Dewhurst et al., 1999; Tobin et50al., 2001; Crawford et al., 2002; Schleicher et al., 2006a],51the precise role of fluid-rock interaction and associated clay52formation in fault zones is not sufficiently understood53[Chester and Logan, 1986; Evans and Chester, 1995].54[3] This paper presents comprehensive geochemical data55from hand-picked, fine-grained fault rock cuttings and56equivalent mudrock lithologies of the wall rock, sampled57at various depths from the SAFOD drill hole. Data collected58in this study demonstrate the extent of mineralization and59element transport, and describe the fluid-rock interactions in60fault rocks and their host lithologies in the deep San61Andreas Fault. Two areas of primary interest were targeted62for this study (Figure 1c): a shallow fault trace (fault trace 1)63between 3066 m and 3169 m measured depths (MD) and64the main trace between 3292 m and 3368 m MD (fault65trace 2). The�100mwide shallow fault section is interpreted66as a fault zone on the basis of rock deformation and alteration67features [Bradbury et al., 2007; Solum et al., 2006]. This zone68lays �20 m above a level of active casing deformation69located at 3194 m [Hickman et al., 2008]. The �75 m wide70main fault trace includes the active fault recognized by
JOURNAL OF GEOPHYSICAL RESEARCH, VOL. 114, XXXXXX, doi:10.1029/2008JB006092, 2009ClickHere
for
FullArticle
1Department of Geological Sciences, University of Michigan, AnnArbor, Michigan, USA.
2Geozentrum Nordbayern, Universitat Erlangen-Nurnberg, Erlangen,Germany.
3Institut fur Geographie und Geologie, Universitat Greifswald,Greifswald, Germany.
Copyright 2009 by the American Geophysical Union.0148-0227/09/2008JB006092$09.00
XXXXXX 1 of 12
71 casing deformation at 3301 m MD [Zoback et al., 2005].72 The elemental geochemistry of 10 major and 3 minor73 elements for 36 fault rock samples, for 27 host rock samples74 and for 21 crushed bulk rock samples were analyzed. As75 prior observations showed that fault-related smectitic clay76 grows during slip as thin films on fracture surfaces and that77 matrix clay minerals of a burial diagenetic origin character-78 ize the host mudrocks [Schleicher et al., 2006a, 2008], it79 was critical to select the small fragments of mineralized80 fault rock from the cuttings in order to examine the fault81 rock geochemistry.82 [4] Both bulk mineral assemblages and elemental com-83 position of exhumed rocks of the San Andreas Fault have84 been previously reported [e.g., Evans and Chester, 1995;85 Solum et al., 2006; Schulz and Evans, 2000], but this paper86 is the first to present SAFOD geochemical data from the87 fault rocks at depths, including the creeping part of the San88 Andreas Fault, as opposed to bulk rock analyses that mask89 fault-related processes. We present evidence that significant90 volumes of fluids have circulated through the fault zone91 over its history of development, despite the apparent lack of92 present-day evidence for fluid flow based on drilling mud-93 gas analyses [Wiersberg and Erzinger, 2007, 2008].
94 2. San Andreas Fault and the SAFOD Drill Hole
95 [5] The �1300 km long San Andreas Fault is a right-96 lateral strike-slip fault in western California, marking the97 boundary between the Pacific Plate in the west and the98 North American Plate in the east. In the area of Parkfield in99 central California, the fault transitions from creeping to100 seismic behavior, resulting in enhanced major and minor101 earthquakes at different depths. For this reason, a hole has102 been drilled through the San Andreas Fault at this location103 (the San Andreas Fault Observatory at Depth (SAFOD)) as104 part of the Earthscope initiative (http:/www.icdp-online.de/105 sites/sanandreas/index/). This hole, situated �1.8 km south-106 west of the surface trace of the fault, provides a natural
107laboratory to study the physical and chemical processes108associated with active deformation, creep and earthquake109generation [Hickman et al., 2004]. In 2002, a vertical Pilot110hole was drilled to 2.2 km depth into Salinian granite and111granodiorite after drilling through pebbly sandstone112[Hickman and Zoback, 2004; Solum and van der Pluijm,1132004]. The main hole, drilled during 2004 and 2005 (phases1141 and 2), is vertical to a depth of approximately 1.7 km,115where it begins an angled descent in order to intersect the116trace of the San Andreas Fault at around 2.7 km true vertical117depth (TVD; Figure 1b). Phase 1 was completed in 2004118and drilled through Quaternary and Tertiary sedimentary119rocks, granite/granodiorite and into arkosic sedimentary120rocks [Draper et al., 2005; Hickman et al., 2005]. Phase 2121activities occurred in summer 2005 and completed drilling122to 3992 m measured depth (MD) along the drill hole. This123drilling extended into interbedded mudstone, siltstone and124shale lithologies at the bottom of the drill hole (Figure 1c)125[Draper et al., 2005; Hickman et al., 2005]. Bradbury et al.126[2007] investigated the bulk mineralogy of the SAFOD drill127cuttings, showing an arkosic rock sequence from 1920 to1282550 m, separated by a clay rich zone at 2530–2680 m and129a fine-grained sequence at 2680–3150 m MD. A lithologic130change occurs at �3150 m MD, where arenites are replaced131by fine-grained siltstone and shaly fragments. The section at1323150–3550 m MD is characterized by fine-grained quartz-133feldspar-rich mudrocks (siltstone and shales) with interbed-134ded sandstones. The occurrence of localized alteration and135cataclasite defines multiple deformation zones in the 3000–1363400 m MD region. In summer 2007, Phase 3 was com-137pleted by drilling several multilateral core holes from the138main hole within the active segment of the San Andreas139Fault.
1403. Methods
141[6] Drill cuttings, a few mm in size, were selected in 3 m142intervals for systematic analysis from the two sections of the
Figure 1. (a) Location map marking the San Andreas Fault and the San Andreas Fault Observatory atDepth (SAFOD) drill site in Parkfield. (b) Schematic image of the SAFOD drill holes (Pilot hole andMain hole) modified after Zoback and Hickman [2005]. (c) Details of the study area, showing the mainlithologies and the sample location of the shallow fault trace 1 (3069 to 3170 m measured depth (MD))and the deep main fault trace 2 (3292 to 3368 m MD), modified after Draper et al. [2005].
XXXXXX SCHLEICHER ET AL.: FLUID-ROCK INTERACTION IN THE SAFOD HOLE
2 of 12
XXXXXX
143 San Andreas Fault drill hole; the shallower fault trace 1144 (3066 m to 3169 m MD), and the deeper main fault trace 2145 (3292 m to 3368 m MD). A magnet was used to separate146 steel shavings from each sample introduced during drilling.147 The remaining cuttings were examined under a binocular148 microscope with the purpose of identifying and picking149 fault-related grains. Hand-picked grains allow detailed char-150 acterization of the fault rock minerals and recognition of151 small-scale heterogeneities that are associated with faulting.152 The dark gray fault fragments are typical mudrocks (silt-153 stones, mudstones, and clay stones), mainly less than 1 mm154 in size and identified by the presence of polished surfaces155 and thin film coatings with slickenside striations. For each156 sample, approximately 100–200 mg of material was hand-157 picked and rinsed for �1 min in deionized water in an158 ultrasonic bath to remove any remaining drilling mud and159 steel shaving contamination.160 [7] The mineral assemblages of the bulk rock and the161 picked fault-related grains were determined using a Scintag162 X-ray diffractometer with CuKa radiation and a step size of163 0.02 �2q. The preparation of the rock samples followed the164 analytical methods described by Moore and Reynolds165 [1997]. Randomly oriented powder samples, as well as166 oriented samples (air-dried and ethylene glycolated) were167 prepared to identify the individual bulk and clay mineralo-168 gy. For scanning electron microscopy (SEM) analysis,169 polished thin sections from core material at 3066 m and170 3436 m MD were coated with carbon and studied with a171 Hitachi S3200N SEM using backscatter imaging and semi-172 quantitative energy (X-ray) dispersive spectroscopy (EDS).173 The mineral occurrence, composition and shape were char-174 acterized from 3 m above fault trace 1, and from approx-175 imately 68 m below fault trace 2. These representative176 mudrock samples were chosen because of their best prox-177 imity to the areas of interest.178 [8] Elemental geochemistry including major rock form-179 ing elements and some minor elements (Rb, Ti, and Zr) of180 the bulk rock and the picked fault rock samples were181 analyzed using Inductively Coupled Plasma-Optical Emis-182 sion Spectrometry (ICP-OES). The powdered rock samples183 (100 mg) were digested in 5% trace metal HNO3 with 1 g of
184ultra pure fused anhydrous lithium metaborate and 100 mg185of lithium bromide (a nonwetting agent was included to186facilitate melting). A Mn solution was used to align the ICP-187OES. The ICP-OES was calibrated using a blank and 6188dilutions (1/10, 1/50, 1/100, 1/500, 1/1000, and 1/5000) of189SM-225102, a certified digest standard (High Purity Stand-190ards). Quality control samples, River sediment B, Trace191Metal Drinking Water, and SM-90 were chosen as they192include all of the elements analyzed. They were measured193after every ten samples to check for instrument drift. USGS194standards QLO-1, RGM-1, SCo-1, BHVO-1, and SDC-1195[Abbey, 1983; Gladney and Roelandts, 1988; Govindaraju,1961994; Flanagan, 1976] were also analyzed and used to197routinely correct measurements.198[9] Modifying Gresens’ [1967] and Grant’s [1986, 2005]199volume composition calculations, the following mass bal-200ance equations can be written for four sections of the fault201(3069–3158 m, 3160–3170 m, 3292–3316 m, 3320–2023368 m) on the basis of changes in element distribution.203In order to determine the percent change of each oxide, the204slope is used to predict where the plucked fault concentra-205tion of a given oxide should lie along the slope of immobile206oxides and the differences between the actual and the207predicted measurement established. The amount of element208gain or loss is determined by multiplying the percent change209and the bulk rock value (Table 1). For the purpose of this210study, the ratio of the density of wall rock to fault rock is211assumed to be 1, reflecting the observations that the rock212types are similar. Using the percent change for each element213(Table 1), the amount of each element lost per 100 g of bulk214rock is calculated below:
100 g bulk rock� 47:22 g SiO2 � 6:10 gAl2O3 � 2:17 gNa2O
� 1:29 gK2O� 1:13 gCaO� 0:58 g Fe2O3 � 0:23 gBaO
� 0:01 gRb2O ¼ 41:27 g fault rockþ 0:29 gMgO
þ 0:09 g TiO2 þ 0:03 g P2O5
þ 0:01 gMnO 3066� 3158mMDð Þ
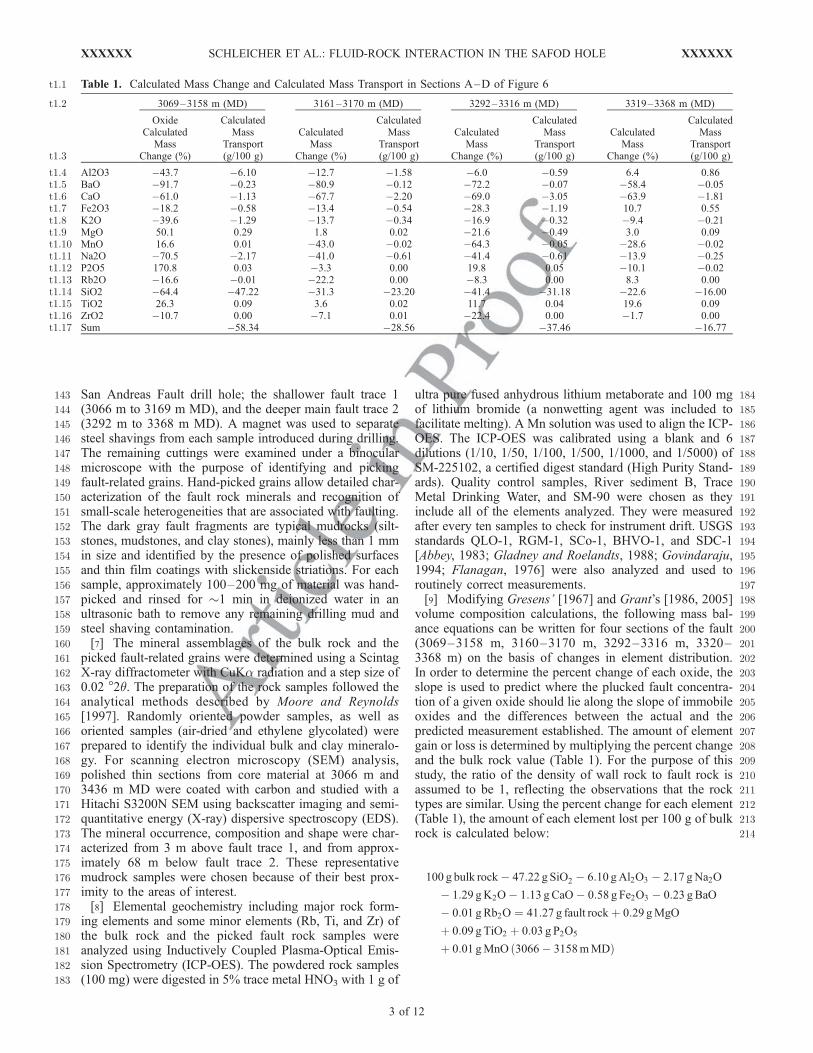
t1.1 Table 1. Calculated Mass Change and Calculated Mass Transport in Sections A–D of Figure 6
3069–3158 m (MD) 3161–3170 m (MD) 3292–3316 m (MD) 3319–3368 m (MD)t1.2
OxideCalculated
MassChange (%)
CalculatedMass
Transport(g/100 g)
CalculatedMass
Change (%)
CalculatedMass
Transport(g/100 g)
CalculatedMass
Change (%)
CalculatedMass
Transport(g/100 g)
CalculatedMass
Change (%)
CalculatedMass
Transport(g/100 g)t1.3
Al2O3 �43.7 �6.10 �12.7 �1.58 �6.0 �0.59 6.4 0.86t1.4BaO �91.7 �0.23 �80.9 �0.12 �72.2 �0.07 �58.4 �0.05t1.5CaO �61.0 �1.13 �67.7 �2.20 �69.0 �3.05 �63.9 �1.81t1.6Fe2O3 �18.2 �0.58 �13.4 �0.54 �28.3 �1.19 10.7 0.55t1.7K2O �39.6 �1.29 �13.7 �0.34 �16.9 �0.32 �9.4 �0.21t1.8MgO 50.1 0.29 1.8 0.02 �21.6 �0.49 3.0 0.09t1.9MnO 16.6 0.01 �43.0 �0.02 �64.3 �0.05 �28.6 �0.02t1.10Na2O �70.5 �2.17 �41.0 �0.61 �41.4 �0.61 �13.9 �0.25t1.11P2O5 170.8 0.03 �3.3 0.00 19.8 0.05 �10.1 �0.02t1.12Rb2O �16.6 �0.01 �22.2 0.00 �8.3 0.00 8.3 0.00t1.13SiO2 �64.4 �47.22 �31.3 �23.20 �41.4 �31.18 �22.6 �16.00t1.14TiO2 26.3 0.09 3.6 0.02 11.7 0.04 19.6 0.09t1.15ZrO2 �10.7 0.00 �7.1 0.01 �22.4 0.00 �1.7 0.00t1.16Sum �58.34 �28.56 �37.46 �16.77t1.17
XXXXXX SCHLEICHER ET AL.: FLUID-ROCK INTERACTION IN THE SAFOD HOLE
3 of 12
XXXXXX
100 g bulk rock� 23:20 g SiO2 � 2:20 gCaO� 1:58 gAl2O3
� 0:61 gNa2O� 0:54 g Fe2O3 � 0:34 gK2O� 0:12 gBaO
� 0:02 gMnO ¼ 71:39 g fault rockþ 0:02 g TiO2
þ 0:02 gMgO 3161� 3169mMDð Þ
100 g bulk rock� 31:18 g SiO2 � 3:05 gCaO� 1:19 g Fe2O3
� 0:59 gAl2O3 � 0:61 gNa2O� 0:49 gMgO� 0:32 gK2O
� 0:07 gBaO� 0:5 gMnO ¼ 61:99 g fault rockþ 0:04 g TiO2
þ 0:05 P2O5 3292� 3316mMDð Þ
100 g bulk rock� 16:00 g SiO2 � 1:81 gCaO� 0:25 gNa2O
� 0:21 gK2O� 0:05 gBaO� 0:02 gMnO;� 0:02 g P2O5
¼ 81:6 g fault rockþ 0:86 gAl2O3 þ 0:55 g Fe2O3 þ 0:09 gMgO
þ 0:09 g TiO2 3219� 3368mMDð Þ
224 4. Results
225 4.1. Mineralogy
226 4.1.1. X-Ray Diffraction Analysis227 [10] The X-ray diffraction (XRD) analyses of randomly228 oriented bulk rock samples show abundant quartz, feldspar229 (both plagioclase and K-feldspar) and clay minerals (illite230 and illite-smectite/I-S) as main components, along with231 minor amounts of calcite and laumontite in some samples232 [see also Solum et al., 2006]. The appearance of chlorite and233 chlorite-smectite (C-S) minerals at �3150 m MD reflects234 the lithologic change from finer grained arkosic sandstones235 to a fine-grained quartz-feldspar-rich siltstone that alternates236 with sandy and shaly sections [Draper et al., 2005;237 Bradbury et al., 2007]. The picked fault-related grain238 material comprises fine-grained mudrock lithologies con-239 taining abundant illite and I-S along with quartz and240 plagioclase components in the shallow fault trace. Occa-241 sional discrete smectite minerals with additional chlorite242 and/or C-S also occur in the deeper fault trace. Because the243 fault and matrix mineralization cannot be entirely separated,244 the basic fault rock mineralogy is not significantly different245 from the bulk wall rock assemblage, except of the higher246 abundance of smectite components in the I-S and C-S mix-247 layered minerals. Notable variations in the abundance of248 chlorite, illite, I-S and C-S from the picked fault rocks at249 different depths were observed on the basis of air-dried and250 glycolated XRD patterns of oriented samples.251 [11] Three representative samples from the shallow fault252 trace 1 and the deeper fault trace 2 are shown in Figures 2a–253 2c. The low-angle diffraction pattern at 3075 m MD254 (Figure 2a) shows a broad peak in the air-dried sample with255 two distinct maxima, caused by the combined contribution256 of two >10 A phases. The peak at �10 A represents a pure257 illite phase, whereas the peak at �11 A indicates the I-S258 phase. A shift to ca 12 A after saturation with ethylene259 glycol reflects a small amount of interlayer smectite [Moore260 and Reynolds, 1997; Schleicher et al., 2008]. The XRD261 patterns of the fault-related grains at 3170 m MD that
262reflects the deepest sample in the shallow area (Figure 2b),263shows as well typical illite and I-S components in the form264of a broad peak with two maxima. However, here the I-S265peak occurs at 10.6 A, reflecting fewer smectite interlayers.266The glycolated mixed-layered reflection is likely obscured267by the position of the chlorite peak at 14.5 A.268[12] The fault rocks from fault trace 2 shows similar269components of illite and I-S. However, on the basis of the270peak shape and peak position, I-S with slightly higher271amounts of smectite occurs in some of the samples, as seen,272for example, at 3344 m MD (Figure 2c) with a broad I-S273peak shifting to 12.6 A after ethylene glycolation. The shift274of the chlorite peak in the glycolated samples indicate a C-S275phase that could be observed in most of the XRD patterns at276these depths. Similar C-S mixed-layered phases were de-277scribed from the exhumed Punchbowl fault and the SAFOD278Pilot hole [Solum et al., 2003; Solum and van der Pluijm,2792004].2804.1.2. Scanning Electron Microscopy Analysis281[13] To image the minerals and microstructures of the282investigated mudrocks and to obtain confirmation of the283mineral assemblages determined by XRD, Figure 3 presents284representative backscattered electron images from two rock285core samples at 3066 m MD (�3 m above the shallow trace)286and 3436 m MD (68 m below the main trace). Numerous287reaction textures are observed with quartz, feldspar, chlorite,288illite and associated mixed-layered clays along the investi-289gated fault traces 1 and 2 (Figures 3a and 3b). K-feldspar290and albite/anorthite detrital clasts are strongly dissolved,291and associated pores and sutured grain boundaries are often292filled with clay minerals that make up the fine-grained293matrix of these fine-grained clastic lithologies. Pores formed294within grains occur in both quartz and feldspar, whereby the295strongly dissolved plagioclase (albite/anorthite mixtures)296appears only as isolated remnants occurring within the clay297dominated matrix. Relatively large (>2 mm) detrital grains298of illite occur together with <2 mm authigenic I-S particles299with characteristic irregular flaky shapes [Schleicher et al.,3002008]. Figure 3a shows albite/anorthite minerals from the301shallower sample at 3066 m MD altered into I-S clay302minerals. The EDS patterns of the alteration products show303a relatively high amount of K and less Na and Ca, next to304Mg and less Fe. Also, I-S precipitates in small pores are305relatively K rich.306[14] The more fractured minerals in the deeper samples at3073436 m MD (Figure 3b) show even stronger alteration of308detrital plagioclase, feldspar and quartz, with enhanced309mineralization of mixed-layered I-S as well as C-S minerals310with a range of different particle sizes and shapes. Irregular311fractures and veins are mainly filled with calcite, but on the312basis of TEM observations some very small veins are also313filled with smectitic minerals [Schleicher et al., 2006b].
3144.2. Geochemistry
3154.2.1. Major Element Distribution316[15] A composite traverse through the fault zone is317plotted using a logarithmic scale in Figure 4. It shows the318elemental distribution of the picked fault-related grains319across the shallow fault and the deep fault traces. The most320constant concentrations in both fault zones are seen for321SiO2, Al2O3, and ZrO2. In the shallow fault trace 1, the322oxide element distributions are all relatively homogenous
XXXXXX SCHLEICHER ET AL.: FLUID-ROCK INTERACTION IN THE SAFOD HOLE
4 of 12
XXXXXX
323 with one distinct change at 3160 m MD. Beneath this level,324 MnO, TiO2, Na2O, MgO, K2O, and Fe2O3 are slightly more325 depleted, whereas some oxides (MnO, TiO2, Na2O, and326 K2O) show a continuous decrease until 3170 m MD. Only
327CaO is more enriched after the change at 3160 m MD, and328shows a continuous increase with depth.329[16] In comparison to the shallow fault trace 1, the deeper330fault trace 2 shows notably lower concentrations of ZrO2,
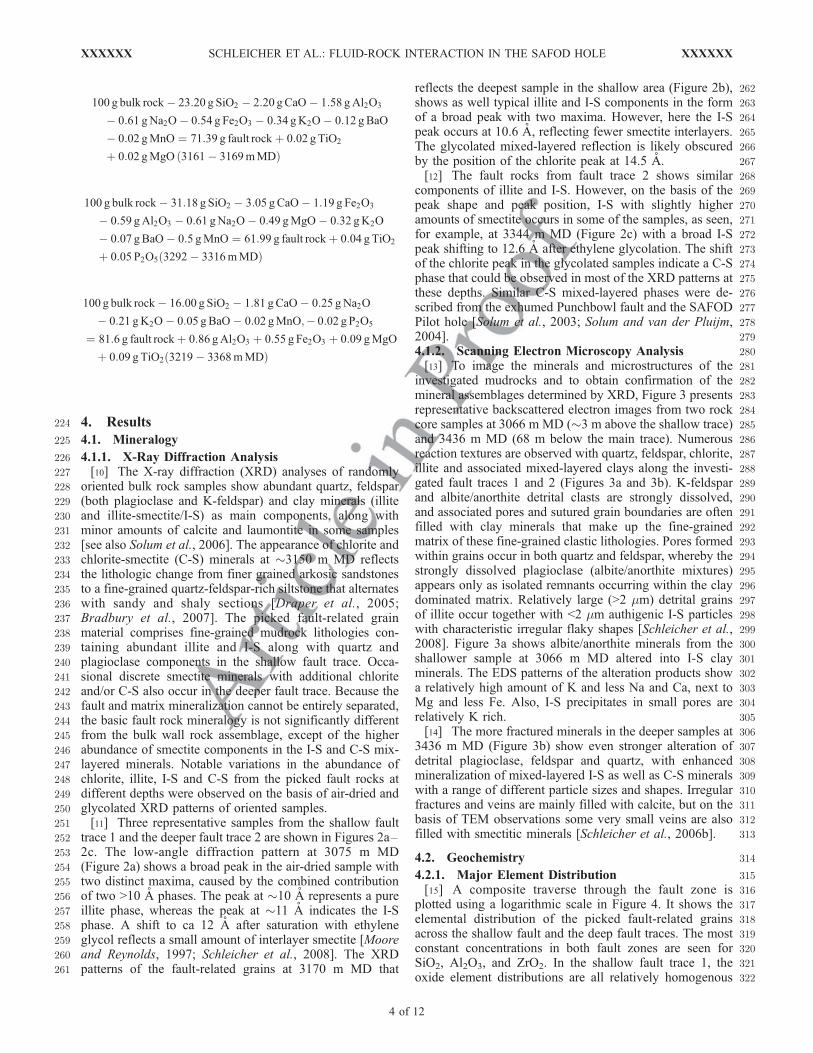
Figure 2. X-ray diffraction patterns from plucked fault rock cuttings at (a) 3075 m MD, (b) 3170 mMD, and (c) 3344 m MD. Air-dried and glycolated spectra are shown. Chl, chlorite; I-S, illite-smectite; Il,illite.
XXXXXX SCHLEICHER ET AL.: FLUID-ROCK INTERACTION IN THE SAFOD HOLE
5 of 12
XXXXXX
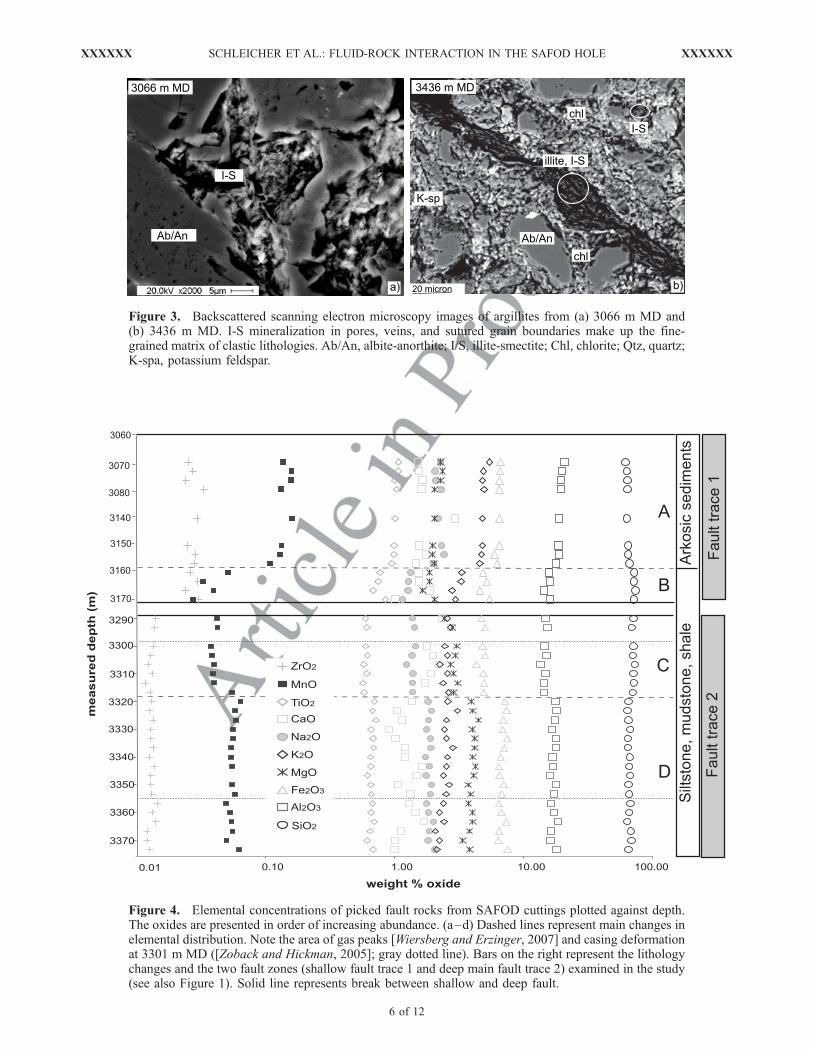
Figure 3. Backscattered scanning electron microscopy images of argillites from (a) 3066 m MD and(b) 3436 m MD. I-S mineralization in pores, veins, and sutured grain boundaries make up the fine-grained matrix of clastic lithologies. Ab/An, albite-anorthite; I/S, illite-smectite; Chl, chlorite; Qtz, quartz;K-spa, potassium feldspar.
Figure 4. Elemental concentrations of picked fault rocks from SAFOD cuttings plotted against depth.The oxides are presented in order of increasing abundance. (a–d) Dashed lines represent main changes inelemental distribution. Note the area of gas peaks [Wiersberg and Erzinger, 2007] and casing deformationat 3301 m MD ([Zoback and Hickman, 2005]; gray dotted line). Bars on the right represent the lithologychanges and the two fault zones (shallow fault trace 1 and deep main fault trace 2) examined in the study(see also Figure 1). Solid line represents break between shallow and deep fault.
XXXXXX SCHLEICHER ET AL.: FLUID-ROCK INTERACTION IN THE SAFOD HOLE
6 of 12
XXXXXX
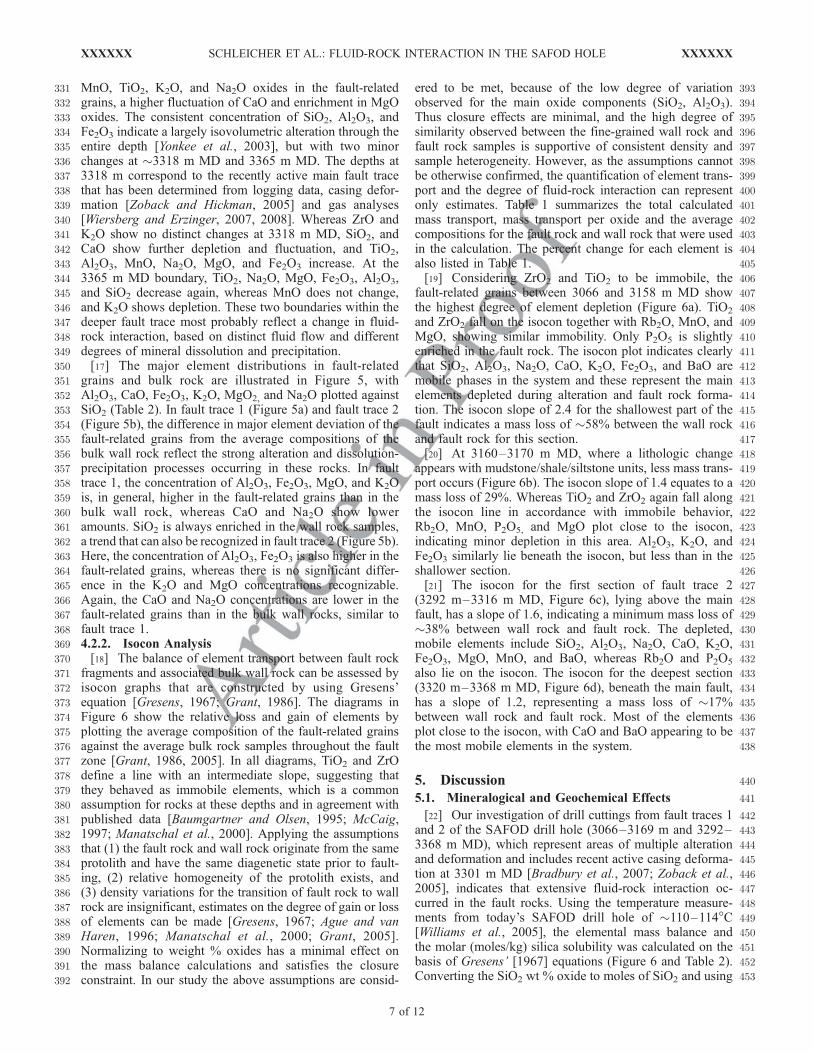
331 MnO, TiO2, K2O, and Na2O oxides in the fault-related332 grains, a higher fluctuation of CaO and enrichment in MgO333 oxides. The consistent concentration of SiO2, Al2O3, and334 Fe2O3 indicate a largely isovolumetric alteration through the335 entire depth [Yonkee et al., 2003], but with two minor336 changes at �3318 m MD and 3365 m MD. The depths at337 3318 m correspond to the recently active main fault trace338 that has been determined from logging data, casing defor-339 mation [Zoback and Hickman, 2005] and gas analyses340 [Wiersberg and Erzinger, 2007, 2008]. Whereas ZrO and341 K2O show no distinct changes at 3318 m MD, SiO2, and342 CaO show further depletion and fluctuation, and TiO2,343 Al2O3, MnO, Na2O, MgO, and Fe2O3 increase. At the344 3365 m MD boundary, TiO2, Na2O, MgO, Fe2O3, Al2O3,345 and SiO2 decrease again, whereas MnO does not change,346 and K2O shows depletion. These two boundaries within the347 deeper fault trace most probably reflect a change in fluid-348 rock interaction, based on distinct fluid flow and different349 degrees of mineral dissolution and precipitation.350 [17] The major element distributions in fault-related351 grains and bulk rock are illustrated in Figure 5, with352 Al2O3, CaO, Fe2O3, K2O, MgO2, and Na2O plotted against353 SiO2 (Table 2). In fault trace 1 (Figure 5a) and fault trace 2354 (Figure 5b), the difference in major element deviation of the355 fault-related grains from the average compositions of the356 bulk wall rock reflect the strong alteration and dissolution-357 precipitation processes occurring in these rocks. In fault358 trace 1, the concentration of Al2O3, Fe2O3, MgO, and K2O359 is, in general, higher in the fault-related grains than in the360 bulk wall rock, whereas CaO and Na2O show lower361 amounts. SiO2 is always enriched in the wall rock samples,362 a trend that can also be recognized in fault trace 2 (Figure 5b).363 Here, the concentration of Al2O3, Fe2O3 is also higher in the364 fault-related grains, whereas there is no significant differ-365 ence in the K2O and MgO concentrations recognizable.366 Again, the CaO and Na2O concentrations are lower in the367 fault-related grains than in the bulk wall rocks, similar to368 fault trace 1.369 4.2.2. Isocon Analysis370 [18] The balance of element transport between fault rock371 fragments and associated bulk wall rock can be assessed by372 isocon graphs that are constructed by using Gresens’373 equation [Gresens, 1967; Grant, 1986]. The diagrams in374 Figure 6 show the relative loss and gain of elements by375 plotting the average composition of the fault-related grains376 against the average bulk rock samples throughout the fault377 zone [Grant, 1986, 2005]. In all diagrams, TiO2 and ZrO378 define a line with an intermediate slope, suggesting that379 they behaved as immobile elements, which is a common380 assumption for rocks at these depths and in agreement with381 published data [Baumgartner and Olsen, 1995; McCaig,382 1997; Manatschal et al., 2000]. Applying the assumptions383 that (1) the fault rock and wall rock originate from the same384 protolith and have the same diagenetic state prior to fault-385 ing, (2) relative homogeneity of the protolith exists, and386 (3) density variations for the transition of fault rock to wall387 rock are insignificant, estimates on the degree of gain or loss388 of elements can be made [Gresens, 1967; Ague and van389 Haren, 1996; Manatschal et al., 2000; Grant, 2005].390 Normalizing to weight % oxides has a minimal effect on391 the mass balance calculations and satisfies the closure392 constraint. In our study the above assumptions are consid-
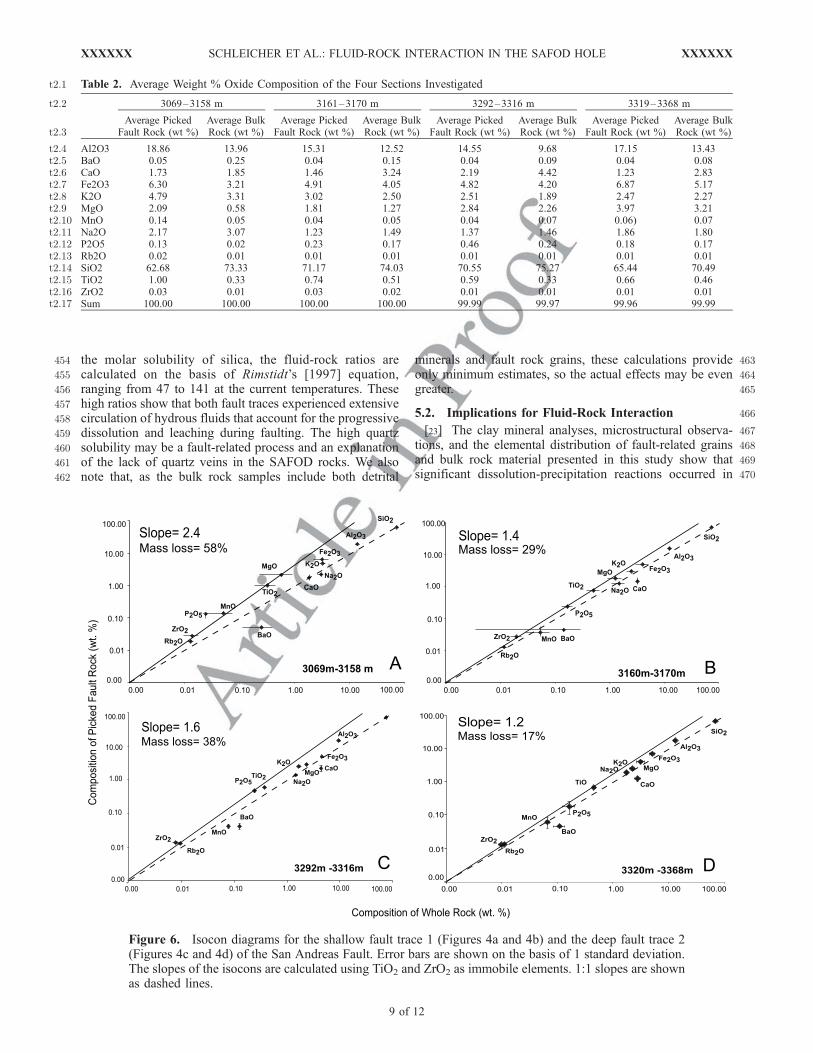
393ered to be met, because of the low degree of variation394observed for the main oxide components (SiO2, Al2O3).395Thus closure effects are minimal, and the high degree of396similarity observed between the fine-grained wall rock and397fault rock samples is supportive of consistent density and398sample heterogeneity. However, as the assumptions cannot399be otherwise confirmed, the quantification of element trans-400port and the degree of fluid-rock interaction can represent401only estimates. Table 1 summarizes the total calculated402mass transport, mass transport per oxide and the average403compositions for the fault rock and wall rock that were used404in the calculation. The percent change for each element is405also listed in Table 1.406[19] Considering ZrO2 and TiO2 to be immobile, the407fault-related grains between 3066 and 3158 m MD show408the highest degree of element depletion (Figure 6a). TiO2
409and ZrO2 fall on the isocon together with Rb2O, MnO, and410MgO, showing similar immobility. Only P2O5 is slightly411enriched in the fault rock. The isocon plot indicates clearly412that SiO2, Al2O3, Na2O, CaO, K2O, Fe2O3, and BaO are413mobile phases in the system and these represent the main414elements depleted during alteration and fault rock forma-415tion. The isocon slope of 2.4 for the shallowest part of the416fault indicates a mass loss of �58% between the wall rock417and fault rock for this section.418[20] At 3160–3170 m MD, where a lithologic change419appears with mudstone/shale/siltstone units, less mass trans-420port occurs (Figure 6b). The isocon slope of 1.4 equates to a421mass loss of 29%. Whereas TiO2 and ZrO2 again fall along422the isocon line in accordance with immobile behavior,423Rb2O, MnO, P2O5, and MgO plot close to the isocon,424indicating minor depletion in this area. Al2O3, K2O, and425Fe2O3 similarly lie beneath the isocon, but less than in the426shallower section.427[21] The isocon for the first section of fault trace 2428(3292 m–3316 m MD, Figure 6c), lying above the main429fault, has a slope of 1.6, indicating a minimum mass loss of430�38% between wall rock and fault rock. The depleted,431mobile elements include SiO2, Al2O3, Na2O, CaO, K2O,432Fe2O3, MgO, MnO, and BaO, whereas Rb2O and P2O5
433also lie on the isocon. The isocon for the deepest section434(3320 m–3368 m MD, Figure 6d), beneath the main fault,435has a slope of 1.2, representing a mass loss of �17%436between wall rock and fault rock. Most of the elements437plot close to the isocon, with CaO and BaO appearing to be438the most mobile elements in the system.
4405. Discussion
4415.1. Mineralogical and Geochemical Effects
442[22] Our investigation of drill cuttings from fault traces 1443and 2 of the SAFOD drill hole (3066–3169 m and 3292–4443368 m MD), which represent areas of multiple alteration445and deformation and includes recent active casing deforma-446tion at 3301 m MD [Bradbury et al., 2007; Zoback et al.,4472005], indicates that extensive fluid-rock interaction oc-448curred in the fault rocks. Using the temperature measure-449ments from today’s SAFOD drill hole of �110–114�C450[Williams et al., 2005], the elemental mass balance and451the molar (moles/kg) silica solubility was calculated on the452basis of Gresens’ [1967] equations (Figure 6 and Table 2).453Converting the SiO2 wt % oxide to moles of SiO2 and using
XXXXXX SCHLEICHER ET AL.: FLUID-ROCK INTERACTION IN THE SAFOD HOLE
7 of 12
XXXXXX
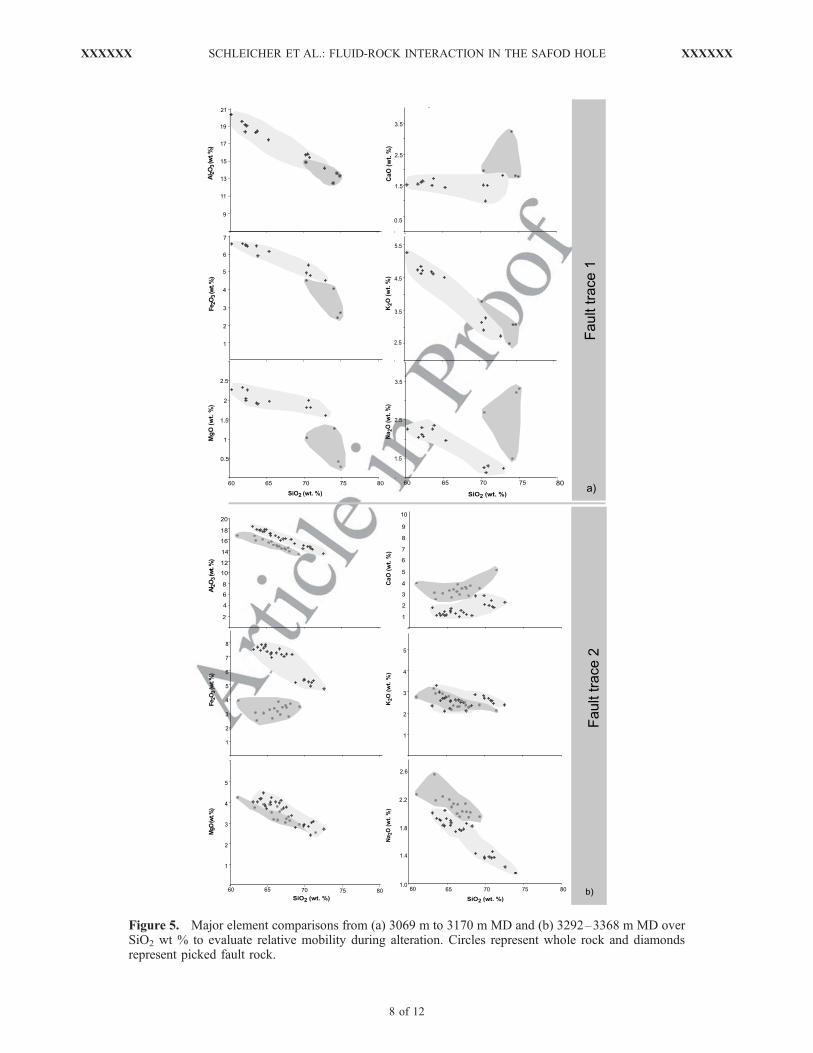
Figure 5. Major element comparisons from (a) 3069 m to 3170 m MD and (b) 3292–3368 m MD overSiO2 wt % to evaluate relative mobility during alteration. Circles represent whole rock and diamondsrepresent picked fault rock.
XXXXXX SCHLEICHER ET AL.: FLUID-ROCK INTERACTION IN THE SAFOD HOLE
8 of 12
XXXXXX
454 the molar solubility of silica, the fluid-rock ratios are455 calculated on the basis of Rimstidt’s [1997] equation,456 ranging from 47 to 141 at the current temperatures. These457 high ratios show that both fault traces experienced extensive458 circulation of hydrous fluids that account for the progressive459 dissolution and leaching during faulting. The high quartz460 solubility may be a fault-related process and an explanation461 of the lack of quartz veins in the SAFOD rocks. We also462 note that, as the bulk rock samples include both detrital
463minerals and fault rock grains, these calculations provide464only minimum estimates, so the actual effects may be even465greater.
4665.2. Implications for Fluid-Rock Interaction
467[23] The clay mineral analyses, microstructural observa-468tions, and the elemental distribution of fault-related grains469and bulk rock material presented in this study show that470significant dissolution-precipitation reactions occurred in
t2.1 Table 2. Average Weight % Oxide Composition of the Four Sections Investigated
3069–3158 m 3161–3170 m 3292–3316 m 3319–3368 mt2.2
Average PickedFault Rock (wt %)
Average BulkRock (wt %)
Average PickedFault Rock (wt %)
Average BulkRock (wt %)
Average PickedFault Rock (wt %)
Average BulkRock (wt %)
Average PickedFault Rock (wt %)
Average BulkRock (wt %)t2.3
Al2O3 18.86 13.96 15.31 12.52 14.55 9.68 17.15 13.43t2.4BaO 0.05 0.25 0.04 0.15 0.04 0.09 0.04 0.08t2.5CaO 1.73 1.85 1.46 3.24 2.19 4.42 1.23 2.83t2.6Fe2O3 6.30 3.21 4.91 4.05 4.82 4.20 6.87 5.17t2.7K2O 4.79 3.31 3.02 2.50 2.51 1.89 2.47 2.27t2.8MgO 2.09 0.58 1.81 1.27 2.84 2.26 3.97 3.21t2.9MnO 0.14 0.05 0.04 0.05 0.04 0.07 0.06) 0.07t2.10Na2O 2.17 3.07 1.23 1.49 1.37 1.46 1.86 1.80t2.11P2O5 0.13 0.02 0.23 0.17 0.46 0.24 0.18 0.17t2.12Rb2O 0.02 0.01 0.01 0.01 0.01 0.01 0.01 0.01t2.13SiO2 62.68 73.33 71.17 74.03 70.55 75.27 65.44 70.49t2.14TiO2 1.00 0.33 0.74 0.51 0.59 0.33 0.66 0.46t2.15ZrO2 0.03 0.01 0.03 0.02 0.01 0.01 0.01 0.01t2.16Sum 100.00 100.00 100.00 100.00 99.99 99.97 99.96 99.99t2.17
Figure 6. Isocon diagrams for the shallow fault trace 1 (Figures 4a and 4b) and the deep fault trace 2(Figures 4c and 4d) of the San Andreas Fault. Error bars are shown on the basis of 1 standard deviation.The slopes of the isocons are calculated using TiO2 and ZrO2 as immobile elements. 1:1 slopes are shownas dashed lines.
XXXXXX SCHLEICHER ET AL.: FLUID-ROCK INTERACTION IN THE SAFOD HOLE
9 of 12
XXXXXX
471 both fault sections (trace 1 and 2) with enhanced, fluid-472 assisted element transport. Dissolution of primary quartz,473 feldspar, and mica lead to elemental transport of Si, Al, K,474 Ca, Mg, and Fe, and the precipitation of mixed-layered I-S475 and C-S, calcite, and laumontite predominantly along frac-476 ture and fault surfaces. The loss of the alkali’s (K2O, CaO,477 Na2O, Al2O3, and SiO2) is generally linked to feldspar and478 quartz dissolution that can be observed in the SEM images479 (Figure 3). The minor loss of MgO and greater loss of480 Fe2O3 support the precipitation of chlorite and C-S. A likely481 interpretation is that the alkali elements were transported482 along slip surfaces and crystallized elsewhere in the form of483 I-S, C-S, and smectite minerals. Ca is highly mobile484 throughout the entire fault zone and likely contributed to485 the precipitation of Ca-zeolites, Ca-sulfates, and calcite.486 These precipitates are common in cuttings and core material487 [Solum et al., 2006; Bradbury et al., 2007; Draper et al.,488 2005], and their abundance fluctuates across the fault traces489 occurring as vein or adjacent pore fillings. Another distinct490 Ca source is the alteration of anorthite, whereas the loss of491 K generally reflects the dissolution of detrital K-feldspar,492 biotite, or authigenic illite-smectite minerals that were493 formed during prior diagenesis.494 [24] On the basis of detailed mineralogical study and495 modeling of I-S minerals in the matrix of several fine-496 grained mudrock core samples at three different depths,497 Schleicher et al. [2008] concluded that the bulk volume clay498 minerals formed during slow burial diagenesis over the past499 5 to 11 Ma and are not related directly to fault slip.500 Exceptions to this burial pattern are the mixed layered501 phases with higher smectite content than predicted by this502 burial model, which are concentrated along the mineralized503 slip surfaces that characterize the fault rock fragments504 analyzed in this study. As both burial- and fault-related505 clay are present to varying extent in both fault rock frag-506 ments and the less deformed host rock, it is evident that the507 elemental variations shown in Figure 6 result from a508 combination of these two processes.509 [25] In this study, we distinguish three distinct changes in510 element composition through fault trace 1 and 2 (Figure 4).511 The change in the shallow fault may be explained by a512 lithologic transition from arkosic sandstone to fine-grained513 shaly rocks [Bradbury et al., 2007]. However, because the514 picked fault-related grains with striations and polished515 surfaces are relatively homogenous in composition, show-516 ing only the appearance of chlorite in XRD, the continuous517 element depletion after 3160 m MD could also reflect518 enhanced fluid flow along the fault zone and higher degrees519 of fluid-rock interaction in this area. The clay mineral520 assemblage in fault trace 2 is relatively constant through521 depth with no lithologic variation, but two recognizable522 changes in the concentration of elements occur at 3317 m523 MD and at 3355 m MD. Here Wiersberg and Erzinger524 [2007] showed differences in the noble gas content of mud-525 gas samples, and Zoback et al. [2005] described distinct526 casing deformation at this level due to active fault creep.527 The concentrations of TiO2, Mn2O3, MgO, Fe2O3, Na2O,528 and Al2O3 and the strong fluctuation of CaO can be529 attributed to the enhanced precipitation of chlorite and/or530 C-S minerals. At 3368 m MD, another slight change in531 elemental distribution corresponds with small but notable532 gas peaks. These variations are likely related to the disso-
533lution of minerals induced by disequilibrium between the534fluid and the wall rock. Local dissolution occurs in associ-535ation with brittle fracturing and mineralization on slip536surfaces, whereby stress-induced mineral dissolution and537reprecipitation at grain-contacts are mechanisms that can538facilitate active fault creep. These relationships imply a539genetic relationship between the degree of elemental trans-540fer and local creep zones within the fault core.541[26] As it can be realistically assumed that the degree of542diagenetic alteration prior to faulting was similar for the543same lithologies at similar depths, the isocon plots can be544used to estimate the degree of fluid-rock interaction incurred545during the faulting. The highest degree of fluid-rock inter-546action recorded from the depth above �3160 m (area A of547Figure 4), with the highest mass loss of 58% and a high548fluid/rock ratio of 141, may correspond to the more perme-549able fractured fault margin as identified by Wiersberg and550Erzinger [2008]. However, as not all gas data are available551between 3060 and 3160 m MD, the precise position of the552upper fault core boundary remains uncertain.553[27] The lowest degree of element depletion recorded in554the fault rock compared to the wall rock lithology occurs in555the deepest part of fault trace 2, between 3320 and 3368 m556MD with �17% of mass loss and fluid/rock ratio of 47557(Figure 6d). This corresponds to the depth of active fault558creep with recent casing deformation [Zoback et al., 2005],559element changes at 3317 m MD and 3355 m MD, and560significant in situ gas peaks in the drilling mud [Wiersberg561and Erzinger, 2008]. Here I-S and C-S are the main562alteration products in the fault fragments. Whereas the563precipitation of C-S may be triggered by the transportation564of Mg and Fe from the wall rock into the fault rocks, K, and565Ca are leading elements for precipitation of I-S minerals as566thin films on fracture surfaces. The reduced amount of fluid567migration is likely related to the higher amount of thin film568coatings containing clays with greater amounts of interlay-569ered smectite that precipitate on fracture surfaces570[Schleicher et al., 2006b] and not in the wall rock. Stress-571enhanced dissolution at grain contacts is therefore proposed572as the main mechanism for mineral transformation in these573fault rocks, based on the localization of neomineralization574on slip surfaces.575[28] The high degree of fluid-rock interaction within the576segments of the fault zone is further supported by the577detection of recent fluids of Na-Ca-Cl composition in578the SAFOD borehole, which are considered to be typical579formation waters for sedimentary rocks in California580[Thordsen et al., 2005]. The present-day borehole temper-581atures (�110�C and �114�C respectively) are ideal for582extensive leaching and clay mineral precipitation. However,583on the basis of in situ mud-gas analysis in the Pilot and584Main boreholes, Wiersberg and Erzinger [2007, 2008]585suggested that the San Andreas Fault acts as a barrier for586both horizontal and vertical fluid flow, with more permeable587rocks at the fault zone margins surrounding a low-588permeable fault core. The distinct gas composition of some589sections detected in the fault at �3150–3200 m and 3310–5903340 m were interpreted as isolated gas lenses trapped from591the surrounding source rocks.592[29] Our results partly support the model of Wiersberg593and Erzinger [2007], with a higher degree of fluid/rock594interaction occurring along the margins of the fault core
XXXXXX SCHLEICHER ET AL.: FLUID-ROCK INTERACTION IN THE SAFOD HOLE
10 of 12
XXXXXX
595 than within the core itself. However, the geochemical596 constraints on the degree of elemental depletion along the597 principal fault traces clearly indicate that the San Andreas598 Fault zone does not behave as an impermeable structure.599 The mass loss and fluid-rock ratios we calculated require600 significant volumes of paleofluid along the fault during its601 history of development. Such discrepancies are to be602 expected in seismically active fault zones, which represent603 dynamically evolving structures that experience rapid604 changes in stress, permeability, and fluid flow linked to605 the earthquake cycle [Sibson, 1994]. Given today’s state of606 a fault that is not transporting much fluid, we suggest the607 core of the structure is currently in a stage of mineralization608 as opposed to transient fluid flow. The passage of such609 fluids still remains the primary cause of mineral hydration610 and clay growth within this active portion of the fault zone,611 and is an important agent in mass transfer and weakening612 during San Andreas faulting.613
614 [30] Acknowledgments. The National Science Foundation (EAR-615 0345985), the Deutsche Forschungsgemeinschaft (DFG Project SCHL616 1821/1–1 and 1/2), and the University of Michigan Turner Fund provided617 support for our ongoing SAFOD research. We thank Joel Blum for618 providing generous access to RIGL, Marcus Johnson and Carmen Nezat619 for their assistance in ICP-OES analysis, and Ted Huston for ICP-MS620 analysis at the University of Michigan. Thanks to John Solum for helping621 collect samples and many discussion on XRD analysis and SAFOD622 sampling. Nicholas Hayman and Jim Evans are gratefully thanked for their623 helpful reviews, as well as Chris Marone, Georg Dresen, and the Associate624 Editor Reid Cooper.
625 References626 Abbey, S. (1983), Studies in ‘‘standard samples’’ of silicate rocks and627 minerals 1969–1982, Pap. Geol. Surv. Can., 83–15, 114 pp.628 Ague, J. J., and J. L. M. van Haren (1996), Assessing metasomatic mass629 and volume changes using the bootstrap, with application to deep crustal630 hydrothermal alteration of marble, Econ. Geol., 91, 1169–1182.631 Baumgartner, L. P., and S. N. Olsen (1995), A least-squares approach to632 mass transport calculations using the isocon method, Econ. Geol., 90,633 1261–1270.634 Beach, A. (1976), The interrelations of fluid transport, deformation, geo-635 chemistry and heat flow in early Proterozoic shear zones in the Lewissian636 Complex, Philos. Trans. R. Soc. London, Ser. A, 280, 569–604.637 Bradbury, K. K., D. C. Barton, J. G. Solum, S. D. Draper, and J. P. Evans638 (2007), Mineralogic and textural analyses of drill cuttings from the San639 Andreas Fault Observatory at Depth (SAFOD) boreholes: Initial interpe-640 tations of fault zone composition and constraints on geologic models,641 Geosphere, 3(5), 299–318, doi:10.1130/GES00076.1.642 Carter, N. L., A. K. Kronenburg, J. V. Ross, and D. V. Wiltscho (1990),643 Control of fluids on deformation in rocks, in Deformation Mechanisms,644 Rheology and Tectonics, edited by R. J. Knipe and E. H. Rutter, Geol.645 Soc. Spec. Publ., 54, 1–13.646 Chester, F. M., and J. M. Logan (1986), Implications for mechanical proper-647 ties of brittle faults from observations of the Punchbowl Fault zone,648 California, Pure Appl. Geophys., 124, 79 – 106, doi:10.1007/649 BF00875720.650 Crawford, B. R., R. D. Myers, A. Woronow, D. R. Faulkner, and E. H.651 Rutter (2002), Porosity-permeability relationships in clay-bearing fault652 gouge, SPE paper 78214 presented at Rock Mechanics Conference, Irvin,653 Tex., 1–13.654 Dewhurst, D. N.,Y. Yang, and A. C. Aplin (1999), Permeability and fluid655 flow in natural mudstones, in Muds and Mudstones: Physical and Fluid656 Flow Properties, edited by A. C. Aplin et al., pp. 23–45, Geol. Soc.657 London, U. K.658 Draper, S. D., N. L. Boness, and J. P. Evans (2005), Source and significance659 of the sedimentary rocks in the SAFOD borehole: Preliminary analysis,660 Eos Trans. AGU, 86(52), Fall Meet. Suppl., Abstract T24B–02.661 Evans, J. P., and F. M. Chester (1995), Fluid-rock interaction in faults of the662 San Andreas system: Inferences from San Gabriel Fault rock geochem-663 istry and microstructures, J. Geophys. Res., 100, 13,007 – 13,020,664 doi:10.1029/94JB02625.665 Flanagan, F. J. (1976), Descriptions and analyses of eight new USGS rock666 standards, U.S. Geol. Surv. Prof. Pap., 840, 192.
667Forster, C. B., and J. P. Evans (1991), Fluid flow in thrust faults and668crustalline thrust sheets: Results of combined field and modeling studies,669Geophys. Res. Lett., 18, 979–982, doi:10.1029/91GL00950.670Gladney, E. S., and I. Roelandts (1988), Compilation of elemental concen-671tration data for USGS BHVO-1, MAG-1, QLO-1, RGM-1, SCo-1, SDC-6721, SGR-1, and STM-1, Geostand. Newsl., 12, 253–362, doi:10.1111/673j.1751-908X.1988.tb00053.x.674Govindaraju, K. (1994), Compilation of working values and descriptions675for 383 geostandards, Geostand. Newsl., 18, 1–158.676Grant, J. A. (1986), The isocon diagram: A simple solution to Gresens’677equation for metasomatic alteration, Econ. Geol., 81, 1976–1982.678Grant, J. A. (2005), Isocon analysis: A brief review of the method and679applications, Phys. Chem. Earth, 30, 997–1004.680Gresens, R. L. (1967), Composition-volume relationships of metasomatism,681Chem. Geol., 2, 47–65, doi:10.1016/0009-2541(67)90004-6.682Hayman, N. W. (2006), Shallow crustal fault rocks from the Black Moun-683tain detachments, Death Valley, CA, J. Struct. Geol., 28, 1767–1784,684doi:10.1016/j.jsg.2006.06.017.685Hickman, S. H., and M. D. Zoback (2004), Stress orientation and magni-686tudes in the SAFOD Pilot hole, Geophys. Res. Lett., 31, L15S12,687doi:10.1029/2004GL020043.688Hickman, S. H., M. D. Zoback, and W. L. Ellsworth (2004), Introduction to689special section: Preparing for the San Andreas Fault Observatory at690Depth, Geophys. Res. Lett., 31, L12S01, doi:10.1029/2004GL020688.691Hickman, S. H., M. D. Zoback, and W. L. Ellsworth (2005), Structure and692composition of the San Andreas Fault zone at Parkfield: Initial results693from SAFOD Phase I and II, Eos Trans. AGU, 86(52), Fall Meet. Suppl.,694Abstract T23E–05.695Hickman, S., et al. (2008), Structure and composition of the San Andreas696Fault in central California: Recent results from SAFOD sample analyses,697Eos Trans. AGU, 89(53), Fall Meet. Suppl., Abstract T53F–01.698Hulsebosch, T. P., and B. R. Frost (1989), Mineral changes, element mo-699bility, and fluids associated with deep shearing in the Mount Helen700structural belt, in Fluid Movements, Element Transport and the Composi-701tion of the Deep Crust, NATO Sci. Ser., Ser. C Mathematical and Physical702Sciences, vol. 281, edited by D. Bridgewater, pp. 139–150, Kluwer703Acad., Dordrecht, Netherlands.704Manatschal, G., D. Marquer, and G. L. Frueh-Gree (2000), Channelized705fluid flow and mass transfer along a rift-related detachment fault (eastern706Alps, southeast Switzerland), Geol. Soc. Am. Bull., 112(1), 21–33,707doi:10.1130/0016-7606(2000)112<0021:CFFAMT>2.3.CO;2.708Marquer, D., and M. Burkhard (1992), Fluid circulation, progressive de-709formation and mass-transfer processes in the upper crust: The example of710basement-cover relationships in the External Crystalline Massifs, Swit-711zerland, J. Struct. Geol., 14, 1047 – 1057, doi:10.1016/0191-7128141(92)90035-U.713McCaig, A. M. (1984), Fluid-rock interaction in some shear zones from the714Pyrenees, J. Metamorph. Geol., 2, 129 – 141, doi:10.1111/j.1525-7151314.1984.tb00292.x.716McCaig, A. M. (1997), The geochemistry of volatile fluid flow in shear717zones, in Deformation-Enhanced Fluid Transport in the Earth’s Crust718and Mantle,Mineral. Soc. Ser., vol. 8, edited by M. B. Holness, pp. 227–719266, Chapman and Hall, London.720Moore, D. M., and R. C. Reynolds Jr. (1997), X-Ray Diffraction and the721Identification of Clay Minerals, 2nd ed., Oxford Univ. Press, Oxford,722U. K.723Rimstidt, J. D. (1997), Quartz solubility at low temperatures, Geochim.724Cosmochim. Acta, 61, 2553 – 2558, doi:10.1016/S0016-7037(97)72500103-8.726Schleicher, A. M., L. N. Warr, and B. A. van der Pluijm (2006a), Fluid727focusing and back-reactions in the uplifted shoulder of the Rhine rift728system: A clay mineral study along the Schauenburg Fault zone (Heidel-729berg, Germany), Int. J. Earth Sci., 95(1), 19–33, doi:10.1007/s00531-730005-0490-3.731Schleicher, A. M., B. A. van der Pluijm, and L. N. Warr (2006b), Origin732and significance of clay-coated fractures in mudrock fragments of the733SAFOD borehole (Parkfield, California), Geophys. Res. Lett., 33,734L16313, doi:10.1029/2006GL026505.735Schleicher, A. M., L. N. Warr, and B. A. van der Pluijm (2008), Mixed-736layered clay minerals and their geological significance: Samples from the737San Andreas Fault at �2.5–3 km depth (SAFOD at Parkfield, Califor-738nia), Contrib. Mineral. Petrol., 157, 173–187, doi:10.1007/s00410-008-7390328-7.740Schulz, S. E., and J. P. Evans (2000), Mesoscopic structure of the Punch-741bowl Fault, southern California and the geologic and geophysical struc-742ture of active strike-slip faults, J. Struct. Geol., 22, 913 – 930,743doi:10.1016/S0191-8141(00)00019-5.744Sibson, R. H. (1994), Crustal stress, faulting and fluid flow, in Geofluids:745Origin, Migration and Evolution of Fluids in Sedimentary Basins, edited746by J. Parnell, Geol. Soc. Spec. Publ., vol. 78, pp. 69–84.
XXXXXX SCHLEICHER ET AL.: FLUID-ROCK INTERACTION IN THE SAFOD HOLE
11 of 12
XXXXXX
747 Solum, J. G., and B. A. van der Pluijm (2004), Phyllosilicate mineral748 assemblages of the SAFOD Pilot hole and comparisons with an exhumed749 segment of the San Andreas Fault system, Geophys. Res. Lett., 31,750 L15S19, doi:10.1029/2004GL019909.751 Solum, J. G., B. A. van der Pluijm, D. R. Peacor, and L. N. Warr (2003),752 Influence of phyllosilicate mineral assemblages, fabrics, and fluids on the753 behavior of the Punchbowl Fault, southern California, J. Geophys. Res.,754 108(B5), 2233, doi:10.1029/2002JB001858.755 Solum, J. G., S. H. Hickman, D. A. Lockner, D. E. Moore, B. A. van der756 Pluijm, A. M. Schleicher, and J. P. Evans (2006), Mineralogical charac-757 terization of protolith and fault rocks from the SAFOD Main hole, Geo-758 phys. Res. Lett., 33, L21314, doi:10.1029/2006GL027285.759 Thordsen, J. J., W. C. Evans, Y. K. Kharaka, B. M. Kennedy, and M. van760 Soestim (2005), Chemical and isotopic composition of water and gases761 from the SAFOD wells: Implications to the dynamics of the San Andreas762 Fault at Parkfield, CA, Eos Trans. AGU, 86(52), Fall Meet. Suppl.,763 Abstract T23E–08.764 Tobin, H., P. Vannucchi, and M. Meschede (2001), Structure, inferred765 mechanical properties, and implications for fluid transport in the decolle-766 ment zone, Costa Rica, convergent margin, Geology, 29(10), 907–910,767 doi:10.1130/0091-7613(2001)029<0907:SIMPAI>2.0.CO;2.768 Vrolijk, P., and B. A. van der Pluijm (1999), Clay gouge, J. Struct. Geol.,769 21, 1039–1048, doi:10.1016/S0191-8141(99)00103-0.770 Wiersberg, T., and J. Erzinger (2007), A helium isotope cross-section study771 through the San Andreas Fault at seismogenic depths, Geochem. Geo-772 phys. Geosyst., 8(1), Q01002, doi:10.1029/2006GC001388.773 Wiersberg, T., and J. Erzinger (2008), Origin and spatial distribution of gas774 at seismogenic depths of the San Andreas Fault from drill-mud gas ana-
775lysis, Appl. Geochem., 23, 1675 – 1690, doi:10.1016/j.apgeochem.7762008.01.012.777Williams, C. F., M. A. d’Alessio, F. V. Grubb, and S. P. Galanis Jr. (2005),778Heat flow studies in the SAFOD Main hole, Eos Trans. AGU, 86(52),779Fall Meet. Suppl., Abstract T23E–07.780Wu, F. T., L. Blatter, and H. Roberson (1975), Clay gouges in the San781Andreas Fault system and their possible implications, Pure Appl. Geo-782phys., 113, 87–95, doi:10.1007/BF01592901.783Yonkee, W. A., W. T. Parry, and R. L. Bruhn (2003), Relations between784progressive deformation and fluid-rock interaction during shear-zone785growth in a basement-cored thrust sheet, Sevier orogenic belt, Utah,786Am. J. Sci., 303, 1–59, doi:10.2475/ajs.303.1.1.787Zoback, M. D., and S. H. Hickman (2005), Preliminary observations of788stress and fluid pressure in and near the San Andreas Fault at depth in789SAFOD boreholes, Eos Trans. AGU, 86(52), Fall Meet. Suppl., Abstract790T21A–0438.791Zoback, M., S. Hickman, and W. Ellsworth (2005), Drilling, sampling and792measurements in the San Andreas Fault zone at seismogenic depth, Eos793Trans. AGU, 86(52), Fall Meet. Suppl., Abstract T23E–01.
�����������������������795B. A. van der Pluijm, A. M. Schleicher, and S. N. Tourscher, Department796of Geological Sciences, University of Michigan, 1100 N. University797Avenue, Ann Arbor, MI 48109-1005, USA. ([email protected])798L. N. Warr, Institut fur Geographie und Geologie, Universitat Greifswald,799Friedrich-Ludwig-Jahn-Strasse17a, D-17487 Greifswald, Germany.
XXXXXX SCHLEICHER ET AL.: FLUID-ROCK INTERACTION IN THE SAFOD HOLE
12 of 12
XXXXXX