Embed Size (px)
Citation preview

Graduate Theses, Dissertations, and Problem Reports
2004
Constraint-based facilities planning Constraint-based facilities planning
Tafazzul Ahmed Khan West Virginia University
Follow this and additional works at: https://researchrepository.wvu.edu/etd
Recommended Citation Recommended Citation Khan, Tafazzul Ahmed, "Constraint-based facilities planning" (2004). Graduate Theses, Dissertations, and Problem Reports. 1545. https://researchrepository.wvu.edu/etd/1545
This Thesis is protected by copyright and/or related rights. It has been brought to you by the The Research Repository @ WVU with permission from the rights-holder(s). You are free to use this Thesis in any way that is permitted by the copyright and related rights legislation that applies to your use. For other uses you must obtain permission from the rights-holder(s) directly, unless additional rights are indicated by a Creative Commons license in the record and/ or on the work itself. This Thesis has been accepted for inclusion in WVU Graduate Theses, Dissertations, and Problem Reports collection by an authorized administrator of The Research Repository @ WVU. For more information, please contact [email protected].
Constraint Based Facilities Planning
Tafazzul Ahmed Khan
Thesis submitted to the College of Engineering and Mineral Resources
at West Virginia University in partial fulfillment of the requirements
for the degree of
Master of Science in
Industrial Engineering
B. Gopalakrishnan, Ph.D., Chair Ralph Plummer, Ph.D. Robert Creese, Ph.D.
Department of Industrial Engineering
Morgantown, West Virginia 2004
Keywords: Facilities Planning, Facility Layout, Facility Design, Manufacturing Parameters, Layout Effectiveness, M-CRAFT

ABSTRACT
Constraint Based Facilities Planning
Tafazzul Ahmed Khan
In recent years a large variation of production volume for the mass-production products
happens frequently due to the changes in technology and market. Those changes cause
introduction of new products having shorter life cycles, thus enforcing modification and
renewal of production facilities much earlier than their lifetime. A model was built to
assess the impact of manufacturing parameters on the effectiveness of the layout and the
material handling system. A relationship was developed between variations in production
oriented parameters and its impact on the facility size and final cost of the product being
manufactured exclusively in terms of machine time, operator time and material handling
duration. A job shop manufacturing scenario was considered for this analysis and a
“Powerarm” [22] was considered as the product being manufactured. The various
manufacturing parameters involved are considered one at a time and varied keeping the
other parameters constant and their impact on the facility layout effectiveness is
determined.

iii
ACKNOWLEDGEMENTS
I would like to wholeheartedly thank my advisor Dr. B. Gopalakrishnan for his
continued support, guidance and encouragement during the course of this research work.
I also wish to thank Dr. Ralph Plummer and Dr. Robert Creese, my committee members,
for their advice and support. Above all, I wish to thank God, my family for being there
for me always and supporting me and my friends for their constant support and help in all
my endeavors.
iv
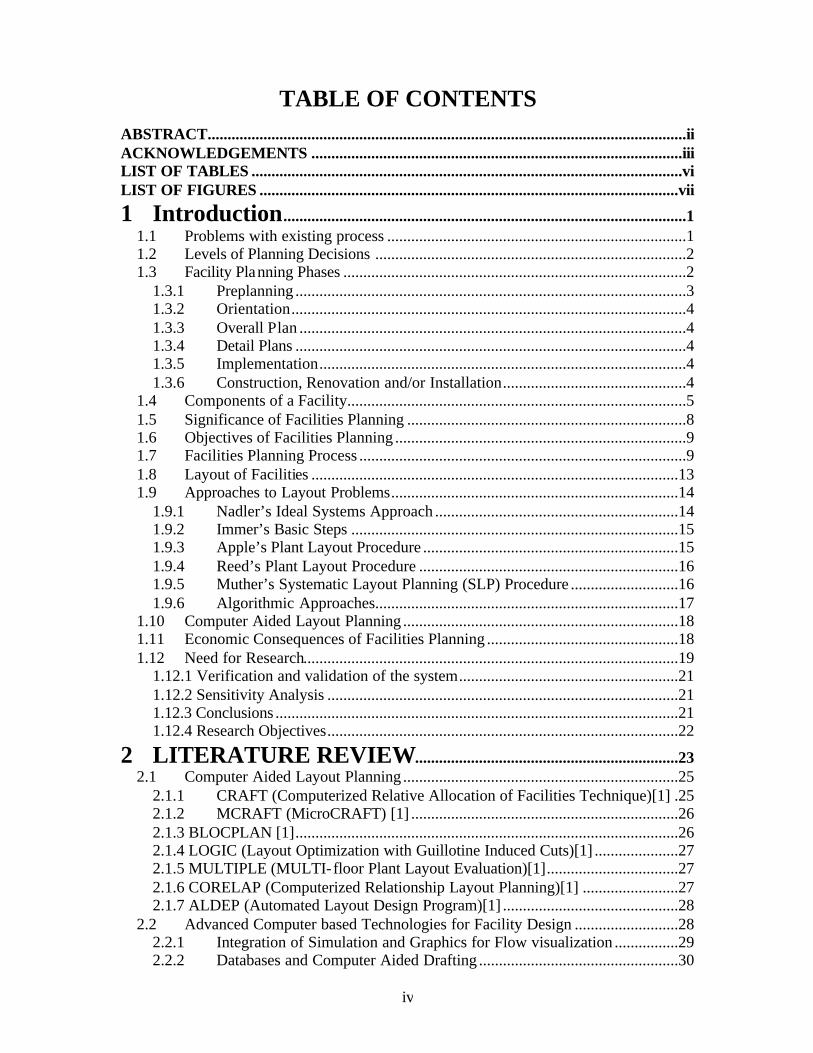
TABLE OF CONTENTS
ABSTRACT........................................................................................................................ii ACKNOWLEDGEMENTS .............................................................................................iii LIST OF TABLES ............................................................................................................vi LIST OF FIGURES .........................................................................................................vii
1 Introduction.....................................................................................................1 1.1 Problems with existing process ...........................................................................1 1.2 Levels of Planning Decisions ..............................................................................2 1.3 Facility Planning Phases ......................................................................................2
1.3.1 Preplanning ..................................................................................................3 1.3.2 Orientation...................................................................................................4 1.3.3 Overall Plan .................................................................................................4 1.3.4 Detail Plans ..................................................................................................4 1.3.5 Implementation............................................................................................4 1.3.6 Construction, Renovation and/or Installation..............................................4
1.4 Components of a Facility.....................................................................................5 1.5 Significance of Facilities Planning ......................................................................8 1.6 Objectives of Facilities Planning .........................................................................9 1.7 Facilities Planning Process ..................................................................................9 1.8 Layout of Facilities ............................................................................................13 1.9 Approaches to Layout Problems........................................................................14
1.9.1 Nadler’s Ideal Systems Approach .............................................................14 1.9.2 Immer’s Basic Steps ..................................................................................15 1.9.3 Apple’s Plant Layout Procedure ................................................................15 1.9.4 Reed’s Plant Layout Procedure .................................................................16 1.9.5 Muther’s Systematic Layout Planning (SLP) Procedure ...........................16 1.9.6 Algorithmic Approaches............................................................................17
1.10 Computer Aided Layout Planning .....................................................................18 1.11 Economic Consequences of Facilities Planning ................................................18 1.12 Need for Research..............................................................................................19
1.12.1 Verification and validation of the system.......................................................21 1.12.2 Sensitivity Analysis ........................................................................................21 1.12.3 Conclusions .....................................................................................................21 1.12.4 Research Objectives........................................................................................22
2 LITERATURE REVIEW..................................................................23 2.1 Computer Aided Layout Planning .....................................................................25
2.1.1 CRAFT (Computerized Relative Allocation of Facilities Technique)[1] .25 2.1.2 MCRAFT (MicroCRAFT) [1] ...................................................................26 2.1.3 BLOCPLAN [1]................................................................................................26 2.1.4 LOGIC (Layout Optimization with Guillotine Induced Cuts)[1] .....................27 2.1.5 MULTIPLE (MULTI-floor Plant Layout Evaluation)[1].................................27 2.1.6 CORELAP (Computerized Relationship Layout Planning)[1] ........................27 2.1.7 ALDEP (Automated Layout Design Program)[1] ............................................28
2.2 Advanced Computer based Technologies for Facility Design ..........................28 2.2.1 Integration of Simulation and Graphics for Flow visualization ................29 2.2.2 Databases and Computer Aided Drafting ..................................................30
v
2.2.3 Artificial Intelligence in Facility Design ...................................................30 2.3 Conclusion.........................................................................................................34
3 RESEARCH APPROACH ...............................................................35 3.1 Collection of Data ..............................................................................................35 3.2 Procedure ...........................................................................................................36
3.2.1 Scrap Rate ..................................................................................................36 3.2.2 Equipment Fractions ..................................................................................37 3.2.3 Employee Requirements ............................................................................38 3.2.4 Parts of the Powerarm................................................................................40 3.2.5 Operations on Powerarm [22]....................................................................40 3.2.6 Parameters considered ...............................................................................42
3.3 Operations Process Chart for the Powerarm [22] ..............................................44 3.4 Analysis .............................................................................................................45
3.4.1 Assumptions ..............................................................................................45 3.4.2 Effect of Scrap Rate ...................................................................................49 3.4.3 Effect of Reliability of Machines ..............................................................50 3.4.4 Effect of Availability of Machines ............................................................51 3.4.5 Effect of Loading and Unloading Time .....................................................52
3.5 Evaluation of Model in M-CRAFT ...................................................................53 3.5.1 Procedure ...................................................................................................53 3.5.2 M-CRAFT Analysis with Scrap Rate ........................................................55 3.5.3 M-CRAFT Analysis with Reliability of Machines....................................56 3.5.4 M-CRAFT Analysis with Availability of Machines .................................57
3.6 Sensitivity Analysis ...........................................................................................58 3.6.1 Sensitivity Analysis with Scrap rate ..........................................................58 3.6.2 Sensitivity Analysis with Reliability of Machines ....................................62 3.6.3 Sensitivity Analysis with Availability of Machines ..................................65 3.6.4 Sensitivity Analysis with Loading/Unloading Time .................................67 3.6.5 Sensitivity Analysis with M-CRAFT Results............................................70
3.7 Chapter Conclusion ...........................................................................................73
4 Conclusion and Future Work ........................................................74 4.1 Conclusion.........................................................................................................74 4.2 Scope for Future Work ......................................................................................75
Bibliography .....................................................................................................................76 Appendix...........................................................................................................................78
A1. MCRAFT Results after Scrap Rate was reduced by 50%......................................87 A2. MCRAFT Results after Scrap Rate was increased by 50%....................................88 A3. M-CRAFT Results after Reliability of Machines was reduced by 25%.................89 A4. M-CRAFT Results after Availability of Machines was reduced by 25% ..............90
vi
LIST OF TABLES
Table 1.1Percentage of the Gross National Product (GNP) typically expended on New
Facilities between 1955 and Today(2003) by Industry Grouping [1] .........................8 Table 2.1 Development of computer aided facility design methods .................................29 Table 3.1 Manufacturing Times for individual machines .................................................42 Table 3.2 Scrap rates of different operations .....................................................................43 Table 3.3 Loading and Unloading times for different machine operations .......................43 Table 3.4 Other parameters for machines ..........................................................................44 Table 3.5 Calculation of Total Space ................................................................................48 Table 3.6 Effect of Scrap Rate...........................................................................................49 Table 3.7 Effect of Reliability of Machines ......................................................................50 Table 3.8 Effect of Availability of Machines ....................................................................51 Table 3.9 Effect of Loading and Unloading time ..............................................................52 Table 3.10 M-CRAFT Results on Change of Scrap Rate..................................................56 Table 3.11 M-CRAFT Results on Reliability Values of Machines ...................................56 Table 3.12 M-CRAFT Analysis with Availability of Machines .......................................57 Table 0.1Model Excel Spreadsheet ...................................................................................79 Table 0.2 Space Allocation for different machines ...........................................................79 Table 0.3 Individual Department Calculations ..................................................................80

vii
LIST OF FIGURES
Figure 1.1 Facilities planning defined by Richard Muther, Copyright 1979.......................3 Figure 1.2Existing Facilities planning hierarchy [1] ...........................................................6 Figure 1.3 Proposed Facilities planning hierarchy ..............................................................7 Figure 1.4 Continuous improvement facilities planning cycle [1] ....................................10 Figure 1.5 Winning facilities planning process. Source Tompkins [1] .............................12 Figure 1.6 Ideal systems hierarchy [4] ..............................................................................14 Figure 1.7 Systematic layout planning (SLP) procedure [1] .............................................17 Figure 1.8Example of a manufacturing process ................................................................20 Figure 2.1Dynamic facility layout methodology [6] .........................................................24 Figure 2.2 Facility management life cycle [5] ...................................................................32 Figure 3.1 Operations Process Chart for the Powerarm....................................................45 Figure 3.2 Initial input sequence in M-CRAFT.................................................................54 Figure 3.3 Final Layout obtained in M-CRAFT................................................................54 Figure 3.4 Number of Machines Vs % Change in Scrap Rate ..........................................58 Figure 3.5 Number of Operators Vs % Change in Scrap Rate ..........................................59 Figure 3.6 Area of the Facility Vs % Change in Scrap Rate .............................................60 Figure 3.7 Machine and Operator Activity Cost Vs % Change in Scrap Rate ..................61 Figure 3.8 Number of Machines Vs % Change in Reliability of Machines ......................62 Figure 3.9 Number of Operators Vs % Change in Reliability of Machines ......................63 Figure 3.10 Area of the Facility Vs % Change in Reliability of Machines .......................63 Figure 3.11Cost of the Product Vs % Change in the Reliability of Machines ..................64 Figure 3.12 Number of Machines Vs % Change in Availability of Machines..................65 Figure 3.13Number of Operators Vs % Change in Availability of Machines...................65 Figure 3.14 Area of the Facility Vs% Change in Availability of Machine .......................66 Figure 3.15 Cost of the Product Vs % Change in Availability of Machines .....................67 Figure 3.16 Area Vs % Change in Loading/Unloading Time of Machines ......................68 Figure 3.17Number of Machines Vs% Change in Loading/Unloading Time ...................68 Figure 3.18 Loading/Unloading time Vs Number of Operators ........................................69 Figure 3.19 Cost of Product Vs % Change in Loading/Unloading Time ..........................70 Figure 3.20 Material Handling Costs ($) by M-CRAFT Vs % Change in Scrap Rate......71 Figure 3.21 Material Handling Costs ($) by M-CRAFT Vs % Change in Reliability
Values of Machines ...................................................................................................71 Figure 3.22 Material Handling Costs ($) by M-CRAFT Vs % Change in Availability of
Machines ....................................................................................................................72 Figure 0.1 M-CRAFT Input Screen 1 ................................................................................81 Figure 0.2 M-CRAFT Input Screen 2 ................................................................................81 Figure 0.3 M-CRAFT Input Screen 3 ................................................................................82 Figure 0.4 M-CRAFT Input Screen 4 ................................................................................82 Figure 0.5 M-CRAFT Input Screen 5 ................................................................................83 Figure 0.6 M-CRAFT Input Screen 6 ................................................................................83 Figure 0.7 M-CRAFT Input Screen 7 ................................................................................84 Figure 0.8 M-CRAFT Input Screen 8 ................................................................................84 Figure 0.9 M-CRAFT Input Screen 9 ................................................................................85
viii
Figure 0.10 M-CRAFT Input Screen 10 ............................................................................85 Figure 0.11 M-CRAFT Output Screen 1 ...........................................................................86 Figure 0.12 M-CRAFT Output Screen 2 ...........................................................................86 Figure 0.13 M-CRAFT Output Screen 3 ...........................................................................87 Figure 0.14 M-CRAFT Output Screen 1 when Scrap Rate was reduced by 50%.............87 Figure 0.15 M-CRAFT Output Screen 2 when Scrap Rate was reduced by 50%.............88 Figure 0.16 M-CRAFT Output Screen 1 when Scrap Rate was increased by 50% ..........88 Figure 0.17 M-CRAFT Output Screen 2 when Scrap Rate was increased by 50% ..........89 Figure 0.18 M-CRAFT Output Screen 1 when Reliability of Machines was reduced by
25%............................................................................................................................89 Figure 0.19 M-CRAFT Output Screen 2 when Reliability of Machines was reduced by
25%............................................................................................................................90 Figure 0.20 M-CRAFT Output Screen 1 when Availability of Machines was reduced by
25%............................................................................................................................90 Figure 0.21 M-CRAFT Output Screen 2 when Availability of Machines was reduced by
25%............................................................................................................................91

1
1 Introduction Facilities planning is a complex and broad subject spanning a wide range of disciplines
such as engineering, real estate, insurance, ergonomics, architecture, law and
management. Infact, the actual breadth of information needed to successfully carry out a
major facilities planning and design project would require the expertise of not one but
many experts in a host of disparate fields. For example, within the engineering
profession, civil, electrical, industrial and mechanical engineers are all involved with
facility planning. Also involved are architects, consultants, general contractors, managers,
real estate brokers and urban planners. Hence it is very difficult to address it from a
single viewpoint as so many entities are involved. Also, the design of facilities has
become relevant to business success.
Facilities planning determines how an activity’s tangible fixed assets best support
achieving the activity’s objective [1]. For a manufacturing firm, facilities planning
involves the determination of how the manufacturing facility best supports production. In
the case of an airport, facilities planning involves how the airport facility is to support the
passenger-airplane interface. Similarly, facilities planning for a hospital determines how
the hospital facility supports providing medical care to its patients.
1.1 Problems with existing process Before looking at the various aspects of facilities planning and design, I looked at some
of the questions which when answered would give us better results. Some of the
questions which need to be answered are:
• What happens if people are not sensitive to the manufacturing operations in the
facility being designed?
• What would happen if the layout is designed first and then the equipment placed
in it?
• What is the impact on the facility layout if there is a change in any of the
parameters involved in the manufacturing process?
2
It is very important to look into the answers for the above questions before planning any
facility. Any facility which is constructed is for the particular product that is to be
manufactured in it and also for the equipment which is used in its manufacture. Hence,
details of the processes required for the manufacture and the equipment needed, the space
requirements and their location is important at the facility planning stage. It is difficult
and expensive to install the processes and equipment after the facility is designed without
considering the above parameters. It would be very difficult to identify the key
parameters which are important and whose variation might bring about changes in the
facility layout. It is always desired that a new facility be designed in such a way that it
can incorporate any small changes or modifications required in future. In order to design
such a facility, it is important to have knowledge of the manufacturing processes, the
equipment required, their location or orientation inside the facility and the effects of the
parameter changes on the facility layout.
1.2 Levels of Planning Decisions
Facilities planning and design decisions are made at different levels. The highest
decision level is capacity planning that provides enough productive capacity of all kinds
to meet the requirement of the organization. This might be related to specific conditions
and quantities of floor space, land, building and equipment. The next level is location, the
geographic placement of capacity. At this level, site planning decisions are made that are
followed by building decisions where the interior and exterior structure is designed. The
next level is the department level where the decisions are taken with concerned groups of
people and equipment and their day to day activities. Once this level is set, the planner
considers workplace design. Then, plans are made to implement these decisions. It is not
necessary that these levels need to occur in a sequence. In a practical environment, these
levels overlap. It is always desirable to proceed in rigorous top-down order. The
decisions made at any level must be compatible with those at other levels.
1.3 Facility Planning Phases
After considering the levels of facilities planning, it is important to analyze the different
phases involved in facilities planning. Every planning project involves a move from the
3
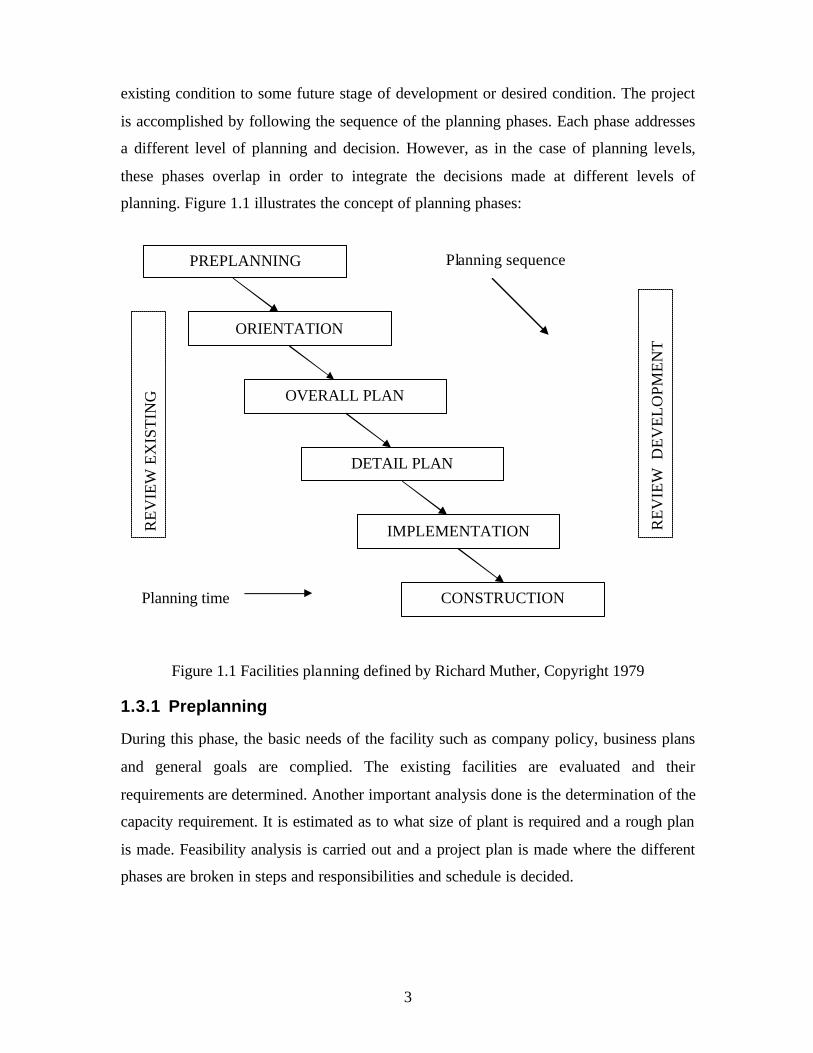
existing condition to some future stage of development or desired condition. The project
is accomplished by following the sequence of the planning phases. Each phase addresses
a different level of planning and decision. However, as in the case of planning levels,
these phases overlap in order to integrate the decisions made at different levels of
planning. Figure 1.1 illustrates the concept of planning phases:
Figure 1.1 Facilities planning defined by Richard Muther, Copyright 1979
1.3.1 Preplanning
During this phase, the basic needs of the facility such as company policy, business plans
and general goals are complied. The existing facilities are evaluated and their
requirements are determined. Another important analysis done is the determination of the
capacity requirement. It is estimated as to what size of plant is required and a rough plan
is made. Feasibility analysis is carried out and a project plan is made where the different
phases are broken in steps and responsibilities and schedule is decided.
PREPLANNING
ORIENTATION
OVERALL PLAN
DETAIL PLAN
IMPLEMENTATION
CONSTRUCTION
Planning sequence
Planning time
RE
VIE
W E
XIS
TIN
G
RE
VIE
W D
EV
EL
OPM
EN
T

4
1.3.2 Orientation
In this phase, the non-facility objectives and existing conditions are converted to physical
facility requirements. The site location, the current facilities in the site or the department
in the plant are evaluated. Also considered are the external opportunities available and the
constraints if there are any.
1.3.3 Overall Plan
During this phase, the physical requirements are converted into an overall plan of the
facility. The overall block layout, handling plan, basic communications plan, primary
utilities distribution plan and preliminary building plans are developed. In general, in this
phase, the actual solution is determined in order to reach the objective.
1.3.4 Detail Plans
In this phase, the physical requirements and constraints identified in the earlier phase are
further subdivided into areas and components so that a more detailed plan of the facilities
is obtained. The detailed machinery and equipment layouts, detailed handling plans,
detailed communication plans, secondary utilities distribution plans and the detailed
building documents are developed. The major features of the different components and
areas are studied and the solutions are developed.
1.3.5 Implementation
This is the phase in which the evaluated plans and strategies are streamlined and an
action plan is made for the construction, renovation and installation. Preparation of
installation documents, handling equipment procurement, and training is done.
1.3.6 Construction, Renovation and/or Installation
This phase involves the actual implementation of the plans made in the earlier phases. It
involves follow-up of the planning process and monitoring of the implementation of the
above made plans. Communications equipment installation, utilities installation and
building construction and rehabilitation is done in this phase.
5
1.4 Components of a Facility
There are five components in any facility must be discussed in order to organize the
planning approach. They are:
1. Layout: This is the arrangement of activities, features and spaces around the
relationships that exist between them.
2. Handling: This component deals with evaluating the methods to move products,
materials, people and equipment between the various points in the facility.
Material handling is the art of moving, storing, protecting and controlling
material. This is a means by which manufacturing quality is improved by
reducing inventory and damage through improved handling practices.
3. Communication: This is the means of transmitting information between various
points in the facility. It is very important to have a good communication system in
place for the successful transfer of information from different stages of the
manufacturing process thereby reducing the defects in products and improving the
quality.
4. Utilities: This is one of the most important components in any type of facility
being planned. Every facility needs to have the resources for generation and
distribution of substances like water, waste, gas, air and power, though the
importance of each of these may vary depending upon the type of facility.
5. Building: Finally, in order to incorporate all the components mentioned above, we
need to have a building or structure. The form, type of material used for
construction and the design depends on the requirement of the components which
constitute it and also based on the product being manufactured.
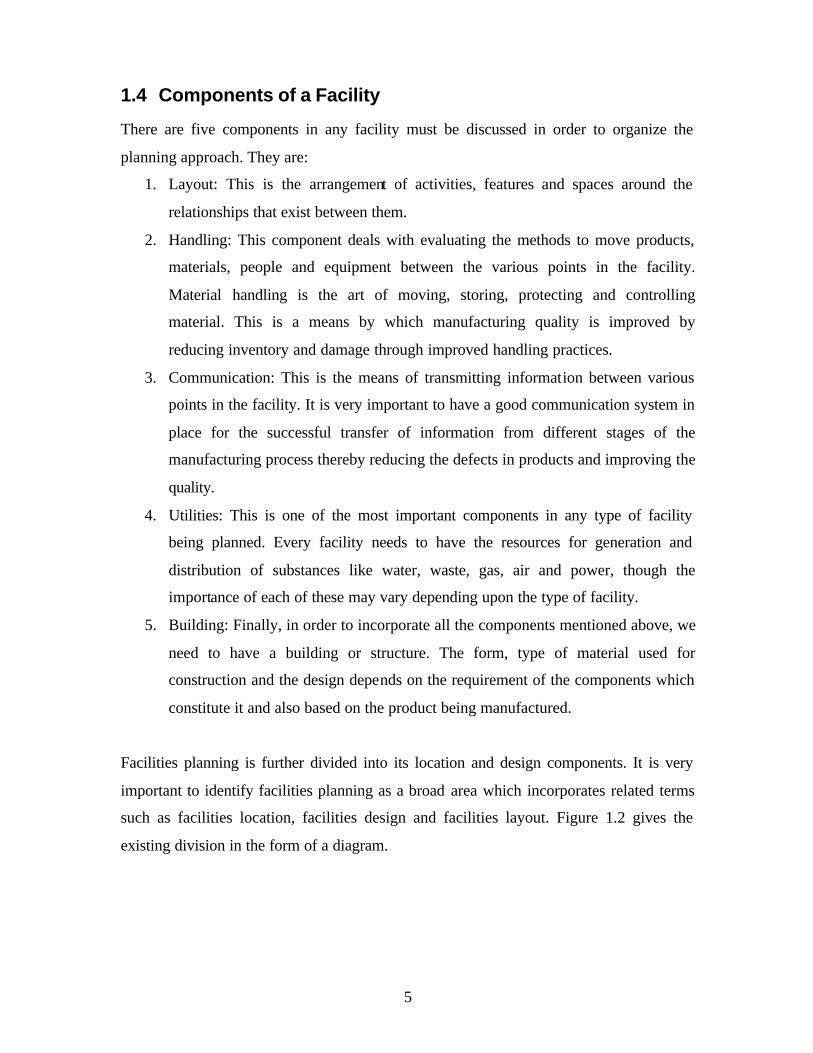
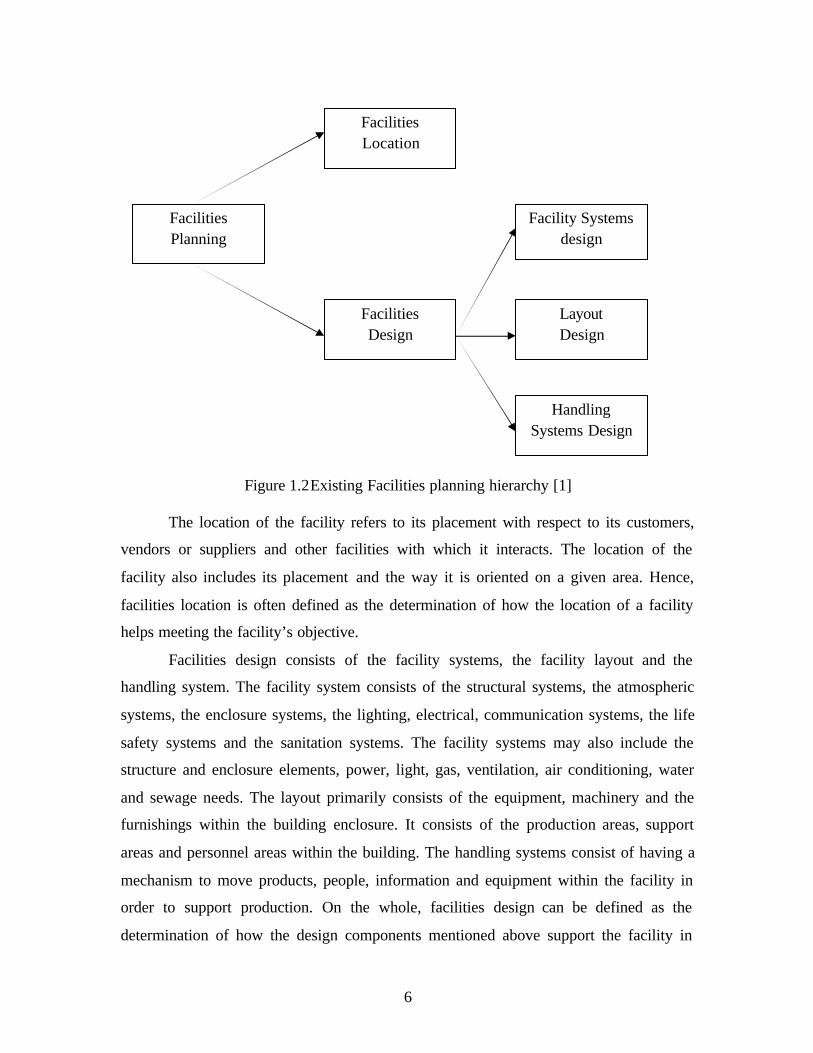
Facilities planning is further divided into its location and design components. It is very
important to identify facilities planning as a broad area which incorporates related terms
such as facilities location, facilities design and facilities layout. Figure 1.2 gives the
existing division in the form of a diagram.
6
Figure 1.2Existing Facilities planning hierarchy [1]
The location of the facility refers to its placement with respect to its customers,
vendors or suppliers and other facilities with which it interacts. The location of the
facility also includes its placement and the way it is oriented on a given area. Hence,
facilities location is often defined as the determination of how the location of a facility
helps meeting the facility’s objective.
Facilities design consists of the facility systems, the facility layout and the
handling system. The facility system consists of the structural systems, the atmospheric
systems, the enclosure systems, the lighting, electrical, communication systems, the life
safety systems and the sanitation systems. The facility systems may also include the
structure and enclosure elements, power, light, gas, ventilation, air conditioning, water
and sewage needs. The layout primarily consists of the equipment, machinery and the
furnishings within the building enclosure. It consists of the production areas, support
areas and personnel areas within the building. The handling systems consist of having a
mechanism to move products, people, information and equipment within the facility in
order to support production. On the whole, facilities design can be defined as the
determination of how the design components mentioned above support the facility in
Facilities Planning
Facilities Design
Facilities Location
Handling Systems Design
Layout Design
Facility Systems design

7
meeting its objectives. Facilities location addresses the macro or major issues of facility
planning and facilities design addresses the micro or finer elements of facility planning.
Figure 1.3 Proposed Facilities planning hierarchy
Figure 1.3 shows the proposed facilities planning hierarchy. The focus of the research
starts from the facility design stage, the input for which comes from facility planning and
location. A user interface is proposed which provides the user with the information about
the facility systems design, layout design and the handling systems design. Information is
also provided about the manufacturing parameters. Thus any changes in the
manufacturing parameters resulting in changes in facility layout are reflected in the
facility design. This approach helps in determining the manufacturing parameters which
are important and the effect of their changes on the facility systems, layout and material
handling system. It also helps the user to establish the important parameters which have
the largest impact on the facility.
Facilities Planning
Facilities Design
Facilities Location
Handling Systems Design
Layout Design
Facility Systems design
Manufacturing Parameters
User
Change

8
1.5 Significance of Facilities Planning
According to the U.S. Bureau of Census, since 1955, approximately 8% of the Gross
National Product (GNP) has been spent annually on new facilities in the United States.
Table 1.1 indicates the typical expenditures on facilities planning in percentage of GNP,
for major industry groupings.
Industry GNP Percentage Manufacturing 3.2
Mining 0.2
Railroad 0.2
Air and other transportation 0.3
Public utilities 1.6
Communication 1.0
Commercial and other 1.5
All industry 8.0
Source: US Bureau of Census
Table 1.1Percentage of the Gross National Product (GNP) typically expended on New Facilities between 1955 and Today(2003) by Industry Grouping [1]
The size of investment in the new facilities and modifications in the existing facilities
make study of facilities planning important. The manufacturing industry spent the
maximum amount of money on facility redesigning because of frequent changes in
product demand and changes in process designs. This process design changes resulted in
changes in facility design resulting in higher costs to manage the facilities. It is estimated
that approximately 250 billion will be spent annually in the United States alone on
facilities that require planning or replanning[1]. Since the cost involved is very high,
more emphasis is being paid to make the design more adaptive in order to accommodate
changes and additions in the layout when required. Though, the scope of facilities
planning is indicated by the annual dollar volume, it does not appear that adequate
planning is being performed.
9
1.6 Objectives of Facilities Planning
The objective of facilities planning is to plan a facility that achieves the desired facilities
location and incorporates the necessary facilities design. Dividing facilities planning into
location and design, it is more appropriate to define objectives of these functions
individually. The objective of facilities location can be defined as “to determine the
location which, in consideration of all factors affecting deliver-to-customers cost of the
product(s) to be manufactured, will afford the enterprise the greatest advantage to be
obtained by virtue of location”[1]. This objective is applied not only to the products that
are manufactured, but also to the services that are offered.
Similarly, some of the objectives of facilities design can be listed as follows.
1. Support the organization’s vision by improving material handling, control and
ensuring better housekeeping
2. Utilize the resources such as people, equipment, space and energy effectively to
reduce defects and improve final quality of the product or service being offered.
3. Reduce the amount of capital investment required.
4. Be adaptable to changes if required in the future thereby promoting ease of
maintenance.
5. Provide an environment which is safe for the employees working there thereby
creating job satisfaction.
Facilities design is easily the most important aspect of facilities planning. Since there are
many objectives involved in facilities design, careful evaluation of each of them is
required based on the requirement.
1.7 Facilities Planning Process
The concept of facilities planning is always termed as a facility life cycle as it is
frequently replanned or modified in order to meet the objectives of the organization,
though it is planned only once. Modern manufacturing and service are characterized by
the necessity to rapidly adapt to changes in the product quantity, design or mix resulting
in modification of production facilities and processes. Such changes may develop from
different resources. This process continues until the facility is completely redesigned to
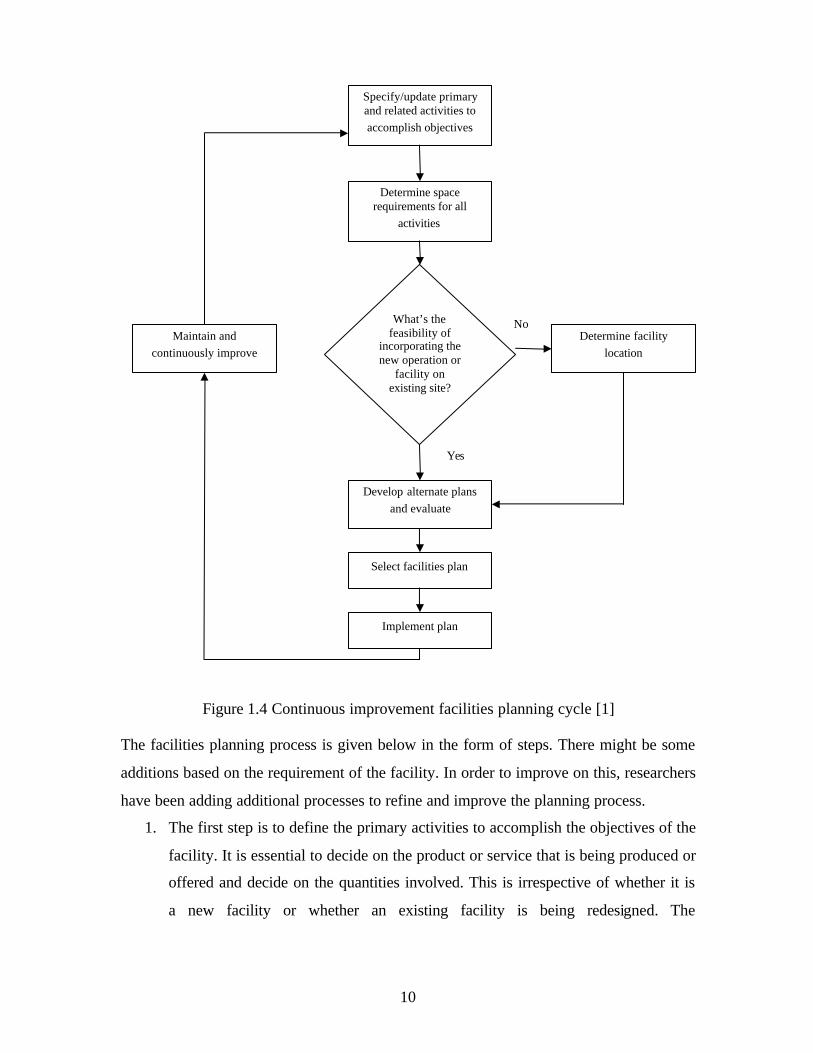
meet its objectives. Figure 1.4 shows the facilities planning cycle which shows the link
between facilities planning and facilities replanning process.
10
Figure 1.4 Continuous improvement facilities planning cycle [1]
The facilities planning process is given below in the form of steps. There might be some
additions based on the requirement of the facility. In order to improve on this, researchers
have been adding additional processes to refine and improve the planning process.
1. The first step is to define the primary activities to accomplish the objectives of the
facility. It is essential to decide on the product or service that is being produced or
offered and decide on the quantities involved. This is irrespective of whether it is
a new facility or whether an existing facility is being redesigned. The
Specify/update primary and related activities to accomplish objectives
Determine space requirements for all
activities
Develop alternate plans and evaluate
Select facilities plan
Implement plan
Determine facility location
Maintain and continuously improve
What’s the feasibility of
incorporating the new operation or
facility on existing site?
Yes
No
11
identification of the volume and the type of activity involved makes the planning
process simple and makes it easier to work towards achieving the objectives.
2. The second step is to identify and specify the primary and secondary activities
that need to be performed in order to meet the desired objectives of the facility.
They can be the defined in terms of the operations that need to be performed and
the equipment, personnel and material flow involved.
3. The next step is to determine the relationships between the different activities that
are present. It is important to define both qualitative and quantitative relationships
and know how these activities interact or support one another within the facility.
4. The next step is to determine the space required for all the activities which need to
be carried out within the facility. The requirements of all the equipment, material
and personnel needs to be considered before calculating the space requirements.
5. The next step is to generate alternate facilities plans which would include
alternative facilities location and facilities designs which in turn would contain
alternate layout, structural and material handling designs. Depending on the type
of situation and requirement, the decision on facility location and design is made.
6. Once the alternative facilities plans are made, they are evaluated and are ranked.
They are evaluated by checking the subjective factors in each plan and how they
affect the facility or its operation.
7. After the evaluation of the plans, the goal in this step is to determine the plan
which is the most suited to achieve the goals and objectives of the company. Cost
is one of the major factors for evaluation, though it might be not be the only basis
for selection.
8. Once the plan is selected, the next step is to implement the plan. A lot of planning
and effort goes into the actual construction. This phase involves coordinating the
actual construction, installation of the layout, actually starting up, running and
debugging.
9. In this step, the facilities plan is maintained and adapted for future changes. The
rate at which modern markets demand new products puts an ever increasing
demand on the manufacturing facilities. Hence, any new requirements demanding
change in facilities plan need to be accommodated thereby reflecting any energy
12
saving measures or improved material handling equipment that are available.
These changes may also result in changes in the actual facilities plan.
10. As the changes are incorporated in the facility plan, the objectives of the facility
change which need to be considered and redefined. We need to determine
products that need to be produced or the services that need to be provided in
specific quantifiable terms. If there are any potential costs or energy savings
available, they need to be considered and integrated in the layout plan.
As mentioned earlier, in order to achieve the desired objectives of a facility, the above
mentioned facilities planning approach has been modified and some more activities
added in order to present a clearer understanding of the planning process. One of these
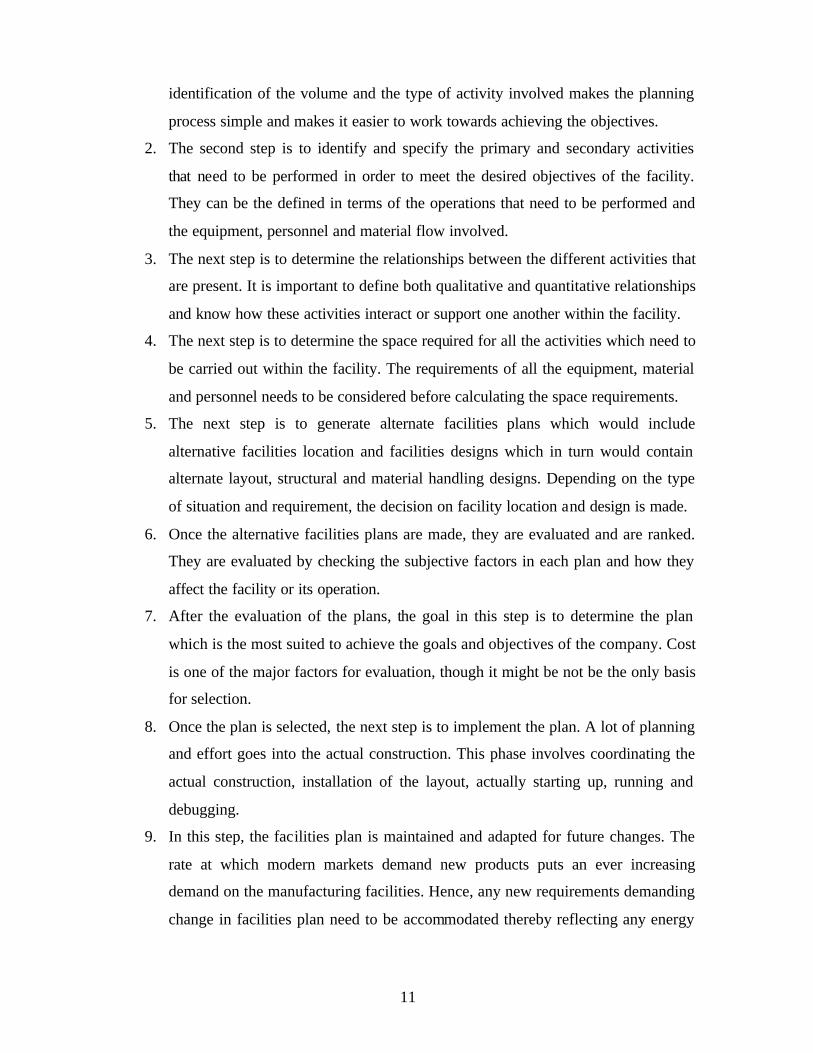
contemporary approaches, called the winning facilities process is shown in Figure 1.5.
Figure 1.5 Winning facilities planning process. Source Tompkins [1]
Figure 1.5 depicts a systematic procedure of arriving at a winning facilities layout. The
first step starts with identifying the organizational model and objectives for success.
Then, the next steps involve establishing the different facilities planning design criteria
and obtaining the organization’s commitment to support these plans. Teams are
established and the specific goals for each of these teams are developed and alternative
approaches are identified to accomplish these specific goals. The different approaches are
evaluated for their feasibility and improvement plans are suggested to these approaches.
Understand external issues
1B
Establish Teams
4
Understand internal issues
1C
Obtain support for improvement
plans 10
Access present status
5
Identify specific goals
6
Identify alternative approaches
7
Evaluate alternative approaches
8
Define improvement
plans 9
Understand Organization
model of success 1A
Implement plans
11
Audit results
12
Obtain organization’s commitment
3
Establish facilities planning
design criteria 2

13
Necessary support is obtained to improve these different improvement plans and the best
facilities design plan is implemented. The results are audited and recorded for future
analysis.
1.8 Layout of Facilities
Once the production process has been identified and defined, it is necessary to lay out the
facility in such a way that the production activities are performed with minimum cost and
time. This physical definition of the layout is important as this would decide on the final
shape and size of the facility. Layouts are classified into four basic types: process layout,
product layout, fixed position layout and group layout. Based on the requirements of the
manufacturing process and the product being manufactured, the most appropriate layout
type is selected. Process layouts are designed by keeping the process being performed in
mind. This type of layout is generally used in facilities where a number of different types
of products are manufactured in batches. Since the quantities involved for the different
types are generally small, the layouts are divided into segments based on the type of
operation being carried out. Product layout is used where the same type of product or
product groups are manufactured in large quantities. Here, the product and not the
process is important and hence the focus in more on the product being manufactured. The
layout is based on the production sequence of the product being manufactured in the
production line. Fixed Position layout is used when the product being manufactured is
large and cannot be moved. Hence the workstations are brought to the product rather than
the product going to the different workstations. The production of ships, airplanes and
railroad stock are examples of fixed position layouts. A group layout is used when
production volumes for individual products are not enough to justify product layouts, but
on grouping these similar products, a product family is formed for which a layout can be
justified. Products can be grouped into product families based on similar processing,
design, material composition, tooling requirement and so on. This grouping of processes
is called cells and hence group layout is sometimes called as cellular layout. The group
layout has high intradepartmental flow and less interdepartmental flow. Group layout is
sometimes also called as product family layout.
14
1.9 Approaches to Layout Problems
The type of layout depends on the type of product being manufactured. The more
complicated the product being made is, the more complicated the layout of the facility.
Sometimes, even a simple production process may create problems because of some
design feature of the product. Hence deciding on a layout which is simple and efficient is
not an easy task. A number of procedures have been developed to facilitate the design of
plant layouts. These procedures can be basically classified into two main types:
Construction type layout methods which basically deal with developing the layout from
scratch and improvement type layout methods which deal with generating alternative
layouts to the existing layout. We start our discussion by considering the approaches to
new layouts.
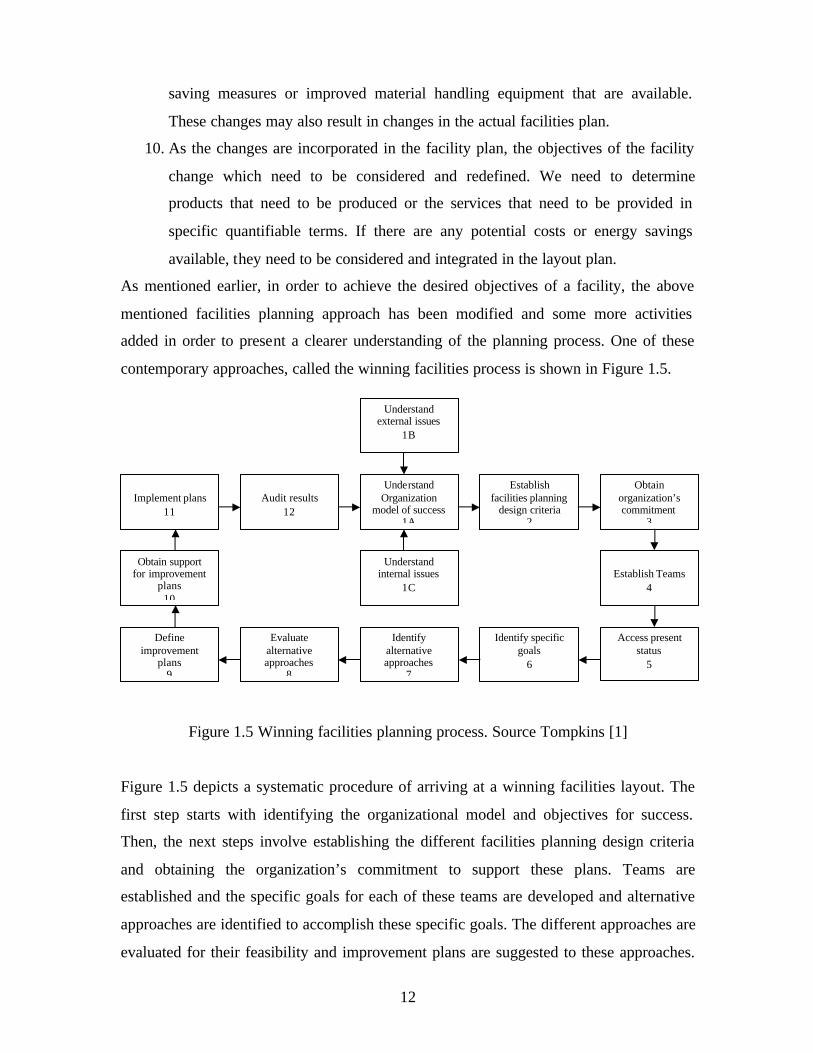
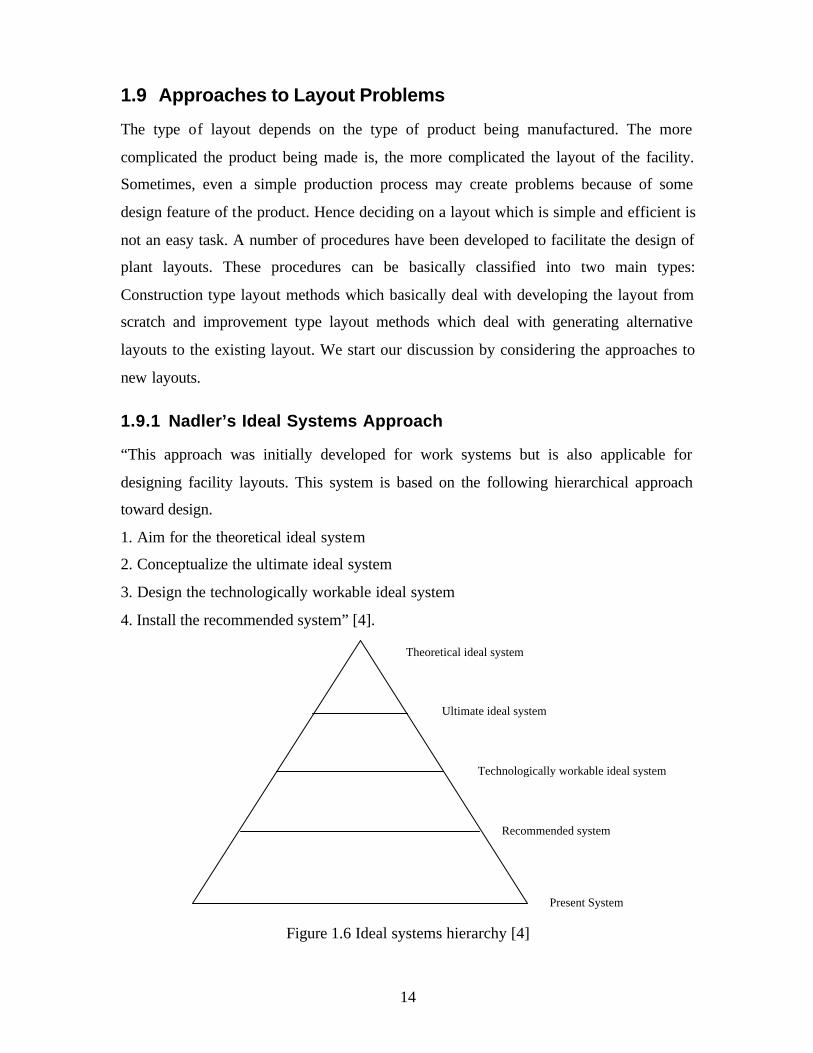
1.9.1 Nadler’s Ideal Systems Approach
“This approach was initially developed for work systems but is also applicable for
designing facility layouts. This system is based on the following hierarchical approach
toward design.
1. Aim for the theoretical ideal system
2. Conceptualize the ultimate ideal system
3. Design the technologically workable ideal system
4. Install the recommended system” [4].
Figure 1.6 Ideal systems hierarchy [4]
Ultimate ideal system
Technologically workable ideal system
Recommended system
Present System
Theoretical ideal system
15
1.9.2 Immer’s Basic Steps
According to Immer, the analysis of a layout problem should have three basic steps
which can be applied to any type of layout problem. These steps are
1. Put the problem on paper
2. Show lines of flow
3. Convert flow lines to machine lines
1.9.3 Apple’s Plant Layout Procedure
“Apple proposed the following detailed sequence of steps in producing a plant layout.
1. Procure the basic data.
2. Analyze the basic data.
3. Design the productive process.
4. Plan the material flow pattern.
5. Consider the general material handling plan.
6. Calculate the equipment requirements.
7. Plan individual workstations.
8. Select specific material handling equipment.
9. Coordinate groups of related operations.
10. Design activity relationships.
11. Determine storage requirements.
12. Plan service and auxiliary activities.
13. Determine space requirements.
14. Allocate activities to total space.
15. Consider building types.
16. Construct master layout.
17. Evaluate, adjust and check the layout with the appropriate persons.
18. Obtain approvals.
19. Install the layout.
20. Follow up on implementation of the layout”[4].
16
1.9.4 Reed’s Plant Layout Procedure
“In the planning and preparation of the layout, Reed recommended the following steps to
be taken in his systematic plan of attack.
1. Analyze the product or products to be produced.
2. Determine the process required to manufacture the product.
3. Prepare layout planning charts.
4. Determine workstations.
5. Analyze storage area requirements.
6. Establish minimum aisle widths.
7. Establish office requirements.
8. Consider personnel facilities and services.
9. Survey plant services.
10. Provide for future expansion”[4].
1.9.5 Muther’s Systematic Layout Planning (SLP) Procedure
The systematic layout planning approach developed by Muther is one of the most popular
approaches for designing plant layouts and has been applied to production, transportation,
storage, supporting services and office activities among others. Once the necessary
information is available, a flow analysis can be merged with the activity analysis to
develop the relationship between the two. This relationship is shown using the
relationship chart which measures flows qualitatively between departments using the
closeness relationship values developed by Muther.
The SLP Procedure is shown in Figure 1.7 below.

17
Figure 1.7 Systematic layout planning (SLP) procedure [1]
1.9.6 Algorithmic Approaches
These are some of the most extensively used layout procedures which find considerable
application in the modern day facilities. Significant research has been done in this area
and new and improved algorithms are available now for different types of layout
problems. The relative placement of the departments based on their closeness ratings or
Input data and activities
1. Flow of materials 2. Activity Relationships
3. Relationship diagram
4. Space requirements
5. Space available
10. Evaluation
9. Develop layout alternatives
8. Practical limitations
7. Modifying considerations
6. Space relationship
diagram
Ana
lysi
s Se
arch
Se
lect
ion

18
their material flow intensities is one that can be reduced to an algorithmic process. There
are three main types of algorithmic layout approaches
1. Relationship Diagramming which is a variation of SLP
2. Pairwise Exchange Method based on the Travel Chart Method
3. The Graph Based Construction Method based on Graph Theory
1.10 Computer Aided Layout Planning
The facilities planning process has been simplified to a large extent with the advent of
computers and the availability of user friendly and effective computer assisted design and
manufacturing programs. The layout can now be easily constructed, evaluated and
discarded till the most effective layout is obtained. Though computers cannot replace
human judgment and experience, they significantly enhance the productivity of the layout
planner and quality of the solution by evaluating large number of alternatives in a short
duration. Some of the important and commonly used computerized layout algorithms are
CRAFT, M-CRAFT, BLOCPLAN, LOGIC, MULTIPLE, CORELAP and ALDEP. They
are discussed in detail in the literature review chapter. M-CRAFT is being used in the
research for validation of the model as this is the new version of CRAFT, which is one of
the earliest layout algorithms and also one of the best algorithms to arrive at the best
possible layout with the lowest material handling costs. It performs all possible two or
three way exchanges and arrives at a layout with the lowest cost.
1.11 Economic Consequences of Facilities Planning
“Facilities decisions can have a direct and lasting impact on financial resources and
operating efficiency. An expensive plan or design will consume extra cash or incur extra
debt during construction”[2]. The facility manager needs to have the ability and skill to
justify projects economically as companies set requirements for funds more than what is
required every year. An inefficient plan can consume cash and resources over its entire
lifespan if not considered in detail. Thus, there are two basic approaches which are
considered to quantify the economic benefits for projects. One approach sets a
benchmark (ex. Benefit-cost ratio = 3.5), where anything above this is accepted and
anything below rejected. The other approach is to rank these projects (ex. ranking based
on internal rate of return) up to the funds available are accepted and the others rejected.

19
The facilities managers should have knowledge of the working of these tools and also be
aware of their benefits and limitations.
Cost justification is very important for any project being considered. This helps in
identifying the project which has the highest potential for reward, projects that limits or
reduces financial risk and also in prioritizing the projects competing for limited
resources. It turns out the economic consequences of facilities planning can be related
directly to the resources invested which rise rapidly during the detailed planning and
construction. Also, we have influence on profit and operating efficiency which is the
greatest during preplanning and becomes smaller as the detailed designs are formulated.
Capacity decisions have the greatest influence on profit. Location decisions are the next
greatest influence as the decisions on site plan and building design are taken in this phase.
For any facilities project, whether it is a new project or an improvement project, efficient
means of financing must be found. In facilities planning, the amount involved is
generally high, careful consideration must be given to how the financing happens.
Various factors like whether to lease or buy or build a facility, decision to purchase or
modify a facility for cash or finance and also the various ways financing can take place
needs to be studied and evaluated before any decision is made.
1.12 Need for Research
Increasing global competition, rapid changes in technology and the necessity to cater
quickly to a cost and quality conscious customer have changed the dynamics of facilities
planning [6]. Modern day manufacturing facilities need to be responsive to the frequent
changes in the product mix and demand and thereby minimize the material handling and
machine relocation costs. A principal goal of concurrent engineering has been the
reduction of development cycle time of new products. This success brings about a
parallel need for the evaluation and reconfiguration of the facilities where these products
need to be manufactured. This is because of the rate at which modern markets demand
new products which puts ever increasing burden on the existing manufacturing facilities.
The current manufacturing scenario retards any change in the existing settings.
Significant research has been carried out in order to determine whether the changes in
work settings help in the goals that have been set to be achieved. The redesign of
workspace has become relevant to business success in ways that many business people

20
and even higher proportion of facility managers still do not understand. Since,
considerable attention needs to be paid to facilities of the modern era because of the costs
associated with it and also the resources expended, the senior management is scrutinizing
the contribution of facility management departments to an organization’s success.
Because of the development happening in this area, in the near future, work will no
longer be a place, but a range of activities that can be conducted virtually anywhere and
at any time.
2% scrap 2% scrap
Figure 1.8Example of a manufacturing process
Consider Figure 1.8, which shows a simple manufacturing process. A given raw
material is converted into a finished product after operation A and operation B. Both of
these operations have a scrap rate of 2% each and the quantity of finished product
produced is 100,000 pieces/day. Now let us assume that the scrap rate increases to 5% for
both the operations. Naturally, the quantity of raw material increases in order to produce
the same number of finished product, along with increase in the operation times for A and
B. This would also result in additional requirements of equipment and personnel for
which additiona l space needs to be allocated. Thus, there is an immediate modification
and upgrading required in the existing facility. This is the effect of only one of the many
parameters involved in the manufacture of the product. There are many parameters which
are involved in manufacturing process and hence any variation in these parameters would
have a direct impact on the facility design.
Thus, the primary objective is to emphasize the fact that change in process or
parameter values result in changes in the facility size. Cost of the product is of
importance because any change in the size of the facility has direct impact on the final
cost of the product being manufactured. The objective of facility design and planning as
mentioned earlier is to have a facility with the right equipment, product and size. Also,
changes in the facility bring about changes in the number of personnel involved which
Raw Material
Operation A
Operation B
Finished product
Quantity produced: 100,000 pieces/day
21
adds to the cost of the product. Hence, a model is necessary which gives a facility
manager of designer the tool to study the effects of product parameters on facility size.
1.12.1 Verification and validation of the system
A product is identified and the parts that go into its manufacture are considered with the
different manufacturing parameters associated with it. Other details which are considered
are the equipment used to manufacture these different parts. Analysis is done using
specific values of these parameters and the cost and space required for the manufacture is
initially calculated. In order to determine how these parameters have an effect on the cost
of the product and the size of the facility, these parameters are varied one at a time
keeping the other parameters constant and the results tabulated.
The development of computer models has eased the task of evaluating different solutions.
There are many computer programs available, which have been discussed earlier that can
be used to validate the any type of facilities layout. These computer models can design
the layout, determine the cost of material handling and layout changes and also shows a
working model of the actual layout to help the user in determining the best possible
solution. This research also involves developing a model initially in MS-EXCEL to study
the effects and the results are validated in M-CRAFT facility design software.
1.12.2 Sensitivity Analysis
Since there is a possibility of a large number of factors affecting the facility size and the
final cost of product, it is important to identify the most decisive factors which could be
considered for future analysis. Also, some factors may affect the result in a different way
when used isolated than when used in conjunction with other factors as there might be
many factors which might be correlated. Various parameters can be changed and their
impact on the facility and cost of the product be analyzed. The effects of altering these
factors on the facility can be studied. Sensitivity analysis can be performed on these
factors which would help the facility decision makers in making better decisions by
concentrating on the important factors.
1.12.3 Conclusions
Large variation in production volume has become the norm due to the frequent changes
in technologies and market. Many case studies have been discussed in [1] which further

22
substantiate the above-mentioned conclusion. Modern day facilities need to be flexible to
meet the ever-changing demands of the market and the end customers. The market
demand is dynamic and hence facilities need to be able to cater to this dynamic change in
product demand. Since resources need to be added or modified, significant cost and labor
is involved in order to incorporate these additions or modifications. Facilities need to be
designed such that introduction of newer products with shorter life cycles enforcing
modifications and renewal of production facilities much earlier than their life time do not
result in major capital expenditure. Hence a model needs to be built and investigation
needs to be done to access the effect of manufacturing parameters on the effectiveness of
the layout and the material handling system.
1.12.4 Research Objectives
The primary objectives of the research are given below.
• Investigate the impact of manufacturing parameters on facility layout.
• Develop a model in MS-EXCEL that will showcase the relationships between
product and process design parameters and facility layout.
• Execute the model and develop relationship between manufacturing parameters
and layout effectiveness by varying the different manufacturing parameters.
• Verify and validate the model after performing sensitivity analysis.

23
2 LITERATURE REVIEW
“Modern manufacturing and service are characterized by the necessity to rapidly adapt
production facilities and processes to changes in the required product quantity, mix and
design. Such changes are arise from different sources like new regulations and
environmental rules the manufacturer needs to comply, sudden changes in product
demand, a new product line that the company’s marketing people are eager to introduce
or an integral part of the company’s continuous productivity improvement program” [7].
Production managers are faced with matching the emerging product portfolio with the
resources they have available [10]. Hence, many companies examine how complex their
new products are before putting them into full production. The role of the facilities
manager has become crucial in the modern day manufacturing industries. Since any
changes in the product mix or quantity bring about changes in the facility layout and
design, a facilities manager needs to be prepared for these unforeseen requirements.
Earlier, when a new facility was planned, based on the selection and knowledge
of the interaction between the different machining centers or departments, the facility
manager attempts to maximize the adjacency measure, minimize the total cost of material
handling or optimize some combination of the two. A heuristic or an optimal algorithm
depending on the formulation and size of the problem is used to obtain a block layout [6].
The solution obtained is modified to include both, adjacency and total cost qualitative
criteria under the assumption that:
• The product range and the composition remain constant over the lifetime of the
facility
• If there are any changes in the product mix, they are made known at the design
stage itself
These assumptions held in the past, but not in today’s manufacturing industry.
Today’s manufacturing practices indicate that:
• The range and composition of products manufactured is changing frequently at an
alarming rate [1].
• It is not possible to predict the changes which might be required in the future.

24
Under these conditions, the effectiveness of the facility design is measured by the ability
of the layout to adapt to the changes of the product mix and volume [6].
Figure 2.1Dynamic facility layout methodology [6]
The dynamic facility layout methodology addresses the layout issue considering
the relocation of machines, workstations, personnel and support services in a dynamic
environment. Since it is not possible to predict material flow patterns between
workstations over long planning horizons and changes in flow patterns are known just
before they occur, a manufacturer must alter the layout whenever the situation warrants.
The above methodology considers the revised manufacturing conditions and accordingly
designs the layout thereby minimizing the rearrangement costs while maximizing the
potential savings in the material flow costs. The newer facilities should be designed in
such a way that they respond to the underlying dynamics of operation and planning. A
cycle of modeling, analysis and design will lead to better understanding of the problem
dynamics and help define solutions that are fairly robust [6].
Design Data - New Product Design - New Processes Selected
Production Data - Expected Volume - Changed Product Mix
Current Facility Layout
Relocation Costs
Facility Layout Design
Mat
eria
l Han
dlin
g C
osts
Revised Material Flow Matrices and Adjacency Matrices
Output - Machine Location - Material Flow Path
25
Regardless of the source and the extent of change, two important issues that need
to be addressed are project development time and design quality. To reduce the
development time and increase the quality, a collaborative approach to facility design is
mandatory [7]. Facility design has evolved significantly over time and hence pioneering
tools were based on manual algorithms and integrated methodologies.
Genetic algorithms are a class of adaptive search techniques which have gained
popularity in facility design optimization problems. A lot of genetic algorithms have been
designed to solve the quadratic assignment formulation of equal and unequal sized
facilities layout problems. Genetic algorithms have received a great deal of attention due
to the fact that they do not rely on the analytical properties of the function to be
optimized which make them suited for a wide class of optimization problems [9]. An
approach to solve a facility layout problem with equal sized and unequal-sized areas
using genetic algorithms is given in [9].
Due to the availability of computer technology, automation of manual and error
prone part of the design work was possible. More recently, computer systems for
graphical simulation along with the advanced computer networking technology have
provided the infrastructure for collaborative facility design.
2.1 Computer Aided Layout Planning
As mentioned earlier, facilities planning process has been simplified to a large extent
with the advent of computers and the availability of user friendly and effective computer
assisted design and manufacturing programs. The layouts can now be easily constructed,
evaluated and discarded until the most effective layout is obtained. Actual models can be
simulated and real life scenarios can be created and validated. Some of the important and
commonly used computerized layout algorithms are discussed in the literature.
2.1.1 CRAFT (Computerized Relative Allocation of Facilities
Technique)[1]
CRAFT is one of the earliest layout algorithms and was developed by Armour, Buffa and
Vollman in 1963[1]. CRAFT is an improvement type of algorithm starting with an initial
layout and develops alternate layouts. It begins by determining the centroids of the
departments in the initial layout. It then calculates the rectilinear distances between pairs

26
of department centroids and stores it in the distance matrix. The initial layout cost is
calculated using entries on the from-to chart, unit cost matrix and distance matrix.
CRAFT then considers all possible two-way and three-way department exchanges and
identifies the best exchange, the one that results in the lowest layout cost. Once the
exchanges are done, CRAFT calculates the new centroids for the departments and also
calculates the new layout cost. The next iteration is done again with CRAFT trying to
find out the best exchange possible. This process is continued till no further two or three-
way exchanges and reduction in layout cost is possible.
CRAFT is generally flexible with respect to department shapes, exchanges
departments only that are adjacent or equal in area, captures the initial layout with
reasonable accuracy and is a highly path dependent heuristic. However, CRAFT is
restricted to rectangular buildings and rarely generates department shapes that result in
straight, uninterrupted aisles, which are generally desired in the final layout.
2.1.2 MCRAFT (MicroCRAFT) [1]
MCRAFT is the new version of CRAFT developed by Hosni, Whitehouse and Atkins.
MCRAFT is similar to CRAFT except that it can exchange any two departments even if
they are not equal in area and are not adjacent. MCRAFT divides the area into a number
of bands and assigns the one or more departments in these bands. The number of bands is
specified by the user. Though there are advantages using MCRAFT, it also has some
shortcomings like its inability to capture the initial layout accurately unless the
departments are already arranged in bands and assumes that the bandwidth is the same for
all bands.
2.1.3 BLOCPLAN [1]
BLOCPLAN was developed by Donaghey and Pire. The departments are arranged in
bands as in the case of MCRAFT but the number of bands are determined by the program
and are generally limited to two or three bands. Also, the departments are present in only
one band and hence they are rectangular in shape. The band widths are allowed to vary
which was not possible in MCRAFT. This can be used both as a construction type and an
improvement type algorithm as it calculates the initial layout fairly accurately. It uses the

27
relationship chart and from-to chart to evaluate the layout though they can be used only
one at a time.
2.1.4 LOGIC (Layout Optimization with Guillotine Induced Cuts)[1]
In LOGIC, assumption is made that it takes the from-to chart as the input data. Like
BLOCPLAN, LOGIC can be used both as a constructive type and improvement type
algorithm. LOGIC divides the building into smaller portions by executing successive
“guillotine” cuts which are straight lines running from one end of the building to the
other. LOGIC executes a series of horizontal and vertical cuts. After each cut, the
departments are assigned to the east side or the west side of the cut. LOGIC constructs a
tree in order to successfully execute these cuts. The departments generated by LOGIC are
rectangular, provided that the building under consideration is also rectangular.
2.1.5 MULTIPLE (MULTI-floor Plant Layout Evaluation)[1]
MULTIPLE was developed by Bozer, Meller and Erlebacher for multiple floor facilities.
It is similar to CRAFT except for the exchange procedure and layout formation.
MULTIPLE uses from-to chart as input data and the departments need not be rectangular.
It is an improvement type algorithm which starts with an initial layout specified by the
layout planner. MULTIPLE can exchange any two departments whether they are adjacent
or not. It achieves this by using “spacefilling curves” (SFCs). In MULTIPLE, SFCs are
used to reconstruct a new layout when there is an exchange of any two departments.
2.1.6 CORELAP (Computerized Relationship Layout Planning)[1]
CORELAP is one of the oldest construction routine developed by James Moore in 1967.
It determines the most effective overall layout on the basis of relationships between
equipments and the steps involved in the production process. It constructs a layout by
calculating the total closeness rating (TCR) for each department. TCR is the sum of the
numerical values assigned to the closeness relationships by converting vowel letter
ratings to their numerical equivalents (A=6, E=5, I=4, O=3, U=2, X=1). The ratings for
each activity area are summed up and evaluated to find the activity with the highest TCR.
That activity is then placed at the center of the layout and the remaining areas are then
examined again.

28
2.1.7 ALDEP (Automated Layout Design Program)[1]
The ALDEP routine was developed Jerrold Seehof and Wayne Evans and has the same
data input requirement and objectives as CORELAP. ALDEP takes a different approach
to construct the layout by selecting the first department and breaking ties randomly.
ALDEP produces may layouts, rates the layouts and the evaluation of the layouts is done
by the facilities manager. Each layout is rated and scored based on the number of related
activities that are adjacent and weighted based by the relative closeness required between
them.
The shapes of the activity areas created by ALDEP are much more regular than
the ones obtained by either CRAFT or CORELAP. This is a result of the sweep technique
it employs. The assignment of activities in multistory building is a formidable planning
problem and a variety of algorithms and approaches are available. Some of them
resemble the ones already discussed. Some of the most commonly used techniques are
SPACECRAFT which is an extension of CRAFT that incorporates vertical travel costs
and is an improvement algorithm, Planning ADES which was a set of card input
programs for use in IBM mainframe computers and SABA routine which is a
combination of improvement and construction algorithms. Over the last few years, there
have been progressive uses of interactive graphics. However, the underlying algorithms
will be definitely similar if not the same for future layout solutions as well. It is always
difficult to suggest one algorithm which would suit a particular layout problem. Hence it
is always suggested that the facility planner looks at the solutions obtained by at least two
or three algorithms before making the final decision.
2.2 Advanced Computer based Technologies for Facility Design
Techniques for facility design have progressed in parallel with the evolution of
manufacturing [7]. In an effort to use space effectively and improve the production
efficiency, various planning methods and algorithms were developed and introduced.
Focus has always been on planning the arrangement of departments and machines to
reduce the cost of moving materials and products through the facility. Computer
technologies have been extensively to develop advanced tools for facility design. Table
2.1 shows the development of computer aided facility design methods. A description of
some of the tools currently being used is given below.

29
2.2.1 Integration of Simulation and Graphics for Flow visualization Simulation is one of the fast growing computer packages used to solve facility layout
problems. Simulation study is done to determine the inherent constraints and
Stage of development Tools for facility design Examples
Manual design Integrated manual methodology Automation of methodology elements
Algorithms, templates Systematic layout planning Computerized Versions of algorithms, mathematical programming , heuristics etc Discrete event simulation (including simulation animation packages) Computer aided drafting
(Tompkins and White 1984) SLP (Muther 1973) CRAFT (Armour and Buffa 1963) CORELAP (Lee and Moore 1967) SLAM II, GPSS (Pritsker 1986) AutoCAD application (Masud and Sathyana 1992)
Integrated applications
Database and simulation Graphical simulator emulator systems for robotics, Integration of CAD, kinematics and discrete event simulation and data libraries
CAFP (Nof 1980) ROBCAD (Technomatix Technologies 1989) IGRIP/QUEST (Deneb Robotics 1993)
Artificial intelligence
applications Knowledge based systems and optimization
FADES (Fisher and Nof 1984) and QLAARP (Banerjee et al 1992) respectively
Facility description language Collaborative design semantics, multi level design, integration of simulator emulator and discrete event simulation
FDL (Witzerman and Nof 1995a, 1995b)
Collaboration over internet for facility engineering infrastructure
Integrated architectural design, structural engineering and energy analysis
SEED (Flemming et al 1994) for architectural design, CONGEN (Gorti and Sriran 1994) for structural engineering and ACE/BLAST (Case and Lu 1995, Blast 1991) for energy analysis
Table 2.1 Development of computer aided facility design methods
bottleneck operations in the manufacturing process. The relevant performance measures
from the simulation output along with factors like space requirements for each equipment
and the expected production goal of the new facility can be analyzed to present new
design alternatives for the proposed new facility. Commercial simulation packages have
been developed with graphical modules to show flow relationships. Tumay (1992)
presents an approach that integrates CAD and system simulation which result in accurate
scale models for animation [7]. ROBCAD and IGRIP are graphical simulator emulators
for detailed design of robotic workcells that support deterministic motion simulation of
kinematic devices and plant layout alternatives. Linkage of cell simulation with material
30
handling animation and discrete event simulation are allowed by incorporating Quest on
IGRIP. AutoMOD II, an industrial simulation system developed by Thompson (1989)
focuses on the physical geometry of manufacturing, material handling, storage and
distribution.
2.2.2 Databases and Computer Aided Drafting
The use of computers has been extended to detailed facility plans with the advent of low
cost software for computer aided drafting. It is important to store and maintain a database
on information about the geometry, device parameters, processes and flow
characteristics. Computer aided drafting is the primary design representation and the
source of specialty drawings. Design layers with geometric data such as identification,
location, volume and related information are calculated from the graphical model and
placed into a database for further application [7].
2.2.3 Artificial Intelligence in Facility Design
FADES (Fisher and Nof 1984) was the first rule based system to support the facility
design process supporting equipment selection, capacity analysis and workstation site
selection. FADES selects an economic model, develops inputs and invokes the model
based on the input provided by the user. Another iterative methodology which optimizes
the layout with respect to material flow is QLAARP (Banerjee et. al. 1992). The
algorithm is based on a linear programming solution to a design graph network
minimizing the cumulative product of flow and distance. Another important feature of
QLAARP is its ability to identify and eliminate qualitative layout anomalies. Wang and
Bell (1992) apply a knowledge based design system with a focus on the simulation of
part and tool flow in flexible manufacturing systems [7].
Though there have been significant advancements in computer based facility
design methodologies, these tools have some limitations which are given below.
• Generally, tools focus on a specific task and often use a model that does not
support the data requirements and outputs obtained from other tools.
• The design outputs from one model are used as input parameters at the next level
of design abstraction though lower level models may invalidate the assumptions
or results obtained at higher level models.

31
• Most research focuses on facility layout problems ignoring the detailed aspects of
facility design which might affect the ultimate solution.
Therefore, corrections that may be required may result in costly modifications to the
physical facility along with changes in planned staffing levels, equipment configurations
and material handling requirements. It is not known whether computers will ever be able
to fully capture and use human experience and judgment in arriving at solutions for any
given facility layout problem. Computers will continue to be used as design aids to the
layout planner who will continue to play a key role in developing and evaluating the
facility layout.
The most dramatic changes in the workplace are still to come. While many
companies have yet to absorb the past decade’s advances in areas such as technology,
building codes and worker sophistication, it is time to think of the bigger changes ahead
[19]. Companies will need help to design and facilitate innovations that fit the new work
environment rather than those based on our industrial past.
Facility management is a fairly new business and management discipline which is
defined as the practice of coordinating the physical workplace with the people and work
of the organization, integrating the principles of business administration, architecture and
the behavioral and engineering sciences. It embraces the concepts of cost effectiveness,
productivity improvement, efficiency and employee quality of life [5]. The public and the
private sector have been slow to realize the business nature of facility management. The
following information helps in emphasizing the importance of facility management.
• The Department of Defense is estimated to own over $500 billion in facilities.
• Facilities are usually the greatest component of a company’s administrative
expense after payroll.
• Some facilities have avoided or saved costs in the range of 30 to 35 percent
without any diminution of services by simply applying the sound principles of
facilities planning, lease management and energy management.
Figure 2.2 in the following page depicts the facility management life cycle. Its explains
the different stages of a facility management lifecycle. The planning stage involves
identifying the resources for the facility and planning the budget required. The next stage
involves building the actual structure of the facility. This process involves evaluating
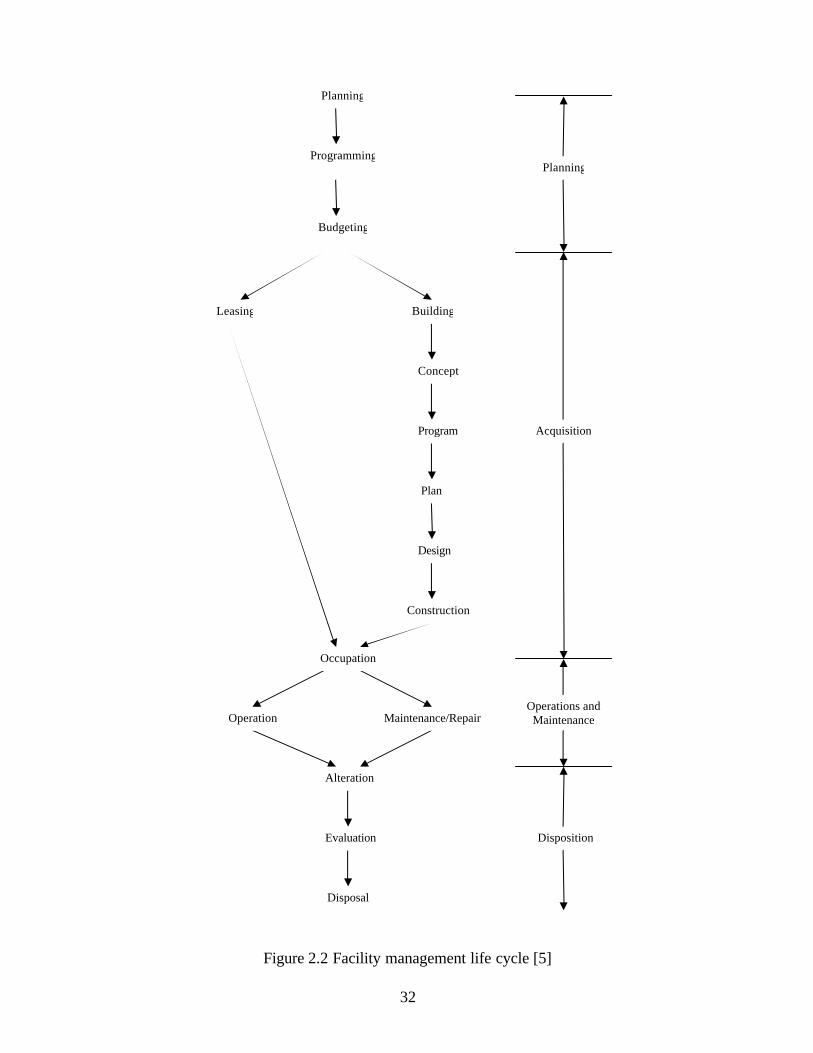
32
Figure 2.2 Facility management life cycle [5]
Planning
Programming
Budgeting
Leasing Building
Concept
Program
Plan
Design
Construction
Occupation
Operation Maintenance/Repair
Alteration
Evaluation
Disposal
Planning
Acquisition
Operations and Maintenance
Disposition

33
whether to construct a new building or use an already existing structure. The facility
concept, the design and construction plan are executed in this stage. The next stage
involves placing each of the different operations and the necessary resources required to
perform these operations like materials, equipment and labor. Provisions need to be made
for regular maintenance of these areas whenever the need arises. The last stage involves
provisions to make changes in the facility layout when required due to changes in market
demand and dispose any resources, which may not be required for the new layout.
Another new development in layout planning is the development of flexible
layouts. Flexible layouts use methods and equipment that can perform a variety of tasks
under different operating conditions. Harmon and Peterson [1] have suggested the use of
the following objectives to develop flexible layouts which are given below.
1. Reorganize factory subplants to achieve superior manufacturing status.
2. Provide maximum perimeter access for receiving and shipping materials,
components and products as close to each subplant as possible.
3. Cluster all subplants dedicated to a product or product family around the final
process subplant to minimize inventories, shortages and improve communication.
4. Locate supplier subplants of common component subplants in a central location to
minimize component travel distances.
5. Minimize the factory size to avoid wasted time and motion of workers.
6. Eliminate centralized storage of purchased materials, components and assemblies
and move storage to focused subplants.
7. Minimize the amount of factory reorganization that will be made necessary by
future growth and change.
8. Avoid locating offices and support services on factory perimeters.
9. Minimize the ratio of isle space to production process space.
The issue of flexibility is becoming increasingly important to the design, planning
and operation of manufacturing facilities [23]. This importance is due to the nature of the
environment characterized by high degree of variability and volatility in which most
manufacturing organizations have to compete. Manufacturing flexibility is now seen as a
mechanism that allows organizations to compete despite the volatility of their operating
environments by responding in a cost efficient and timely fashion to changing market
demands [23].

34
Different approaches have been adopted and evaluated to address the facilities
layout and design problems. Since the impact of work settings on organizational
performance is visible, it is clearly explained in [12]. As cost is one of the most important
consideration in any facilities problem, the strategies needed to reduce the cost of the
product is explained in [8]. The impact of new products on the facility is explained in
[10]. Newer methodologies have been introduced to address the facility layout problem
like the use of genetic algorithms for facility layout design in [9] and simulation in [11].
The changes in design and facilities management over a period of time are explained in
[14]. Since, it is important to study the current facility before making any changes or
additions based on requirements; the procedure used to conduct a facility management
audit is explained in [15].
2.3 Conclusion
The literature review reveals the work that has been done in the area of facilities layout
and design and underlines its importance across the globe. Considerable efforts have been
put into this area of research and the availability of improved technology has provided
many tools that have improved the quality of research. Though many topics have been
covered and dealt with in isolation, the focus on the overall facility design system is
improving. The literature clearly shows that the effect of process parameters on the
effectiveness of the facility layout has not been analyzed. Since changes in facility have
direct impact on the expenses of the company and thereby on the cost of the product
being manufactured, the methodology adopted in arriving at the solution needs to be
carefully eva luated. The availability of computer based layout algorithms have helped in
enhancing the productivity of the layout designer who can now evaluate different options
available to him and select the most suitable one. But there is still no tool available to the
facilities manager to determine how process parameters impact layout effectiveness.
Research shows that demand of new products by the market, which bring about changes
in the product mix, volume and process parameter changes have direct impact on the
facility size and also the machine and operator activity cost. Hence, a tool is required
which would help in understanding the effect of process parameter changes on layout
effectiveness. It can be clearly established that the approach that reduces the total costs to
the minimum and requires the minimum modifications in the facility is the most suited.

35
3 RESEARCH APPROACH
3.1 Collection of Data
Evaluation of the current conditions that exist in the facility requires data on the process
and product parameters that are being handled. The facilities manager needs to have close
interaction with the product and process designer as these are the people responsible for
changes in the product or process design which ultimately might result in changes in the
facility design. The product designer is responsible for specifying what the end product
would be in terms of the dimensions, material composition and sometimes packaging as
well. The process planner or designer is responsible for determining how the product will
be manufactured. Also involved is the production planner who specifies the production
quantities and schedules the production equipment. The facility planner is dependent on
the product, process and schedule designers for timely and accurate input to carry out his
task effectively. Since these factors have some or the other impact on the facility,
combination of these factors can be put to test and the effects on the size of the facility
and cost of the product being manufactured can be analyzed. Also, sensitivity analysis
can be done in order to determine the most decisive factors.
Any manufacturing facility is designed based on the annual volume that needs to
be manufactured based on the market requirement. The process requirements to meet this
demand can be categorized in three phases. The first phase determines the quantity of
components to be manufactured including the scrap allowance to meet the market
demand. The second phase determines the equipment required for each operation. The
third phase combines the operation requirements to obtain the overall equipment
requirements.
Once the decisions on the product, process and schedule design are made, the
facilities planner needs to organize the information and generate and evaluate the layout,
material handling, storage and unit load design alternatives. Then, consideration is given
to the flow of materials and the relationship of activities using the different tools
available like affinity diagram, interrelationship digraph, matrix diagram, prioritization
matrix and the appropriate relationship diagram is constructed. The next step then is to
evaluate the space requirements for the layout. Ideally, it is better to develop a layout and
then construct the building around the layout, but more than often there are a lot of

36
constraints like the presence of a building, limitation in the size of the building size or
availability of capital for new construction resulting in considering not only space
requirements but also its availability.
3.2 Procedure
In order to study the relationship between the process parameters on the facility size and
the cost of the product being manufactured, a product was selected being manufactured in
a job shop production and a facility was designed to manufacture the product. A job shop
was considered for the research, as this type of production is the best platform to
showcase process parameters in a manufacturing facility and their impact on layout
effectiveness. Some of the important parameters, which are used in the manufacture of
the product, and entities, which are required in arriving at the final size of the facility, are
discussed in the following sections.
3.2.1 Scrap Rate
One of the most important considerations which need to be taken into account in the
manufacture of any product is the scrap rate. Scrap is the material waste generated in the
manufacturing process due to geometric or quality considerations [1]. Every company
strives to keep the scrap rate to the minimum in an effort for continuous improvement.
Scrap rate can be reduced by automating the process, loosening the tolerance, increasing
the number of certified suppliers, improving the quality at the source and use of higher
grade of material.
We have,
Ok = Ik - PkIk or Ok = Ik(1- Pk) [1]
Hence,
Ik = Ok/(1-Pk)
Where,
Pk is the percentage scrap produced at the kth operation
Ok is desired output of non defective product from operation k
Ik is the production input to operation k

37
Therefore, the expected number of input units to start production for a part having n
operations is
On I1 = ------------------------------ Eqn. 3.1 (1-P1)(1-P2)…….(1-Pn)
where in this case On is the market estimate
3.2.2 Equipment Fractions
Another calculation required in order to determine the space requirement for any facility
is the Equipment fraction. This is the quantity of equipment required for an operation.
The equipment fraction for any operation may be determined by dividing the total time
required for the operation (product of the standard time for the operation and the number
of times the operation needs to be performed) by the time available to complete the
operation. The following deterministic model given in [1] can be used to estimate the
equipment fraction.
SQ F = -------- Eqn. 3.2 EHR
Where,
F = number of machines required per shift
S = standard time (minutes) per unit produced
Q = number of units to be produced per shift
E = actual performance, expressed as a percentage of standard time
R = reliability of the machine
Also, equipment fractions are a function of the following factors:
• Number of shifts as the same machine might work in more than one shift.
• Set-up times because whenever machines are not dedicated, more machines are
required when the set-up times are longer.
• Degree of flexibility as customers may require small quantities of different
products to be delivered frequently which may require extra machine capacity to
handle these kinds of requests.

38
• Layout type as more number of machines may be required to dedicate
manufacturing cells or focused factories to the production of product families.
• Total productive time that will increase the machine up time and improve quality
thereby reducing the number of machines required for production.
These models are used to plan facility which provides sufficient flexibility to
handle changes in machine fraction variables.
The next step is to combine the equipment fractions for identical equipment types
though it might not be straightforward. Overtime and subcontracting can be thought of if
only one operation is to be performed on a particular equipment type, whereas if more
than one operation is to be performed on a particular equipment type, several alternatives
can be considered.
Once the decisions on the product, process and schedule design are made, the
facilities planner needs to organize the information he has and generate and evaluate the
layout, material handling, storage and unit load design alternatives. Then, consideration is
given to the flow of materials and the relationship of activities using the different tools
available like affinity diagram, interrelationship digraph, matrix diagram, prioritization
matrix etc, and the appropriate relationship diagram is constructed. The next step then is
to evaluate the space requirements for the layout. Ideally, it is better to develop a layout
and the construct the building around the layout, but more than often there are a lot of
constraints like the presence of a building, limitation in the size of the building size or
availability of capital for new construction resulting in considering not only space
requirements but also its availability.
3.2.3 Employee Requirements
After looking at ways of determining the production rate and the number of machines
required per production period, we also need to look at the determination of the number
of employees required. In the case of manual assembly operations where the operator is
handling only one machine, the number of employees can be determined as follows:
n PijTij Aj = ? ------------- ………..[3] Eqn. 3.3 i = 1 Hij
where,
Aj = number of operators required for assembly operation j
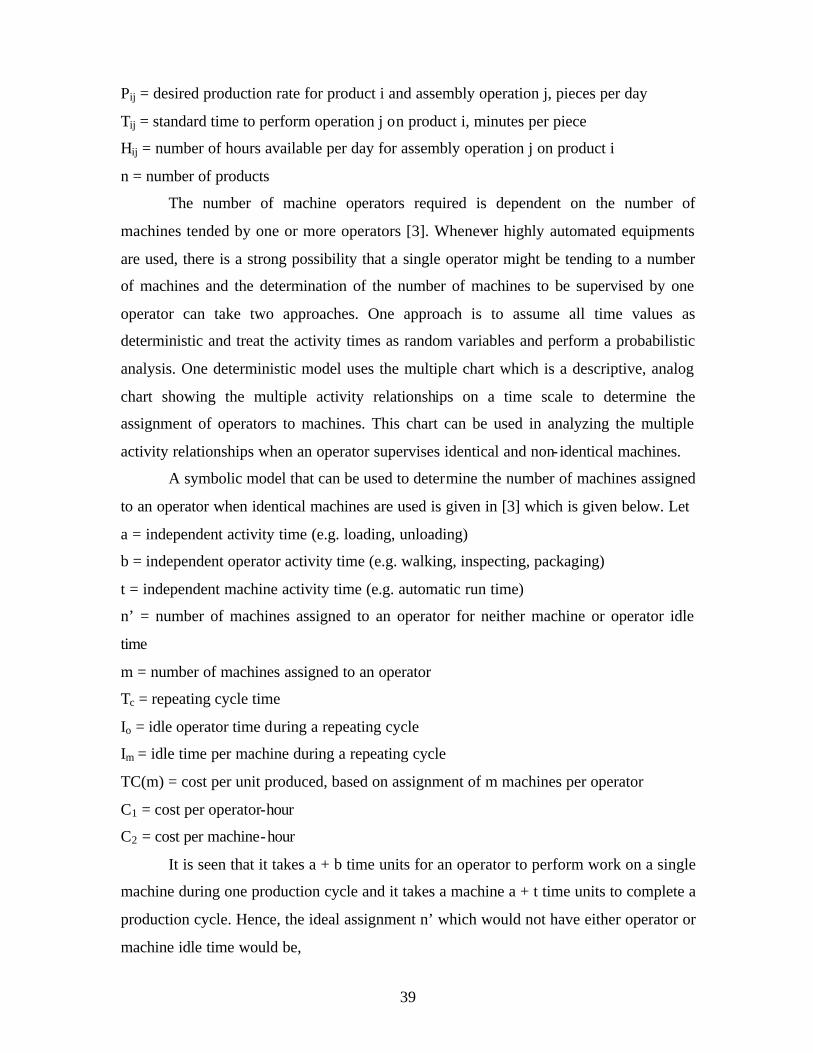
39
Pij = desired production rate for product i and assembly operation j, pieces per day
Tij = standard time to perform operation j on product i, minutes per piece
Hij = number of hours available per day for assembly operation j on product i
n = number of products
The number of machine operators required is dependent on the number of
machines tended by one or more operators [3]. Whenever highly automated equipments
are used, there is a strong possibility that a single operator might be tending to a number
of machines and the determination of the number of machines to be supervised by one
operator can take two approaches. One approach is to assume all time values as
deterministic and treat the activity times as random variables and perform a probabilistic
analysis. One deterministic model uses the multiple chart which is a descriptive, analog
chart showing the multiple activity relationships on a time scale to determine the
assignment of operators to machines. This chart can be used in analyzing the multiple
activity relationships when an operator supervises identical and non- identical machines.
A symbolic model that can be used to determine the number of machines assigned
to an operator when identical machines are used is given in [3] which is given below. Let
a = independent activity time (e.g. loading, unloading)
b = independent operator activity time (e.g. walking, inspecting, packaging)
t = independent machine activity time (e.g. automatic run time)
n’ = number of machines assigned to an operator for neither machine or operator idle
time
m = number of machines assigned to an operator
Tc = repeating cycle time
Io = idle operator time during a repeating cycle
Im = idle time per machine during a repeating cycle
TC(m) = cost per unit produced, based on assignment of m machines per operator
C1 = cost per operator-hour
C2 = cost per machine-hour
It is seen that it takes a + b time units for an operator to perform work on a single
machine during one production cycle and it takes a machine a + t time units to complete a
production cycle. Hence, the ideal assignment n’ which would not have either operator or
machine idle time would be,

40
a + b n’ = ------- Eqn. 3.4 a + t
If m is the number of machines assigned to an operator, then if m<n’, the operator
is idle and if m>n’, then the machine is idle. Hence in order to balance this, the following
formulation is arrived in [3] to determine the cost of the unit produced.
(C1 + mC2)(a + t) TC(m) = ------------------------ when m<n’ Eqn. 3.5 m
TC(m) = (C1 + mC2)(a + b) when m>n’ Eqn. 3.6
The above formulation has been used for the determination of the cost of the
product being manufactured in a facility.
3.2.4 Parts of the Powerarm
A Powerarm [22] was selected to do the research and conduct the analysis for the
different process parameters involved in a job shop production scenario. Apple [22] gives
the complete details on the manufacturing process, the sequence of operations, the
operation times and the types of machines required to manufacture the Powerarm. This
data is used to build a model in MS EXCEL and the impact of varying these parameters
on the layout effectiveness is established. There are different parts which when
assembled form the Powerarm. The important parts are considered and area required to
manufacture each of the different parts is determined. These areas are added to arrive at
the total area required to manufacture the Powerarm. The important parts considered are
the Base, Eccentric rod, Handle, Cover, Cap, Pin, Pressure pad and Ball swivel.
3.2.5 Operations on Powerarm [22]
The different operations, the equipments and their manufacturing time are given in detail
in Apple [22]. They are shown in Table 3.1 below.

41
Operation No.
Operation Description Machine Name Pieces/hr
PART I – BASE 1 Face bottom Leblond Eng. lathe 60
2 Face top, turn OD, neck, drill and ream Warner and Swasey #1A turret lathe
23.8
3 Drill three bolt holes Cleereman drill press 84 4 Drill pin hole Delta drill press 238 5 Drill and ream eccentric hole 2 Spindle Fosdick drill press 65.4 6 Inspect Bench 55.4 7 Degrease Detrex washer 143 PART II – ECCENTRIC ROD 1 Cut off and chamfer Oster #601 588 2 Drill 5/16 hole Delta drill press 250 3 Tap 3/8-16 hole Delta drill press 120 4 Turn eccentric Leblond Eng. Lathe 149 5 Inspect Bench 143 6 Heat treat Furnace (subcontract) 910
7 Grind O.D. Cinn. Centerless grinder (subcontract)
455
8 Degrease Detrex washer 455 PART III – HANDLE 1 Thread, cut off and chamfer Warner and Swasey #1A 256 2 Thread, & chamfer 2nd end Warner and Swasey #1A 232 3 Inspect Bench 500 4 Degrease Detrex washer 600 PART VII – COVER 1 Face, bore, turn and cut off Warner and Swasey #1A 60 2 Drill 4-9/32 holes Cleereman drill press 178 3 Saw in two Brown and Sharpe mill 125 4 Inspect Bench 250 5 Degrease Detrex washer 300 PART VIII – CAP 1 Face, bore, and cut seat Warner and Swasey #1A 30.3 2 Drill and tap 2 Spindle Fosdick drill press 62.5 3 Mill slot Milwaukee vertical mill 83.5 4 Inspect Bench 100 5 Degrease Detrex washer 143 PART IX – PIN 1 Cut off and chamfer Oster# 601 1000 PART X – PRESSURE PAD 1 Bore, face and chamfer Warner and Swasey #1A 40 2 Mill slot Brown and Sharpe mill 120 3 Inspect Bench 100
4 Degrease Detrex washer (continued)
600
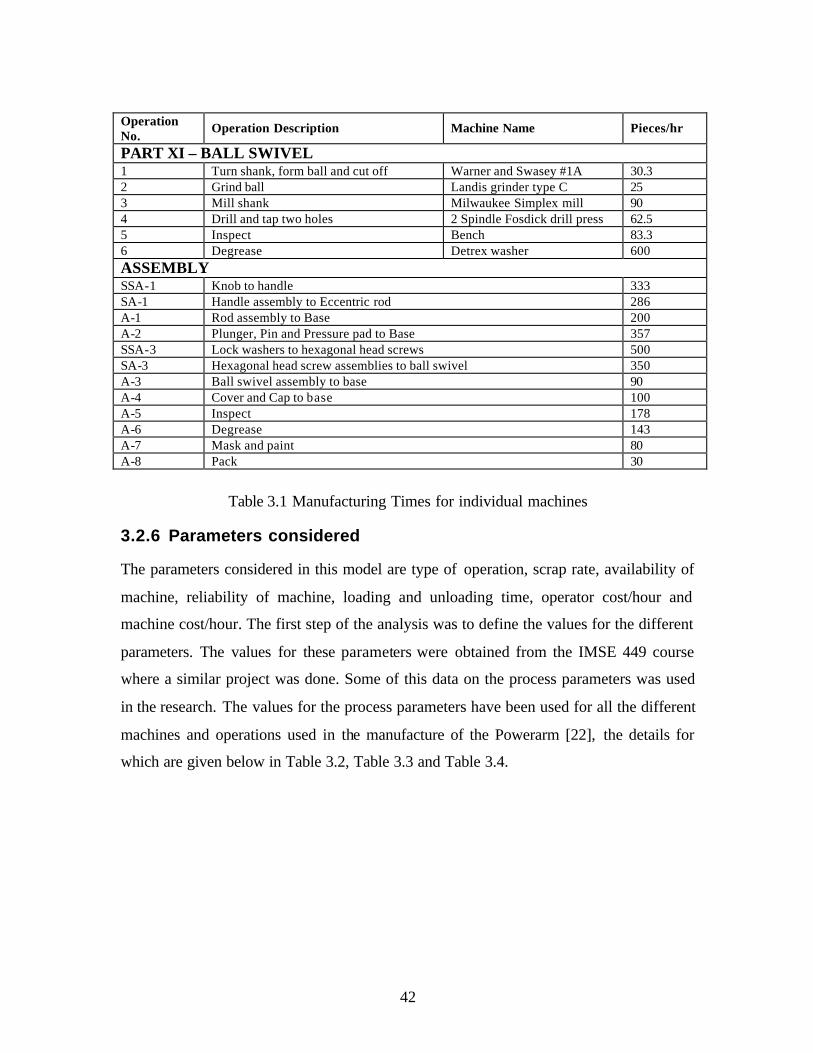
42
Operation No.
Operation Description Machine Name Pieces/hr
PART XI – BALL SWIVEL 1 Turn shank, form ball and cut off Warner and Swasey #1A 30.3 2 Grind ball Landis grinder type C 25 3 Mill shank Milwaukee Simplex mill 90 4 Drill and tap two holes 2 Spindle Fosdick drill press 62.5 5 Inspect Bench 83.3 6 Degrease Detrex washer 600 ASSEMBLY SSA-1 Knob to handle 333 SA-1 Handle assembly to Eccentric rod 286 A-1 Rod assembly to Base 200 A-2 Plunger, Pin and Pressure pad to Base 357 SSA-3 Lock washers to hexagonal head screws 500 SA-3 Hexagonal head screw assemblies to ball swivel 350 A-3 Ball swivel assembly to base 90 A-4 Cover and Cap to base 100 A-5 Inspect 178 A-6 Degrease 143 A-7 Mask and paint 80 A-8 Pack 30
Table 3.1 Manufacturing Times for individual machines
3.2.6 Parameters considered
The parameters considered in this model are type of operation, scrap rate, availability of
machine, reliability of machine, loading and unloading time, operator cost/hour and
machine cost/hour. The first step of the analysis was to define the values for the different
parameters. The values for these parameters were obtained from the IMSE 449 course
where a similar project was done. Some of this data on the process parameters was used
in the research. The values for the process parameters have been used for all the different
machines and operations used in the manufacture of the Powerarm [22], the details for
which are given below in Table 3.2, Table 3.3 and Table 3.4.

43
OPERATIONS SCRAP RATE Face 4% Turn 2% Neck 0.5% Drill 3% Ream 2%
Inspect 4% Degrease 0%
Cut off 3% Chamfer 6%
Tap 2% Heat treatment 7%
Grind 5% Thread 6%
Saw 3% Bore 4% Cut 3% Mill 5% Form 3%
Assembly 0% Table 3.2 Scrap rates of different operations
Table 3.2 gives details on the scrap rate for each of the different types of operations
performed during the manufacture of the Powerarm [22].
MACHINE OPERATION SETUP & UNLOAD (min) Leblond Lathe Face 0.2
Turn 0.26 Warner & Swasey Turn 0.6
Face 0.6 Neck 0.4 Drill 0.46 Ream 0.66 Thread 0.4 Cut 0.4 Chamfer 0.4 Bore 0.48 Form 0.4
Cleerman Drill Press Drill 0.32 Delta Drill Press Drill Pin Holes 0.60
Fosdick Drill Press Drill 0.70 Bench Inspect 0.44
Dextrex Washer Degrease 0.26 Oster Cut off 0.43
Chamfer 0.3 Brown & Sharpe Mill Saw 0.28
Milwaukee Mill Mill 0.72 Landis Grinder Grind 0.54 Simplex Mill Mill 0.50 Table 3.3 Loading and Unloading times for different machine operations

44
Table 3.3 gives the times for loading and unloading the part on the different machines for
each of the operations performed.
MACHINE AVAILABILITY (hrs/day)
RELIABILITY (%) COST ($/hr)
SPACE (sft)
Leblond lathe 24 93 12 101 Warner & Swasey 24 83 15 123 Cleerman Drill Press 24 88 10 78 Delta Drill Press 24 88 9 99 Fosdick Drill Press 24 77 13 120 Bench 24 100 7 66 Dextrex Washer 24 100 8 77 Oster 24 80 21 134 Brown & Sharpe Mill 24 85 18 99 Milwaukee Mill 24 78 15 113 Landis Grinder 24 89 19 124 Simplex Mill 24 92 17 101
Table 3.4 Other parameters for machines
Finally, Table 3.4 provides details on the availability of each of the machines, their
reliability in percentages, the operating cost of machine in dollar per hour and the space
required for each of the machines to be installed in the facility being designed.
Independent operator activity time is taken as 1 minute, operator cost is taken as
$25/hr, operator efficiency as 80% and number of Powerarms [22] manufactured is 1000.
3.3 Operations Process Chart for the Powerarm [22]
Figure 3.1 in the following page shows the operations process chart for the Powerarm
[22]. The process chart clearly shows the product flow resulting in the final assembly of
the Powerarm [22]. The assembly sequence for the different parts of the Powerarm [22],
the different manufacturing operations on each of the parts for their manufacture and the
sequence of these operations are depicted in the operations process chart.

45
Figure 3.1 Operations Process Chart for the Powerarm
3.4 Analysis
3.4.1 Assumptions
1. The facility considered is designed for job shop production.
2. Demand is fixed and is known.
3. The cost of the product determined is only the operator and the machine activity
cost. Other costs are not considered.
4. The results shown are only for the manufacture of Powerarm [22] for all the
machines involved in its manufacture.
The first step was to determine the size of facility required in order to
manufacture 1000 Powerarms [22] with the input parameters, machines and processes
given above. Also determined was the cost of each Powerarm [22] that was manufactured
in this facility. The first step is to determine the number of machines of each type for the
different parts that go into the Powerarm [22]. The ideal assignment n’ which would not
have either operator or machine idle time for each operation and part is then determined.

46
Then the number of machines per operator and the number of operators required for each
operation are determined. Then the cost of the part being manufactured on that machine
is then determined. In order to reduce the idle time of the machine and operator, similar
machines are combined and availability of a particular machine after the required
operation is utilized for another part which has similar machine requirements. Thus, the
total activity cost of manufacturing the Powerarm [22] is obtained by combining the
individual activity costs for the different parts.
The determination of the space requirements for the equipment, personnel and
auxiliary areas is the next step. The values of space required for all the different machines
are defined in square feet. The total number of different types of machines required in the
manufacture of the Powerarm [22] is determined and the space required for them is
calculated. Also, calculated is the space required for the operators who operate these
along with auxiliary space requirements like the aisle space and space for plant services.
The total space required is the summation of the equipment space, the operator space and
the auxiliary space.
To explain the process of arriving at the final area of the facility, calculations for
Leblond lathe used to face the bottom of the base part of the Powerarm [22] is shown.
Using the data from Tables 3.2, Tables 3.3 and Table 3.4 and the formula for output,
equipment fractions, n’ and activity cost of the product, the number of machines,
operators and activity cost of the product are determined to manufacture 1000 Powerarms
[22].
The first step is to determine the number of base parts that go into the Leblond Lathe for
facing operation taking into account the scrap rate for the Leblond Lathe and the
machines which are used in the manufacture of the base part. For 1000 Powerarms [22],
the quantity of parts that go into the manufacture of base in the Leblond Lathe is
1000 I = -------------------------------------------------------------------------------- = 1264 (1-0.04)(1-0.04)(1-0.03)(1-0.03)(1-0.03)(1-0.03)(1-0.02)(1-0.04)
The number of Leblond lathes required to do the facing operation per day are calculated
next as follows.
1 min/part x 1264 parts F = ------------------------------------------ = 0.93 lathes per day 100% x 1440 min/day x 0.93

47
The next step is to determine the n’, which is the assignment of operators to the
machines. The values for loading and unloading time for the Leblond lathe are obtained
from Table 3.3, the value for independent machine activity time (t) for the Leblond lathe
is calculated using the details from Table 3.1 and the operator activity time (b) is taken as
1 minute. Using this data of loading and unloading time, machine activity time and
independent operator time, the n’ for this operation is.
a + b (0.1+0.1)+1 n’ = ------- = ------------------ = 1 a + t (0.1+0.1)+1
This indicates that there will be no machine or operator idle time if one operator is
assigned to one machine. However, this is not a normal scenario as often, the n’ is a
decimal value and the decision to round up or round down the n’ value is based on the
lowest cost, for which the procedure to calculate is given below.
As stated earlier, if m is the number of machines assigned to an operator, then if m<n’,
the operator is idle and if m>n’, then the machine is idle. Hence in order to balance this,
the following formulation is arrived in [3] to determine the cost of the unit produced:
(C1 + mC2)(a + t) TC(m) = ------------------------ when m<n’ m
TC(m) = (C1 + mC2)(a + b) when m>n’
In the research, values for number of machines of similar machines are grouped together
and their n’ are added. For the Leblond lathe, the combined value for the number of
machines is 1.31 and the combined value of n’ for Leblond lathes is 1.51. The number of
Leblond lathes is rounded up to 2. The number of machines per operator is decided based
on the assignment that results in the lowest cost. For the Leblond lathe, the number of
machines per operator can be either one machine per operator or two machines per
operator. The assignment is decided using the formula given above.
If one machine is assigned per operator, the activity cost of the product is
($25/hr + 1 x $12/hr)((0.1+0.1) + 1) TC(1) = ---------------------------------------------- = $0.74 1 x 60 min/hr

48
If two machines are assigned to each operator, the activity cost of the product is
($25/hr + 2 x $12/hr)((0.1+0.1) + 1) TC(2) = ---------------------------------------------- = $0.98 60 min/hr
Since the cost of assigning one machine per operator is less than assigning two machines
per operator, one machine is assigned per operator. Similar calculations are done for all
the different parts, operations and machines and the total number of different types of
machines and operators for them are calculated. The total activity cost of the product is
arrived by adding the activity cost for each of the different types of machines. Finally, the
area required to accommodate these calculated machines and operators using the values
defined earlier. The facility is divided into six different departments by grouping the
same type of machines. The details calculated values of machines, operators, are show
below in Tables 3.5 and the Appendix gives the complete details on the process
parameters, machines and operation sequence.
Table 3.5 Calculation of Total Space
As shown in the table above, considering the given parameters, the total space
required for the facility in order to manufacture the Powerarm [22] is 3424 sq. feet. Since
there are many process parameters involved in the manufacture of the Powerarm [22], it
is important to determine the manufacturing parameters that are of importance and have
an impact on the facility layout. In order to determine the relationship between these
manufacturing parameters and facility layout, each of these parameters were considered
one at a time and varied keeping the other parameters constant. The results obtained and
their impact on the facility layout and the activity cost of the product are explained
below.
3022
336460
342410.27
Total Machine and Operator Space (Sq.ft)Plant Services (Sq.ft)
Total Space (Sq.ft)Machine and Operator Activity Cost ($)
FINAL CALCULATIONSTotal Number of MachinesTotal Number of Operators

49
3.4.2 Effect of Scrap Rate
Scrap rate is one of the most important manufacturing parameters and needs to be
carefully evaluated and studied. Small changes in scrap rate can have adverse effects on
the other parameters involved in the manufacturing process. In our analysis, scrap rate
was varied in steps of 5% and the effect of this variation on the other parameters was
noted. It was observed that as the scrap rate was increased, the facility size also increased
proportionately. The number of machines and operators also increased as the scrap rate
increased. The cost of the product though remained constant because the cost considered
in the research is only the operator and machine activity cost. This activity cost does not
take into account the material cost and other related manufacturing cost. Also, the scrap
rate is independent of operator and machine cost. Hence, even though the number of
machines and operators change, the machine and operator activity cost remains the same.
The changes incurred in the area, number of machines and number of operators are
shown in the table and the details of this variation are given in the table below.
Table 3.6 Effect of Scrap Rate
Scrap Rate Area (sft)Number of Machines
Machine and Operator
Activity CostOperator
% change in Area
% change in
machines
% change in cost
% change in
operators
-50% 3139 28 10.27$ 20 -8.32% -6.67% 0.00% -9.09%-45% 3270 29 10.27$ 20 -4.50% -3.33% 0.00% -9.09%-40% 3270 29 10.27$ 20 -4.50% -3.33% 0.00% -9.09%-35% 3272 29 10.27$ 21 -4.44% -3.33% 0.00% -4.55%-30% 3272 29 10.27$ 21 -4.44% -3.33% 0.00% -4.55%-25% 3272 29 10.27$ 21 -4.44% -3.33% 0.00% -4.55%-20% 3272 29 10.27$ 21 -4.44% -3.33% 0.00% -4.55%-15% 3272 29 10.27$ 21 -4.44% -3.33% 0.00% -4.55%-10% 3272 29 10.27$ 21 -4.44% -3.33% 0.00% -4.55%-5% 3424 30 10.27$ 22 0.00% 0.00% 0.00% 0.00%5% 3424 30 10.27$ 22 0.00% 0.00% 0.00% 0.00%10% 3424 30 10.27$ 22 0.00% 0% 0% 0%15% 3424 30 10.27$ 22 0.00% 0% 0% 0%20% 3424 30 10.27$ 22 0.00% 0% 0% 0%25% 3426 30 10.27$ 23 0.06% 0% 0% 5%30% 3559 31 10.27$ 23 3.94% 3% 0% 5%35% 3559 31 10.27$ 23 3.94% 3% 0% 5%40% 3559 31 10.27$ 23 3.94% 3% 0% 5%45% 3659 32 10.27$ 23 6.86% 7% 0% 5%50% 3659 32 10.27$ 23 6.86% 7% 0% 5%
EFFECT OF SCRAP RATE

50
Table 3.6 above indicates that scrap rate has a strong influence on the facility design
changing the facility size, number of machines and the operators. The lower the scrap
rate, the lesser area is required because of lesser number of machines and operators
required to manufacture the Powerarm [22]. Table 3.6 shows when the scrap rate is
reduced by 50%, the number of machines and operators required to manufacture the
Powerarms [22] is the lowest and the highest when the scrap rate is increased by 50%.
3.4.3 Effect of Reliability of Machines
The next parameter considered for the analysis was the reliability of the machines used in
the manufacture of the Powerarm [22]. The reliability values for the different types of
machines used have been defined earlier. In order to study the effects of change in
reliability values on the facility layout, its values were reduced by 50% in steps of 5%. It
was seen that as the reliability was reduced, the area required for the facility increased
and so did the number of machines required and the operators required. There was no
change in the activity cost for changes in the reliability values because as mentioned
earlier, the cost calculated is only the machine and operator activity cost and change in
reliability of the machine does not have any impact on the activity cost of the product.
Also, reliability values are independent of machine and operator activity cost, hence
change in reliability values does not result in changes in the activity cost. Table 3.7
shows this analysis for the different reliability values in detail.
Table 3.7 Effect of Reliability of Machines
Reliability Area (Sft)Number of Machines
Machine and Operator
Activity CostOperator
% change in Area
% change in
machines
% change in cost
% change in
operators
-50.00% 6373 53 10.27$ 38 86.13% 77% 0% 73%-45.00% 5826 49 10.27$ 34 70.15% 63% 0% 55%-40.00% 5269 45 10.27$ 31 53.88% 50% 0% 41%-35.00% 5023 43 10.27$ 29 46.70% 43% 0% 32%-30.00% 4645 40 10.27$ 28 35.66% 33% 0% 27%-25.00% 4285 37 10.27$ 26 25.15% 23% 0% 18%-20.00% 4021 35 10.27$ 25 17.44% 17% 0% 14%-15.00% 3789 33 10.27$ 23 10.66% 10% 0% 5%-10.00% 3659 32 10.27$ 23 6.86% 7% 0% 5%-5.00% 3424 30 10.27$ 22 0.00% 0% 0% 0%
EFFECT OF RELIABILITY OF MACHINES
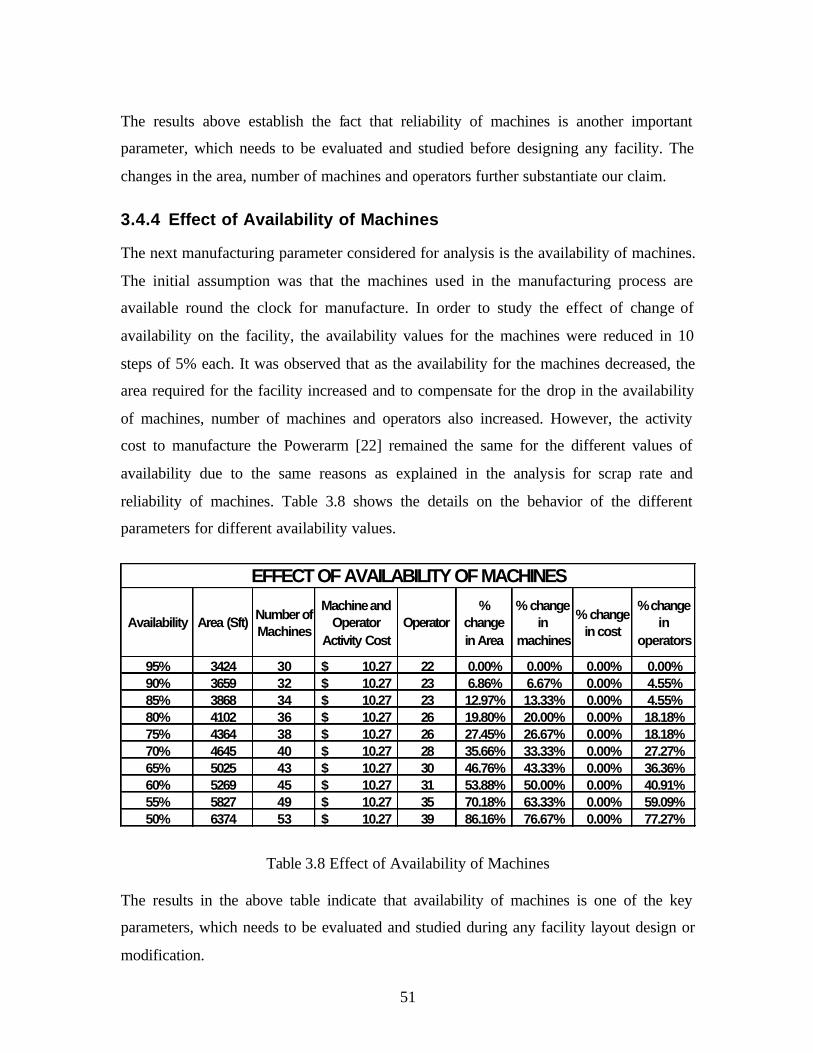
51
The results above establish the fact that reliability of machines is another important
parameter, which needs to be evaluated and studied before designing any facility. The
changes in the area, number of machines and operators further substantiate our claim.
3.4.4 Effect of Availability of Machines
The next manufacturing parameter considered for analysis is the availability of machines.
The initial assumption was that the machines used in the manufacturing process are
available round the clock for manufacture. In order to study the effect of change of
availability on the facility, the availability values for the machines were reduced in 10
steps of 5% each. It was observed that as the availability for the machines decreased, the
area required for the facility increased and to compensate for the drop in the availability
of machines, number of machines and operators also increased. However, the activity
cost to manufacture the Powerarm [22] remained the same for the different values of
availability due to the same reasons as explained in the analysis for scrap rate and
reliability of machines. Table 3.8 shows the details on the behavior of the different
parameters for different availability values.
Table 3.8 Effect of Availability of Machines The results in the above table indicate that availability of machines is one of the key
parameters, which needs to be evaluated and studied during any facility layout design or
modification.
Availability Area (Sft) Number of Machines
Machine and Operator
Activity CostOperator
% change in Area
% change in
machines
% change in cost
% change in
operators
95% 3424 30 10.27$ 22 0.00% 0.00% 0.00% 0.00%90% 3659 32 10.27$ 23 6.86% 6.67% 0.00% 4.55%85% 3868 34 10.27$ 23 12.97% 13.33% 0.00% 4.55%80% 4102 36 10.27$ 26 19.80% 20.00% 0.00% 18.18%75% 4364 38 10.27$ 26 27.45% 26.67% 0.00% 18.18%70% 4645 40 10.27$ 28 35.66% 33.33% 0.00% 27.27%65% 5025 43 10.27$ 30 46.76% 43.33% 0.00% 36.36%60% 5269 45 10.27$ 31 53.88% 50.00% 0.00% 40.91%55% 5827 49 10.27$ 35 70.18% 63.33% 0.00% 59.09%50% 6374 53 10.27$ 39 86.16% 76.67% 0.00% 77.27%
EFFECT OF AVAILABILITY OF MACHINES

52
3.4.5 Effect of Loading and Unloading Time
The last parameter considered for our analysis was the loading and unloading time. The
loading and unloading times for each of the machines involved in the manufacture of the
Powerarm [22] were given earlier. It was observed that changes in this manufacturing
parameter did not result in any changes in the area of the facility, the number of machines
required or operators needed to operate these machines. However, as the loading and
unloading time was decreased, the machine and operator activity cost of the product
being manufactured also decreased and increased when the loading and unloading time
increased. This is because, as the loading and unloading time changes, the amount of
work done by the operator also changes, resulting in increase or decrease in the operator
activity cost. Hence whenever the value for loading and unloading time changes, the
activity cost of the product also changes as the cost considered in the research is only the
machine and operator activity cost. Table 3.9 below gives the details on the changes in
the cost of the product with respect to changes in the loading and unloading time.
Table 3.9 Effect of Loading and Unloading time The results in the table above indicate that loading and unloading time also affects the
facility design and has direct implication on the activity cost of the product being
manufactured.
Loading / Unloading
timeArea (sft)
Number of Machines
Machine and Operator
Activity CostOperator
% change in Area
% change in
machines
% change in cost
% change in
operators
-25.00% 3424 30 9.21$ 22 0.00% 0.00% -10.33% 0.00%-20.00% 3424 30 9.42$ 22 0.00% 0.00% -8.26% 0.00%-15.00% 3424 30 9.63$ 22 0.00% 0.00% -6.20% 0.00%-10.00% 3424 30 9.86$ 22 0.00% 0.00% -4.04% 0.00%-5.00% 3424 30 10.06$ 22 0.00% 0.00% -2.07% 0.00%5.00% 3424 30 10.48$ 22 0.00% 0.00% 2.06% 0.00%10.00% 3424 30 10.59$ 22 0.00% 0.00% 3.09% 0.00%15.00% 3424 30 10.91$ 22 0.00% 0.00% 6.19% 0.00%20.00% 3424 30 11.12$ 22 0.00% 0.00% 8.25% 0.00%25.00% 3424 30 11.33$ 22 0.00% 0.00% 10.32% 0.00%
EFFECT OF CHANGE IN LOADING/UNLOADING TIME
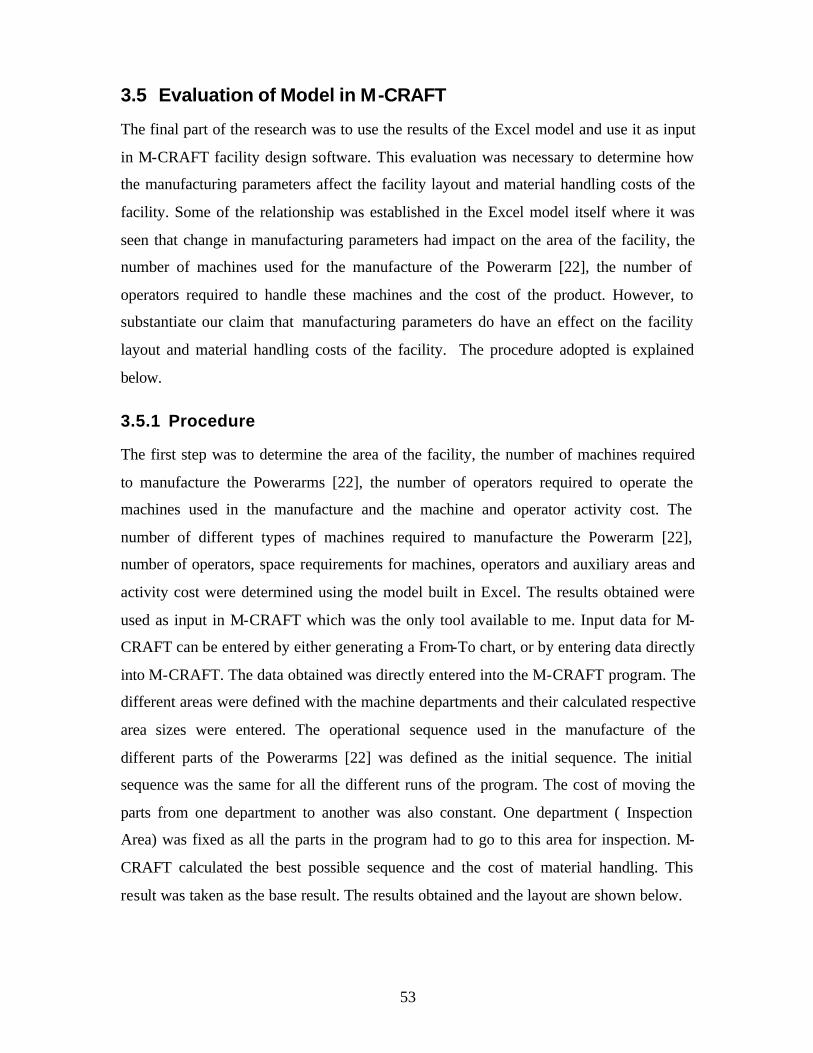
53
3.5 Evaluation of Model in M-CRAFT
The final part of the research was to use the results of the Excel model and use it as input
in M-CRAFT facility design software. This evaluation was necessary to determine how
the manufacturing parameters affect the facility layout and material handling costs of the
facility. Some of the relationship was established in the Excel model itself where it was
seen that change in manufacturing parameters had impact on the area of the facility, the
number of machines used for the manufacture of the Powerarm [22], the number of
operators required to handle these machines and the cost of the product. However, to
substantiate our claim that manufacturing parameters do have an effect on the facility
layout and material handling costs of the facility. The procedure adopted is explained
below.
3.5.1 Procedure
The first step was to determine the area of the facility, the number of machines required
to manufacture the Powerarms [22], the number of operators required to operate the
machines used in the manufacture and the machine and operator activity cost. The
number of different types of machines required to manufacture the Powerarm [22],
number of operators, space requirements for machines, operators and auxiliary areas and
activity cost were determined using the model built in Excel. The results obtained were
used as input in M-CRAFT which was the only tool available to me. Input data for M-
CRAFT can be entered by either generating a From-To chart, or by entering data directly
into M-CRAFT. The data obtained was directly entered into the M-CRAFT program. The
different areas were defined with the machine departments and their calculated respective
area sizes were entered. The operational sequence used in the manufacture of the
different parts of the Powerarms [22] was defined as the initial sequence. The initial
sequence was the same for all the different runs of the program. The cost of moving the
parts from one department to another was also constant. One department ( Inspection
Area) was fixed as all the parts in the program had to go to this area for inspection. M-
CRAFT calculated the best possible sequence and the cost of material handling. This
result was taken as the base result. The results obtained and the layout are shown below.

54
Figure 3.2 Initial input sequence in M-CRAFT
Figure 3.3 Final Layout obtained in M-CRAFT
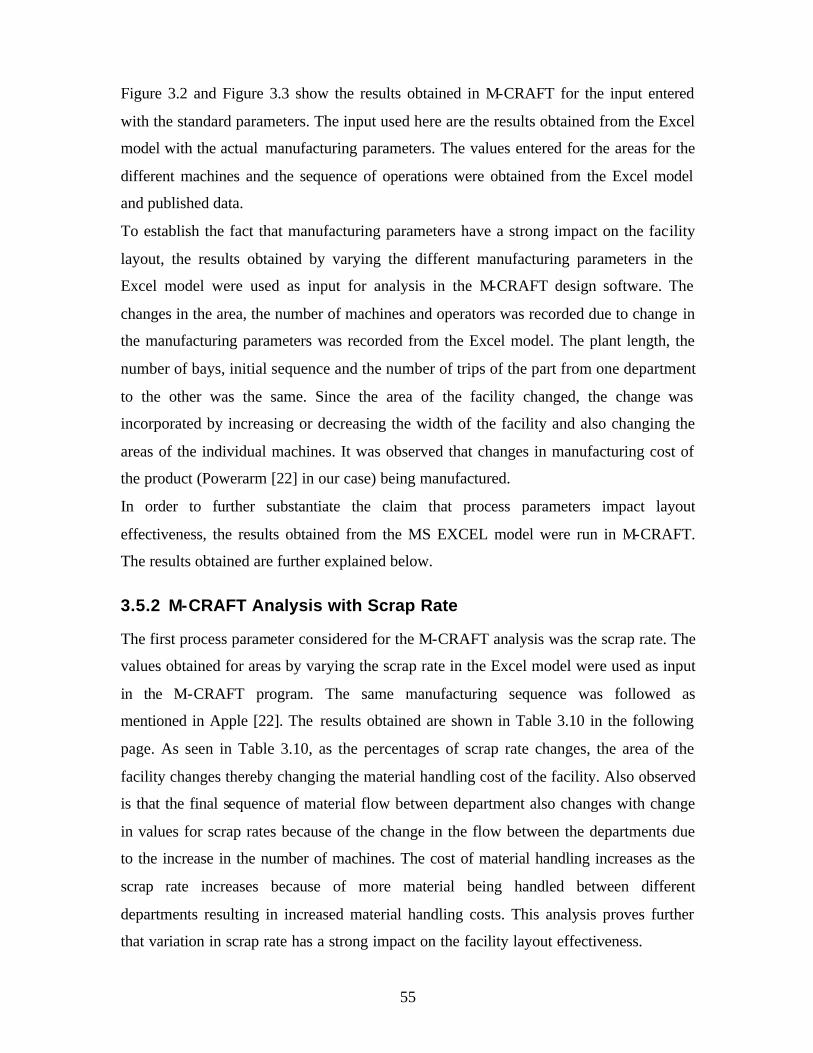
55
Figure 3.2 and Figure 3.3 show the results obtained in M-CRAFT for the input entered
with the standard parameters. The input used here are the results obtained from the Excel
model with the actual manufacturing parameters. The values entered for the areas for the
different machines and the sequence of operations were obtained from the Excel model
and published data.
To establish the fact that manufacturing parameters have a strong impact on the facility
layout, the results obtained by varying the different manufacturing parameters in the
Excel model were used as input for analysis in the M-CRAFT design software. The
changes in the area, the number of machines and operators was recorded due to change in
the manufacturing parameters was recorded from the Excel model. The plant length, the
number of bays, initial sequence and the number of trips of the part from one department
to the other was the same. Since the area of the facility changed, the change was
incorporated by increasing or decreasing the width of the facility and also changing the
areas of the individual machines. It was observed that changes in manufacturing cost of
the product (Powerarm [22] in our case) being manufactured.
In order to further substantiate the claim that process parameters impact layout
effectiveness, the results obtained from the MS EXCEL model were run in M-CRAFT.
The results obtained are further explained below.
3.5.2 M-CRAFT Analysis with Scrap Rate
The first process parameter considered for the M-CRAFT analysis was the scrap rate. The
values obtained for areas by varying the scrap rate in the Excel model were used as input
in the M-CRAFT program. The same manufacturing sequence was followed as
mentioned in Apple [22]. The results obtained are shown in Table 3.10 in the following
page. As seen in Table 3.10, as the percentages of scrap rate changes, the area of the
facility changes thereby changing the material handling cost of the facility. Also observed
is that the final sequence of material flow between department also changes with change
in values for scrap rates because of the change in the flow between the departments due
to the increase in the number of machines. The cost of material handling increases as the
scrap rate increases because of more material being handled between different
departments resulting in increased material handling costs. This analysis proves further
that variation in scrap rate has a strong impact on the facility layout effectiveness.

56
Table 3.10 M-CRAFT Results on Change of Scrap Rate
3.5.3 M-CRAFT Analysis with Reliability of Machines
The next process parameter considered for the M-CRAFT analysis was the reliability of
machines. The values obtained for areas by varying the machine reliability values in the
Excel model were used as input in the M-CRAFT program. The same manufacturing
sequence was followed as mentioned in Apple [22]. The results obtained are shown in
Table 3.12 below.
Table 3.11 M-CRAFT Results on Reliability Values of Machines
Scrap Rate Initial Sequence Final SequenceMaterial Handling
CostArea (sft)
-50% 1-2-3-4-5-6 1-2-4-3-5-6 3,465.91$ 64 x 49-40% 1-2-3-4-5-6 1-2-4-3-5-6 $ 3,686.09 64 x 51.1-30% 1-2-3-4-5-6 1-2-4-3-5-6 $ 3,731.16 64 x 51.1-20% 1-2-3-4-5-6 1-2-4-3-5-6 $ 3,756.07 64 x 51.1-10% 1-2-3-4-5-6 1-2-4-3-5-6 $ 3,783.56 64 x 51.110% 1-2-3-4-5-6 1-2-3-6-5-4 $ 3,825.11 64 x 53.520% 1-2-3-4-5-6 1-2-3-6-5-4 $ 3,872.41 64 x 53.530% 1-2-3-4-5-6 1-2-3-6-5-4 $ 4,077.65 64 x 55.640% 1-2-3-4-5-6 1-2-3-6-5-4 $ 4,148.22 64 x 55.650% 1-2-3-4-5-6 1-2-3-6-5-4 $ 4,167.92 64 x 57.15
M-CRAFT RESULTS ON CHANGE OF SCRAP RATE
Reliability Initial Sequence Final SequenceMaterial Handling
CostArea (sft)
-50% 1-2-3-4-5-6 1-2-3-6-5-4 5,208.11$ 64 x 99.6-45% 1-2-3-4-5-6 1-2-3-6-5-4 $ 4,819.68 64 x 91-40% 1-2-3-4-5-6 1-2-3-6-5-4 $ 4,697.19 64 x 82.33-35% 1-2-3-4-5-6 1-2-3-6-5-4 $ 4,532.78 64 x 78.5-30% 1-2-3-4-5-6 1-2-3-6-5-4 $ 4,232.73 64 x 72.6-25% 1-2-3-4-5-6 1-2-3-6-5-4 4,116.57$ 64 x 66.95-20% 1-2-3-4-5-6 1-2-3-6-5-4 $ 4,034.10 64 x 62.83-15% 1-2-3-4-5-6 1-2-3-6-5-4 $ 3,949.71 64 x 59.2-10% 1-2-3-4-5-6 1-2-3-6-5-4 $ 3,908.29 64 x 57.2-5% 1-2-3-4-5-6 1-2-3-6-5-4 $ 3,780.23 64 x 53.5
M-CRAFT RESULTS ON CHANGE OF MACHINE RELIABILITY
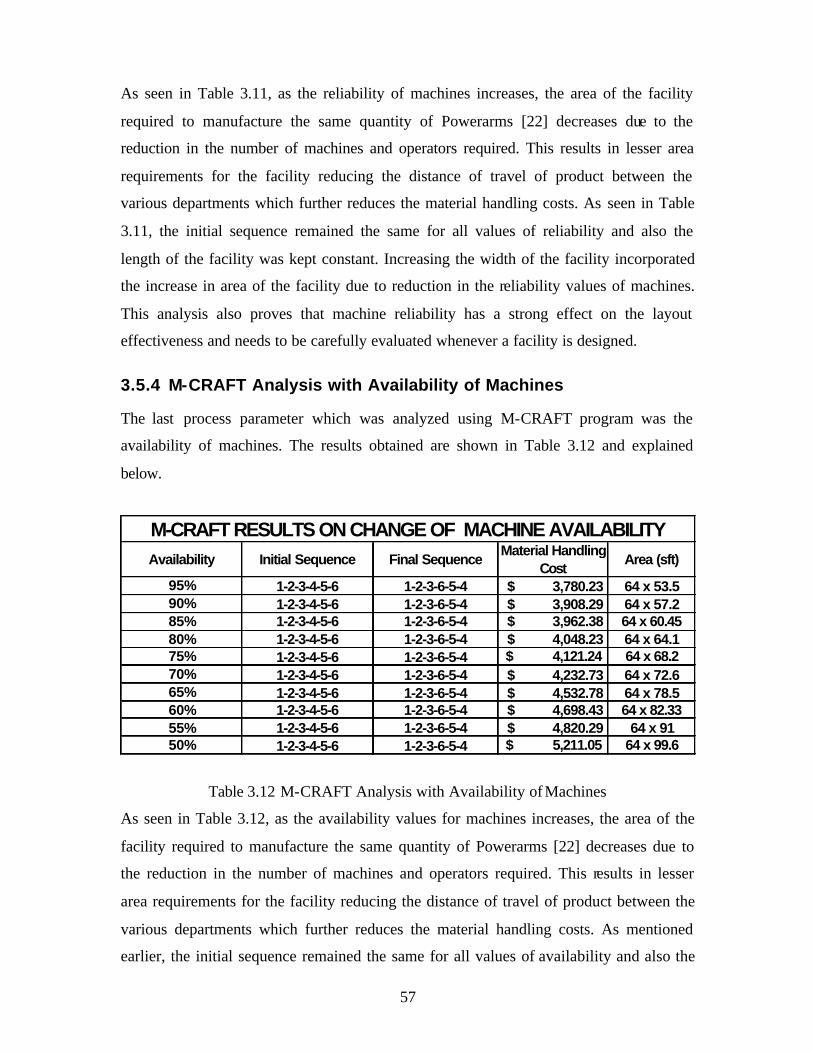
57
As seen in Table 3.11, as the reliability of machines increases, the area of the facility
required to manufacture the same quantity of Powerarms [22] decreases due to the
reduction in the number of machines and operators required. This results in lesser area
requirements for the facility reducing the distance of travel of product between the
various departments which further reduces the material handling costs. As seen in Table
3.11, the initial sequence remained the same for all values of reliability and also the
length of the facility was kept constant. Increasing the width of the facility incorporated
the increase in area of the facility due to reduction in the reliability values of machines.
This analysis also proves that machine reliability has a strong effect on the layout
effectiveness and needs to be carefully evaluated whenever a facility is designed.
3.5.4 M-CRAFT Analysis with Availability of Machines
The last process parameter which was analyzed using M-CRAFT program was the
availability of machines. The results obtained are shown in Table 3.12 and explained
below.
Table 3.12 M-CRAFT Analysis with Availability of Machines
As seen in Table 3.12, as the availability values for machines increases, the area of the
facility required to manufacture the same quantity of Powerarms [22] decreases due to
the reduction in the number of machines and operators required. This results in lesser
area requirements for the facility reducing the distance of travel of product between the
various departments which further reduces the material handling costs. As mentioned
earlier, the initial sequence remained the same for all values of availability and also the
Availability Initial Sequence Final SequenceMaterial Handling
CostArea (sft)
95% 1-2-3-4-5-6 1-2-3-6-5-4 $ 3,780.23 64 x 53.590% 1-2-3-4-5-6 1-2-3-6-5-4 $ 3,908.29 64 x 57.285% 1-2-3-4-5-6 1-2-3-6-5-4 $ 3,962.38 64 x 60.4580% 1-2-3-4-5-6 1-2-3-6-5-4 $ 4,048.23 64 x 64.175% 1-2-3-4-5-6 1-2-3-6-5-4 4,121.24$ 64 x 68.270% 1-2-3-4-5-6 1-2-3-6-5-4 $ 4,232.73 64 x 72.665% 1-2-3-4-5-6 1-2-3-6-5-4 $ 4,532.78 64 x 78.560% 1-2-3-4-5-6 1-2-3-6-5-4 $ 4,698.43 64 x 82.3355% 1-2-3-4-5-6 1-2-3-6-5-4 $ 4,820.29 64 x 9150% 1-2-3-4-5-6 1-2-3-6-5-4 5,211.05$ 64 x 99.6
M-CRAFT RESULTS ON CHANGE OF MACHINE AVAILABILITY

58
length of the facility was kept constant. Increasing the width of the facility incorporated
the increase in area of the facility due to reduction in the availability values of machines.
This analysis proves that machine availability also has a strong effect on the layout
effectiveness and needs to be carefully evaluated whenever a facility is designed.
3.6 Sensitivity Analysis
The next step was to do sensitivity analysis by comparing each of the parameters with
respect to the cost of the product, the area of the facility under consideration, number of
machines and the number of operators and see changes in their behavior with changes
made in these parameters. In order to establish the relationships between the different
parameters, graphs were plotted in Microsoft Excel to see the changes and results. Some
of these graphs plotted have been given below and explained.
3.6.1 Sensitivity Analysis with Scrap rate The first process parameter considered for the sensitivity analysis was the scrap rate for
the different machines used in the manufacture of the Powerarm [22]. As explained in the
earlier sections, variation in scrap rate has a large impact on the layout effectiveness
which is further substantiated by performing this sensitivity analysis.
Figure 3.4 Number of Machines Vs % Change in Scrap Rate
Number of Machines Vs Scrap Rate (%)
26
27
28
29
30
31
32
33
-50% -45% -40% -35% -30% -25% -20% -15% -10% -5% 5% 10% 15% 20% 25% 30% 35% 40% 45% 50%
Scrap Rate (%)
Num
ber
of M
achi
nes
Series11

59
As shown in Figure 3.4, as the scrap rate increases, the number of machines required to
manufacture the Powerarms [22] also increases. It is seen in Figure 3.4 that the number of
machines remains the same for certain percentages of scrap rate. Since the number of
machines are rounded up to the next higher value, it appears that the number of machines
remain the same for different values of scrap rate though in actual scenario, the number
of machines did change in decimal values for every change in the value of scrap rate.
Since the change in the number of machines is a decimal value and the machines are
being rounded to the next integer values, certain values of scrap rate have the same
number of machines. In an actual manufacturing scenario, where the product quantity is
large, smaller changes of scrap rate would result in large changes in the number of
machines.
The next analysis was done to see the effect change in scrap rate percentages on the
number of operators used in the manufacture of the Powerarm [22]. The results obtained
are shown in Figure 3.5 and explained below.
Figure 3.5 Number of Operators Vs % Change in Scrap Rate
Figure 3.5 shows the relationship between the number of operators and scrap rate
percentages. The number of operators required to manufacture the Powerarms [22]
Number of Operators Vs Scrap Rate (%)
18.5
19
19.5
20
20.5
21
21.5
22
22.5
23
23.5
-50% -45% -40% -35% -30% -25% -20% -15% -10% -5% 5% 10% 15% 20% 25% 30% 35% 40% 45% 50%
Scrap Rate (%)
Num
ber
of O
pera
tors
Series1
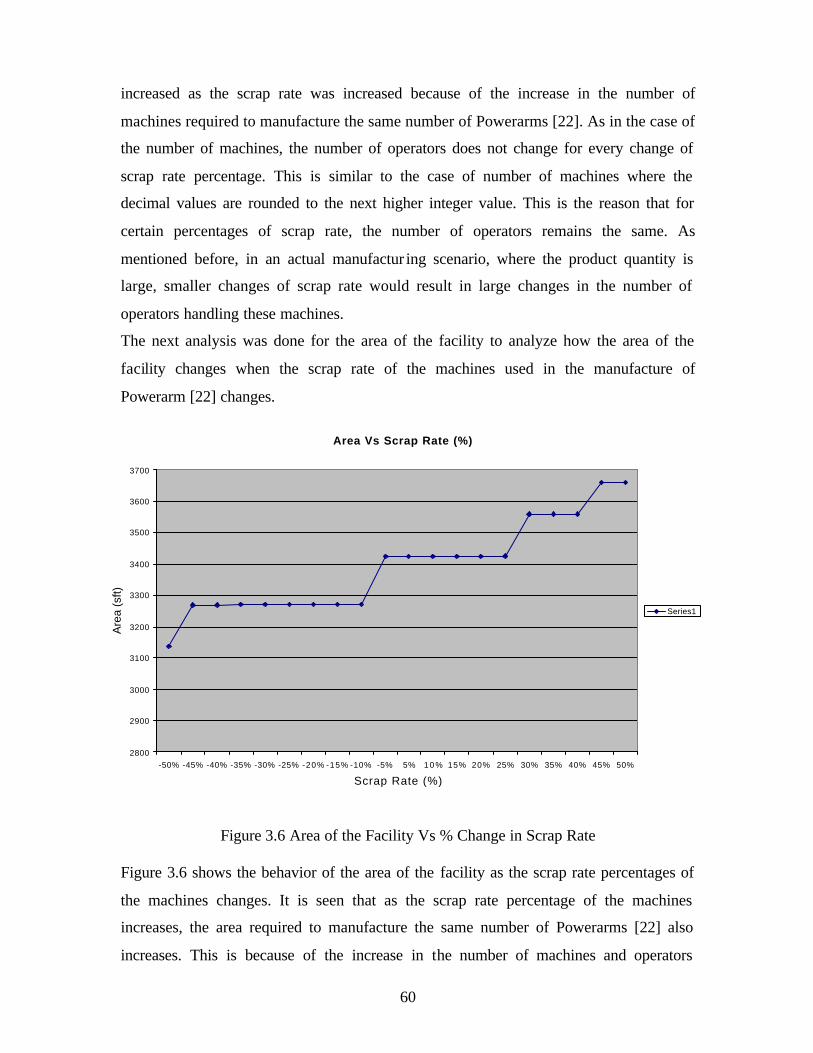
60
increased as the scrap rate was increased because of the increase in the number of
machines required to manufacture the same number of Powerarms [22]. As in the case of
the number of machines, the number of operators does not change for every change of
scrap rate percentage. This is similar to the case of number of machines where the
decimal values are rounded to the next higher integer value. This is the reason that for
certain percentages of scrap rate, the number of operators remains the same. As
mentioned before, in an actual manufactur ing scenario, where the product quantity is
large, smaller changes of scrap rate would result in large changes in the number of
operators handling these machines.
The next analysis was done for the area of the facility to analyze how the area of the
facility changes when the scrap rate of the machines used in the manufacture of
Powerarm [22] changes.
Figure 3.6 Area of the Facility Vs % Change in Scrap Rate Figure 3.6 shows the behavior of the area of the facility as the scrap rate percentages of
the machines changes. It is seen that as the scrap rate percentage of the machines
increases, the area required to manufacture the same number of Powerarms [22] also
increases. This is because of the increase in the number of machines and operators
Area Vs Scrap Rate (%)
2800
2900
3000
3100
3200
3300
3400
3500
3600
3700
-50% -45% -40% -35% -30% -25% -20% -15% -10% -5% 5% 1 0 % 15% 20% 25% 30% 35% 40% 45% 50%
Scrap Rate (%)
Are
a (s
ft)
Series1
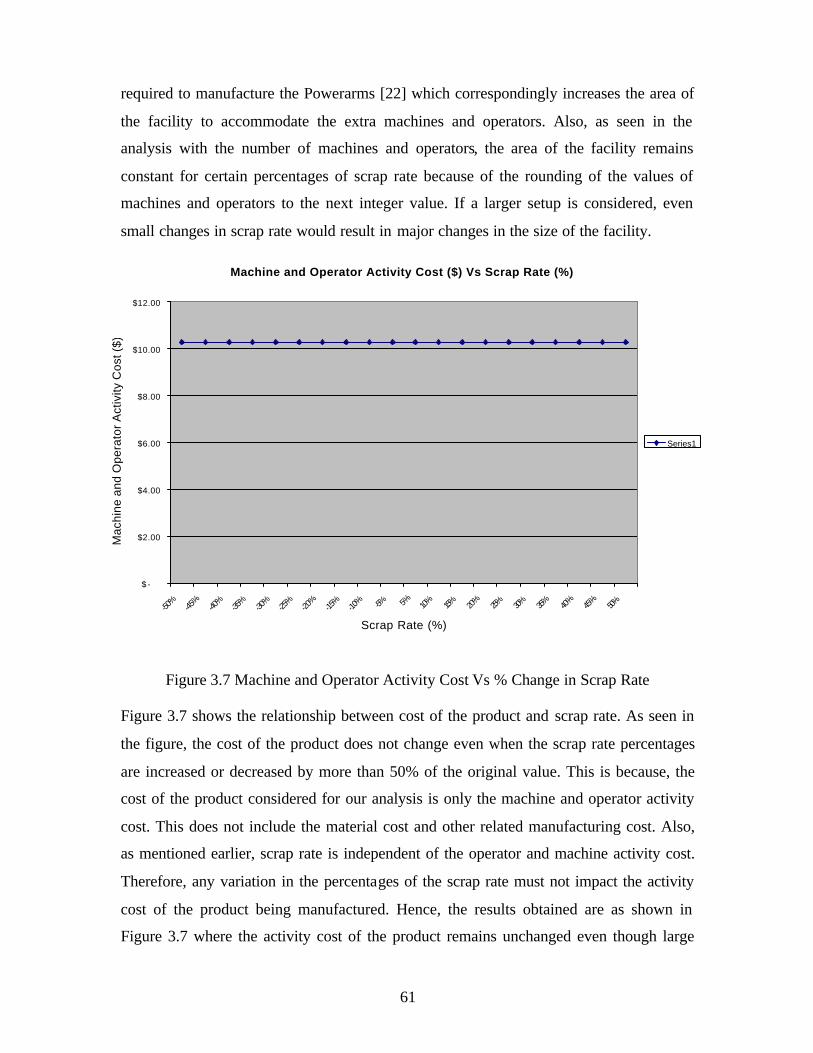
61
required to manufacture the Powerarms [22] which correspondingly increases the area of
the facility to accommodate the extra machines and operators. Also, as seen in the
analysis with the number of machines and operators, the area of the facility remains
constant for certain percentages of scrap rate because of the rounding of the values of
machines and operators to the next integer value. If a larger setup is considered, even
small changes in scrap rate would result in major changes in the size of the facility.
Figure 3.7 Machine and Operator Activity Cost Vs % Change in Scrap Rate Figure 3.7 shows the relationship between cost of the product and scrap rate. As seen in
the figure, the cost of the product does not change even when the scrap rate percentages
are increased or decreased by more than 50% of the original value. This is because, the
cost of the product considered for our analysis is only the machine and operator activity
cost. This does not include the material cost and other related manufacturing cost. Also,
as mentioned earlier, scrap rate is independent of the operator and machine activity cost.
Therefore, any variation in the percentages of the scrap rate must not impact the activity
cost of the product being manufactured. Hence, the results obtained are as shown in
Figure 3.7 where the activity cost of the product remains unchanged even though large
Machine and Operator Activity Cost ($) Vs Scrap Rate (%)
$ -
$2.00
$4.00
$6.00
$8.00
$10.00
$12.00
-50%
-45%
-40%
-35%
-30%
-25%
-20%
-15%
-10% -5% 5% 10% 15% 20
%25% 30% 35% 40
%45
%50%
Scrap Rate (%)
Mac
hine
and
Ope
rato
r Act
ivity
Cos
t ($)
Series1
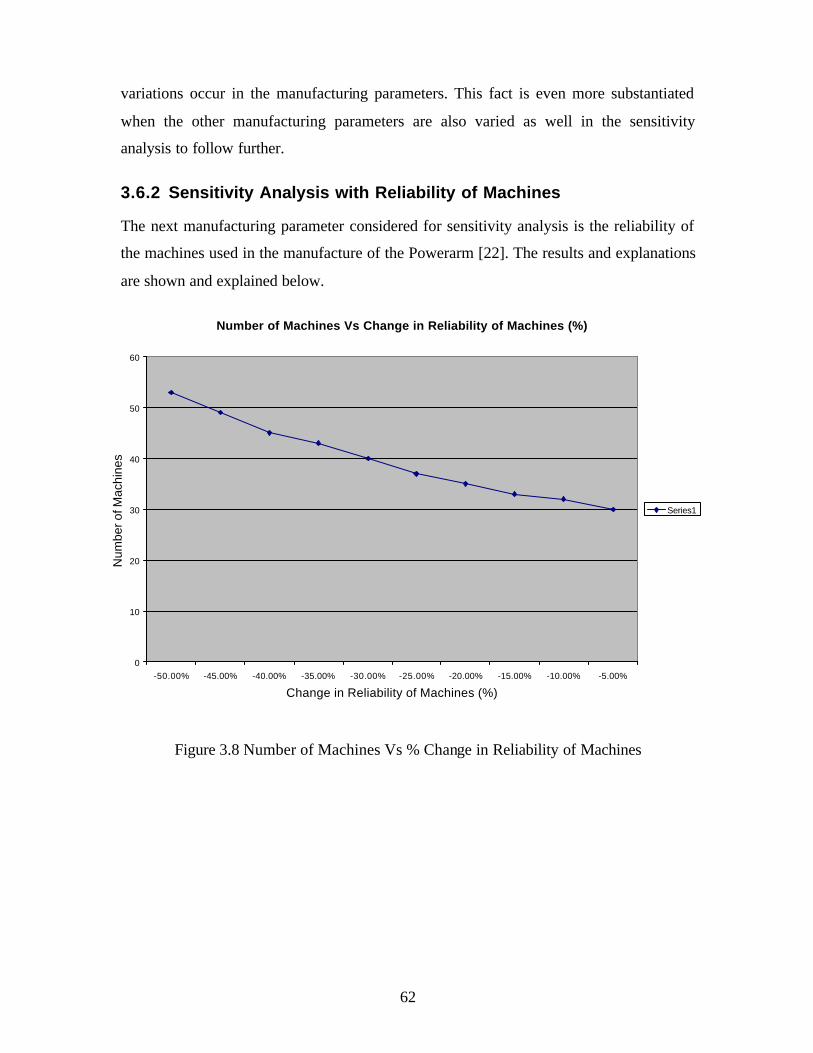
62
variations occur in the manufacturing parameters. This fact is even more substantiated
when the other manufacturing parameters are also varied as well in the sensitivity
analysis to follow further.
3.6.2 Sensitivity Analysis with Reliability of Machines
The next manufacturing parameter considered for sensitivity analysis is the reliability of
the machines used in the manufacture of the Powerarm [22]. The results and explanations
are shown and explained below.
Figure 3.8 Number of Machines Vs % Change in Reliability of Machines
Number of Machines Vs Change in Reliability of Machines (%)
0
10
20
30
40
50
60
-50.00% -45.00% -40.00% -35.00% -30.00% -25.00% -20.00% -15.00% -10.00% -5.00%
Change in Reliability of Machines (%)
Num
ber o
f Mac
hine
s
Series1

63
Figure 3.8 depicts that as the reliability of the machines decreases, the number of
machines required to manufacture the Powerarm [22] increases due to increase in number
of machines required to manufacture the same number of Powerarms [22].
Figure 3.9 Number of Operators Vs % Change in Reliability of Machines
Figure 3.9 shows the relationship between reliability of the machines used in the
manufacture of the Powerarm [22] and the number of operators operating these machines.
As explained earlier, the number of operators required to operate these machines
increases as the reliability of machines decreases due to increase in the number of
machines required to manufacture the same number of Powerarms [22].
Figure 3.10 Area of the Facility Vs % Change in Reliability of Machines
Number of Operators Vs Change in Reliability of Machines (%)
0
5
10
15
20
25
30
35
40
-50.00% -45.00% -40.00% -35.00% -30.00% -25.00% -20.00% -15.00% -10.00% -5.00%
Change in Reliabil i ty of Machines (%)
Num
ber
of O
pera
tors
Series1
A r e a ( s f t ) V s C h a n g e i n R e l i a b i l i t y o f M a c h i n e s ( % )
0
1 0 0 0
2 0 0 0
3 0 0 0
4 0 0 0
5 0 0 0
6 0 0 0
7 0 0 0
- 5 0 . 0 0 % - 4 5 . 0 0 % - 4 0 . 0 0 % - 3 5 . 0 0 % - 3 0 . 0 0 % - 2 5 . 0 0 % - 2 0 . 0 0 % - 1 5 . 0 0 % - 1 0 . 0 0 % - 5 . 0 0 %
C h a n g e i n R e l i a b i l i t y o f M a c h i n e s ( % )
Are
a (s
ft)
S e r i e s 1

64
Figure 3.10 shows the behavior of the area of the facility as the reliability percentages of
the machines changes. It is seen that as the machine reliability percentage decreases, the
area required to manufacture the same number of Powerarms [22] increases. This is
because of the increase in the number of machines and operators required to manufacture
the Powerarms [22], which correspondingly increases the area of the facility to
accommodate the extra machines, and operators.
The last parameter analyzed with the reliability of machines was the machine and
operator activity cost, the results for which are shown in Figure 3.11 and explained
below.
Figure 3.11Cost of the Product Vs % Change in the Reliability of Machines
The activity cost of the product does not change for change in values of reliability of
machines. This is because of the same reason explained earlier during the comparison of
scrap rate and cost of the product where we had stated that the costs considered are only
the operator and machine activity costs and hence reliability value change does not
impact these activity costs for the product being manufactured. Also, as mentioned earlier
in the analysis with scrap rate, reliability values of machines are also independent of the
operator and machine activity cost. Therefore, any variation in the reliability values must
Machine and Operator Activity Cost ($) Vs Change in Reliability of Machines (%)
$-
$2.00
$4.00
$6.00
$8.00
$10.00
$12.00
-50.00% -45.00% -40.00% -35.00% -30.00% -25.00% -20.00% -15.00% -10.00% -5.00%
Change in Reliability of Machines (%)
Mac
hine
and
Ope
rato
r Act
ivity
Cos
t ($)
Series1
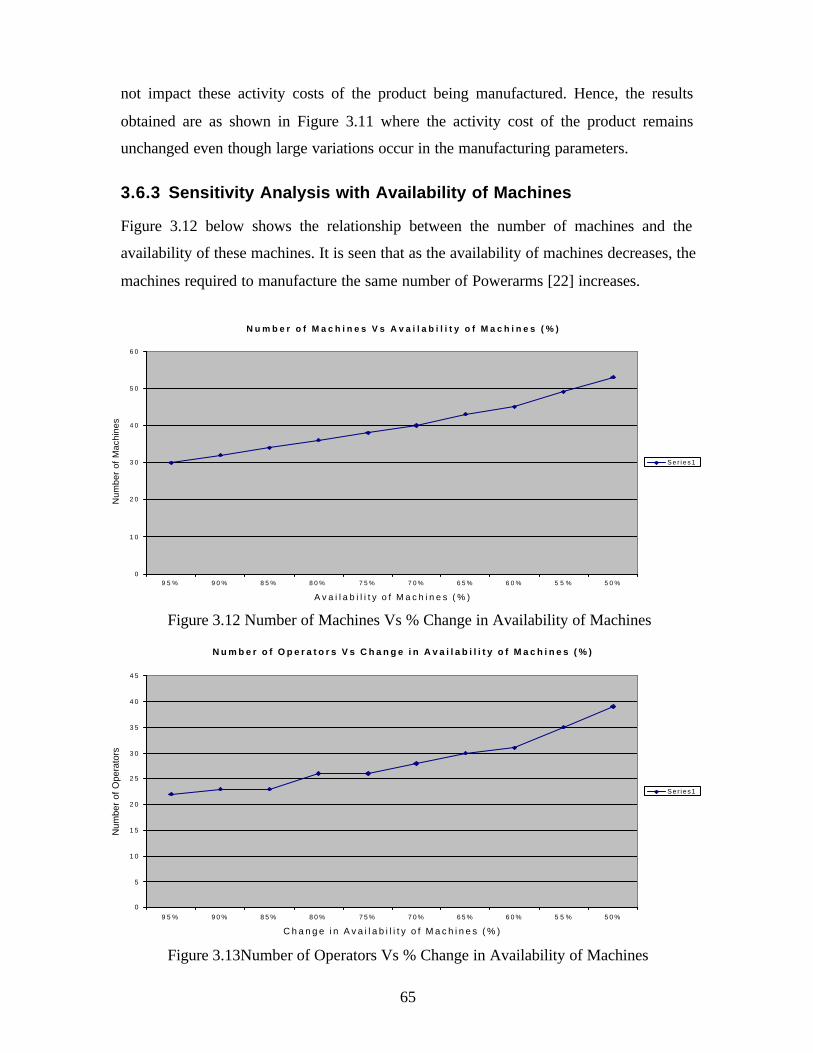
65
not impact these activity costs of the product being manufactured. Hence, the results
obtained are as shown in Figure 3.11 where the activity cost of the product remains
unchanged even though large variations occur in the manufacturing parameters.
3.6.3 Sensitivity Analysis with Availability of Machines
Figure 3.12 below shows the relationship between the number of machines and the
availability of these machines. It is seen that as the availability of machines decreases, the
machines required to manufacture the same number of Powerarms [22] increases.
Figure 3.12 Number of Machines Vs % Change in Availability of Machines
Figure 3.13Number of Operators Vs % Change in Availability of Machines
N u m b e r o f M a c h i n e s V s A v a i l a b i l i t y o f M a c h i n e s ( % )
0
1 0
2 0
3 0
4 0
5 0
6 0
9 5 % 9 0 % 8 5 % 8 0 % 7 5 % 7 0 % 6 5 % 6 0 % 5 5 % 5 0 %
A v a i l a b i l i t y o f M a c h i n e s ( % )
Num
ber
of M
achi
nes
S e r i e s 1
N u m b e r o f O p e r a t o r s V s C h a n g e i n A v a i l a b i l i t y o f M a c h i n e s ( % )
0
5
1 0
1 5
2 0
2 5
3 0
3 5
4 0
4 5
9 5 % 9 0 % 8 5 % 8 0 % 7 5 % 7 0 % 6 5 % 6 0 % 5 5 % 5 0 %
C h a n g e i n A v a i l a b i l i t y o f M a c h i n e s ( % )
Num
ber
of O
pera
tors
Ser ies1
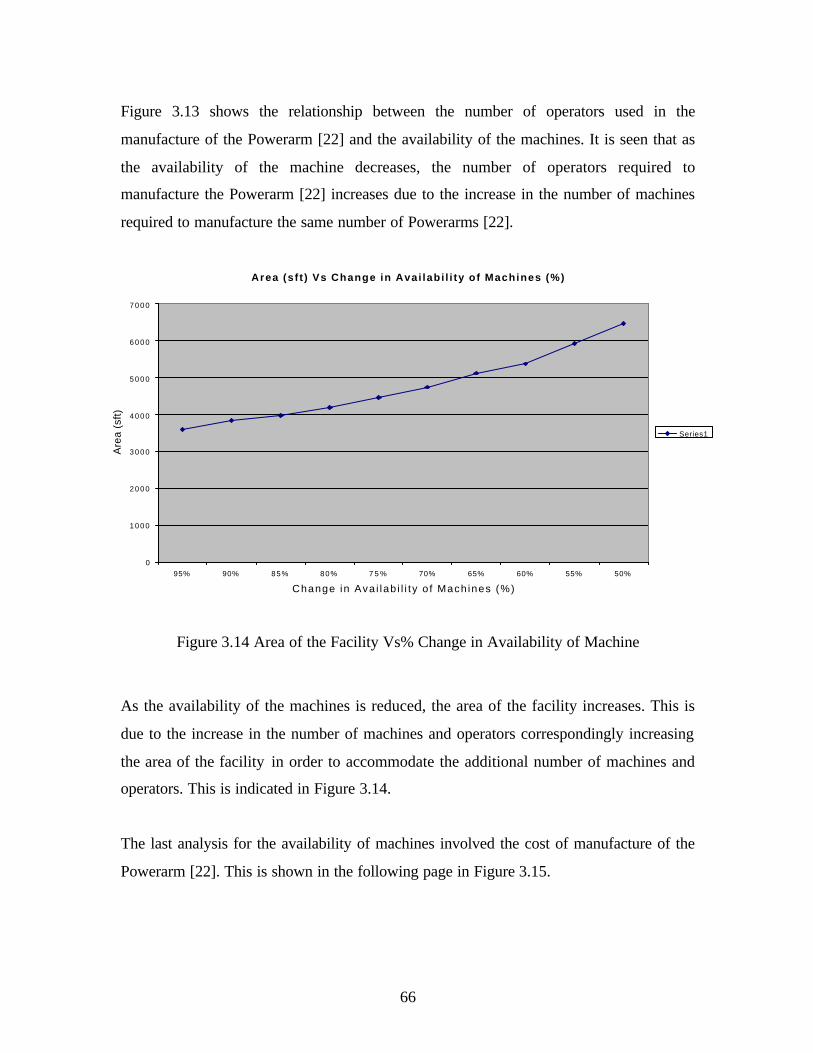
66
Figure 3.13 shows the relationship between the number of operators used in the
manufacture of the Powerarm [22] and the availability of the machines. It is seen that as
the availability of the machine decreases, the number of operators required to
manufacture the Powerarm [22] increases due to the increase in the number of machines
required to manufacture the same number of Powerarms [22].
Figure 3.14 Area of the Facility Vs% Change in Availability of Machine
As the availability of the machines is reduced, the area of the facility increases. This is
due to the increase in the number of machines and operators correspondingly increasing
the area of the facility in order to accommodate the additional number of machines and
operators. This is indicated in Figure 3.14.
The last analysis for the availability of machines involved the cost of manufacture of the
Powerarm [22]. This is shown in the following page in Figure 3.15.
Area (sf t ) Vs Change in Avai labi l i ty of Machines (%)
0
1 0 0 0
2 0 0 0
3 0 0 0
4 0 0 0
5 0 0 0
6 0 0 0
7 0 0 0
95% 90% 85% 80% 7 5 % 70% 65% 60% 55% 50%
Change in Ava i lab i l i t y o f Mach ines (%)
Are
a (s
ft)
Series1
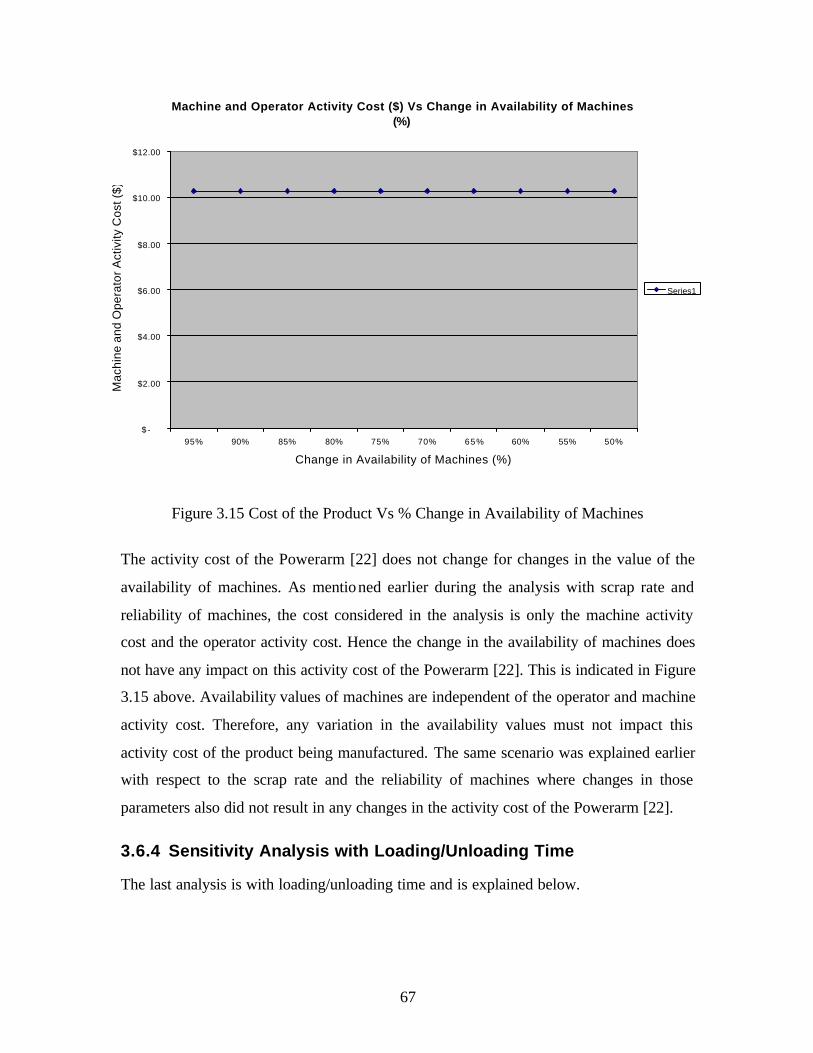
67
Figure 3.15 Cost of the Product Vs % Change in Availability of Machines
The activity cost of the Powerarm [22] does not change for changes in the value of the
availability of machines. As mentioned earlier during the analysis with scrap rate and
reliability of machines, the cost considered in the analysis is only the machine activity
cost and the operator activity cost. Hence the change in the availability of machines does
not have any impact on this activity cost of the Powerarm [22]. This is indicated in Figure
3.15 above. Availability values of machines are independent of the operator and machine
activity cost. Therefore, any variation in the availability values must not impact this
activity cost of the product being manufactured. The same scenario was explained earlier
with respect to the scrap rate and the reliability of machines where changes in those
parameters also did not result in any changes in the activity cost of the Powerarm [22].
3.6.4 Sensitivity Analysis with Loading/Unloading Time
The last analysis is with loading/unloading time and is explained below.
Machine and Operator Activity Cost ($) Vs Change in Availability of Machines (%)
$ -
$2.00
$4.00
$6.00
$8.00
$10.00
$12.00
95% 90% 85% 80% 75% 70% 65% 60% 55% 50%
Change in Availability of Machines (%)
Mac
hine
and
Ope
rato
r Act
ivity
Cos
t ($)
Series1

68
Figure 3.16 Area Vs % Change in Loading/Unloading Time of Machines The loading/unloading time does not have any impact on the area of the facility because
it increases the operator labor time and activity cost and hence there is no change in the
area for changes in loading/unloading time of machines, which is shown in Figure 3.16.
Figure 3.17 Number of Machines Vs% Change in Loading/Unloading Time
Area (S f t ) Vs Change in Load ing /Un load ing T ime (%)
0
5 0 0
1 0 0 0
1 5 0 0
2 0 0 0
2 5 0 0
3 0 0 0
3 5 0 0
4 0 0 0
-25 .00% -20.00% - 1 5 . 0 0 % -10.00% -5.00% 5 . 0 0 % 10.00% 1 5 . 0 0 % 20.00% 25.00%
Change i n Load ing /Un load ing T ime (%)
Are
a (S
ft)
Series1
N u m b e r o f M a c h i n e s V s C h a n g e i n L o a d i n g / U n l o a d i n g T i m e ( % )
0
5
1 0
1 5
2 0
2 5
3 0
3 5
- 2 5 . 0 0 % -20.00% - 1 5 . 0 0 % - 1 0 . 0 0 % - 5 . 0 0 % 5.00% 1 0 . 0 0 % 1 5 . 0 0 % 2 0 . 0 0 % 2 5 . 0 0 %
C h a n g e i n L o a d i n g / U n l o a d i n g T i m e ( % )
Num
ber
of M
achi
nes
Ser ies1
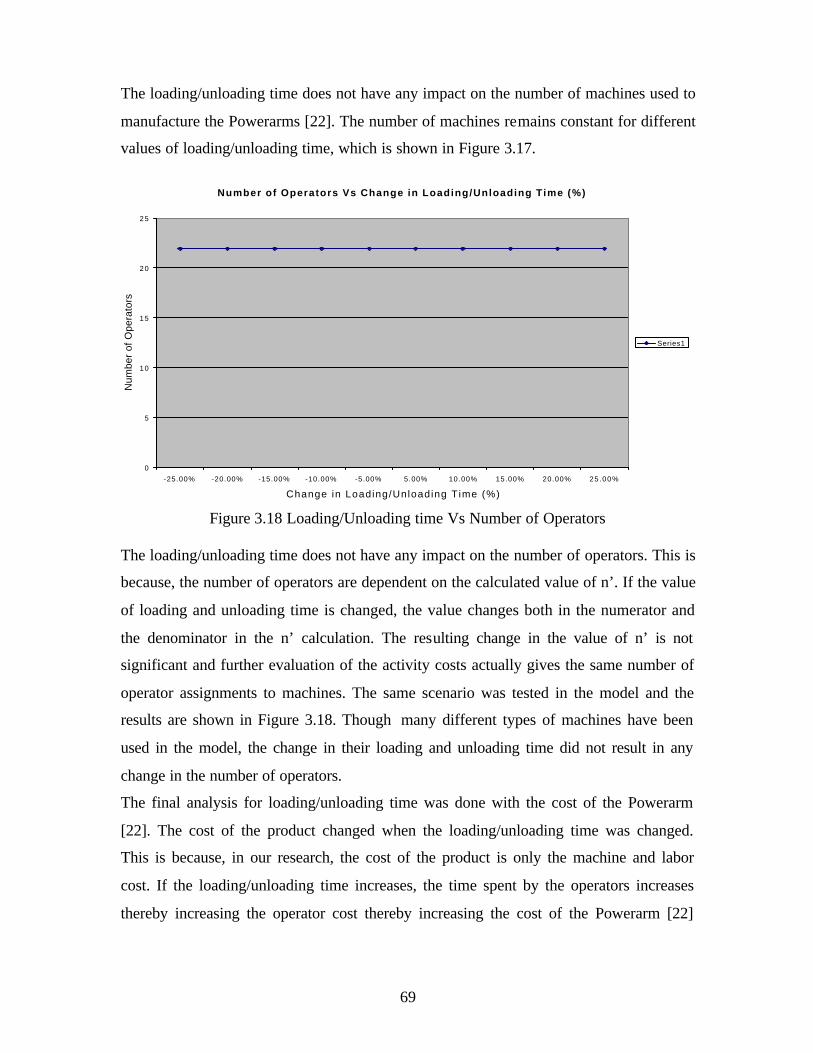
69
The loading/unloading time does not have any impact on the number of machines used to
manufacture the Powerarms [22]. The number of machines remains constant for different
values of loading/unloading time, which is shown in Figure 3.17.
Figure 3.18 Loading/Unloading time Vs Number of Operators The loading/unloading time does not have any impact on the number of operators. This is
because, the number of operators are dependent on the calculated value of n’. If the value
of loading and unloading time is changed, the value changes both in the numerator and
the denominator in the n’ calculation. The resulting change in the value of n’ is not
significant and further evaluation of the activity costs actually gives the same number of
operator assignments to machines. The same scenario was tested in the model and the
results are shown in Figure 3.18. Though many different types of machines have been
used in the model, the change in their loading and unloading time did not result in any
change in the number of operators.
The final analysis for loading/unloading time was done with the cost of the Powerarm
[22]. The cost of the product changed when the loading/unloading time was changed.
This is because, in our research, the cost of the product is only the machine and labor
cost. If the loading/unloading time increases, the time spent by the operators increases
thereby increasing the operator cost thereby increasing the cost of the Powerarm [22]
Number of Operators Vs Change in Loading/Unloading Time (%)
0
5
10
15
20
25
-25.00% -20.00% -15.00% -10.00% -5.00% 5.00% 10.00% 15.00% 20.00% 25.00%
Change in Loading/Unloading Time (%)
Num
ber
of O
pera
tors
Series1

70
being manufactured. This is further shown and explained in the graph on the following
page.
Figure 3.19 Cost of Product Vs % Change in Loading/Unloading Time The cost to manufacture the Powerarm [22] increases with increase in loading and
unloading time due to the increased operator cost associated with it. Increase in loading
and unloading time results in more time spent by the operator in setting up the machine
for manufacture resulting in higher operator cost thereby resulting in higher cost of the
product being manufactured. This is shown in Figure 3.19 above.
3.6.5 Sensitivity Analysis with M-CRAFT Results
The last part of the sensitivity analysis involved studying the results obtained using the
M-CRAFT facility design software for each of the process parameters studied earlier.
Scrap Rate, reliability of machines and availability of machines were each considered
individually and the impact of variation of these parameters on the material handling
costs is analyzed.
Figure 3.20 shows the analysis between scrap rate and material handling costs in the
facility. It is established that as the scrap rate of the product being manufactured
increases, the material handling costs also increase. This is because, as the scrap rate
Machine and Operator Act iv i ty Cost ($ ) Vs Change in Loading/Unloading Time (%)
$-
$ 2 . 0 0
$ 4 . 0 0
$ 6 . 0 0
$ 8 . 0 0
$ 1 0 . 0 0
$ 1 2 . 0 0
-25.00% -20.00% -15.00% -10.00% -5.00% 5.00% 10.00% 15.00% 20.00% 25.00%
Change in Load ing /Un load ing T ime (%)
Mac
hine
and
Ope
rato
r A
ctiv
ity C
ost (
$)
Ser ies1

71
increases, the area of the facility increases due to the increase in the number of machines
and operators. This results in larger distances of material handling between departments
resulting in higher handling costs. This is shown in Figure 3.20 below.
Figure 3.20 Material Handling Costs ($) by M-CRAFT Vs % Change in Scrap Rate
Figure 3.21 Material Handling Costs ($) by M-CRAFT Vs % Change in Reliability
Values of Machines
M-CRAFT Analysis wi th Scrap Rate
$ -
$ 5 0 0 . 0 0
$1 ,000 .00
$1 ,500 .00
$2 ,000 .00
$2 ,500 .00
$3 ,000 .00
$3 ,500 .00
$4 ,000 .00
$4 ,500 .00
-50% -40% -30% - 2 0 % -10% 1 0 % 20% 3 0 % 40% 50%
% Change in Scrap Rate
Mat
eria
l Han
dlin
g C
osts
($)
by
M-C
RA
FT
Series1
M - C R A F T R e s u l t s w i t h R e l i a b i l i t y o f M a c h i n e s
$ -
$ 1 , 0 0 0 . 0 0
$ 2 , 0 0 0 . 0 0
$ 3 , 0 0 0 . 0 0
$ 4 , 0 0 0 . 0 0
$ 5 , 0 0 0 . 0 0
$ 6 , 0 0 0 . 0 0
- 5 0 % - 4 5 % - 4 0 % - 3 5 % - 3 0 % - 2 5 % - 2 0 % - 1 5 % - 1 0 % - 5 %
% C h a n g e i n R e l i a b i l i t y V a l u e s o f M a c h i n e s
Mat
eria
l Han
dlin
g C
osts
($)
by
M-C
RA
FT
Ser ies1

72
Figure 3.21 shows the analysis between reliability values of machines and material
handling costs in the facility. It is established that as the reliability of machines decreases,
the material handling costs increase. This is due to increase in the number of machines
required to manufacture the same number of products, which increases the area
requirements of the facility. This results in larger travel distances for materials between
departments resulting in higher handling costs.
Figure 3.22 Material Handling Costs ($) by M-CRAFT Vs % Change in Availability of Machines
Figure 3.22 shows the analysis between availability values of machines and material
handling costs in the facility. It is established that as the availability of machines
decreases, the material handling costs increase. This is due to increase in the number of
machines required to manufacture the same number of products which increases the area
requirements of the facility. This results in larger travel distances for materials between
departments resulting in higher handling costs.
M-CRAFT Results with Availability of Machines
$-
$1,000.00
$2,000.00
$3,000.00
$4,000.00
$5,000.00
$6,000.00
95% 90% 85% 80% 75% 70% 65% 60% 55% 50%
% Change in Availability of Machines
Mat
eria
l Han
dlin
g C
osts
($)
by
M-C
RA
FT
Series1

73
3.7 Chapter Conclusion
The research proved that we need to be sensitive to the manufacturing operations in the
facility being designed. Variation in process parameters results in changes in facility size,
machines, operators and cost of the product being manufactured. If these relationships are
not considered, facility design changes in order to meet the changing market demand
would result in high facility costs. If this relationship is studied, changes required would
be fewer, thus resulting in lower facility costs. Also, the details on the equipment and
operators need to be worked out before the facility is designed. If this aspect is not
considered, there might be frequent changes in the facility design in order to
accommodate the equipment and resources. The results and conclusions of this research
are expla ined in the next chapter.

74
4 Conclusion and Future Work
4.1 Conclusion From the results obtained of the Excel model and the analysis done in M-CRAFT, it is
seen that manufacturing parameters have a strong impact on the facility layout and to a
large extent are responsible for the layout costs. This research shows that that a model
that can establish relationship between the facility design and process and product
parameters can be developed. It will be extremely helpful to the industrial end users who
cannot devote required time and cost that goes into this analysis and estimation. Such a
model will also provide information on the important parameters which have maximum
impact on the facility design and cost of the product being manufactured. This model
would help in estimating the effects on the facility in terms of cost whenever changes or
modifications are required in an existing facility. The model in our research was for job
shop production involving a single product having different parts which go into the final
product. The model helped us in understanding the fact that careful analysis is required
before making any changes in the manufacturing parameters as small variations can have
large effects on the layout of the facility and material handling costs, especially in a large
setup.
The model developed helped us in establishing and understanding the following:
• Enabled to identify the important manufacturing parameters that govern facility
design, in our case, it was scrap rate, reliability of machines, availability of
machines and loading/unloading time.
• Provided a tool to determine the size of a facility given the necessary parameters
and the cost of the product with respect to operator and equipment. Our analysis
started after determining the size of the layout, the machines and operators
required to manufacture the 1,000 Powerarms.
• The developed model showed the relationships between the product and process
design parameters and how they impact the facility layout and design.
• Provides a simple tool to validate the designed layout and perform sensitivity
analysis for the important parameters.

75
4.2 Scope for Future Work As mentioned earlier, the model in our research was for job shop production involving a
single product having different parts, which go into the final product. The same model
can be extended to a large setup if information is available on the products being
manufactured and the manufacturing parameters associated with it. Since the facility in
our research was a job shop type and the production quantity considered was only 1000
Powerarms [22], only larger changes in manufacturing parameters indicated changes in
layout size and cost of handling the product. If a bigger facility is considered having the
resources to manufacture different types of products in large quantities, even small
changes in manufacturing parameters would reflect changes in the facility layout and cost
of material handling. Also, in our analysis, due to the non-availability of resources, we
used a DOS based facility design software M-CRAFT which could not be linked to the
Excel model and had very limited output features. If resources are available, there are
software available like FDL, CONGEN etc which are far more advanced and can be used
for better validation and analysis and linked with other tools also. An excellent tool can
be built if these resources are available with the complete product and process data,
which can serve as a reference for any facility executive to monitor the effects of process
and product parameter changes on facility design and product handling costs. The robust
model would help in:
• Determine the effects of processes and products on facility design.
• Statistically analyze the relationships between the different parameters.
• Determine the product handling costs and their variation when the process and
product parameters vary.

76
Bibliography [1] Tompkins, James A.... [et al.], “Facilities Planning” /J. Wiley, c2003. [2] Hales, Lee H., “Computer Aided Facilities Planning”, Marcel Dekker Inc., 1984. [3] James, Robert W., Alcorn, Paul A., “A Guide to Facilities Planning”, Prentice
Hall 1991. [4] Francis, Richard L., Mcginnis Jr, Leon F., White, John A., “Facility Layout and
Location: An Analytical Approach”, Second Edition, Prentice Hall, 1992. [5] Cotts, David G., Lee, Michael., “The Facility Management Handbook”, American
Management Association, 1992. [6] Kochhar, J.H., Heragu, S.S., “Facility Layout design in a changing environment”,
International Journal of Production Research, August 1998, pp. 2429-2446. [7] Lara, Marco A., Witzerman, James P., Nof, Shimon Y., “Facility description
language for integrating distributed designs”, International Journal of Production Research, February 1999.
[8] Smith, Terrence A., Randhawa, Sabah U., “Manufacturing Facility design: World
Quality at Global prices”, Institute of Industrial Engineers, IE Solutions ’97 Conference Proceedings, pp. 60-64.
[9] Moghaddain, Tavakkoli R., Shayan E., “Facilities layout design by Genetic
algorithms”, Computers Ind. Engg Vol. 35, Nos. 3-4, pp. 527-530, 1998. [10] Frizelle, G.D.M., “Assessing the impact of new products on the factory”, 5th
International Conference on Factory 2000, 2-4th April 1997, Conference Publication No. 435, IEE 1997.
[11] Eneyo, Emmanuel S., Pannirselvam, Gertrude P., “The use of simulation in
facility layout design: a practical consulting experience”, Proceedings of the 1998 winter Simulation Conference.
[12] Ilozor, Ben Dozie., Lovem Peter E.D., Treloar, Graham., “The impact of work
settings on organizational performance measures in built facilities”, Facilities, vol. 20, issue ½ 2002, pp.61-67.
[13] Grimshaw, R.W., “FM: the professional interface”, facilities, vol. 21, issue 5/6
2003, pp. 50-57. [14] Duffy, Francis, “Design and facilities management in a time of change”,
facilities, vol. 18, issue 10/11/12 2000, pp. 371-375

77
[15] Whitaker, Martha J., “Conducting a facility management audit”, facilities, vol. 13, issue 6 1995, pp. 6-12
[16] Cairns, George., “Seeking a facilities management philosophy for the changing
workplace”, facilities, vol. 21, issue 5/6 2003, pp. 95-105 [17] Mcgregor, Wes., “The future of workspace management”, facilities, vol. 18,
issue ¾ 2000, pp. 138-143 [18] Blair, Lynne., Thatcher, Meredith., “calculating occupiable floor area: a North
American initiative”, facilities, vol. 13, issue 7 1995, pp. 17-72 [19] Vaughan, Beth Harmon., “Tomorrow’s workplace: anywhere, anytime”,
facilities, vol. 13, issue 4 1995, pp. 6-13 [20] So, Albert T.P., Wong, Alvin C.W., Wong, K-c., “ A new definition of
intelligent buildings for Asia”, facilities, vol. 17, issue 12/13 1999, pp. 485-491 [21] Brauer, Roger L., “Facilities Planning”, American Management association 1992 [22] Apple, James M., “Plant Layout and Material Handling”, second edition, The
Ronald Press Company 1963 [23] Benajaafar, Saifallah., “Design of flexible layouts for manufacturing systems”,
IEEE International Engineering Management conference, Institute of Electical and Electronics Engineers 1995, pp. 421-427

78
Appendix
10001
14401
100
BASE
Machine Name Operation Pieces/ Hr Scrap Rate
Availability Reliability Loading Time(min)
Unloading Time(min)
Operator Cost/hr($)
Machine Cost/hr($)
Number of Machines required
LEBLOND LATHE Face Bottom 60 0.04 24 0.93 0.1 0.1 25 12 0.94WARNER & SWASEY Face top OD 23.8 0.04 24 0.83 0.3 0.3 25 15 2.56CLEEREMAN DRILL PRESS Drill three Holes 84 0.03 24 0.88 0.16 0.16 25 10 0.58DELTA DRILL PRESS Drill pin holes 238 0.03 24 0.88 0.3 0.3 25 9 0.22
Drill 65.4 0.03 24 0.77 0.35 0.35 25 13 0.91Ream 0.02 0 0 0 0 0 0
BENCH Inspect 55.4 0.04 24 1 0.22 0.22 25 7 0.78DETREX WASHER Degrease 143 0 24 1 0.13 0.13 25 8 0.29
ECCENTRIC RODCut off 588 0.03 24 0.8 0.43 0.43 25 21 0.12Chamfer 0.06 0 0 0 0 0 0
DELTA DRILL PRESS Drill 5/16 hole 250 0.03 24 0.88 0.3 0.3 25 9 0.24DELTA DRILL PRESS Tap 3/8-16 hole 120 0.02 24 0.88 0.2 0.2 25 9 0.48LEBLOND LATHE Turn Eccentric 149 0.02 24 0.93 0.13 0.13 25 12 0.36BENCH Inspect 143 0.04 24 1 0.22 0.22 25 7 0.34HEAT TREATMENT Furnace 910 0.07 0 0 0 0 0 0GRIND O.D Cinn. Grinder 455 0.05 0 0 0 0 0 0DETREX WASHER Degrease 455 0 24 1 0.13 0.13 25 8 0.09
HANDLEThread 256 0.06 24 0.83 0.2 0.2 25 15 0.27Cut off 0.03 0 0 0 0 0 0Chamfer 0.06 0 0 0 0 0 0Thread 232 0.06 24 0.83 0.2 0.2 25 15 0.26Chamfer 0.06 0 0 0 0 0 0
BENCH Inspect 500 0.04 24 1 0.22 0.22 25 7 0.09DETREX WASHER Degrease 600 0 24 1 0.13 0.13 25 8 0.07
COVERFace 60 0.04 24 0.83 0.3 0.3 25 15 1.22Bore 0.04 0 0 0 0 0 0Turn 0.02 0 0 0 0 0 0Cut off 0.03 0 0 0 0 0 0
CLEEREMAN DRILL PRESS Drill 4-9/31 holes 178 0.03 24 0.99 0.16 0.16 25 10 0.30BROWN & SHARPE MILL Saw in two 125 0.03 24 0.85 0.14 0.14 25 18 0.48BENCH Inspect 250 0.04 24 1 0.22 0.22 25 7 0.20DETREX WASHER Degrease 300 0.13 24 1 0.13 0.13 25 8 0.16
CAPFace 30.3 0.04 24 0.83 0.3 0.3 25 15 2.07Bore 0.04 0 0 0 0 0 0Cut seat 0.02 0 0 0 0 0 0
FOSDICK DRILL PRESS Drill and tap 62.5 0.03 24 0.77 0.35 0.35 25 13 0.98MILWAUKEE MILL Mill slot 83.5 0.05 24 0.78 0.36 0.36 25 15 0.70BENCH Inspect 100 0.04 24 1 0.22 0.22 25 7 0.43DETREX WASHER Degrease 143 0 24 1 0.13 0.13 25 8 0.29
FACILITY DESIGN MODEL FOR MANUFACTURE OF POWERARM
WARNER & SWASEY
WARNER & SWASEY
WARNER & SWASEY
WARNER & SWASEY
Batch Size
Independent operator activity time(min)Number of Powerarms Needed:
Availability of machines per day (min)Efficiency of the machines
OSTER 601
FOSDICK DRILL PRESS

79
Table 0.1Model Excel Spreadsheet
Figure 0.1 gives the details of the different parts that go into the final assembly of the
Powerarm [22]. The chart gives the different machines used in the manufacture of these
parts, the manufacturing parameters involved and the costs for the different machines and
operators. Each of these parameters was carefully considered to arrive at the final number
of machines and operators and cost of the product. All the data used is published data
from [22].
Table 0.2 Space Allocation for different machines
PINCut off 1000 0.03 24 0.8 0.43 0.43 25 15 0.06Chamfer 0.06 0 0 0 0 0 0
PRESSURE PADBore, 40 0.04 24 0.83 0.24 0.24 25 15 1.59Face 0.04 0 0 0 0 0 0chamfer 0.06 0 0 0 0 0 0
BROWN & SHARPE MILL Mill slot 120 0.05 24 0.85 0.25 0.25 25 18 0.45BENCH Inspect 100 0.04 24 1 0.22 0.22 25 7 0.43DETREX WASHER Degrease 600 0 24 1 0.13 0.13 25 8 0.07
BALL SWIWELTurn 30.3 0.02 24 0.83 0.4 0.4 25 15 2.23Shank 0.02 0 0 0 0 0 0Cut off 0.03 0 0 0 0 0 0
form ball 0.03 0 0 0 0 0 0LANDIS GRINDER Grind ball 25 0.05 24 0.89 0.27 0.27 25 19 2.27SIMPLEX MILL Mill shank 90 0.05 24 0.92 0.25 0.25 25 17 0.58
Drill 62.5 0.03 24 0.9 0.35 0.35 25 13 0.81Tap 0.02 0 0 0 0 0 0
BENCH Inspect 83.3 0.04 24 1 0.22 0.22 25 7 0.52DETREX WASHER Dergrease 600 0 24 1 0.13 0.13 25 8 0.07
WARNER & SWASEY
FOSDICK DRILL PRESS
WARNER & SWASEY
OSTER 601
Machine Space (Sq.ft)1011237899
1206677
13499
113124101103
DETREX WASHER
BROWN & SHARPE MILL
MILWAUKEE MILLLANDIS GRINDER
SIMPLEX MILL
OTHERS
DELTA DRILL PRESS
FOSDICK DRILL PRESSBENCH
OSTER
Machine NameSPACE ALLOCATION FOR DIFFERENT MACHINES
LeBLOND LATHE
WARNER & SWASEY LATHE
CLEEREMAN DRILL PRESS
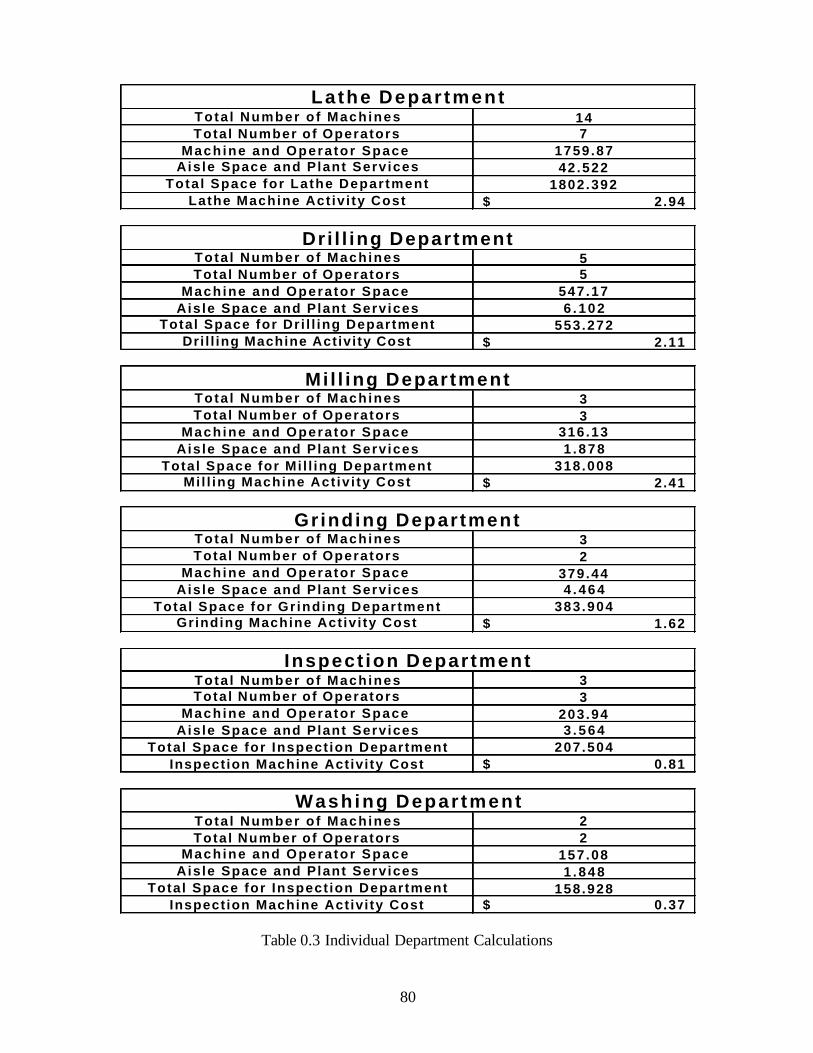
80
Table 0.3 Individual Department Calculations
147
1759.8742.522
1802.3922.94$
55
547.176 . 1 0 2
553.2722.11$
33
316.131 . 8 7 8
318.0082.41$
32
379.444 . 4 6 4
383.9041.62$
33
203.943 . 5 6 4
207.5040.81$
22
157.081 . 8 4 8
158.9280.37$
Total Space for Inspect ion DepartmentInspection Machine Activi ty Cost
Aisle Space and Plant Services
Washing Depar tment
Tota l Number of OperatorsMachine and Opera tor Space
Mi l l ing Machine Act iv i ty Cost
Aisle Space and Plant ServicesTota l Space for Gr inding Department
Grinding Machine Act ivi ty Cost
Grinding DepartmentTota l Number o f MachinesTota l Number of Operators
Machine and Opera tor Space
Aisle Space and Plant ServicesTotal Space for Mi l l ing Department
Mil l ing Department
Machine and Opera tor Space
Aisle Space and Plant Services
Dri l l ing Department
Total Space for Dr i l l ing DepartmentDri l l ing Machine Activi ty Cost
Lathe Depar tment
Inspect ion Department
Tota l Number o f MachinesTota l Number of Operators
Machine and Opera tor Space
Tota l Number o f MachinesTota l Number of Operators
Tota l Number o f MachinesTota l Number of Operators
Machine and Opera tor Space
Aisle Space and Plant ServicesTota l Space for Lathe Department
Lathe Machine Act iv i ty Cost
Tota l Number o f MachinesTota l Number of Operators
Machine and Opera tor Space
Tota l Number o f Machines
Aisle Space and Plant ServicesTotal Space for Inspect ion Department
Inspection Machine Activi ty Cost

81
Figure 0.1 M-CRAFT Input Screen 1
Figure 0.2 M-CRAFT Input Screen 2

82
Figure 0.3 M-CRAFT Input Screen 3
Figure 0.4 M-CRAFT Input Screen 4
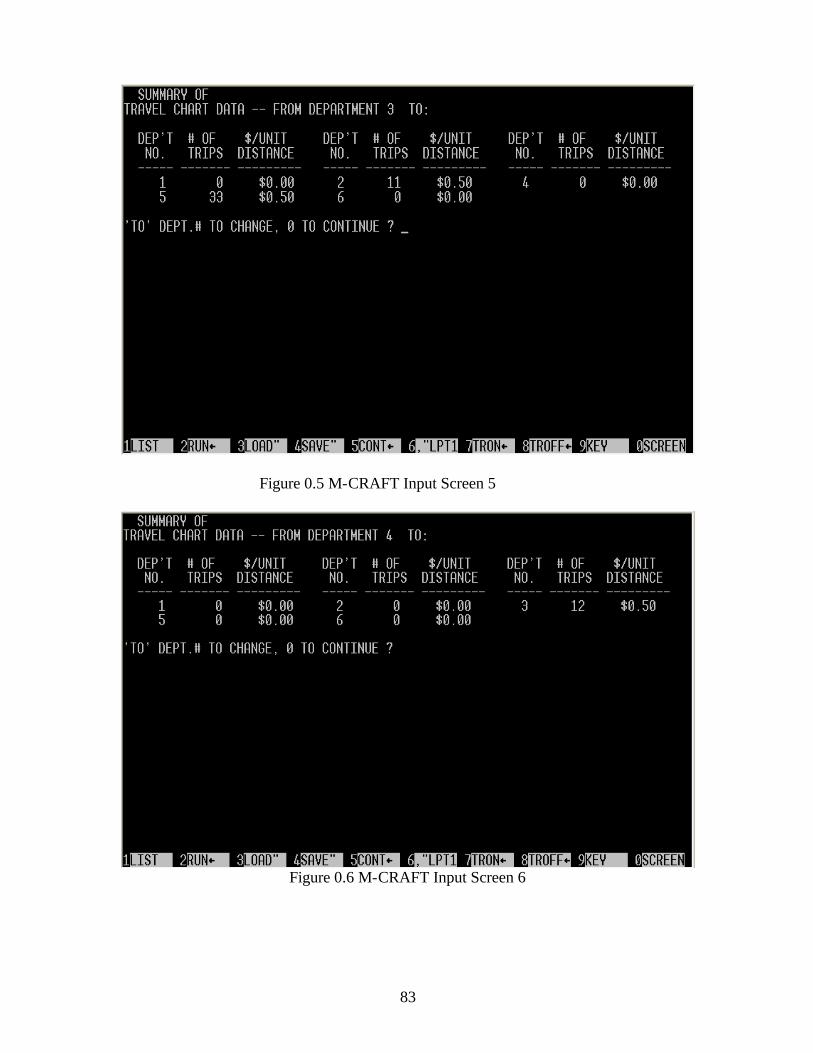
83
Figure 0.5 M-CRAFT Input Screen 5
Figure 0.6 M-CRAFT Input Screen 6

84
Figure 0.7 M-CRAFT Input Screen 7
Figure 0.8 M-CRAFT Input Screen 8

85
Figure 0.9 M-CRAFT Input Screen 9
Figure 0.10 M-CRAFT Input Screen 10

86
Figure 0.11 M-CRAFT Output Screen 1
Figure 0.12 M-CRAFT Output Screen 2

87
Figure 0.13 M-CRAFT Output Screen 3
A1. MCRAFT Results after Scrap Rate was reduced by 50%
Figure 0.14 M-CRAFT Output Screen 1 when Scrap Rate was reduced by 50%

88
Figure 0.15 M-CRAFT Output Screen 2 when Scrap Rate was reduced by 50%
A2. MCRAFT Results after Scrap Rate was increased by 50%
Figure 0.16 M-CRAFT Output Screen 1 when Scrap Rate was increased by 50%
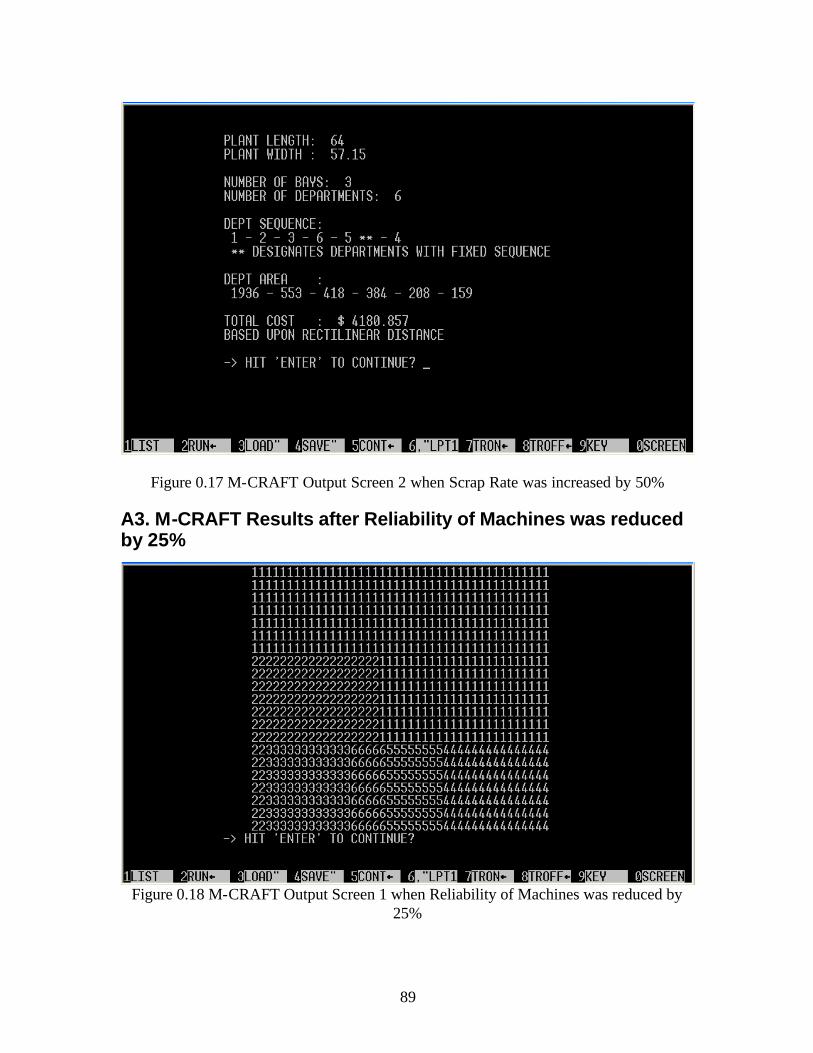
89
Figure 0.17 M-CRAFT Output Screen 2 when Scrap Rate was increased by 50%
A3. M-CRAFT Results after Reliability of Machines was reduced by 25%
Figure 0.18 M-CRAFT Output Screen 1 when Reliability of Machines was reduced by 25%

90
Figure 0.19 M-CRAFT Output Screen 2 when Reliability of Machines was reduced by 25%
A4. M-CRAFT Results after Availability of Machines was reduced by 25%
Figure 0.20 M-CRAFT Output Screen 1 when Availability of Machines was reduced by 25%

91
Figure 0.21 M-CRAFT Output Screen 2 when Availability of Machines was reduced by 25%