Embed Size (px)
Citation preview
CONSTANTS OF SPECTRAL RADIATION OF A UNI-
FORMLY HEATED INCLOSURE OR SO-CALLEDBLACK BODY, II
By W. W. Coblentz
CONTENTSPage
I. Introduction 459II. Recomputation of data 461
III. Discussion of other data. 468
IV. Summary 470Appendix—Note on methods of calculating the spectral radiation constants. ,
.
471
I. INTRODUCTION
In a previous communication ^ the results of an investigation of
the constant of spectral radiation of a black body were pre-
sented. The spectral energy cin^es were obtained by means of a
vacuum bolometer, a mirror spectrometer, and a perfectly clear
fluorite prism.
In the isothermal spectral energy ctirves obtained with these
instruments the position Xm of the maximum emission Ej^, was
computed by taking the wave lengths, \ and X2, corresponding to
equal intensities, ii^xi=£^x2, on the asstmiption that the observed
energy curve fits the Planck equation. The equation which is
used in computing Xm is
^ a (logX2-logX,)X,X3 \\[\og{i-e-^ll^^'')-\og{i-e-^h'^)]"" a'(X2-Xi) log e a' (X2-X1) log e
The second term in this equation is rather complicated. It re-
quires an approximate value of the spectral radiation constant,
C, which was assumed, for the piupose of calculating this correc-
tion (for the series of 1 909 to i9ii),tobeC = i4 500. A decrease of
100 units in C (say C = 14 400) decreases the mean value ^ of Xmby O.OOI2JLI, which at that time was considered negligible.
1 This Bulletin, 10, p. 2; 1913.
2 In the previous paper this value was stated to be 0.005M, which is erroneous.
459

460 Bulletin of the Biireau of Standards [Voi.is
The second term in the above equation, which is usuaUy
mentioned as a ''correction factor" has always been a stnmbhng
block in the computations. After the completion of the calcu-
lations of Xm it was found that the computer had omitted a factor
from this "second term" which introduced an error of about 0.5
per cent, giving a mean value of C = 14 280 (0.5 per cent too low).
Some doubts arose also as to the accuracy of part of the calibra-
tion cuTv'e of the prism, known as the "cahbration cur\'e of 191 2,"
in view of the general belief, held at that time, that the value
can not be lower than C = i4 500." To save work in correcting
this error in the ''second term," fewer points were taken, and the
values of Xg, at 4 to 5^1, were increased by a slight amount to cor-
respond with the ''calibration cur^^e of 19 10." The data thus
obtained gave a mean value of C = i4 456, which is about 0.2 per
cent higher than would have been obtained by adhering to the
"calibration cuta'C of 1912," published in the previous paper.
These data were published in 191 3, the intention being to re-
vise them, if the calibration cruve of 19 10 should be foimd wrong.
In the meantime Paschen ^ has pubHshed further data on the
dispersion of fluorite which shows that the part of the caHbration
cur^-e of 1 9 10, used by the writer in the above computations, is
less reliable than the calibration cur^x of 191 2.
Recently, on examining the previous computations, it was
foimd that the above-mentioned "second term" still contains a
small error, giving a mean value of Xm, which is 0.2 to 0.3 per cent
too high. As a result of these errors, which happen to be of the
same sign, the value of C = i4 456, pre^-iously published, is 0.5 to
0.6 per cent too large, owing to faults in the caHbration cxm^e and
to a small error in the reduction of the data.
The computations have therefore been made anew, using the
values of \ and X2 which had been read from the spectral energy
curves obtained with the prism calibration cur^-e of 191 2. Therecomputation of these data turned out to be a simple matter, in
view of the fact that it merely required dividing the above-
mentioned "second term" factors by 2.3 and subtracting 0.0038/z
from the mean value of Xm. The subtraction of 0.003 S/z is
necessary because C = 14 600 instead of C =14 300 had been
used in computing the second-term factors of the'
' data of 1 9 1 2.
"
2 Paschen., Ann. der Phys., 41, p. 67=; 1913.
Cobientz] Coustauts of Spectral Radiatio7i 461
The difficulty encountered in this investigation was an over-
abundance of spectral energy curves, the viewing of which caused
such fatigue to the eyes that, after having drawn the curves and
indicated the best positions for obtaining \ and \, it was neces-
sary to assign to another the task of reading oE the numerical
values of Xj and X2 from the curves and computing the results.
After a lapse of more than three years the writer finds no correc-
tions to the values of \ and X2 as then read from the energy curves
by his assistant, showing that the work, had been faithfully done.
As for the errors in the computations, owing to eye fatigue, it was
impossible for months thereafter to give attention to the reduc-
tion of the data. Furthermore, at that time a correction of 0.3
to 0.5 per cent was considered of minor importance in view of the
great difficulties involved in the work. It is of interest to note
that the discrepancies in the previous paper are due to faults
in reduction of the data and not in the experimental work. Thepresent disagreement between theory and experiment is very
small, and may be further reduced when we know more about
the optical constants of the prism used in producing the spectrum.
11. RECOMPUTATION OF DATA
As already mentioned, the recomputation of the data consisted
simply in eliminating the errors in the "second-term correction"
which is used in obtaining Xm. The total number of points on the
energy curve was usually greatly increased . In this manner a meanvalue of Xm was obtained v/hich is more representative of the
whole energy ciu^e. The values of X2 were taken in the regions
where there is no atmospheric absorption, viz, 2.3 to 2.5/x, 3.3 to
4.ijLt, 4.4 to 4.6/x, and 4.8 to 5.6^. In the previous paper the value
of C was based upon data obtained in 191 1 and the " series of 191 2."
The "series of 191 1" contained many curves taken at extreme
temperatures. For the lov/ temperatures the curves were greatly
affected by atmospheric absorption, and at high tem^peratures the
scale of temperatures was questioned. Correcting these data a
mean value of C = i4 390 was obtained for the "series of 1911.''
However, considering the quality of the spectral energy curves, it
does not seem fair to give them any weight in deducing a nev/ meanvalue, although it would increase the corrected mean value but
little.

462 Bulletin of the Btireau of Standards [Vol. 13
As mentioned in the previous paper the "' series of 1912 " obser-
vations are considered the most accurate (i) as regards adjust-
ments of apparatus, (2) temperature scale, (3) bolometric control,
(4) elimination of atmospheric water vapor, and (5) as regards the
general appearance of the spectral energy cin^^es. These data
were therefore carefully recomputed and tabulated. In making
up the tables the column of probable errors is omitted in view of the
writer's feeling that such data are illusor\'.
In the present paper the old numbers of the tables are carried
in a footnote at the end of each table to facilitate comparison with
the data in the previous paper to which reference must be made for
details. Series 8, Table 6, is poor owing to various difficulties that
were experienced—that is. tremors, bolometric troubles, etc.—so
that only the most reliable cunxs were considered in the present
computations.
TABLE 10
Series 1912, I.—White Radiating Walls, Fluorite Prism No. 1, Water-Cooled ShutterNo. 2.
[Energy curves LXXXVI-XCII]
No.Form oi
energycurve
Wave length of marimiamemission <\;rMxj
Absolutetem-
peratureMean value
Number of
computations
Old
Old New Old New
New Old New
xcm & . . .
.
Lxxxvm.xci?>
LXXXV11-.
LXXXVI...T.XXXIX c
XCb
Mean.
?
PPPWPPPW
1112-
1209
1223
1242
1350
1419
1427
605
408
374
345
154
056
045
2.601 3
2.401 6
2.356 4
2.332 5
2.139 6
2.034 7
2.031 5
2922
2910
2904
2912
2908
2916
2918
2897
2903
2881
2896
2888
14 508
14 451
14 418
14 459
14 438
14 480
14 485
2913 14 453
14 384
14 414
14 304
14 379
14 339
14 329
14 389
14 352
o Table 12 of previous paper. ^ Furnace heated by outer coil only. '^ Poor curve.
Coblentz] Constants of Spectral Radiation 463
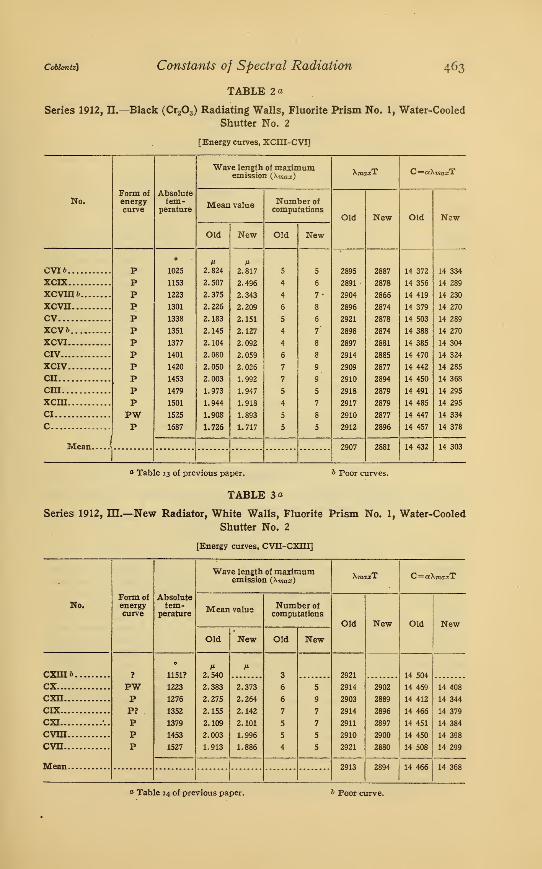
TABLE 2«
Series 1912, n.—Black (CraOg) Radiating Walls, Fluorite Prism No. 1, Water-Cooled
Shutter Ko. 2
[Energy curves, XCIII-CVI]
Form of
energycurve
Absolutetem-
perature
Wave length of maximumemission (Xmax)
XtoozT C—aXmaxT^
No. Mean valueNumber of
computationsOld New Old New
Old New Old New
CYlb PPPPPPPPPPPPPWP
1025
1153
1223
1301
1338
1351
1377
1401
1420
1453
1479
1501
1525
1687
2.824
2.507
2.375
2.226
2.183
2.145
2.104
2.080
2.050
2.003
1.973
1.944
1.908
1.726
M2.817
2.496
2.343
2.209
2.151
2.127
2.092
2.059
2.025
1.992
1.947
1.918
1.893
1.717 5
5
6
'8
6
7'
8
8
9
9
5
7
8
5
2895
2891-
2904
2896
2921
2898
2897
2914
2909
2910
2918
2917
2910
2912
2887
2878
2865
2874
2878
2874
2881
2885
2877
2894
2879
2879
2877
2896
14 372
14 356
14 419
14 379
14 503
14 388
14 385
14 470
14 442
14 450
14 491
14 485
14 447
14 457
14 334
XCIX 14 289
xcvm&xcvn
14 230
14 270
cv 14 289
XCV6 14 270
XCVI 14 304
CIV 14 324
XCIV 14 285
en 14 368
cm 14 295
xcm 14 295
CI 14 334
c 14 378
Mean L. 2907 2881 14 432 14 303
o Table 13 of previous paper.
TABLE 3 a
^ Poor curves.
Series 1912, m.—New Radiator, White Walls, Fluorite Prism No. 1, Water-Cooled
Shutter No. 2
[Energy curves, CVn-CXni]
Form of
energycurve
Absolutetem-
perature
Wave length of maximumemission (Xmax)
XmaxT C= aXnjciT
No. Mean valueNumber of
computations
Old New Old New
Old New Old New
rTTTT b 7
PWPP?
PPP
1151?
1223
1276
1352
1379
1453
1527
2.540
2.383
2.275
2.155
2.109
2.003
1.913
M
2.373
2.264
2.142
2.101
1.996
1.886
3
5
I
7
5
5
2921
2914
2903
2914
2911
2910
2921
2902
2889
2896
2897
2900
2880
14 504
14 469
14 412
14 466
14 451
14 450
14 508
cx 14 408
cxn 14 344
cix 14 379
CXI '.. 14 384
cvin 14 398
cvn 14 299
Mean 2913 2894 14 466 14 368
'^ Table 14 of previous paper. Poor curve.

464 Bulletin of the Bureau of Standards [Vol. 13
TABLE A a
Series 1912, IV.—New Radiator, Black (CioOg^^aCooOg) Walls, Fluorite Prism No. 1,
Water-Cooled Shutter No. 2
[Energy ciirves, CXR^'-C]
No.
Wave length 01 maximumemission {\max)
Form of ' Absoluteenergy
jtem-
curvejperature
C=a.\r.
Mean value INiunber of
iccmcutations
Old
Old Old New
C2
cxxn..CXXT...
cxYm.cxx...
CXslI.
.
CXIZ...
CXVIc..
cxv...
cxr/j>..
p?
pppPWppppp
1025
1077
1154
1223
1276
1353
1377
1454
1503?
M3.312
2.826
2.704
2.516
2.376
2.280
2.156
2.122
2.007
1.954
3.280
2.818
2.694
2.507
2.364
2.270
2.139
2.104
1.996
2901
2897
2912
2903
2906
2909
2917
2922
2918
2936
New
2873
2888
2901
2893
2891
2896
.2894
2897
2902
Mean. 2910
Old
14 405
14 332
14 459
14 414
14 428
14 445
14 486
14 507
14 488
14 5S0?
New
14 255
14 339
14 404
14 354
14 354
14 379
14 369
14 384
14 408
2893 14 446 14 363
a Table 15 of previous paper.
TABLE 5 «
6 Poor curves.
Series 1912, V.—Blackened Radiator, New Adjustments, Fluorite Prism No. 1,
Water-Cooled Shutter No. 2
[Energy curves, CXXIV-CXL]
Form of
energycurve
Absolutetem-
perature
Wave length of maTimumemission {\maz}
X7:,^;rT C=cc\maxT
No.Mean value
Number of
computationsOld New Old New
Old New Old New
CXXXV6CXXXlIb
cxxxrvcxxxi
?
PPWPPP+P^PWpp+ppp+p-f
pPWP+
o
1026
1077
1153
1194
1224
1276
1302
1302
1338
1352
1378
1421?
1454
1503
1627?
1663
1796
M2.831
2.703
2.520
2.441
2.380
2.284
2.237
2.242
2.182
2.160
2.118
2.068
2.008
1.961?
1.798
1.756
1.639
M2.822
2.692
2.509
2.433
2.368
2.271
2.226
2.231
2.164
2.136
2.096
1.996
1.794
1.730
1.615
5
5
6
4
6
9
6
7
5
4
5
5
9
4
5
5
8
5
7
7
6
6
6
6
6
5
4
8
5
2
5
2905
2911
2905
2914
2913
2914
2913
2920
2920
2921
2918
2939
2920
2948
2925
2921
2945
2895
2899
2893
2905
2898
2898
2898
2904
2895
2888
2888
2902
2919
2887
2900
14 423
14 455
14 425
14 469
14 464
14 469
14 461
14 498
14 497
14 501
14 483
14 588?
14 497
14 629?
14 374
14 394
14 364
14 4^4
r.x^TX^ 14 389
CnCKTi 14 389
CXXXIMCXXXVU
14 389
14 419
14 374
cxxvmex X V
14 339
14 339
CXXXVIcxxvnrxxiv
14 408
CXLc 14 524? 14 493?
CXXXVUlc....nxxxivbc
14 500 14 285
14 631? 11 358
Mean 2915 2895 14 476 14 3"6
° Table i6 cf previous paper. Poor curves. Alternating current used for furnace heating coils.

Coblenlz] Constants of Spectral Radiation 465
TABLE 6«
Series 1912, VHI.—Blackened Radiator, New Thermocouple, Fluorite Prism No. 1,
Water-Cooled Shutter No. 2
[Energy curves, CLVI-CLXVU]
Form of
energycurve
Absolutetem-
perature
Wave length of maximumemission {Xmax)
\maxT C=aX77»aa;T
No. Mean valueNxmiber of
computations
Old New Old New
Old New Old New
CLIX& ?
WPPPP?
PPWPppp+p+
806
879
953
1077
1223
1277
1300
1314
1376
1377
1452
1539
M3.610
3.300
3.052
2.703
2.380
2.286
2.248
2.236
2.120
2.140
2.030
1.920
M2910
2901
2909
2911
2911
2920
2923
2938?
2917
2947?
2948?
2955?
2888
2896
2898
2896
2900
2894
14 447
14 402
14 441
14 454
14 453
14 497
14 513?
14 588'
CLX 3.286
3.039
2.691
2.368
2.271
2.103
2
2
7
6
7
8
7
6
5
10
9
7
7
7
6
5
3
14 339
CLXIc 14 339
c^vm 14 389
CLVHd .... 14 379
CLVI 14 399
CLXIVcCLxvn/,c... .
CLxm 14 482
14 634?
14 639?
14 369
CLXVl c,e
CLXn g .
CLXV«.c 14 671?
Mean 2912 2895 14 461 1 14 375
o Table 19 of previous paper.
& Very poor curve, X max by inspection.
c Poor series, tremors.
d Poor curve.
TABLE 7a
e Radiation sensitivity changed.
/ Furnace heated by outer coil only.
g Bolometer unsteady; low vacuum.
Series 1912, IX.—^Blackened Radiator, Fluorite Prism No. 1, Water-Cooled Shutter
No. 1
LEnergy curves, CLXVIU-CLXXVI]
Form of
energycurve
Absolutetem-
perature
Wave length of maximumemission (Xniax)
XttmkbT C^aXmaxT
No. Mean valueNumber of
computationsOld New Old New
Old New Old New
CLXXIV&CLXxmCLXXV
P?
PPPPPPPP
1175
1194
1277
1302
1353
1377
1451
1452
1540
2.465
2.431
2.272
2.232
2.153
2.114
2.010
2.007
1.890
M2.446
2.416
2.257
2.216
2.137
2.101
1.996
1.986
1.871
2
2
7
6
6
8
7
5
8
7
4
2896
2900
2901
2906
2913
2911
2916
2914
2909
2874
2885
2882
2885
2891
2893
2896
2884
2881
14 381
14 401
14 405
14 429
14 462
14 456
14 477
14 467
14 443
14 270
14 324
14 309
CLXxn 14 324
CLXXVICLXXI .
14 355
14 365
CLXX 14 379
CLXIXbCLXVmb
14 319
14 304
Mean 2909 2886 14 436 14 327
* Table 20 of previous paper.
67154°—vol 13—16 8
b Poor curves, sensitivity changing.
466 Bulletin of the Bureau of Standards
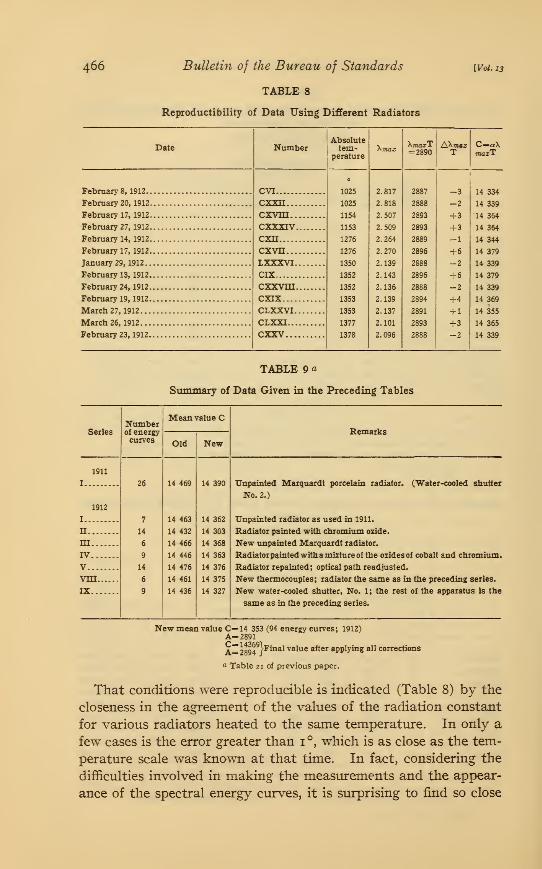
TABLE 8
Reproductibility of Data Using Different Radiators
[Vol. 13
Date NumberAbsolutetem-
perature
XttwxTI
AX=2890 1
*:
C=aXmaxT
Februarys, 1912..
February 20, 1912.
February 17^ 1912.
February 27, 1912.
February 14, 1912.
February 17, 1912.
January 29, 1912..
February 13, 1912.
February 24, 1912.
February 19, 1912.
March 27, 1912...
March 26, 1912...
Febriiary23, 1912.
CVIrxxii
cxvm..cxxxivcxn....
cxvn..LXXXVICIX
cxxvmcxix...
CLXXVI.
CLXXI..
CXXV...
1025
1025
1154
1153
1276
1276
1350
1352
1352
1353
1353
1377
1378
2.817 2887 -3
2.818 2888 -2
2.507 2893 +32.509 2893 +32.264 2889 -1
2.270 2896 +62.139 2888 —2
2.143 2896 4-6
2.136 2888 -2
2.139 2894 -f4
2.137 2891 -fl
2.101 2893 -1-3
2.096 2888 -2
14 334
14 339
14 364
14 364
14 344
14 379
14 339
14 379
14 339
14 369
14 355
14 365
14 339
TABLE 9 o.
Summary of Data Given in the Preceding Tables
SeriesNumberof energycurves
Mean value C
Remarks
Old New
1911
I 26 14 469 14 390 Unpainted Marquardt porcelain radiator. (Water-cooled shutter
No. 2.)
1912
I 7 14 463 14 362 Unpainted radiator as used in 1911.
n 14 14 432 14 303 Radiator painted with chromium oxide.
m 6 14 466 14 368 New unpainted Marquardt radiator.
IV 9 14 446 14 363 Radiator painted with a mixture of the oiidesof cobalt and chromium.
V 14 14 476 14 376 Radiator repainted; optical path readjusted.
vm 6 14 461 14 375 New thermocouples; radiator the same as in the preceding series.
IX 9 14 436 14 327 New water-cooled shutter. No. 1; the rest of the apparatus is the
same as in the preceding series.
New mean value C=14 353 (94 energy curves; 1912)A= 2891C= 143691A=2894 ^Final value after applying all corrections
a Table 21 of previous paper.
That conditions were reproducible is indicated (Table 8) by the
closeness in the agreement of the values of the radiation constant
for various radiators heated to the same temperature. In only a
few cases is the error greater than i °, which is as close as the tem-
perature scale was known at that time. In fact, considering the
difficulties involved in making the measurements and the appear-
ance of the spectral energy curves, it is siirprising to find so close
cobientz] Constants of Spectral Radiation 467
an agreement (the maximum range is only about 0.5 per cent) nowthat the computations have been made and the data assembled for
inspection.
In Table 9 are assembled the reliable data which form the basis
for obtaining a mean value of the radiation constants. The meanvalue of all the data including the "series of 1911 " is C = i4 358.
However, as already stated, the data of 191 1 are not as reliable as
is desirable, and since there is no way of estimating their value
the writer prefers to consider only the ''series of 191 2," which
contains seven sets of observations (65 energy curves) , which give
a mean value of C = i4 353 micron degrees and A =2891 micron
degrees.
If the corrections to the temperature scale (mentioned in the
previous paper) are applied, the value isC = i4362. A further
correction ( = + 7) is necessary because the second term in equa-
tion I was computed using C = i4 300 instead of C = i4 350.
Hence, the final corrected value is C = i4 369 and ^=2894micron degrees.
A recent investigation of instruments and methods for evalu-
ating radiant energy in absolute value ^ gave a new determination
of the coefficient, a, of total radiation ^ of a black body. Thenumerical value as published is (7 = 5.72 x lo"^^ watt. cm. -2
deg."'', which from our present knowledge appears to be close to
the true value. Hence, if theoretical considerations are to be
relied upon, this value of the coefficient, a, of total radiation indi-
cates that the coefficient of spectral radiation is of the order of
C = i4 322, as compared with the experimentally determined
value C = i4 369. This is a difference of only 0.3 per cent. Theagreement is so close that it must be considered accidental in view
of the great experimental difficulties involved in obtaining the
data. These data were obtained at different dates, on the sameradiator (operated under various conditions), and using the samescale of temperatures. The small outstanding discrepancy is
probably as much the result of uncertainties in the calibration
curve (refractive indices) of the fluorite prism as it is the result
of uncertainties in the temperature scale, and of the inevitable
experimental errors.
* This Bulletin, 12, p. 504; 1916.
' This Bulletin, 12, p. 553; 1916. The first issue gave a value of ^=5.75, which is incorrect.
468 Bulletin of the Bureau oj Standards [Voi.13
m. DISCUSSION OF OTHER DATA
Paschen's Data.—After a lapse of about iS years it is interesting
to turn back to the pioneering work of Paschen and obser\'e howclose he came to the truth.
In his first paper Paschen *"' used four radiators, heated to 100°,
191°, 304°, and 450°, respectively, and 4 bolometers. He ob-
tained a series of closely agreeing values which gave a mean value
(2894, 2892, 2888, 2890) of XniT = 2S9i. Using the Planck reduc-
tion factor (4.9651) instead of the Wien factor (5) , this gives a value
of C = i4 354. The following year Paschen ' obtained a series of
spectral energy ciu*\'es from radiators operated at high tempera-
tures. He obtained a value of A =2921 as a result of arbitrarily
changing his calibration cin^'e as described in the writer's previous
paper. He changed also his pre^^ious data, increasing the value
of A from 2891 to 2915, or about 0.9 per cent. From this it would
appear that his later value (A ==2921) is 0.9 per cent higher than
it should have been; that is, his experimental values were close
to .4=2895 ^^^ ^ = 14 374- I^ other words, Paschen's original
data fall within the range of the recent and more accurately deter-
mined values.
The Reichsanstah Data.—Duriug the past 16 years the Phys.-
Tech. Reichsanstah, at Berlin, has pursued extensive investiga-
tions of the laws of radiation and their apphcation to the tempera-
ture scale. The first investigation by Lummer and Pringsheim ^
gave a mean value of .4=2879. In their second paper they
obtained a much higher value, ^Az, A = 2940.
In 1906 Holbom and Valentiaer ^ obtained a value of C= 14 200
as a result of a series of spectrophotometric measurements. This
is now admittedly m error, owing to an erroneous temperature
scale in which the melting poiat of palladium was taken to be
1575° instead of about 1550°. Recently Valentiner ^° corrected
this value, raising it to C= 14 350.
During the past seven years these investigations have been pur-
sued by Warburg ^^ and his collaborators. In their first commu-
s Paschen, Sitzber. Akad. Wiss., Berlin, 21, p. 403; 1S99.
Paschen, Ann, der Phys., 4, p. 27:; 19^01.
- Lummer and Pringsheim, Verh. Phys. Ges., 1, pp. 23, 215; 1S99.
^ Holbom and Valentiner, Am. der Phys. (4), 22, p. i; 1906.
'0 Valentiner, Am. der Phys. (4). 29, p. 4S9; 1912.
" (i) Warburg and Leithauser, Z. S. fur Instrk., SO, p. iiS, 1910; (2) Warburg and ]>itliauser, Z. S.
furlnstrk., 31, p. 124, igii; (3) Warburg, Hupka, and Miiller, Z. S. fur Instrk., 32, p. 134, 1912; (4) War-btirg, Leithauser, Hupka, and Miiller, Sitzer Akad, Wiss. Berlin I., p. 35, 1913; (5) Warburg, Leithauser,
Hupka, and Miiller, Ann. de Phys. (4), 40, p. 609, 1913; (6) Hoffmann and Meissner, Z. S. Instrk.. 3-3, p. 15-.
1913; (7) Warburg, Hupka, and Miiller, Z. S. Instrk., 34, p. 115. 1914; (8) Warburg and Miiller, Z. S.
Instrk., So, p. 98, 1915; (9) Warburg and Miiller, Ann. der Phys.. 4S, p. 410, 1915.

Cobientz] Coustauts of Spcctral Radiation 469
nication ^^ they reported a value of C = 14 570. They questioned
the temperature scale and proceeded to make their investigations
at high temperatures by using the radiation laws to establish their
temperature scale, thus avoiding the temperature scale as trans-
ferred from the gas thermometer by means of thermocouples.
They retain only one temperature fixed point, viz, gold at 1064°
(later 1063°). The higher temperatures (1400°) were determined
radiometrically.
In their next commimication (2) values are reported which
varied from C = 14 200 to 14 600. In the following report (3) the
fluorite prism gave values ranging from C = i4 300 to 14 600 and
it was discarded. A quartz prism gave a value of C = i4 360;
and in a more complete paper (4 and 5) the values of C = i4 370and A = 2894 are given. These values have stood for some years.
A subsidiary investigation (6) of the relative brightness of a black
body at the melting point of palladium and of gold gave a value
of C = i4 440.
Recently further data (8 and 9) were published, in which a value
of C = i4 250 was obtained from the temperature scale based on
the Stefan-Boltzmann law of total radiation and a value of C =
14 300 or 14 400 was obtained by using the Wien displacement law
to establish the temperature. The imcertainty in the value of C =
14 300 or 14 400 is owing to the imcertainty in their calibration
curve (refractive indices) of the quartz prism which is now being
investigated. The present status is the adoption ^^ of the value of
C = i4 300, although from the reliability of Paschen's determina-
tions of the refractive indices of quartz the chances are that the
higher value (C = 14 350 to C = 14 400) may be foimd nearer the
correct value.
In passing, it is of interest to note that their recent determina-
tions of the absorption coefficients of quartz are in close agreement
with those published by the writer,^* excepting at 2.21 fx, where
they find a narrow absorption band. Any errors made in elim-
inating the effect of this absorption upon the spectral energy
curve will affect the temperature scale and hence indirectly the
value of the spectral radiation constant.
From this brief review of the experimental data now available
it appears that the value of the spectral radiation constant lies
between C = 14 300 and C = 14 400.
12 Si'tzber., 44, p. 225; 1910.
13 Warburg, Verb. Phys. Ges., 18, p. i; January. 1916.
" This Bulletin, 11, p. 471; 1914.
470 Bulletin of the Bureau of StaJidards [Voi. 13
IV. SUMMARY
The present paper gives the result of a recomputation of the
constants of spectral radiation of a black body, which had been
published in a previous paper. This recomputation was necessi-
tated as the result of the adoption of a new and apparently more
reliable calibration cur\'e of the fluorite prism used in the work,
and as a result of the discover}^ of a small error which was found
in the pre\dous computations. Although these errors are small
(and would have been consideied negHgible four years ago) they
happen to be of the same sign and hence have an appreciable
effect upon the final result.
The results of the present computations give a mean value of
C = i4 369, which is close to the mean value of all the published
data.
The data of other investigators are summarized and it is found
that they lie close to C = i4 350.
From a consideration of the data now available it appears that
the values of the constants of spectral radiation are close to
C = 14 350 micron degrees.
^ = 2890 micron degrees.
and that the coefficient of total radiation is of the order of
0---5.7X io~'^ watt cm~^ deg."^
This indicates that the constant, h, of the quantum theory is of the
order h = 6.56 to 6.57 X lo"^^ erg sec,
Washington, March 24, 1 916.
APPENDIXNOTE ON METHODS OF CALCULATING THE SPECTRAL RADIATION CON-
STANTS
Because of the difficulties involved in maintaining a vacuumbolometer at a constant radiation sensitivity or in determining its
radiation sensitivity from day to day it has been the custom toobserve isothermal spectral energy curves and compute the valueof Xm as an intermediary step in obtaining the value of the con-stant C.
In the work just described the radiation sensitivity of the vacuumbolometer was determined by using the black body as a standardof radiation. It was therefore not possible to compare data ob-tained on different days, although the black body served as a con-venient standard of radiation for comparison while observing anyone isothermal energy curve.
The difficulty in obtaining a value of the constant C by compu-tation from observations on an isothermal spectral energy curvehas always been due to the uncertainty as to what formula shouldbe used. If the Wien equation is used, then 0^ = 5; and if thePlanck equation is used, then a = 4.9651.
In computing his values of Xm Paschen used the Wien equation,although it did not fit his best data. This gave him a high valueof C, as mentioned on a previous page, where a lower and moreprobable value is given.
From the very beginning of his investigations on black-bodyradiation the writer found that the Wien equation did not fit his
spectral energy curves. The assumption was therefore tenta-
tively made that the observed curves fit the Planck equation ; and,at the completion of the investigation, this was found to be truefor about 75 per cent of all the observed curves. This conclusion
was based upon the uniformity of the values of Xm which resulted
from computation (by the method of equal ordinates £^^^£^2)of values of \ and X2 which were taken far apart, and also close to-
gether, on the observed isothermal vSpectral energy curve.
The method of equal ordinates was used because in this mannerit was possible to utilize values of \ and X2 which correspond withvalues of E^i and £^2 which are closely the same in magnitude asoriginally observed, and hence contain the same errors of observa-tion;^^ also the slit widths are closely the same. This methoddoes not require the most accurate wave lengths and refractive
indices (at least not for values of X2 greater than 4.5 m) and it per-
1*^e bolometer-galvanometer (zero reading) is always unsteady by o.i to 0.3 mm whether the deflec-tion is s mm or 200 mm. Hence the parts of the curve having the same sized deflections have the sameaccuracy.
471
472 Bulletin of the Bureau of Standards {vd.13
mits the selection of parts of the spectral energ}- cur^'es Trhich are
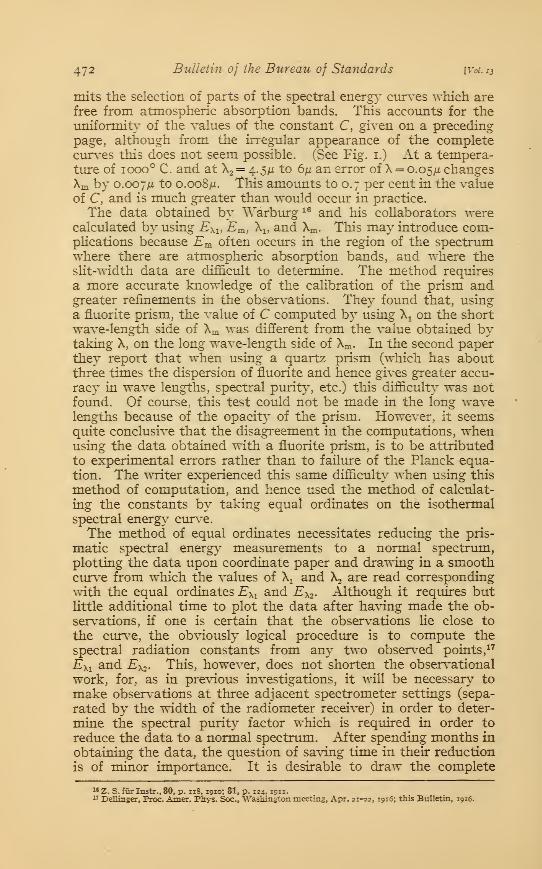
free from atmospheric absorption bands. This accoimts for theimiformity of the values of the constant C, given on a precedingpage, although from the irregular appearance of the completecur\^es this does not seem possible. (See Fig. i.) At a tempera-ture of 1000° C. and at X2 = 4. 5m to 6^ an error of X = o.o5,a changesXm by 0.007M to 0.008//. This amounts to o. 7 per cent in the valueof C, and is much greater than would occur in practice.
The data obtained by Warburg ^^ and his collaborators werecalculated by using E^^, Em, \, and Xm- This may introduce com-plications because E^ often occurs in the region of the spectrumwhere there are atmospheric absorption bands, and where theslit-width data are difficult to determine. The method requires
a more accurate knowledge of the calibration of the prism andgreater refinements in the obsen,'ations. They found that, usiag
a fluorite prism, the value of C computed by usiag X^ on the short
wave-lensrth side of Xm was different from the value obtained bvtaking X, on the long wave-length side of Xm. In the second paperthey report that when usiag a quartz prism (which has aboutthree times the dispersion of fluorite and hence gives greater accu-
racy LQ wave lengths, spectral purit}', etc.) this difficulty was notfound. Of course, this test could not be made in the long wavelengths because of the opacity of the prism. However, it seemsquite conclusive that the disagreement ia the computations, whenusiag the data obtaiaed with a fluorite prism, is to be attributed
to experimental errors rather than to faflure of the Planck equa-tion. The writer experienced this same difficulty when usiag this
method of computation, and hence used the method of calculat-
iag the constants by takiag equal ordiaates on the isothermal
spectral energ}' cur\'e.
The method of equal ordiaates necessitates reducing the pris-
m.atic spectral energ\' measurements to a normal spectrum,plottiag the data upon coordinate paper and drawing in a smoothcurA'e from which the values of \ and X2 are read corresponding
with the equal ordiaates ^xi and Ex2- Although it requires butlittle additional time to plot the data after haviag made the ob-
ser\'ations, if one is certaia that the obser\^ations He close to
the cur\"e, the ob^-iously logical procedure is to compute the
spectral radiation constants from any two obser\'ed points,"
Exi and £^X2- This, however, does not shorten the obser\'ational
work, for, as in pre\aous iavestigations, it will be necessary to
make obser\'ations at three adjacent spectrometer settings (sepa-
rated by the width of the radiometer receiver) ia order to deter-
mine the spectral purity factor which is required in order to
reduce the data to a normal spectrum. After spending months in
obtaining the data, the question of sa\dng time in their reduction
is of minor importance. It is desirable to draw the complete
" Z. S. fur Instr., 30, p. ii8, 1910; 31, p. 124, 1911-1' Dellinger, Proc Ainer. Phys. Sex:., Washington meeting, Apr. 21-22, 1916; this Bulletin, 1916.
Cobienfz] Constants of Spectral Radiation 473
curve and preserve it for future reference. If the obser\^ations donot He close to the smooth curve then this method is slightly
arbitrary as to the manner of combining the observations so as
to obtain an integration of the whole curve without making morecomputations than would be used in the ** method of equal ordi-
nates."
The appropriate formula for computing the radiation con-
stants from any two points on an isothermal spectral energycurve is easily deduced from Planck's equation, and in its com-plete form, as shown by Dr. Bellinger, is:
The term ''log (i — ^~^^^) " may be expanded into a series andusually all the factors can be neglected, except one which is logg.g-cAsT^ It is therefore necessary to know the approximatevalue of C, as was required in the writer's ^^ method of computa-tion.
Dr. Delllnger has made computations on data observed by thewriter, using values of E^i and £^2, which are on opposite sides
of Eia, and which are closely the same in magnitude. He obtainedvalues of Xm, which are in very close agreement with the dataobtained by the writer, who used the method of equal ordinates,
Exi =Ex2- However, when the computations were made for twopoints which are on the same side of the maximum and which donot lie close to the smooth curve drawn through all the observa-
tions, some of the values of X^ are discordant, as observed byWarburg. This disagreement, however, was not systematic as
observed by Warbmrg and it was not greater than the experimentalerrors (2 per cent) that may easily be present in the work. Thismay seem a little disconcerting to those not familiar with the diffi-
culties in obtaining the observations. It is therefore relevant to saythat because of the small dispersion, the large errors of observa-
tion, the uncertainties in the dispersion and in the slit-widthfactors, the possible presence of scattered radiation (which appearsat 4. SIX to 5ju in the spectrum produced by a prism containing
numerous, cleavage surfaces), variations in temperature of theradiator, etc., the writer is of the opinion that the use of equalordinates (Exi =£^X2)> or the use of the general solution of Planck's
equation in which E'xi Q-^d Ex2 are closely the same and on opposite
sides of Em, is the most satisfactory method of calculating thespectral radiation constants from isothermal spectral energy curvesobtained with a fluorite prism. The general solution is probablya more sensitive test of the validity of Planck's equation, but it
requires more accurate experimental data than the writer could
obtain four years ago.
18 This Bulletin, 10, p. 7 (eq. 6); 1913.
474 Bulletin of the Bureau of Standards [Vd. 13
'n-^t,^^^
t o ^ o Oo o ^u ro n fO r^ CsJ c>i
::h cv^ o
NOI±D3-lJ3Cl d3J.3!^ONiyA-7L/<^
> <r^ O

cobimtz] Constants of Spectral Radiation 475
In Fig, I is shown the observed spectral energy curve (in dottedlines; Series LXXXVI, 191 2; see Table i) of a black body at atemperature of 1077° C- '^^^ normal curve is shown by the con-tinuous line. The arrows indicate points at which values of \and X2 were taken in order to compute Xm by the method of equalordinates.
This curve is typical of what was obtained when operating theradiator at 800° to 1000° C. From 1.7/1 to 3.5JL1 the curve is
irregular and often deeply indented, owing to atmospheric absorp-tion bands of water vapor and carbon dioxide. Part of the inden-tation at 1,711 might be caused by errors in the slit-width factors
used for reducing the data to a normal spectrum and by absorp-
tion in the prism which, although quite free from color, belongedto the green variety of fluorite. An examination ^^ of samples of
lightly colored green fluorites showed small absorption bands at
1.6 to 3.5^- Hence no attempt was made to obtain high accu-
racy in the observations extending from 2/x to 3ju, for it was notintended to use the data in the computations.The absorption bands of atmospheric water vapor at 5.6/^ to
6.2JU were also investigated.^^ At 6.25/i there is a narrow region
of minimum absorption, amounting to 10 to 12 per cent, followed
by absorption bands at 6.3 to 6.7/x.
In Fig. I the circles represent the computed emission, using
Planck's equation and C = 14 350. In the region of the spectrumfrom iju to 1.611 and from 3.6/x to 5.5JU there is a complete agree-
ment between the observed and the computed curve. Several
observed points deviate from the smooth curve by i to 2 per cent,
which is better than one can expect, considering the fact that acorrection had to be applied for a change in the radiation sensi-
tivity of the bolometer.
An inspection of Fig. i and Eq. 2, shows that inconsistent
values of C must result from combining data which are above andbelow the smooth curve and on the same side of Xm. The com-putation by the method of equal ordinates suppresses these errors
of observation by estimating the value of £^xi = ^X2 ^'^^ by placing
more of the burden of proof upon determinations of \ and Xg.
In obtaining the experimental data the usual procedure was to
begin observations by making a few readings at a few points pre-
ceding the wave length (i jit in this series) at which computationswere to be made. This was done for the purpose of *' warming upthe apparatus" and for obtaining the "purity factor" to reduce
the data to a normal spectrum. Only three readings were madeat 0.9 2/x, and the temperature of the radiator had not yet becomesteady. Hence, the wTiter does not consider the small difference
between the observed and the computed value at 0.9 2/i to be dueto a real disagreement between theory and experiment. Thesame is true for the region of the spectrum beyond 6/x. Correcting
19 This Bulletin, 9, p. ii6, Fig. 12.20 This Bulletin, 1, p. 635, Fig. 3-
-6 Bulletin of the Bureau oj Standards {Vol. 13
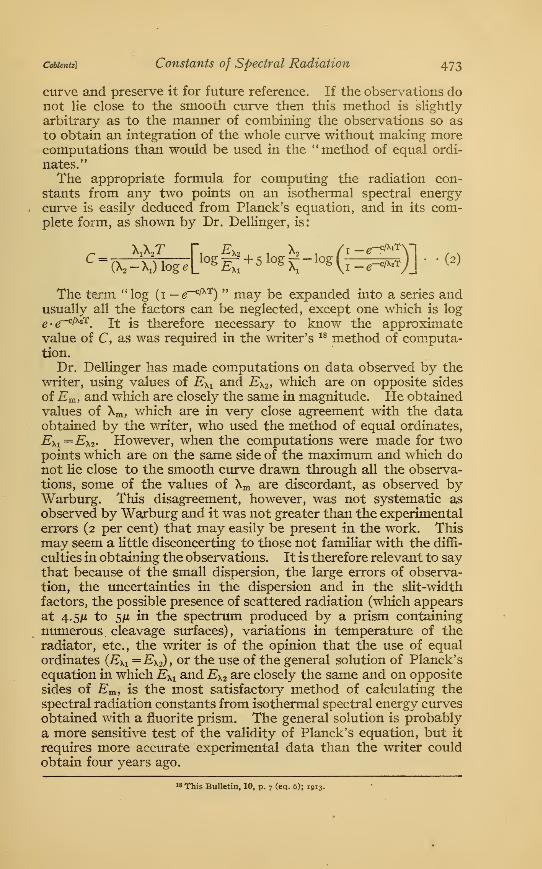
for atmospheric absorption at 6.24/1 produces exact coincidencebetween the obser\-ed and the computed values. "Wlien one con-siders that an accuracy higher than i per cent was difficult toattain,, and that momentar}- disturbances might introduce a rangeof 2 to 5 per cent in the galvanometer readings which were less
than 2 cm deflection, it is safe to say that the Planck equationfits the ex-oerimental data to 6.^ix.
Q O C; O Q o *= ^ O o o oo CO >j > d
In Fig. 2 is shown the spectral energy distribution at 1323^ C.
It is t\'pical of the cur\'es obtained at high temperatures. Thisillustration gives two series of measurements obtained at different
dates. The theoretical cun-e for 7=1596° K and C= 14350coincides remarkablv well with the obsen.-ations, considering the

cobientz] Constants of Spectral Radiation 477
possibility of stray light, especially at 5iU where the observations
are high. The low values at 0.7^1 to iju, in Figs, i and 2, may bedue to improper correction of the absorption by the silver mirrors.
The sHght shearing of the observed and the computed curves maybe due to incorrect temperatures. At any rate it is hardly suffi-
cient to be considered a real departtire from the Planck equation;although as mentioned in the previous paper there are some indi-
cations that the Planck equation may not fit the observations
beyond jfi.
As mentioned in the previous paper, these data are the first
indication that Planck's equation fits the experimental observa-tions in this region of the spectrum. The few discordant experi-
mental data obtained with optical pyrometers are hardly convinc-ing proof that this equation does not apply also to measurementsmade in the visible spectrum. To make the test more conclusive,
an outfit is being constructed for operating the radiator, andspectroradiometric apparatus in a vacuinn, in order to eUminateatmospheric absorption. Because of the numerous subsidiary
investigations which must be made preliminary to this investiga-
tion, some time must necessarily elapse before data can beobtained using all the apparatus in a vacuum.


![RISET DALAM PERENCANAAN PEMASARANeprints.dinus.ac.id/14368/1/[Materi]_ANALYZING_THE_SOCIAL... · melanggengkan perilaku. Tipe-tipe riset (Andreasen) ... Demo-Graphic forces Techno-Logical](https://img.dokumen.tips/doc/110x75/5c82614c09d3f2173c8bc0e4/riset-dalam-perencanaan-materianalyzingthesocial-melanggengkan-perilaku.jpg)


