Embed Size (px)
Citation preview

LTH
Consolidation properties of powder formulations
Projektering, KET050
Therese Areskoug, Olof Ed, Martin Nilsson & Maria Sundqvist
5/20/2013
Supervisors:
Christian Hulteberg, Lund University
Hans T. Karlsson, Lund University
Poul Bach, Novozymes

Abstract The project is a collaboration between Novozymes and LTH with the task to study the
consolidation properties of powders. The objective is to find the powder properties that effect
and ensures a good compaction and to see if a good compaction is equivalent to good tablets.
This is to improve the storage and transportation efficiency of powders that are difficult to
compact. Six model powders were studied namely milk powder, sodium sulfate, rabbit food,
detergent, sugar and gruel. The powder parameters measured were particle size and size
distribution, morphology, flowability, mean pore size, specific surface area, elasticity as well
as bulk, tap and true density. The compaction properties were investigated by tableting the
powders and measuring tablet density as well as tablet surface and crush strength.
Compaction ratio was chosen as the main variable to which all other properties were
compared. It was preferred over crush and surface strength because the goal is to have a good
compaction, not a strong tablet. The compaction ratio is defined as tablet density divided with
its initial bulk density. Milk powder was the best of the tested powders from a compaction
point of view, and also formed the best tablets. It is assumed that a powder with similar
properties would result in a good compaction. The results showed that the desired properties
are a low tap and true density as well as a low surface area and elasticity. The bulk and tablet
densities should be high.
Acknowledgements First of all we would like to thank Novozymes for giving us the task at hand. Poul Bach,
senior service manager at Novozymes has been providing support and guidance throughout
the project. We would also like to thank Christian Hulteberg at the Chemical Engineering
department of LTH for being our main supervisor. He has motivated and helped us find the
right path forward at times when we did not know how to proceed. Also we would like to
thank our course coordinator Hans T. Karlsson from the same department.
Birgitta Lindén has given us invaluable help by explaining and helping with the use of lab
equipment. She also performed the BET analysis for us which requires special thanks. We
have also been provided with extra lab equipment and valuable information about tableting
and tablet properties from Marie Wahlgren at the department of Food Technology. From the
same department, Malin Sjöö has been consulted on the chemometrics part of this report and
given valuable comments and affirmation on the method.

Table of Contents 1. Introduction ....................................................................................................................................... 1
2. Theory ................................................................................................................................................ 2
2. 1. Particle Size .................................................................................................................................. 2
2. 2 Morphology .................................................................................................................................. 3
2. 2. 1. Influences on Compaction ................................................................................................... 3
2. 2. 2. Measurement Techniques ................................................................................................... 4
2. 3 Porosity ......................................................................................................................................... 4
2. 3. 1 Measurement Techniques .................................................................................................... 5
2. 4 Density .......................................................................................................................................... 6
2. 4. 1 True density .......................................................................................................................... 6
2. 4. 3. Bulk density ......................................................................................................................... 7
2. 4. 5. Tapped density .................................................................................................................... 8
2. 5 Tableting ....................................................................................................................................... 8
3. Method .............................................................................................................................................. 11
3. 1 Sieving ......................................................................................................................................... 11
3. 2 Density Measurements .............................................................................................................. 12
3. 3 Size and Size distribution ............................................................................................................ 12
3. 4 Morphology ................................................................................................................................ 14
3. 5 Flowability .................................................................................................................................. 14
3. 6 Tableting ..................................................................................................................................... 14
3. 7 Surface hardness and Crush strength ......................................................................................... 16
3. 8 Elasticity ...................................................................................................................................... 18
3. 9 BET .............................................................................................................................................. 18
4. Results and Discussion .................................................................................................................... 19
4. 1 Density ........................................................................................................................................ 19
4. 2 Size and Size distribution ............................................................................................................ 21
4. 3 Morphology ................................................................................................................................ 23
4. 4 Flowability .................................................................................................................................. 25
4. 5 Surface hardness and Crush strength ......................................................................................... 26
4. 6 Elasticity ...................................................................................................................................... 27
4. 7. BET ............................................................................................................................................. 28
4. 8 Chemometrics ............................................................................................................................ 30
4. 9. General Discussion .................................................................................................................... 38

5. Conclusions ...................................................................................................................................... 40
6. Future Work .................................................................................................................................... 42
References ............................................................................................................................................ 43
Appendix .............................................................................................................................................. 46

1
1. Introduction A powder is made up from a large number of individual particles, thus it is difficult to predict
the bulk powder behavior based on the measured properties of individual particles [1].
Understanding how different powder properties affect compaction is an essential part in order
to optimize a process, evaluate certain unit operations and for storage, transportation or final
packing. Novozymes in collaboration with the Chemical Engineering department at LTH has
given the task to investigate this matter, particularly with respect to powders that are known to
have bad compaction properties. The objective is to find the powder properties that effect and
ensures a good compaction and to see if a good compaction is equivalent to good tablets. The
powder parameters measured were particle size and size distribution, morphology,
flowability, mean pore size and specific surface area, elasticity as well as bulk, tap and true
density. The compaction properties were investigated by tableting the powders and measuring
tablet density as well as tablet surface and crush strength. Powder properties and
corresponding compaction properties were then studied to see if any correlation between the
two could be found and thus what properties that are important in order to have a powder with
good compactability. The investigated powders were milk powder, sodium sulfate, rabbit
food, detergent, sugar and gruel.

2
2. Theory Previous theoretical knowledge has been summarized in categories corresponding to the
parameters investigated in this project. The influence of particle size and size distribution,
morphology, porosity, density and compaction processes have all been discussed in the
following chapters.
2. 1. Particle Size To characterize a particle, certain information is required such as the particle size, shape and
size distribution. The compaction of a powder is dependent on the particle size which can be
varied in a controlled manner. The smaller the particles are, the less void the packing
contains. Different measurement methods are suitable for different particle sizes. Sieving is a
basic method with wide size range, approximately 5-4 000µm but all depends on the sieve
mesh size, to divide and categorize the particles into size intervals. Other methods frequently
used to categorize the particle size are optical microscopy, which has an approximate size
range of 0.8-150µm, and laser diffraction. Most particles that form a powder, organic or
otherwise, will not have a spherical shape, and thus it is convenient to express an equivalent
circular diameter. Table 1 describes the characteristics of size ranges. [2]
Table 1. Characteristics of particles in different size ranges. Table adapted from Axelsson [2].
Size Range
(μm)
Component Bulk Characteristic
3000-30 000
(can be as low as
1000 μm)
Grain and
lump
Broken
solid
Free-flowing, but could cause mechanical
arching problems during discharge from
bins and silos
100-1000 Granule Granular
solid
Easy-flowing with cohesive effects if % of
fines is high
< 100 Particle Powder
10-100 Particle Granular
powder
May show cohesive effects and some
handling problems
1-10 Particle Superfine
powder
Highly cohesive; very difficult to handle
< 1 Particle Ultrafine
powder
Extremely difficult (or impossible) to
handle
All particles in a powder are not mono-sized, i.e. have uniform size distribution. The size
distribution that would be most beneficial is a normal distribution which makes the analysis of
the size easier. [3] Having a wide range of particle sizes is favorable to create a good tablet.
The smaller particles can fill out the voids between the larger particles and a denser packing
with larger possibilities of surface interactions can be achieved. [4]
3
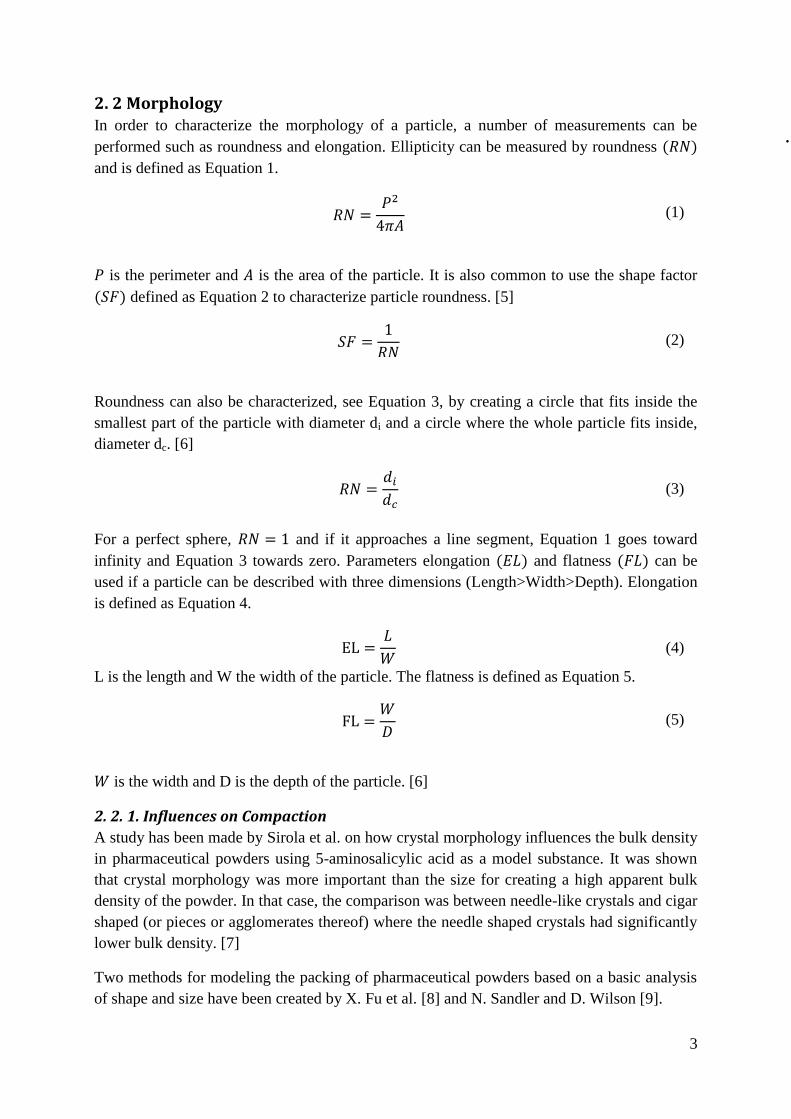
2. 2 Morphology In order to characterize the morphology of a particle, a number of measurements can be
performed such as roundness and elongation. Ellipticity can be measured by roundness
and is defined as Equation 1.
(1)
is the perimeter and is the area of the particle. It is also common to use the shape factor
defined as Equation 2 to characterize particle roundness. [5]
(2)
Roundness can also be characterized, see Equation 3, by creating a circle that fits inside the
smallest part of the particle with diameter di and a circle where the whole particle fits inside,
diameter dc. [6]
(3)
For a perfect sphere, and if it approaches a line segment, Equation 1 goes toward
infinity and Equation 3 towards zero. Parameters elongation and flatness can be
used if a particle can be described with three dimensions (Length>Width>Depth). Elongation
is defined as Equation 4.
(4)
L is the length and W the width of the particle. The flatness is defined as Equation 5.
(5)
is the width and D is the depth of the particle. [6]
2. 2. 1. Influences on Compaction
A study has been made by Sirola et al. on how crystal morphology influences the bulk density
in pharmaceutical powders using 5-aminosalicylic acid as a model substance. It was shown
that crystal morphology was more important than the size for creating a high apparent bulk
density of the powder. In that case, the comparison was between needle-like crystals and cigar
shaped (or pieces or agglomerates thereof) where the needle shaped crystals had significantly
lower bulk density. [7]
Two methods for modeling the packing of pharmaceutical powders based on a basic analysis
of shape and size have been created by X. Fu et al. [8] and N. Sandler and D. Wilson [9].
4
2. 2. 2. Measurement Techniques
There are two methods of investigating morphology of the particles, namely Scanning
Electron Microscopy, shortened SEM, and Light Microscopy. The latter can be used to
determine the projected shapes of the particles in the powder using ocular inspection. Newer
techniques allow the information to be directly transmitted to a computer which performs the
analysis electronically. For ocular analysis, the particles must all be in the same plane and
separated. More importantly, the sample that should be analyzed must be representative for
the bulk. The bulk containing the sample should therefore be homogenous. SEM is also a
useful technique in determining the shape of the particles. It can also provide information
about surface texture. In SEM, electrons scan across the sample which provides the
information. A drawback of SEM is the small sample size which causes the analysis to be less
quantitative, as well as the problem to shoot electrons on organic powders. However the
problem of shooting electrons on organic powders can be solved by applying a gold coating
on the sample. [10]
2. 3 Porosity Most materials are to some extent porous, which means that they contain pores, i.e. cavities,
channels or interstices, which are deeper than they are wide. The porosity of a material has a
major influence on the physical properties of the solid such as thermal conductivity, strength,
wetting behavior and density. The particles themselves can be porous; these voids are called
internal or intraparticle voids. But voids can also be created between two or more particles
next to each other due to shape and manner of packing of the constituent particles. These
voids are known as interparticle voids. It is therefore important to distinguish between the
intraparticle voids and interparticle voids. Following classifications divide the pores in
different sizes:
Micropores d < 2 nm
Mesopores 2 nm < d < 50 nm
Macropores 50 nm < d
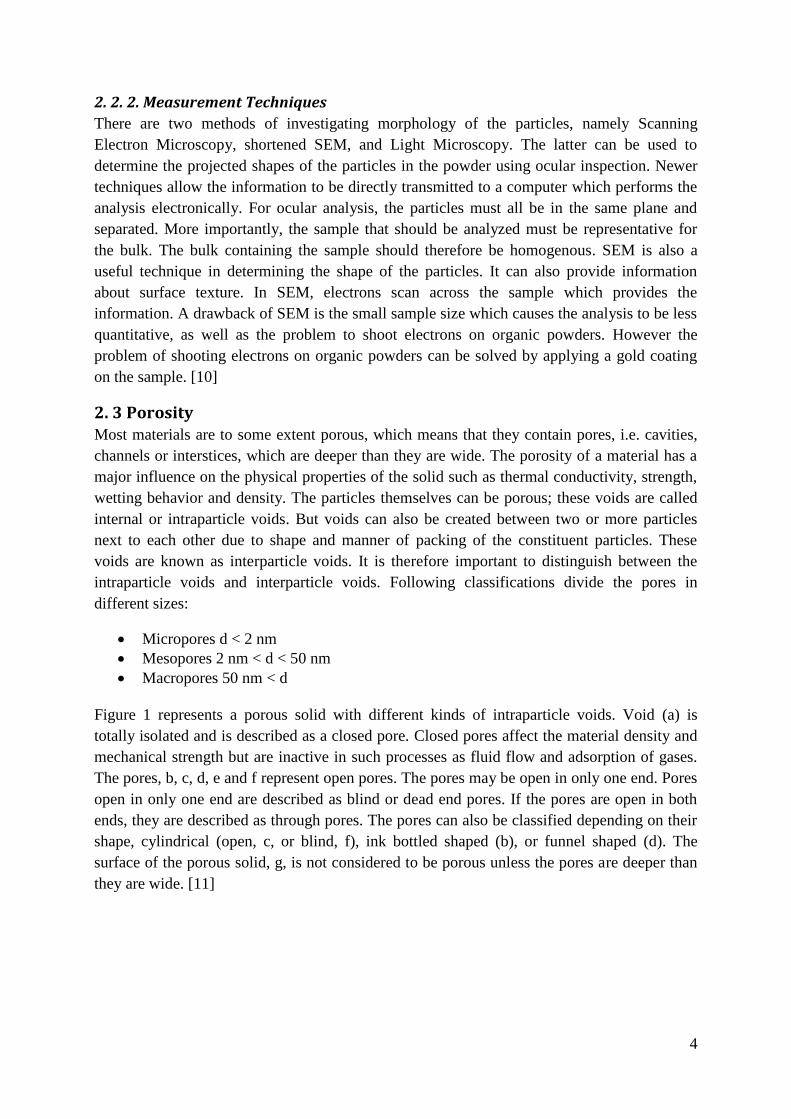
Figure 1 represents a porous solid with different kinds of intraparticle voids. Void (a) is
totally isolated and is described as a closed pore. Closed pores affect the material density and
mechanical strength but are inactive in such processes as fluid flow and adsorption of gases.
The pores, b, c, d, e and f represent open pores. The pores may be open in only one end. Pores
open in only one end are described as blind or dead end pores. If the pores are open in both
ends, they are described as through pores. The pores can also be classified depending on their
shape, cylindrical (open, c, or blind, f), ink bottled shaped (b), or funnel shaped (d). The
surface of the porous solid, g, is not considered to be porous unless the pores are deeper than
they are wide. [11]

5
2. 3. 1 Measurement Techniques
The complexity of porous materials has led to many experimental techniques for their
characterization. The term porosimetry is often used to include measurement of pore size,
volume, density and other porosity-related characteristics of a material. Mercury intrusion
porosimetry uses the non-wetting properties of mercury and its high surface tension, making
mercury perfect for probing pore spaces. Mercury does not spontaneously enter pores due to
capillary forces, therefore it must be forced into the pores by applying external pressure. The
required pressure is inversely proportional to the size of the pores. The external pressure
depends on the sizes of the pores, large pores requires a lower pressure. From the pressure
versus intrusion data, the method generates volume and size distributions using the Washburn
equations. The method is destructive, meaning that the sample is destroyed. [12] Due to the
high pressure applied the particles cannot be too fragile because of breakage risk. The starting
point when the interparticle voids are filled and the intraparticle voids are beginning to be
intruded must be possible to detect. This is impossible if the particles possess interparticle
voids which are the same size as the intraparticle voids. [13]
Another technique is Branauer-Emmett-Teller, BET, where gas adsorption measurements are
used for characterization of a variety of porous solids. The sample of known mass is
transferred to a sorption chamber. Inside the sorption chamber, the sample is progressively
dossed with known amount of gas, usually nitrogen at 77K, at incremental pressure steps.
There must be sufficient time between each pressure step in order to allow the system to reach
equilibrium. Once the final target adsorption pressure is achieved, usually at saturation
pressure, the reverse process takes places, called desorption. During desorption the gas is
withdrawn until initial state is reached. The quantity of gas at every step during the adsorption
and desorption process is recorded as a function of the relative pressure of the adsorptive gas.
This result in an adsorption-desorption curve known as a gas sorption isotherm. By applying
the BET method the specific surface area of the sample can be calculated from the gas
sorption isotherm. [14]
Figure 1. Schematic cross-section of a porous solid. Illustration from [11].

6
2. 4 Density Depending on how the total volume of a sample is measured, a number of different definitions
can be applied. The three densities defined in this chapter are true density, bulk density and
tap density.
2. 4. 1 True density
True particle (or substance) density is the average mass of the particles divided by the solid
volume, no voids included except those that are in the molecular packing arrangement, i.e.
within the unit cell configuration [15] [10]. The true density is determined by using
displacement methods such as gas/liquid pycnometry or flotation in a liquid [10].
Gas pycnometry is a method measuring the displacement of a gas, usually air or an inert gas
such as helium. The apparatus consists of two cylinders, as seen in Figure 2, containing
pistons, one for reference (A) and one to put the powder sample (B). The general principle is
to try and keep both of these cylinders at the same gas pressure, which is monitored with a
differential pressure indicator. As the sample is introduced into the cylinder B, a new pressure
value will be induced upon cylinder A causing the piston inside cylinder B to move forward
in order to reach the same pressure. But seeing as the powder sample occupies extra volume,
the piston will not move the same distance as in A. This distance difference will hence
proportional to the volume of the sample [1].
Overall gas pycnometry is an easy, reproducible and non-destructive method that can be used
in a material-sparing way [10]. However, when handling organic powders, one must take into
consideration that they often consist of particles that are both soft and porous and should be
tested at lower operating pressures than that of the equipment standard. For food powder the
pressure range should be around 0.5-1 bar. Some particles can have an active surface that can
interact and absorb with gas during testing, introducing errors. This is easily avoided by using
an inert gas instead of air. [1] Removal of volatile contaminants, that can cause errors in the
measurement by escape from the powder during the testing, is achieved by a purging of the
sample [10].

7
2. 4. 3. Bulk density
Bulk density is the density at a random loose packing and is defined as the mass of the
powder divided by the total volume occupied, where the interparticle void volumes are
included. The extent of void volume is dependent on characteristics such as particle shape,
particle size distribution, interparticle friction, and cohesion [10].
Bulk density of a powder is determined by measuring the volume of a known mass sample.
This is generally done by passing the sample through a sieve into a graduated cylinder. The
untapped, or “aerated”, bulk density is then read to the nearest graded unit, being careful not
inflict additional compression onto the powder. Other methods to measure the untapped bulk
density is to have the powder being passed through a volumeter, or a measuring vessel. [16]
Figure 2. Describes calibration of the instrument (a), the beginning of the testing
(b), the piston displacement (c), and the reading (d). Illustration from Barbosa-
Cánovas, et al. [1].

8
2. 4. 5. Tapped density
Tapped density is the mass divided by the volume occupied after mechanically tapping the
container containing the powder sample. Hence there is an increase of the bulk density and
this represents the random dense packing.
Particle size distribution has been shown to have an effect on packing properties and hence
the tapped density and the void fraction in a packed bed. In a relatively recent report, by
Suzuki, et al [17], the effects of size distribution on tapping properties of fine powder were
examined. The two kinds of test powders used were fly ash, with a spherical morphology, and
silica powder, that has an irregularly shaped morphology. By examining the powders at
different size distributions, particle sizes and different tapping numbers; they were able to
attain that the void fraction of fly ash particles greater than 15µm would remain constant
while the void fraction for the silica powder continued to decrease with increasing particle
size, as the inter-particle friction between the irregular particles seemed to be much stronger.
It was also shown that the void fraction, of a packed bed with a log-uniform size distribution,
experienced a decrease with a wider size range, as the more fine powder particles can enter
voids between the larger particles making it more packed.
The measurement of the trapped density is a continuation from earlier determination of the
untapped bulk density. By allowing the cylinder to be raised, and then dropped under the
influence of its own weight, using a tapped density tester that operates at a fixed drop distant
and nominal drop rate, it is possible to measure the tapped density. [10]
2. 5 Tableting Tableting is one way to compact a powder and it is used mainly for pharmaceutical products.
There are different machines that can be used for creating tablets, the main types are single
punch machine or rotary tablet machine. The single punch machine creates tablets by filling
the die with the powder, usually via a hopper which is removed after filling. The upper punch
then applies pressure enough to create a tablet. Both the upper and the lower punch slide
upwards, pushing the tablet out of the die. Lastly, the hopper slides back and push the tablet
off the die area [18]. A tablet press of this type is limited to a production of 150-200 tablets
per day which means that it is limited to small scale production.
9
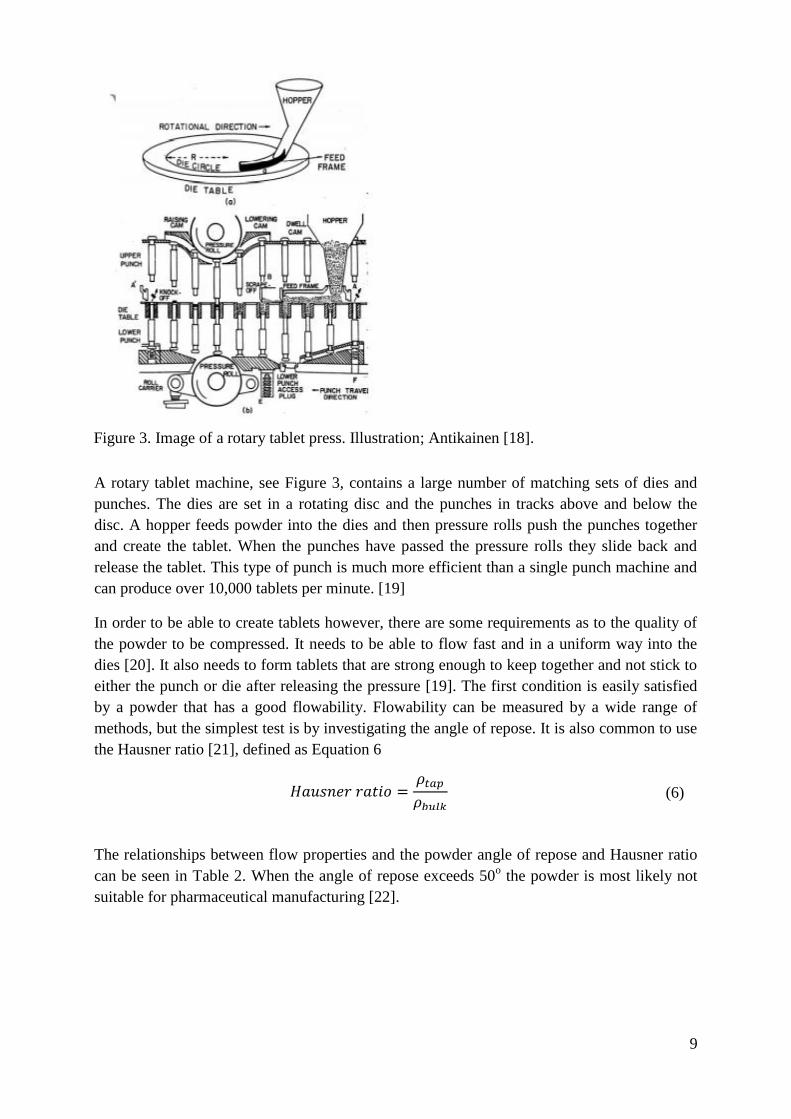
A rotary tablet machine, see Figure 3, contains a large number of matching sets of dies and
punches. The dies are set in a rotating disc and the punches in tracks above and below the
disc. A hopper feeds powder into the dies and then pressure rolls push the punches together
and create the tablet. When the punches have passed the pressure rolls they slide back and
release the tablet. This type of punch is much more efficient than a single punch machine and
can produce over 10,000 tablets per minute. [19]
In order to be able to create tablets however, there are some requirements as to the quality of
the powder to be compressed. It needs to be able to flow fast and in a uniform way into the
dies [20]. It also needs to form tablets that are strong enough to keep together and not stick to
either the punch or die after releasing the pressure [19]. The first condition is easily satisfied
by a powder that has a good flowability. Flowability can be measured by a wide range of
methods, but the simplest test is by investigating the angle of repose. It is also common to use
the Hausner ratio [21], defined as Equation 6
(6)
The relationships between flow properties and the powder angle of repose and Hausner ratio
can be seen in Table 2. When the angle of repose exceeds 50o the powder is most likely not
suitable for pharmaceutical manufacturing [22].
Figure 3. Image of a rotary tablet press. Illustration; Antikainen [18].

10
Table 2. Flow properties for different Angles of repose and Hausner ratio adapted from Carr [22].
Flow property Angle of repose (degrees) Hausner
ratio
6- Excellent 25-30 1.00-1.11
5- Good 31-35 1.12-1.18
4- Fair – aid not needed 36-40 1.19-1.25
3- Passable – may hang up 41-45 1.26-1.34
2- Poor – requires agitation 46-55 1.35-1.45
1- Very poor 56-65 1.46-1.59
0- Extremely poor >66 >1.60
After the powder has been successfully introduced into the die, it is to be compressed. The
particles rearrange and form a less porous structure at very low pressures. When the pressure
increases, the particles start to break or deform (in some cases both), the deformation can be
either plastic or elastic. The deformation caused by elasticity means that the particles revert to
the shape they had before compression while plastic deformation means that the particles stay
in the same shape as when exposed to pressure. In order to create a strong tablet, the plastic
deformation should outweigh the elastic since otherwise there is a risk that it disintegrates
fully or partially. Another related problem is the fact that the pressure applied to the powder is
not evenly distributed. Pressure zones of higher and lower pressure are created during the
compression causing weakness points in the tablet. These are extra sensitive areas when
elasticity or other stresses occur after removing the pressure. It is common for a low pressure
zone to occur just below the surface, causing the top part of the tablet to fall off. The
phenomenon is called capping or lamination and can be reduced by making sure the powder is
not too dry and that the compression force is neither too high nor too fast. [19] [18] Surface
rupture that does not form a sheet or a disc is more likely caused by sticking of the granules to
the surface of the die and can be reduced by adding lubricant or reducing the moisture content
of the powder. [23]
The initial particle size and size distribution is highly important for the tabletability of a
powder. Smaller particles can fill in the gaps between larger particles which results in a higher
density. They also have more relative surface area available for binding to other particles,
resulting in a stronger tablet [24]. It is common to granulate the powder before tableting in
order to improve flowability, decrease dusting and segregation of powder components as well
as the compressibility of the material. The ideal particle size for tableting is usually 200-
500µm. [18]
11
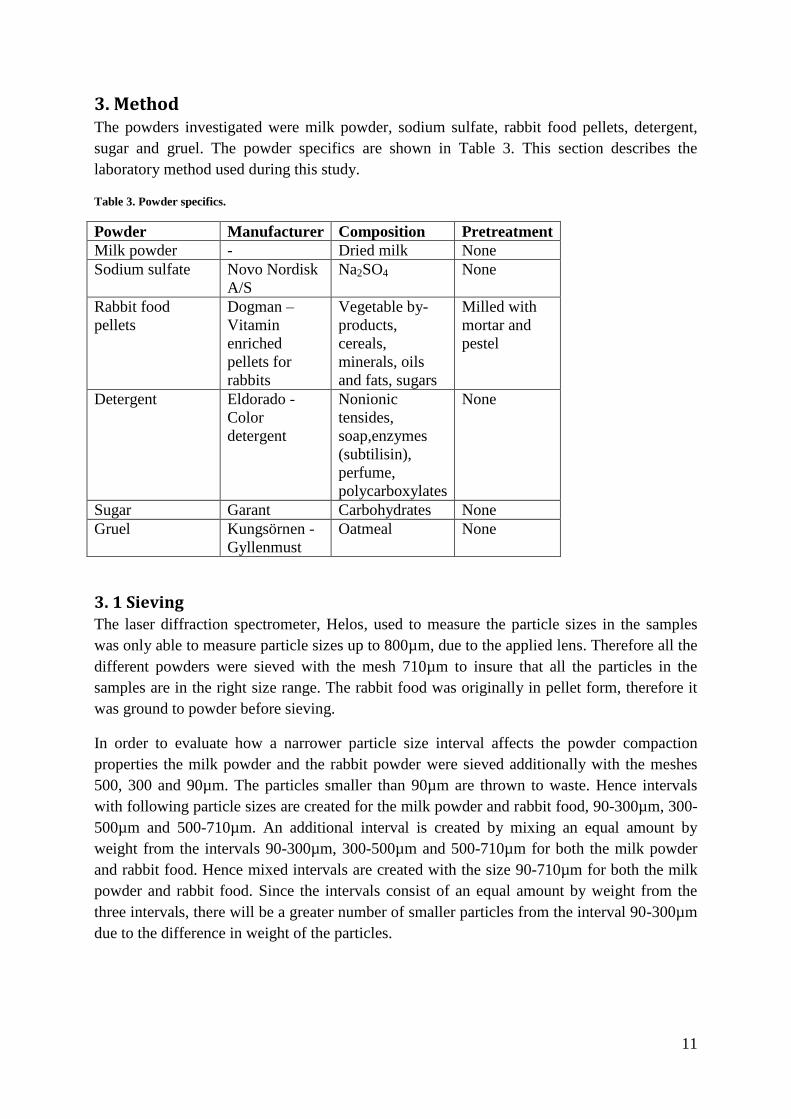
3. Method The powders investigated were milk powder, sodium sulfate, rabbit food pellets, detergent,
sugar and gruel. The powder specifics are shown in Table 3. This section describes the
laboratory method used during this study.
Table 3. Powder specifics.
Powder Manufacturer Composition Pretreatment
Milk powder - Dried milk None
Sodium sulfate Novo Nordisk
A/S
Na2SO4 None
Rabbit food
pellets
Dogman –
Vitamin
enriched
pellets for
rabbits
Vegetable by-
products,
cereals,
minerals, oils
and fats, sugars
Milled with
mortar and
pestel
Detergent Eldorado -
Color
detergent
Nonionic
tensides,
soap,enzymes
(subtilisin),
perfume,
polycarboxylates
None
Sugar Garant Carbohydrates None
Gruel Kungsörnen -
Gyllenmust
Oatmeal None
3. 1 Sieving The laser diffraction spectrometer, Helos, used to measure the particle sizes in the samples
was only able to measure particle sizes up to 800µm, due to the applied lens. Therefore all the
different powders were sieved with the mesh 710µm to insure that all the particles in the
samples are in the right size range. The rabbit food was originally in pellet form, therefore it
was ground to powder before sieving.
In order to evaluate how a narrower particle size interval affects the powder compaction
properties the milk powder and the rabbit powder were sieved additionally with the meshes
500, 300 and 90µm. The particles smaller than 90µm are thrown to waste. Hence intervals
with following particle sizes are created for the milk powder and rabbit food, 90-300µm, 300-
500µm and 500-710µm. An additional interval is created by mixing an equal amount by
weight from the intervals 90-300µm, 300-500µm and 500-710µm for both the milk powder
and rabbit food. Hence mixed intervals are created with the size 90-710µm for both the milk
powder and rabbit food. Since the intervals consist of an equal amount by weight from the
three intervals, there will be a greater number of smaller particles from the interval 90-300µm
due to the difference in weight of the particles.

12
3. 2 Density Measurements True density was determined using a helium pycnometer (Micromeritics AccuPyc 1330). The
accuracy of the apparatus is within 0.03% of the reading value, and during the analyses the
apparatus allow purges for sample cleaning, as well as for air and moisture removal from the
chambers. [25] For each powder sample, two measurements were performed to affirm a good
reproducibility.
The bulk and tap density was manually measured by filling a measurement cylinder with
approximately 30 ml powder, carefully not to add any additional pressure which might
compact the powder. The powder was weighed in order to calculate the bulk density. After
this, the cylinder was raised approximately 1 dm above the table and tapped in a controlled
manner 20 times against the tabletop. The new volume was measured and the tap density
calculated. To confirm the reproducibility 3 measurements were done.
The tablet density was calculated by using a digital caliper to measure the height and
diameter. The mass of the tablet was weight in the tablet press mold, which was a constant
0.5g for each powder.
3. 3 Size and Size distribution For the size determination of the particles in a sample a laser diffraction spectrometer
equipped with a dry dispersing unit and a vibratory feeding unit is used. The laser diffraction
spectrometer is of type HELOS 12LA, the dry dispersing unit is of type Rodos T4 and the
vibratory feeding unit is of type DR1000 Both the spectrometer and the dispersing unit are
manufactured by Sympatec. The vibratory feeding unit is manufactured by Retsch. The
equipment can be seen in Figure 4.
Figure 4. Equipment used during size determination showing the vibratory feeding unit (A), the dispersion unit Rodos
(B) and the laser diffraction spectrometer, Helos (C).

13
The vibratory feeding unit is loaded with a dry powder sample and provides the dry dispersing
unit, Rodos, with powder. The powder is transported along a vibrating chute that causes the
particles in the sample to move forward and falling down to Rodos. A constant mass-flow is
important in order to achieve a good dispersion of the sample. The vibratory feeder is
equipped with an amplitude control that determines the mass-flow of particles to Rodos. [26]
The powder provided by the vibratory feeding unit to the dry dispersing unit, Rodos, falls
down in a hopper. The powder is then fed through a nozzle with the help of compressed air
forming an aerosol jet with compressed air and sample powder. A smooth and homogeneous
dosing is required in order to achieve a good dispersion of the powder sample passing through
the detector in the laser diffraction spectrometer. If the dispersion of the powder sample
passing through the detector is bad, the particles in the powder will overlap each other
forming larger particles. The detector will then measure the size of the agglomerate instead of
the primary particle sizes. [27]
The laser diffraction spectrometer, Helos, consists of a laser beam and a detector. Helos is
connected to a computer with the Sympatech software Windox, that register the response
from the detector and presents the results from the measurement.
The aerosol jet composed of air and sample powder passes Helos laser beam and the detector
registers the particle sizes in the sample. The diffraction of the laser light results from the
interaction of the light with the particles and is described mathematically by the Fraunhofer
theory. The diffraction pattern in the simplest case, a single spherical particle, forms a ring
structure. This can be seen in Figure 5. The distance r0 of the first minimum to the center is
depending on the particle size. [28]
Figure 5. Diffraction pattern of a single spherical particle. . Illustration from Sympatech [28].
To perform the analysis the container with the powder is first rotated to mix the different
particle sizes creating a homogenous composition of the different sizes in the entire container.
A sample from the container, approximately 10 g, is then applied to the vibratory feeding unit.
The analysis is then started in the program Windox that collects the data from the laser
diffraction spectrometer.

14
3. 4 Morphology Using light microscopy, Nikon Optiphot and Visicam 1.3, pictures of the powder particles
were taken and studied. Two different zooms were used, 2/0.05 160/- and 20/0.4 160/0.17.
One lens was used to see the quantitative morphology and size while the other lens, with a
larger zoom, was used to give a more qualitative picture. Calibration of the lenses was
conducted to give a scale, and thus give a proper measurement of the powder particles.
As the powder particles are not transparent, only the 2D projections are visible. When the
particles were too large to fit on the screen, only the edges were shot.
3. 5 Flowability A funnel was used to direct the powder into a pile as uniformly as possible. The funnel end
was kept close to the pile in order to keep the pile from being smashed from the force of
falling particles. A picture was taken of the pile from straight on. The angle of repose was
measured as the largest angle along the slope from the horizontal plane by using the ruler tool
in Adobe Photoshop CS3.
The flowability was also checked by calculating the Hausner Ratio, see equation 6 in section
2.5 Tableting.
3. 6 Tableting The tablet press that has been used for tableting the powders was a manual single punch
machine of unknown manufacturer. It consisted of a top plate (A), bottom plate (B), a punch
(C), two inserts (D), a lever (E), pressure gauge (F), vacuum hose (G) and a pressure chamber
(H). All parts are displayed in Figure 6 and Figure 7. The bottom and top plate were stuck
together and the lower insert was inserted. Then the powder was weighed and inserted, 0.5g
of powder was used. The punch was inserted on top of the upper insert. It was all placed
centered in the pressure chamber and vacuum was attached. The screw on top of the chamber
was fastened and the vacuum turned on. The lever on the pressure chamber was pulled at until
the correct pressure was reached and then kept for a certain time, 4 minutes. The applied
pressure was 450 MPa for all powders with the exception of sugar and sodium sulfate. Sugar
was exposed to a pressure of 150 MPa and sodium sulfate to 300 MPa.
Lastly, the vacuum was turned off, the pressure released and the die removed from the
pressure chamber. The bottom plate was removed and the inserts and finished tablet were
tapped out by hand.

15
Figure 6. The loose parts of the tableting machine consist of a top plate (A), bottom plate (B), punch (C) and top and
bottom inserts (D).
Figure 7. Tableting machine where (E) is the lever, (F) is the pressure gauge, (G) is the vacuum hose and (H) is the
pressure chamber.
E
F G
H

16
3. 7 Surface hardness and Crush strength The surface hardness of the tablets made from various powders is tested in a friability tester of
type Erweka TA. The friability tester can be seen in Figure 8A. Three tablets made of one
powder are weighed together and then placed in the friability tester’s drum. The friability
tester’s drum can be seen in Figure 8B. When the friability tester starts the drum rotates
causing the tablets to break. The drum rotates at constant speed hence the test time determines
the number of rotating laps of the drum. The test time is set at 4 min which corresponds to
100 rotating laps of the drum. After the test, the tablets are again weighed to calculate how
much mass the tablets have lost in the friability tester. A tablet with high surface hardness will
encounter low loss of mass during the friability test. This procedure was repeated for all
powders separately.
Figure 8. Friability tester (A) and drum (B) used to measure surface hardness.
The crush strength of the tablets was measured in a hardness tester of type Schleuniger 4M,
which is shown in Figure 9. A tablet was placed in the hardness tester and the pressure
required to break the tablet was measured. The test was repeated three times on each powder
and size to confirm the reproducibility.
A B

17
Figure 9. Crush strength tester.
However, some of the tablets were too soft and did not have a specific breaking point.
Because the crush strength tester can only measure the specific point where the tablet snaps,
TA-XT2i Texture analyzer, see Figure 10, was used in order to determine the maximum
pressure endurance for tablets made out of rabbit food pellets and gruel.
Figure 10. TA-XT2i Texture analyzer for measuring crush strength.

18
The program was set to measure Tablet Compression which produced a pressure curve. An
example of a pressure curve for rabbit food, sieve size interval 500-710µm, can be seen in
Figure 11.
Figure 11. Pressure curve from Texture Analyzer for rabbit food (sieve size interval 500-710µm).
The tablets were placed one by one in a standing position on the stand below the piston. The
program was run and a pressure curve produced. As in the crush tester, three tablets of each
powder and size were analyzed and the maximum pressure was directly compared to the
pressures obtained by the crush strength tester after conversion to the same pressure unit.
3. 8 Elasticity The diameter of the tablets was measured immediately after taking it out of the die with a
digital caliper. The measured tablet diameter was then compared with the diameter of the die
to be able to calculate the percentage of springback or radial recovery, due to elastic
deformation of the tablet.
3. 9 BET The powder particles were analyzed for changes in their BET surface areas measured by the
adsorption of nitrogen at liquid nitrogen temperature using a Micromeritics ASAP 2400
instrument after degassing for 16 h at 473 K. Pore volume analysis was performed using the
BJH method [29]. The Halsey formula [30] was used to calculate the thickness of the
adsorbed layer (t-value). The desorption-isotherm was used for the analysis; the values are
average values of 2 analysis runs were used. [30]

19
4. Results and Discussion In this section, the results for each of the measured parameters have been compiled and
discussed. Both individual plots for each parameter and a chemometric analysis for all
parameters are presented.
4. 1 Density Figure 12 presents the results from the density measurements performed for all the different
powders, i.e. all sieved size intervals of milk powder and rabbit food, as well as for sodium
sulfate, detergent, sugar and gruel. The true density measurements for the 90-710µm intervals
consist of an average value taken from the other intervals for each corresponding powder
since it did not vary significantly between the powders. The standard deviation can also be
seen in the figure since the staples are mean values from the measurements made. The
standard deviation is low (see the figure), which show good reproducibility of the
measurements. The bulk density of each powder varies slightly between the different particle
sizes, which can be seen for the milk powder and rabbit food in the figure. Detergent has the
highest bulk density of the powder tested while milk powder with particle sizes in the sieve
interval 500-710µm has the lowest bulk density.
The measured tap densities are very similar to the bulk density for all the different powders.
However small differences can be seen in the Figure 12 where the tap density for all the
powders has a somewhat higher density compared to the bulk density. Sodium sulfate has the
largest difference between bulk and tap density; all the other powders have a similar
difference between bulk and tap density.
Figure 12. Bulk, tap, tablet and true density measurements with standard deviation.
0,00
0,50
1,00
1,50
2,00
2,50
3,00
De
nsi
ty g
/cm
3
Density
Bulk density
Tap density
Tablett density
True density

20
The density measured on the tablets made of the different powders varies between 1.09 g/cm3
and 2.21 g/cm3. Sodium sulfate has the highest tablet density while rabbit food with the
particle sizes in the sieve intervals 500-710µm and 90-710µm has the lowest tablet density.
The true density for each powder is independent of the particle sizes in the powder sample.
This can be seen for the milk powder and rabbit food as the true density do not vary with the
different particle size intervals. It is more expected that the tablet densities for the milk
powder should be uniform, since the powder has been granulated and might fall apart into
smaller particles as it is crushed. Milk powder tablets had a very uniform surface where no
individual particles could be made out while for example rabbit food of all sizes had clearly
visible and intact particles on the surface. However, the rabbit food powders still show a very
even distribution of tablet densities. Sodium sulfate has the highest true density while milk
powder has the lowest.
Figure 13 presents the compaction ratio where the tablet density has been divided with the
true density, which is the maximum possible compaction. The highest possible compaction
ratio is hence 1, since the tablet then has the true density. The applied pressures when making
the tablets were 300 MPa, except for sugar and sodium sulfate where the applied pressures
were 150 and 300 MPa respectively. Milk powder has the highest compaction ratio and the
variation of the compaction ratio between the different particle size intervals is very small.
Rabbit food has the lowest compaction ratio for all the different particle size intervals.
Figure 13. Maximum possible compaction ratio.
The ratio between the tablet density and bulk density, i.e. compaction ratio, for the powders
are shown in Figure 14. This ratio is a measurement of the powders compaction ability from
the bulk. As can be seen in the figure, milk powder with particle size 500-710µm has the
highest ratio and therefore best compaction ability. Rabbit food with particle size 90-710µm
has the lowest ratio and has the poorest compaction ability of the powders studied.
0,000,100,200,300,400,500,600,700,800,901,00
Tablet density/True density ratio

21
Figure 14. Compaction ratio, i.e. tablet density divided with bulk density.
4. 2 Size and Size distribution The size distribution curves, both the cumulative and the frequency distribution curve, are
illustrated in Figure 15 for milk powder, sieve interval 300-500µm.
Figure 15. Diagram displaying a typical cumulative and frequency distribution curve. This diagram was for milk
powder (sieve interval 300-500µm).
Two of the powder samples, milk powder and rabbit food, were sieved into three different
size intervals, 90-300µm, 300-500µm, and 500-710µm. The sieving is only a tool to separate
0
0,5
1
1,5
2
2,5
3
3,5
4
4,5
5
Tablet density/Bulk density ratio
0
10
20
30
40
50
60
70
80
90
100
cum
ula
tive d
istr
ibution Q
3(x
) / %
0
0.5
1.0
1.5
2.0
2.5
3.0
3.5
4.0
density d
istr
ibution q
3lg
(x)
0.5 1 5 10 50 100 500 1000
particle s ize / µm
Sympatec
WINDOX
Designator Nr. 1Nr. 2

22
the powder into intervals but the real size intervals for each of the powders are measured with
laser diffraction and are shown in Figure 16. It is shown that the real sizes differ from the
sieve sizes, much likely due to the geometry of the specific powder and the overall handling
of the sieving. In this case, milk powder has a tendency to disintegrate when handled roughly,
resulting in smaller particles than the sieve interval indicates, whereas rabbit food has great
variation in geometry and a large portion of elongated particles (see morphology in next
section). In a certain orientation, these particles have access to the smaller intervals when
sieving. Both milk 90-300µm and sodium sulfate were rather static, which might have
influenced the separation while sieving.
The highest value in Figure 16 is taken from the cumulative distribution curve, showing the
particle size below which 90% of the powder sample exists. In the same way the lowest value
is the particle size below which 10% of the powder sample exists. These two limits are called
x90 and x10.
The mode is the size with the highest frequency and seen as the top of the frequency curve in
Figure 15. In Figure 16 the mode of each powder sample is presented as a triangle. All of the
frequency distribution curves are more or less asymmetric, hence the high mode, and in the
case of sodium sulfate almost as high as the x90 value.
Figure 16. Real size distribution/intervals for all the powders. The highest to the lowest number adjacent to each
staple are x90, the mode and x10.
It is seen that milk powder has the largest particles, followed by sugar. Sodium sulfate has the
smallest particles as well as the narrowest size distribution. The widest size distribution
belongs to the mix sample of milk powder.
91
183
305
138
2 58
237
181
87 131
255
32
300
475
692
588
47
334
550 540 494 457
617
218 215
420
600
425
38
340
450 460
330
420
523
145
0
100
200
300
400
500
600
700
800
Size
Dis
trib
uti
on
µm
Size distribution

23
4. 3 Morphology Milk powder has an airy and bulky structure composed of smaller, seemingly spherical,
particles, which continue throughout the different size intervals. It is possible to spot variation
in size, which can indicate disintegration of larger powder particles. In Figure 17 light
microscope pictures of milk powder are shown for the same sieve interval 300-500µm, but in
two different magnifications.
Figure 17. Light microscope pictures of milk powder (sieve interval 300-500µm) for two different zooms. (A) show the
bulky appearance of milk powder and (B) the indication of breakage into smaller particles.
Sodium sulfate is a static powder, composed of much smaller particles than the milk powder.
Due to the static properties of the powder the particles cluster together to form large
structures. This was also observed for milk powder 90-300µm. These structures do not seem
to be uniform and depends on the static interaction between the smaller particles. As can be
seen in Figure 18A, it is possible to distinguish the smaller particles in the larger structure.
Sodium sulfate was difficult to apply onto the microscope-slide due to the static interactions.
Figure 18. Light microscope pictures of (A) Sodium Sulfate and (B) sugar. The pictures are taken with the same lens.
A B
A B
24
The sugar has a crystalline structure, as seen in Figure 18B, and a comparably large particle
size.
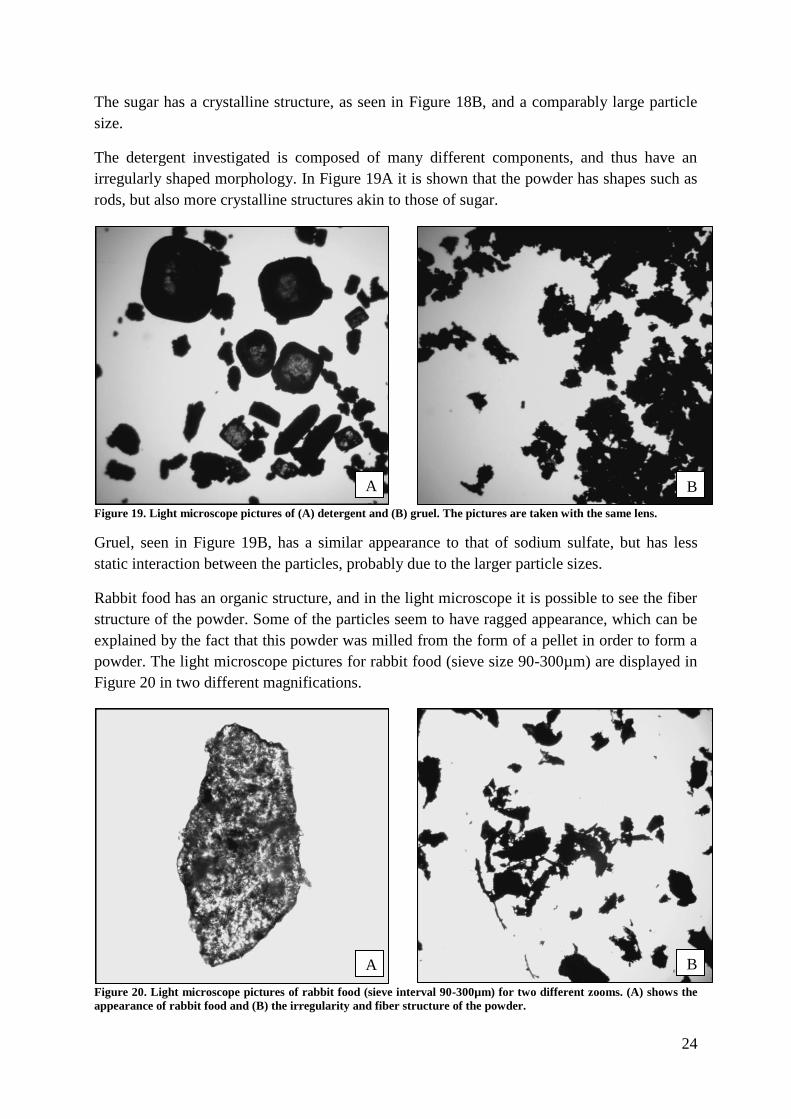
The detergent investigated is composed of many different components, and thus have an
irregularly shaped morphology. In Figure 19A it is shown that the powder has shapes such as
rods, but also more crystalline structures akin to those of sugar.
Figure 19. Light microscope pictures of (A) detergent and (B) gruel. The pictures are taken with the same lens.
Gruel, seen in Figure 19B, has a similar appearance to that of sodium sulfate, but has less
static interaction between the particles, probably due to the larger particle sizes.
Rabbit food has an organic structure, and in the light microscope it is possible to see the fiber
structure of the powder. Some of the particles seem to have ragged appearance, which can be
explained by the fact that this powder was milled from the form of a pellet in order to form a
powder. The light microscope pictures for rabbit food (sieve size 90-300µm) are displayed in
Figure 20 in two different magnifications.
Figure 20. Light microscope pictures of rabbit food (sieve interval 90-300µm) for two different zooms. (A) shows the
appearance of rabbit food and (B) the irregularity and fiber structure of the powder.
A
A
B
B

25
4. 4 Flowability The angles of repose and Hausner ratio have been graded accordingly to Table 2 where 0 is
the worst and 6 is the best. The results can be seen in Figure 21.
Figure 21. Flowability based on angle of repose and Hausner ratio.
Unfortunately, the angle of repose and Hausner ratio did not correspond well. Only milk
powder 300-500µm was classified in the same way by the two methods. According to the
classification system, a score of 3 or below means the powder should have bad flowability
properties. The only powder belonging to this class, according to the Hausner ratio, was the
gruel. However, according to the angle of repose, the mixed size interval of milk powder,
sodium sulfate, the gruel and all sieve size intervals of the rabbit food were given a score
below 3. According to experience obtained while working with these powders, the angle of
repose seems to be the more accurate method in this case. The powders that tended to get
stuck in the funnel while performing the angle of repose test and the ones that were hard to fill
in the small die were the ones given low scores. Hausner ratio on the other hand is not based
directly on flowability, but is instead a model based on the ratio between tap and bulk density.
Even though the model might seem unreliable in this case, it is widely used [21]. However,
the methods used to determine the tap and bulk density permits multiple errors. Firstly, the
bulk density volume measured may have been slightly over-packed since the powder fell
down from approximately 20 cm from the funnel to the bottom of the measuring glass. Most
likely, the tap volume was not compacted enough just from tapping by hand repeatedly 20
times. As can be read in the articles [31] and [32] the tap densities were determined by
tapping more than 20 times, in some cases a bulk and tap volumeter were used. It was also
shown by Abdullah and Geldart that the tapped density still increased for very small powders
even after 1200 taps made by a Copley Tap Density Volumeter. [33] The use of the Hausner
ratio is also often criticized because it has only been established empirically. [34]
The two methods for measuring flowability cannot be directly compared in this case, but the
relative results within each method it is still valid. The tendency seems to be that the mixed
0
1
2
3
4
5
6
Flowability
Angle of repose
Hausner ratio

26
powder fractions of milk and rabbit food have a significantly lower flowability than the other
fractions of the same powder. This is probably because the smaller particles can fill out the
voids between the larger particles. It creates a more stable pile due to the increased area where
friction and cohesive forces can influence the flowability.
4. 5 Surface hardness and Crush strength The remaining percent of the tablets after running the friability tester can be seen in Figure 22.
Figure 22. Percent remaining of the tablet after running the friability tester.
The surface strength of the milk powder tablets was very strong. All the different sizes were
very close to 100% intact after tumbling around for 4 minutes. Second best was sugar which
was also close to 100% intact even though the working pressure of the tablet press had been
adjusted to a pressure of 150 MPa instead of 450 MPa. It seems that once the pressure is
lowered capping and lamination of the tablet can be avoided, thus making sugar tablets with a
strong surface.
Rabbit pellets of sieve sizes 300-500µm and 500-710µm were completely disintegrated and
there were no pieces that could be weighed after the test. Surprisingly, the smallest sieve size
interval of rabbit pellets held together a lot better, almost 80% remained after testing. This
indicates that it is possible that the size or size distribution have an influencing factor to
surface strength. The different sizes of milk powder did however not show any difference,
which indicate that there are other influential properties. It might also simply be that the
bigger sizes of milk powder were crushed to smaller particles which gave them a stronger
surface. Small particles are not enough though because the gruel, that has relativity small
particles, was one of the powders that disintegrated completely.
0
10
20
30
40
50
60
70
80
90
100
Friability test - % remaining
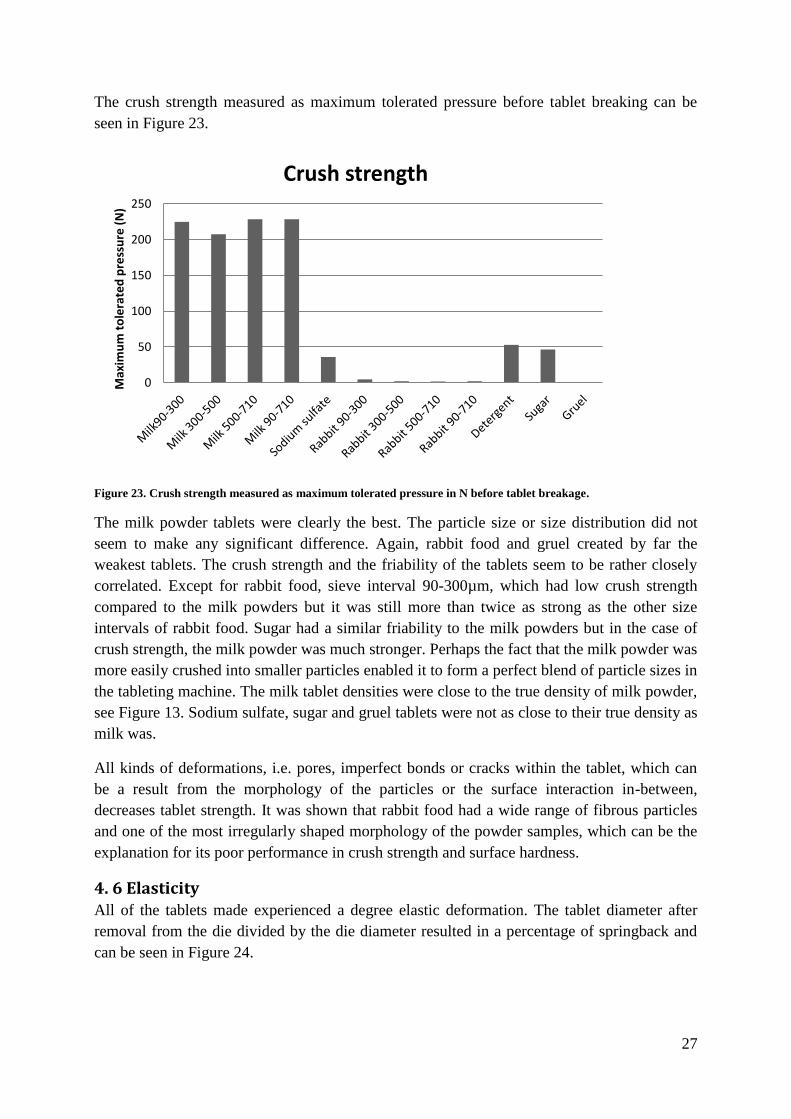
27
The crush strength measured as maximum tolerated pressure before tablet breaking can be
seen in Figure 23.
Figure 23. Crush strength measured as maximum tolerated pressure in N before tablet breakage.
The milk powder tablets were clearly the best. The particle size or size distribution did not
seem to make any significant difference. Again, rabbit food and gruel created by far the
weakest tablets. The crush strength and the friability of the tablets seem to be rather closely
correlated. Except for rabbit food, sieve interval 90-300µm, which had low crush strength
compared to the milk powders but it was still more than twice as strong as the other size
intervals of rabbit food. Sugar had a similar friability to the milk powders but in the case of
crush strength, the milk powder was much stronger. Perhaps the fact that the milk powder was
more easily crushed into smaller particles enabled it to form a perfect blend of particle sizes in
the tableting machine. The milk tablet densities were close to the true density of milk powder,
see Figure 13. Sodium sulfate, sugar and gruel tablets were not as close to their true density as
milk was.
All kinds of deformations, i.e. pores, imperfect bonds or cracks within the tablet, which can
be a result from the morphology of the particles or the surface interaction in-between,
decreases tablet strength. It was shown that rabbit food had a wide range of fibrous particles
and one of the most irregularly shaped morphology of the powder samples, which can be the
explanation for its poor performance in crush strength and surface hardness.
4. 6 Elasticity All of the tablets made experienced a degree elastic deformation. The tablet diameter after
removal from the die divided by the die diameter resulted in a percentage of springback and
can be seen in Figure 24.
0
50
100
150
200
250
Max
imu
m t
ole
rate
d p
ress
ure
(N
)
Crush strength

28
Figure 24. Elastic deformation in percent.
The rabbit pellets had by far the largest springback and therefore the largest portion of elastic
deformation out of all the powders. This should have a negative effect on the overall
tabletability, as it is desirable to have the tablet keep its shape. It could also decrease the
ability to compact, since high elastic springback must make it harder to create a tablet close to
its true density. Sodium sulfate and detergent had the least amount of elastic deformation. It
can also be seen that the rabbit food had the highest springback and also performed very
poorly in the crush strength and friability tests as seen in Figure 22 and Figure 23. However,
milk powder was the best performing powder in both of those tests but the elasticity was still
present. The fact that there was some springback in combination with the closeness between
tablet and true density, see Figure 13, shows that the milk powder must have been very close
to its true density while inside the die.
The elasticity should be influenced by the applied pressure of the tableting machine. Both
sodium sulfate and sugar were tableted with a lower pressure than the other powders. In order
to properly evaluate elasticity, the same pressure should be applied to all powders when
tableting. The results however give an estimate of the relative elasticity.
4. 7. BET From the BET analysis, both the specific surface area and the mean pore size were obtained.
The specific surface area, the area outside of the particle and inside the pores, for the different
powders is shown in Figure 25. BET-analysis measures the adsorption and desorption of
liquid nitrogen. Since some nitrogen condenses at the sample container’s wall additional area,
0.1-0.2 m2, will be added to the result. The specific surface area for the powders tested varies
between 0.7 m2/g and 3 m
2/g. When the margin of error is taken into consideration the result
is greatly affected. As can be seen in the figure, milk powder with the particle size 90-710µm
has the highest surface area 3 m2/g of the powders tested. However this is somewhat strange
since it would be more realistic if the milk powder 90-710µm were a fraction from the three
smaller milk powder size intervals. Rabbit food with the particle size 90-710µm has the
-
0,50
1,00
1,50
2,00
2,50
Elastic deformation - % springback

29
lowest specific surface area, 0.7 m2/g. No specific patterns could be discerned by just looking
at this graph. Since the specific area is small, krypton could be used instead of nitrogen which
would give a more accurate result.
Figure 25. Specific surface area.
The mean pore size as measured in the BET analysis is shown in Figure 26. As can be seen in
the figure, the mean pore size varies between 17.5 nm and 1.3 nm. Milk powder with the
particle size 500-700µm has the smallest mean pore size 1.3 nm. Since it contains the smallest
milk powder particles evaluated, it seems reasonable that the mean pore size should be
smaller than the other milk powders. This because they contain agglomerated particles to a
larger extent which creates more surface area.
Figure 26. Mean pore size in nm.
For the milk powder a trend of decreasing pore size with decreasing particle size can be seen,
as well as an expected mean pore size for the largest size interval. The same cannot however
0
0,5
1
1,5
2
2,5
3
3,5
m2 /
g
Specific area
0
0,2
0,4
0,6
0,8
1
1,2
nm
Mean pore size

30
be said about the rabbit food where the mean pore size does not seem to show the same
pattern as the milk powder.
It is especially strange since rabbit food 300-500µm and rabbit food 500-710µm are very
similar in size and size distribution as well as having very similar densities.
4. 8 Chemometrics Chemometrics is used to extract information from systems, in this case correlations between
powder and the compaction ratio. This compaction ratio was chosen as the main variable to
which all other properties were compared. It was chosen over crush and surface strength
because the goal in this study is to have a good compaction, not a strong tablet.
The data consists of a matrix, called design matrix, compiled from the test results of the
different samples, each column of the matrix corresponds to the property tests and the rows
are the different samples. The data consists of different units and are therefore standardized
and centered to zero.
A principal component analysis, PCA, is done on the design matrix. This will reconstruct the
data using an orthogonal transformation from observation of possibly correlated variables into
linearly uncorrelated variables, called principal components. These principal components
consist of scores and loadings. Scores, T, describes the observations while the loadings, P,
describe the variables. These two new matrixes are created to find a new combination of
describing variables that explains the data variation better. Equation 7 explains the model of
the principal components in matrix form, where E is the error in the model. [35]
(7)
The scree plot describes the degree of data explanation for each corresponding principal
component. The cumulative degree of explanation is shown in the R2 plot, see Figure 27.

31
Figure 27 Scree and R2 plot describing the systems degree of explanation and the cumulative degree of explanation
respectively.
Figure 27 shows that using two principal components will only explain a little more than 67%
of the data. By plotting the scores and loadings for the first two principal components a biplot
can be constructed. This shows the different correlations between the variables and
observations.
Partial least square 1, PLS1, will be used to analyze the results and to determine correlations
in the variables. The overall principles of PLS1 are fairly straightforward. Instead of modeling
exclusively the X variables, as in PCA, two sets of models are obtained equation 8 and 9.
(8)
(9)
where q is the compaction ratio loadings. The product of T and P approximates all the
measured properties except compaction ratio which is approximated from the product of T
and q. An important feature of PLS is that it is possible to obtain a scores matrix that is

32
common to both the compression ratio, C, and measurements, X. Note that T and P for PLS
are different to T and P obtained in PCA, and unique sets of scores and loadings are obtained
for each compound in the dataset. PLS1 will also give a matrix called W, which is the weight
matrix of the residuals.
In order to choose the right amount of principal components that should be used to analyze
the data, the RMS-error is calculated for X and C using equation 10 and 11. In the equations I
stand for the number of rows and J for the number of colons in the matrix. a stands for the
number of principal components used in the calculations. [35]
√∑ ∑ ( )
(10)
√∑ ( )
(11)
The RMS-error for the X-matrix and the C-matrix can be seen in Figure 28.
Figure 28. The RMS-error where the upper graph is for the C-matrix and the lower for the X-matrix.
Figure 28 provides a number of six principal components for the PLS1 analysis. The choice is
made based on the valley in the RMS-error for the approximation of the C-matrix. The

33
increase in RMS-error is based on noise which should be avoided and considering that the
RMS-error for the approximation of the X-matrix is close to its lowest value shows that six
principal components is sufficient.
The W*q-plot resembles a biplot for the PCA, which gives correlations between the different
properties. Equation 13 below shows the calculation of W*q which can be plotted in a W*q-
plot, see Figure 29. [35]
(13)

34
Figure 29. W*q-plots showing the correlations between the different properties. The upper figure shows all properties
while the lower only shows the variables that have significance to the tablet/bulk-ratio.

35
The variables in the W*q plot are vectors and the angle between the variables and the
compaction ratio shows how much each variable affect the ratio, a narrower angle gives a
greater effect. The closer each value is to the origin, the lesser it is described with the amount
of principal components used for that plot. Angle of repose, 10% accumulated, 90%
accumulated, 99% accumulated, mode and the average pore size have a large distance to the
origin, as seen in Figure 29. W*q-plots showing the correlations between the different
properties. The upper figure shows all properties while the lower only shows the variables that
have significance to the tablet/bulk-ratio.. A clear separation between the variables can thus
be seen. Since a few parameters are located close to the origin, the level of uncertainty is
rather high. Therefore most of the data from those parameters will be shown in a larger
dimension and the information given in the 2D plot is misguiding. Hence the information
taken from the chemometric analysis should come from the confidence interval.
Using the six selected principal components a confidence interval can be construct. The
confidence interval was calculated in order to eliminate the variables that do not have a
significant influence on the response and to see which way they affect the compaction ratio. A
method called Jackknifing is used to examine the standard error and equation 12 was used to
calculate the parameter estimations. [35]
(12)
The calculated values and confidence interval is documented in Table 4.
Table 4. The confidence interval for the different properties, where the marked variables have a significant effect on
the tablet/bulk ratio.
Variable Confidence interval
Tap density -5.1298 -5.1292
Bulk density 0.9565 0.9570
True density -1.8061 -1.8049
Tablet density 3.7662 3.7673
Elasticity 0.0008 0.0029
Angle of repose -0.0077 0.0282
Hausner ratio 2.2085 2.2093
10% accumulated -0.0124 0.0108
90% accumulated -0.0180 0.0243
99% accumulated -0.0198 0.0125
Mode -0.0057 0.0095
Surface area -0.0110 -0.0090
Average pore size -0.0071 0.0088
The marked properties in Table 4 have a significant effect on the compaction ratio, thus are all
the densities, Hausner ratio, elasticity and surface area important. The sign of the confidence
intervals can also be seen in Table 4. The tap and true density as well as the surface area
affects the compaction ratio negatively, therefore they should have low values in order to get
a higher compaction ratio. The rest of the significant properties; bulk density, tablet density,
elasticity and Hausner ratio show a positive impact. A high Hausner ratio equals low

36
flowability. The Hauser ratio on the other hand is a mathematical expression, which consists
of the ratio between bulk and tap density, therefore it is not surprising that it has a significant
correlation to the compaction ratio as both bulk and tap has significant influence.
To test the results of the estimations, the estimated response is plotted against the real
response, see Figure 30.
Figure 30. The estimated response as a function of the real response.
The figure show a decent estimation since the plotted data from the material follows the linear
equation .

37
Finally the confidence intervals were made for both the compaction ratio and the maximum
compaction ratio where changes of the variables have been made, see Table 5 and Table 6 .
Table 5. The confidence interval for the different properties, where the marked variables have a significant effect on
the compaction ratio, tablet/bulk.
Variable Confidence interval
Bulk density -5.0849 -5.0846
True density -0.9177 -0.9170
Tablet density 3.4661 3.4667
Elasticity 0.0298 0.0306
Angle of repose -0.0058 0.0120
Hausner ratio 1.2586 1.2591
Interval size -0.0069 0.0065
Mode -0.0036 0.0074
Table 6. The confidence interval for the different properties, where the marked variables have a significant effect on
the maximum compaction ratio, tablet/true.
Variable Confidence interval
Bulk density -0.1143 -0.1142 True density -0.6858 -0.6856 Tablet density 0.9329 0.9331 Elasticity 0.0322 0.0325 Angle of repose -0.0021 0.0036 Hausner ratio 0.4991 0.4993 Interval size -0.0012 0.0014 Mode -0.0007 0.0011
Following variables were removed during the change: the results from BET-analysis, tap
density and the different accumulated sizes. The size interval, which is defined as the length
of the interval from 90 % accumulated to 10 % accumulated in the size distribution curve, was
added. The changes of the variables do not affect the confidence intervals. The size interval is
deemed non-significant by the model for both the compaction ratio and the maximum
compaction ratio.

38
4. 9. General Discussion A good powder, from a compaction point of view, is a powder with properties that enables it
to have a high compaction ratio. This means a high end product density, in this case tablet
density, in comparison with its initial bulk density. In this study, it is clear that milk powder
has the best compaction ratio compared to all the investigated powders, as well as good tablet
properties such as high crush and surface strength. Milk powder does not have the highest
tablet density, seen in Figure 12, however this is due to the true density of milk powder which
is the second lowest of the powders tested. A powder is unable to have a higher tablet density
than the true density. There are other powders, e.g. sodium sulfate, which has a higher tablet
density than milk powder, but does not have the same airy bulk thus resulting in a low
compaction ratio.
There are of course other properties that determine if a powder is suitable for large scale
compaction processes. Flowability is a prime example of such a property, as large scale
production processes are relying on good powder flow within the facility, and for feeding of
the rotary tablet machine. However, this has been disregarded in this study where the focus
has been to find the properties for good compaction. It was experienced during the tableting
that powders with low flowability were distributed very unevenly in the mold. Sodium sulfate,
which had the lowest flowability of the samples, had this problem. It resulted in what was
likely an uneven pressure distribution, making the tablet both brittle and hard to remove form
the mold without breaking it. This was also one of the powders where the pressure had to be
adjusted to prevent capping. The pressure for tableting sugar was also adjusted, even though
the flowability was good. This shows that there is a possibility that both pressure and
flowability interact in creating capping. The consequence of this is that the tablet may be
strong once produced, but the formation of the tablet is hard.
Two out of the six powders, i.e. the milk powder and rabbit food, were divided into different
size intervals. This was done in order to study if the particle size distribution had any
significant influence on the compaction, as these tendencies have been seen in earlier work [4]
[17] [24]. In this case, the maximum compaction ratio between the tablet and true density
were studied. Unfortunately, there was only a marginal difference between each size interval
making the result inconclusive. However, the friability test of rabbit food indicates that a
smaller particle size strongly increase the tablet surface strength. Over 70% of rabbit food 90-
300µm remained after the test but the other size intervals were completely disintegrated. More
details might have been obtained by having more narrow size intervals.
The chemometric model shows that tap, bulk, true and tablet density as well as elasticity,
Hausner ratio and specific surface area have significant effect on the compaction ratio. But the
impact of the properties varies. Surface area and elasticity have very low influence whereas
the tap and tablet density have greater affect. Bulk and tablet density, as well as elasticity and
Hausner ratio have a positive effect which means that a high value on these properties gives a
high compaction ratio. The tablet and bulk density are by definition influencing the
compaction ratio. Therefore a correlation can be seen both in the individual plots and the
chemometric model. Tap density, true density and specific surface area have a negative effect
on the compaction ratio.

39
A high Hausner ratio is equal to low flowability. According to the theory [22], it is good to
have a good flowability. Therefore, the chemometrics are contradicting the theory where a
high Hausner ratio is beneficial for compaction. As discussed section 4.4 Flowability,
Hausner ratio is a questionable way to measure flowability. There was also a problem with the
method used to measure the tap density, which strongly increase the uncertainty of the
Hausner results. However the other method, angle of repose, did not show any significant
correlation with the compaction ratio. This can also be seen when comparing Figure 14.
Compaction ratio, i.e. tablet density divided with bulk density. and Figure 21 where no
apparent correlation is visible. One example of a powder with bad flowability was milk
powder 90-710µm but at the same time it had one of the highest compaction ratios. The
powder also exhibits a high crush and surface strength, see Figure 22 and Figure 23.
The positive influence of the elasticity in the chemometric analysis was unexpected, as it is
not intuitive and hard to distinguish when the result was evaluated, both individually and as a
comparison. Every sample is subjected to some elastic deformation, but the more ductile
tablets, i.e. rabbit food and gruel, experience a larger elasticity. Also the relation between
specific surface area and compaction ratio could not be seen by individual comparison.
Since it is known that milk powder is granulated, it is regarded plausible that the powder
breaks down during the compression into tablets. This makes the connection and interaction,
as surface area increases [24], between the particles easier and thus creates a harder and
denser tablet. The tablets made out of milk powder had a homogenous surface. This makes it
impossible to distinguish which particle size interval was used to make the tablet. All powders
except gruel and rabbit food had the same tendencies as milk powder, i.e. would make
homogenous tablets. It was possible to distinguish single particles at the surface on the tablets
made of rabbit food and gruel. Deformations within the tablet, e.g. pores, imperfect and weak
bonds or cracks, can have a negative influence on the connections and interactions between
the particles and thus may be the reason to the rabbit food tablets poor performance in crush
strength and surface hardness.
Morphology was not a factor in the chemometric analysis due to the difficulty to do a
representative estimation of the shape factors [5] for each powder with existing equipment. It
would require a large amount of measurements as most of the powders have a large variation
in shape and size. For the same reason, comparison between the powder morphology and
compression ratio did not lead to any conclusion.

40
5. Conclusions The main goal in this study was to evaluate the consolidation properties of powders, focusing
on how to get a high compaction ratio. Six powders were investigated, namely milk powder,
sodium sulfate, rabbit food, detergent, sugar and gruel. Since milk powder was the best of the
tested powders, from a compaction point of view, it can be assumed that a powder with
similar properties would result in a good compaction. Milk powder possess properties such as
relatively low elasticity, high true density and a low and porous bulk density with the ability
to break the particles to create new surface bonds. These are all favorable properties to
achieve a good compaction. However, there are some contradictions between results from the
chemometric analysis and the comparison made with individual plots for each parameter.
A high plastic deformation is favorable to achieve a good tablet, as a low plastic deformation
results in that the tablet disintegrates [23]. The tablets with high elastic deformation were the
weakest and most friable tablets. They also had the lowest maximum compaction ratio due to
the loss of tablet density when the tablet volume was increased. The chemometrics showed
that high elasticity had a significant and positive, however, small influence on the compaction
ratio. Good compaction and a strong tablet are however two different things, a high
compaction ratio does not seem to automatically mean a strong tablet. It could be seen when
comparing gruel and sodium sulfate which had very similar maximum compaction ratio, but
the crush and surface strength of gruel was nothing compared to sodium sulfate.
The flowability of a powder has previously been shown to have an effect on the tabletability
[20], where high flowability is desirable. Of the two ways to express flowability, Hausner
ratio and angle of repose, only Hausner ratio showed significant influence on the compaction
ratio in the chemometric analysis. However, the Hausner ratio was deemed to be very
uncertain because of the data it was based on. Even if a powder has bad flowability it is
possible to achieve a good compaction, which can be seen when Figure 14. Compaction ratio,
i.e. tablet density divided with bulk density.Figure 14 (maximum compaction ratio) is
compared with Figure 21 (flowability).
Other parameters that were shown by chemometrics to have a significant positive influence on
the compaction ratio were low surface area, low true and tap density and high bulk and tablet
density. Knowing more about the powders gives a more accurate result from the chemometric
model. A greater number of tests on a larger assortment of powders will give a more general
model, which can be assumed to represent all powders and not just the ones tested.
According to theory size and size distribution should affect the compaction [4] [17] [24],
where a large size interval is desired. However, this was not experienced when the laboratory
work was evaluated. This is due to the sieving error when the powder was divided into
different size intervals, where problems with overlapping and narrower intervals appeared.
Even if no conclusion can be drawn from the morphology, it is clear that the powders differ in
shape. Milk powder, gruel and sodium sulfate have all relatively round particles. Sugar, and to
some extent detergent, have a crystalline morphology while rabbit food has the most irregular
shape of the powders tested. Some static behavior was observed for the powders with the

41
smallest particles. However, it was not shown if the static behavior had any effect on the
compaction or tabletability.
The final conclusion was that a good compaction does not mean that the powders form good
tablets. The elasticity seems to have a great influence especially on the crush and surface
strength, but also to some extent on the maximum compaction. Other parameters that proved
to be good for compaction were low true and tap density and high bulk and tablet density.

42
6. Future Work For further work with the project the sieving of the powders should be improved in order to
investigate the influence of the size and size distribution of the compaction. Therefore the
sieving should be performed before the fractions are measured with a laser diffraction
spectrometer to make sure that the particle size intervals do not overlap. It is suggested that
during the sieving there should be a gap between the different size intervals. For example,
sieving with the meshes 710µm, 500µm, 450µm, 300µm, 250µm and 90µm could be tested.
Hence the following size intervals will be created 500-710, 450-300µm and 250-90µm. This
to make sure that no overlapping of the different size intervals occurs. It would also be an idea
to further investigate the ideal particle size for tableting, 200-500µm [18].
Instead of powders with uniform particle size, other powders with a wider particle size
distribution should be used. Then the powder can be divided in different particle size intervals
to further investigate the influence of the size and size distribution of the compaction. Only
milk powder and rabbit food were sieved to create different size intervals during this study,
but it would be good if all studied powders were sieved to the same intervals.
During the compaction of the powders it would be very interesting to measure and evaluate
the amount of plastic deformation and fragmentation which occurs when the tablet is formed,
to understand the mechanics of the compaction process. For example during the laboratory
work it was experienced that milk powder probably have a fragmentation than rabbit food
during the compaction of the powders. This could be evaluated using the Heckel plot.
The method used to measure the tap density of the powders should be replaced since it is not
considered to be sufficiently accurate. Just tapping 20 times is considered to be far too low
compared with the articles [31] and [32]. A bulk and tap volumeter should be used to get a
more accurate result. The calculations of the Hausner ratio will also be more accurate then
and more comparable to the angle of repose.
Another thing that would be very good to be able to quantify, is morphology. This parameter
could then be used to explain or discuss the compaction or tablet behavior. In this study there
was no possibility to measure and quantify the morphology and therefore it was hard to
compare it to the other parameters.
Finally, the impact on the investigated powders by lubricants and coatings would be
interesting to investigate in order to make the results more applicable to large scale tableting
production.

43
References
[1] G. V. Barbosa-Cánovas, E. Ortega-Rivas, P. Juliano and H. Yan, "Particle Properties," in
Food Powders - Physical Properties, Processing, and Functionality, New York, Kluwer
Academic/Plenum Publishers, 2005, pp. 19-54.
[2] A. Axelsson, "Karakterisering av partiklar," Lund.
[3] J. N. Staniforth and M. E. Aulton, "Particle size analysis," in Pharmaceutics - the science of
dosage form design, New York, Churchill Livingstone, 1988, pp. 564-568.
[4] S. Lakio, "Fysikaalinen Farmasia," [Online]. Available:
http://www.fysikaalinenfarmasia.fi/symposium11/lakio_presentation.pdf. [Accessed 08 May
2013].
[5] V. Mikli, H. Käerdi, P. Kulu and M. Besterci, "Charactarization of Powder Particle
Morphology," Proc. Estonian Acad. Sci. Eng., vol. 7, no. 1, pp. 22-34, 2001.
[6] A. Andersson, Kurspärm: Partikelteknologi, Lund: Kemisk Apparatteknik, 1999.
[7] Sirola, B. S. J. Luksic and N. Kujundzic, "Effect of crystal size and shape on bulk density of
pharmaceutical powders," Journal of Crystal Growth, pp. 403-409, 199.
[8] X. Fu, M. Dutt, A. C. Bentham, B. C. Hancock, R. E. Cameron and J. A. Elliott,
"Investigation of particle packing in model pharmaceutical powders using X-ray
microtomography and discrete element method," Powder Technology, p. 134–140, 2006.
[9] N. Sandler and D. Wilson, "Prediction of Granule Packing and Flow Behavior Based on
Particle Size and Shape Analysis," Journal of Pharmaceutical Sciences, vol. 99, p. 958–968,
2009.
[10] G. E. Amidon, P. J. Secreast and D. Mudie, "Particle, Powder, and Compact
Characterization," in Developing Solid Oral Dosage Forms, Academic Press, © Elsevier Inc.,
2009, p. 163–186.
[11] J. Rouquerol, D. Avnir, C. Fairbridge, E. D.H, J. Haynes, N. Pernicone, J. Ramsay, K. Sing
and K. Unger, "Recomendations for the characterization of porous solids".International union
of pure and applied chemistry.
[12] M. I. Corporation,
"http://www.micromeritics.com/Repository/Files/Mercury_Porosemitry_Theory_poster_.pdf,"
Micromeritics Instrument Corporation. [Online].
[13] S. Hogekamp and M. Pohl, "Porosity measurement of fragile agglomerates," Powder
44
Technology, vol. 130, pp. 385-392, 2003.
[14] L. Espinal, "Porosity and its measurement," in Characterization of Materials.
[15] B. C. Hancock, J. T. Colvin, M. P. Mullarney and A. V. Zinchuk, "The Relative Densities of
Pharmaceutical Powders,Blends, Dry Granulations, and Immediate-Release Tablets,"
Pharmaceutical Technology, pp. 64-80, April 2003.
[16] United States Pharmacopeia, "<616> Bulk and Tapped Density of Powders," 01 Dec 2012.
[Online]. Available:
http://www.usp.org/sites/default/files/usp_pdf/EN/USPNF/revisions/m99375-
bulk_density_and_tapped_density_of_powders.pdf. [Accessed 11 feb 2013].
[17] M. Suzuki, H. Sato, M. Hasegawa and M. Hirota, "Effects of size distribution on tapping
properties of fine powder," Powder Technology, vol. 118, no. 1-2, pp. 53-57, 2001.
[18] O. Antikainen, "Tablet compression as a phenomenon and Inter-molecular bond formation in
tableting," in Helsingfors Universitet, Helsingfors.
[19] N. A. Armstrong and M. E. Aulton, "Tableting," in Pharmaceutics - the science of dosage
form design, New York, Churchill Livingstone, 1993, pp. 647-668.
[20] M. Wahlgren, Interviewee, Professor. [Interview]. 11 04 2013.
[21] C. Sheehan, "Powder flow," U.S Pharmacopeia, [Online]. Available:
http://www.pharmacopeia.cn/v29240/usp29nf24s0_c1174.html. [Accessed 14 05 2013].
[22] E. L. Carr, "Evolulating Flow Properties of Solids," Chem. Eng., vol. 72, pp. 163-168, 1965.
[23] M. D. Tousey, "Sticking and picking: Some Causes and Remedies," Tablets & Capsules,
2003.
[24] S. Lakio, S. Siiriä, H. Räikkönen, S. Airaksinen, T. Närvänen, O. Antikainen and J. Yliruusi,
"New insights into segregation during tabletting," International Journal of Pharmaceutics, pp.
19-26, 2012.
[25] Micromeritics Instrument Corporation, "AccuPyc 1330 Pycnometer - Operator's Manual".
[26] Sympatec, "Dosing unit of dry powders," Sympatec GmbH , [Online]. Available:
http://www.sympatec.com/EN/Accessory/VIBRI-L.html.
[27] Sympatech, "Rodos - Dry dispersion for laser diffraction," Sympatech GmbH , [Online].
Available: http://www.sympatec.com/EN/LaserDiffraction/RODOS.html.
[28] Sympatech, "Helos - Particle analysis with laser diffraction," Sympatech GmbH, [Online].
Available: http://www.sympatec.com/EN/LaserDiffraction/HELOS.html.
45
[29] E. P. Barrett, L. G. Joyner and P. P. Halenda, "The Determination of Pore Volume and Area
Distributions in Porous Substances. I. Computations from Nitrogen Isotherms.," J Am Chem
Soc, vol. 73, p. 373–380, 1951.
[30] G. Halsey, "Physical Adsorption on Non-Uniform Surfaces," J Chem Phys, vol. 16, p. 931,
1948.
[31] S. Inderbir and K. Pradeep, "Preformulation studies for direct compression suitability of
cefuroxime axetil and paracetamol: A graphicalrepresentation using SeDeM diagram," Acta
Poloniae Pharmaceutica - Drug Research, 2012.
[32] L. Block, L. Scheling, A. Couto, M. Silva, M. Tagliari and T. M. S. Bresolin, "Effect of
binders on 500mg metformin hydrochloride tablets produced by wet granulation," Revista de
Ciências Farmacêuticas Básica e Aplicada, 2009.
[33] E. Abdullah and D. Geldart, "The use of bulk density measurements as flowability
indicators," Powder technology, pp. 151-165, 1999.
[34] A. Santomaso, P. Lazzaro and P. Canu, "Powder flowability and density ratios: the impact of
granules packing," Chemical Engineering Science, vol. 58, no. 3, pp. 2857-2874, 2003.
[35] R. G. Brereton, Chemometrics: Data Analysis for the Laboratory and Chemical Plant, John
Wiley & Sons, Ltd. , 2003.
[36] K. Fyfe, O. Kravchuk, A. V. Nguyen, H. Deeth and B. Bhandari, "Influence of Dryer Type on
Surface Characteristics," Drying Technology, pp. 758-769, 2011.
[37] J. J. Nijdam and T. Langrish, "An Investigation of Milk Powders Produced by a Laboratory-
Scale Spray Dryer," Drying Technology, p. 1043–1056, 2005.
[38] W. Scott and T. F. Co, "Ten things you need to consider when choosing and installing a roller
press system," Powder and Bulk Engineering, 2000.
[39] S. G. System-Partikel-Technik, "Dosing units for dry powder," [Online]. Available:
http://www.sympatec.com/EN/LaserDiffraction/HELOS.html.
[40] e. Aulton, "Particle size analysis," in Pharmaceutics, 1988, pp. 564-568.
[41] E. Barrett, L. Joyner and P. Halenda, "The Determination of Pore Volume and Area
Distributions in Porous Substances. I. Computations from Nitrogen Isotherms.," J Am Chem
Soc, p. 373–380, 1951.
[42] G. Halsey, "Physical Adsorption on Non-Uniform Surfaces.," J Chem Phys, p. 931, 1948.

46
Appendix Following appendix contains all the raw data extracted from the laboratory work.

Substance Nr. Size (µm) Weight Bulk/Tap (g) Bulk (cm3) Tap (cm3) Tap (g/cm3) Tap average Tap std Bulk (g/cm3) Bulk average
Milk 1 500-710 8,88 29 29 0,31 0,31
2 500-710 9,58 31,5 30,5 0,31 0,30
3 500-710 9,73 30 30 0,32 0,31 0,01 0,32 0,31
4 300-500 10,93 32 30,5 0,36 0,34
5 300-500 10,17 30 28 0,36 0,34
6 300-500 10,98 31,5 30,5 0,36 0,36 0,00 0,35 0,34
7 90-300 13,18 30 27 0,49 0,44
8 90-300 14,04 31,5 29 0,48 0,45
9 90-300 13,48 31 28 0,48 0,48 0,00 0,43 0,44
10 90-710 11,189 30 27,5 0,41 0,37
11 90-710 11,182 30,5 27,5 0,41 0,37
12 90-710 11,362 31 28 0,41 0,41 0,00 0,37 0,37
NaSO4 13 <710 27,632 29 25 1,11 0,95
14 <710 30,701 34 28 1,10 0,90
15 <710 30,822 33 28 1,10 1,10 0,00 0,93 0,93
Rabbit 16 500-710 12,92 28,5 26 0,50 0,45
17 500-710 14,808 31 28,5 0,52 0,48
18 500-710 16,106 36 32,5 0,50 0,50 0,01 0,45 0,46
19 300-500 11,342 28 23,5 0,48 0,41
20 300-500 13,82 33 30 0,46 0,42
21 300-500 11,559 29 25 0,46 0,47 0,01 0,40 0,41
22 90-300 13,294 33 27 0,49 0,40
23 90-300 10,945 29 23 0,48 0,38
24 90-300 12,729 33 27 0,47 0,49 0,02 0,39 0,42
25 90-710 13,01 28 27,5 0,47 0,46
26 90-710 14,467 30,5 27,5 0,53 0,47
27 90-710 13,847 31 28 0,49 0,75 0,30 0,45 0,69
Detergent 28 <710 30,333 29 27 1,12 1,05
29 <710 33,249 33 30 1,11 1,01
30 <710 31,051 30,5 28,5 1,09 1,11 0,01 1,02 1,02
Sugar 31 <710 29,4 35 32 0,92 0,84
32 <710 28,474 32 30 0,95 0,89
33 <710 23,502 27 26 0,90 0,92 0,02 0,87 0,87
Gruel 34 <710 13,139 30 22 0,60 0,44
35 <710 12,856 27 21 0,61 0,48
36 <710 15,82 33,5 25,5 0,62 0,61 0,01 0,47 0,46

Substance Nr. Size (µm) True (g/cm3) Average True True std Tablet d (mm) Tablet h (mm) Volyme tablet (cm3) Tablet (g/cm3) Average tablet Tablet std
Milk 1 500-710 1,42
13,01 2,73 0,363 1,38
2 500-710 1,44
13 2,74 0,364 1,37
3 500-710 1,43 1,43 0,008 13,02 2,81 0,374 1,34 1,36 0,02
4 300-500 1,40
13,02 2,89 0,385 1,30
5 300-500 1,41
13,02 2,76 0,367 1,36
6 300-500 1,41 1,41 0,004 13,06 2,82 0,378 1,32 1,33 0,03
7 90-300 1,39
13,05 2,75 0,368 1,36
8 90-300 1,40
13,01 2,74 0,364 1,37
9 90-300 1,40 1,40 0,003 13,06 2,77 0,371 1,35 1,36 0,01
10 90-710
13,01 2,71 0,360 1,39
11 90-710
13,01 2,73 0,363 1,38
12 90-710 1,41
13,03 2,72 0,363 1,38 1,38 0,00
NaSO4 13 <710 2,63
13 1,63 0,216 2,31
14 <710 2,64
12,99 1,73 0,229 2,18
15 <710 2,64 2,64 0,003 12,99 1,77 0,235 2,13 2,21 0,08
Rabbit 16 500-710 1,49
13,34 3,52 0,492 1,02
17 500-710 1,47
13,25 3,26 0,449 1,11
18 500-710 1,48 1,48 0,007 13,12 3,23 0,437 1,15 1,09 0,05
19 300-500 1,49
13,25 3,48 0,480 1,04
20 300-500 1,49
13,12 3,38 0,457 1,09
21 300-500 1,49 1,49 0,001 13,14 3,16 0,429 1,17 1,10 0,05
22 90-300 1,51
13,18 3,26 0,445 1,12
23 90-300 1,51
13,17 3,23 0,440 1,14
24 90-300 1,51 1,51 0,000 13,11 3,2 0,432 1,16 1,14 0,01
25 90-710
13,21 3,35 0,459 1,09
26 90-710
13,23 3,36 0,462 1,08
27 90-710 1,49
13,28 3,3 0,457 1,09 1,09 0,00
Detergent 28 <710 2,21
13,02 1,86 0,248 2,02
29 <710 2,21
12,96 1,83 0,241 2,07
30 <710 2,21 2,21 0,001 12,98 1,82 0,241 2,08 2,06 0,03
Sugar 31 <710 1,60
12,98 2,55 0,337 1,48
32 <710 1,61
13,06 2,5 0,335 1,49
33 <710 1,61 1,61 0,004 12,99 2,62 0,347 1,44 1,47 0,02
Gruel 34 <710 1,46
13,15 3,08 0,418 1,20
35 <710 1,45
13,08 3,11 0,418 1,20
36 <710 1,45 1,45 0,004 12,99 3,12 0,413 1,21 1,20 0,01
Average of the two values above Average of the group

Substance Nr. Size (µm) Tablet d (mm) Average diameter % Increase Diameter std
Milk 1 500-710 13,01
2 500-710 13,00
3 500-710 13,02 13,01 0,39 0,01
4 300-500 13,02
5 300-500 13,02
6 300-500 13,06 13,03 0,57 0,02
7 90-300 13,05
8 90-300 13,01
9 90-300 13,06 13,04 0,62 0,02
10 90-710 13,01
11 90-710 13,01
12 90-710 13,03 13,02 0,44 0,01
NaSO4 13 <710 13,00
14 <710 12,99
15 <710 12,99 12,99 0,26 0,00
Rabbit 16 500-710 13,34
17 500-710 13,25
18 500-710 13,12 13,24 2,13 0,09
19 300-500 13,25
20 300-500 13,12
21 300-500 13,14 13,17 1,62 0,06
22 90-300 13,18
23 90-300 13,17
24 90-300 13,11 13,15 1,49 0,03
25 90-710 13,21
26 90-710 13,23
27 90-710 13,28 13,24 2,16 0,03
Detergent 28 <710 13,02
29 <710 12,96
30 <710 12,98 12,99 0,21 0,02
Sugar 31 <710 12,98
32 <710 13,06
33 <710 12,99 13,01 0,39 0,04
Gruel 34 <710 13,15
35 <710 13,08
36 <710 12,99 13,07 0,87 0,07

Substance Size (µm) Angle of repose (⁰) Angle category Hausner ratio (tapp/bulk) Hausner category Hausner agerage
Milk 500-710 28,6
1,00
500-710 38,1
1,03
500-710 33,35 5 1,00 6 1,01
300-500 28,1
1,05
300-500 30,7
1,07
300-500 29,4 6 1,03 6 1,05
90-300 34
1,11
90-300 32,7
1,09
90-300 33,35 5 1,11 6 1,10
90-710 45,7
1,09
90-710 45
1,11
90-710 45,35 3 1,11 6 1,10
NaSO4 <710 70,2
1,16
<710 109,8
1,21
<710 90 0 1,18 5 1,18
Rabbit 500-710 46,3
1,10
500-710 42
1,09
500-710 44,15 3 1,11 6 1,10
300-500 51,1
1,19
300-500 46,5
1,10
300-500 48,8 2 1,16 5 1,15
90-300 52,7
1,22
90-300 53,5
1,26
90-300 53,1 2 1,22 4 1,24
90-710 54,8
1,02
90-710 60,5
1,11
90-710 57,65 1 1,11 6 1,08
Detergent <710 31,6
1,07
<710 34
1,10
<710 32,8 5 1,07 6 1,08
Sugar <710 39,5
1,09
<710 33,9
1,07
<710 36,7 4 1,04 6 1,07
Gruel <710 63,4
1,36
<710 61,2
1,29
<710 62,3 1 1,31 3 1,32
Average of the two values above

Substance Nr. Size (µm) Pressure (N) Pressure average (N) Pressure std (N) Pressure (kPo)
Milk 1 500-710 251,05
25,6
2 500-710 227,51
23,2
3 500-710 206,92 228,49 18,03 21,1
4 300-500 210,84
21,5
5 300-500 194,17
19,8
6 300-500 217,71 207,57 9,88 22,2
7 90-300 218,69
22,3
8 90-300 228,49
23,3
9 90-300 227,51 224,90 4,41 23,2
10 90-710 242,22
24,7
11 90-710 210,84
21,5
12 90-710 232,42 228,49 13,11 23,7
NaSO4 13 <710 18,63
1,9
14 <710 59,82
6,1
15 <710 29,42 35,96 17,44 3
Rabbit 16 500-710 1,65
17 500-710 2,01
18 500-710 1,95 1,87 0,16
19 300-500 1,72
20 300-500 1,55
21 300-500 2,62 1,96 0,47
22 90-300 4,18
23 90-300 4,50
24 90-300 5,61 4,76 0,61
25 90-710 2,30
26 90-710 2,22
27 90-710 1,93 2,15 0,16
Detergent 28 <710 38,25
3,9
29 <710 56,88
5,8
30 <710 63,74 52,96 10,77 6,5
Sugar 31 <710 73,55
7,5
32 <710 27,46
2,8
33 <710 38,25 46,42 19,68 3,9
Gruel 34 <710 0,38
35 <710 0,35
36 <710 0,36 0,36 0,01
Equal to 0, for these powder a different machine was used Average of the two values above.

Substance Nr. Size (µm) Weight before (g) Weight after (g) % Left % Left average % Lost weight
Milk 1 500-710
2 500-710
3 500-710 1,415 1,403 0,99 0,99 0,01
4 300-500
5 300-500
6 300-500 1,423 1,418 1,00 1,00 0,00
7 90-300
8 90-300
9 90-300 1,429 1,427 1,00 1,00 0,00
10 90-710
11 90-710
12 90-710 1,467 1,464 1,00 1,00 0,00
NaSO4 13 <710
14 <710
15 <710 1,476 0,779 0,53 0,53 0,47
Rabbit 16 500-710
17 500-710
18 500-710 1,485 0 0,00 0,00 1,00
19 300-500
20 300-500
21 300-500 1,5 0 0,00 0,00 1,00
22 90-300
23 90-300
24 90-300 1,489 1,144 0,77 0,77 0,23
25 90-710
26 90-710
27 90-710 1,49 0 0,00 0,00 1,00
Detergent 28 <710
29 <710
30 <710 1,495 1,165 0,78 0,78 0,22
Sugar 31 <710
32 <710
33 <710 1,514 1,429 0,94 0,94 0,06
Gruel 34 <710
35 <710
36 <710 1,5 0 0,00 0,00 1,00

Substance Nr. Sieve size (µm) x10 x90 x99 mode
Milk 1 500-710 236,39 689,72 730,47 600
2 500-710 374,52 694,41 730,94 600
3 500-710 305,46 692,07 730,71 600
4 300-500 187,43 478,18 511,320 430
5 300-500 179,03 472,31 510,730 410
6 300-500 183,23 475,25 511,03 420
7 90-300 89,85 298,55 404,96 210,00
8 90-300 92,13 301,81 400,46 220,00
9 90-300 90,99 300,18 402,71 215
10 90-710 136,76 573,58 701,800 440
11 90-710 138,51 602,47 720,280 410
12 90-710 137,64 588,03 711,04 425
NaSO4 13 <710 1,51 46,12 69,470 40
14 <710 1,73 47,90 72,830 35
15 <710 1,62 47,01 71,15 38
Rabbit 16 500-710 190,45 553,67 608,870 460
17 500-710 171,15 526,64 606,160 460
18 500-710 180,80 540,16 607,52 460
19 300-500 235,61 551,52 611,030 450
20 300-500 238,42 548,36 609,520 450
21 300-500 237,02 549,94 610,28 450
22 90-300 60,01 339,06 448,640 340
23 90-300 55,07 328,72 419,300 340
24 90-300 57,54 333,89 433,97 340
25 90-710 85,71 488,99 597,690 340
26 90-710 87,49 498,35 606,680 320
27 90-710 86,60 493,67 602,19 330
Detergent 28 <710 128,88 436,22 507,120 400
29 <710 133,35 477,07 571,310 440
30 <710 131,12 456,65 539,22 420
Sugar 31 <710 259,52 639,41 725,440 540
32 <710 250,98 594,15 712,400 505
33 <710 255,25 616,78 718,92 523
Gruel 34 <710 31,65 214,38 311,080 150
35 <710 31,85 221,74 333,100 140
36 <710 31,75 218,06 322,09 145
Average of the two values above.