Embed Size (px)
Citation preview
i
June 2007
ii
The Team
Team Leader
Lubna Farooq Malik [email protected]
Team Members
Muhammad Akhtar Javed [email protected]
Salman Ahmed [email protected]
Muhammad Rizwan [email protected]
Rizwana Rifat [email protected]
Abdul Samad [email protected]
Data Assistance
Muhammad Amjad [email protected]
iii
List of Abbreviations
CAR Capital Adequacy Ratio CB Commercial Bank CDR Credit to Deposit Ratio CRR Cash Reserve Requirement CY Calendar Year FB Foreign Bank HTM Held-to-Maturity IB Islamic Bank IBB Islamic Bank Branch IBI Islamic Banking Institution LPB Local Private Bank MCR Minimum Capital Requirement MTB Market Treasury Bill NII Net Interest Income NOP Net Open Position NPF Non Performing FinanceNPL Non Performing Loan NSS National Saving Scheme OMO Open Market Operation PIB Pakistan Investment Bond PSCB Public Sector Commercial Bank ROA Return on AssetROE Return on Equity RSA Rate Sensitive Asset RSL Rate Sensitive Liability RWA Risk Weighted Asset SBP State Bank of Pakistan SB Specialized Bank SLR Statutory Liquidity Requirement SME Small and Medium Enterprise

iv
Glossary Capital Adequacy Ratio is the amount of risk-based capital as a percent of risk-weighted assets.
Consumer Financing means any financing allowed to individuals for meeting their personal, family or household needs. The facilities categorized as Consumer Financing include credit cards, auto loans, housing finance, consumer durables and personal loans.
Corporate means and includes public limited companies and such entities, which do not come under the definition of SME.
Credit risk arises from the potential that a borrower or counter-party will fail to perform an obligation or repay a loan. Discount rate is the rate at which SBP provides three-day repo facility to banks, acting as the lender of last resort.
Duration (Macaulay’s Duration) is a time weighted present value measure of the cash flow of a loan or security that takes into account the amount and timing of all promised interest and principal payments associated with that loan or security. It shows how the price of a bond is likely to react to different interest rate environments. A bond’s price is a function of its coupon, maturity and yield.
GAP is the term commonly used to describe the rupee volume of the interest-rate sensitive assets versus interest-rate sensitive liabilities mismatch for a specific time frame; often expressed as a percentage of total assets.
Gross income is the net interest income (before provisions) plus non-interest income; the income available to cover the operating expenses.
Interbank rates are the two-way quotes namely bid and offer rates quoted in interbank market are called as interbank rates.
Interest rate risk is the exposure of an institution’s financial condition to adverse movement in interest rates, whether domestic or worldwide. The primary source of interest rate risk is difference in timing of the re-pricing of bank’s assets, liabilities and off-balance sheet instruments.
Intermediation cost is the administrative expenses divided by the average deposits and borrowings.
Liquid assets are the assets that are easily and cheaply turned into cash – notably cash and short-term securities. It includes cash and balances with banks, call money lending, lending under repo and investment in government securities.
Liquidity risk is the risk that the bank will be unable to accommodate

v
decreases in liabilities or to fund increases in assets. The liquidity represents the bank’s ability to efficiently and economically accommodate decreases in deposits and to fund increases in loan demand without negatively affecting its earnings.
Market risk is the risk that changes in the market rates and prices will impair an obligor’s ability to perform under the contract negotiated between the parties. Market risk reflects the degree to which changes in interest rates, foreign exchange rates, and equity prices can adversely affect the earnings of a bank.
Net interest income is the total interest income less total interest expense. This residual amount represents most of the income available to cover expenses other than the interest expense.
Net Interest Margin (NIM) is the net interest income as a percent of average earning assets.
Net loans are the loans net of provision held for NPLs.
Net Non-Performing Loans (NPLs) is the value of non-performing loans minus provision for loan losses.
Net NPLs to net loans means net NPLs as a percent of net loans. It shows the degree of loans infection after making adjustment for the provision held.
Non-Performing Loans (NPLs) are loans and advances whose mark-up/interest or principal is overdue by 90 days or more from the due date.
NPLs to loans ratio/Infection ratio stands for NPLs as a percent of gross loans.
Paid-up capital is the equity amount actually paid by the shareholders to a company for acquiring its shares.
Rate Sensitive Assets (RSA) are assets susceptible to interest rate movements; that will be re-priced or will have a new interest rate associated with them over the forthcoming planning period.
Repricing risk arises from timing differences in the maturity of fixed rate and the repricing of floating rates as applied to banks’ assets, liabilities and off-balance sheet positions Return on assets measures the operating performance of an institution. It is the widely used indicator of earning and is calculated as net profit as percentage of average assets.
Return on equity is a measure that indicates the earning power of equity and is calculated as net income available for common stockholders to average equity Risk weighted Assets: Total risk weighted assets of a bank would comprise two broad categories: credit risk-weighted assets and market risk-weighted assets. Credit
vi
risk weighted assets are calculated from the adjusted value of funded risk assets i.e. on balance sheet assets and non-funded risk exposures i.e. off-balance sheet item. On the other hand for market risk-weighted assets, first the capital charge for market risk is calculated and then on the basis of this charge amount the value of Market Risk Weighted Assets is derived.
Secondary market is a market in which securities are traded following the time of their original issue.
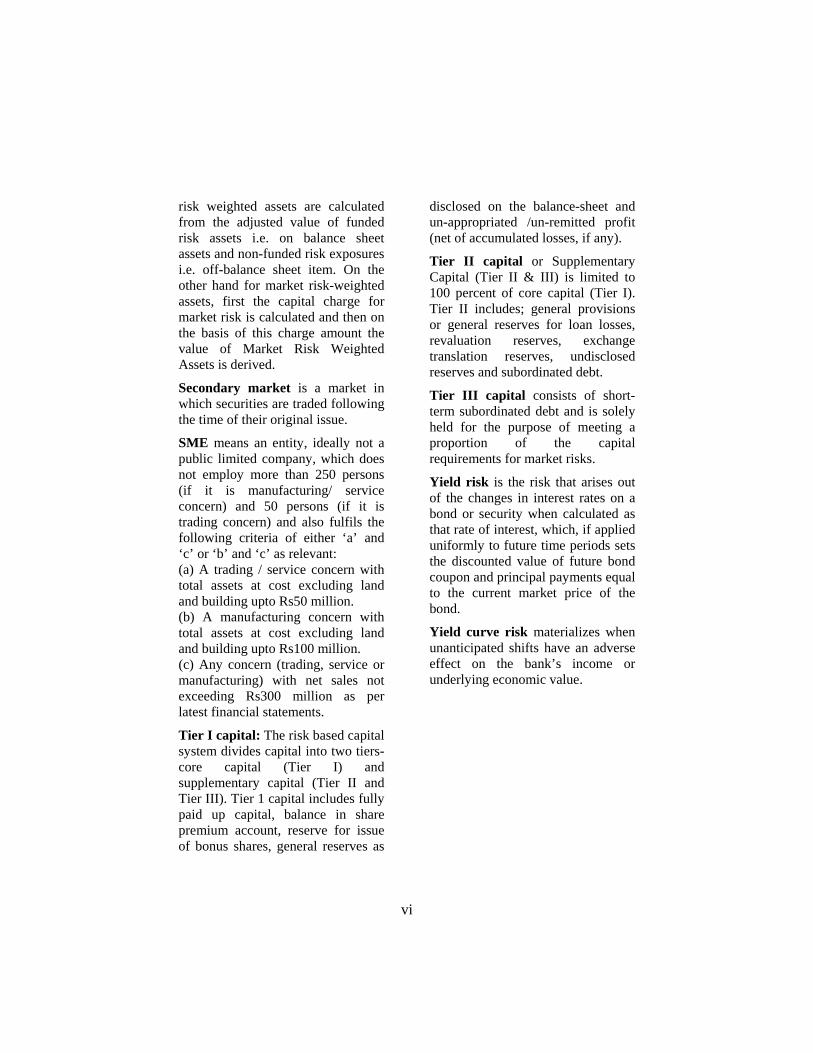
SME means an entity, ideally not a public limited company, which does not employ more than 250 persons (if it is manufacturing/ service concern) and 50 persons (if it is trading concern) and also fulfils the following criteria of either ‘a’ and ‘c’ or ‘b’ and ‘c’ as relevant: (a) A trading / service concern with total assets at cost excluding land and building upto Rs50 million. (b) A manufacturing concern with total assets at cost excluding land and building upto Rs100 million. (c) Any concern (trading, service or manufacturing) with net sales not exceeding Rs300 million as per latest financial statements.
Tier I capital: The risk based capital system divides capital into two tiers- core capital (Tier I) and supplementary capital (Tier II and Tier III). Tier 1 capital includes fully paid up capital, balance in share premium account, reserve for issue of bonus shares, general reserves as
disclosed on the balance-sheet and un-appropriated /un-remitted profit (net of accumulated losses, if any).
Tier II capital or Supplementary Capital (Tier II & III) is limited to 100 percent of core capital (Tier I). Tier II includes; general provisions or general reserves for loan losses, revaluation reserves, exchange translation reserves, undisclosed reserves and subordinated debt.
Tier III capital consists of short-term subordinated debt and is solely held for the purpose of meeting a proportion of the capital requirements for market risks.
Yield risk is the risk that arises out of the changes in interest rates on a bond or security when calculated as that rate of interest, which, if applied uniformly to future time periods sets the discounted value of future bond coupon and principal payments equal to the current market price of the bond.
Yield curve risk materializes when unanticipated shifts have an adverse effect on the bank’s income or underlying economic value.
Contents
Section Page
List of Abbreviations i
Glossary ii
1. Overview 1
2. Assets and Funding Structure 5
2.1 Deposits 7
2.2 Borrowings 9
2.3 Loans 9
2.4 Investments 12
3. Financial Soundness of the Banking System 14
3.1 Solvency 14
3.2 Profitability 18
4. Risk Assessment of the Banking System 21
4.1 Credit Risk 21
4.2 Market Risk 25
4.3 Liquidity Risk 29
5. Performance of Islamic Banking 32
6. Resilience of the Banking System Towards Stress Tests 35
Annex-I Financial Soundness Indicators 40
Annex-II Selected Indicators for Different Categories of Banks 42
Annex-III Bank-wise Major Statistics 43
Annex-IV Group-wise Composition of Banks 44

1
Quarterly Performance Review of the Banking System June 2007 1
Overview
The assets of banking system witnessed an exceptional growth during the June-07 quarter as compared to last many quarters, mainly supported by the huge increase in deposits and healthy addition in capital. In sharp contrast to the recent years’ trend when loans remained the mainstay of the inflows till CY06, it was the investments that attracted much of the share of the increased inflows during this quarter. Overall, performance of the banking system remained healthy, on the back of strong profits and strengthening capital position. The performance of the key financial soundness indicators generally witnessed an extension of the previous quarter’s performance. Though the aggressive loan growth in the past few years have resulted in marginal rise in the level of infected portfolio, the healthy profits lent hand to keep the key asset quality indicators in check. Market risk profile of the banking system remained contained. On the back of extraordinary deposits inflows and slowdown in advances, liquidity indicators suggested further softening during the quarter under review.
Total assets of the banking system grew exceptionally by 11 percent i.e. Rs499 billion to Rs4,952 billion during the Jun-07 quarter, equal to almost 80 percent of the full year increase of CY06. The slowdown in the growth of loan portfolio witnessed in March 07 quarter continued in June quarter too, as loans took only one-fourth of this increased asset base. Specifically, loans of the banking system increased by Rs132 billion to Rs2,496 billion during the quarter, which, nevertheless is substantial when compared with the previous years’ trend - almost equal to the one third of the total increase
1 The review is based on the data mainly taken from the Quarterly Reports of Condition and Annual Audited Accounts submitted by the banks. It covers their global operations, unless otherwise mentioned. The banks have been divided into four groups namely, Public Sector Commercial Banks (PSCBs), Local Private Banks (LPBs), Foreign Banks (FBs) and Specialized Banks (SBs). PSCBs include two nationalized commercial banks and two provincial banks, whereas LPBs consist of four privatized banks and nineteen domestic private banks. The composition of these four groups has been given at Annex-IV. The performance of the overall banking system, particularly these groups of banks, has been evaluated using the financial soundness indicators.

2
in CY06. On the other hand, significant share of inflows stayed with investments, which increased by a handsome figure of Rs202 billion, as compare to full year’s increase of Rs47 billion in CY06. Resultantly, the share of investments in total assets has increased to 23.8 percent from 19.3 percent in CY06 and the share of loans reduced to 50.5 percent from 55.8 percent in CY06. Moreover, lending to financial Institutions though constitute small portion of the assets, has substantially increased by Rs84 billion during the Jun-07 quarter.
Profitability of the banking system continued to grow – signifying an extension to the previous years’ trend. Before tax profit of the banking system reached to Rs68.5 billion, which constitutes around 55 percent of the full year profit of CY06. After tax profit increased to Rs45.4 billion, which accounts for about 54 percent of the full year after tax profit of CY06. As a result, key profitability indicators remained strong. Both the before tax and after tax ROA of the banking system maintained the last quarters’ level of 3.0 percent and 2.0 percent in Jun-07. Despite significant increase in the equity base through capital injection, the banking system was able to maintain ROE at previous quarter’s level 20.6 percent.
Disaggregated analysis of income and expenses shows that increase in interest expense was on higher side as compared to the increase in the interest income. This may be referred to relatively higher increase in deposits rates as well as some compositional shift of the assets away from loans to the investments, which offer comparatively lower returns. Increase in cost of deposits is well supported by the declining interest rate spread between the weighted average rates of return on incremental loans and fresh deposits, which squeezed to 4.99 percent from 5.18 percent in Mar-07.
Capital of the banking system strengthened further during the quarter. The shareholders’ equity surpassed the level of Rs400 billion. The qualifying risk based capital of the banking system increased by 6 percent i.e. Rs24 billion to Rs419 billion during the quarter under review. In absolute terms, core capital increased to Rs334 billion from Rs316 billion. The level of supplementary capital also increased to Rs85 billion from Rs79 billion during the same period. Since a greater rise has been witnessed in core capital, its share in total capital has increased to 80.3 percent. Capital
3
adequacy ratio (CAR) of the banking system stayed almost at the previous quarter’s level of 13.3.
The key asset quality ratios experienced improvement during Jun-07 quarter as compared to March 07 quarter despite a minor fading in the credit quality of the banking system following the aggressive credit growth during the past few years. Specifically, NPLs of banking system, which had been decreasing till CY06, experienced a small increase of Rs3 billion during the Jun-07 quarter however net NPLs improved by Rs2 billion to Rs45. The increase in NPLs came only from LPBs, whereas the improvement in net NPLs was largely because of higher provisioning against the infected loans. The specialized banks have significantly improved their levels of NPLs and net NPLs, which dropped by Rs6 billion and Rs7 billion respectively during the quarter, whereas PSCBs and FBs were able to keep their levels in check. However the LPBs experienced increase in both NPLs as well as net NPLs by Rs9 billion and Rs6 billion respectively. Both the NPLs to loans ratio and net NPLs to net Loans ratio of the banking system improved to 7.1 percent and 1.8 percent from 7.4 percent and 2.0 percent in Mar-07. The improvement in these indicators was largely because of more than proportional increase in level of advances then level of NPLs. Segment wise, the NPLs to loans ratios of corporate, SME and consumer segments have increased by 0.2 percent, 0.6 percent and 0.4 percent to 6.9 percent, 9.7 percent and 3.6 percent respectively in Jun-07 quarter. On the other hand, infection ratio of agriculture sector witnessed a decline of 4.4 percent to 19.3 percent during the quarter.
Market risk profile of the banking system remained restrained. Though there has been gradual increase in the PKRV rates along all the time buckets, but since the repricing GAPs are not that large, interest rate exposure of the banking system remained subdued. As for the interest rate risk, Pakistan’s exchange rate remained broadly stable during the last few years and during the Jun-07 quarter it hovered around 60.4 rupees. Net open position (NOP) largely stayed positive and well within the limits, the exchange rate exposure of the banks seemed subtle. Direct equity exposure of the banking system, which included investments in both the listed and unlisted stocks, experienced a slight decline to Rs33.2 billion from Rs33.9 billion in Mar-07 quarter. This exposure when measured in terms of total capital stayed less than 7 percent, which seems not large. Liquidity of the banking system further eased during the quarter. A shift of the assets away
4
from loans to investments added to the liquidity of the banking system. Loans to deposits ratio of the banking system softened to 63.9 percent from 66.0 percent in Mar-07. Liquid assets to total asset ratio also increased to 35.8 percent from 34.0 percent in Mar-07.
Segment wise increase in loans portfolio reveals that it was corporate sector, commodity finance and the consumer finance activities, which attracted significant portion of the incremental loans. Loans of corporate sector increased by Rs38 billion to Rs1,343 billion. Commodity finance, with almost an equal increase reached Rs169 billion. Growth in consumer finance, which has been attracting much attention of the stakeholders, remained at 6 percent during the quarter and its level has reached Rs354 billion and its share in total loans increased slightly to 14.3 percent from 14.1 percent in Mar-07.
Summing up, assets of the banking system experienced significant growth during the quarter. Noticeable shift has been seen in the composition of banking system’s assets, away from loans towards investments. Operating performance also remained on track. Both the capital and profits of the banking system strengthened further. A marginal increase in NPLs however warrants due attention of the risk managers of the banks and its forthcoming movement would largely shape the profitability of the banking system. Solvency profile is expected to strengthen further on the back of capital injections as part of the ongoing consolidation process.
5
2. Assets and Funding Structure
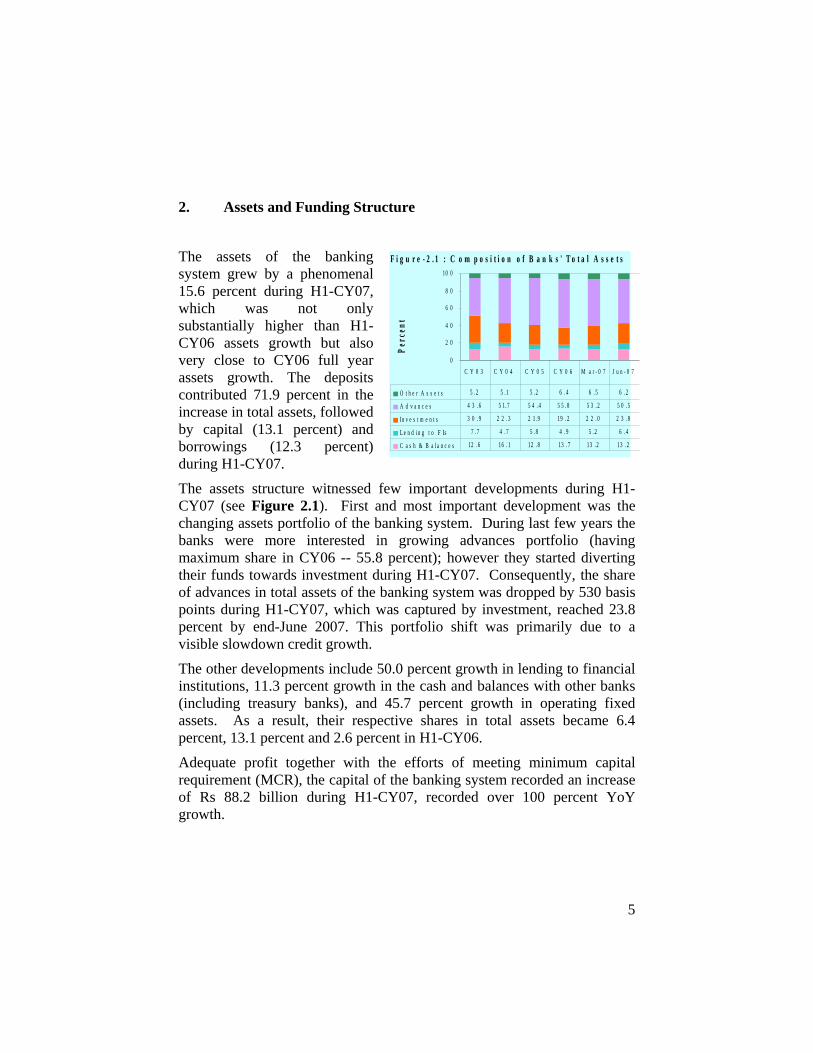
The assets of the banking system grew by a phenomenal 15.6 percent during H1-CY07, which was not only substantially higher than H1-CY06 assets growth but also very close to CY06 full year assets growth. The deposits contributed 71.9 percent in the increase in total assets, followed by capital (13.1 percent) and borrowings (12.3 percent) during H1-CY07.
The assets structure witnessed few important developments during H1-CY07 (see Figure 2.1). First and most important development was the changing assets portfolio of the banking system. During last few years the banks were more interested in growing advances portfolio (having maximum share in CY06 -- 55.8 percent); however they started diverting their funds towards investment during H1-CY07. Consequently, the share of advances in total assets of the banking system was dropped by 530 basis points during H1-CY07, which was captured by investment, reached 23.8 percent by end-June 2007. This portfolio shift was primarily due to a visible slowdown credit growth.
The other developments include 50.0 percent growth in lending to financial institutions, 11.3 percent growth in the cash and balances with other banks (including treasury banks), and 45.7 percent growth in operating fixed assets. As a result, their respective shares in total assets became 6.4 percent, 13.1 percent and 2.6 percent in H1-CY06.
Adequate profit together with the efforts of meeting minimum capital requirement (MCR), the capital of the banking system recorded an increase of Rs 88.2 billion during H1-CY07, recorded over 100 percent YoY growth.
0
2 0
4 0
6 0
8 0
10 0
Perc
ent
O t h e r A s s e t s 5 . 2 5 . 1 5 . 2 6 . 4 6 . 5 6 . 2
A d v a n c e s 4 3 . 6 5 1. 7 5 4 . 4 5 5 . 8 5 3 . 2 5 0 . 5
In v e s t m e n t s 3 0 . 9 2 2 . 3 2 1. 9 19 . 2 2 2 . 0 2 3 . 8
L e n d in g t o F Is 7 . 7 4 . 7 5 . 8 4 . 9 5 . 2 6 . 4
C a s h & B a l a n c e s 12 . 6 16 . 1 12 . 8 13 . 7 13 . 2 13 . 2
C Y 0 3 C Y 0 4 C Y 0 5 C Y 0 6 M a r - 0 7 J u n - 0 7
F i g u r e - 2 . 1 : C o m p o s i t i o n o f B a n k s ' T o t a l A s s e t s
6
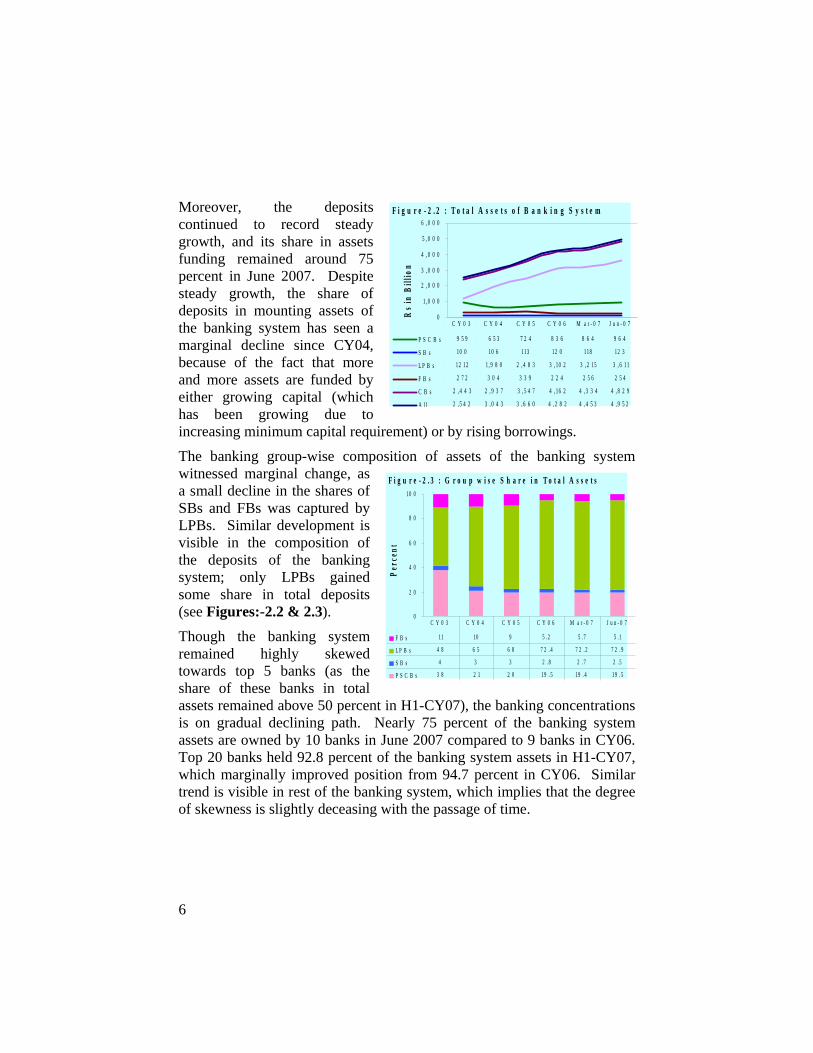
Moreover, the deposits continued to record steady growth, and its share in assets funding remained around 75 percent in June 2007. Despite steady growth, the share of deposits in mounting assets of the banking system has seen a marginal decline since CY04, because of the fact that more and more assets are funded by either growing capital (which has been growing due to increasing minimum capital requirement) or by rising borrowings.
The banking group-wise composition of assets of the banking system witnessed marginal change, as a small decline in the shares of SBs and FBs was captured by LPBs. Similar development is visible in the composition of the deposits of the banking system; only LPBs gained some share in total deposits (see Figures:-2.2 & 2.3).
Though the banking system remained highly skewed towards top 5 banks (as the share of these banks in total assets remained above 50 percent in H1-CY07), the banking concentrations is on gradual declining path. Nearly 75 percent of the banking system assets are owned by 10 banks in June 2007 compared to 9 banks in CY06. Top 20 banks held 92.8 percent of the banking system assets in H1-CY07, which marginally improved position from 94.7 percent in CY06. Similar trend is visible in rest of the banking system, which implies that the degree of skewness is slightly deceasing with the passage of time.
0
1, 0 0 0
2 , 0 0 0
3 , 0 0 0
4 , 0 0 0
5 , 0 0 0
6 , 0 0 0
Rs i
n Bi
llion
P S C B s 9 5 9 6 5 3 7 2 4 8 3 6 8 6 4 9 6 4
S B s 10 0 10 6 113 12 0 118 12 3
L P B s 12 12 1 , 9 8 0 2 , 4 8 3 3 , 10 2 3 , 2 15 3 , 6 11
F B s 2 7 2 3 0 4 3 3 9 2 2 4 2 5 6 2 5 4
C B s 2 , 4 4 3 2 , 9 3 7 3 , 5 4 7 4 , 16 2 4 , 3 3 4 4 , 8 2 9
A l l 2 , 5 4 2 3 , 0 4 3 3 , 6 6 0 4 , 2 8 2 4 , 4 5 3 4 , 9 5 2
C Y 0 3 C Y 0 4 C Y 0 5 C Y 0 6 M a r - 0 7 J u n - 0 7
F i g u r e - 2 . 2 : T o t a l A s s e t s o f B a n k i n g S y s t e m
0
2 0
4 0
6 0
8 0
10 0
Perc
ent
F B s 11 10 9 5 . 2 5 . 7 5 . 1
L P B s 4 8 6 5 6 8 7 2 . 4 7 2 . 2 7 2 . 9
S B s 4 3 3 2 . 8 2 . 7 2 . 5
P S C B s 3 8 2 1 2 0 19 . 5 19 . 4 19 . 5
C Y 0 3 C Y 0 4 C Y 0 5 C Y 0 6 M a r - 0 7 J u n - 0 7
F i g u r e - 2 . 3 : G r o u p w i s e S h a r e i n T o t a l A s s e t s
7
Deposits and other accounts’ is still the single largest funding source of the banking system assets. Nearly 72 percent of additional assets were funded by deposits during H1-CY07. However, during last few quarters, its contribution in total assets depicts a declining trend. Specifically the share of deposits, which was close to 80 percent of the footings of the balance sheet of the banking system in CY04, gradually shrunk to 74.4 percent in H1-CY07.
It is important to note that the deposits of the banking system grew rapidly during H1-CY07; the growth rate was even higher than an average and steady growth of over 15 percent per annum during CY02-CY07. According to June 2007 data, the deposits growth rate was 15.0 percent in just six months (or 30 percent per annum). The huge external inflows including workers’ remittances, foreign direct investment and debt flows besides slight credit expansion were the main contributors in steady deposit growth. Despite this growth, the declining share of deposits was due to even higher rise in capital, as the banks have been raising more and more capital in order to meet the MCR.
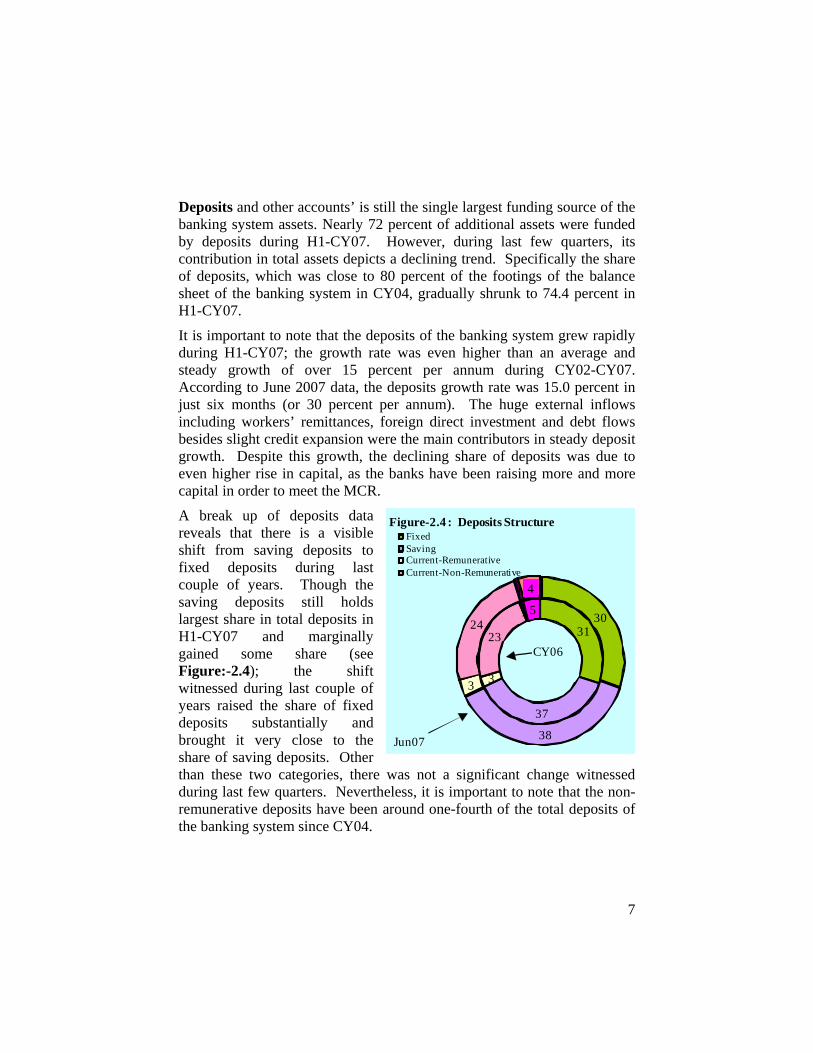
A break up of deposits data reveals that there is a visible shift from saving deposits to fixed deposits during last couple of years. Though the saving deposits still holds largest share in total deposits in H1-CY07 and marginally gained some share (see Figure:-2.4); the shift witnessed during last couple of years raised the share of fixed deposits substantially and brought it very close to the share of saving deposits. Other than these two categories, there was not a significant change witnessed during last few quarters. Nevertheless, it is important to note that the non-remunerative deposits have been around one-fourth of the total deposits of the banking system since CY04.
31
37
3
23
1 5 30
38
3
24
1 4
Figure-2.4 : Deposits StructureFixedSavingCurrent-RemunerativeCurrent-Non-Remunerative
CY06
Jun07
8
Capital in contrast to CY06, when most of capital augmentation occurred in second half of the year, the banks during CY07 started raising their capital base substantially in the first six months. The capital of the banking system grew by 22.0 percent during H1-CY07 compared to 11.7 percent in H1-CY06. In fact, the capital of the banking system has been growing by phenomenal 40.6 percent per annum since CY02, and H1-CY07 was no exception. Primarily it was due to minimum capital requirement, which implies that every bank has to raise its capital by at least Rs one billion every year, in order to reach ultimate level of Rs 6 billion by end-CY09.
Not surprisingly, the banks’ efforts to meet MCR raised the share of capital in funding total assets of the banking system. Specifically, by end-June 2007, the net assets of the banking system were 9.9 percent of the total assets, showing substantially improved position from 4.8 percent in CY02, and also a marginal improvement in H1-CY07.
While H1-CY06 increase in capital was contributed largely by revaluation surplus, reserves and unremitted profit; the H1-CY07 increase was attributed to assigned capital (Rs 28.4 billion) and reserves (Rs 24.8 billion). And it was also substantiated by unremitted profit (Rs 19.5 billion) and revaluation surplus (Rs 15.5 billion).
Borrowings of the banking system grew by 19.3 percent during H1-CY07, higher than overall assets growth rate, which implies that the borrowings have funded marginally larger portion of assets in this period. Specifically, the 10.3 percent of the assets of the banking system are funded by the borrowings in H1-CY07 compared to 10.0 percent in CY06.
The breakup of the borrowings data reveals that the share of secured borrowings is on the rise since CY04, reached 87.7 percent in H1-CY07 from 83.5 percent in CY04. Interestingly, though the share of the borrowings from SBP recorded decline in H1-CY07 from 23.0 percent in CY04, the absolute amount of loans marginally increased in this period. .
Advances (net) after showing strong growth during CY03-CY06 (27.2 percent per annum), witnessed a small growth of 4.6 percent (or Rs 109.8 billion) during H1-CY07. Resultantly, the share of advances in total assets dropped by 530 basis points in H1-CY07; shrunk to 50.5 percent from 55.8 percent in CY06.

9
A breakup of advances data2 reveals that the slowdown is witnessed across the board. In fact, SME sector and commodity finance recorded a decline in their total loans portfolio during H1-CY07. The decline in advances to SME sector came from working capital. The segment-wise composition of the advances therefore saw marginal changes in this period. Specifically, the corporate sector and consumer finance marginally increased their shares in total advances, whereas SME & Agriculture sectors and commodity finance lost their shares slightly (see Figure 2.5 & Table:-2.1).
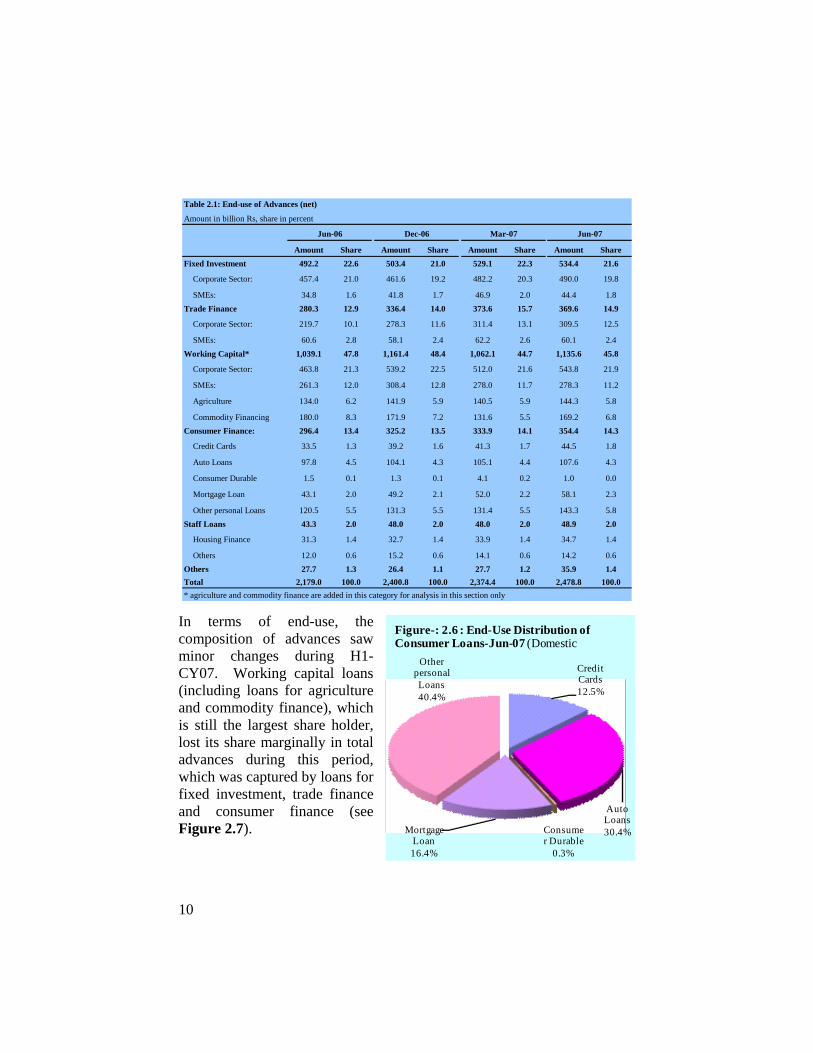
Consumer finance recorded a slowdown in H1-CY07 after showing tremendous growth in last few years. It grew by only 9.0 percent during H1-CY07, however its share in total advances increased by 75 basis points. A detailed analysis reveals that the slowdown is witnessed primarily in Auto loans and other personal loans; none of the consumer finance product recorded decline in absolute term during H1-CY07 except loans for consumer durables. While the other personal loans maintained its highest share in consumer finance at 40.4 percent, the Auto loans lost its share to mortgage loans and credit cards. The uncollateralized credit cards loans increased to Rs 44.4 billion in H1-CY06 from Rs 39.2 billion in CY06, raising its share by 48 basis points; the mortgage loans rose to Rs 58.1 billion in H1-CY07 from Rs 49.2 billion in CY06, raising its share by 124 basis points (see Figure 2.6).
2 This section is based on banks domestic operations only.
Corporate Sector54.2%SMEs
15.4%
Agriculture
5.8%
Consumer Finance14.3%
Commodity Finance
6.8%
Staff Loans2.0%
Others1.4%
Figure-2.5 : Loans by Type of Borrowers-June-07
10
Amount Share Amount Share Amount Share Amount Share492.2 22.6 503.4 21.0 529.1 22.3 534.4 21.6
Corporate Sector: 457.4 21.0 461.6 19.2 482.2 20.3 490.0 19.8
SMEs: 34.8 1.6 41.8 1.7 46.9 2.0 44.4 1.8280.3 12.9 336.4 14.0 373.6 15.7 369.6 14.9
Corporate Sector: 219.7 10.1 278.3 11.6 311.4 13.1 309.5 12.5
SMEs: 60.6 2.8 58.1 2.4 62.2 2.6 60.1 2.41,039.1 47.8 1,161.4 48.4 1,062.1 44.7 1,135.6 45.8
Corporate Sector: 463.8 21.3 539.2 22.5 512.0 21.6 543.8 21.9
SMEs: 261.3 12.0 308.4 12.8 278.0 11.7 278.3 11.2
Agriculture 134.0 6.2 141.9 5.9 140.5 5.9 144.3 5.8
Commodity Financing 180.0 8.3 171.9 7.2 131.6 5.5 169.2 6.8296.4 13.4 325.2 13.5 333.9 14.1 354.4 14.3
Credit Cards 33.5 1.3 39.2 1.6 41.3 1.7 44.5 1.8
Auto Loans 97.8 4.5 104.1 4.3 105.1 4.4 107.6 4.3
Consumer Durable 1.5 0.1 1.3 0.1 4.1 0.2 1.0 0.0
Mortgage Loan 43.1 2.0 49.2 2.1 52.0 2.2 58.1 2.3
Other personal Loans 120.5 5.5 131.3 5.5 131.4 5.5 143.3 5.843.3 2.0 48.0 2.0 48.0 2.0 48.9 2.0
Housing Finance 31.3 1.4 32.7 1.4 33.9 1.4 34.7 1.4
Others 12.0 0.6 15.2 0.6 14.1 0.6 14.2 0.627.7 1.3 26.4 1.1 27.7 1.2 35.9 1.4
2,179.0 100.0 2,400.8 100.0 2,374.4 100.0 2,478.8 100.0
Jun-07Mar-07
Table 2.1: End-use of Advances (net)
Amount in billion Rs, share in percent
Dec-06Jun-06
Fixed Investment
Trade Finance
Working Capital*
Consumer Finance:
Staff Loans
Others Total* agriculture and commodity finance are added in this category for analysis in this section only
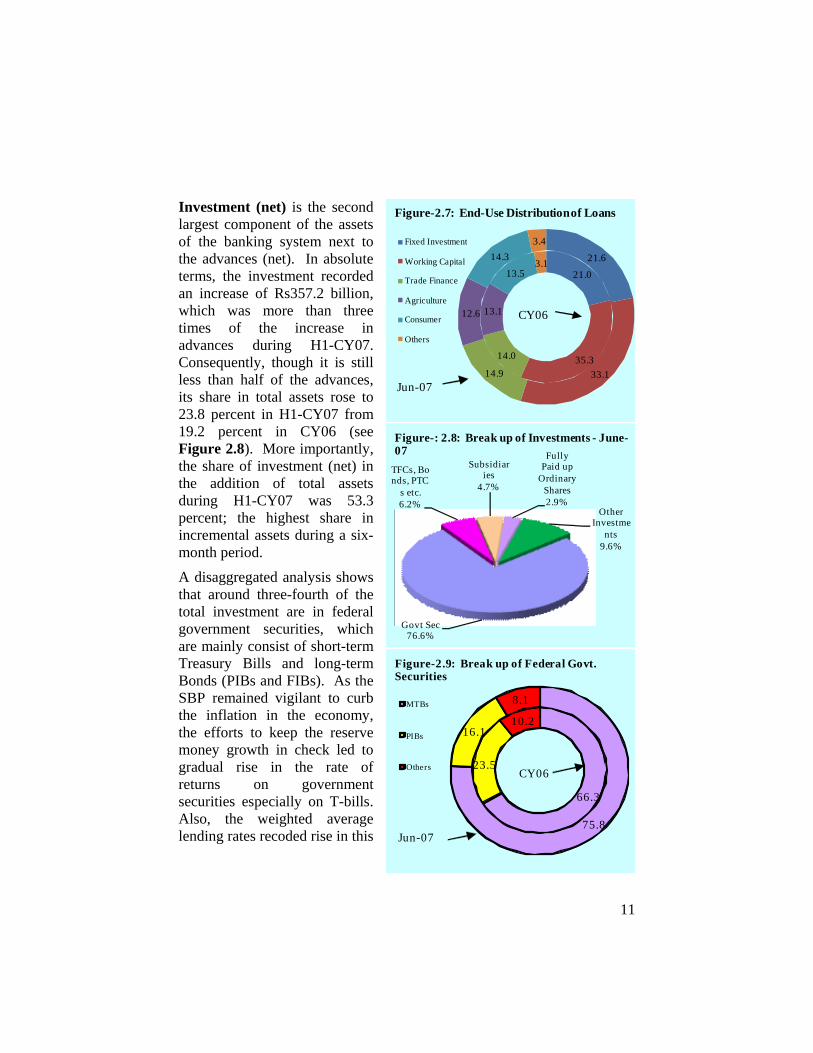
In terms of end-use, the composition of advances saw minor changes during H1-CY07. Working capital loans (including loans for agriculture and commodity finance), which is still the largest share holder, lost its share marginally in total advances during this period, which was captured by loans for fixed investment, trade finance and consumer finance (see Figure 2.7).
Credit Cards12.5%
Auto Loans30.4%Consume
r Durable0.3%
Mortgage Loan16.4%
Other personal Loans40.4%
Figure-: 2.6 : End-Use Distribution of Consumer Loans-Jun-07 (Domestic
11
Investment (net) is the second largest component of the assets of the banking system next to the advances (net). In absolute terms, the investment recorded an increase of Rs357.2 billion, which was more than three times of the increase in advances during H1-CY07. Consequently, though it is still less than half of the advances, its share in total assets rose to 23.8 percent in H1-CY07 from 19.2 percent in CY06 (see Figure 2.8). More importantly, the share of investment (net) in the addition of total assets during H1-CY07 was 53.3 percent; the highest share in incremental assets during a six-month period.
A disaggregated analysis shows that around three-fourth of the total investment are in federal government securities, which are mainly consist of short-term Treasury Bills and long-term Bonds (PIBs and FIBs). As the SBP remained vigilant to curb the inflation in the economy, the efforts to keep the reserve money growth in check led to gradual rise in the rate of returns on government securities especially on T-bills. Also, the weighted average lending rates recoded rise in this
21.0
35.3 14.0
13.1
13.5 3.1 21.6
33.1 14.9
12.6
14.3 3.4 Fixed Investment
Working Capital
Trade Finance
Agriculture
Consumer
Others
CY06
Jun-07
Figure-2.7: End-Use Distribution of Loans
Govt Sec76.6%
TFCs, Bonds, PTC
s etc.6.2%
Subsidiaries
4.7%
Fully Paid up
Ordinary Shares2.9%
Other Investme
nts9.6%
Figure-: 2.8: Break up of Investments - June-07
66.3
23.5
10.2
75.8
16.1
8.1 MTBs
PIBs
Others CY06
Jun-07
Figure-2.9: Break up of Federal Govt. Securities
12
process. Thus the growth in advances witnessed a slowdown and the banks moved forward to place their funds in government securities. Specifically, the banks’ investment in government securities grew by exceptional 45.8 percent during H1-CY07; the highest rise in last four years.
A further analysis of banks investment in government securities reveals that the banks invested almost entirely in treasury bills during H1-CY07 (see Figure 2.9). Specifically, the banks’ investment in treasury bills rose to Rs 667.7 billion, showing an addition of Rs 265.9 billion during H1-CY07. On the other hand, the banks’ investment in PIBs increased by only Rs 13.0 billion during the period under review. Consequently, the share of PIBs in government securities dropped to 17.6 percent in H1-CY07 from 23.5 percent in CY06. On the other hand, treasury bills captured this share, and rose to 75.5 percent in H1-CY07.
Moreover, there was a sharp jump in ‘subsidiaries and associated undertakings’ investment during H1-CY07. Specifically, it rose to Rs 53.8 billion in H1-CY07 from Rs 21.1 billion in CY06, raising its share in total investment from 2.6 percent to 4.6 percent in just six months of CY07. Another important development was the substantial decline in the head of ‘TFCs & Debentures’ investment during H1-CY07; its share in total investment dropped to 6.1 percent from 10.2 percent during this period.

13
3. Financial Soundness of the Banking System 3.1 Solvency
Solvency profile of the banking system stayed healthy during the Jun-07 quarter. The shareholders’ equity surpassed the level of Rs400 billion. The qualifying risk based capital of the banking system increased by 6 percent (i.e. Rs24 billion) to Rs419 billion during the quarter under review. In absolute terms, core capital increased to Rs334 billion from Rs316 billion. The level of supplementary capital also increased to Rs85 billion from Rs79 billion during the same period (see Figure:-3.1. 1). Since a greater increased has been witnessed in core capital, its share in total capital has increased to 80.3 percent (see Figure:- 3.1.2).
Following the pattern of the previous quarter, the asset mix witnessed a compositional shift away from the risky assets i.e. loans to the investments. This has a direct affect on the risk profile of the banking system and the risk weighted assets, in terms of total assets, experienced a decline to 63.9 percent from 66.4 percent in Mar-07 quarter (see
050
100150200250300350400450
Billi
on ru
pees
S upple me nt a ryCa pit a l
2.9 23.3 50.8 69.7 76.2 79.4 84.6
Core Ca pit a l 25.4 77.0 131.7 195.3 288.3 316.3 334.5
Re quire d Core 25.0 47.3 69.6 94.2 115.2 118.3 118.3
Re quire d Tot a l 50.0 94.7 139.3 188.3 230.5 236.6 236.55
CY97 CY03 CY04 CY05 CY06Ma r-
07J un-
07
Figure-3.1.1: Risk-based Capital Position
35
45
55
65
All Banks 4 3 .5 46 .5 57.2 6 4 .3 6 7.3 66 .4 6 3 .9
Comm. Banks 4 1.1 45.2 56 .6 6 4 .1 6 7.0 66 .2 6 3 .7
CY9 7 CY03 CY0 4 CY0 5 CY0 6 Mar-07
Jun-0 7
Figure-3.1.3: RWA to Total Assets
0
20
40
60
80
100
CY97CY01
CY02CY03
CY04CY05
CY06
Mar-07
Jun-07
0246810121416
Tier 1 Tier 2 CAR (RHS in %)
Figure:-3.1.2 Capital Structure and Capital Adequacy
14
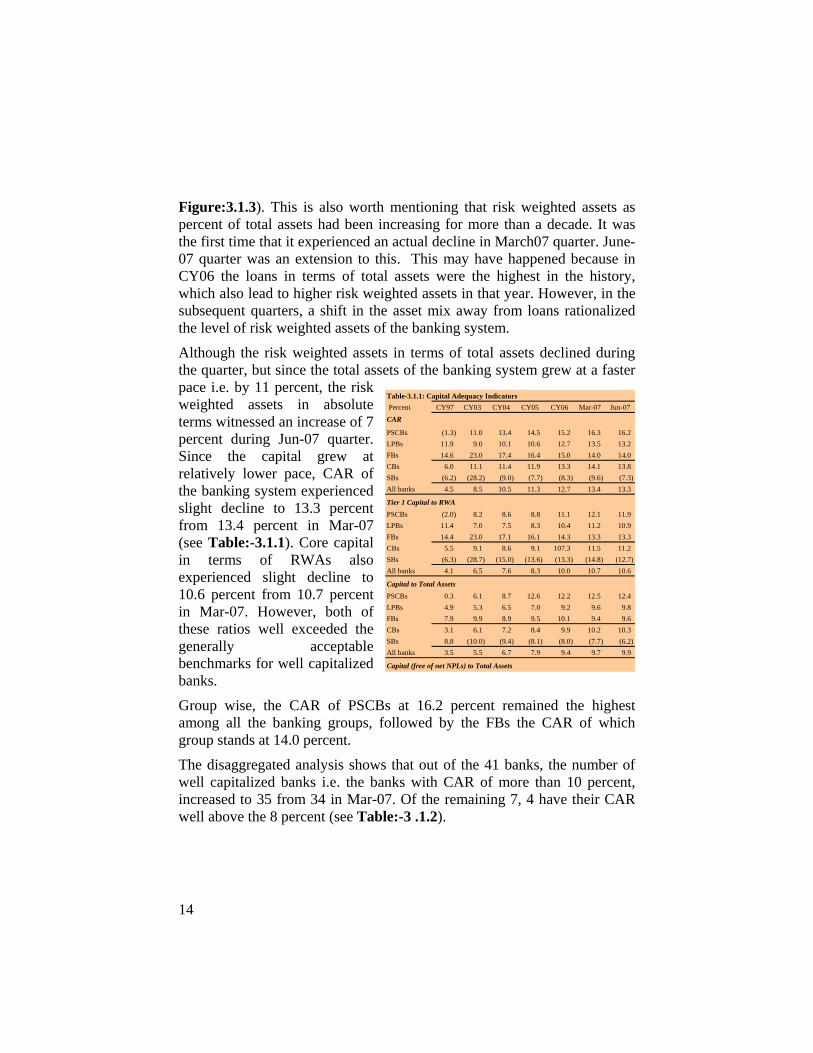
Figure:3.1.3). This is also worth mentioning that risk weighted assets as percent of total assets had been increasing for more than a decade. It was the first time that it experienced an actual decline in March07 quarter. June-07 quarter was an extension to this. This may have happened because in CY06 the loans in terms of total assets were the highest in the history, which also lead to higher risk weighted assets in that year. However, in the subsequent quarters, a shift in the asset mix away from loans rationalized the level of risk weighted assets of the banking system.
Although the risk weighted assets in terms of total assets declined during the quarter, but since the total assets of the banking system grew at a faster pace i.e. by 11 percent, the risk weighted assets in absolute terms witnessed an increase of 7 percent during Jun-07 quarter. Since the capital grew at relatively lower pace, CAR of the banking system experienced slight decline to 13.3 percent from 13.4 percent in Mar-07 (see Table:-3.1.1). Core capital in terms of RWAs also experienced slight decline to 10.6 percent from 10.7 percent in Mar-07. However, both of these ratios well exceeded the generally acceptable benchmarks for well capitalized banks.
Group wise, the CAR of PSCBs at 16.2 percent remained the highest among all the banking groups, followed by the FBs the CAR of which group stands at 14.0 percent.
The disaggregated analysis shows that out of the 41 banks, the number of well capitalized banks i.e. the banks with CAR of more than 10 percent, increased to 35 from 34 in Mar-07. Of the remaining 7, 4 have their CAR well above the 8 percent (see Table:-3 .1.2).
Percent CY97 CY03 CY04 CY05 CY06 Mar-07 Jun-07CAR
PSCBs (1.3) 11.0 13.4 14.5 15.2 16.3 16.2 LPBs 11.9 9.0 10.1 10.6 12.7 13.5 13.2 FBs 14.6 23.0 17.4 16.4 15.0 14.0 14.0 CBs 6.0 11.1 11.4 11.9 13.3 14.1 13.8 SBs (6.2) (28.2) (9.0) (7.7) (8.3) (9.6) (7.3) All banks 4.5 8.5 10.5 11.3 12.7 13.4 13.3
PSCBs (2.0) 8.2 8.6 8.8 11.1 12.1 11.9 LPBs 11.4 7.0 7.5 8.3 10.4 11.2 10.9 FBs 14.4 23.0 17.1 16.1 14.3 13.3 13.3 CBs 5.5 9.1 8.6 9.1 107.3 11.5 11.2 SBs (6.3) (28.7) (15.0) (13.6) (13.3) (14.8) (12.7) All banks 4.1 6.5 7.6 8.3 10.0 10.7 10.6
Capital to Total AssetsPSCBs 0.3 6.1 8.7 12.6 12.2 12.5 12.4 LPBs 4.9 5.3 6.5 7.0 9.2 9.6 9.8 FBs 7.9 9.9 8.9 9.5 10.1 9.4 9.6 CBs 3.1 6.1 7.2 8.4 9.9 10.2 10.3 SBs 8.8 (10.0) (9.4) (8.1) (8.0) (7.7) (6.2) All banks 3.5 5.5 6.7 7.9 9.4 9.7 9.9
Capital (free of net NPLs) to Total Assets
Table-3.1.1: Capital Adequacy Indicators
Tier 1 Capital to RWA
15
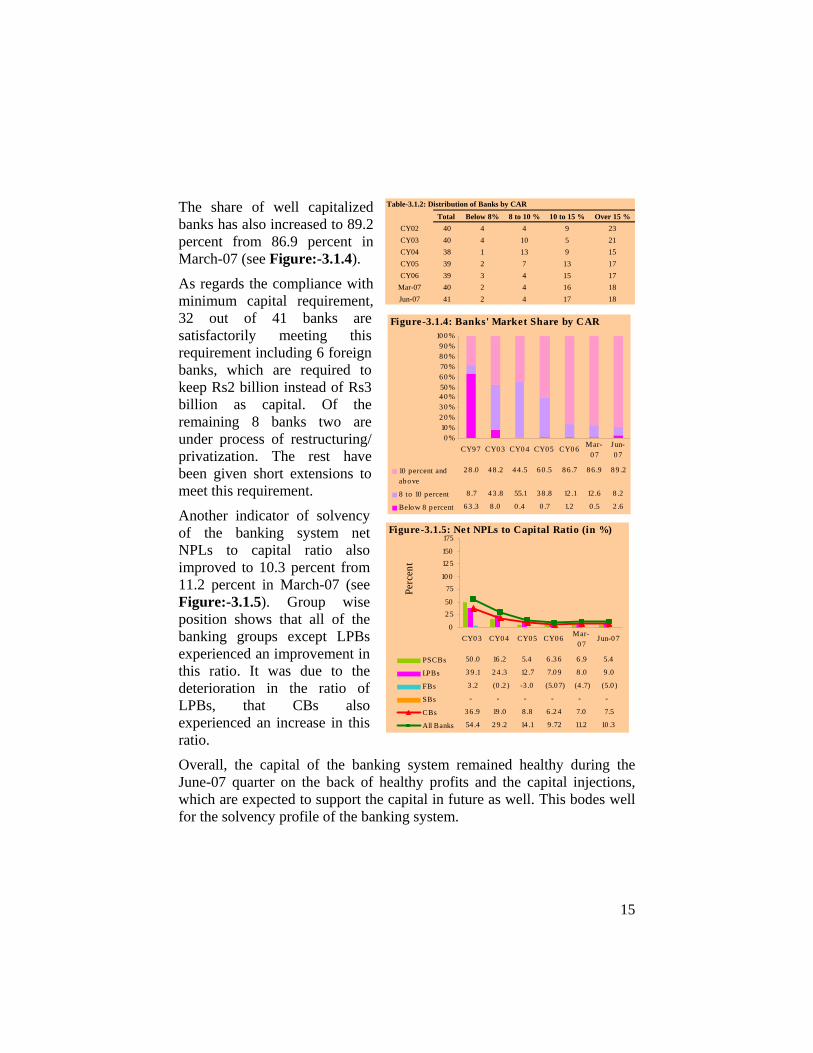
The share of well capitalized banks has also increased to 89.2 percent from 86.9 percent in March-07 (see Figure:-3.1.4).
As regards the compliance with minimum capital requirement, 32 out of 41 banks are satisfactorily meeting this requirement including 6 foreign banks, which are required to keep Rs2 billion instead of Rs3 billion as capital. Of the remaining 8 banks two are under process of restructuring/ privatization. The rest have been given short extensions to meet this requirement.
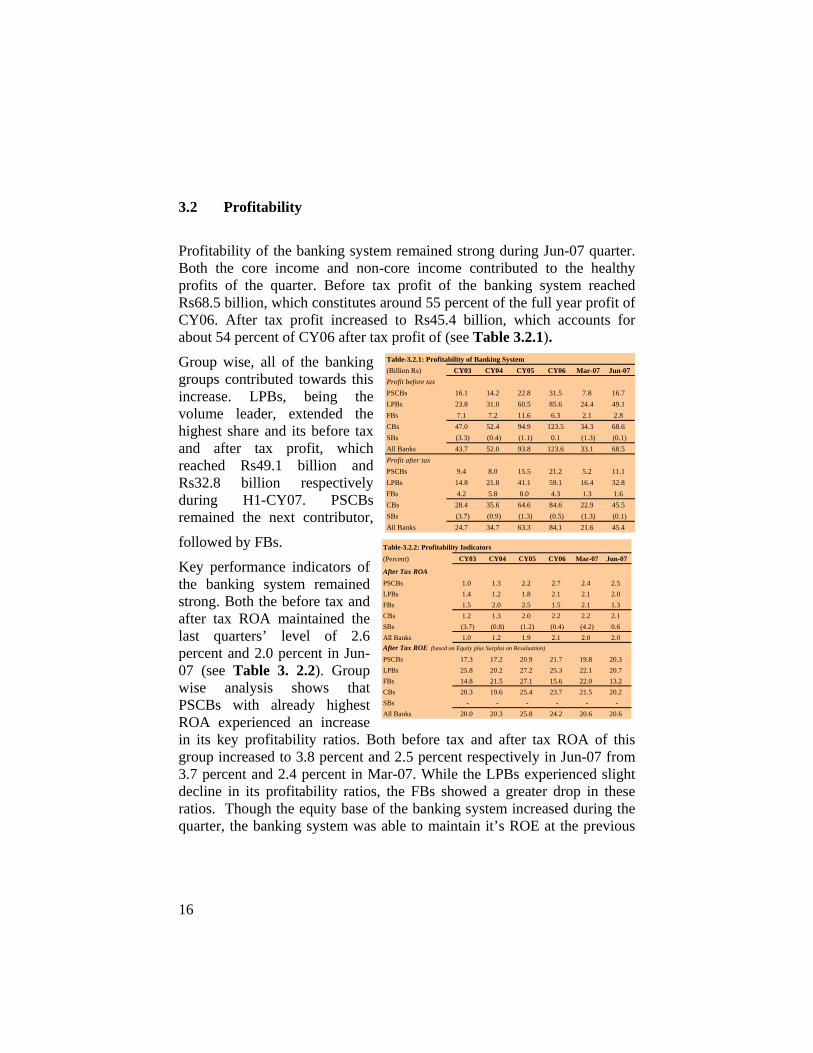
Another indicator of solvency of the banking system net NPLs to capital ratio also improved to 10.3 percent from 11.2 percent in March-07 (see Figure:-3.1.5). Group wise position shows that all of the banking groups except LPBs experienced an improvement in this ratio. It was due to the deterioration in the ratio of LPBs, that CBs also experienced an increase in this ratio.
Overall, the capital of the banking system remained healthy during the June-07 quarter on the back of healthy profits and the capital injections, which are expected to support the capital in future as well. This bodes well for the solvency profile of the banking system.
Total Below 8% 8 to 10 % 10 to 15 % Over 15 %CY02 40 4 4 9 23CY03 40 4 10 5 21CY04 38 1 13 9 15CY05 39 2 7 13 17CY06 39 3 4 15 17
Mar-07 40 2 4 16 18Jun-07 41 2 4 17 18
Table-3.1.2: Distribution of Banks by CAR
0
2 550
75100
12 5150
175
Perc
ent
PSCBs 50 .0 16 .2 5.4 6 .3 6 6 .9 5.4
LPBs 3 9 .1 2 4 .3 12 .7 7.0 9 8 .0 9 .0
FBs 3 .2 (0 .2 ) -3 .0 (5.0 7) (4 .7) (5.0 )
SBs - - - - - -
CBs 3 6 .9 19 .0 8 .8 6 .2 4 7.0 7.5
All Banks 54 .4 2 9 .2 14 .1 9 .72 11.2 10 .3
CY0 3 CY0 4 CY05 CY06 Mar-0 7
Jun-0 7
Figure-3.1.5: Net NPLs to Capital Ratio (in %)
0 %10 %
2 0 %3 0 %4 0 %50 %6 0 %70 %8 0 %9 0 %
10 0 %
10 p ercent andab ove
2 8 .0 48 .2 4 4 .5 6 0 .5 8 6 .7 8 6 .9 8 9 .2
8 to 10 p ercent 8 .7 43 .8 55.1 3 8 .8 12 .1 12 .6 8 .2
Belo w 8 p ercent 6 3 .3 8 .0 0 .4 0 .7 1.2 0 .5 2 .6
CY9 7 CY0 3 CY0 4 CY05 CY0 6 Mar-0 7
Jun-0 7
Figure-3.1.4: Banks' Market Share by CAR
16
3.2 Profitability
Profitability of the banking system remained strong during Jun-07 quarter. Both the core income and non-core income contributed to the healthy profits of the quarter. Before tax profit of the banking system reached Rs68.5 billion, which constitutes around 55 percent of the full year profit of CY06. After tax profit increased to Rs45.4 billion, which accounts for about 54 percent of CY06 after tax profit of (see Table 3.2.1).
Group wise, all of the banking groups contributed towards this increase. LPBs, being the volume leader, extended the highest share and its before tax and after tax profit, which reached Rs49.1 billion and Rs32.8 billion respectively during H1-CY07. PSCBs remained the next contributor,
followed by FBs.
Key performance indicators of the banking system remained strong. Both the before tax and after tax ROA maintained the last quarters’ level of 2.6 percent and 2.0 percent in Jun-07 (see Table 3. 2.2). Group wise analysis shows that PSCBs with already highest ROA experienced an increase in its key profitability ratios. Both before tax and after tax ROA of this group increased to 3.8 percent and 2.5 percent respectively in Jun-07 from 3.7 percent and 2.4 percent in Mar-07. While the LPBs experienced slight decline in its profitability ratios, the FBs showed a greater drop in these ratios. Though the equity base of the banking system increased during the quarter, the banking system was able to maintain it’s ROE at the previous
Table-3.2.1: Profitability of Banking System(Billion Rs) CY03 CY04 CY05 CY06 Mar-07 Jun-07
PSCBs 16.1 14.2 22.8 31.5 7.8 16.7LPBs 23.8 31.0 60.5 85.6 24.4 49.1FBs 7.1 7.2 11.6 6.3 2.1 2.8CBs 47.0 52.4 94.9 123.5 34.3 68.6SBs (3.3) (0.4) (1.1) 0.1 (1.3) (0.1)All Banks 43.7 52.0 93.8 123.6 33.1 68.5
PSCBs 9.4 8.0 15.5 21.2 5.2 11.1LPBs 14.8 21.8 41.1 59.1 16.4 32.8FBs 4.2 5.8 8.0 4.3 1.3 1.6CBs 28.4 35.6 64.6 84.6 22.9 45.5SBs (3.7) (0.9) (1.3) (0.5) (1.3) (0.1)All Banks 24.7 34.7 63.3 84.1 21.6 45.4
Profit before tax
Profit after tax
Table-3.2.2: Profitability Indicators(Percent) CY03 CY04 CY05 CY06 Mar-07 Jun-07
After Tax ROAPSCBs 1.0 1.3 2.2 2.7 2.4 2.5LPBs 1.4 1.2 1.8 2.1 2.1 2.0FBs 1.5 2.0 2.5 1.5 2.1 1.3CBs 1.2 1.3 2.0 2.2 2.2 2.1SBs (3.7) (0.8) (1.2) (0.4) (4.2) 0.6All Banks 1.0 1.2 1.9 2.1 2.0 2.0After Tax ROE (based on Equity plus Surplus on Revaluation)
PSCBs 17.3 17.2 20.9 21.7 19.8 20.3LPBs 25.8 20.2 27.2 25.3 22.1 20.7FBs 14.8 21.5 27.1 15.6 22.0 13.2CBs 20.3 19.6 25.4 23.7 21.5 20.2SBs - - - - - -All Banks 20.0 20.3 25.8 24.2 20.6 20.6
17
quarter’s level. Group wise, PSCBs witnessed an increase in both the before tax and after tax ROE during the quarter.
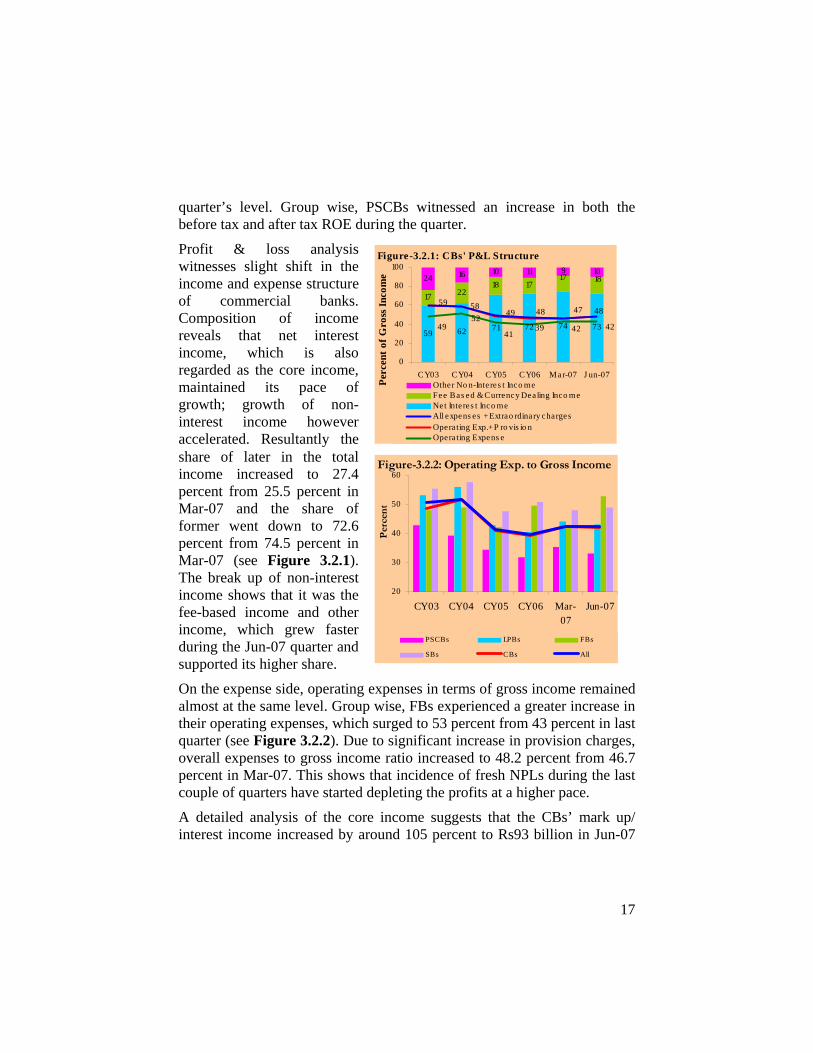
Profit & loss analysis witnesses slight shift in the income and expense structure of commercial banks. Composition of income reveals that net interest income, which is also regarded as the core income, maintained its pace of growth; growth of non-interest income however accelerated. Resultantly the share of later in the total income increased to 27.4 percent from 25.5 percent in Mar-07 and the share of former went down to 72.6 percent from 74.5 percent in Mar-07 (see Figure 3.2.1). The break up of non-interest income shows that it was the fee-based income and other income, which grew faster during the Jun-07 quarter and supported its higher share.
On the expense side, operating expenses in terms of gross income remained almost at the same level. Group wise, FBs experienced a greater increase in their operating expenses, which surged to 53 percent from 43 percent in last quarter (see Figure 3.2.2). Due to significant increase in provision charges, overall expenses to gross income ratio increased to 48.2 percent from 46.7 percent in Mar-07. This shows that incidence of fresh NPLs during the last couple of quarters have started depleting the profits at a higher pace.
A detailed analysis of the core income suggests that the CBs’ mark up/ interest income increased by around 105 percent to Rs93 billion in Jun-07
59 62 71 72 74 73
17 2218 17
24 16 10 11 9 1017 18
58
4952
4142 4239
48 47 484959
0
20
40
60
80
100
CY03 CY04 CY05 CY06 Mar-07 J un-07Pe
rcen
t of G
ross
Inco
me
Other No n-Inte res t Inco meFee Bas ed & Currency Dea ling Inco meNet Inte res t Inco meAll expens es + Extrao rdinary chargesOperating Exp.+ P ro vis io nOperating Expens e
Figure-3.2.1: CBs' P&L Structure
20
30
40
50
60
CY03 CY04 CY05 CY06 Mar-07
Jun-07
Per
cen
t
PSCBs LPBs FBs
SBs CBs All
Figure-3.2.2: Operating Exp. to Gross Income
18
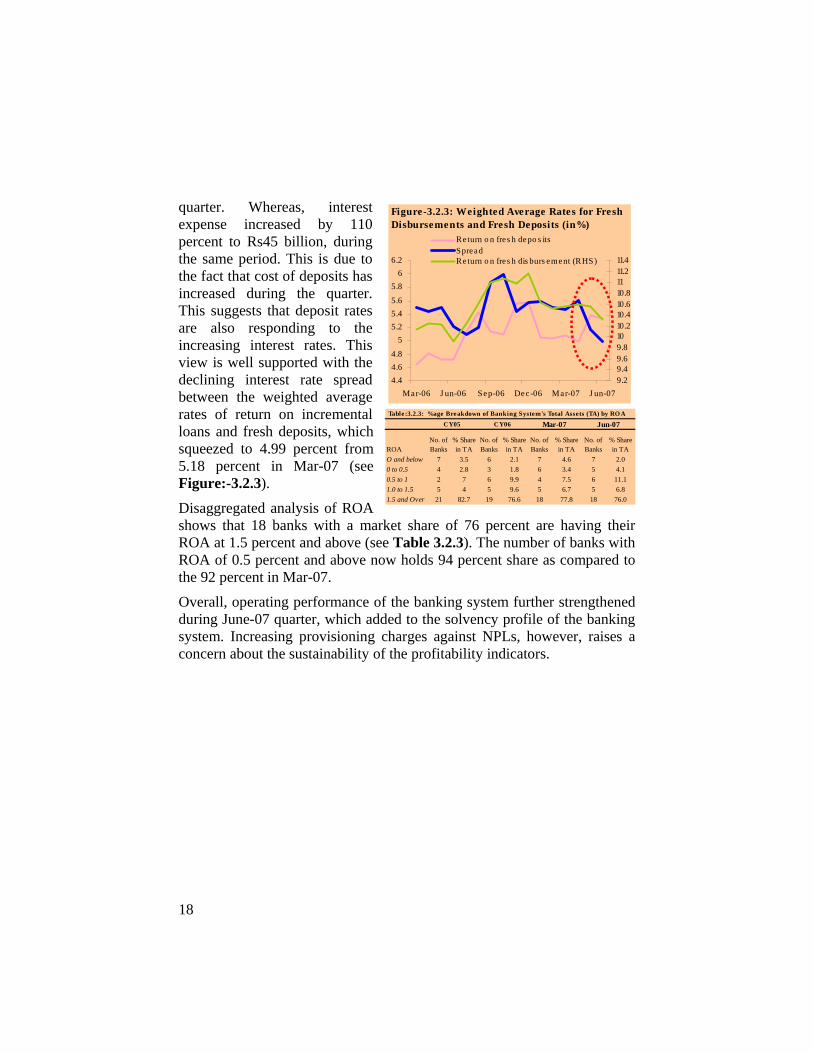
quarter. Whereas, interest expense increased by 110 percent to Rs45 billion, during the same period. This is due to the fact that cost of deposits has increased during the quarter. This suggests that deposit rates are also responding to the increasing interest rates. This view is well supported with the declining interest rate spread between the weighted average rates of return on incremental loans and fresh deposits, which squeezed to 4.99 percent from 5.18 percent in Mar-07 (see Figure:-3.2.3).
Disaggregated analysis of ROA shows that 18 banks with a market share of 76 percent are having their ROA at 1.5 percent and above (see Table 3.2.3). The number of banks with ROA of 0.5 percent and above now holds 94 percent share as compared to the 92 percent in Mar-07.
Overall, operating performance of the banking system further strengthened during June-07 quarter, which added to the solvency profile of the banking system. Increasing provisioning charges against NPLs, however, raises a concern about the sustainability of the profitability indicators.
Table:3.2.3: %age Breakdown of Banking System's Total Assets (TA) by RO A
ROANo. of Banks
% Share in TA
No. of Banks
% Share in TA
No. of Banks
% Share in TA
No. of Banks
% Share in TA
O and below 7 3.5 6 2.1 7 4.6 7 2.00 to 0.5 4 2.8 3 1.8 6 3.4 5 4.10.5 to 1 2 7 6 9.9 4 7.5 6 11.11.0 to 1.5 5 4 5 9.6 5 6.7 5 6.81.5 and Over 21 82.7 19 76.6 18 77.8 18 76.0
Jun-07Mar-07CY05 CY06
4.44.64.8
55.25.45.6
5.86
6.2
Mar-06 J un-06 Sep-06 Dec-06 Mar-07 J un-079.29.49.69.81010.210.410.610.81111.211.4
Return o n fres h depo s itsSpreadReturn o n fres h dis burs ement (RHS)
Figure-3.2.3: Weighted Average Rates for Fresh Disbursements and Fresh Deposits (in%)
19
4. Risk Assessment of the Banking System 4.1 Credit Risk
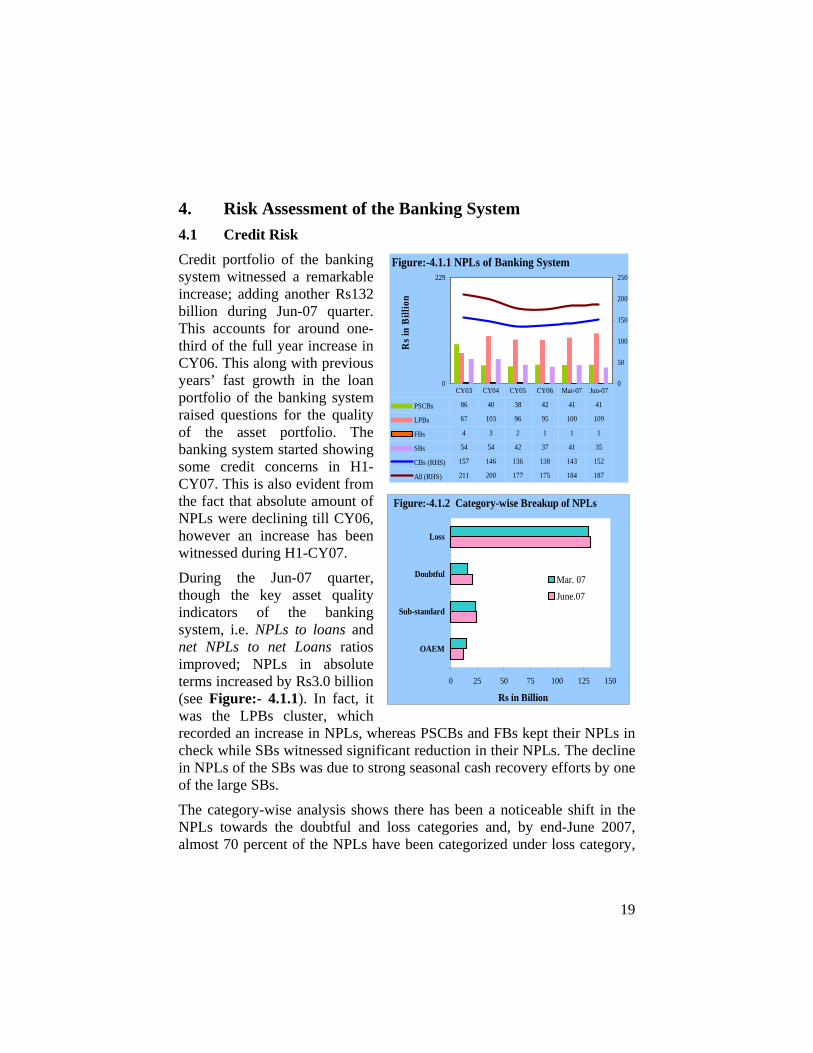
Credit portfolio of the banking system witnessed a remarkable increase; adding another Rs132 billion during Jun-07 quarter. This accounts for around one-third of the full year increase in CY06. This along with previous years’ fast growth in the loan portfolio of the banking system raised questions for the quality of the asset portfolio. The banking system started showing some credit concerns in H1-CY07. This is also evident from the fact that absolute amount of NPLs were declining till CY06, however an increase has been witnessed during H1-CY07.
During the Jun-07 quarter, though the key asset quality indicators of the banking system, i.e. NPLs to loans and net NPLs to net Loans ratios improved; NPLs in absolute terms increased by Rs3.0 billion (see Figure:- 4.1.1). In fact, it was the LPBs cluster, which recorded an increase in NPLs, whereas PSCBs and FBs kept their NPLs in check while SBs witnessed significant reduction in their NPLs. The decline in NPLs of the SBs was due to strong seasonal cash recovery efforts by one of the large SBs.
The category-wise analysis shows there has been a noticeable shift in the NPLs towards the doubtful and loss categories and, by end-June 2007, almost 70 percent of the NPLs have been categorized under loss category,
0
229
Rs i
n B
illio
n
0
50
100
150
200
250
PSCBs 86 40 38 42 41 41
LPBs 67 103 96 95 100 109
FBs 4 3 2 1 1 1
SBs 54 54 42 37 41 35
CBs (RHS) 157 146 136 138 143 152
All (RHS) 211 200 177 175 184 187
CY03 CY04 CY05 CY06 Mar-07 Jun-07
Figure:-4.1.1 NPLs of Banking System
0 25 50 75 100 125 150
OAEM
Sub-standard
Doubtful
Loss
Mar. 07June.07
Figure:-4.1.2 Category-wise Breakup of NPLs
Rs in Billion
20
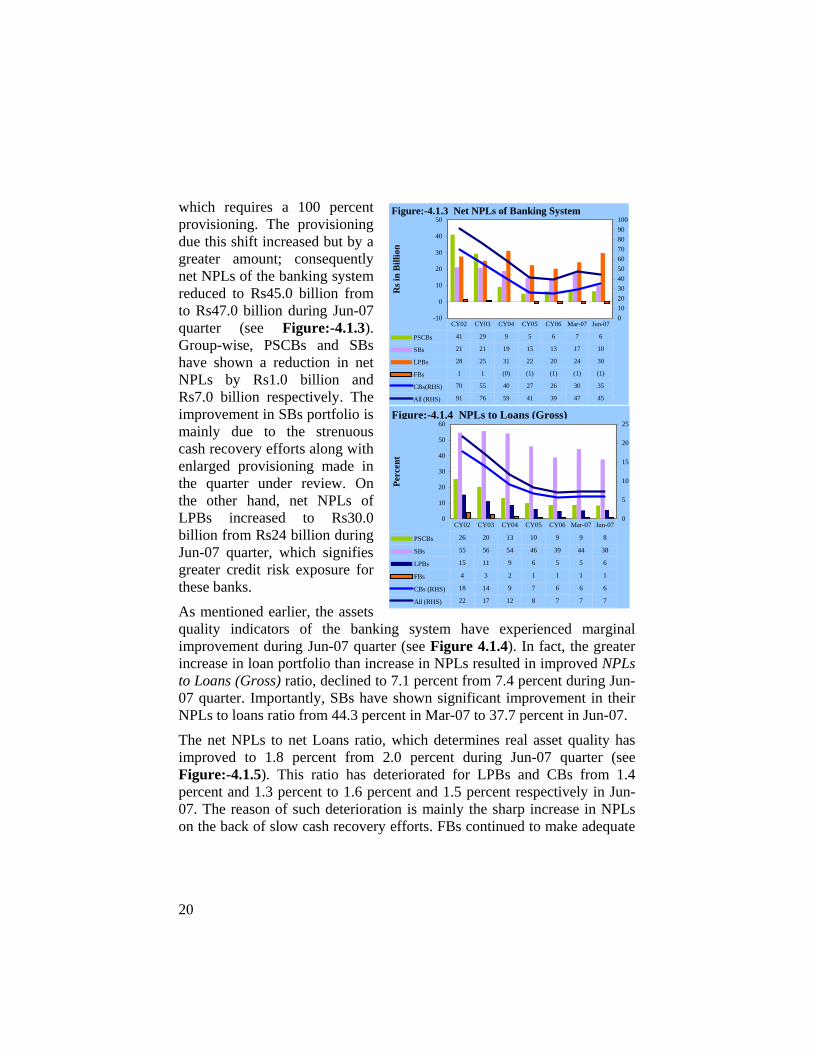
which requires a 100 percent provisioning. The provisioning due this shift increased but by a greater amount; consequently net NPLs of the banking system reduced to Rs45.0 billion from to Rs47.0 billion during Jun-07 quarter (see Figure:-4.1.3). Group-wise, PSCBs and SBs have shown a reduction in net NPLs by Rs1.0 billion and Rs7.0 billion respectively. The improvement in SBs portfolio is mainly due to the strenuous cash recovery efforts along with enlarged provisioning made in the quarter under review. On the other hand, net NPLs of LPBs increased to Rs30.0 billion from Rs24 billion during Jun-07 quarter, which signifies greater credit risk exposure for these banks.
As mentioned earlier, the assets quality indicators of the banking system have experienced marginal improvement during Jun-07 quarter (see Figure 4.1.4). In fact, the greater increase in loan portfolio than increase in NPLs resulted in improved NPLs to Loans (Gross) ratio, declined to 7.1 percent from 7.4 percent during Jun-07 quarter. Importantly, SBs have shown significant improvement in their NPLs to loans ratio from 44.3 percent in Mar-07 to 37.7 percent in Jun-07.
The net NPLs to net Loans ratio, which determines real asset quality has improved to 1.8 percent from 2.0 percent during Jun-07 quarter (see Figure:-4.1.5). This ratio has deteriorated for LPBs and CBs from 1.4 percent and 1.3 percent to 1.6 percent and 1.5 percent respectively in Jun-07. The reason of such deterioration is mainly the sharp increase in NPLs on the back of slow cash recovery efforts. FBs continued to make adequate
-10
0
10
20
30
40
50
Rs i
n B
illio
n
0102030405060708090100
PSCBs 41 29 9 5 6 7 6
SBs 21 21 19 15 13 17 10
LPBs 28 25 31 22 20 24 30
FBs 1 1 (0) (1) (1) (1) (1)
CBs(RHS) 70 55 40 27 26 30 35
All (RHS) 91 76 59 41 39 47 45
CY02 CY03 CY04 CY05 CY06 Mar-07 Jun-07
Figure:-4.1.3 Net NPLs of Banking System
0
10
20
30
40
50
60
Perc
ent
0
5
10
15
20
25
PSCBs 26 20 13 10 9 9 8
SBs 55 56 54 46 39 44 38
LPBs 15 11 9 6 5 5 6
FBs 4 3 2 1 1 1 1
CBs (RHS) 18 14 9 7 6 6 6
All (RHS) 22 17 12 8 7 7 7
CY02 CY03 CY04 CY05 CY06 Mar-07 Jun-07
Figure:-4.1.4 NPLs to Loans (Gross)

21
provisioning requirement and were quite successful in limiting their credit risk exposure.
The increase in provision by Rs5.0 billion during the quarter has out paced the increase in NPLs of Rs3.0 billion (see Figure:-4.1.6). As a result, the ratio of provision to NPLs improved to 76.0 percent from 74.5 percent in Jun-07. However, NPLs coverage ratio for LPBs and CBs has dropped down to 72.7 percent and 76.9 percent from 75.8 percent and 79.2 percent respectively in Mar-07.
Segment-wise domestic loan portfolio of the banking system was increased by Rs104.0 billion during the Jun-07 quarter. However, such an increase in loan portfolio was accompanied by an increase in NPLs of Rs3.0 billion. (see Table:-4.1.1). The detailed analysis of the NPLs shows that CBs and SBs depicted a mixed trend as an increase of Rs9.0 billion exhibited by CBs was cast down by a reduction of Rs6.0 billion in NPLs of SBs. Since corporate sector is sharing the major pie, 54.2 percent, of the loan portfolio, it is also sharing 53.2 percent in
Table: 4.1.1 Segmentwise Infection of Loans Portfolio
(Domestic Operations) (in %)Sector
Jun-07 Mar-07 Jun-07 Mar-07 Jun-07 Mar-07
Corporate 6.6 6.4 98.4 100.0 6.9 6.7 SMEs 7.7 7.1 85.3 86.8 9.7 9.2 Agriculture 7.8 8.1 29.6 37.2 19.3 23.7 Consumers 3.6 3.2 19.8 21.2 3.6 3.2
Credit Cards 6.6 3.7 - - 6.6 3.7 Auto Loans 2.4 2.6 14.0 16.7 2.4 2.6 Consumer Durables 14.8 2.7 25.4 25.7 15.7 3.2 Mortgage Loans 2.9 2.3 - - 2.9 2.3 Others 3.8 4.0 - - 3.8 4.0
Commodity Finance 0.8 1.0 - - 0.8 1.0 Staff Loans 0.8 0.8 0.1 0.1 0.8 0.8 Others 3.6 4.8 14.4 12.0 3.7 4.9 Total 5.8 5.6 37.7 44.3 7.0 7.2
CBs SBs All
0
50
100
150
200
250
Rs i
n B
illio
n
40
50
60
70
80
Provision 140 135 141 136 137 137 142
NPLs 232 211 200 177 175 184 187
Provision to NPLs(RHS)
61 64 70 77 78 74 76
CY02 CY03 CY04 CY05 CY06 Mar-07 Jun-07
Figure:-4.1.6 Provision Against NPLs
-1
9
19
29
39
Perc
ent
0
4
8
12
PSCBs 13 8 3 1 1.5 1.5 1.4
LPBs 7 5 3 2 1.1 1.4 1.6
FBs 1 1 (0) (1) (1.0) (0.9) (1.0)
SBs 29 33 26 23 18.7 25.0 14.4
CBs(RHS) 8 5 3 1 1.1 1.3 1.5
All (RHS) 10 7 4 2 1.6 2.0 1.8
CY02 CY03 CY04 CY05 CY06 Mar-07 Jun-07
Figure:-4.1.5 NPLs to Loans (net)
22
the NPLs of the banking system. The infection ratio of the corporate sector has slightly moved up to 6.9 percent from 6.7 percent. The agriculture sector, which attracted concerns in the last quarter, improved its infection ratio from 23.7 percent to 19.3 percent by its efficient cash recoveries. The Group-wise analysis reveals that SBs have managed to reduce the infection ratio to 19.3 percent from 23.7 percent during the quarter. SME sector experienced a decline of Rs4.0 billion in its loan portfolio and its infection ratio increased from 9.2 percent to 9.7 percent. The consumer finance continued its growth pace with the addition of another Rs20.0 billion in its loan portfolio during the quarter Jun-07. Such a growth in consumer finance was followed by marginal upward movement in infection ratio which has slightly moved up from 3.2 percent to 3.6 percent in Jun-07. The consumer finance products like credit cards and consumer durables exhibited a significant deterioration in their infection ratios. The credit cards having 12.5 percent share in consumer loans is contributing 23.2 percent in the total NPLs of the total consumer finance; as a result the infection ratio for credit card has moved up to 6.6 percent from 3.7 percent.
Keeping in view the overall increase in the loan portfolio of the banking system, the overall infection ratios have witnessed marginal improvement in Jun-07 quarter. However, increase in volume of NPLs of the banking system attracted attention, and it would affect significantly the profitability of the system if not checked in coming months.
23
4.2 Market Risk
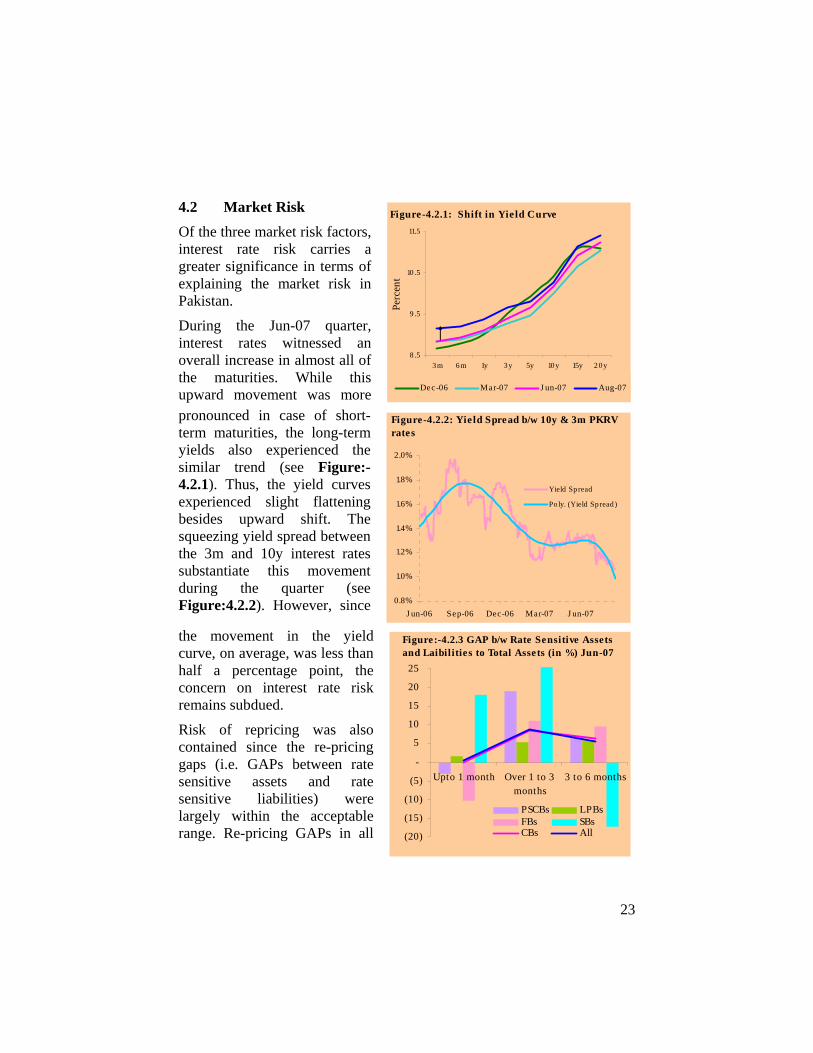
Of the three market risk factors, interest rate risk carries a greater significance in terms of explaining the market risk in Pakistan.
During the Jun-07 quarter, interest rates witnessed an overall increase in almost all of the maturities. While this upward movement was more pronounced in case of short-term maturities, the long-term yields also experienced the similar trend (see Figure:-4.2.1). Thus, the yield curves experienced slight flattening besides upward shift. The squeezing yield spread between the 3m and 10y interest rates substantiate this movement during the quarter (see Figure:4.2.2). However, since
the movement in the yield curve, on average, was less than half a percentage point, the concern on interest rate risk remains subdued.
Risk of repricing was also contained since the re-pricing gaps (i.e. GAPs between rate sensitive assets and rate sensitive liabilities) were largely within the acceptable range. Re-pricing GAPs in all
8 .5
9 .5
10 .5
11.5
3 m 6 m 1y 3 y 5y 10 y 15y 2 0 y
Perc
ent
Dec-06 Mar-07 J un-07 Aug-07
Figure-4.2.1: Shift in Yield Curve
0.8%
1.0%
1.2%
1.4%
1.6%
1.8%
2.0%
J un-06 Sep-06 Dec-06 Mar-07 J un-07
Yield Sp read
Po ly. (Yield Sp read )
Figure-4.2.2: Yie ld Spread b/w 10y & 3m PKRV rates
(20)
(15)
(10)
(5)
-
5
10
15
20
25
Upto 1 month Over 1 to 3months
3 to 6 months
PSCBs LPBsFBs SBsCBs All
Figure:-4.2.3 GAP b/w Rate Sensitive Assets and Laibilities to Total Assets (in %) Jun-07
24
the three time buckets, upto 3 months, 3-12 months and over 1 year buckets, were well below the +/- 10 percent of the total assets (see Figure:-4.2.3). Barring the SBs, almost all of the banking groups were maintaining the acceptable levels of GAP. PSCBs, however, were experiencing a significant positive GAP in one year bucket. This may warrant the exposure of these banks to the risk of revaluation. Surprisingly the banks are maintaining a negative repricing GAP even in the scenario when the interest rates are rising. This exposes them to the interest rate risk for that term. May be it is the attractive returns on their locked assets that they can afford to pay for their negative positions.
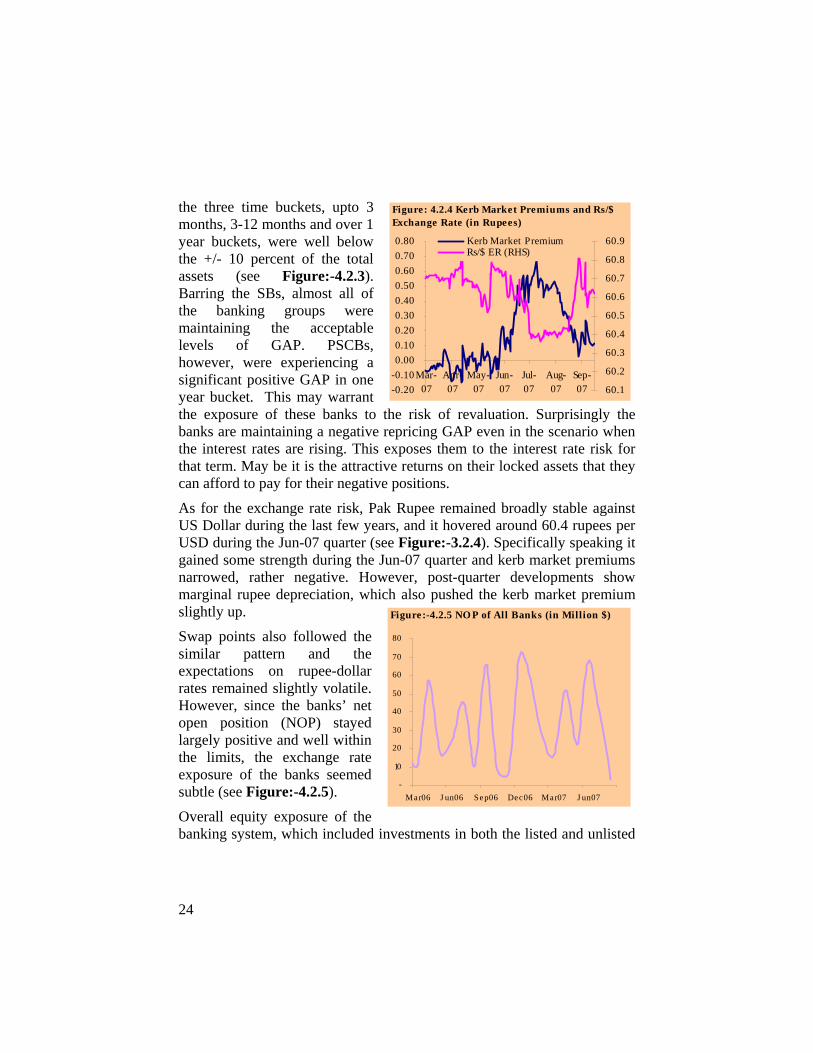
As for the exchange rate risk, Pak Rupee remained broadly stable against US Dollar during the last few years, and it hovered around 60.4 rupees per USD during the Jun-07 quarter (see Figure:-3.2.4). Specifically speaking it gained some strength during the Jun-07 quarter and kerb market premiums narrowed, rather negative. However, post-quarter developments show marginal rupee depreciation, which also pushed the kerb market premium slightly up.
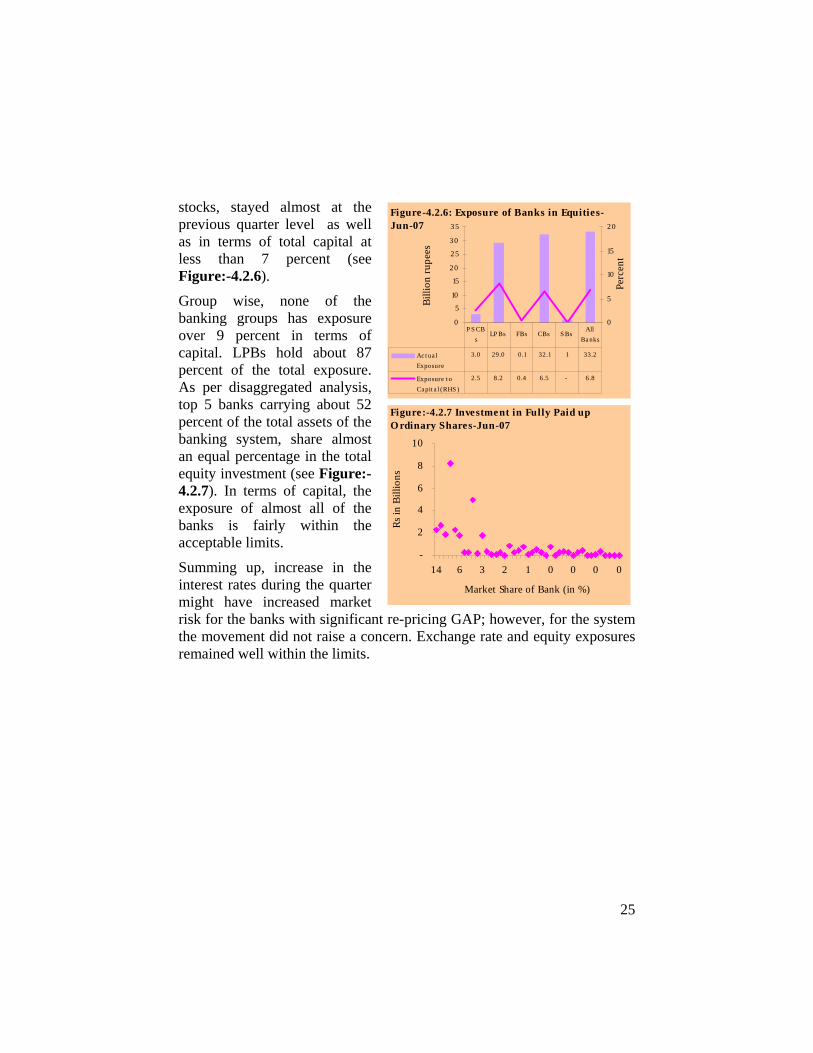
Swap points also followed the similar pattern and the expectations on rupee-dollar rates remained slightly volatile. However, since the banks’ net open position (NOP) stayed largely positive and well within the limits, the exchange rate exposure of the banks seemed subtle (see Figure:-4.2.5).
Overall equity exposure of the banking system, which included investments in both the listed and unlisted
-0.20-0.100.000.100.200.300.400.500.600.700.80
Mar-07
Apr-07
May-07
Jun-07
Jul-07
Aug-07
Sep-07 60.1
60.2
60.3
60.4
60.5
60.6
60.7
60.8
60.9Kerb Market PremiumRs/$ ER (RHS)
Figure: 4.2.4 Kerb Market Premiums and Rs/$ Exchange Rate (in Rupees)
-
10
20
30
40
50
60
70
80
Mar06 J un06 Sep06 Dec06 Mar07 J un07
Figure:-4.2.5 NO P of All Banks (in Million $)
25
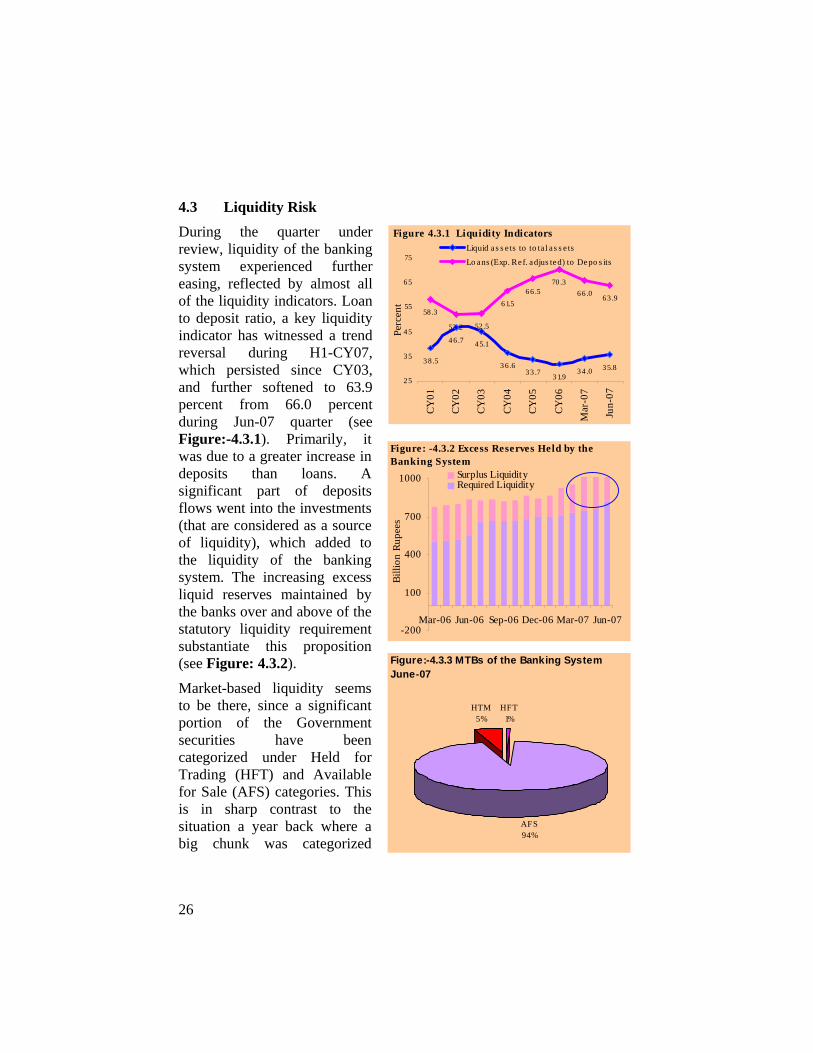
stocks, stayed almost at the previous quarter level as well as in terms of total capital at less than 7 percent (see Figure:-4.2.6).
Group wise, none of the banking groups has exposure over 9 percent in terms of capital. LPBs hold about 87 percent of the total exposure. As per disaggregated analysis, top 5 banks carrying about 52 percent of the total assets of the banking system, share almost an equal percentage in the total equity investment (see Figure:-4.2.7). In terms of capital, the exposure of almost all of the banks is fairly within the acceptable limits.
Summing up, increase in the interest rates during the quarter might have increased market risk for the banks with significant re-pricing GAP; however, for the system the movement did not raise a concern. Exchange rate and equity exposures remained well within the limits.
0
5
10
15
20
2 5
30
3 5
Billi
on ru
pees
0
5
10
15
2 0
Perc
ent
Ac t ua lExposure
3.0 29.0 0.1 32.1 1 33.2
Exposure t oCa pit a l (RHS )
2.5 8.2 0.4 6.5 - 6.8
P S CBs
LP Bs FBs CBs S BsAll
Ba nks
Figure-4.2.6: Exposure of Banks in Equities-Jun-07
-
2
4
6
8
10
14 6 3 2 1 0 0 0 0
Market Share of Bank (in %)
Rs in
Bill
ions
Figure:-4.2.7 Investment in Fully Paid up O rdinary Shares-Jun-07
26
4.3 Liquidity Risk
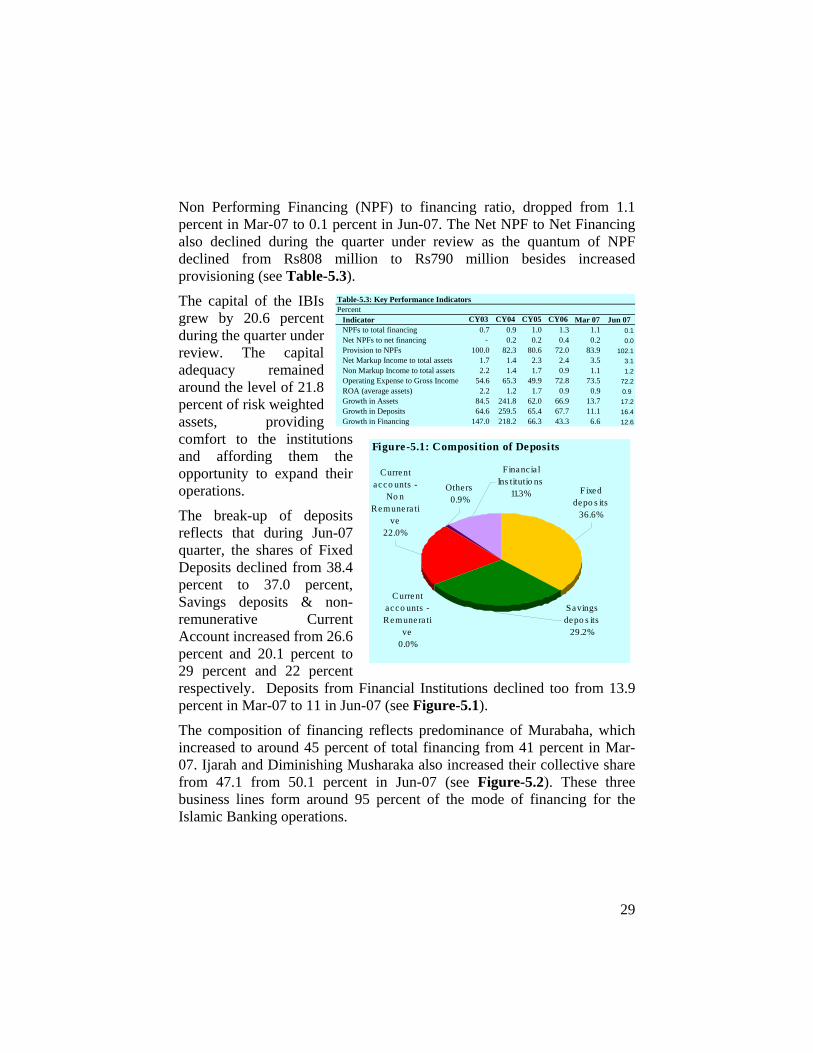
During the quarter under review, liquidity of the banking system experienced further easing, reflected by almost all of the liquidity indicators. Loan to deposit ratio, a key liquidity indicator has witnessed a trend reversal during H1-CY07, which persisted since CY03, and further softened to 63.9 percent from 66.0 percent during Jun-07 quarter (see Figure:-4.3.1). Primarily, it was due to a greater increase in deposits than loans. A significant part of deposits flows went into the investments (that are considered as a source of liquidity), which added to the liquidity of the banking system. The increasing excess liquid reserves maintained by the banks over and above of the statutory liquidity requirement substantiate this proposition (see Figure: 4.3.2).
Market-based liquidity seems to be there, since a significant portion of the Government securities have been categorized under Held for Trading (HFT) and Available for Sale (AFS) categories. This is in sharp contrast to the situation a year back where a big chunk was categorized
3 8.5
4 6 .7 45.1
3 6 .63 3 .7 3 1.9
3 4 .0 35.8
58 .3
52 .2 52 .5
6 1.56 6 .5
70 .36 6 .0 63 .9
2 5
3 5
4 5
55
6 5
75
CY01
CY02
CY03
CY04
CY05
CY06
Mar
-07
Jun-
07
Perc
ent
Liquid as s e ts to to ta l a s s e ts
Lo ans (Exp. Ref. adjus ted) to Depo s its
Figure 4.3.1 Liquidity Indicators
HFT1%
AFS94%
HTM5%
Figure:-4.3.3 MTBs of the Banking System June-07
-200
100
400
700
1000
Mar-06 Jun-06 Sep-06 Dec-06 Mar-07 Jun-07
Billi
on R
upee
s
Surplus LiquidityRequired Liquidity
Figure: -4.3.2 Excess Reserves Held by the Banking System

27
under Held to Maturity (HTM). Around 95 percent of market treasury bills (MTBs) have been placed under tradable categories (see Figure:-4.3.3).
In order to reinforce its tight monetary stance, the SBP continued to focus on the short-term rates by resorting to frequent open market operations (OMOs) to keep the inter-bank liquidity in check. This has kept the inter-bank rates close to the discount rate. Moreover, significant discounting has also been observed during the period.
However the liquidity risk, which may arise due to the maturity mismatches, i.e. GAPs between the maturity of assets and liabilities, remained a source of concern. Although the overall GAP between the maturities of assets and liabilities were well within the acceptable level of +/-10 percent, banking groups show significant exposures (see Figure:4.3.4). In 3m maturity bucket, PSCBs followed by FBs witnessed significant negative GAP (stayed at 26 percent and 19 percent respectively in terms of total assets). This may be attributed to the very nature of the major chunk of deposits, i.e. current & checking/saving deposits, which are mostly categorized under short-term buckets. Although, the continuous flow accompanied with significant share of current & checking/saving accounts may lead to significant negative gap in near-term bucket, an absolute decline in such deposits may raise liquidity concern for these banks.
Summing up, the liquidity of the banking system witnessed further ease in June-07 quarter, which is also reflected in almost all of the liquidity indicators. Maturity mismatches of a few banks however, may raise a liquidity concern for them.
(35)
(25)
(15)
(5)
5
15
25
Upto 3month
3 months to1 year
Over 1 year
PSCBs LPBsFBs SBsCBs All
Figure:-4.3.4 Maturity GAP (Assets - Liabilities) to Total Assets (in %) Jun-07

28
Table-5.1: Islamic Banking PlayersCY02 CY03 CY04 CY05 Mar07 June 07
No. of Islamic Banks (IBs) 1 1 2 2 5 6
No. of Branches 6 10 23 37 99 109No. of conventional banks operating Islamic Banking Branches
- 3 7 9 12 12
No. of Islamic Banking Branches (IBBs)
- 7 21 33 57 58
Table-5.2: Sources and Uses of Funds (Billion rupees)CY03 CY04 CY05 CY06 Mar07 Jun 07
SOURCESDeposits 8.4 30.2 49.9 83.7 93.1 108.3Borrowings 1.9 6.6 9.0 10.8 12.2 14.3Capital & other funds 2.0 5.1 7.8 16.3 20.9 25.2Other liabilities 0.6 2.3 4.7 8.4 9.4 11.1
12.9 44.1 71.5 119.3 135.6 159.0USES:Financing 8.7 27.5 45.8 65.6 70.0 78.8Investments 1.2 2.0 1.9 7.3 8.4 11.5Cash, bank balance, placements 2.0 11.9 19.3 31.4 46.1 53.2Other assets 1.0 2.7 4.5 15.0 11.2 15.5
12.9 44.1 71.5 119.3 135.6 159.0
5. Performance of Islamic Banking
Jun-07 quarter witnesses an entry of another Islamic Bank, with that the number of Islamic Banks has risen to 6 whereas the number of branches operated by Islamic Banks has increased from 99 in Mar-07 to 109 in Jun-07. In addition, one new branch was added in the branches operated by conventional banks (IBBs) during the quarter under review (see Table-5.1).
The balance sheet of IBIs grew by 17.25 percent over the quarter and stood at Rs. 159 billion. (see Table-5.2), which reflects the trend similar to the trend visible in conventional banking. However, the growth IBIs balance sheet is commendable when compared with 11.2 percent growth in the balance sheet of the overall banking system. Islamic Banking system now forms around 3 percent of the banking system.
The review of the balance sheet reveals that the deposits remained predominant source of financing, which formed around 68 percent of total sources of funds. Together with borrowings, they formed around 77 percent, while 15.8 percent was contributed by the shareholders in the form of capital and other funds. On the asset side, financing remained the largest asset with 49.5 percent followed by cash, bank balances and placement 33.4 percent and investments 7.2 percent. Improvement in financing to deposits ratio was witnessed as it declined to 72.8 percent in Jun-07 from 75.2 percent in Mar-07. The improvement in asset quality was also reflected in the declining
29
Others 0.9%
Current acco unts -
No n Remunera ti
ve22.0%
Current acco unts -Remunera ti
ve0.0%
Savings depo s its
29.2%
Fixed depo s its
36.6%
Financ ia l Ins titutio ns
11.3%
Figure-5.1: Composition of Deposits
Percent Indicator CY03 CY04 CY05 CY06 Mar 07 Jun 07NPFs to total financing 0.7 0.9 1.0 1.3 1.1 0.1Net NPFs to net financing - 0.2 0.2 0.4 0.2 0.0Provision to NPFs 100.0 82.3 80.6 72.0 83.9 102.1Net Markup Income to total assets 1.7 1.4 2.3 2.4 3.5 3.1Non Markup Income to total assets 2.2 1.4 1.7 0.9 1.1 1.2Operating Expense to Gross Income 54.6 65.3 49.9 72.8 73.5 72.2ROA (average assets) 2.2 1.2 1.7 0.9 0.9 0.9 Growth in Assets 84.5 241.8 62.0 66.9 13.7 17.2Growth in Deposits 64.6 259.5 65.4 67.7 11.1 16.4Growth in Financing 147.0 218.2 66.3 43.3 6.6 12.6
Table-5.3: Key Performance Indicators
Non Performing Financing (NPF) to financing ratio, dropped from 1.1 percent in Mar-07 to 0.1 percent in Jun-07. The Net NPF to Net Financing also declined during the quarter under review as the quantum of NPF declined from Rs808 million to Rs790 million besides increased provisioning (see Table-5.3).
The capital of the IBIs grew by 20.6 percent during the quarter under review. The capital adequacy remained around the level of 21.8 percent of risk weighted assets, providing comfort to the institutions and affording them the opportunity to expand their operations.
The break-up of deposits reflects that during Jun-07 quarter, the shares of Fixed Deposits declined from 38.4 percent to 37.0 percent, Savings deposits & non-remunerative Current Account increased from 26.6 percent and 20.1 percent to 29 percent and 22 percent respectively. Deposits from Financial Institutions declined too from 13.9 percent in Mar-07 to 11 in Jun-07 (see Figure-5.1).
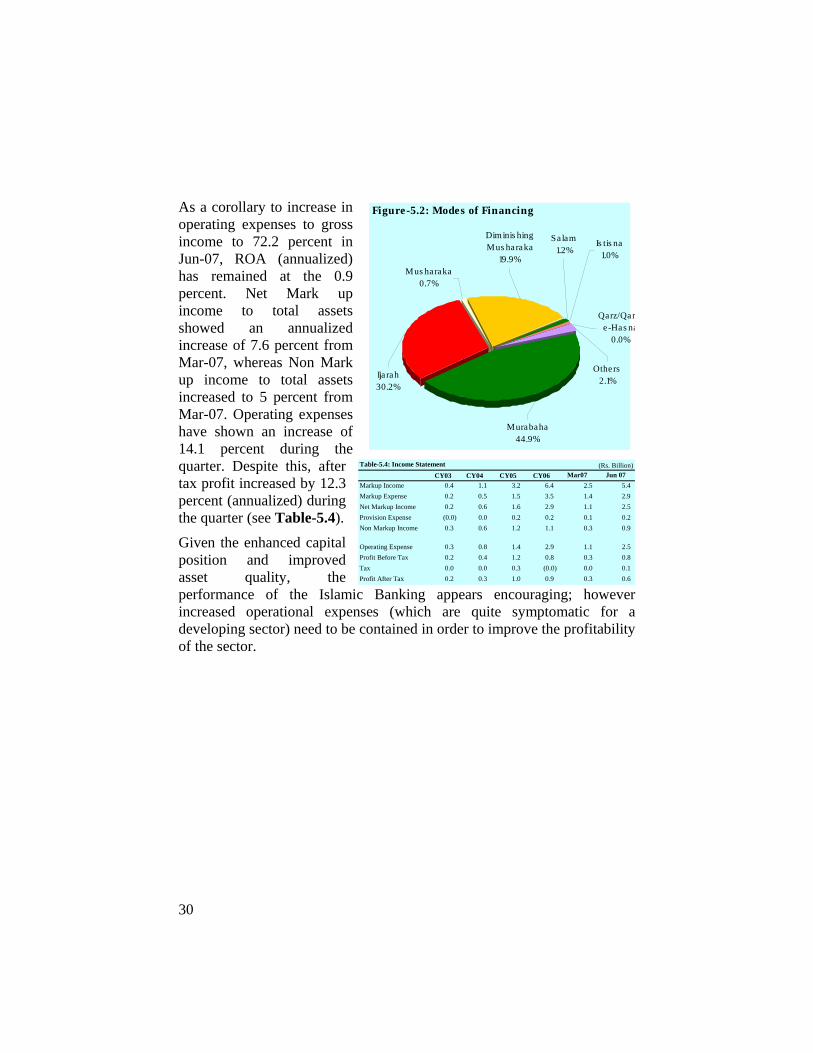
The composition of financing reflects predominance of Murabaha, which increased to around 45 percent of total financing from 41 percent in Mar-07. Ijarah and Diminishing Musharaka also increased their collective share from 47.1 from 50.1 percent in Jun-07 (see Figure-5.2). These three business lines form around 95 percent of the mode of financing for the Islamic Banking operations.
30
(Rs. Billion)CY03 CY04 CY05 CY06 Mar07 Jun 07
Markup Income 0.4 1.1 3.2 6.4 2.5 5.4 Markup Expense 0.2 0.5 1.5 3.5 1.4 2.9 Net Markup Income 0.2 0.6 1.6 2.9 1.1 2.5 Provision Expense (0.0) 0.0 0.2 0.2 0.1 0.2 Non Markup Income 0.3 0.6 1.2 1.1 0.3 0.9
Operating Expense 0.3 0.8 1.4 2.9 1.1 2.5 Profit Before Tax 0.2 0.4 1.2 0.8 0.3 0.8 Tax 0.0 0.0 0.3 (0.0) 0.0 0.1 Profit After Tax 0.2 0.3 1.0 0.9 0.3 0.6
Table-5.4: Income Statement
Others2.1%
Murabaha44.9%
Ija rah30.2%
Qarz/Qare-Has na
0.0%
Diminis hing Mus haraka
19.9%Mus haraka
0.7%
Salam1.2%
Is tis na1.0%
Figure-5.2: Modes of FinancingAs a corollary to increase in operating expenses to gross income to 72.2 percent in Jun-07, ROA (annualized) has remained at the 0.9 percent. Net Mark up income to total assets showed an annualized increase of 7.6 percent from Mar-07, whereas Non Mark up income to total assets increased to 5 percent from Mar-07. Operating expenses have shown an increase of 14.1 percent during the quarter. Despite this, after tax profit increased by 12.3 percent (annualized) during the quarter (see Table-5.4).
Given the enhanced capital position and improved asset quality, the performance of the Islamic Banking appears encouraging; however increased operational expenses (which are quite symptomatic for a developing sector) need to be contained in order to improve the profitability of the sector.

31
6 Resilience of the Banking System towards Stress Tests
Resilience of the banking system of Pakistan has been assessed using the top-down approach to stress testing. This exercise assesses the impact of various stress scenarios on the banking system using simple sensitivity analysis. Reference scenarios have been devised and the impact of the shocks has been assessed for both individual banks as well as all the three commercial banking groups viz. Public Sector Commercial Banks (PSCBs), Local Private Banks (LPBs) and Foreign Banks (FBs). Shocks scenarios under all the three risk factors i.e. credit, market and liquidity risks have been devised using both the historical and hypothetical moves in these risk factors (see Box 6.1).
BOX - 6.1Reference Scenarios for Stress TestsFor the Year ended on Jun 30, 2007
Credit ShocksScenario C-1 assumes a 10 percent increase in NPLs (with a provisioning rate of 100 percent).Scenario C-2 assumes a downward shift of NPLs from Substandard to Doubtful and from Doubtful toLoss category.Scenario C-3 assumes a cumulative impact of the two shocks under Scenarios 1and 2.Scenario C-4 assumes an increase in NPLs upto 10%age points rise in NPLs to Loans ratio ofconsumer finance (with 100% provisioning against increased NPLs)
Market Risk: Interest Rate ShocksScenario IR-1 assumes an increase in interest rates by 200 basis points.Scenario IR-2 assumes a shift and steepening in the yield curve by increasing interest rates of all thethree maturities (by 50, 100, and 150 basis points)Scenario IR-3 assumes a shift coupled with flattening of the yield curve by increasing 150,120 and 100basis points in the three maturities respectively (almost same as was increased from Aug-03 to Dec-03).Market Risk: Exchange Rate ShocksScenario ER-1 assumes a depreciation of ER by 13 percent (closer to the highest change in the monthlyaverage PRS/US$ exchange rate (12.83) over the period since 1994, in September 2000).Scenario ER-2 is based on the hypothetical assumption of appreciation of rupee by 10 percent.Market Risk: Equity Price Risk ShocksScenario E-1 assumes the impact of a 20 percent decline in the price of stock holding.Scenario E-2 assumes the impact of a 40 percent decline in the price of stock holdings.Liquidity ShocksScenario L-1 assumes a 5 percent decline in the liquid liabilities and its impact on liquidity coverageratio calculated after excluding Govt. securities under Held to Maturity category from liquid assets.Scenario L-2 assumes a 10 percent decline in the liquid liabilities and its impact on liquidity coverageratio calculated after excluding Govt. securities under Held to Maturity category from liquid assets.

32
In case of credit and market shocks, the impact has been calibrated on capital, while as for the liquidity risk; the impact is measured in terms of liquidity coverage ratio3. A brief description of the impact of these shocks has been discussed below, whereas the summarized results have been given in Box 6.2.
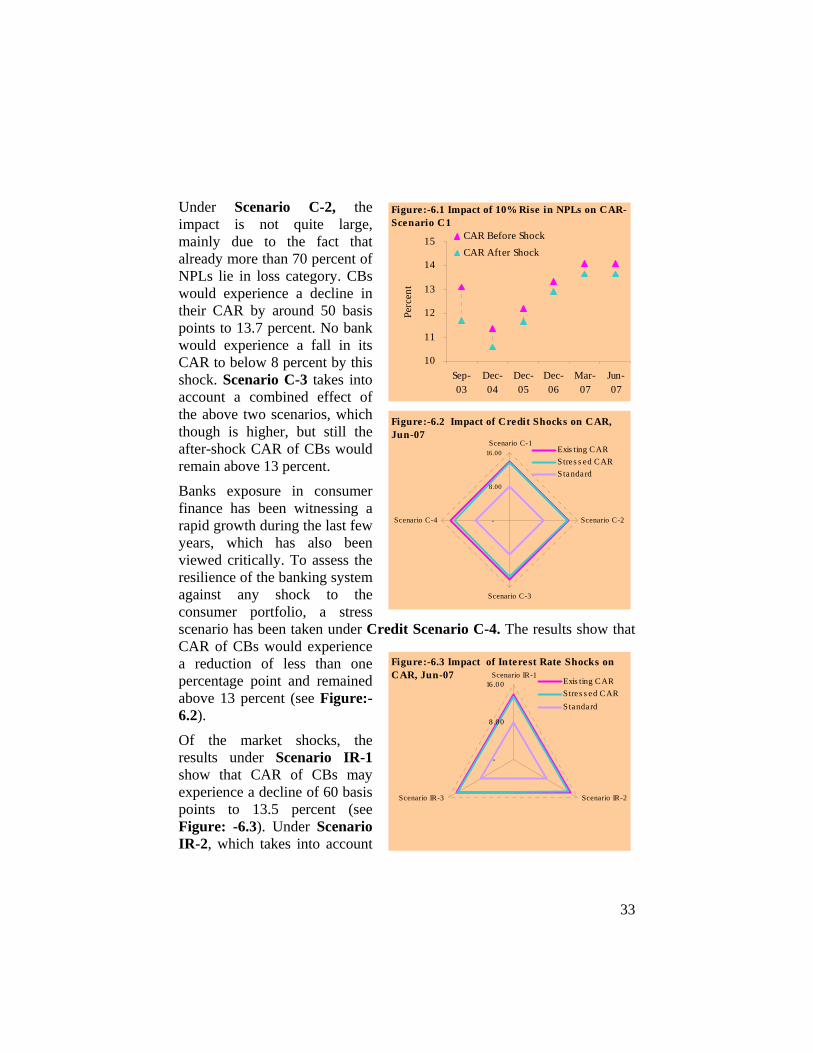
Consistently strengthened capital-base has a greater cushion available to absorb the unusual shocks. As for the Credit Scenario C-1 a shock of 10 percent increase in NPLs, generally all the banks are fairly resilient with this increase in their NPLs requiring 100 percent provisioning against the increased NPLs and healthy capital base can sustain this level of shock comfortably. When the impact of this shock is calibrated on capital of the banks, the commercial banks, as a group, would likely to lose only half a percentage point and adjusted CAR would remain above 13 percent level (see Figure:6.1). Individually, none of the banks would experience a fall in their CAR to below 8 percent by this shock.
3 Ratio of liquid assets to liquid liabilities
Shocks%age Point Change in
CAR
Adjusted CAR- After Shock
%age Point Change in
CAR
Adjusted CAR- After Shock
Credit ShocksScenario C-1 Deterioration in the qualityof loan -0.4 13.7 -0.4 13.7Scenario C-2 Shift in categories of classified loans -0.4 13.7 -0.3 13.8Scenario C-3 Cumulative impact of all shocks in 1and 2 -0.8 13.3 -0.8 13.3Scenario C-4 Deterioration in NPLs ratio of consumer finance -1.0 13.1 -1.0 13.1Market Shocks; Interest Rate ShocksScenario IR-1 Shift in the yield curve -0.6 13.5 -0.4 13.7Scenario IR-2 Shift and steepening of the yield curve -0.4 13.7 -0.3 13.8Scenario IR-3 Shift & flattenining of the yield curve -0.3 13.8 -0.2 13.9Market Shocks; Exchange Rate ShocksScenario ER-1
Depreciation of Rs/US$ exchnage rate (the historical high) 1.3 15.4 1.3 15.4Scenario ER-2 Appreciation of Rs/US$ exchnage rate (hypothetical) -1.0 13.1 -1.0 13.1Market Shocks; Equity Price ShocksScenario E-1 Fall in the KSE index (historical high) 0.0 14.1 -0.1 14.0Scenario E-2 Fall in the KSE index (hypothetical scenario) -0.2 13.9 -0.3 13.8
Actual Stressed Actual StressedScenario L-1 5 Percent Fall in the Liquid Liabilities 40.0 36.9 38.0 34.7Scenario L-2 10 Percent Fall in the Liquid Liabilities 40.0 33.3 38.0 31.1
Note: The results have not been adjusted for deferred tax benefits accruing on these losses.
BOX - 6.2
“Stress Tests” on Commercial Banks
Liquidity ShocksLiquidity Coverage Ratio
June 30, 2007 March 31, 2007
33
Under Scenario C-2, the impact is not quite large, mainly due to the fact that already more than 70 percent of NPLs lie in loss category. CBs would experience a decline in their CAR by around 50 basis points to 13.7 percent. No bank would experience a fall in its CAR to below 8 percent by this shock. Scenario C-3 takes into account a combined effect of the above two scenarios, which though is higher, but still the after-shock CAR of CBs would remain above 13 percent.
Banks exposure in consumer finance has been witnessing a rapid growth during the last few years, which has also been viewed critically. To assess the resilience of the banking system against any shock to the consumer portfolio, a stress scenario has been taken under Credit Scenario C-4. The results show that CAR of CBs would experience a reduction of less than one percentage point and remained above 13 percent (see Figure:-6.2).
Of the market shocks, the results under Scenario IR-1 show that CAR of CBs may experience a decline of 60 basis points to 13.5 percent (see Figure: -6.3). Under Scenario IR-2, which takes into account
10
11
12
13
14
15
Sep-03
Dec-04
Dec-05
Dec-06
Mar-07
Jun-07
Perc
ent
CAR Before ShockCAR After Shock
Figure:-6.1 Impact of 10% Rise in NPLs on CAR-Scenario C1
-
8 .0 0
16 .0 0Scenario IR-1
Scenario IR-2Scenario IR-3
Exis ting CARStres s ed CARStandard
Figure:-6.3 Impact of Interest Rate Shocks on CAR, Jun-07
-
8.00
16.00Scenario C-1
Scenario C-2
Scenario C-3
Scenario C-4
Exis ting CARStres s ed CARStandard
Figure:-6.2 Impact of Credit Shocks on CAR, Jun-07

34
an increase of 50bps, 100bps and 150bps along all the three maturity buckets namely upto three months, three months to one year and over one year, the impact would be comparatively on lower side. CAR of CBs may fall to 13.7 percent. Under Scenario IR-3, which assumes a shift and flattening of the yield curve, the impact further reduced and post shock CAR stayed at 13.8 percent.
Of the exchange rate shocks, under Scenario ER-1, the banks would gain since they have foreign currency denominated assets are in excess of liabilities (see Figure:-6.4). However, a rupee appreciation shock may reduce the CAR of CBs to 13.1 percent (Scenario ER-2).
Equity price shocks assume a 20% fall in the direct equity investment, under Scenario E-1. The result shows that since the banks’ investment in equities is not that significant, and they have also sufficient cushion available in the form of revaluation against such equities, this shock would not impact the bank’s profits. Under this shock, CAR of CBs would remain unchanged (see Figure:-6.5). However, under Scenario E-2, a 40 percent fall in the value of equity investments can affect the profits and, would decrease the CAR of CBs by 20 basis points. Bank-wise, CAR of none of the commercial banks would fall below to 8 percent.
Liquidity has been gauged in terms of liquidity coverage ratio. When compared with the previous quarter the liquidity indicators show some improvement. Resultantly, the liquidity shock envisaged in this exercise
8
10
12
14
16
Scenario ER-1 Scenario ER-2
Perc
ent
Exis ting CAR
Stres s ed CAR
Figure:-6.4 Impact of Exchange Rate Shocks on CAR, Jun-07
13.0
13.5
14.0
14.5
Scenario E-1 Scenario E-2
Perc
ent
Existing CARStressed CAR
Figure:-6.5 Impact of Equity Price Shocks on CAR- Jun-07

35
also show improved results. The analysis shows that under Scenario L-1, the liquidity coverage ratio (calculated after excluding HTM securities from liquid assets) of CBs declined from 40.1 percent to 36.9 percent (see Figure:-6.6). Whereas, a 10 percent decline in the liquid liabilities, a shock assumed under Scenario L-2, may decrease this ratio to 33.5 percent.
Overall, the strengthened capital base and better liquidity has improved the resilience of the banking system during Jun-07 quarter.
25
30
35
40
45
Liquidity Coverage,Scenario L-1
Liquidity Coverage,Scenario L-2
Perc
ent
ExistingStressed
Figure:-6.6 Liquidity Coverage Ratio Calculated After Excluding HTM Portfolio-Jun-07

Financial Soundness Indicators Annex-I
36
2003 2004 2005 2006 Mar-07 Jun-07
Public Sector Commercial Banks 11.0 13.4 14.5 15.2 16.3 16.2 Local Private Banks 9.0 10.1 10.6 12.7 13.5 13.2 Foreign Banks 23.0 17.4 16.4 15.0 14.0 14.0
Commercial Banks 11.1 11.4 11.9 13.3 14.1 13.8 Specialized Banks (28.2) (9.0) (7.7) (8.3) (9.6) (7.3)
All Banks 8.5 10.5 11.3 12.7 13.4 13.3
Public Sector Commercial Banks 8.2 8.6 8.8 11.1 12.1 11.9 Local Private Banks 7.0 7.5 8.3 10.4 11.2 10.9 Foreign Banks 23.0 17.1 16.1 14.3 13.3 13.3
Commercial Banks 9.1 8.6 9.1 10.8 11.5 11.2 Specialized Banks (28.7) (15.0) (13.6) (13.3) (14.8) (12.7)
All Banks 6.5 7.6 8.3 10.0 10.7 10.6
Public Sector Commercial Banks 6.1 8.7 12.6 12.2 12.5 12.4 Local Private Banks 5.3 6.5 7.0 9.2 9.6 9.8 Foreign Banks 9.9 8.9 9.5 10.1 9.4 9.6
Commercial Banks 6.1 7.2 8.4 9.9 10.2 10.3 Specialized Banks (10.0) (9.4) (8.1) (8.0) (7.7) (6.2)
All Banks 5.5 6.7 7.9 9.4 9.7 9.9
ASSET QUALITY
Public Sector Commercial Banks 20.4 13.3 10.0 9.0 9.0 8.3 Local Private Banks 11.3 9.0 6.4 5.2 5.5 5.7 Foreign Banks 3.1 1.6 1.2 1.0 1.1 1.1
Commercial Banks 13.7 9.0 6.7 5.7 5.9 6.0 Specialized Banks 55.6 54.1 46.0 39.1 44.3 37.9
All Banks 17.0 11.6 8.3 6.9 7.4 7.1 -
Public Sector Commercial Banks 65.8 77.0 86.8 84.5 84.3 84.5 Local Private Banks 62.7 69.9 76.4 78.7 76.2 72.7 Foreign Banks 78.7 101.9 145.9 191.7 184.1 188.9
Commercial Banks 64.8 72.4 80.4 81.5 79.6 76.9 Specialized Banks 61.5 64.9 64.8 64.1 58.0 62.9
All Banks 63.9 70.4 76.7 77.8 74.7 74.3
Public Sector Commercial Banks 8.1 3.4 1.5 1.5 1.5 1.4 Local Private Banks 4.5 2.9 1.6 1.1 1.4 1.6 Foreign Banks 0.7 (0.0) (0.6) (1.0) (0.9) (1.0)
Commercial Banks 5.3 2.7 1.4 1.1 1.3 1.4 Specialized Banks 32.5 29.3 23.1 18.7 25.0 18.5
All Banks 6.9 3.8 2.1 1.6 2.0 1.9
Public Sector Commercial Banks 50.0 16.2 5.5 6.4 6.0 5.4 Local Private Banks 39.1 24.3 13.0 7.1 7.7 9.6 Foreign Banks 3.2 (0.2) (3.0) (5.1) (4.7) (5.0) Commercial Banks 36.9 19.0 9.0 6.2 6.6 7.8 Specialized Banks - - - - - - All Banks 54.4 29.2 14.3 9.7 10.7 10.7
EARNINGS
Public Sector Commercial Banks 1.8 2.4 3.3 4.0 3.7 3.8 Local Private Banks 2.2 1.7 2.7 3.1 3.1 3.0 Foreign Banks 2.6 2.5 3.6 3.2 3.5 2.3
Commercial Banks 2.1 2.0 2.9 3.2 3.2 3.1 Specialized Banks (3.3) (0.4) (1.0) (1.3) (4.6) 0.7
All Banks 1.8 1.9 2.8 3.1 3.0 3.0
Public Sector Commercial Banks 1.0 1.3 2.2 2.7 2.4 2.5 Local Private Banks 1.4 1.2 1.8 2.1 2.1 2.0 Foreign Banks 1.5 2.0 2.5 2.1 2.1 1.3
Commercial Banks 1.2 1.3 2.0 2.2 2.2 2.1 Specialized Banks (3.7) (0.8) (1.2) (1.8) (4.7) 0.6
All Banks 1.0 1.2 1.9 2.1 2.0 2.0
Net NPLs to Net Loans
Net NPLs to Capital
Return on Assets (Before Tax)
Return on Assets (After Tax)
Tier 1 Capital to RWA
Capital to Total Assets
NPLs to Total Loans
Provision to NPLs
Indicators
CAPITAL ADEQUACYRisk Weighted CAR

Financial Soundness Indicators Annex-I
37
2003 2004 2005 2006 Mar-07 Jun-07
Public Sector Commercial Banks 29.9 30.8 30.7 32.4 29.9 30.4 Local Private Banks 41.5 28.8 40.1 36.2 32.8 31.1 Foreign Banks 25.0 26.7 38.9 30.0 35.9 23.3
Commercial Banks 33.7 29.0 37.2 34.7 32.2 30.5 Specialized Banks - - - - - -
All Banks 35.4 30.5 38.2 35.2 31.5 31.0
Public Sector Commercial Banks 17.3 17.2 20.9 21.7 19.8 20.3 Local Private Banks 25.8 20.2 27.2 25.0 22.0 20.7 Foreign Banks 14.8 21.5 27.1 20.4 22.0 13.2
Commercial Banks 20.3 19.6 25.4 23.7 21.5 20.2 Specialized Banks - - - - - -
All Banks 20.0 20.3 25.8 23.8 20.6 20.6 -
Public Sector Commercial Banks 64.1 63.7 71.3 69.5 80.7 75.9 Local Private Banks 55.9 62.0 73.0 73.5 74.7 72.8 Foreign Banks 55.3 57.7 61.5 65.8 57.5 61.2
Commercial Banks 58.9 61.9 71.3 72.1 74.5 72.6 Specialized Banks 62.2 81.9 87.7 40.1 64.1 52.2
All Banks 59.2 62.8 72.0 70.9 74.0 71.7
Public Sector Commercial Banks 43.9 39.5 34.3 31.8 35.5 33.1 Local Private Banks 53.2 56.2 43.1 40.7 44.0 43.4 Foreign Banks 48.2 49.0 42.2 49.8 43.3 52.9
Commercial Banks 49.0 51.7 41.2 39.4 42.4 42.1 Specialized Banks 67.5 57.8 47.8 62.6 48.0 49.2
All Banks 50.5 52.0 41.5 40.3 42.7 42.4 LIQUIDITY
Public Sector Commercial Banks 49.1 43.9 35.6 33.9 35.4 35.8 Local Private Banks 42.9 34.3 32.4 31.1 33.3 35.6 Foreign Banks 49.2 39.8 41.8 41.0 43.6 42.0
Commercial Banks 46.1 37.0 33.9 32.2 34.3 36.0 Specialized Banks 22.9 25.3 25.8 23.0 22.5 26.4
All Banks 45.1 36.6 33.7 31.9 34.0 35.8
Public Sector Commercial Banks 59.0 52.6 44.7 42.6 43.9 45.7 Local Private Banks 54.5 42.3 40.3 40.6 43.1 46.8 Foreign Banks 68.9 53.4 57.9 61.1 64.3 63.1
Commercial Banks 57.8 45.7 42.7 42.0 44.4 47.4 Specialized Banks 135.0 154.1 183.2 205.4 227.7 238.5
All Banks 58.5 46.5 43.5 42.7 45.0 48.1
Public Sector Commercial Banks 45.7 49.7 59.8 64.6 61.2 61.5 Local Private Banks 58.2 67.3 70.8 74.5 70.7 67.0 Foreign Banks 63.8 70.1 68.7 80.1 69.1 73.6
Commercial Banks 53.6 63.6 68.4 72.7 68.6 66.1 Specialized Banks 379.1 370.5 400.7 528.4 594.5 525.4
All Banks 56.4 65.8 70.2 74.6 70.4 67.8 Note: The indicators for March, June 2007 are based on Un-audited returns
Cost / Income Ratio
Liquid Assets/Total Assets
Liquid Assets/Total Deposits
Advances/Deposits
Indicators
ROE (Avg. Equity & Surplus) (Before Tax)
ROE (Avg. Equity & Surplus) (After Tax)
NII/Gross Income
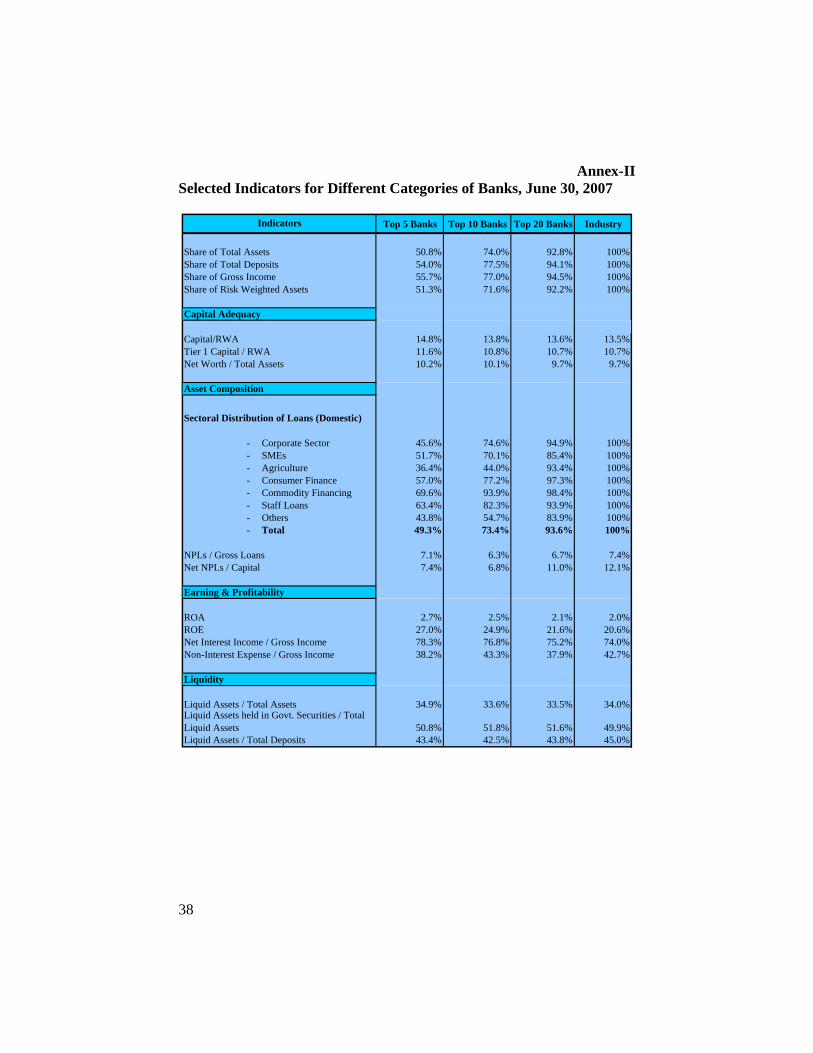
Annex-II Selected Indicators for Different Categories of Banks, June 30, 2007
38
Top 5 Banks Top 10 Banks Top 20 Banks Industry
50.8% 74.0% 92.8% 100%Share of Total Deposits 54.0% 77.5% 94.1% 100%
55.7% 77.0% 94.5% 100%51.3% 71.6% 92.2% 100%
14.8% 13.8% 13.6% 13.5%11.6% 10.8% 10.7% 10.7%10.2% 10.1% 9.7% 9.7%
Sectoral Distribution of Loans (Domestic)
- Corporate Sector 45.6% 74.6% 94.9% 100%- SMEs 51.7% 70.1% 85.4% 100%- Agriculture 36.4% 44.0% 93.4% 100%- Consumer Finance 57.0% 77.2% 97.3% 100%- Commodity Financing 69.6% 93.9% 98.4% 100%- Staff Loans 63.4% 82.3% 93.9% 100%- Others 43.8% 54.7% 83.9% 100%- Total 49.3% 73.4% 93.6% 100%
7.1% 6.3% 6.7% 7.4%7.4% 6.8% 11.0% 12.1%
2.7% 2.5% 2.1% 2.0%27.0% 24.9% 21.6% 20.6%78.3% 76.8% 75.2% 74.0%38.2% 43.3% 37.9% 42.7%
34.9% 33.6% 33.5% 34.0%
50.8% 51.8% 51.6% 49.9%43.4% 42.5% 43.8% 45.0%
Liquid Assets / Total AssetsLiquid Assets held in Govt. Securities / Total Liquid AssetsLiquid Assets / Total Deposits
Non-Interest Expense / Gross Income
Liquidity
ROAROENet Interest Income / Gross Income
Net NPLs / Capital
Earning & Profitability
Asset Composition
NPLs / Gross Loans
Capital/RWATier 1 Capital / RWANet Worth / Total Assets
Share of Total Assets
Share of Gross IncomeShare of Risk Weighted Assets
Capital Adequacy
Indicators

Annex-III Bank-wise Major Statistics, Jun 30, 2007
39
S. No. Name of Bank Assets Deposits Equity 1 Bank of Khyber 36,469 23,959 6,188 2 Bank of Punjab 218,107 171,968 20,204 3 First Women Bank Limited 8,423 7,064 1,024 4 National Bank of Pakistan 701,094 553,028 92,470 5 Industrial Development Bank of Pakistan 9,425 6,111 28,120- 6 Zarai Taraqiati Bank Limited 88,594 3,438 14,374 7 Pumjab Provincial Cooperative Bank 17,657 2,008 3,424 8 SME Bank 7,351 2,057 2,755 9 Allied Bank of Palistan 294,718 231,116 19,462
10 Bank Alfalah Limited 310,171 270,656 13,676 11 Bank Alhabib Limited 132,454 107,170 7,297 12 Askari Commercial Bank Limited 180,549 142,255 13,347 13 Crescent Commercial Bank Limited 18,241 10,238 7,120 14 Atlas Bank Limited 22,244 12,718 3,047 15 Habib Bank Limited 634,418 496,677 65,269 16 Faysal Bank Limited 142,607 97,836 17,096 17 KASB Bank Limited 34,883 26,839 2,694 18 Dubai Islamic Bank Pakistan Ltd 14,767 10,062 4,053 19 JS Bank 19,330 14,432 3,570 20 Bank Islami 7,821 4,195 3,175 21 Arif Habib Rupali Bank Ltd. 9,584 5,118 3,126 22 First Dawood Islamic Bank 3,621 553 3,028 23 MCB Bank Limited 383,800 300,915 46,964 24 Meezan Bank Limited 59,729 45,053 5,224 25 Metropolitan Bank Limited 169,127 118,808 12,134 26 Mybank Limited 37,085 26,227 5,549 27 NIB Bank 85,638 40,715 18,059 28 PICIC Commercial Bank Limited 79,450 68,730 4,634 29 Prime Commercial Bank Limited 41,949 29,472 3,287 30 SaudiPak Commercial Bank Limited 66,500 46,532 5,240 31 Soneri Bank Limited 76,954 56,415 6,165 32 United Bank Limited 499,587 402,983 33,559 33 astandard Chartered Bank (Pakistan) Limted 281,772 178,600 42,983 34 Emirates Bank 3,988 864 2,866 35 ABN Amro Bank 82,309 59,539 5,539 36 Oman International Bank 2,739 650 2,011 37 HongKong & Shanghai Banking Corporation 28,748 17,625 2,515 38 Deutche Bank Limited 9,277 3,638 3,123 39 Bank of Tokyo 5,803 1,780 2,413 40 Citibank 105,487 71,216 6,354 41 Bank Albaraka 19,487 14,477 2,320
(Rs in Million)
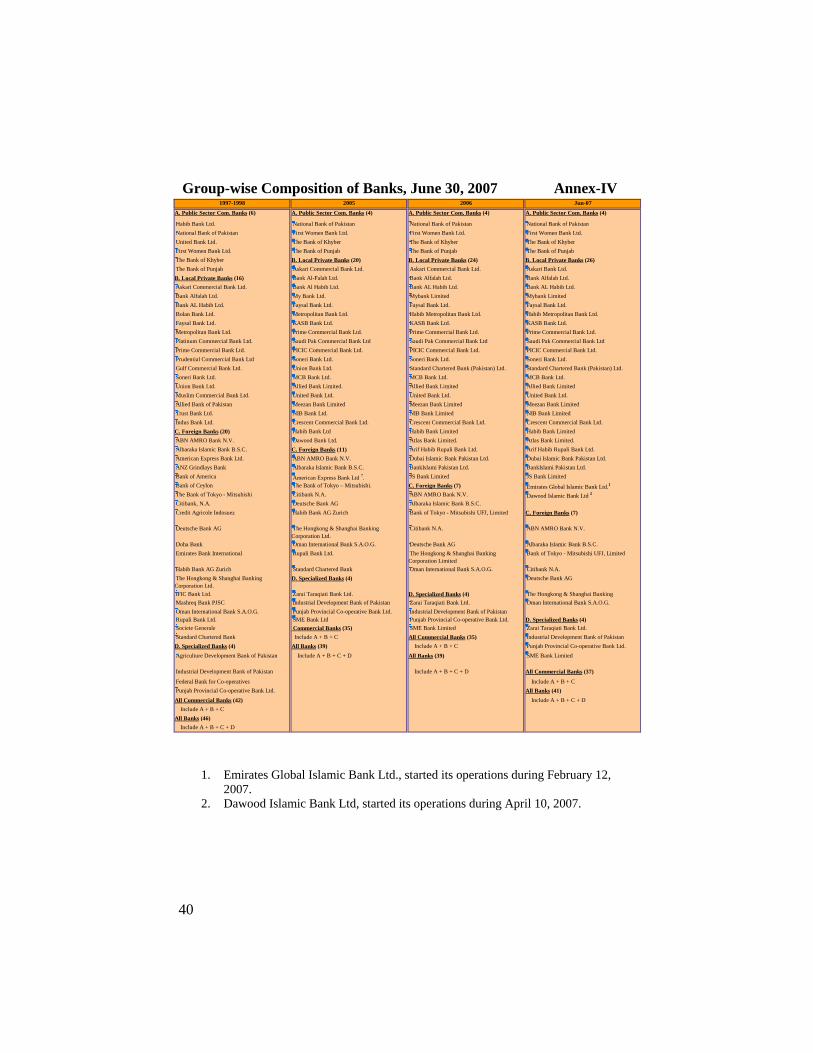
Group-wise Composition of Banks, June 30, 2007 Annex-IV
40
1. Emirates Global Islamic Bank Ltd., started its operations during February 12, 2007.
2. Dawood Islamic Bank Ltd, started its operations during April 10, 2007.
1997-1998 2005 2006 Jun-07
A. Public Sector Com. Banks (6) A. Public Sector Com. Banks (4) A. Public Sector Com. Banks (4) A. Public Sector Com. Banks (4)
Habib Bank Ltd. National Bank of Pakistan National Bank of Pakistan National Bank of Pakistan National Bank of Pakistan First Women Bank Ltd. First Women Bank Ltd. First Women Bank Ltd. United Bank Ltd. The Bank of Khyber The Bank of Khyber The Bank of Khyber First Women Bank Ltd. The Bank of Punjab The Bank of Punjab The Bank of Punjab The Bank of Khyber B. Local Private Banks (20) B. Local Private Banks (24) B. Local Private Banks (26) The Bank of Punjab Askari Commercial Bank Ltd. Askari Commercial Bank Ltd. Askari Bank Ltd.B. Local Private Banks (16) Bank Al-Falah Ltd. Bank Alfalah Ltd. Bank Alfalah Ltd. Askari Commercial Bank Ltd. Bank Al Habib Ltd. Bank AL Habib Ltd. Bank AL Habib Ltd. Bank Alfalah Ltd. My Bank Ltd. Mybank Limited Mybank Limited Bank AL Habib Ltd. Faysal Bank Ltd. Faysal Bank Ltd. Faysal Bank Ltd. Bolan Bank Ltd. Metropolitan Bank Ltd. Habib Metropolitan Bank Ltd. Habib Metropolitan Bank Ltd. Faysal Bank Ltd. KASB Bank Ltd. KASB Bank Ltd. KASB Bank Ltd. Metropolitan Bank Ltd. Prime Commercial Bank Ltd. Prime Commercial Bank Ltd. Prime Commercial Bank Ltd. Platinum Commercial Bank Ltd. Saudi Pak Commercial Bank Ltd Saudi Pak Commercial Bank Ltd Saudi Pak Commercial Bank Ltd Prime Commercial Bank Ltd. PICIC Commercial Bank Ltd. PICIC Commercial Bank Ltd. PICIC Commercial Bank Ltd. Prudential Commercial Bank Ltd Soneri Bank Ltd. Soneri Bank Ltd. Soneri Bank Ltd. Gulf Commercial Bank Ltd. Union Bank Ltd. Standard Chartered Bank (Pakistan) Ltd. Standard Chartered Bank (Pakistan) Ltd. Soneri Bank Ltd. MCB Bank Ltd. MCB Bank Ltd. MCB Bank Ltd. Union Bank Ltd. Allied Bank Limited. Allied Bank Limited Allied Bank Limited Muslim Commercial Bank Ltd. United Bank Ltd. United Bank Ltd. United Bank Ltd. Allied Bank of Pakistan Meezan Bank Limited Meezan Bank Limited Meezan Bank Limited Trust Bank Ltd. NIB Bank Ltd. NIB Bank Limited NIB Bank Limited Indus Bank Ltd. Crescent Commercial Bank Ltd. Crescent Commercial Bank Ltd. Crescent Commercial Bank Ltd.C. Foreign Banks (20) Habib Bank Ltd Habib Bank Limited Habib Bank Limited ABN AMRO Bank N.V. Dawood Bank Ltd. Atlas Bank Limited. Atlas Bank Limited. Albaraka Islamic Bank B.S.C. C. Foreign Banks (11) Arif Habib Rupali Bank Ltd. Arif Habib Rupali Bank Ltd. American Express Bank Ltd. ABN AMRO Bank N.V. Dubai Islamic Bank Pakistan Ltd. Dubai Islamic Bank Pakistan Ltd. ANZ Grindlays Bank Albaraka Islamic Bank B.S.C. BankIslami Pakistan Ltd. BankIslami Pakistan Ltd. Bank of America American Express Bank Ltd 7. JS Bank Limited JS Bank Limited Bank of Ceylon The Bank of Tokyo – Mitsubishi. C. Foreign Banks (7) Emirates Global Islamic Bank Ltd.1
The Bank of Tokyo - Mitsubishi Citibank N.A. ABN AMRO Bank N.V. Dawood Islamic Bank Ltd 2
Citibank, N.A. Deutsche Bank AG Albaraka Islamic Bank B.S.C. Credit Agricole Indosuez Habib Bank AG Zurich Bank of Tokyo - Mitsubishi UFJ, Limited C. Foreign Banks (7)
Deutsche Bank AG The Hongkong & Shanghai Banking Corporation Ltd.
Citibank N.A. ABN AMRO Bank N.V.
Doha Bank Oman International Bank S.A.O.G. Deutsche Bank AG Albaraka Islamic Bank B.S.C. Emirates Bank International Rupali Bank Ltd. The Hongkong & Shanghai Banking
Corporation Limited Bank of Tokyo - Mitsubishi UFJ, Limited
Habib Bank AG Zurich Standard Chartered Bank Oman International Bank S.A.O.G. Citibank N.A. The Hongkong & Shanghai Banking Corporation Ltd.
D. Specialized Banks (4) Deutsche Bank AG
IFIC Bank Ltd. Zarai Taraqiati Bank Ltd. D. Specialized Banks (4) The Hongkong & Shanghai Banking Mashreq Bank PJSC Industrial Development Bank of Pakistan Zarai Taraqiati Bank Ltd. Oman International Bank S.A.O.G. Oman International Bank S.A.O.G. Punjab Provincial Co-operative Bank Ltd. Industrial Development Bank of Pakistan Rupali Bank Ltd. SME Bank Ltd Punjab Provincial Co-operative Bank Ltd. D. Specialized Banks (4) Societe Generale Commercial Banks (35) SME Bank Limited Zarai Taraqiati Bank Ltd. Standard Chartered Bank Include A + B + C All Commercial Banks (35) Industrial Development Bank of PakistanD. Specialized Banks (4) All Banks (39) Include A + B + C Punjab Provincial Co-operative Bank Ltd. Agriculture Development Bank of Pakistan Include A + B + C + D All Banks (39) SME Bank Limited
Industrial Development Bank of Pakistan Include A + B + C + D All Commercial Banks (37)
Federal Bank for Co-operatives Include A + B + C Punjab Provincial Co-operative Bank Ltd. All Banks (41)All Commercial Banks (42) Include A + B + C + D Include A + B + CAll Banks (46) Include A + B + C + D


![Volltext (PDF) - Krause und Pachernegg - kup.at · PDF filePAT1 qpr, uPAqpr, MMP1 qpr, [16] bFGF qpr, FGFR qpr, TIMP1 q, ... Medium komponiert [54]. Ein wesentli-cher Unterschied zum](https://img.dokumen.tips/doc/110x75/5a7a1af77f8b9adf228d4b97/volltext-pdf-krause-und-pachernegg-kupat-qpr-upaqpr-mmp1-qpr-16-bfgf.jpg)