Embed Size (px)
Citation preview

Consolidated Financial Statements Financial year 2012
Approved by the Board of Directors March 13th, 2013


3
MANAGEMENT REPORTS AND FINANCIAL STATEMENTS
Group Structure and bank shareholdings 9
Reference Scenario 13
Management Report 21
The Group in 2012 23
Key indicators of Cattolica Group business performance 26
Ways in which the Group image and information are disclosed 33
Business performance for the period 35
A brief outline of the business performance 37
Insurance business and other sectors of activities 41
Financial and asset management 54
Risk management 59
Risk management 61
Insurance risk – non-life business 61
Insurance risk – life business 62
Market risk 64
Operating, legal and reputational risk 68
Employees and sales network 71
Human resources 73
Sales network 74
Significant events and other information 77
Significant transactions carried out during the year 79
Other information 87
Significant events during the first few months of 2013 92
Outlook for business activities 93
Consolidated Financial Statements 95
Statement of Financial Position 97
Income statement 99
Statement of comprehensive income 100
Statement of cash flows 102
Statement of changes in equity 103
Reconciliation statement of the result of the period and shareholders’ equity of the Group
and the Parent Company 107
Index

4
Notes to the accounts 113
Part A – Basis of presentation and consolidation area 115
Part B – Accounting principles 125
Part C – Information on the consolidated statement of financial position and income
statement 149
Part D – Other information 193
Certification of the Executive appointed to draw up the corporate accounting documents 197 Independent Auditors’ Report 199

5
TABLES
Table 1 – Key economic indicators 27
Table 2 – Key equity indicators 27
Table 3 – Sales network and headcount 28
Table 4 – Reclassified consolidated statement of financial position 29
Table 5 – Reclassified consolidated income statement 30
Table 6 – Reclassified consolidated income statement by segment of activities 31
Table 7 – Key indicators 32
Table 8 - Total premiums written 45
Table 9 – Life premiums written 46
Table 10 – Group exposure to re-insurers by rating category 62
Table 11 – Stratification of the portfolio on the basis of the maturity date 66
Table 12 – Stratification of the bond portfolio by rating 67
Table 13 – Group headcount 74
Table 14 - Ratios for share in circulation 92
Table 15 – Scope of consolidation (ISVAP Regulation No. 7 dated July 13th, 2007) 121
Table 16– Statement of financial position by sector of activities (ISVAP Regulation No. 7 dated July 13th, 2007) 151
Table 17 – Intangible assets 152
Table 18 - Goodwill – changes during the period 152
Table 19 – Other intangible assets – changes during the period 155
Table 20 – Tangible assets 157
Table 21 – Property and other tangible assets – changes during the period 158
Table 22 – Analysis of technical provisions – reinsurance amount (ISVAP Regulation No. 7 dated July 13th, 2007) 159
Table 23 - Investments 159
Table 24 – Investment property – changes during the period 160
Table 25 – Analysis of tangible and intangible assets (ISVAP Regulation No. 7 dated July 13th, 2007) 161
Table 26 - Investments in subsidiaries, associates and joint ventures 161
Table 27 – Analysis of non-consolidated equity investments (ISVAP Regulation No. 7 dated July 13th, 2007) 162
Summary index of tables

6
Table 28 – Summary data of non consolidated subsidiary and associated companies and joint ventures 162
Table 29 - Financial investments 163
Table 30 – Analysis of financial assets (ISVAP Regulation No. 7 dated July 13th, 2007) 163
Table 31 - Fair value of held to maturity investments and of loans and receivables 164
Table 32 - Financial assets at fair value through profit or loss 165
Table 33 - Exposure in Greek Government debt securities 166
Table 34 - Exposure in government debt securities issued by EU zone countries - Available for sale financial assets 166
Table 35 - Exposure in government debt securities issued by EU zone countries - Financial assets at fair value through profit or loss 167
Table 36 - Exposure in government debt securities issued by EU zone countries - Held to maturity investments 167
Table 37 – Analysis of financial assets and liabilities by level (ISVAP Regulation No. 7 dated July 13th, 2007) 168
Table 38 – Analysis of changes in level 3 financial assets and liabilities (ISVAP Regulation No. 7 dated July 13th, 2007) 168
Table 39- Analysis of assets and liabilities relating to contracts issued by insurance companies where the investment risk is borne by the policyholders and deriving from pension fund management (ISVAP Regulation No. 7 dated July 13th, 2007) 169
Table 40 - Sundry receivables 169
Table 41 – Other asset items 170
Table 42 - Other assets 171
Table 43 – Shareholders’ equity 173
Table 44 – Provisions and allowances 174
Table 45 – Provisions and allowances – changes during the period 174
Table 46 – Analysis of technical provisions (ISVAP Regulation No. 7 dated July 13th, 2007) 176
Table 47 – Financial liabilities 177
Table 48 – Analysis of financial liabilities (ISVAP Regulation No. 7 dated July 13th 2007) 178
Table 49 - Payables 179
Table 50 – Employee severance indemnity and length-of-service bonus 180
Table 51 – Other liability items 180
Table 52 - Other liabilities 181

7
Table 53– Breakdown of direct and indirect gross premiums written class and by geographic area 183
Table 54 - Insurance business 184
Table 55 - Analysis of insurance operating expenses 184
Table 56 - Financial operations 185
Table 57 - Financial and investment income and charges (ISVAP Regulation No. 7 dated July 13th, 2007) 186
Table 58 – Income taxes for the year 188
Table 59 – Reconciliation of the tax rate – analysis 189
Table 60 - Analysis of the statement of other comprehensive income – net amounts (ISVAP Regulation No. 7 dated July 13th, 2007) 189
Table 61 – Income statement by sector of activities (ISVAP Regulation No. 7 dated July 13th, 2007) 190
Table 62 – Analysis of technical insurance items (ISVAP Regulation No. 7 dated July 13th, 2007) 191
Table 63 – Analysis of insurance operating expenses (ISVAP Regulation No. 7 dated July 13th, 2007) 191
Table 64 - Transactions with related parties 196


Group Structure and bank shareholdings

Key:
(*) Tua Assicurazioni wholly owns Tua Retail.
(**) 0.005% of the share capital of Cattolica Services is held individually by ABC Assicura, BCC Assicurazioni, BCC Vita, Berica Vita, Cattolica
Previdenza, C.P. Servizi Consulenziali, Duomo Uni One, Lombarda Vita, Risparmio & Previdenza and TUA Assicurazioni.
(***) Up until February 25th, 2013, the company name was Car Full Service.
Non-Life Operating services Life Banks Agricultural-real estate
property sector
49%
82%
BCC Vita
Berica Vita
Cattolica Life
Cattolica Previdenza
Lombarda Vita
Risparmio & Previdenza
ABC Assicura
BCC Assicurazioni
Duomo Uni One Assicurazioni
TUA Assicurazioni (*)
As at December 31st, 2012
Cattolica Immobiliare
Cattolica Services (**)
Cattolica Services Sinistri (***)
C. P. Servizi Consulenziali
Cassa di Risparmio di San Miniato
Prisma
Cattolica Agricola
Cattolica Beni Immobili
100%
25.07%
20%
100%
100%
99.95%
51%
NON LIFE LIFE OTHER
99.99%
97%
60%
51%
51%
60%
60%
100%
60%
97.58%

Cassa di Risparmio di Fabriano e Cupramontana
Banca Popolare S. Angelo
Emil Banca
UBI Banca
Banca di Valle Camonica
Banca Popolare di Vicenza
As at December 31st, 2012
BANK SHAREHOLDINGS
17.42%
0.42%
0.08%
0.92%
6.38%
0.46%


Reference Scenario


15
Macro-economic scenario
During the year, the crisis continued to weigh heavily on global markets, especially in Europe where the economic recession, aggravated by the policies for containing budget costs and by the rise in the costs of refinancing the public deficit became increasingly pressing. This was joined by the implicit default of Greece which further eroded the confidence of investors and contributed towards heavily reducing the economic growth estimates. In order to contrast the deteriorating situation, the European Central Bank initially increased the liquidity extraordinary measures for the banking system by means of a second LTRO transaction (long-term refinancing operation) over 3 years. The worsening of the crisis and the difficulty of the European authorities to provide swift responses, forced the board to adopt an expansive monetary policy during the Summer, cutting the rates in the second quarter by 25 bp, taking them to the all time low of 0.75% and launching additional extraordinary liquidity measures for the banking system. The most important of these measures was the OMT (Outright Monetary Transaction) or rather the programme for the repurchase of short-term government securities of countries in difficulty, subject to the signing of a memorandum with the manoeuvres for the containment of the debt which the rescued government will have to implement. In Italy, the crisis deteriorated further, with a collapse in the confidence indexes and a significant reduction in industrial production which pushed the country into a deep recession. Despite the efforts linked to the containment of the public deficit, the concern of international investors with regard to the staying power of the single currency brought the levels of the spread to the all-time high values already seen in 2011. Only the intervention of the European Central Bank and the completion of a series of important reforms on the employment market carried out by the Monti government made it possible to temporarily brighten up the situation. The US economy disclosed a trend in line with expectations, featuring under potential economic growth. Positive contributions came from internal demand, aided by the increase in employment level in the private sector, from the real estate property market (even if still at contained levels) and from the cycle of stock of the manufacturing sector. At the same time however, industrial activities slowed down even further due to the reduction in exports and the November elections curbed the budget adjustment manoeuvres. Therefore, the Federal Reserve continued its expansive monetary policy, launching two additional repurchase operations on g overnment securities in order to ensure the system ample liquidity and changing the tax policy targets for the coming years. In Japan, the economy suffered a heavy slowdown in consequence of the reduction in Chinese demand. The new prime minister declared a new expansive policy so as to keep the Japanese economy competitive. By contrast, among emerging countries an essential slowdown was seen in economic activities, mainly due to the considerable re-balancing of the budget flows (China and South East Asia), the lack of structural reforms (India) and the crisis in the main economic sector (Brazil). Global inflation disclosed significant symptoms of a slowdown. Bond markets Despite the numerous downgrades registered on global governmental issues, on t he bond market the return on ten-year government securities of the core countries (Germany, USA and UK) remained at minimum levels, albeit with a partial recovery in the second half of the year,
Reference Scenario

16
both for the US (1.77%) and for the German (1.38%) yield curve, while the short-term maturities reported close to zero nominal rates and in some cases even negative ones. Volatility was high in 2012, following the mentioned above policy delays. After an initial part of the year when the effect of the abundant liquidity on markets led to a significant contraction in the returns of the curves, the second and third quarters saw an abnormal trend involving a widening of the spread between the return on government securities of the peripheral European countries with respect to German Bunds, with record levels on all the curves. From August onwards, the intervention of the European Central Bank and greater concreteness of the Eurogroup decisions, for the purpose of achieving a fiscal and banking union, led to a contraction on the spreads close to record lows for the year. In contrast, the attention of the operators was concentrated above all else on the corporate bonds market which saw an explosion at record levels of the issues both for the investment grade component and for the high-yield market, with an increase in the portfolio risk. Stock markets The stock markets saw great volatility, guided above all else by the economy trend expectations and the European crisis. The share lists maintained a fluctuating trend for the whole of the first half of the year, while from June onwards the evident underweight of the investors and the conviction of the operators that the Euro Zone could tangibly resolve the problems led buyers to return in a more decisive manner to the market attracted by high dividends paid. On an annual basis, in the USA, the S&P 500 i ndex closed at +13.40% and the Nasdaq at +15.90%, while in Europe the Dax closed at +29.06%, the Eurostoxx50 at +13.79% and the FTSEMIB at +7.84%. In Asia, the Hang Seng index rose 22.9% and the Nikkei closed with a gain of 22.94%. Foreign exchange market The fears of an economic recession in Europe led the Euro to lose value both against the Dollar, with depreciation of 3%, and against the Yen, which gained 8.74% on the single currency. The Fed’s decision to keep the market extremely liquid for a long period made it possible for the Dollar to devaluate also against the Japanese currency by 5.91%.

17
Insurance industry
The graphs below show certain summary figures published by ANIA1 for the insurance industry for the period 2007-2011.
4.7%
-2.9%
3.0%
-0.5%
-3.0%
5.5%
-2.2%
3.4%
-0.6%
-3.4%-4.0%
-3.0%
-2.0%
-1.0%
0.0%
1.0%
2.0%
3.0%
4.0%
5.0%
6.0%
2007 2008 2009 2010 2011
Key indicatorsInsurance sector
%
Technical result/direct and indirect premiums Net income/direct and indirect premiums On the basis of the IVASS Statistics on gross premiums written through the fourth quarter of 2012, published on March 6th, 2013, overall premiums written in the life and non-life classes by Italian insurance companies and by representative agencies in Italy of companies from outside the E.E.A. during 2012 amounted to € 105,109.4 million, with a decrease of 4.6% with respect to 2011 (-7.4% in real terms), which follows the -12.5% registered in that year with respect to 2010 (when the amount of the premiums written had reached an all-time high).
1 Source ANIA - L’assicurazione italiana nel 2011-2012, page 317, publication dated June 25th, 2012.
61,555 54,829
81,409 90,592
73,869
35,471
34,327
33,790
33,054
36,363
0
20,000
40,000
60,000
80,000
100,000
120,000
140,000
2007 2008 2009 2010 2011
Direct and indirect Life premiums Direct and indirect Nonlife premiums
Key economic indicatorsof the Insurance sector
€/millions

18
In detail, life premiums, equating to € 69,707.2 million, reported a decrease of 5.6% (-8.4% in real terms), and an incidence on the overall life and non-life portfolio which came to 66.3% (67% in 2011); the non-life portfolio, which came to 35,402.2 million, decreased 2.6% (-5.5% in real terms), with an incidence of 33.7% on the overall portfolio (33% in 2011). The same changes calculated on a consistent basis (or rather also excluding from the 2011 total premiums written the ones of three companies which left the Italian direct business portfolio in 2012), reveal - for the Italian insurance companies and representative agencies in Italy of companies from outside the E.E.A. - a drop in total premiums written (life and non-life), for the life classes and the non-life classes equating, respectively, to 4.3%, 5.5% and 1.9% (in real terms the reduction on a consistent basis in premiums written came to 7.1%, 8.3% and 4.8%). Premiums written as a percentage of GDP in 2012 came to 6.71% (down with respect to the 6.98% in 2011); in detail, the drop was attributable to the life classes, where the percentage of GDP came to 4.45% (4.68% in 2011), while it came to 2.26% for the non-life classes (down slightly with respect to the 2.30% in 2011). With regard to the figures relating to premiums written in the life classes, Class I (insurance on the duration of human life) with € 51,087.5 million, reported a decrease of 9.7% compared with 2011; Class III (insurance whose main benefits are directly linked to the value of UCIT units or internal funds or indexes or other reference values) with € 13,799.9 million, increased 10.5% with respect to 2011; premiums written for Class V (capitalization transactions) amounted to € 2,814.4 million, a decrease of 10.1%. These classes as a percentage of total life premiums represent 73.3%, 19.8% and 4% respectively (76.6%, 16.9% and 4.2% respectively in 2011). With regard to the remaining classes, the premiums of Class VI (pension funds: € 1,85 5.7 million, involving a decrease of 22.7% when compared with 2011) represented 2.7% of the life portfolio (2% in 2011). Premiums written relating to Class IV insurance (Long-term non-cancellable health insurance: € 43.2 million) and supplementary insurance (€ 106.6 million) in conclusion represented the remaining 0.2% of total life premiums (as in 2011). With reference to assets managed for pension funds, overall these came to € 11,696.1 million, involving an increase of 17.2% with respect to the end of 2011. The breakdown by sales channels of premiums written discloses that bank and post office branches broker 48.6% of the life portfolio (down by around six percentage points with respect to the 54.8% in 2011), financial advisors 23.3% (up by five percentage points with respect to the 18.3% in 2011), agencies with mandate 16.3% (stable with respect to the 16.4% in 2011), agencies managed directly and subsidiaries 10.3% (compared with 9.2% in the same period of 2011), brokers 1.1% (compared with 1% as in 2011) and other forms of direct sale 0.4% (compared with 0.3%, as in 2011). With reference to the trend of the non-life classes, the premiums portfolio of the TPL land motor vehicles and TPL ships (sea and inland water vessels) classes amounted in total to € 17,576.1 million, presenting a drop of 1.2% with respect to 2011, with an incidence of 49.6% on total non-life classes (48.9% in 2011) and 16.7% on total premiums (16.1% in 2011). With regard to the other classes, those with the highest business, and therefore the highest percentage in terms of the total, are: accident and injury, with 8.4% (as in 2011), TPL general,

19
with 8.3% (8.1% in 2011), land vehicle hulls, with 7.5% (8% in 2011), other damage to assets, with 7.4% (7.3%), fire and natural forces, with 6.5% (6.4% in 2011) and health, with 6% (as in 2011). Analysis by distribution channel continues to highlight the preponderance of premiums written via agencies with mandate, even if these continue to drop slightly with respect to previous figures. In conclusion, this channel places 81.3% of the non-life portfolio (81.6% in 2011) and 87.2% of the portfolio relating to just the motor TPL class (88% in 2011). Lastly, mention should be made of the slight rise in the portion brokered by other forms of direct sale, both with regard to the non-life portfolio (5.2% compared with 4.7% in 2011), and with reference to just the motor TPL class (7.9% compared with 6.9% in 2011). On the basis of the afore-mentioned figures, the Group’s market share in the non-life sector would rise from 4.5% to 4.8% and in the life sector would drop from 3.1% to 2.8%.
4.5 4.8
3.12.8
3.6 3.5
0.00
1.00
2.00
3.00
4.00
5.00
6.00
2011 2012
Total Group market share%
Non life Life Total


Management Report


Management Report The Group in 2012 Business performance for the period Risk management Employees and sales network Significant events and other information


Management Report
25
The Cattolica Group closed the year with consolidated profit of € 84 million compared with € 41.8 million in the previous year. The Group’s net result came to € 61.9 million (€ 37.4 million at December 31st, 2011). Excluding the extraordinary effects, the consolidated profit would have come to € 95 million, and the Group net result € 78 million. Despite the continuation of the difficult economic situation and the instability of the financial markets in the Euro Zone due to heavy tension on sovereign debts, the improvement in business operations of the non-life classes continued with a combined ratio of retained business which dropped from 96.9% in December 2011 to 95.7%; the latter figure, excluding the effects of the earthquake which hit Emilia Romagna in May, came to 94.7%. Premiums written for the direct non-life business classes rose by 3.6% also due to the on-going productive commitment of the agencies confirming the strategy implemented over the last few years, enhancing and consolidating the sales network as the backbone for the Group’s growth. Life premiums written were affected by the decrease in the market and dropped 14.8%, passing from € 2,319.2 million to € 1,976 m illion, with premiums in the traditional segment for € 1,307.6 million, unit and index-linked premiums for € 203.5 million, capitalisation for € 318.7 million and pension funds for € 146.2 million. Financial operations2 closed with a result, gross of the tax effects, amounting to € 542.2 million as against € 259 .5 million in the previous year, mainly as a result of the additional income interest from which rose from € 410.3 m illion to € 432.7 million, of the increase in other net incomes realised which rose from € 12.8 million to € 89.6 m illion and of the reduction in losses from valuation on financial assets from € 181.1 million to € 21.9 million. Overall, this consolidated result was affected by € 48 million in impairment losses on the financial investments portfolio3 and on goodwill. As at December 31st, investments amounted to € 15,938.7 million (€ 15,094.5 million as at December 31st, 2011) and technical provisions net of the reinsurance amount together with financial liabilities relating to investment contracts came to € 15,010.9 m illion (€ 14,945.5 million as at December 31st, 2011). Consolidated shareholders’ equity amounted to € 1,608.8 million (€ 1,223.5 million as at December 31st, 2011) and the Group’s solvency margin came to 1.61 times the regulatory minimum4 compared with 1.25 times as at December 31st, 2011.
*****
2With the exclusion of investments whose risk is borne by the policyholders and the change in other financial liabilities. 3 Net of tax effects and shadow accounting. 4 Prior to the Parent Company’s dividend payment proposal. It is hereby disclosed that the Parent Company does not apply the IVASS anti-crisis regulations. Taking into account the dividend proposal, the solvency margin comes to 1.55 times the regulatory minimum.
The Group in 2012

26
Significant corporate events which characterised 2012 included the purchase, for a value of € 76 million, of the agricultural-real estate complex “Tenuta Cà Tron”, covering a surface area of more than 1,000 hectares, via two specifically-created companies, Cattolica Agricola and Cattolica Beni Immobili, and the renewal in December of the strategic partnership agreement with Banca Popolare di Vicenza, extending the expiry date until 2022. The renewed agreement, linked to the changed market context, confirms and consolidates the collaboration launched between the two Groups in 2007, focusing on the growth of the insurance companies in the partnership. The agreement confirms the exclusive commitments in force for the distribution of Cattolica Group products via the network of the Banca Popolare di Vicenza Group, which at December 31st, had 640 branches.
KEY INDICATORS OF CATTOLICA GROUP BUSINESS PERFORMANCE
The tables which follow show the most significant performance indicators, the figures concerning employees and the sales network, the reclassified consolidated statement of financial position and income statement, the consolidated income statement reclassified by segment of activities and the key indicators as co mpared to those of the previous year, respectively, in accordance with the international accounting standards. In these consolidated financial statements, the term “premiums written” means the sum total of the insurance premiums (as defined by IFRS 4) and the amounts relating to investment contracts (as defined by IFRS 4 which refers the related discipline to IAS 39).

Management Report
27
Table 1 – Key economic indicators
Changes
(€ thousands) 2012 2011 Abs. amount %
Total premiums written 3,676,670 3,960,534 -283,864 -7.2
of which
Gross premiums written 3,539,070 3,778,268 -239,198 -6.3
Direct business - non-life 1,685,444 1,626,769 58,675 3.6
Direct business – life 1,838,422 2,136,936 -298,514 -14.0
Indirect business - non-life 15,103 14,453 650 4.5
Indirect business – life 101 110 -9 -8.2
of which
Investment contracts 137,600 182,266 -44,666 -24.5
Consolidated net profit for the period 84,043 41,805 42,238 n.s.
Group net profit for the period 61,879 37,448 24,431 65.2
n.s. = not significant
Table 2 – Key equity indicators
Changes
(€ thousands) 2012 2011 Abs. amount %
Investments 15,938,701 15,094,533 844,168 5.6
Technical provisions net of reinsurance amount 14,054,067 13,941,214 112,853 0.8
Financial liabilities relating to investment contracts 956,861 1,004,277 -47,416 -4.7
Consolidated shareholders' equity 1,608,762 1,223,466 385,296 31.5

28
Table 3 – Sales network and headcount
Changes
(number) 2012 2011 Abs. amount %
Direct network:
Agencies 1,391 1,398 -7 -0.5%
including non-exclusive agencies 349 331 18 5.4%
Partner networks:
Bank branches 5,967 5,990 -23 -0.4%
Financial advisors 879 973 -94 -9.7%
Welfare and pension product advisors 30 46 -16 -34.8%
C.P. Servizi Consulenziali subagents 295 217 78 35.9%
Headcount prior to BPVI Fondi SGR spin-off (*) 1,451 1,470 -19 -1.3%
Employees acquired with BPVI Fondi SGR spin-off 9 0 9
Total headcount 1,460 1,470 -10 -0.7%
Full-Time Equivalent headcount prior to BPVI Fondi SGR spin-off (*) 1,397 1,410 -13 -0.9%
FTE employees acquired with BPVI Fondi SGR spin-off 9 0 9
FTE headcount 1,406 1,410 -4 -0.3%
(*) on March 14th, the deed for the partial non-proportionate spin-off of BPVI Fondi SGR within Cattolica Immobiliare was finalised; the business segment was subsequently spun-off to Cattolica Assicurazioni with effect as at December 31st, 2012.

Management Report
29
Table 4 – Reclassified consolidated statement of financial position
Changes Items from obligatory
statements (*) (€ thousands) 2012 2011 Abs. amount %
Assets
Investment property 172,935 157,958 14,977 9.5 4.1
Property 94,747 18,778 75,969 n.s. 2.1
Investments in subsidiaries, associates and joint ventures 82,197 103,108 -20,911 -20.3 4.2
Loans and receivables 1,239,353 1,516,516 -277,163 -18.3 4.4
Held to maturity investments 287,193 285,481 1,712 0.6 4.3
Available for sale financial assets 9,739,824 8,512,235 1,227,589 14.4 4.5
Financial assets at fair value through profit or loss 3,714,741 4,093,219 -378,478 -9.2 4.6
Cash and cash equivalents 607,711 407,238 200,473 49.2 7
Investments 15,938,701 15,094,533 844,168 5.6
Intangible assets 310,467 327,612 -17,145 -5.2 1
Technical provisions - reinsurance amount 673,367 640,453 32,914 5.1 3
Sundry receivables, other tangible assets and other asset items 1,525,999 1,858,993 -332,994 -17.9 (**)
TOTAL ASSETS 18,448,534 17,921,591 526,943 2.9
Liabilities and shareholders' equity
Group capital and reserves 1,255,025 980,976 274,049 27.9
Group profit for the year 61,879 37,448 24,431 65.2 Shareholders' equity pertaining to the Group 1,316,904 1,018,424 298,480 29.3 1.1
Capital and reserves pertaining to minority shareholders 269,694 200,685 69,009 34.4
Profit for the period pertaining to minority shareholders 22,164 4,357 17,807 n.s. Net shareholders' equity pertaining to minority shareholders 291,858 205,042 86,816 42.3 1.2
Total capital and reserves 1,608,762 1,223,466 385,296 31.5 1
Provision for unearned premiums 701,539 625,694 75,845 12.1
Provision for outstanding claims 2,312,178 2,331,070 -18,892 -0.8
Gross technical provisions - non-life 3,013,717 2,956,764 56,953 1.9 3
Gross technical provisions - life 11,365,658 11,298,929 66,729 0.6 3
Other gross non-life technical provisions 2,202 2,300 -98 -4.3 3
Other gross life technical provisions 345,857 323,674 22,183 6.9 3
Financial liabilities 1,264,398 1,254,072 10,326 0.8 4 of which deposits from policyholders 956,861 1,004,277 -47,416 -4.7
Allowances, payables and other liability items 847,940 862,386 -14,446 -1.7 (***)
TOTAL LIABILITIES AND SHAREHOLDERS' EQUITY 18,448,534 17,921,591 526,943 2.9 (*) Indicates the items of the statements in the consolidated financial statements as per ISVAP regulation No. 7 of July 13th, 2007 (**) Sundry receivables, other asset items, and other tangible assets (balance sheet items under assets = 5 + 6 + 2.2) (***) Allowances, payables and other liability items (balance sheet items under liabilities = 2 + 5 + 6) n.s. = not significant

30
Table 5 – Reclassified consolidated income statement
Changes Items from obligatory
statements (*) (€ thousands) 2012 2011 Abs. amount % Net premiums 3,161,876 3,439,405 -277,529 -8.1 1.1
Net charges relating to claims -3,218,839 -3,194,241 -24,598 -0.8 2.1
Operating expenses -441,160 -441,508 348 0.1 of which commission and other acquisition costs -304,786 -305,869 1,083 0.4 2.5.1 of which other administrative expenses -136,374 -135,639 -735 -0.5 2.5.3
Other revenues net of other costs (other technical income and charges) -48,183 -9,897 -38,286 n.s. 1.6 - 2.6 Net income deriving from financial instruments at fair value through profit or loss 227,864 26,935 200,929 n.s. 1.3
of which class D 214,041 16,843 197,198 n.s. Net income deriving from investments in subsidiaries, associates and joint ventures -3,662 -15,693 12,031 76.7 1.4 - 2.3
Net income deriving from other financial instruments and investment property 567,871 280,993 286,878 n.s. 1.5 - 2.4
of which net interest 432,729 410,308 22,421 5.5 1.5.1 - 2.4.1 of which other income net of other charges 47,674 36,404 11,270 31.0 1.5.2 - 2.4.2 of which net profits realised 89,629 12,777 76,852 n.s. 1.5.3 - 2.4.3 of which net valuation profits on financial assets -21,894 -181,114 159,220 87.9 1.5.4 - 2.4.4 of which changes in other financial liabilities 19,733 2,618 17,115 n.s. 1.5.4 - 2.4.4
Commission income net of commission expense -27 1,132 -1,159 n.s. 1.2 - 2.2
Operating expenses relating to investments -16,120 -14,382 -1,738 -12.1 2.5.2 RESULT OF INSURANCE BUSINESS AND FINANCIAL OPERATIONS 229,620 72,744 156,876 n.s.
Other revenues net of other costs (excluding other technical income and charges included under insurance operations)
-70,781 -51,759 -19,022 -36.8 1.6 - 2.6
PRE-TAX PROFIT FOR THE PERIOD 158,839 20,985 137,854 n.s.
Taxation -74,796 20,804 -95,600 n.s. 3
NET PROFIT FOR THE PERIOD 84,043 41,789 42,254 n.s.
PROFIT (LOSS) FROM DISCONTINUED OPERATIONS 0 16 -16 -100.0 4
CONSOLIDATED PROFIT (LOSS) FOR THE PERIOD 84,043 41,805 42,238 n.s.
Profit for the period pertaining to minority shareholders 22,164 4,357 17,807 n.s.
PROFIT FOR THE PERIOD PERTAINING TO THE GROUP 61,879 37,448 24,431 65.2 n.s. = not significant

Management Report
31
Table 6 – Reclassified consolidated income statement by segment of activities
NON-LIFE LIFE OTHER TOTAL
(€ thousands) 2012 2011 2012 2011 2012 2011 2012 2011
Net premiums 1,374,395 1,362,054 1,787,481 2,077,351 0 0 3,161,876 3,439,405
Net charges relating to claims -946,102 -990,681 -2,272,737 -2,203,560 0 0 -3,218,839 -3,194,241
Operating expenses -337,954 -328,504 -103,206 -113,001 0 -3 -441,160 -441,508 of which commission and other acquisition costs -247,123 -236,031 -57,663 -69,838 0 0 -304,786 -305,869 of which other administrative expenses -90,831 -92,473 -45,543 -43,163 0 -3 -136,374 -135,639
Other revenues net of other costs (other technical income and charges) -31,670 -230 -16,513 -9,667 0 0 -48,183 -9,897
Net income deriving from financial instruments at fair value through profit or loss -8,065 1,551 235,929 25,384 0 0 227,864 26,935
of which class D 214,041 16,843 214,041 16,843
Net income deriving from investments in subsidiaries, associates and joint ventures -372 -9,430 -3,290 -6,263 0 0 -3,662 -15,693
Net income deriving from other financial instruments and investment property 93,580 21,773 468,089 252,620 6,202 6,600 567,871 280,993
Commission income net of commission expenses -16 -57 -11 1,189 0 0 -27 1,132 Operating expenses relating to investments -3,211 -3,523 -7,037 -6,444 -5,872 -4,415 -16,120 -14,382 RESULT OF INSURANCE BUSINESS AND FINANCIAL OPERATIONS 140,585 52,953 88,705 17,609 330 2,182 229,620 72,744 Other revenues net of other costs (excluding other technical income and charges included under insurance operations) -46,283 -35,638 -24,852 -15,792 354 -329 -70,781 -51,759
PRE-TAX PROFIT FOR THE PERIOD 94,302 17,315 63,853 1,817 684 1,853 158,839 20,985
Taxation -47,460 23,227 -27,302 -2,531 -34 108 -74,796 20,804
NET PROFIT FOR THE PERIOD 46,842 40,542 36,551 -714 650 1,961 84,043 41,789 PROFIT (LOSS) FROM DISCONTINUED OPERATIONS 0 16 0 0 0 0 0 16
CONSOLIDATED PROFIT (LOSS) FOR THE PERIOD 46,842 40,558 36,551 -714 650 1,961 84,043 41,805

32
Table 7 – Key indicators
2012 2011
Non-life ratios for retained business Claims ratio (Net charges relating to claims / Net premiums) 68.8% 72.7% G&A ratio (Other administrative expenses / Net premiums) 6.6% 6.8% Commission ratio (Acquisition costs / Net premiums) 18.0% 17.3% Total Expense ratio (Operating expenses / Net premiums) 24.6% 24.1% Combined ratio (1 - (Technical balance / Net premiums)) 95.7% 96.9% Non-life ratios for direct business Claims ratio (Net charges relating to claims / Premiums for the period) 69.5% 72.4% G&A ratio (Other administrative expenses / Premiums for the period) 5.6% 5.8% Commission ratio (Acquisition costs / Premiums for the period) 18.9% 18.5% Total Expense ratio (Operating expenses / Premiums for the period) 24.5% 24.2% Combined ratio (1 - (Technical balance / Premiums for the period) 96.1% 96.8% Life ratios G&A ratio (Other administrative expenses / Premiums written) 2.3% 1.9% Commission ratio (Acquisition costs / Premiums written) 2.9% 3.0% Total Expense ratio (Operating expenses/ Premiums written) 5.2% 4.9% Total ratios G&A ratio (Other administrative expenses / Premiums written) 3.7% 3.4% Note: "Total premiums written" in the life business refer to the amount of gross insurance premiums and of the investment contracts

Management Report
33
WAYS IN WHICH THE GROUP IMAGE AND INFORMATION ARE DISCLOSED
The Social report
Each year the Company publishes the Social Report which is drawn up in accordance with the GBS standard. The first section (identity) proposes the distinctive values of the Company. In the second section (economic data), the Group’s corporate activities are represented in quantitative terms. The crux of the social report is found in the third section (corporate relationship), where a detailed map of the stakeholders outlines the overall picture of the corporate relations.
The Investor Relations Division
The Investor Relations Division maintained an on-going dialogue with the financial community, involving relations marked by clarity and transparency, in order to ensure the market visibility on the results and on the strategies of the Group. There are four companies which follow and publish analysis and reports on Cattolica stock; individual meetings are periodically organised with the analysts so as to look in-depth at the economic-business trend. On July 11th, Carlo Ferraresi was appointed as the new Finance Director and Investor Relations Manager of the Cattolica Group. Mr. Ferraresi comes from Crédit Agricole Corporate & Investment Bank where he covered the role of Managing Director and gained important technical and managerial experience. He has covered important roles both in the finance field and in the insurance and reinsurance sectors in Italy and in the UK.
Rating In January, Standard & Poor’s lowered the ratings of 16 countries in the Euro Zone, including Italy with a decrease of two notches from A to BBB+ with a negative outlook. Consequently, the agency adopted the same rating action for 15 European insurance companies including the Cattolica Group. On January 27th, the agency in fact took the Group’s rating to “BBB” with a negative outlook in line with its view that the persistence of an unfavourable economic and financial market trend in Italy and the Euro Zone could influence the capitalisation of the company. On October 3rd, the rating agency confirmed Cattolica’s rating as BBB, confirming the strong operating performance of the non-life business, the maintenance of a consolidated market position and the ability of management to achieve the results. The outlook remains negative given the continuation of a still uncertain economic and financial context.


Management Report The Group in 2012 Business performance for the period Risk management Employees and sales network Significant events and other information


Management Report
37
A BRIEF OUTLINE OF THE BUSINESS PERFORMANCE
The Group by main financial statement aggregates
Sectors of business
The Group’s activities are divided up into three business segments: life, non-life and other. The core business of the Group, headed up by Cattolica Assicurazioni, a company which is involved in both life and non-life business, is divided up between the non-life segment (ABC Assicura, BCC Assicurazioni, Car Full Service, C.P. Servizi Consulenziali for the Cattolica and TUA Assicurazioni mandate, Duomo Uni One Assicurazioni, hereinafter “Duomo Uni One”, and TUA Assicurazioni) and the life segment (BCC Vita, Berica Vita, Cattolica Life, Cattolica Previdenza, C.P. Servizi Consulenziali for the Cattolica Previdenza Vita mandate, Lombarda Vita, Risparmio & Previdenza). The other activities include the agricultural-real estate services of Cattolica Agricola and Cattolica Beni Immobili and the operating services of Cattolica Services and Cattolica Immobiliare, instrumental in the performance of the Group’s activities. For an analysis of the result by segment of business, reference should be made to Table 6, where each segment is represented net of the intersectorial adjustments. The notes to the accounts contain tables relating to the operating segments envisaged by ISVAP Regulation No. 7 dated July 13th, 2007 (gross of eliminations between sectors).
Profit for the year
The year closed with consolidated net profit of € 84 million, of which € 46.8 million attributable to the non-life business (€ 40.6 million in 2011), € 36.6 million attributable to the life business (€ 714 thousand loss in 2011), and € 650 t housand pertaining to the “other” segment (€ 2 million in 2011). The Group’s net profit came to € 61.9 million (€ 37.4 million in 2011).
Premiums Gross consolidated premiums (which therefore comply with the definition of insurance policy as per IFRS 4) at the end of the accounting period amounted to € 3,539.1 million. Also taking into account investment contracts, total premiums written came to € 3,676.7 m illion, disclosing a decrease of € 283.9 million (-7.2%) compared with the previous year, attributable to life premiums.
Business performance for the period

38
1,627 1,686
2,319
1,976
15 15 0
400
800
1,200
1,600
2,000
2,400
2,800
2011 2012
Direct Non life premiums Direct Life premiums Indirect premiums (Life and Non life)
Direct Life and Non life premiums, indirect premiums
€/millions
Gross direct non-life premiums totalled € 1,685.4 million, registering an increase of 3.6% and account for 47.8% of total direct premium business (43.2% in 2011). Gross direct life premiums totalled € 1,83 8.4 million (€ 2,136.9 million in 2011); total premiums written amounted to € 1,976 million (-14.8%). Life insurance policies represented the majority share of total direct business (52.2% in 2012 compared with 56.8% in 2011).
Direct premiums written are divided up as follows by sales channel: agencies 47.6%, banks 35.2%, brokers 7%, welfare and pension product advisors 0.3%, financial advisors 0.2% and other channels 9.7%.
1,743
1,289
255 18
356
Agencies Banks Brokers Financial & Pension Advisors Other channels
Direct premiums by channel€/millions
Other administrative expenses
Other administrative expenses amount to € 136.4 million compared with € 135.6 million, essentially in line with the previous year. The ratio of other administration expenses to total insurance premiums written came to 3.7%, compared with 3.4% in 2011, mainly as a result of the drop in premiums written.

Management Report
39
The Group by segments
Non-life business
The non-life business ended the period with net premiums of € 1,374.4 million, compared with € 1,362.1 million last year (+0.9%). The combined ratio net of reinsurance dropped to 95.7%, compared with 96.9% as at December 31st, 2011 and was characterised by the decrease in the claims ratio which fell from 72.7% to 68.8%, despite the negative effects deriving from the earthquake in Emilia Romagna and the decrease in the incidence of other administrative expenses which fell from 6.8% to 6.6% in 2011. Financial operations were characterised by net income deriving from other financial instruments and investment property for € 93.6 million, compared with € 21.8 million in 2011, involving an increase in income on sales which amounted to € 26.6 m illion compared with -€ 1.8 million in 2011, w ith net losses from valuation which rose from € 44.5 m illion to € 6. 1 million and net interest which increased from € 61.8 million to € 68.8 million. The non-life business ended the period with a profit of € 46.8 million, compared with € 40.6 million as at December 31st, 2011.
Life business Life business was characterised by a decrease in net life premiums which fell from € 2,077.4 million to € 1,787.5 million (-14%) and by the result of financial operations5 which improved, passing from € 247 million to € 459.9 million. Financial operations were characterised by net income deriving from other financial instruments and investment property for € 468.1 million, compared with € 252.6 million in 2011, involving an increase in income on sales which amounted to € 63.1 million compared with € 14 .5 million in 2011, with net income from valuation which rose from € -131.9 million to € 6.9 million and net interest which increased from € 351.3 million to € 366.9 million. The life business ended the period with a profit of € 36.6 million, compared with a loss of € 714 thousand as at December 31st, 2011.
Other business The result relating to the other segment at the end of the accounting period came to € 650 thousand, compared with € 2 million in 2011.
Sectors by geographic area
Written premiums, which are taken in Italy, are mainly concentrated in Central-Northern Italy, an area similar in terms of risk and return and therefore not significant for the purposes of the secondary segmentation envisaged by IFRS 8.
Investments Investments which include investment property, equity investments in subsidiaries, associates and joint ventures, loans and receivables, held to maturity investments, available for sale financial assets, financial assets at fair value through profit or loss, cash & cash equivalents and property used for operating purposes), amounted to € 15 ,938.7 million at year end compared with € 15,094.5 million in 2011 (+5.6%). In detail, investment property and properties used for operating activities amounted to € 267.7 million compared with € 176.7 million in 2011; equity investments in Group companies fell from € 103.1 m illion to € 82.2 million (-20.3%), mainly due to the B.P.Vi. Fondi SGR spin-off. Loans and receivables fell from € 1,516.5 m illion to € 1,239.4 million (-18.3%), held to maturity investments amounted to € 287.2 million (in line with December 31st, 2011),
5 With the exclusion of investments whose risk is borne by the policyholders and the change in other financial liabilities.

40
available for sale financial assets rose from € 8,512.2 million to € 9,739.8 million (+14.4%) and financial assets at fair value through profit or loss decreased from € 4,093.2 million to € 3,714.7 million (-9.2%). The result of financial operations, with the exclusion of investments whose risk is borne by the policyholders and gross of the tax effects and the change in other financial liabilities, came to € 542.2 million, compared with € 259.5 million in 2011.
Net income relating to other financial instruments and investment property amounted to € 567.9 million (€ 281 million as of December 31st, 2011), mainly due to the capital losses from valuation for € 21.9 million compared with € 181.1 million as at December 31st, 2011, net income from sales which passed from € 12.8 million to € 89.6 million and net interest which rose from € 410.3 million to € 432.8 million.
Technical provisions
Non-life technical provisions (premiums and claims) amounted to € 3,013.7 million, compared with € 2,956.8 million last year (+ 1.9%).
2,957 3,014
0
500
1,000
1,500
2,000
2,500
3,000
3,500
2011 2012
Non life technical provisions€/millions
Life technical provisions (mathematical provisions inclusive of shadow accounting) totalled €
11,365.7 million, compared with € 11,299 million at the end of the previous year. Also taking into account financial liabilities relating to investment contracts, the technical provisions and deposits relating to life business amounted to € 12,322.5 million, involving a decrease on 2011 of 0.2%.
11.299 11.366
1.004 957
0
3.500
7.000
10.500
14.000
17.500
2011 2012
Life technical provisions Life investment policies
12.303 12.323
Life technical provisions and investment contracts
€/millions

Management Report
41
Life technical provisions include the shadow accounting provision which takes into account the share of latent gains and losses on assets in segregated funds ascribable to policyholders.
Shareholders' equity
Consolidated shareholders’ equity at the end of the accounting period came to € 1, 608.8 million as against € 1,223.5 million in 2011. The Group’s shareholders’ equity amounts to € 1,316.9 million compared with € 1,018.4 million in 2011 (+29.3%) and includes gains on available for sale financial assets amounting to € 64.9 million, compared with losses for € -167.8 million at the end of the previous year. Portions of shareholders’ equity pertaining to minority shareholders amounted to € 291 .9 million compared with € 205 million last year and include gains on available for sale financial assets amounting to € 21.5 million, compared with € -68.8 million at the end of the previous year.
INSURANCE BUSINESS AND OTHER SECTORS OF ACTIVITIES
Summary of the activities carried out by the Group companies
At December 31st, the scope of consolidation comprised the insurance Parent Company, ten insurance companies, four service companies, two companies which carry out agricultural-real estate activities, three real estate property investment funds and one mutual equity fund. During the year, San Miniato Previdenza was merged by incorporation into the Parent Company and Cattolica Business School was merged by incorporation into Cattolica Services. The scope of consolidation includes Fondo Perseide for the first time, a closed-end real estate property mutual investment fund, and the two newcos, Cattolica Agricola and Cattolica Beni Immobili.
Società Cattolica di Assicurazione – Società Cooperativa, which operates throughout Italy in the life and non-life businesses, ideally targeting the medium/high range of the personal segment. It is the Parent Company of the following companies:
Non-life insurance companies
• ABC Assicura, is authorized to carry out non-life business and distributes its products using the network of branches of the Banca Popolare di Vicenza Group. The Parent Company holds 60% of the share capital;
• BCC Assicurazioni, is authorized to carry out non-life business and distributes its products
using the network of branches of the ICCREA Group. The Parent Company holds 51% of the share capital;
• Duomo Uni One Assicurazioni, is authorised to carry out non-life business. Following the
spin-off into Cattolica, which took place in April 2011, the insurance portfolio relating to an agency, the key account policy portfolio and the portfolio relating to indirect business remained with the company. The Parent Company holds 99.99% of the share capital;
• TUA Assicurazioni, carries out insurance activities in the non-life segment, offering the

42
market a sp ecialist range of insurance and financial products/services able to meet the needs of personal line customers. The Parent Company holds 97% of the share capital.
Life assurance companies
• BCC Vita is authorized to carry out life insurance activities and distributes its products via the branches of the ICCREA Group. It is controlled by Cattolica via a 51% holding;
• Berica Vita, is authorized to carry out life insurance activities and distributes its products
using the network of branches of the Banca Popolare di Vicenza Group. The Parent Company holds 60% of the share capital;
• Cattolica Life Limited, is a l ife insurance company with registered office in Dublin,
Ireland, specialised in the structuring of index and unit linked policies by customer segments. The Parent Company holds 60% of the share capital;
• Cattolica Previdenza. The company is authorised to carry out life insurance activities and
non-life activities in relation to just the accident, injury and health classes within the sphere of pension & welfare products and collective assistance. It avails itself of leading brokerage firms, 30 pe nsion and welfare product consultants and, with the launch of C.P. Servizi Consulenziali’s activities, a network of 321 sub-agents. On May 15th, with reference to the provisions originally agreed on, the Parent Company acquired the residual holding of 19.86% from Intesa Sanpaolo Vita thereby achieving complete possession of the share capital;
• Lombarda Vita. The company is authorised to carry out life insurance activities,
distributing them via the network of branches of the UBI Banca Group. The Parent Company holds 60% of the share capital;
• Risparmio & Previdenza, carries out life insurance activities and is active in the non-life
segment, limited to accident and injury and health, in order to offer a complete range of pension and welfare products, availing itself of the branches of the UBI Banca Group, Banca di Torre del Greco and other banks. It is owned by Cattolica which has a holding of 97.58%, following the acquisition in May of a further holding of 2.4% from Banco di Brescia.
Companies of the other segment
Agricultural-real estate property companies
• Cattolica Agricola, was established on September 28th, by Cattolica, the sole shareholder, with initial capital of € 120 thousand fully paid, within the sphere of the purchase of the property complex known as “Tenuta Ca’ Tron”. It is a single-member limited liability company which has the exclusive purpose of carrying out agricultural activities pursuant to Article 2135 of the Italian Civil Code;
• Cattolica Beni Immobili, was established on September 28th, by Cattolica, the sole
shareholder, with initial capital of € 120 thousand fully paid-in, within the sphere of the purchase of the property complex known as “T enuta Ca’ Tron”. It is a si ngle-member limited liability company which is destined to manage the properties not used for

Management Report
43
agricultural activities existing on the land.
Closed-end real estate property funds
• Fondo Euripide, is a cl osed-end real estate property mutual investment fund to which Cattolica Immobiliare transferred all the properties and which, in December, acquired Palazzo Biandrà in Piazza Cordusio, Milan. Cattolica holds an interest of 41.63%, Berica Vita 10.18%, Cattolica Previdenza 2.04%, Lombarda Vita 45.47%, and Tua Assicurazioni 0.68%;
• Fondo Macquarie Office Italy, is a cl osed-end real estate property mutual investment
fund which was wholly acquired by the Group companies. It owns the property complex City Central in Via Lepetit, Milan. Cattolica holds an interest of 61.83%, BCC Vita 10.36%, Cattolica Previdenza 4.14%, Lombarda Vita 17.75%, and Risparmio & Previdenza 5.92%;
• Fondo Perseide, is a m utual fund dedicated to investment in renewable energies. On
October 4th, it acquired the first two photovoltaic plants for a value of € 9.35 million.
Closed-end equity funds
• Fondo Networth, is a closed-end mutual investment equity fund reserved for qualified investors who invests mainly in companies active on the market of energy production from renewable sources. Cattolica has a holding of 99.76%.
Service companies
• Cattolica Immobiliare carries out consulting and management activities for the real estate property assets. On April 1st, the partial, non-proportionate spin-off of B.P.Vi. Fondi SGR into Cattolica Immobiliare was finalised; the latter consequently changed its corporate name intto Cattolica Gestione Investimenti S.p.A.. On May 15th, Cattolica’s Board of Directors approved the partial spin-off project for the spin-off of Cattolica Gestione Investimenti in favour of the same. The transaction, having obtained the necessary authorisations from the competent authorities and the legal deadlines having elapsed, was finalised on December 27th and was effective since December 31st with the consequent return to its previous name. It is wholly-owned by Cattolica;
• Car Full Service, is the Group company dedicated to the development of the products and services linked to the motor industry including the repair activities supporting the settlement of claims. Cattolica Services owns 82%. On December 21st, 2012 a n outline agreement was settled between Cattolica Service, Car Full Service and the minority shareholders of the same; following the finalisation of the same and as from February 28th, 2013, Cattolica, via Cattolica Services, owns 100% of the former Car Full Service (which, as at February 25th, 2013, adopted the name Cattolica Services Sinistri s.p.a.) inclusive of the claims management activities;
• Cattolica Services, a consortium company which carries out service activities for the
Group. A division of the company handles planning, implementation and management of IT applications and operating processes, along with the services relating to telecommunications services; another deals with the settlement of Group claims with the exception of the security, hail and transport areas. During the year it acquired the new division “Fabbrica Life” from the Parent Company. On December 31st it absorbed Cattolica Assicurazioni Business School, a consortium company, set up in November 2010, as a training hub suitable for utilising the skills developed within in favour of all those who

44
work with the Group. Cattolica Services is 99.95% owned by Cattolica, while the remaining investment is held by other Group companies (ABC Assicura, BCC Assicurazioni, BCC Vita, Berica Vita, Cattolica Previdenza, C.P. Servizi Consulenziali, Duomo Uni One, Lombarda Vita, Risparmio & Previdenza and TUA Assicurazioni) to an equal extent (0.005%);
• C. P. Servizi Consulenziali, received an agency mandate in 2011 from Cattolica, Cattolica
Previdenza and TUA Assicurazioni. As from May 2012, besides the life business solely under Cattolica Previdenza mandate, it carries out non-life premium business activities (with TUA and Cattolica products) also availing itself of sub-agents, previously welfare and pension fund advisors, of Cattolica Previdenza. It is 51% owned by Cattolica and 49% owned by Cattolica Previdenza.

Management Report
45
Insurance business
Insurance premiums are shown in the table below, with indication of the percentage in relation to total direct business and percentage changes as compared with the previous year, together with investment contracts.
Table 8 - Total premiums written
Classes Changes
(€ thousands) 2012 % of total 2011 % of total Abs. amount % 01 - Accident and injury 124,503 3.5 131,755 3.5 -7,252 -5.5
02 – Health 97,656 2.8 101,935 2.7 -4,279 -4.2
03 - Land vehicle hulls 107,653 3.1 109,761 2.9 -2,108 -1.9
07 - Goods in transit 6,165 0.2 6,612 0.2 -447 -6.8
08 - Fire & natural forces 106,598 3.0 112,415 3.0 -5,817 -5.2
09 - Other damage to assets 139,631 4.0 123,314 3.3 16,317 13.2
10 - TPL - Land motor vehicles 868,158 24.6 817,175 21.7 50,983 6.2
13 - TPL –General 157,594 4.5 144,058 3.8 13,536 9.4
14 – Credit 797 n.s. 424 n.s. 373 88.0
15 – Suretyship 12,408 0.4 13,233 0.4 -825 -6.2
16 - Sundry financial losses 24,596 0.7 28,505 0.8 -3,909 -13.7
17- Legal protection 11,293 0.3 11,835 0.3 -542 -4.6
18 – Assistance 24,856 0.7 20,830 0.6 4,026 19.3
Other classes (1) 3,536 n.s. 4,917 n.s. -1,381 -28.1
Total non-life classes 1,685,444 47.8 1,626,769 43.2 58,675 3.6
Insurance on the duration of human life - class I 1,307,649 37.1 1,351,931 35.9 -44,282 -3.3 Insurance on the duration of human life linked to investment funds - class III 199,799 5.7 379,197 10.1 -179,398 -47.3
Health insurance - class IV 44 n.s. 89 n.s. -45 -50.6
Capitalisation transactions - class V 318,686 9.1 393,316 10.5 -74,630 -19.0
Pension funds - class VI 12,244 0.3 12,403 0.3 -159 -1.3
Total life classes 1,838,422 52.2 2,136,936 56.8 -298,514 -14.0
Total direct business 3,523,866 100.0 3,763,705 100.0 -239,839 -6.4
Indirect business 15,204 14,563 641 4.4
Total insurance premiums 3,539,070 3,778,268 -239,198 -6.3 Insurance on the duration of human life linked to investment funds - class III 3,675 2.7 18,505 10.2 -14,830 -80.1
Pension funds - class VI 133,925 97.3 163,761 89.8 -29,836 -18.2
Total investment contracts 137,600 100.0 182,266 100.0 -44,666 -24.5
TOTAL PREMIUMS WRITTEN 3,676,670 3,960,534 -283,864 -7.2
n.s. = not significant (1) includes railway rolling stock, aircraft, sea and inland water vessels/hulls and TPL aircraft and sea and inland water vessels.
In particular, life premiums written are divided by insurance class (taking account of both
insurance premiums and investment contracts) as follows:

46
Table 9 – Life premiums written
Life business Changes
(€ thousands) 2012 % of total 2011 % of total Abs. amount % Insurance on the duration of human life - class I 1,307,649 66.2 1,351,931 58.3 -44,282 -3.3 Insurance on the duration of human life linked to investment funds - class III 203,474 10.3 397,702 17.1 -194,228 -48.8
Health insurance - class IV 44 n.s. 89 n.s. -45 -50.6
Capitalisation transactions - class V 318,686 16.1 393,316 17.0 -74,630 -19.0
Pension funds - class VI 146,169 7.4 176,164 7.6 -29,995 -17.0
Total life premiums - direct business 1,976,022 100.0 2,319,202 100.0 -343,180 -14.8
n.s. = not significant
Non-life business – written Premiums
Direct non-life premiums written rose from € 1,626.8 million to € 1,685.4 million, disclosing an increase of 3.6%. Indirect premiums rose from € 14.5 million to € 15.1 million, (+4.5%).
The trend in non-life premiums written saw growth of 5.3% in the motor classes and 1.4% in the non-motor classes: in detail; premiums relating to other damage to assets increased, amounting to € 139.6 million (+13.2%), along with those relating to general TPL which totalled € 157.6 m illion (+9.4%) and those relating to assistance amounting to € 24.9 m illion (+19.3%).
817
110 144 123
868
108 158 140
0
100
200
300
400
500
600
700
800
900
1,000
TPL - Land motor vehicles Land vehicle hulls TPL-General Accident and injury
2011 2012
Main Non life classes, direct premiums€/millions
Direct non-life premiums written were generated as follows: the agency channel with € 1,523.4 million (+4.1%), the banking channel with € 46.2 million (-12.3%), brokers with € 83.1 million (+48.7%), welfare and pension product advisors with € 4 thousand and other channels with € 32.7 million (-39.5%). Non-life premiums attributable to the Parent Company totalled € 1,4 68.3 million, € 19. 1 million to ABC Assicura, € 19.5 million to BCC Assicurazioni, € 1.1 m illion to Duomo Uni One, € 158.4 million to TUA Assicurazioni, in addition to accident/injury and health premiums written by the companies Cattolica Previdenza and Risparmio & Previdenza amounting to €

Management Report
47
15.5 million and € 3.5 million respectively.
Non-life business - R&D activities: new products
Within the framework of the progressive renewal of the product catalogue and the standardisation of the same at Group level, the following activities were carried out. The Parent Company During the year, marketing commenced of new products within the retail and corporate sphere: Retail products ”Cattolica&Salute INFORTUNI” was launched in March with innovative coverage for the accident/injury market and again with the retail sphere “Cattolica&Famiglia”, a new line of clear, simple and immediate products, so as to protect the main areas of the personal and family sphere at a contained cost. Corporate products During the Spring, “Cattolica&Impresa INDUSTRIA” was launched, the new Group product dedicated to small and medium-sized industrial companies, conceived to help the various local manufacturing entities and further enhance the link between the Group and the business world and to develop the area in which they operate. The new “Cattolica&Professionisti RC TECNICI, PROGETTISTI AGRONOMI E FORESTALI” policy came out in October, in order to more fully satisfy the different insurance needs of professionals who operate in agronomic/forestry section by means of simple and adaptable solutions. The year ended with the launch of “Cattolica&Impresa ARTIGIANO E PICCOLA INDUSTRIA” which completes the Group’s range dedicated to the segment of manufacturing businesses.
ABC Assicura During the year, the company consolidated the personal line range of products already on sale within banks, taking steps to overhaul part of the existing catalogue and introducing five new products: • a specific product for mortgages taken out in the past so as to meet the insurance needs of
customers for the event linked to demise, disability and loss of employment. The product was created in collaboration with Berica Vita;
• a multi-risk family policy, to protect the family from serious events which may affect them and which comprises, in a single solution, the following coverage: reimbursement of major surgery, third party liability in private life and legal protection;
• a multi-risk home policy which is intended to cover risks pertaining to the home. The product is not linked to the disbursement of loans and has been developed in complementary units which can be chosen by the customer providing protection for one’s properties, with maximum flexibility and completeness;
• a policy, which is the first health product of ABC Assicura, which envisages a daily convalescence allowance. A simple product with regard to coverage and particularly abundant in terms of protection which proposes an indemnity in the event of hospital stays

48
which may compromise the ability to generate income for a freelance workers or which have eroded the resources of the household in the event of a dependent employee.
Placement of the product “CREDITOR PROTECTION CARTE DI CREDITO” under contract with Compass s.p.a was launched by Banca Popolare di Vicenza and Banca Nuova and particular attention was dedicated to the study and development of the pharmacy multirisk product, a product with a wide range of specific coverage for this commercial category.
BCC Assicurazioni During 2012, the Company made a number of changes envisaged by ISVAP Instruction No. 2946/2011, in force as from April 2nd, 2012, on t he following products: “Formula Fotovoltaico”,“Pro Fabbricato”,“Pro Agricoltura”,“Pro Agriturismo”, “Pro-Artigianato”, “Pro Commercio” and “Formula Domus”. Other changes were made to ““Socio in salute”, a new product which offers the shareholders of the lending co-operative different forms of protection linked to the family sphere in one single package. This policy offers the subscribers three important types of coverage such as the reimbursement of health costs due to important surgery, the protection of property from damage caused to third parties and support for sorting out legal matters linked to major surgery.
TUA Assicurazioni In January, TUA Assicurazioni launched the new policy “TUA Salute MAXXI”, aspiring to the French GAV, which provides wide coverage in the event of serious disability or demise. In July, the “TUA Famiglia” product, a head-of-the-household TPL and multi-risk for the home policy, was overhauled and modernised: inclusion of new and exclusive coverage (stalking, protection of personal data on the internet and assistance for electrical household appliances) and definition of a number of made-to-measure solutions for the various types of homes which aimed to facilitate and speed up the activities of the financial advisor (despite maintaining the possibility of intervening intact, varying the insured amounts, limits and coverage). In conclusion, during the second half of the year, the “TUA Professione” solution was extended by including among the options third party and administrative/accounting liability of public employees.
Life business - Premiums
Direct life business premiums came to € 1,838.4 million and indirect life premiums totalled € 101 thousand. Premiums relating to investment contracts amounted to € 137.6 million. Total direct life premiums written amounting to € 1,976 million, were down by 14.8% when compared with the € 2,319.2 million at the end of 2011. The life segment disclosed a decrease in premiums written for traditional type contracts which, in a situation of heavy competition on t he returns offered by other alternative forms of investment, saw their appeal decrease. The trend in premiums for linked products, especially index linked products disclosed renewed interest from investors who show preference for coupon flows and who are heedful of the

Management Report
49
variable return mechanism linked to the performance of one or more reference indexes. The attention which the Group pays to the pension and welfare component has led to the development of accumulation plans and supplementary welfare products. Direct life business premiums were generated by the agency channel with € 220 million (+0.8%), the banking channel with € 1,243.1 million (-19.6%), brokers with € 171.8 million (-20%), pension and welfare product consultants with € 11.5 million (-71.4%), financial advisors with € 6.4 million and other channels with € 323.2 million, mainly represented by pensions funds (+20.3%). Life premiums attributable to the Parent Company totalled € 612.5 million (€ 644.8 million in 2011), BCC Vita € 184.7 million (€ 190.5 million in 2011), Berica Vita € 198.1 million (€ 282.5 million in 2011), Cattolica Previdenza € 110.8 million (€ 85.3 million in 2011), Lombarda Vita € 705.7 million (€ 893.3 million in 2011), Risparmio & Previdenza € 18.9 million (€ 35.1 million in 2011) and Cattolica Life € 145.3 million (€ 187.7 million in 2011).
In class I (insurance on the duration of human life), the Group recorded a decrease in insurance
premiums from € 1,351.9 million to € 1,307.6 million (-3.3%). This result was affected by the heavy competition on returns offered by other alternative forms of investment which benefited from the significant growth in returns on government securities. Total Class III premiums written amounted to € 203.5 million, compared with € 397.7 million in 2011. Premiums for linked products, especially index linked products, as already reported, were met with enthusiasm by investors who show preference for coupon flows and who are heedful of the variable return mechanisms linked to the performance of reference indexes. Total Class V premiums written (capitalisation) amounted to € 318.7 million, compared with € 393.3 million in 2011. No investment policies were issued during the year. Class VI premiums written (pension funds) decreased from € 176.2 m illion to € 146.2 million, due primarily to investment policies from € 163.8 million to € 133.9 million.
1,352
398 393
176
1,308
203
319
146
0
200
400
600
800
1,000
1,200
1,400
1,600
1,800
2,000
Class I Class III Class V Class VI
2011 2012
Main Life classes, direct premiums€/millions

50
Life business - R&D activities: new products
During the year new Class I products were marketed, of which 18 for the Parent Company, 1 for Lombarda Vita, 5 for Berica Vita and 4 for Cattolica Previdenza. With regard to the range of capitalisation products, a new class V product was created for Lombarda Vita. With regard to Class III products, two single premium unit-linked products were developed for Lombarda Vita: one addressing retail-type customers linked to a single internal flexible fund, the other by contrast dedicated to mass affluent customers and linked to 58 external funds. The catalogue was extended, creating products specifically dedicated to customer insurance, protection and savings/investment needs.
Parent Company, Cattolica Previdenza, Lombarda Vita and Risparmio & Previdenza Product activities were focused on the consolidation of that already achieved in the previous year, while product innovation specifically concerned the segment of protection, savings and investment products, by means of the restyling of the current products and the development of a new model for approaching the segment business linked to both investment and protection coverage, working on new insurance solutions. Furthermore, given the current situation of the markets and in line with the matters envisaged by the strategic business plan, long-term investment products were developed which pay out a minimum guaranteed annual rate of return exclusively when maturing and nil redemption penalties for “welfare” reasons”. In detail, the insurance offer placed by the Parent Company’s agency distribution network was expanded with the development of three Class I products, created with the purpose of offering a competitive mix of products in the catalogue. In fact, three mixed insurance products with single premium and annual revaluation of capital and additional benefit in the event of death have been created; one of these offers scheduled benefits each year under the form of payment coupons so as to permit the planning of the financial flows of the product subscriber. With regard to the banking network of the Parent Company and the other subsidiary companies, as well as the network of welfare and pension product advisors and insurance brokers, the insurance range saw the development of new Class I products of various types: • three mixed insurance products with single premium and annual revaluation of capital and
additional benefit in the event of demise; • one single premium insurance product with deferred capital which also envisages the
payment of a bonus on maturity; • two mixed insurance products with single premium which annually make a scheduled pay
out in the form of a coupon and which provide benefits which can be revalued on maturity, as well as additional benefits in the event of demise;
• two temporary insurance products for the event of demise: one with capital and constant annual premium following demise due to accident; the other with decreasing capital and a limited constant annual premium;

Management Report
51
• a temporary insurance in the event of demise with decreasing capital and a single premium. With a view to completing the range dedicated to protection, in conclusion a specific product has been developed with a constant annual premium dedicated to the coverage of the risk of non-self sufficiency (so-called long term care). The range of Class V products for the banking network saw the creation of a product with a sole premium and additional single premiums which makes it possible to establish capital which can be revalued annually in relation to the return obtained from the internal segregated fund which the policy is linked to. Various capitalization products have been developed dedicated to investors-institutional contracting parties, which makes it possible to establish capital which can be revalued annually in relation to the return obtained by the internal segregated fund; in this case as well, the company guarantees a minimum return and the consolidation of the revalued capital. Furthermore, numerous insurance products were created for the sales networks of the Parent Company, linked to the funding of loans and other financing agreements with related insurance coverage in the event of demise and other events; for such purposes, temporary insurance in the event of demise with decreasing capital was developed for which the company, in the event the insured party dies during the terms of the contract, undertakes to settle the envisaged insured sum on the beneficiaries. Towards the end of the year, steps were taken to up-date the product catalogue for the entire Cattolica Assicurazioni Group, with the aim of adapting it to the matters envisaged by Directive 2004/113/EC, which establishes the general principle of equal treatment of men and women in the insurance sphere and prohibits any form of discrimination based on gender when accessing and supplying goods and services.
BCC Vita This insurance company continued the activities carried out in 2012 studying traditional Class I insurance solutions linked to the situation of the financial markets with the issue of products with specific funding of the assets, which in a second phase of the product will rejoin the BCC Vita Garantita separate fund. These products will permit a saving for the purpose of both the safety of the capital and the payment of the coupons. During the year, with regard to individual products, the insurance company issued: • “BCC Vita - Concreta. 5/2012 & 6/2012”, products with specific funding of assets, full life
single premium with insurance in the event of demise, with coupons for a pre-established amount, annual revaluation of the capital for the period and an additional pay out in the event of demise;
• “BCC Vita - Concreta. 10/2012 5 anni" and "BCC Vita - Concreta. 10/2012 3 anni" , products, created as per the specific funding of assets formula with underlying Iccrea Banca bonds; these are insurance products for the event of demise with full life single premium, with coupons for a pre-established amount until the end of the third or fifth year (first phase), annual revaluation of the capital for the subsequent period (second phase) and an additional pay out in the event of demise;

52
“BCC Vita - Concreta. 12/2012 4 anni" , a product, again structured as specific funding of assets with an underlying Iccrea Banca bond; this is an insurance product for the event of demise with full life single premium, with coupons for a pre-established amount until the end of the fourth year (first phase), annual revaluation of the capital for the subsequent period (second phase) and an additional pay out in the event of demise; With regard to collective products, the company launched “Protezione Fido”, a product which provides coverage for the event of demise and total disability. The premium is once a year. This product is intended to cover bank credit facilities (opening of current account credit, advances on invoices and collection with due reserve) care of Banche di Credito Cooperativo.
Berica Vita The line dedicated to protection, savings and investments was enhanced, creating five new products: • three full life policies in the event of demise featuring a single premium and additional
single premiums, with revaluation and an additional benefit in the event of demise; • a mixed insurance product with single premium and additional single premiums with annual
revaluation of capital and additional benefit in the event of death; • a temporary insurance in the event of demise with decreasing capital and a single premium.
Cattolica Life During the year, the insurance company concentrated on the marketing of the “Ensemble” and “Nova Ensemble” products, unit-linked insurance proposals which offer customers the possibility of allocating the conferred capital to a basket made up of five different investment proposals. Diversified in terms of risk profile, the solutions range from protection of the capital to the search for high returns of mainly share-based funds. The structured funds with a return target for the networks of Banca Popolare di Vicenza and Banca Nuova numbered 8 in 2012. These are joined by two funds destined for distribution via the branches of Cassa di Risparmio di San Miniato. The company also took steps to enhance its catalogue with a new unit-linked policy with single premiums known as “Duet European Equity” which will be made available for placement as from January 2013.
Reinsurance
Non-life business The Parent Company’s reinsurance programme maintained a standardised structure in line with that last year. Reference continued to be made to a programme of proportional transfers with the complementary nature of optional transfer where necessary. The residual retained portion of each class was further protected by claim excess coverage against the occurrence of both insured events of a significant amount and catastrophic events. With regard to TUA Assicurazioni , t he transfer programme for 2012 is made up of a

Management Report
53
proportional transfer for the main classes, net of the optional transfers, with residual retention protected by claim excess agreements. With regard to the bank-assurance companies ABC Assicura and BCC Assicurazioni , the transfer programme for 2012 is made up of a proportional transfer for the main classes, net of the optional transfers, with residual retention protected by claim excess agreements vis-à-vis the Parent Company with subsequent retrocession to reinsurers for all the classes except; assistance, legal protection, general TPL for pollution, which are transferred to reinsurers specialised in these classes. The renewal of the agreements relating to the coverage of the following risks completes the reinsurance programme: loans against salaries for employees, health risk, accident & injury, loss of employment associated with the disbursement of loans and mortgages. With regard to Cattolica Previdenza, the reinsurance programme comprises claims excess coverage for the accident and injury class (for risk and catastrophe) and health. With regard to the coverage for reimbursement of medical costs in the health class, proportional coverage has been provided in addition to the excess agreement. Life business The individual policy segment is reinsured for the risk of demise, via a r isk excess structure which envisages the transfer of the life risks on a proportional basis. The collective policy segment is reinsured for the risk of demise, via a quota-related agreement, whose retention is covered by a specific claim excess agreement. For both the cases indicated above, the residual retention is protected by adequate claim excess catastrophe coverage. Agreements relating to the coverage of the following completes the life reinsurance programme: • risk of non-self sufficiency (long-term care); • loans against salaries for employees and pensioners; • risk of demise associated with disbursement of loans and mortgages.
***** Dealings with reinsurance companies which present the best prospects of continuity over the long-term have been preferred for all the Group companies. When selecting the partners, particular attention was paid to the solidity and reliability of the same, directing the choice towards those with the best rating (minimum Standard & Poor’s “A-” or equivalent) or those less exposed, in the composition of the portfolio, to risk categories liable to technical-economic imbalances. When defining the reinsurance programme, all the Group companies followed the provisions of the outline resolution concerning outgoing reinsurance in pursuance of Article 3 of the ISVAP circular No. 574/D dated December 23rd, 2005. The boards of directors of all the companies approved the structure and the transfer plan for 2012, in February.

54
FINANCIAL AND ASSET MANAGEMENT
Investment property and properties
While Europe remains the centre of the current financial crisis, the main markets of the UK, France and Germany reported an increase in investment activities on the property market, thanks in part to their ability to attract international investors who are well-known for preferring long-term prime assets on strategic markets.. This situation contrasts with the drop in volumes of transactions on m arkets undergoing expansion such as Poland, where suitable products are scarce. Transactions in southern Europe by contrast were limited (source JLL). In this context, the Italian property market was characterised by a constant outflow of foreign capital and by the fence sitting of Italian institutional operators attributable to the protraction of the recessionary prospects, as well as the prohibitive conditions for accessing credit. Going against the market trend, the Cattolica Group once again began to invest in the property market, further enhancing its portfolio. Acquisitions and other property transactions With reference to the purchase of the property complex known as “Tenuta Ca’ Tron”, as per the agreement entered into on March 12th between Cattolica and the Fondazione Cassamarca, on June 8th ISVAP authorised the formation, by the Parent Company, of two new single-member limited liability companies.
177 268 103 82
1,517 1,240
286 287
8,512
9,740
4,093 3,715
407 607
0
2,000
4,000
6,000
8,000
10,000
12,000
2011 2012
Investment Property and property Investments in subsidiaries, associates and joint venturesLoans and receivables, cash and cash equivalents Held to maturity investmentsAvailable for sale financial assets Financial assets at fair value through profit or lossCash and cash equivalents
Investments €/millions

Management Report
55
On September 28th, with initial capital of € 120 thousand fully paid-in, Cattolica Agricola was established, which has the exclusive purpose of carrying out agricultural activities pursuant to Article 2135 of the Italian Civil Code, and Cattolica Beni Immobili, destined to manage the properties not used for agricultural activities existing on the estate. On October 9th, the two companies resolved an increase in their share capital, respectively to € 35.5 and to € 7 m illion, for the purchase of assets instrumental to their business activities: the increase was fully subscribed by the sole shareholder Cattolica, which took steps to make payment on October 11th. By means of deed dated October 15th the afore-mentioned companies, appointed to do so by the Parent Company, entered into notarial deeds with the Fondazione Cassamarca relating to the estate properties, for a total equivalent value of € 76 million, of which € 35.5 million paid by Cattolica Agricola for land and agricultural properties and € 7 million paid by Cattolica Beni Immobili for properties not used for business purposes. The payment of the residual amount will take place in two instalments on December 31st, 2013 and 2014. Under the terms agreed by means of agreement dated October 10th and with a value date as at October 26th, the newco reimbursed the Parent Company for the sums that it previously paid out to the seller by way of confirmatory down payment, for a total of € 5 million. On December 14th, the Parent Company entered into a binding agreement for the purchase of Palazzo Biandrà located in Piazza Cordusio, Milan, acquired on December 21st, under abeyance condition (which as of the date of the Board meeting for the approval of Cattolica’s financial statements had not yet come about), for a price of € 100 m illion, via Fondo Immobiliare Euripide, managed by Finanziaria Internazionale Investments SGR, and subscribed pro rata by the Group companies. Property which will be used for business activities Work launched in December 2011 w as completed on the renovation of part of the property complex of the offices originally intended for residential use. Disposals No property disposals were carried out during the year.
Stock investments
Investment activities were carried out within a particularly delicate and volatile context: confidence in the first quarter, linked to the approval of the extraordinary measures by the European Central Bank and the improved economic forecasts, disappeared in mid-year, when the tension at political level and the fears of a possible break up of the Euro area brought the markets to all-time lows. From the third quarter onwards, a se ries of agreements between heads of state on a g reater integration between the Eurozone nations and the renewed support of the European Central Bank by means of extraordinary measures, made it possible to achieve considerable and lasting recovery until year end. Activities were characterised in any event by the maintenance of adequate liquidity levels which

56
made it possible to flexibly deal with the volatility registered during the period, at the same time maintaining a high level of coherence with the financial durations expressed by asset and liability management. During the year, exposure with regard to Italian government issues increased, in particular fixed rate and linked to inflation, benefiting from the evident pick up in the second half of the year. With regard to bonds, it was also possible to seize interesting opportunities offered by the underwriting of securities associated with industrial issuers, while the easing of issues attributable to financial issuers continued. With a view to portfolio diversification, the component invested in the property segment increased. The recovery of the stock markets made it possible to further rationalise the exposure within the segment, with the reduction of positions no longer considered strategic in favour of securities more in keeping with a logical of guaranteeing high returns in terms of dividend payments. The portfolio is denominated principally in Euro. Issuers place products primarily in Europe, and to a lesser extent in the United States. However, many issuers presented an elevated geographic diversification within the sphere of operations, for the purpose of reducing recession risks as far as possible.
Performance in the 4th quarter
The Group result as of December 31st, benefited from a positive contribution in the fourth quarter for € 21 million, while the consolidated result in the same period came to € 33 million.
Latent capital gains and losses
At the end of the year, latent capital gains net of tax effects were recorded on held to maturity investments for € 6.1 m illion, along with latent capital losses net of tax effects on the portfolio valued at amortised cost for € 45.2 million, relating to bonds and other fixed-income securities. Said capital losses were not deemed permanent losses in value. The overall fair value of the held to maturity investments and loans and receivables as o f December 31st, amounted to € 1,467 million. Net of the tax effects on properties and on investment property, latent capital gains - on the basis of estimates made by appointed outside experts - totalled € 15.6 million. The overall fair value of property and investment property came to € 291.5 million.


Management Report The Group in 2012 Business performance for the period Risk management Employees and sales network Significant events and other information


Management Report
61
RISK MANAGEMENT
These activities are carried out by the Risk Management Division, which will be dealt with in the section “Internal controls”.
INSURANCE RISK – NON-LIFE BUSINESS
Risk concerning tariff rating, proposal selection and the reservation process
The motor and elementary classes tariff divisions, located within the Group’s Non-Life Actuarial service, put together tariffs on technical bases referable to company or market data and appropriate safety loads in line with the levels of capital absorption and combined ratio target. The need to review the existing tariffs or those drafted are indicated in management control reports and requests from the divisions (class). When achieving their mission, each Group company must guarantee its own stability and soundness, ensuring a satisfactory risk/return ratio. So as to limit the volatility of the risk undertaken in favour of equity soundness, the Group uses common risk selection and assumption policies, and defines a re-insurance structure so as to reduce the variable nature of the portfolio results within set limits. Within the sphere of the assumptive policies, particular attention is paid to the risk concentrations relating to acquired portfolios; specifically, with reference to disaster risks (earthquakes and floods), the risk plurality is monitored, divided up by territorial area and measured by means of the amounts insured and the compensation limits, so as to quantify the overall exposure. So as t o determine the foreseeable charges for claims, the results of the inventory for the classes with a slow settlement process are flanked by statistical-actuarial type methods, based on the analysis of the historic data. The latter represents the information flow necessary for the definition of the hypothesis on w hich the method structures used are based, with particular reference to the development of the average cost and the rate of inflation endogenous to the claims. Simulations are periodically carried out on these variables in order to estimate the effect of the same on the reserve, also checking the consistency with the choices adopted for the annual financial statements. In order to optimise the process for the correct reservation at last cost of the claims, particular attention was paid to the analysis and monitoring of the claims pointer.
Credit risk
The Group has adopted a prudent re-insurance and joint-insurance policy in the non-life segment with third-party delegation, showing preference for re-insurers and delegates with an adequate rating. No significant losses due to insolvency have been reported.
Risk management

62
Table 10 – Group exposure to re-insurers by rating category
Rating (€ thousands) exposure % of total
AAA 94,742 16.8
AA+ 9,913 1.8
AA 2,655 0.5
AA- 43,265 7.7
A+ 177,265 31.4
A 24,663 4.4
A- 25,492 4.5
BBB+ 63,511 11.3
BBB+* 85,416 15.2
BBB 26,676 4.7
BBB- 7,134 1.3
Not rated 2,933 0.5
TOTAL 563,664 100.0
* Associated with a public body
Mismatching risk
Due to the singularity of its process which sees the payment of the premiums (revenues) prior to the sustaining of the claims (costs), the non-life insurance business is characterised by a necessary correlation between assets and liabilities. The investments covering the non-life business technical provisions have the purpose of optimising the risk/return profile, taking into account the timing profile of the obligations vis-à-vis the policyholders, within a context of joint management of the assets and the liabilities.
INSURANCE RISK – LIFE BUSINESS
Risk concerning tariff rating, proposal selection, mortality/ longevity/ invalidity and the reservation process
For the determination of the pure premiums of the life assurance tariff rates, the Group insurance companies adopt prudent hypotheses in terms of population tables and financial guarantees given. The tariffs are periodically updated in order to take account of changes in the mortality of the Italian population or that of the outstanding portfolio and the change in the interest rates. This permits on-going adaptation to the demographic and financial evolution, as well as an y timely adjustments to sudden changes in said factors. If appropriate, additional provisions are provided for the pre-existing portfolio, which cover any changes for the worse in the hypotheses adopted at the time of tariff rating. The products placed by the Group’s insurance companies, in particular those where the pure risk component is significant, envisage assumptive methods structured on t he basis of the personal characteristics of the policyholders and the guarantees given. This limits any anti-selection phenomena. The life business insurance risks are demographic type risks (risk of mortality, longevity and invalidity), risk of insufficiency of first-order bases with respect to the costs of portfolio management (expense risk) and risk of early cancellation of the policy portfolio (redemption

Management Report
63
risk). The mathematical provisions are determined by using the first-order technical bases, in other words those used for the calculation of the pure premiums, in compliance with Italian accounting standards. So as to deal with any insufficiency (estimated on the basis of simulations of scenarios relating to the dismantling of the reference portfolios due to deaths or redemptions and to the propensity towards exercising the life annuity options on maturity) of the population and technical bases with respect to the guarantees given and commitments, additional provisions are provided, if necessary. On a yearly basis, the effective deaths are compared with those anticipated by the population bases adopted for the calculation of the pure premiums of the tariffs placed. Over the last few accounting periods, the effective mortality - with reference to portfolios with prevailing mortality risk - in total did not exceed 50% of the predicted amount, estimated using updated population bases, with possible mortality peaks due to non-recurrent and statistically insignificant events. The technical hypotheses, such as the propensity towards exercising the contractual options (for example: maturity and return), the mortality incidences, the exercise of early redemptions, are adopted on the basis of the time series detected on the portfolios of the insurance companies and by means of a comparison with the available market data. Such hypotheses are subsequently corrected as a r esult of qualitative valuations, such as t he analysis of the commercial agreements with the placers, the legislative amendments and the type of the new products being placed. The international accounting standards envisage that the insurance companies assess the adequacy of their insurance liabilities, recording any deficit in the income statement. Accordingly, the liability adequacy test verifies whether the provisions are adequate for covering the future cash flows relating to financial insurance policies with Discretionary Participation Features, according to hypotheses which define the scenario considered to be the best and most consistent for the representation of the corporate situation. The analysis performed reveals the suitability of the Group’s insurance liabilities as at December 31st, 2012. This result is confirmed both at individual insurance company level and at aggregate level. Therefore no integration of the provisions was necessary according to the liability adequacy test.
Credit risk The Group has adopted a prudent re-insurance and joint-insurance policy, showing preference for re-insurers and delegates with an adequate rating. No significant losses due to insolvency have been reported.
Mismatching risk
Due to the singularity of its process which sees the payment of the premiums (revenues) prior to the sustaining of the services (costs), the life insurance business is characterised by a necessary correlation between assets and liabilities. This implies a potential mismatching risk which is dealt with by means of Asset and Liability Management techniques, thanks to which the Group adopts policies for the investment of the assets covering the provisions linked to the duration and the return. The technical provisions are influenced by the interest rate trends. So as to deal with the risk

64
of insufficiency of the interest rates, additional provisions are provided in accordance with Italian legislation which requires simulations of the performance scenarios of the interest rates and hypotheses on the strategies of re-investment or sale of the assets covering the mathematical provisions. The financial hypotheses, such as the interest rate curves or the strategies adopted for reinvestment purposes, are adopted on the basis of interest rates published by leading financial providers and the comparison between the durations of assets and liabilities within an ALM context. By means of the latter process, in its various forms, the Group controls the liquidity and mismatching risk, in relation to the residual contractual obligations.
Sensitivity / disclosure risk analysis
The hypotheses adopted in the various assessments and estimates are usually modified so as to check the impact on the valorisations and eventually gain indications for subsequent strategies. In particular, scenarios concerning positive and negative shocks regarding the interest rates, change in the propensity towards the exercise of the options on maturity, change in the recourse to early redemptions, changes in the mortality of the policyholders and change in the spending hypotheses for the management of the policy portfolio, are adopted. In detail, within the context of the liability adequacy test, sensitivity analysis is performed on the main risk factors with an impact on the valuation of the liabilities. The scenario of best estimate hypotheses, adopted as the basis for the determination of any deficit to be recorded in the income statement, is changed by adopting a second scenario of worst case hypothesis for all the risk factors considered potentially significant. With reference to market risks, both a variation of the foreseeable return rates of the benefits and the change in the risk free curve used for the discounting of future cash, are simulated. In relation to the analysis of the population risks, fundamentally the mortality and longevity risk, mortality tables or survival tables increased to the extent of 10% are adopted. The hypotheses of propensity towards redemption are modified by 50%, up or down on a differentiated basis for sub-portfolios with a view to prudence. Lastly, a deterioration hypothesis of 10% of the annual operating costs for the policy portfolio is adopted. The measurement of the shocks adopted is based on similar worst-case scenarios adopted at the time of market analysis carried out within a context of the Solvency II Quantitative Impact Studies. The valuation of the liabilities obtained in this second prudent scenario makes it possible to estimate the reduction in the adequacy margin of the liabilities, or the eventual deficit which should be recorded in the income statement, if the extreme shock hypotheses simulated on all the significant risk factors were to be achieved at the same time. The adequacy of the Group’s insurance liabilities as of December 31st, has been confirmed.
MARKET RISK
Risk management activities relating to investments are aimed at identifying, assessing and controlling market risks, or the probability of suffering losses due to: • changes in financial market conditions (interest rates, share prices, credit spreads,
exchange rates, etc.); • misalignments between the timing profiles of assets and liabilities; • unforeseen liquidity requirements that call for the liquidation of portfolios of assets, in
order to preserve the solvency of the Parent Company and companies in the Group.

Management Report
65
The basis of the control system is defined by the outline resolutions approved by the Boards of Directors which discipline the investment activities of the individual Group insurance companies. Specifically, each resolution contains a definition of the qualitative and quantitative limits of the investments for each type of financial instrument, distinguishing between life classes, non-life classes and unrestricted equity. The management of the securities portfolio is carried out in part within the Group and in part by professional outside managers. In the latter case, the management appointments are granted in line with the investment limits established by the Boards of Directors in the outline resolutions, in order to guarantee consistency, correctness, prudence and observance of the legislation in the asset management policies. The close collaboration between the divisions tasked with managing the assets and liabilities of each insurance company, guarantees continual attention towards the objectives of optimising and stabilising the operating results and represents the basis for the adoption of the financial and commercial management strategies.
Interest rate risk
The Group’s investment policy is focused on the optimisation of the management results and on the reduction of the volatility of the same, taking into account the Asset and Liability Management requirements. During the first half of the year, the extraordinary liquidity manoeuvres of the European Central Bank led to the government component outweighing the rest, given the sharp squeeze of the spreads on the Italian curve. However, as from the second quarter, the deterioration of the European financial crisis significantly increased the risk premiums and the volatility on all the asset classes, suggesting that liquidity in the portfolio should be kept exceptionally high. At the end of June, coinciding with the Euromeeting and the decision of the ECB to launch extraordinary rescue programmes, the decision was made to constantly increase the Italian government component in the portfolio, with a gradual extension of the duration, proportionally reducing the trading activities on the majority of the investments. The most significant component is attributable to Italian government securities, while the rest of the portfolio is diversified by sector and issuer so as to obtain returns compatible with the coverage provided to the policyholders. In particular, within the life sector the time mismatching is monitored between the liabilities due to policyholders (provisions) and the covering assets, taking into account the fact that the liabilities incorporate guaranteed minimums. The Group uses a procedure to manage the exposure to interest rates which considers:
• the assets pertaining to each segregated management fund and all the associated future flows;
• the liabilities represented by the aggregation of the policies outstanding per individual tariff and by the recurrent premiums which they will develop.
The system, having set the interest rate scenario variables, simulates the annual return of the segregated life management fund, taking into account both the stripping of the liabilities and any re-investments of the liquidity generated by the financial assets. In order to illustrate the Group’s exposure to interest rate risk, steps were taken to make a stratification of the portfolio by maturity. The analysis below shows that the portfolio is

66
almost 50% invested in securities with a maturity of less than 5 years and cumulatively around 80% invested in securities with a maturity of less than 10 years.
The table below and the subsequent ones contained in this section, do n ot include the investments associated with index or unit-linked policies and pension funds, since the risk is borne by the policyholders for nearly all the former.
Table 11 – Stratification of the portfolio on the basis of the maturity date
(€ thousands) Loans and receivables
Held to maturity investments
Available for sale financial
assets
Financial assets at fair value
through profit or loss Total % of total
Within 12 months 395 3,707 580,669 728,150 1,312,921 11.8
Between 2 and 3 years 204,369 32,841 1,066,336 4,457 1,308,003 11.8
Between 4 and 5 years 203,372 4,805 2,136,830 7,965 2,352,972 21.1
Between 6 and 10 years 227,455 120,134 3,656,395 13,895 4,017,879 36.1
Between 11 and 15 years 437,208 113,952 1,109,338 2,670 1,663,168 14.9
More than 15 years 115,951 11,754 342,699 1,195 471,599 4.2
TOTAL 1,188,750 287,193 8,892,267 758,332 11,126,542 100.0
Sensitivity analysis
The sensitivity analysis on the interest rate was carried out by hypothesising parallel shocks on the rates curve. Two scenarios were considered, a negative one, with hypothesis of an increase in the rates of 75 bp, and a positive one, featuring a decrease of an equal extent. The extent of the duration was used as modified in order to quantify, security by security, the amount of the deviation in the market value prior and post shock. For certain particular types of securities, in a prudential light, the residual duration data item of the security was considered more representative in this estimate. The results obtained reveal that the effect of the negative shock hypothesised, net of tax effects, would come to around € 182 million on shareholders’ equity and around € 5 million on the result. With reference to loans and receivables, the effect would have come to around € 15 million in latent capital losses and with reference to investments held until maturity, the effect would have come to € 9.9 million. The effect would be perfectly symmetrical in the case of positive rate shocks. The sensitivity analysis indicates a concentration of exposure to rate risk, for an ample portion of investments held by the Company in the bond segment, both at fixed and floating rate.
Share risk
With a view to a medium/long-term investment policy, a limited position was maintained, on shares with solid fundamentals and reasonable prospects of dividends, splitting the investment during the period, especially in periods of greater weakness of the markets. Preference has been shown for Italian issuers and those of other European Union countries, chosen on the basis of the individual growth prospects with a view to sector-based diversification and dividend sustainability, paying particular attention to the issuers with global exposure from the point of generation of revenues

Management Report
67
Sensitivity analysis
The sensitivity analysis on the share component was carried out by hypothesising a first shock of 5% and a second shock of 25% on share market indicators. The results obtained show that the impact, net of the tax component, of the first shock would come to roughly € 17 million on s hareholders’ equity and around € 722 t housand on t he income statement; that of the second shock would come to roughly € 85 million on shareholders’ equity and € 3.6 million on the income statement. Again in this case, the greater volatility on the shareholders’ equity derives from the classification of securities, for which reference should be made to the notes to the accounts. With reference to total Group investments, the low component of investments in shares and UCITs referable to the share segment leads to a low exposure to this risk.
Credit risk
During 2012, the explosion of the sovereign debt crisis translated into strong volatility of the spreads on the credit risk. Despite maintaining the liquidity high in the portfolios, as from June steps were taken to reinvest part of the incoming flows on high yield and industrial corporate securities, mainly unrelated to the traditional markets thereby implementing constant sector-based diversification of the portfolio. For the same reason, the decision was taken to constantly reduce the financial component. However, due diligence was kept constant so as to monitor the quality of the significant investments outstanding, preferring investment in issuers with a good risk profile, observing the instructions of the Outline Resolutions which establish precise limits in terms of the credit quality of the portfolio and exposure towards an individual issuer. With regard to the information on the activities carried out on Greek securities, reference should be made to the notes to the accounts and the tables contained therein.
The extent of the exposure of the bond portfolio to credit risk is expressed by the stratification by rating which follows. The table discloses the satisfactory credit quality of the Group portfolio which is primarily invested in securities with a rating of no less than BBB.
Table 12 – Stratification of the bond portfolio by rating
(€ thousands) Loans and receivables
Held to maturity investments
Available for sale financial
assets
Financial assets at fair value
through profit or loss Total % of total
AAA 0 0 30,964 16,765 47,729 0.4
AA 65,572 0 54,917 823 121,312 1.1
A 234,888 4,780 492,006 2,146 733,820 6.6
BBB 796,238 266,664 7,922,316 730,963 9,716,181 87.3
BB 92,052 0 292,432 5,388 389,872 3.5
B 0 15,749 60,263 1,652 77,664 0.7
CCC 0 0 13,451 333 13,784 0.1
Without rating 0 0 25,904 223 26,127 0.2
In Default 0 0 14 39 53 0.0
TOTAL 1,188,750 287,193 8,892,267 758,332 11,126,542 100.0

68
Sensitivity analysis
In order to assess the credit risk, the application of a margin to the corporate bond portfolio, equal to the deviation between the returns of a reference curve and a rating curve lower by two notches was hypothesised. The A/A+ curve was taken as t he reference curve, since it is representative of the average rating level of our corporate bond investment portfolio. In this analysis, only the negative scenario was taken into consideration, which envisages an adjustment from the A/A+ curve to the BBB one; the positive scenario was not hypothesised, with adjustment from the A/A+ curve to the higher one. The results obtained reveal that the effect of the negative shock hypothesised, net of tax effects, would come to around € 51.3 m illion on s hareholders’ equity and around € 248 thousand on the income statement. With reference to loans and receivables, the effect - net of taxation - would have come to around € 3.9 million in latent capital losses and with reference to investments held until maturity, the effect would have come to around € 1 million.
Liquidity risk
The liquidity risk is associated with the possibility that the portfolio assets are difficult to disinvest or that said difficulty translates into a capital loss. The Group handles this type of risk by following the guidelines adopted in the outline resolutions. In particular, as already mentioned, it is envisaged that the portfolio be invested in listed financial instruments with an adequate rating, on t he basis of pre-established quantitative and qualitative limits, to encourage the rapid disinvestment of the financial instruments.
Derivatives
The liquidity risk is associated with the possibility that the portfolio assets are difficult to disinvest or that said difficulty translates into a capital loss. The Group handles this type of risk by following the guidelines adopted in the outline resolutions. In particular, as already mentioned, it is envisaged that the portfolio be invested in listed financial instruments with an adequate rating, on t he basis of pre-established quantitative and qualitative limits, to encourage the rapid disinvestment of the financial instruments.
OPERATING, LEGAL AND REPUTATIONAL RISK
Operating, legal and reputational risk
The operating, legal and reputational risk gauges the probability of suffering losses due to the inefficiency of individuals, processes and systems, external events (such as fraud or supplier activities), difficulty in adapting to the developments in legislation or conduct which may damage the corporate image. The operational risk management system which the Group has adopted sets itself the objective of preventing and reducing the losses deriving from operating risks by means of their correct identification, gauging and mitigation and the systematic disclosure of the risk culture also in an operating sphere. This approach makes it possible to enhance the system of internal controls, improve the efficiency and efficacy of the management processes and encourage dialogue with the Board of Directors, Senior Management, the Board of Statutory Auditors and the Supervisory Body.

Management Report
69
The Risk Management division has developed a three-dimensional approach for the management of operating risks based on: • Self-assessment of the operating risks (so-called risk self assessment): the identification,
assessment of the absolute risk and the associated control are carried out by the process head (in this sense, this is known as r isk self assessment) with the support of the risk management unit;
• Analysis of the key processes and monitoring of the mitigation plans: partly for the purpose of overcoming the method-related limits in the risk self assessment approach, the risk management unit carries out analysis independently on the key processes by means of collating data/objective checks. F urthermore, the unit takes steps to monitor the mitigation action identified over time;
• Calculation of the economic capital: the economic capital represents the endowment of assets which every company must put aside to cover operating risks; the calculation is made according to a regulatory approach (Solvency II) and is also used for the purpose of updating the corporate risks maps.
Other information
The available solvency margin of the Parent Company pursuant to section IV of the Private Insurance Code and ISVAP Regulation No. 19 dated March 14th, 2008, as amended by ISVAP Regulation No. 2768 dated December 29th, 2009, amounted to € 812 million for non-life classes and € 329.8 million for the life classes. The amount of the required margin totals € 233.6 million for the non-life classes and € 155.5 million for the life classes. Therefore, the solvency margin is, for the non-life classes, 3.5 times that required by law, and 2.1 times for the life classes, as per the law. The Group’s solvency margin prior to the dividend pay out, came to around 1.61 times the regulatory minimum and compares with the margin relating to 2011 which was 1.25 times the regulatory minimum. It is hereby disclosed that the Parent Company does not apply the IVASS anti-crisis regulations. Taking into account the dividend proposal, the solvency margin comes to 1.55 times the regulatory minimum.


Management Report The Group in 2012 Business performance for the period Risk management Employees and sales network Significant events and other information


Management Report
73
HUMAN RESOURCES As of December 31st, the Group headcount included 1,460 staff, compared with 1,470 in the previous year, divided up as follows: 40 e xecutives (unchanged with respect to 2011), 244 officials (-3) and 1,176 office workers (-7). The number of full time equivalent Group employees came to 1,406 (compared with 1,410 as of December 31st, 2011).
1,183 1,176
247 24440 40
0
200
400
600
800
1,000
1,200
1,400
1,600
1,800
2,000
2011 2012
Employees Officers Executives
1,470 1,460
Headcount Number
Training
Internal staff training During 2012, C attolica Assicurazioni Business School, merged by incorporation within Cattolica Services with effect as of December 31st, 2012, c arried out 5,000 man days of training benefiting Group employees, in which 1,093 individuals took part. 11% of the activities benefited from the funding of the FBA and FonDir Funds. Training activities supported the action for developing staff so as to make the most of the qualities of the individuals, increase the technical and managerial skills keeping them in line and dealing with a highly complex market scenario, so as to increase motivation and productivity. It also ensured on-going up-dating on legislative and compliance-related matters. For greater details on Group training activities, reference should be made to the matters illustrated in Cattolica’s Management Report.
Employees and sales network

74
Table 13 – Group headcount
Group companies (*) Registered
offices Dec. 31st, 2011 Increases Decreases Changes
Dec. 31st, 2012
ABC Assicura Verona 7 0 0 0 7
BCC Assicurazioni Milan 8 1 1 0 8
BCC Vita Milan 24 1 1 0 24
Berica Vita Vicenza 7 0 1 -1 6
Cattolica Assicurazioni Verona 696 35 (1) 53 (2) -18 678 Cattolica Assicurazioni Business School (**) (CABS) Milan 6 16 (3) 22 (4) -6 0
Cattolica Agricola Verona 0 5 0 5 5
Cattolica Beni Immobili Verona 0 0 0 0 0
Cattolica Life Dublin (Ireland) 10 0 0 0 10
Cattolica Previdenza Milan 119 3 34 (5) -31 88
C.P. Servizi Consulenziali Milan 1 1 1 0 1
Duomo Uni One Assicurazioni Milan 7 0 1 -1 6
Lombarda Vita Brescia 11 0 5 -5 6
Risparmio & Previdenza Verona 39 0 13 (6) -13 26
San Miniato Previdenza (***) San Miniato (PI) 4 0 4 -4 0
TUA Assicurazioni Milan 49 9 3 6 55
Cattolica Immobiliare Verona 6 9 (7) 9 0 6
Cattolica Services (CS) Verona 476 79 (8) 21 58 534
Group total 1,470 159 169 -10 1,460 (*) Number of employees relating to companies consolidated line-by-line excluding the resources covering maternity leave. (**) Merged within Cattolica Services with effect as at December 31st, 2012 (****) Merged within Cattolica Assicurazioni as at February 26, 2012 (1) of which 9 employees from the spin-off of the business segment from Cattolica Immobiliare and 4 due to the merger of San Miniato Previdenza (2) of which 28 transferred to CS (2) of which 16 employees from Cattolica Previdenza (4) of which 20 transferred to CS by means of the merger as at December 31st, 2012 (5) of which 16 transferred to CABS subsequently absorbed in CS (6) of which 8 transferred to CS (7) 9 deriving from the spin-off of the BPVI Fondi SGR business segment (8) of which 53 deriving from Group companies and 20 from the CABS merger
SALES NETWORK Agency coverage
The Group closed the year with a total of 1,391 agencies (1,398 in 2011), distributed as follows: 55.3% in Northern Italy, 25% in Central Italy and 19.7% in Southern Italy and the islands. The Parent Company had 965 agencies (1,010 as of December 31st, 2011). During the year, 32 Cattolica agencies, 2 Cattolica Previdenza agencies, 1 bankassurance agency and 81 TUA Assicurazioni agencies were opened.

Management Report
75
Bank branch coverage
The bank-assurance channel is overseen by the Parent Company by means of a partnership strategy with the banking operators based on bot h commercial agreements with numerous institutions for the sale of insurance policies via bank branches, and on t he insurance companies in which the Parent Company, thereby obtaining control, and banking partners invest. The number of branches distributing Pension Planning products increased from 5,990 at the end of last year to 5,967. The branches of UBI Group banks came to 675. T he alliance with ICCREA HOLDING launched in the second half of 2009 makes it possible to distribute products via 3,674 branches (+43 with respect to December 31st, 2011) of the Banche di Credito Cooperativo, while that with Banca Popolare di Vicenza, underway since 2007, permits the Cattolica Group to access a network of 640 branches. The leading banks operating as Cattolica’s partner, in addition to those already indicated, include Barclays Bank, Banca Carim, Cassa di Risparmio di Ferrara and Cassa di Risparmio di San Miniato.
Pension and welfare product advisor coverage
The Cattolica Previdenza sales network, further to reorganisation at the end of 2011, w as represented by 351 individuals of which 30 pension and welfare product consultants, 295 sub-agents of C.P. Servizi Consulenziali and 26 Cattolica sub-agents. C.P. Servizi Consulenziali is the sales company established last year for the purpose of rationalising the activities of the pension and welfare product consultants within the sphere of the Group networks. The number of Group financial advisors fell to 879 compared with 973 at the end of the previous year.
1,398
5,990
973
301
1,391
5,967
879
351
0
1,000
2,000
3,000
4,000
5,000
6,000
7,000
Agencies Bank branches Financial advisors Pension advisors and sub-agents
2011 2012
Sales channelsNumber


Management Report The Group in 2012 Business performance for the period Risk management Employees and sales network Significant events and other information


79
Management Report
SIGNIFICANT TRANSACTIONS CARRIED OUT DURING THE YEAR
The significant events that occurred during the year as part of the management of the equity investments in Group companies, the corporate reorganization and the consequent rationalization of activities are set out below, in addition to the other events during the period.
Cattolica and the Group
The merger via incorporation of San Miniato Previdenza in the Parent Company was effective for statutory purposes as from 00:01 of February 26th, 2012, while the accounting and tax effects of the transactions of the company absorbed were booked to the financial statements of the absorbing company as from January 1st, 2012. On the basis of the provisions originally agreed, on May 15th, Intesa Sanpaolo Vita transferred the whole remaining holding (19.86%) in Cattolica Previdenza, for € 5 thousand, to the majority shareholder Cattolica, which became the sole shareholder of the subsidiary. On May 22nd, B anco di Brescia transferred the entire holding (2.4%) in Risparmio & Previdenza to Cattolica, the majority shareholder, for € 1.8 million. At present, therefore, the shareholding structure of the company is as follows: Cattolica Assicurazioni 97.58% and Cassa Risparmio Fabriano e Cupramontana 2.42%. On September 19th, Cattolica Life’s Board of Directors, also having taken into account specific Irish legislation, in particular in terms of the margin required and the distributable nature of the reserves and given the need to optimise the allocation of the capital of the Cattolica Group, resolved the distribution to the shareholders of part of its reserves, exceeding the required margin, according to the respective investment held in the same. Subsequently, income reserves were distributed for a total of € 6 million. On September 25th, Lombarda Vita’s shareholders meeting, also having duly noted the performance of the company and the 2012 closure forecasts, in particular relating to the available margin and the margin required and given the need to optimise the allocation of the capital of the Cattolica Group, resolved the distribution to the shareholders of part of its reserves, the ones exceeding the required margin, according to the respective held share amount. Subsequently, reserves were distributed for a total of € 35 million, of which € 25.2 million in capital and € 9.8 million in profits. Executing the agreements signed in 2010 between the Parent Company and Banca Popolare di Vicenza as part of the renewal of the strategic partnership, on March 14th the non-proportional - so-called asymmetrical - partial spin-off of B.P.Vi Fondi SGR to Cattolica Immobiliare was finalised. As from April 1st, Cattolica Immobiliare thus changed its corporate name to Cattolica Gestione Investimenti s.p.a.. In relation to the project for the partial spin-off of Cattolica Gestione Investimenti s.p.a. in favour of the Parent Company, approved by the board of directors of the same on May 15th, for the purpose of concentrating the Group’s activities inherent to the management of financial assets, having obtained the necessary authorisations from the competent authorities, on October 3rd and 5th, respectively, Cattolica and Cattolica Gestione Investimenti resolved the business segment spin-off of the latter in favour of the former; these resolutions were recorded with the Verona Companies’ Register on O ctober 9th and 10th, respectively. The legal deadlines having elapsed, the transaction was finalised on December 27th, 2012 and it became
Significant events and other information

80
effective as from December 31st, 2012. C onsequent to the efficacy of the transaction, the subsidiary changed its corporate name to Cattolica Immobiliare S.p.A.. On November 19th, 2012, during the arbitration proceedings furthered by the Parent Company and Risparmio & Previdenza vis-à-vis Banca Popolare di Bari due to violation of the insurance brokerage contract entered into in 2005 with the insurance company Eurosav (now Risparmio & Previdenza), the Arbitration Board announced the final award for the proceedings, in which the breach committed by the Bank was ascertained and thus the termination of said brokerage transaction was declared with the order to pay compensation for damages in favour of Risparmio & Previdenza, to a total extent of € 6.1 million which the Bank paid to the subsidiary on December 14th, 2012, with reservation to challenge the decision. Non-insurance companies Property companies With reference to the purchase of the property complex known as “Tenuta Ca’ Tron”, as per the agreement entered into on March 12th between Cattolica and the Fondazione Cassamarca, reference should be made to the section investment property under “Business performance for the period”. In September, the Fondo Perseide Energie was 100% subscribed by Cattolica Group companies, a mutual closed-end property investment fund, reserved for qualified investors, dedicated to renewable energies. The Fund commenced its activities on October 4th, with the purchase of two photovoltaic plants located in the province of Bari, with installed power of 1 Mega Watt each and for an overall investment of € 9 million. On December 14th, as already mentioned, Cattolica entered into a binding agreement for the purchase of Palazzo Biandrà located in Piazza Cordusio, Milan, acquired on December 21st, under abeyance condition (which as of the date of the Board meeting for the approval of Cattolica’s financial statements had not yet come about), for a price of € 10 0 million, via Fondo Immobiliare Euripide, managed by Finanziaria Internazionale Investments SGR, and subscribed pro rata by the Group companies. Other On March 15th, Cattolica Assicurazioni Business School resolved a sh are capital increase against payment for € 175 thousand, reserving it under option for Cattolica Previdenza, as per Article 2441 paragraph 4 of the Italian Civil Code. The latter subscribed and fully freed up the shares as from April 1st, via the conferral in kind of its business segment, subject to appraisal by an independent expert which established the value as € 175 thousand. As a result of the transaction, the share capital of Cattolica Assicurazioni Business School was increased from € 400 t housand to € 575 t housand. The Parent Company continued to hold a majority interest in the share capital (68.1%); the holding of Cattolica Previdenza rose to 30.5% while those of the other shareholders fell proportionally. On June 28th, the Boards of Directors of Cattolica Assicurazioni Business School and Cattolica Services - subject to the acquisition by the latter of the holdings respectively held by Cattolica (68.1%), Cattolica Previdenza (30.5%) and by ot her Group companies (1.4%) in Cattolica Assicurazioni Business School - approved the project for the merger via incorporation of the former into the latter on the basis of the statement of financial position
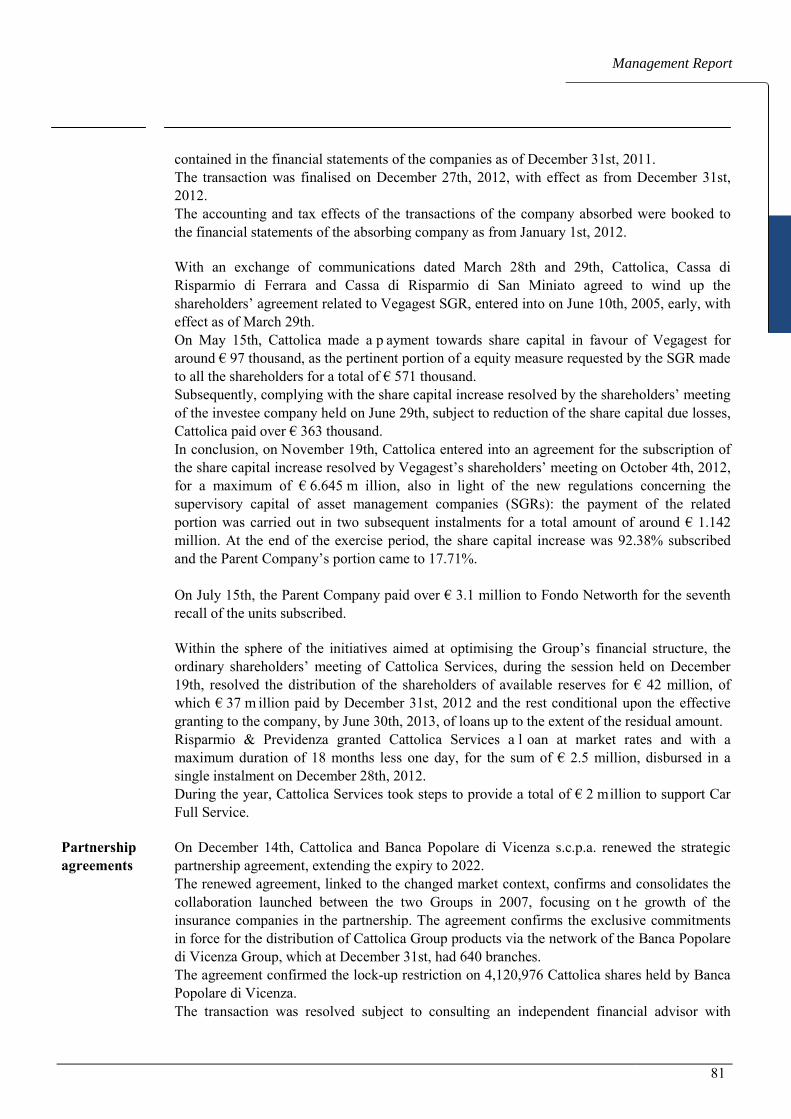
81
Management Report
contained in the financial statements of the companies as of December 31st, 2011. The transaction was finalised on December 27th, 2012, with effect as from December 31st, 2012. The accounting and tax effects of the transactions of the company absorbed were booked to the financial statements of the absorbing company as from January 1st, 2012. With an exchange of communications dated March 28th and 29th, Cattolica, Cassa di Risparmio di Ferrara and Cassa di Risparmio di San Miniato agreed to wind up the shareholders’ agreement related to Vegagest SGR, entered into on June 10th, 2005, early, with effect as of March 29th. On May 15th, Cattolica made a p ayment towards share capital in favour of Vegagest for around € 97 thousand, as the pertinent portion of a equity measure requested by the SGR made to all the shareholders for a total of € 571 thousand. Subsequently, complying with the share capital increase resolved by the shareholders’ meeting of the investee company held on June 29th, subject to reduction of the share capital due losses, Cattolica paid over € 363 thousand. In conclusion, on November 19th, Cattolica entered into an agreement for the subscription of the share capital increase resolved by Vegagest’s shareholders’ meeting on October 4th, 2012, for a maximum of € 6.645 m illion, also in light of the new regulations concerning the supervisory capital of asset management companies (SGRs): the payment of the related portion was carried out in two subsequent instalments for a total amount of around € 1.142 million. At the end of the exercise period, the share capital increase was 92.38% subscribed and the Parent Company’s portion came to 17.71%. On July 15th, the Parent Company paid over € 3.1 million to Fondo Networth for the seventh recall of the units subscribed. Within the sphere of the initiatives aimed at optimising the Group’s financial structure, the ordinary shareholders’ meeting of Cattolica Services, during the session held on December 19th, resolved the distribution of the shareholders of available reserves for € 42 million, of which € 37 m illion paid by December 31st, 2012 and the rest conditional upon the effective granting to the company, by June 30th, 2013, of loans up to the extent of the residual amount. Risparmio & Previdenza granted Cattolica Services a l oan at market rates and with a maximum duration of 18 months less one day, for the sum of € 2.5 million, disbursed in a single instalment on December 28th, 2012. During the year, Cattolica Services took steps to provide a total of € 2 million to support Car Full Service.
Partnership agreements
On December 14th, Cattolica and Banca Popolare di Vicenza s.c.p.a. renewed the strategic partnership agreement, extending the expiry to 2022. The renewed agreement, linked to the changed market context, confirms and consolidates the collaboration launched between the two Groups in 2007, focusing on t he growth of the insurance companies in the partnership. The agreement confirms the exclusive commitments in force for the distribution of Cattolica Group products via the network of the Banca Popolare di Vicenza Group, which at December 31st, had 640 branches. The agreement confirmed the lock-up restriction on 4,120,976 Cattolica shares held by Banca Popolare di Vicenza. The transaction was resolved subject to consulting an independent financial advisor with

82
regard to the compliance of the contractual set-up proposed with market conditions as well as the favourable opinion of the Related Parties Committee. Cassa di Risparmio di San Miniato resolved and carried out a share capital increase for around € 25 million, in the period October-November 2012. The main objective pursued via the accomplishment of the share capital increase is to raise the bank’s equity capacity, for the purpose of ensuring an adequate endowment of means, on a consistent basis with the scheduled growth plans, as well as more easily achieve full compliance with the new prudent supervisory regulations (Basel 3). Also within the sphere of a redefinition of the agreements existing with the Cassa di Risparmio di San Miniato Foundation relating to investment and governance set-ups, also considering therein the applicability of the insurance brokerage relationship with said bank, the Parent Company took part proportionally in said increase. On November 12th, Cattolica exercised the purchase option it was due, subscribing 625,965 ne wly issued shares, for an equivalent value of roughly € 6.4 million: Cattolica now holds 5,007,723 shares, amounting to 25.066% of the share capital of the Bank.
Other events
During the year, the Group took part in the exchange offering on Greek government securities. The transaction involved the exchange for every € 1,000 of par value of old securities of twenty securities with an overall par value of € 315 maturing between 11 and 30 years, one warrant index-linked to the trend in Greek GDP, € 150 of par value divided up into two new securities issued by the European Financial Stability Facility and one bond again issued by the European Financial Stability Facility maturing in six months. The exposure was almost entirely dismantled during the year. On March 27th, Intermonte issued 617,667 shares in favour of ICCREA Holding. The new share capital therefore amounted to € 45.95 million, represented by 45,950,000 shares with a par value of € 1 each. Cattolica’s investment, represented by 5,333,333 shares, fell from 11.76% to 11.61%. The ordinary and extraordinary shareholders’ meeting of Cattolica was held on April 21st. During the extraordinary session, the meeting approved a number the Article of Association amendments laid down by needs for greater coherence of the text of the same with the Company’s status as a co-operative, greater specification of the current wording, as well as the need to introduce certain adjustments as a result of new legislation, and approved the bonus share capital increase for € 8,113,293 by means of use of part of the share premium reserve available and consequent proportional assignment to the shareholders of one bonus share for every twenty shares held, with dividend enjoyment rights as of January 1st, 2012. The bonus share capital increase transaction was therefore carried out (“detachment date”) on July 23rd, with the issue of 2,704,431 new ordinary shares with a par value of € 3 each. As a result of the execution of the bonus share capital increase, Cattolica’s share capital amounted to € 170,379,138 represented by 56,793,046 new ordinary shares with a par value of € 3 each. On May 30th, the Parent Company communicated that, pursuant to Article 144 bis, paragraph 3, of CONSOB regulation No. 11971 dated May 14th, 1999, the Board of Directors resolved to avail itself of the authorisation granted by the shareholders’ meeting held on April 21st, 2012 relating to the transactions on own shares, to the extent of a m aximum number of

83
Management Report
1,622,640 own shares equal to 3% of the share capital and for a maximum value of the shares held of € 30 m illion, for the purposes and as per the conditions indicated in the afore-mentioned shareholders’ resolution. On November 7th, the Parent Company’s Board of Directors resolved the calling of the shareholders’ meeting, in ordinary and extraordinary session, for December 14th and 15th, 2012, in first and second calling respectively. In ordinary session, the shareholders were required to appointed five Directors, pursuant to Article 2386 of the Italian Civil Code and Article 33 of the Articles of Association. In extraordinary calling, the shareholders were required to approve amendments to Articles. 27, 30, 33, 35, 36, 40, 43, 44 and 54 of the Articles of Association. These amendment proposals were dictated by the need to update the corporate governance system as well as the need to introduce a number of adaptations for legislative purposes.
Recapitalisations In order to ensure an adequate level of capitalisation of the insurance companies, also in consideration of the risk tolerance limits which the Cattolica Group has prudently intended to provide itself with and the unresolved uncertainties regarding the trend of the financial markets, during the period the Parent Company and the banking partners made payments towards the share capital in favour of certain subsidiary companies: • ABC Assicura: the Parent Company made a payment with a value date of June 30th, for €
1.8 million by way of the portion of the payment towards capital totalling € 3 million; • Duomo Uni One: the Parent Company made a payment with a value date of January 27th,
towards capital for € 7 million. • Cattolica Previdenza: the Parent Company paid with a value date of March 30th, the
amount of € 7 million; with a value date of September 28th, it paid over the sum of € 3 million and with a value date of December 24th, it paid over € 3 million.
Supervisory Authority (IVASS)
Inspection care of the Parent Company’s Headquarters The inspection assessments care of the Parent Company’s head offices, commenced in November 2011 by the Supervisory Authority, concluded in June. In July, the Company took steps to provide the appropriate deductions and related clarification for the final findings formulated by ISVAP, also making or scheduling a number of changes to its set ups and/or processes. Subsequently, the Supervisory Body served a notice of contestation, according to the procedure envisaged by current legislation, relating to: • alleged procedural and organisational shortfalls pertaining to the Board of Directors and
shortfalls pertaining to the Internal Audit Committee; • organisational profiles relating to the compliance and risk management divisions; • profiles inherent to the reservation risk, with reference to the methods for determining the
provision for outstanding claims relating to the general TPL class and certain components

84
of the TPL motor claims provision, without, what is more, requesting integrations to the provisions.
It is also hereby revealed that the inspection concerned other aspects of the corporate operations, on which what is more the Authority has not reported any findings. In order to further clarify its position, the Parent Company decided to avail itself of the possibility, envisaged by current legislation, of a hearing, fixed for March 26th. Inspection care of the Turin Settlement Unit The inspection assessment care of the Turin Non-Life Claims Settlement Unit concluded with the imposition of fine No. 1882/12 dated May 21st, 2012 amounting to around € 109 thousand. Dispute regarding evasion of the obligation to contract On July 12th, the hearing requested by the Parent Company in relation to the dispute, for violation of Article 132, paragraph I of the Private Insurance Code, was held at IVASS headquarters, with regard to avoidance of the obligation to contract, concerning certain categories of insured parties and specific geographic areas. Subsequently, in November, the IVASS served decree No. 4666/12 inflicting a fine of € 2 million. It is hereby specified that, at present, other insurance companies belonging to leading insurance groups emerge as already having been subject to similar fines. Deeming the decree to be lacking grounds, the Parent Company appealed against the fine before the courts, also requesting suspension of execution of said decree. At present, no hearing has yet been fixed. It should be noted that the proceedings are aimed at obtaining the cancellation of the Decree, and in particular the fine inflicted in the Company for alleged avoidance of the obligation to contract. These proceedings fall within the sphere of a series of similar disputes and related fines which ISVAP inflicted on around 15 insurance companies which, as far as Cattolica is aware, have appealed before the regional administrative court (TAR) against the fines inflicted. These proceedings are still underway since no final decisions has been reached for any of the same. Thus, it is possible to maintain that the defence action adopted by the insurance companies, including therein Cattolica, has legal grounds even if it is not possible to exclude an unfavourable decision by the legal authorities. Claims database In October 2010, ISVAP ordered the dismissal of the sanction proceedings vis-à-vis the Company related to alleged violations in the reports to the Claims Database quantified with regard to sanction aspects according to the new application and quantification criteria as per ISVAP Note dated March 24th, 2011, against which Cattolica, together with other Group and market companies, presented an appeal, upheld in February 2012, before the Lazio TAR.

85
Management Report
Inland Revenue Disputes continue, furthered with regard to VAT irregularities regarding joint assurance and intercompany ancillary services. During the year, additional sentences were passed in favour of Group companies by the Regional and Provincial Tax Commissions. Duomo Uni One On June 4th, a settlement proposal was signed, thereby defining all the outstanding disputes relating to the formal notice of assessment and subsequent notice of inspection relating to 2006 served on Duomo Uni One. This settlement led to a total cost for taxes and fines of € 1.9 million (in the face of assessed findings for € 5.8 million which would have generated additional IRES (company earnings’ tax) of nearly € 2 million plus fines for more than € 3.2 million). The judicial settlement for IRAP and withholding tax purposes is currently being negotiated with the Inland Revenue, with an estimate of the cost of just over € 200 thousand. With reference to the notice of assessment served in relation to 2005, containing the irregularity which concerns the alleged non-deductibility for IRES and IRAP purposes of a capital loss on shares, to be linked to dividends received, since the company had not fulfilled the obligation to communicate the dividends and capital losses within the applicable timescales, the IRES fines have already been defined and the complete closure under legal settlement with the Lombardy Regional Division of the Inland Revenue is deemed possible. With reference to 2007, the following notices were served in the last few days of the year:
• notice of assessments served to the consolidated and consolidating company, containing the IRES - company earnings tax irregularity (additional taxation: € 1.2 m illion, fine: approximately € 2 million) for the capital losses generated on shares deemed not pertinent since they were not suitably documented;
• notice of assessment containing the same irregularity for IRAP - regional business tax - purposes (additional taxation: around € 189 thousand) and VAT irregularities (additional taxation: roughly € 7 t housand) relating to joint insurance transactions and intercompany operations, sanctions from material accumulation for around € 339 thousand;
• formal notification with reference to VAT for a total of € 772 thousand. Cattolica Services As of the balance sheet reference date, the company had tax disputes pending with the tax authorities in relation to the years 2004-2005-2006-2007. All the assessments concern the VAT exemption scheme applied to services rendered to other Group companies pursuant to Article 6 of Italian Law No. 133/1999 in the periods between 2004 and 2007. The Company has always seen its defence reasoning upheld by the Provincial and Regional Tax Commissions applied to. Cattolica Gestione Investimenti A VAT notice of assessment is pending, issued by the Inland Revenue for the 2006 tax period. The notice of assessment contains two irregularities (for a total of € 148 thousand), which lead to a recalculation of the pro rata deductibility of the VAT. Since the company has settled the

86
fines under facilitated conditions, the notice of assessments concerns just the taxes and the interest. The estimate for settlement comes to around € 100 thousand.
Management and co-ordination activities pursuant to Article 2497 et seq. of the Italian Civil Code In accordance with and for the purposes of Articles 2497 et seq. of the Italian Civil Code, Cattolica Assicurazioni soc. coop. performs management and co-ordination activities in relation to the following companies: ABC Assicura, BCC Assicurazioni, BCC Vita, Berica Vita, C.P. Servizi Previdenziali, Car Full Service (Cattolica Services Servizi as from February 2013), Cattolica Gestione Investimenti (Cattolica Immobiliare as from January 1st, 2013), Cattolica Life, Cattolica Previdenza, Cattolica Services, Duomo Uni One Assicurazioni, Lombarda Vita, Risparmio & Previdenza, TUA Assicurazioni and TUA Retail. These companies have acknowledged this arrangement in their financial statements. The Parent Company has exercised its management and co-ordination powers in observance of the principles of correct corporate and business management and on a consistent basis with the roles assigned to the individual Group companies. With specific reference to the transactions expressly influenced by the Company, in addition to the transactions indicated in other parts of this report, it should be noted that said transactions concerned, among other things: • the approval of the guidelines for the handling of the risks at Group level, and
intercompany transactions; • the adoption of governance and management approaches and controls which are standard
at Group level; • the definition of the directives concerning internal controls; • co-ordinated operational transactions and policies; • the re-definition of developmental lines of the strategic approach; • the choices concerning the composition and the remuneration of the corporate bodies,
management and other significant roles with respect to the governance set up. So as t o ensure an evolution of the Group consistent with the lines identified at Parent Company level, the management and co-ordination activities concerned the implementation of co-ordinated management policies and the definition of a number of development lines of the Group’s strategic layout described in this section. The Parent Company also intervened with the recapitalisation transactions necessary for ensuring observance by the subsidiaries of the individual capital ratios envisaged by legislation and by internal regulations concerning the risk tolerance threshold. With regard to financial, tax and administration matters, the central role of the Parent Company is highlighted in the definition of the operating lines in which the Group’s companies are involved. In this connection, mention is specifically made of the review, by the Group companies concerned, of the outline resolution relating to financial investments envisaged by ISVAP Regulation No. 36 dated January 31st, 2011.

87
Management Report
Tax consolidation On June 15th, 2012, the Parent Company informed the Inland Revenue of exercise of the option for the national tax consolidation system for the company Car Full Services (Cattolica Services Sinistri as from February 2013) and confirmation of Group taxation for the companies ABC Assicura, Berica Vita, BCC Assicurazioni, BCC Vita, Cattolica Assicurazioni Business School (merged within Cattolica Services with effect as from December 31st, 2012), Cattolica Gestione Investimenti (Cattolica Immobiliare as from January 1st, 2013), Cattolica Previdenza, Cattolica Services, C.P. Servizi Consulenziali, Duomo Uni One, Lombarda Vita, Risparmio & Previdenza, TUA Assicurazioni and TUA Retail. The reasons why the option has been exercised lie in the appropriateness of offsetting the tax positions with an opposite sign between the Group companies, consequently optimising the financial aspects. For the purposes of the regulation of the economic transactions deriving from the compliance with the tax consolidation regime, an agreement was entered into with Cattolica by each investee company. With reference to the allocations of the economic effects associated with the exercise of the option, the subsidiary companies transfer the amounts corresponding to the taxes and advances deriving from their taxable position to the Parent Company; by contrast, they receive from the Parent Company the amount corresponding to lower tax paid by the same due to the effects of the use of tax losses transferred by subsidiary companies.
OTHER INFORMATION
INTERNAL AUDITING
Compliance During the year, the Group’s Compliance unit continued to further the consolidation in-house of the culture of compliance and audits, also encouraging internal workshops for the stakeholders involved the most in aspects at high risk of non-compliance. It also continued with the furthering of the governance & control operational round table (TOGC), also involving the risk management, internal audit, organisation and legal and corporate affairs divisions; as w ell as the anti-money laundering, terrorism and organised crime operational round table (TOA) in which the life market area, the operational anti-money laundering service and the IT-Compliance division take part. On August 1st, the anti-money laundering unit was set up, within the more extensive “Compliance, Information Security and Anti-money Laundering” service, as a specific organisational unit, in accordance with the ISVAP Regulation No. 41 dated May 15th, 2012, endowed with specific and additional dedicated resources. Ex ante activities (identification and handling of the legislative and internal change) The ex ante activities involved the prior assessment of the effects of the legislative change on the corporate processes and procedures, as well as the analysis of the endogenous changes. Within this sphere, mention is made of the fact that the unit has been intensely involved in the legislative adaptation pursuant to ISVAP Regulation No. 40 da ted May 30th, 2012, ISVAP Regulation No. 41 dated May 15th, 2012 and Italian Decree Law No. 179 dated October 18th, 2012.

88
On-going activities (monitoring of the performance and risk indicators and progress of the corrective action) The unit has undertaken the progressive extension of the perimeter of the KPIs and KRIs identified, to be used to carry out the on-going monitoring activities, studying the possibility of automating as far as possible, via “diagnostic” or “performance-related” applications, the process for collating and organising the data. Ex post activities (remote checks and on-site checks) The ex post activities of the division involve, on the one hand remote checks, and on the other checks carried out on site, and in other words physically care of the division subject to audit. The checks concern both the detection of the level of compliance with the norms of the processes and the operating practices adopted, and the observance of the recommendations imparted by the division and the stage of progress of the planned corrective measures. During the second half of the year, the ex post checks carried out both in situ and for the documental analysis in the 4th quarter of 2011 and in the 1st/2nd quarter of 2012, on bo th the Company and the subsidiaries, were discussed. Consulting activities The unit collaborated with the business areas, providing advisory activities on di fferent subjects and in the first instance on the regulatory and legislative innovations introduced with regard to deregulation of the market. Specific assistance and advice was also provided to the Legal and Corporate Affairs Division for the implementation of ISVAP Instruction No. 3020 dated November 8th, 2012, regarding internal auditing and governance.
Internal audit
The internal audit division is tasked with monitoring and assessing the efficacy and efficiency of the internal audit system, in accordance with the provisions contained in ISVAP Regulation No. 20 dated March 26th, 2008. It is centralised in the Parent Company’s Audit division, the latter directly providing its services to the subsidiary insurance companies operating in Italy and overseeing the activities of the local auditor for Cattolica Life. The division structures its activities in a distinct manner according to whether internal management processes or peripheral processes relating to the agency network are concerned. During the year, the internal audit unit executed its annual plan of activities, operating in line with the timescales envisaged therein. It also finalised its internal standards relating to the monitoring phase of the recommendations triggered off by the audits and obtained renewal of the ISO 9001:2008 quality certification. With regard to consulting for the operating areas, amongst other aspects it set up a nd held training courses for internal staff concerning the culture of auditing in corporate governance and anti-money laundering monitoring.
Risk management
The risk management division, pursuant to section IV of ISVAP Regulation No. 20 da ted March 26th, 2008, is responsible for monitoring the risk management system, in order to identify, evaluate and control the most significant risks, the results of which can undermine the solvency of the company or provide an obstacle to the reaching of company goals. The aim of the division is to develop an effective system for the identification, modelling and

89
Management Report
handling of the risk with a view to the efficient use of the capital, aimed at achieving value. Within the sphere of the risk management process, the risk management division took part in the following activities: • definition of the policies for the undertaking and handling of the risks also in relation to
the business plan; • analysis of the mapping of the current and forecast risks; • assessment of the impacts of the risk stress analysis; • definition of the tolerance to risk at insurance company and Group level and related
monitoring; • analysis of sensitivity with respect to established thresholds.
With regard to the effects of the new Solvency II regulations, activities continued relating to the compliancy master plan drawn up internally on conclusion of in-depth gap analysis.
Appointed Executive
The Appointed Executive continued with the action for strengthening the coverage of the risks and internal controls pertaining to the formation of the accounting and financial disclosure. Accordingly: • the administrative processes risk control division on the staff of the Appointed Executive
was enhanced, a unit which not only sees to the risk assessment activities for the purposes of Italian Law No. 262 dated December 28th, 2005, but also organises the up-dating of the key controls, the risk and controls template, drafts the reporting for the purpose of informing the Board of Directors and the audit bodies;
• four efficacy test campaigns were carried out, taking steps to progressively extend the tests to the entire database of the controls pursuant to Italian Law no. 262 mapped, involving all the organisational units of the Company care of which sensitive processes will be carried out for the purposes of Italian Law no. 262;
• with the collaboration of the organisation, intense rationalisation and review activities were launched for the controls pursuant to Italian Law no. 262 s o as to reflect organisational process changes which have occurred.
• the IT module for the handling of risks and controls pursuant to Italian Law no. 262 ha s been implemented, via which test activities are performed and an initial evaluation is carried out via self-assessment on the efficacy of the checks in relation to the foreseen risks; This module was significantly customised during the year so as to render the workflow easier to use by the users and in line with a more efficient and prompt audit and reporting process;
• training sessions have been organised for the use of the application and for the tracing and formalisation of the controls;
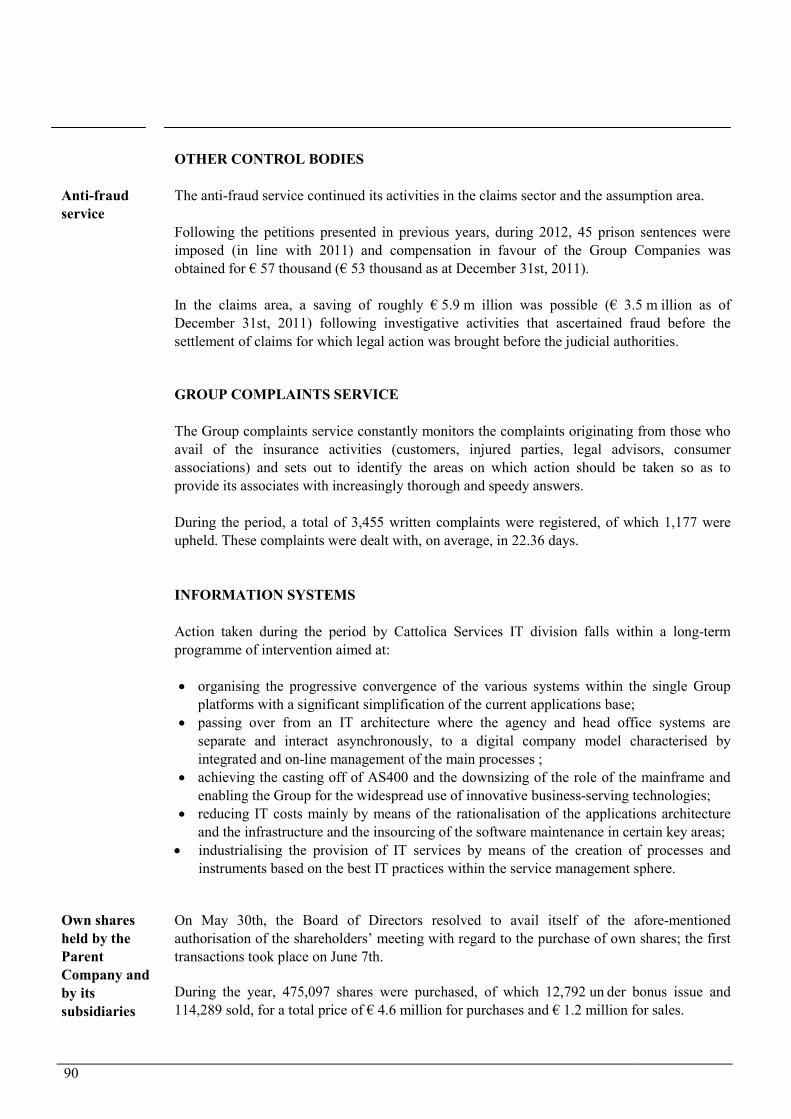
90
OTHER CONTROL BODIES
Anti-fraud service
The anti-fraud service continued its activities in the claims sector and the assumption area. Following the petitions presented in previous years, during 2012, 45 prison sentences were imposed (in line with 2011) and compensation in favour of the Group Companies was obtained for € 57 thousand (€ 53 thousand as at December 31st, 2011). In the claims area, a saving of roughly € 5.9 m illion was possible (€ 3.5 m illion as of December 31st, 2011) following investigative activities that ascertained fraud before the settlement of claims for which legal action was brought before the judicial authorities.
GROUP COMPLAINTS SERVICE The Group complaints service constantly monitors the complaints originating from those who avail of the insurance activities (customers, injured parties, legal advisors, consumer associations) and sets out to identify the areas on which action should be taken so as to provide its associates with increasingly thorough and speedy answers. During the period, a total of 3,455 written complaints were registered, of which 1,177 were upheld. These complaints were dealt with, on average, in 22.36 days.
INFORMATION SYSTEMS Action taken during the period by Cattolica Services IT division falls within a long-term programme of intervention aimed at: • organising the progressive convergence of the various systems within the single Group
platforms with a significant simplification of the current applications base; • passing over from an IT architecture where the agency and head office systems are
separate and interact asynchronously, to a digital company model characterised by integrated and on-line management of the main processes ;
• achieving the casting off of AS400 and the downsizing of the role of the mainframe and enabling the Group for the widespread use of innovative business-serving technologies;
• reducing IT costs mainly by means of the rationalisation of the applications architecture and the infrastructure and the insourcing of the software maintenance in certain key areas;
• industrialising the provision of IT services by means of the creation of processes and instruments based on the best IT practices within the service management sphere.
Own shares held by the Parent Company and by its subsidiaries
On May 30th, the Board of Directors resolved to avail itself of the afore-mentioned authorisation of the shareholders’ meeting with regard to the purchase of own shares; the first transactions took place on June 7th. During the year, 475,097 shares were purchased, of which 12,792 un der bonus issue and 114,289 sold, for a total price of € 4.6 million for purchases and € 1.2 million for sales.

91
Management Report
As of December 31st, the Parent Company held 360,808 own shares, equal to 0.64% of the share capital, for an equivalent book value of € 3.6 million6.
REPORT ON CORPORATE GOVERNANCE AND THE OWNERSHIP STRUCTURES In pursuance of Article 89 bis, section 5, of the Issuers’ Regulations, you are hereby informed that the report on corporate governance and the ownership structures envisaged by Article 123 bis of Italian Legislative Decree No. 58 dated February 24th, 1998, is available on the website “www.cattolica.it” in the Corporate Governance section.
TRANSACTIONS WITH RELATED PARTIES Pursuant to CONSOB Regulation No. 17221 dated March 12th, 2010, and subsequent amendments and additions, as from January 1st, 2011 the “Procedure for the handling of related party transactions” approved by the board of directors on November 29th, 2010, applies to the situations envisaged by the regulations. The document relating to this procedure - which should be referred to for details - is published on the Company’s website - www.cattolica.it - in the “Corporate Governance” section. With reference to disclosure on transactions with related parties, please see Part D – Other information in the notes to the accounts.
Atypical and unusual transactions and non-recurring significant events and operations
Pursuant to CONSOB Communication DEM/6064293 dated July 28th, 2006 you are hereby informed that no atypical and/or unusual transactions were entered into during the year, nor were there any significant non-recurrent events or transactions with significant effects on the company’s accounts.
Performance of Cattolica stock
During the year, Cattolica shares recorded a minimum price of € 8.46 and a maximum price of € 16. A verage capitalisation of the share on the Stock Market during 2012 s tood at € 66 7 million. On July 23rd, the number of shares in circulation rose from 54,088,615 to 56,793,046 following the bonus share capital increase. Average volumes traded in 2012 stood at 33,367 transactions.
6 All the figures indicated in the section are stated by value date.

92
Ratios per share A summary of the main ratios per share is presented below as of December 31st (note that the Parent Company’s share capital is divided up into 56,793,046 ordinary shares with a par value of € 3 each):
Table 14 - Ratios for share in circulation
(in €) 2012 2011
Number of shares in circulation 56,642,685 56,793,046
Premiums written per share (insurance premiums and investment contracts) 64.91 69.74
Group profit per share 1.09 0.66
Group shareholders' equity per share 23.25 17.93
(*) the number di shares in circulation is calculated in pursuance of IAS 33
SIGNIFICANT EVENTS DURING THE FIRST FEW MONTHS OF 2013
On January 15th, 2013, having received formal communication, inspection activities
commenced - and are still underway - by the Inland Revenue - Veneto Regional Division, on Lombarda Vita. These inspection activities execute the communication, received in July 2011 by the Inland Revenue - Lombardy Regional Division, Large Taxpayers Office, of the start of the general tax inspection for 2008. During initial access, having declared that the accounting records were kept care of the secondary offices in Verona, the company requested that the inspection activities be carried out care of the same secondary offices in Verona. The Lombardy Regional Division therefore organised the transfer of the inspection to the charge of the party responsible. In this venue, the company is obliged to exhibit the accounting and tax documentation relating to the period subject to inspection. Further to the outline agreement, signed on December 21st, 2012, between Cattolica Service, Car Full Service and the minority shareholders of the same - which envisaged the spin-off of the maintenance segment of Car Full Service with the related conferral to a newco owned by the minority shareholders, the subsequent sale of the holding deriving from said conferral to the latter and the purchase of the residual investment of 18% of Car Full Service - as from February 28th, 2013, Cattolica, via Cattolica Services, owns 100% of the former Car Full Service (which, as at February 25th, 2013, adopted the name Cattolica Services Sinistri s.p.a.) inclusive of the claims management support activities.

93
Management Report
OUTLOOK FOR BUSINESS ACTIVITIES
With regard to the year underway, still characterised by an insurance market which is feeling the effects of the problematic economic situation, a o perational trend in line with that just ended is at present envisaged. Action is envisaged to develop the non-life classes segment, as well as i nitiatives for the recovery of production on the life segment. The management of investments will continue in accordance with highly prudent criteria, in relation to the continuation of significantly violate conditions on the financial markets.
THE BOARD OF DIRECTORS
Verona, Italy, March 13th, 2013


Consolidated Financial Statements


97
CONSOLIDATED FINANCIAL STATEMENTS AS AT DECEMBER 31st, 2012
STATEMENT OF FINANCIAL POSITION - ASSETS Company: CATTOLICA ASSICURAZIONI GROUP (€ thousands) 2012 2011
1 INTANGIBLE ASSETS 310,467 327,612
1.1 Goodwill 198,870 206,594
1.2 Other intangible assets 111,597 121,018
2 TANGIBLE ASSETS 104,920 27,868
2.1 Property 94,747 18,778
2.2 Other tangible assets 10,173 9,090
3 TECHNICAL PROVISIONS - REINSURANCE AMOUNT 673,367 640,453
4 INVESTMENTS 15,236,243 14,668,517
4.1 Investment property 172,935 157,958
4.2 Investments in subsidiaries, associates and joint ventures 82,197 103,108
4.3 Held to maturity investments 287,193 285,481
4.4 Loans and receivables 1,239,353 1,516,516
4.5 Available for sale financial assets 9,739,824 8,512,235
4.6 Financial assets at fair value through profit or loss 3,714,741 4,093,219
5 SUNDRY RECEIVABLES 775,757 786,896
5.1 Receivables deriving from direct insurance transactions 497,727 615,819
5.2 Receivables deriving from reinsurance transactions 122,916 113,476
5.3 Other receivables 155,114 57,601
6 OTHER ASSET ITEMS 740,069 1,063,007
6.1 Non current assets or disposal group held for sale 0 0
6.2 Deferred acquisition costs 11,810 9,457
6.3 Deferred tax assets 277,020 489,999
6.4 Current tax assets 324,891 333,279
6.5 Other assets 126,348 230,272
7 CASH AND CASH EQUIVALENTS 607,711 407,238 TOTAL ASSETS 18,448,534 17,921,591
Statement of Financial Position

98
CONSOLIDATED FINANCIAL STATEMENTS AS AT DECEMBER 31st, 2012
STATEMENT OF FINANCIAL POSITION - SHAREHOLDERS' EQUITY AND LIABILITIES
Company: CATTOLICA ASSICURAZIONI GROUP (€ thousands) 2012 2011
1 SHAREHOLDERS' EQUITY 1,608,762 1,223,466
1.1 pertaining to the Group 1,316,904 1,018,424
1.1.1 Share capital 170,379 162,266
1.1.2 Other equity instruments 0 0
1.1.3 Capital reserves 656,611 678,672
1.1.4 Revenue reserve and other reserves 368,887 310,386
1.1.5 (Own shares) -3,572 0
1.1.6 Reserve for net exchange differences 0 0
1.1.7 Gains or losses on available for sale financial assets 64,856 -167,806
1.1.8 Other gains or losses recognised directly in equity -2,136 -2,542
1.1.9 Net profit (loss) for the period pertaining to the Group 61,879 37,448
1.2 pertaining to minority interests 291,858 205,042
1.2.1 Capital and reserves pertaining to minority interests 248,202 269,499
1.2.2 Net income recognised directly in equity 21,492 -68,814
1.2.3 Net income for the year pertaining to minority interests 22,164 4,357
2 PROVISIONS AND ALLOWANCES 29,820 27,736 3 TECHNICAL PROVISIONS 14,727,434 14,581,667
4 FINANCIAL LIABILITIES 1,264,398 1,254,072
4.1 Financial liabilities at fair value through profit or loss 933,413 962,190
4.2 Other financial liabilities 330,985 291,882
5 PAYABLES 359,979 402,612
5.1 Payables deriving from direct insurance transactions 65,637 81,111
5.2 Payables deriving from reinsurance transactions 95,762 112,351
5.3 Other payables 198,580 209,150
6 OTHER LIABILITY ITEMS 458,141 432,038
6.1 Liabilities of disposal group held for sale 0 0
6.2 Deferred tax liabilities 157,555 239,693
6.3 Current tax liabilities 232,344 121,792
6.4 Other liabilities 68,242 70,553
TOTAL SHAREHOLDERS' EQUITY AND LIABILITIES 18,448,534 17,921,591

99
CONSOLIDATED FINANCIAL STATEMENTS AS AT DECEMBER 31st, 2012
INCOME STATEMENT Company: CATTOLICA ASSICURAZIONI GROUP (€ thousands) 2012 2011 1.1 Net premiums 3,161,876 3,439,405 1.1.1 Gross premiums written 3,462,866 3,752,933 1.1.2 Ceded premiums -300,990 -313,528 1.2 Commission income 2,933 4,551
1.3 Income and charges deriving from financial instruments at fair value through profit or loss 227,864 26,935
1.4 Income deriving from investments in subsidiaries, associates and joint ventures 0 107
1.5 Income deriving from other financial instruments and investment property 812,851 550,119 1.5.1 Interest income 450,964 430,647 1.5.2 Other income 54,320 40,941 1.5.3 Realised gains 280,330 75,647 1.5.4 Valuation gains 27,237 2,884 1.6 Other revenues 77,955 95,683
1 TOTAL REVENUES AND INCOME 4,283,479 4,116,800 2.1 Net charges relating to claims -3,218,839 -3,194,241 2.1.1 Amounts paid and change in technical provisions -3,434,010 -3,402,834 2.1.2 Reinsurance amount 215,171 208,593 2.2 Commission expense -2,960 -3,419
2.3 Charges deriving from investments in subsidiaries, associates and joint ventures -3,662 -15,800
2.4 Charges deriving from other financial instruments and investment property -244,980 -269,126 2.4.1 Interest expense -18,235 -20,339 2.4.2 Other charges -6,646 -4,537 2.4.3 Realised losses -190,701 -62,870 2.4.4 Valuation losses -29,398 -181,380 2.5 Operating expenses -457,280 -455,890 2.5.1 Commission and other acquisition costs -304,786 -305,869 2.5.2 Operating expenses relating to investments -16,120 -14,382 2.5.3 Other administrative expenses -136,374 -135,639 2.6 Other costs -196,919 -157,339
2 TOTAL COSTS AND CHARGES -4,124,640 -4,095,815 PROFIT (LOSS) FOR THE YEAR BEFORE TAXATION 158,839 20,985 3 Income taxes -74,796 20,804
PROFIT (LOSS) FOR THE YEAR NET OF TAXATION 84,043 41,789 4 PROFIT (LOSS) FROM DISCONTINUED OPERATIONS 0 16
CONSOLIDATED RESULT 84,043 41,805
pertaining to the Group 61,879 37,448
pertaining to minority interests 22,164 4,357
Income statement

100
CONSOLIDATED FINANCIAL STATEMENTS AS AT DECEMBER 31st, 2012
STATEMENT OF COMPREHENSIVE INCOME - Net amounts Company: CATTOLICA ASSICURAZIONI GROUP (€ thousands) 2012 2011 CONSOLIDATED RESULT 84,043 41,805 Change in reserve for net exchange differences 0 0 Gains or losses on available for sale financial assets 322,968 -147,573 Profits or losses on cash flow hedging instruments -2,729 0 Profits or losses on instruments hedging a net investment in foreign operations 0 0 Change in the equity of investee companies 3,135 -2,717 Change in intangible assets revaluation reserve 0 0 Change in tangible assets revaluation reserve 0 0 Income and charges relating to non current assets or disposal group held for sale 0 0 Actuarial gains and losses and adjustments related to defined-benefit plans 0 0 Other items 0 0 TOTAL OF THE OTHER COMPONENTS OF THE STATEMENT OF COMPREHENSIVE INCOME 323,374 -150,290 TOTAL OF THE CONSOLIDATED STATEMENT OF COMPREHENSIVE INCOME 407,417 -108,485 pertaining to the Group 294,947 -69,840 pertaining to minority interests 112,470 -38,645
Statement of comprehensive income

101

102
CONSOLIDATED FINANCIAL STATEMENTS AS AT DECEMBER 31st, 2012 Company: CATTOLICA ASSICURAZIONI GROUP (€ thousands) 2012 2011 Net profit (loss) for the year before taxation 158,839 21,002 Changes in non-monetary items -515,201 -291,331 Change in non-life premiums provision, net 66,870 21,760 Change in provision for outstanding claims and other non-life technical provisions -39,690 -63,175 Change in mathematical provisions and other life technical provisions -491,147 -468,915 Change in deferred acquisition costs, net -2,918 -5,159 Change in provisions and allowances 2,085 -16,444 Non-monetary income and charges deriving from financial instruments, investment property and equity investments -100,680 272,070
Other changes 50,279 -31,468 Change in receivables and payables generated by operating activities 40,667 -65,279 Change in receivables and payables deriving from direct insurance and reinsurance transactions 86,006 -31,388 Change in other receivables/payables, other asset/liabilities -45,339 -33,891 Taxes paid -134,338 -16,431 Net liquidity generated/absorbed by monetary items pertaining to investments and financing activities -92,190 -37,741 Liabilities from financial contracts issued by insurance companies -92,190 -31,514 Payables due to banking and interbank customers 0 0 Loans and receivables due from banking and interbank customers 0 0 Other financial instruments at fair value through profit or loss 0 -6,227 TOTAL NET LIQUIDITY DERIVING FROM OPERATIONS -542,223 -389,780 Net liquidity generated/absorbed by investment property -17,200 -523 Net liquidity generated/absorbed by investments in subsidiaries, associates and joint ventures 0 610 Net liquidity generated/absorbed by business combinations 0 0 Net liquidity generated/absorbed by loans and receivables 325,863 -198,730 Net liquidity generated/absorbed by held to maturity investments 4,897 -193,228 Net liquidity generated/absorbed by available for sale financial assets -45,675 38,924 Net liquidity generated/absorbed by tangible and intangible assets -124,875 -13,626 Other net liquidity flow generated/absorbed by investment activities 562,565 608,556 TOTAL NET LIQUIDITY DERIVING FROM INVESTMENT ACTIVITIES 705,575 241,983 Net liquidity generated/absorbed by capital instruments pertaining to the Group 7,512 -14,417 Net liquidity generated/absorbed by own shares -3,572 0 Distribution of dividends pertaining to the Group 0 -48,680 Net liquidity generated/absorbed by capital and reserves pertaining to minority interests -25,655 32,352 Net liquidity generated/absorbed by subordinated liabilities and by participative financial instruments 0 0 Net liquidity generated/absorbed by sundry financial liabilities 58,836 0 TOTAL NET LIQUIDITY DERIVING FROM FINANCING ACTIVITIES 37,121 -30,745 Effect of the exchange differences on cash and cash equivalents 0 0 CASH AND CASH EQUIVALENTS AT THE BEGINNING OF THE YEAR 407,238 585,780 INCREASE (DECREASE) IN CASH AND CASH EQUIVALENTS 200,473 -178,542 CASH AND CASH EQUIVALENTS AT THE END OF THE YEAR 607,711 407,238
Statement of cash flows

103
CONSOLIDATED FINANCIAL STATEMENTS AS AT DECEMBER 31st, 2012 Company: CATTOLICA ASSICURAZIONI GROUP
(€ thousands)
Balance Dec. 31st,
2010
Change in closing
balances Charges
Adjustments from
reclassification to income
statement Transfers Balance Dec.
31st, 2011
Share capital 162,263 0 3 0 162,266
Other equity instruments 0 0 0 0 0 Shareholders'
equity Capital reserves 690,917 0 -12,245 0 678,672
pertaining to Revenue reserve and other reserves 291,617 0 67,449 -48,680 310,386
the Group (Own shares) 0 0 0 0 0
Profit (loss) for the year 62,047 0 -24,599 0 37,448
Other components of the statement of comprehensive income -63,060 0 -171,474 64,186 0 -170,348
Total pertaining to the Group 1,143,784 0 -140,866 64,186 -48,680 1,018,424 Shareholders'
equity Capital and reserves pertaining to minority interests 226,859 0 44,918 -2,278 269,499
pertaining to Profit (loss) for the year 8,396 0 -4,039 0 4,357 minority interests
Other components of the statement of comprehensive income -25,812 0 -68,283 25,281 0 -68,814
Total pertaining to minority interests 209,443 0 -27,404 25,281 -2,278 205,042
TOTAL 1,353,227 0 -168,270 89,467 -50,958 1,223,466
(€ thousands)
Balance Dec. 31st,
2011
Change in closing
balances Charges
Adjustments from
reclassification to income
statement Transfers Balance Dec.
31st, 2012
Share capital 162,266 0 8,113 0 170,379
Other equity instruments 0 0 0 0 0 Shareholders'
equity Capital reserves 678,672 0 -22,061 0 656,611
pertaining to Revenue reserves and other reserves 310,386 0 58,501 0 368,887
the Group (Own shares) 0 0 0 -3,572 -3,572
Profit (loss) for the year 37,448 0 24,431 0 61,879
Other components of the statement of comprehensive income -170,348 0 127,537 105,531 0 62,720
Total pertaining to the Group 1,018,424 0 196,521 105,531 -3,572 1,316,904 Shareholders'
equity Capital and reserves pertaining to minority interests 269,499 0 -2,317 -18,980 248,202
pertaining to Profit (loss) for the year 4,357 0 17,807 0 22,164 minority interests
Other components of the statement of comprehensive income -68,814 0 60,450 29,856 0 21,492
Total pertaining to minority interests 205,042 0 75,940 29,856 -18,980 291,858
TOTAL 1,223,466 0 272,461 135,387 -22,552 1,608,762
Statement of changes in equity

104


Reconciliation statement of the result of the period and shareholders’ equity of the Group and the Parent Company


109
CONSOLIDATED FINANCIAL STATEMENTS AS AT DECEMBER 31st, 2012
Company: CATTOLICA ASSICURAZIONI GROUP Share capital Profit (loss) Shareholders’
(€ thousands) and reserves for the period equity
Parent Company amounts It Gaap 1,244,016 58,698 1,302,714
Adjustment Ias/Ifrs - Parent Company 185,327 -4,023 181,304
Parent Company amounts IAS/IFRS 1,429,343 54,675 1,484,018
Adjustment Ias/Ifrs - subsidiary companies 0 0 0
Netting of the book values of the equity investments included in the scope of consolidation:
- difference between the book value and the pro-quota value of the shareholders' equity -168,932 0 -168,932
- pro-quota results of the investee companies 0 30,178 30,178
- capital gains from sale of equity investments recorded in the consolidated fin. stat. 0 0 0
- goodwill 202,108 -21,449 180,659
- value of portfolio 13,394 -4,800 8,594
Netting of infra-group transactions:
- dividends from consolidated companies 17,353 -17,353 0
- write-back of effects of equity investment transfers 0 0 0
- reversal of infra-group real estate transactions 0 0 0
- reversal of effects of mergers among Group companies -52,390 824 -51,566
- reversal of effects of infragroup business segment transfers -173,034 723 -172,311
- writebacks from writedowns -20,230 20,230 0
Tax effects of above-mentioned consolidation adjustments 5,479 -1,051 4,428
Effects associated with non-consolidated companies:
Effects associated with the valuation of non-consolidated companies 1,840 -4 1,836
Dividends from associated companies 94 -94 0
Shareholders' equity and net profit pertaining to the Group 1,255,025 61,879 1,316,904
Shareholders' equity and net profit pertaining to minority shareholders’ 269,694 22,164 291,858
CONSOLIDATED SHAREHOLDERS' EQUITY AND NET PROFIT 1,524,719 84,043 1,608,762
Reconciliation statement of the result of the period and shareholders’ equity of the Group and the Parent Company

110


Notes to the accounts


Notes to the accounts Part A – Basis of presentation and consolidation area


117
Notes to the accounts
Applicable legislation
The consolidated financial statements have been drawn up by the Parent Company Società Cattolica di Assicurazione - Soc. Coop. in pursuance of Article 154 ter, paragraph 1 of Italian Legislative Decree No. 58 dated February 24th, 1998 “Testo unico delle disposizioni in materia di intermediazione finanziaria” and Article 95 of Italian Legislative Decree No. 209 dated September 7th, 2005, in observance of the provisions envisaged by the IAS/IFRS international accounting standards and by the SIC/IFRIC interpretations, taking as reference those approved by the European Commission as of December 31st, 2012; they are compliant with the indications of ISVAP Regulation No. 7 dated July 13th, 2007, relating to the technical forms of the consolidated financial statements drawn up on the basis of the IAS/IFRS international accounting standards and subsequent amendments made by means of ISVAP Instruction No. 2784 dated March 8th, 2010. The provisions set forth by CONSOB Regulation No. 11971 adopted with resolution of May 14th, 1999 and subsequent additions and amendments, and Consob recommendations, have also been followed. The recommendations contained in the joint Bank of Italy/Consob/Isvap Documents No. 2 dated February 2009 and No. 4 dated March 2010 regarding the application of the IAS/IFRS were also taken into consideration.
Accounting reference date
The consolidated financial statements closed as of December 31st, 2012, a date which coincides with that of the financial statements of all the companies included within the scope of consolidation. The statements drawn up according to the international accounting standards (IAS/IFRS) as approved by the Boards’ of Directors of the respective companies who are not obliged to adopt the afore-mentioned international accounting standards for the purpose of drawing up the statutory financial statements, have been used for the preparation of the consolidated financial statements. Cattolica Life prepared its financial statements in compliance with the international accounting standards. The statements drawn up by the companies have been used for the funds.
CONSOLIDATION METHODS
a) Line-by-line- consolidation
The use of the line-by-line consolidation method, in accordance with IAS 27, i nvolves the consolidation of all the subsidiary companies in which the Parent Company directly or indirectly holds more than half of the voting rights, and of those in relation to which the Parent Company has the power to determine the financial and operating policies so as to obtain the benefits of their activities, despite not availing of more than half of the voting rights. When using the line-by-line consolidation method, the book value of the equity investments is eliminated against the related shareholders’ equity and all the assets and liabilities of the subsidiary company, including potential liabilities, are included. The positive difference which is generated between the purchase cost and the fair value of the net interest holdings acquired, independently identifiable, with reference to the date of acquisition of control over the equity investment, is recorded under the item “Goodwill”. This value is subject to an annual impairment test as disciplined by IAS 36.
Part A Basis of presentation and consolidation area

118
In the periods after the acquisition of control, the difference between the book value of the equity investment and the portion of shareholders’ equity pertaining to the Group is recorded, for the part exceeding the above described allocation referring to the acquisition date, in the item “revenue reserve and other equity reserves”. The portions of shareholders’ equity, inclusive of the fair value as of the date of acquisition of the equity investment, and of the net result for the year pertaining to minority shareholders, are recorded in specific balance sheet liability and income statement items.
b) Equity method
In accordance with IAS 28, the equity method is applied to equity investments in associated companies. By means of this method, the book value of the equity investment is adjusted in the consolidated financial statements in order to reflect the book value of the shareholders’ equity pertaining to the Group, which can be taken from the last set of financial statements of the investee company and adjusted by the sum of the dividends distributed by the said company. If the cost is greater than the pertinent portion of shareholders’ equity, the difference remaining from the charging to the amortisable/depreciable assets is identified as “goodwill” and subject to an impairment test as disciplined by IAS 36. The effects of the equity method on the Group’s shareholders’ equity and consolidated result for the year are the same as those produced by line-by-line consolidation.
c) Companies carried at cost
Equity investments in subsidiary companies which, due to their size, are considered not to be significant and whose exclusion from the scope of consolidation does not prejudice the reliability of the representation of the equity and financial standing, the economic result and the financial flows of the Group, are carried at cost.
d) Main consolidation adjustments
The main consolidation adjustments are: • the elimination of balances and infragroup transactions, including revenues, costs and
collected dividends; • the elimination of gains and losses deriving from infragroup transactions included in the
book value of the assets and liabilities; • the determination of the deferred taxation, in accordance with the methods envisaged by
IAS 12, on t he temporary differences deriving from the elimination of gains or losses originating from infragroup transactions;
• the adjustment of the effects recorded in the individual financial statements, generated by extraordinary infragroup transactions.
The decreases emerging in consequence of infragroup transactions are maintained in the consolidated financial statements.
SCOPE OF CONSOLIDATION
The scope of consolidation includes the financial statements of the Parent Company and those of the subsidiary companies, in accordance with IAS 27.

119
Notes to the accounts
During the year, the scope of consolidation changed with respect to December 31st, 2011 due to the mergers by incorporation of San Miniato Previdenza in the Parent Company and Cattolica Assicurazioni Business School in Cattolica Services, the acquisition of the Perseide fund and the establishment of two new companies Cattolica Agricola and Cattolica Beni Immobili. As at December 31st, the scope of consolidation included eleven insurance companies, two companies which carry out agricultural-real estate activities, four service companies, three real estate property mutual funds and one equity mutual fund. Besides the companies included within the scope of consolidation, the Group comprises a banking company and two service companies.
1) The following companies are included in the consolidated financial statements on a line-by-line basis in accordance with IAS 27:
• Società Cattolica di Assicurazione – soc. coop. with registered offices in Verona, share
capital of € 170.379 million – the Parent Company; • ABC Assicura s.p.a. with registered offices in Verona, share capital of € 8.925 million. It
carries out non-life insurance activities. The Parent Company holds a direct equity investment of 60%;
• BCC Assicurazioni s.p.a. with registered offices in Milan, share capital of € 14.448 million. It carries out non-life insurance activities. The Parent Company holds a direct equity investment of 51%.
• BCC Vita s.p.a. with registered offices in Milan, share capital of € 62 million. It carries out life insurance activities. The Parent Company holds a direct equity investment of 51%;
• Berica Vita s.p.a. with registered offices in Vicenza, share capital of € 31 million. It carries out life insurance activities. The Parent Company holds a direct equity investment of 60%;
• Cattolica Agricola s.r.l. with registered offices in Verona, share capital of € 35.5 million. It carries out agricultural activities. The Parent Company holds a direct equity investment of 100%;
• Cattolica Beni Immobili s.r.l. with registered offices in Verona, share capital of € 7 million. It carries out activities for the management of the properties not used for agricultural activities care of Tenuta Cà Tron. The Parent Company holds a direct equity investment of 100%;
• Cattolica Immobiliare s.p.a. with registered offices in Verona, share capital of € 400 thousand; the company carries out activities for developing and turning to account the real estate assets and those typical of property services. The Parent Company holds a d irect equity investment of 100%;
• Cattolica Life ltd with registered offices in Dublin, Ireland, share capital € 635 thousand; it carries out life insurance activities. The Parent Company holds a direct equity investment of 60%.
• Cattolica Previdenza s.p.a. with registered offices in Milan, share capital of € 14.35 million; the company is authorised to carry out life insurance activities and non-life activities in relation to the accident, injury and health classes only. The Parent Company’s holding rose from 80.14% to 100%, further to the purchase of the residual investment holding from Intesa Sanpaolo Vita;

120
• Cattolica Services s.c.p.a., with registered offices in Verona, share capital of € 20.954 million; it carries out its activities for the Group companies, offering them IT and telecommunications services, handling the claims settlements with the exception of the security, hail and transport areas. As from the current year, the company also sees to the supply of teaching and training services, following the merger by incorporation of Cattolica Assicurazioni Business School, as well as Fabbrica Vita. The Parent Company owns a d irect equity investment of 99.95% and the remainder is held individually for 0.005% by ABC Assicura, BCC Assicurazioni, BCC Vita, Berica Vita, Cattolica Previdenza, C.P. Servizi Consulenziali, Duomo Uni One, Lombarda Vita, Risparmio & Previdenza and TUA Assicurazioni;
• Cattolica Services Sinistri s.p.a. (formerly Car Full Service) with registered offices in Milan, share capital of € 150 thousand, is the Group company dedicated to the development of the products and services linked to the motor industry. Cattolica Services’ direct equity investment comes to 82%;
• C.P. Servizi Consulenziali s.r.l. with registered offices in Milan, share capital of € 15 thousand, carries out brokerage activities for premiums written in the life and non-life sectors. The Parent Company owns a d irect equity investment of 51%, while that of Cattolica Previdenza comes to 49%;
• Duomo Uni One Assicurazioni s.p.a. with registered offices in Milan, share capital of € 8.878 million. It carries out non-life insurance activities. The Parent Company holds a 99.99% direct equity investment in the company;
• Fondo Euripide, managed by Finanziaria Internazionale Investments SGR, is a closed-end real estate property mutual investment fund. Cattolica holds an interest of 41.63%, Berica Vita 10.18%, Cattolica Previdenza 2.04%, Lombarda Vita 45.47%, and Tua Assicurazioni 0.68%;
• Fondo Macquarie Office Italy, managed by CB Richard Ellis Investors, is a closed-end real estate property mutual investment fund. Cattolica holds an interest of 61.83%, BCC Vita 10.36%, Cattolica Previdenza 4.14%, Lombarda Vita 17.75%, and Risparmio & Previdenza 5.92%;
• Fondo Networth, managed by Vegagest SGR, is a closed-end mutual investment equity fund reserved for qualified investors who invest in activities intended for the creation and construction of electricity generation plants using renewable sources. It is 99.76% owned by Cattolica;
• Fondo Perseide, managed by Finanziaria Internazionale Investments SGR, is a closed-end real estate property mutual investment fund. It is 100% owned by Cattolica;
• Lombarda Vita s.p.a. with registered offices in Brescia, share capital of € 185.3 million. It carries out life insurance activities. The Parent Company holds a direct equity investment of 60%;
• Risparmio & Previdenza s.p.a. with registered offices in Verona, share capital of € 73.75 million. The subsidiary is a life insurer and has been active in non-life insurance in the accident, injury and health classes only. The Parent Company holds a direct equity investment of 97.58%;
• TUA Assicurazioni s.p.a. with registered offices in Milan, share capital of € 15.66 million. It carries out non-life insurance activities. The Parent Company holds a direct equity investment of 97%;

121
Notes to the accounts
Table 15 – Scope of consolidation (ISVAP Regulation No. 7 dated July 13th, 2007)
Country Method Assets % direct
investment % total holding
% of votes available
during ordinary
shareholders'
meetings
% consolida
tion
Name (1) (2) (3) (4) Società Cattolica di Assicurazione - Soc. Coop. 086 G 1
ABC Assicura s.p.a. 086 G 1 60.00% 60.00% 100%
BCC Assicurazioni s.p.a. 086 G 1 51.00% 51.00% 51.02% 100%
BCC Vita s.p.a. 086 G 1 51.00% 51.00% 100%
Berica Vita s.p.a. 086 G 1 60.00% 60.00% 100% Cattolica Services Sinistri s.p.a. (formerly Car Full Service s.p.a.) 086 G 11 0.00% 81.99% 100%
C. P. Servizi Consulenziali s.r.l. 086 G 11 51.00% 100.00% 100%
Cattolica Agricola s.r.l. 086 G 10 100.00% 100.00% 100%
Cattolica Beni Immobili s.r.l. 086 G 10 100.00% 100.00% 100%
Cattolica Immobiliare s.p.a. 086 G 11 100.00% 100.00% 100%
Cattolica Life l.t.d. 040 G 2 60.00% 60.00% 100%
Cattolica Previdenza s.p.a. 086 G 1 100.00% 100.00% 100%
Cattolica Services s.c.p.a 086 G 11 99.95% 99.99% 100%
Duomo Uni One Assicurazioni s.p.a. 086 G 1 99.99% 99.99% 100%
Fondo Euripide 086 G 10 41.63% 77.72% 100%
Fondo Macquarie Office Italy 086 G 10 61.83% 87.68% 100%
Fondo Networth 086 G 11 99.76% 99.76% 100%
Fondo Perseide 086 G 10 100.00% 100.00% 100%
Lombarda Vita s.p.a. 086 G 1 60.00% 60.00% 100%
Risparmio & Previdenza s.p.a. 086 G 1 97.58% 97.58% 100%
TUA Assicurazioni s.p.a. 086 G 1 97.00% 97.00% 100%
(1) Method of consolidation: Line-by-line =G, Proportional=P, Line-by-line by single HQ=U. (2) 1=Italian insurance; 2=EU insurance; 3=non-EU insurance; 4=insurance holding company; 5=EU reinsurance; 6=non-EU reinsurance; 7=banks; 8=SGR; 9=other holding; 10=real estate 11=other. (3) this is the product of the investment relationships relating to all the companies which, placed along the investment chain, may be interposed between the company that draws up the consolidated financial statements and the company in question. If the latter is directly invested in by several subsidiary companies, it is necessary to add together the individual products.
(4) Overall percentage available of the votes at ordinary shareholders' meeting if different from direct or indirect shareholding.
2) The following companies are accounted using the equity method in accordance with IAS 28: Associated companies
• Cassa di Risparmio di San Miniato s.p.a. with registered offices in San Miniato (PI),
share capital of € 159.824 million; it carries out banking activities. The Parent Company holds a direct equity investment of 25.07%;

122
• Prisma s.r.l. with registered offices in Milan, share capital of € 120 thousand, carries out insurance agency activities. The Parent Company holds a direct equity investment of 20%;
3) The following company is carried in the consolidated financial statements at cost, since it is not significant and its exclusion from the scope of consolidation does not prejudice the reliability of the representation of the financial and equity standing, the economic result and the financial flows of the Group:
Subsidiary company
• TUA Retail s.r.l. with registered offices in Milan, share capital of € 50 thousand. It is
wholly-owned by TUA Assicurazioni. It carries out the general agency activities of TUA Assicurazioni.
A schedule of the Group companies with indication of the consolidation method adopted is
shown below.

123
Notes to the accounts
Consolidated line-by-line
Berica Vita
Cattolica Previdenza
Lombarda Vita
Risparmio &Previdenza
Cattolica Life
60%
100%
60%
97,58%
60%
ABC Assicura
BCC Assicurazioni
Duomo Uni OneAssicurazioni
TUA Assicurazioni
60%
51%
99.99%
Cattolica Beni Immobili
100%
Equity method
PrismaCassa di Risparmio di San Miniato
25.07%
Carried at cost
TUA Retail
Non life insurance Life insurance Operating servicesReal estate - agricultural Banks
100%
41.63%
20%
As of December2012
(*) 0.005% of the share capital of Cattolica Services is held individually by ABC Assicura, BCC Assicurazioni, BCC Vita, Berica Vita, Cattolica Previdenza, C.P. Servizi Consulenziali, Duomo Uni One,Lombarda Vita, Risparmio & Previdenza and TUA Assicurazioni.(**) Until February 25, 2013 the name was Car Full Service.(***) The remaining 58.37% is held as follows: 10.18% by Berica Vita, 2.04% by Cattolica Previdenza, 45.47% by Lombarda Vita and 0.68% by TUA Assicurazioni(****) The remaining 38.7% in held as follows: 10.36% by BCC Vita, 4.14% by Cattolica Previdenza, 17.75% by Lombarda Vita and 5.92% by Risparmio & Previdenza.
99.95%BCC Vita
51%
61.83%
Fondo Networth99.76%
97%
82%
49%
51%
Cattolica Services (*)
Cattolica ServicesSinistri (**)
C.P. ServiziConsulenziali
Fondo Euripide (***)
Fondo Macquarie OfficeItaly (****)
Real estate funds Equity funds
Fondo Perseide100%
Cattolica Agricola100%
100%Cattolica Immobiliare


Notes to the accounts Part B – Accounting principles

127
Notes to the accounts
Format
The statement of financial position, the income statement, the statement of comprehensive income, the statement of changes in equity, the statement of cash flows and the notes to the accounts have been drawn up in accordance with the formats laid down by the instructions in ISVAP Regulation No. 7 dated July 13th, 2007, as amended by ISVAP Instruction No. 2784 dated March 8th, 2010.
Accounting standards
The accounting standards adopted for the preparation of the consolidated financial statements are consistent with the principles of each IAS/IFRS standard and each SIC/IFRIC taking as reference those ratified by the European Commission.
New standards and interpretations acknowledged by the EU
Applicable from January 1, 2012 On October 7th, 2010 the IASB published a number of amendments to IFRS 7 – Financial instruments: Disclosures. These amendments aimed to improve the disclosure on t ransfer transactions (derecognition) of financial assets. Specifically, the amendments require greater transparency in relation to the exposure to risks in the event of transactions in which a financial asset is transferred, but where the transferor maintains some form of continuing involvement in this asset. The adoption of this amendment in these financial statements has not had any significant effects on the disclosure produced. Approved, applicable after 2012 and not adopted in advance On May 12th, 2011 the IASB issued IFRS 10 - Consolidated financial statements which will replace SIC-12 and parts of IAS 27, which will be renamed Separate financial statements and will discipline the accounting treatment of investments in the separate financial statements. The new standard introduces a more solid definition of control with respect to the past. Specifically, IFRS 10 requires that an investor, in order to assess whether it has control over the company acquired, focuses on the activities which considerably influence the performances of the same, also envisaging that in assessing the existence of control, only the essential rights are considered, or rather those which can in practice be exercised when important decisions must be adopted with regard to the company acquired. The standard is applicable retrospectively as from January 1st, 2014. On May 12th, 2011 the IASB issued IFRS 11 - Joint arrangements which will replace IAS 31 and SIC-13. The new standard establishes the equity method as the only method for the recognition of investments in jointly-controlled companies and provides criteria for the accounting treatment of the joint arrangements based on the rights and the obligations deriving from the arrangements rather than on t he legal form of the same. The new standard is applicable retrospectively as from January 1st, 2014. Further to the issue of standard, IAS 28 was amended so as to include within its scope also investments in jointly-controlled companies. On May 12th, 2011 the IASB issued IFRS 12 - Disclosure of interests in other entities; this standard aims to discipline the additional information to be provided in the consolidated financial statements for each type of investment, including therein those in subsidiaries, associated companies, joint arrangements, special purpose companies and other non-consolidated vehicles companies. The standard is applicable retrospectively as from January
Part B Accounting principles

128
1st, 2014. On May 12th, 2011 the IASB issued IFRS 13 - Fair value measurement which illustrates how the fair value must be calculated for the purposes of the financial statements and applied to all the cases where the standards envisage or permit the valuation at fair value or the presentation of information based on t he fair value, with a number of limited exclusions. Furthermore, disclosure is required on the fair value measurement (fair value hierarchy) which is more extensive than that currently required by IFRS 7. The standard is applicable prospectively as from January 1st, 2013. On June 16th, 2011 the IASB issued an amendment to IAS 1 - Presentation of financial statements so as to request companies to group together all the components presented in the Statement of “Other comprehensive income” according to whether they could be reclassified subsequently in the income statement or not. The amendment will be applicable as from the accounting periods starting from July 1st, 2012. On June 16th, 2011 the IASB issued an amendment to IAS 19 - Employee benefits. By means of this amendment, the option of deferring the recognition of the actuarial gains and losses using the corridor method was eliminated, requesting the presentation in the balance sheet of the deficit or surplus of the fund and the recognition in the income statement of the cost components linked to the cost service and the net interest cost, as well as the recording of the actuarial gains and losses which derive from the re-measurement of the liabilities and assets under Other comprehensive income. In conclusion, the amendment introduces new additional information to be provided in the notes to the financial statements. The amendment is applicable retrospectively as from the accounting period which commences after or as from January 1st, 2013. On December 16, 2011 the IASB issued a number of amendments to IAS 32 - Financial instruments: presentation, in order to clarify the application of certain criteria for the offsetting of the financial assets and liabilities present in IAS 32, in fact making this more difficult. The amendments are applicable retrospectively for the accounting periods commencing as from or after January 1st, 2014. On December 16th, 2011 the IASB issued a number of amendments to IFRS 7 Financial instruments: disclosures. The amendment requires information on t he effects or potential effects of the offsetting of financial assets and liabilities in the balance sheet of a company. This amendment will have to be applied for the accounting periods commencing on January 1st, 2013. The information will have to be provided retrospectively.
Reporting currency used in the financial statements
The reporting currency for the consolidated financial statements is the Euro. The statements have been drawn up in thousands of Euro without decimal figures, duly rounded off as per the applicable regulation. The amounts have been rounded up or down to the closest unit. The rounded off amount of totals and subtotals in the balance sheet and income statement is the sum of the rounded off amounts of the individual items.
Foreign currency items
In accordance with IAS 21 the monetary assets and liabilities in foreign currency, with the exception of financial instruments, are recorded using the spot exchange rate ruling as of the period end date and the related exchange gains and losses are charged to the income statement.

129
Notes to the accounts
Section 1 Illustration of the accounting policies
The accounting policies used to draw up the consolidated financial statements are the same as those used to prepare the IAS/IFRS statements of the Parent Company and the other Group companies who are not obliged to adopt the afore-mentioned international accounting standards for the purpose of drawing up the statutory financial statements. Cattolica Life prepared its financial statements in compliance with the international accounting standards. No significant consolidation adjustments were necessary in order to adapt the consolidated companies’ accounting standards and policies to those of the Parent Company, with the exception of investment property held by the Euripide, Macquarie Office Italy and Perseide funds which in their accounts value said properties at fair value and therefore, for the purpose of the consolidated financial statements, are stated at historic cost less the related accumulated depreciation. The preparation of the Group’s financial statements requires the directors to make discretional evaluations, estimates and hypotheses which influence the revenue, cost, asset and liability values, and the indication of potential liabilities as of the balance sheet date. These estimates mainly concern: • the technical provisions; • the fair value of assets and liabilities if not directly observable on active markets; • the analysis for the purpose of the impairment test on intangible assets; • the recoverable nature of the deferred tax assets; • the defined-benefit plans; • the provisions and allowance for risks and charges.
The uncertainty regarding these hypotheses and estimates could lead to results which in the future will require a significant adjustment in the book value of these assets and/or liabilities.
Going concern According to the provisions of Bank of Italy/CONSOB/ISVAP document No. 2 da ted February 6th, 2009, it should be noted that the economic outlook is positive, even though there are uncertainties linked to the performance of the markets and rates in particular, taking account of the timescales and ways in which the current situation is developing; the Group’s solid fundamentals do not generate or leave any doubts regarding going concern.
STATEMENT OF FINANCIAL POSITION
INTANGIBLE ASSETS Goodwill The item comprises the goodwill acquired in the business combinations as established by IFRS
3. The goodwill deriving from consolidation represents the additional value of the purchase cost when compared with the value of the assets, liabilities and potential liabilities, valued at fair value, of the subsidiary company. The goodwill is stated as an asset and recorded at cost less the accumulated impairment losses. As prescribed by IAS 36, an impairment test is carried out

130
at least once a year; the procedure of the impairment test was supplemented and approved by the Board of Directors in February. Furthermore, on the basis of the provisions of IAS 36, at the end of each accounting period, it is analysed whether any trigger events have taken place such as stock market capitalisation lower than the Group’s shareholders’ equity or whether the flows of the cash generating units to which the goodwill is allocated have registered significant negative deviations; if this occurs, the value of the goodwill is subjected to a specific impairment test, based on discounted cash flow techniques. A permanent loss in value is recorded if the book value of the cash generating unit to which the goodwill refers is greater than its recoverable value, i.e. the higher between value in use and fair value less costs of disposal; this impairment loss reduces the book value of the goodwill and residually that of the other assets of the cash generating unit in proportion to their book value. In the event of the disposal of a subsidiary company, the residual amount of the goodwill ascribable to the same is included in the disposal value and therefore in the determination of the capital gain or loss on the disposal.
Other intangible assets
The item comprises the assets defined and disciplined by IAS 38. It also includes the value of the insurance portfolio acquired as part of the business combination transaction and by contrast, excludes deferred purchase costs. An intangible asset is recognised, and therefore capitalised, only when it is subject to the control of the company, it is identifiable and it is probable that it will generate future economic benefits and when the cost can be reliably determined. These assets are carried at cost less any accumulated amortisation and any accumulated impairment losses. There are no intangible assets present in the financial statements with an undefinite useful life as established in IAS 38. Depreciable amount of an intangible asset shall be allocated on a systematic basis over its useful life, and shall begin when the asset is available for use, i.e. when it is in the location and condition necessary for the capable of operating in the manner intended by management. In general, except in specific cases, the useful life is established in 5 years with an amortisation rate of 20% per annum for all the intangible assets with the exclusion of insurance portfolios whose period of amortisation ranges from four to eleven years. Intangible assets are periodically subject to the impairment test.
TANGIBLE ASSETS Property This item includes the property intended to be used for business activities.
These assets are carried at cost less any related accumulated depreciation and any impairment losses. Cost comprises the related charges directly ascribable to the purchase and the putting into operation of the asset.

131
Notes to the accounts
For entire premises, the value of the land is separated from the value of the building; the latter is depreciated. For portions of jointly owned property, the division of the two values has not been provided as the benefit in disclosure terms is lower with respect to the cost to be incurred for the determination of the data item; therefore, the entire property is depreciated. The depreciation of the buildings is calculated, on a straight-line basis, in relation to the useful life estimated as thirty-three years. Ordinary maintenance costs are charged to the income statement; those which by contrast lead to an increase in value, or the functionality or useful life of the assets, are allocated to the assets and depreciated. Property intended to be used for business activities is periodically subject to verification of whether the book value is recoverable or not, and is eliminated from the financial statements following disposal or in the event of the depletion of the expected economic benefits.
Other tangible assets
This category includes movable assets, furnishings and office machines. These assets are carried at cost net of accumulated depreciation and any impairment losses. The depreciation is calculated, on a straight-line basis, in relation to the estimated useful life of the related assets using economic-technical rates. The book value of the tangible assets is subject to verification so as to reveal any impairment losses.
INVESTMENTS Investment property
This item includes the property held for investment purposes (IAS 40), owned by the Company; the purpose of the ownership of said property is so that the Company receives rental payments, or so as to increase the value of the investments, or both. This category also includes property intended to be sold, which in any event does not comply with the requirements of IFRS 5, since these are assets originally held so as to gain profit from the appreciation of the capital. For entire premises, the value of the land is separated from the value of the building; the latter is depreciated. For portions of jointly owned property, the division of the two values has not been provided for in that the benefit in disclosure terms is lower with respect to the cost to be incurred for the determination of the data item; therefore, the entire property is depreciated. These assets are carried at cost net of related accumulated depreciation and any impairment losses. The depreciation of the buildings is calculated, on a straight-line basis, in relation to the useful life.

132
Ordinary maintenance costs are charged to the income statement in the year that they are incurred; those which by contrast lead to an increase in value, or the functionality or useful life of the assets, are allocated to the assets and depreciated. Investment property is periodically subject to verification of whether the book value is recoverable or not, and are eliminated from the financial statements following disposal or in the event of the depletion of the expected economic benefits.
Investments in subsidiaries, associates and joint ventures
When determining the investment relationship, the definitions of control, significant influence and joint control anticipated by IAS 27, 28 and 31 have been used. This item also includes equity investments in subsidiary companies considered to be of an insignificant entity with respect to the Group or those which are dormant. Equity investments in subsidiary companies are stated by adopting the line-by-line consolidation method in pursuance of IAS 27. Equity investments in associated companies are accounted for in the financial statements using the equity method. The book value is subject to assessment so as to reveal any losses due to permanent reductions in value. In accordance with the provisions of IAS 31, jointly-controlled equity investments are recorded by adopting the proportional consolidation method. Equity investments in subsidiary and associated companies and in joint ventures are eliminated from the financial statements when, following disposal or other events, the requisites envisaged by IAS 27, 28 and 31 for their recording, are lacking.
FINANCIAL ASSETS
The definition of financial assets includes the receivables from financing activities, debt securities and equities, units in mutual investment funds, loans on policies, receivable reinsurance deposits and other assets. The main accounting approach for the financial assets is the fair value which is represented by: • the price struck at the end of trading as of the period end date for the assets listed on an
active market; • the value determined using commonly used valuation techniques, also considering the
prices which can be taken from recent market transactions between informed and independent parties.
Financial assets are eliminated from the financial statements when, subsequent to maturity, disposal or another event, the contractual rights on the related financial flows are transferred, in addition to the associated risks and benefits. The purchases and sales of a financial asset are recorded as at the settlement date. With regard to financial assets, the fair value is determined by means of the use of prices

133
Notes to the accounts
acquired from public listings, in the event of instruments listed on active markets, or by means of the use of valuation models. An instrument is considered as listed on an active market if the listed prices are promptly and duly available via stock markets, brokers, intermediaries, companies specialized in the sector, listing services or regulatory bodies and represent effective and regular market transactions which have taken place within an adequate reference interval promptly adapting to market changes. In the absence of an active market or a market which does not have a sufficient or permanent number of transactions, the fair value is determined by means of the use of valuation models, generally applied and accepted by the internal market, with the aim of determining the exchange price of a hypothetical transaction which has taken place under market conditions which can be defined as “normal and independent”. These valuation techniques take into account: • values taken from an active market indirectly linkable by features to the instrument to be
valued; • input not taken from variables which can be directly observed on t he market for which
estimates and hypotheses are also made.
When defining fair value, the following priority (hierarchy) is always assigned: • prices taken from a market defined as active (level 1); • prices different from those taken from a market defined as active (of which at level 1),
which are taken directly via at least one valuation of a qualified counterpart or indirectly via valuation models which have parameters which can be directly observed on an active market (level 2) as the input data;
• prices based on data which cannot be directly observed on t he market and which adopt more discretional hypotheses (level 3).
The following are considered to be listed on an active market and therefore classified as level 1: shares listed on regulated markets, bonds listed on national and international circuits which periodic contributions can be recorded for and with levels of volatility deemed suitable, ETF funds. With regard to level 1 financial instruments, the “bid” price of the last transaction day available as of the date of valuation is used as the fair value. Financial instruments whose price cannot be found on a market defined as active (of which at level 1), but is directly inferred via at least one valuation of a qualified counterpart or indirectly via valuation models which have parameters which can be directly observed on an active market as the input data, are classified in the fair value hierarchy as level 2. In the latter case, the valuations do not take place on the listed prices of the same financial instrument subject to valuation but on the comparison of prices, credit spreads, rates or other factors taken from the official listed prices of financial instruments which present essentially similar characteristics (comparable approach). These calculation methods make it possible to reproduce the prices of the financial instruments without including parameters defined as “discretional” capable of significantly influencing the final valuation price. The following are considered to be level 2 instruments: unlisted bonds, bonds underlying index-linked policies, property funds listed on r egulated markets, OTC options and swaps, covered warrants and warrants, mortgages, SICAVs and open-end UCITs, Hedge Funds, and Mezzanine Funds. The fair values of the bonds, including those of bonds underlying index-linked policies, lacking listed prices expressed by markets defined as active are determined by

134
means of the application of credit spreads identified starting off from the financial instruments contributed which are liquid with similar characteristics such as for example: the same rating, duration, issuer, etc. The OTC options and swaps, if not exchanged on organised markets, are valued by means of specific pricing models populated by input parameters which can be observed on markets such as rate curves, volatility, exchanges, etc.. With regard to level 3 financial instruments, the definition of the fair value takes place by means of the use of data which cannot be directly observed on the market or which lead to the adoption by the Group of estimates or hypotheses or other types of information taken for example from specialised sector research (rating agency analysis or reports). The following are included in the level 3 fair value hierarchy: • units in unlisted closed-end property funds and private equity funds whose price is
determined on the basis of the NAV values calculated by the management companies; • unlisted bonds whose fair value is estimated on the basis of the financial discounting
technique making appropriate amendments or additions so as to take into account other factors such as for example illiquidity which characterise them, loan quality, additional prudent adjustments which are matched by the opinions of experts or counterparts;
• strategic equity investments not listed on active markets whose price is estimated by means of models, generally adopted in valuation market practice, typically based on the discounting of flows;
• securities issued by issuers in default (Lehman Brothers bonds and bonds issued by Icelandic banks) recorded at estimated recoverable value;
• OTC options not valued by means of specific pricing models fed by input parameters which can be observed on markets (options with underlying shares or funds and lacking minimum coupons and/or playoff with minimum maturity);
• Enel ANIA bills maintained prudently, given their characteristics, at cost since the return on the same is higher than market levels.
With regard to financial liabilities valued at fair value, reference is made to the level of the corresponding asset.
Held to maturity investments (HTM)
Financial assets considered to be of long-term use, excluding financial derivative instruments, with a pre-established maturity and payments which are fixed or can be determined, which the individual Group companies intend to and have the ability to hold until maturity, are classified in this category. The initial recording takes place at cost inclusive of the charges and income directly attributable thereto. Subsequently, the investments are valued at amortised cost, net of any permanent impairment losses, using the effective interest rate. The amortisation rate thus calculated is recorded in the income statement. On the closure of each set of financial statements, it is assessed if objective evidence exists of any impairment losses. In accordance with the provisions of IAS 39, it is possible to make a reversal of impairment, if the reasons for the impairment losses have been removed, up to the limit of the previous write-down. In the event of early disposal or transfer to another category, of a significant amount not

135
Notes to the accounts
justified by particular events, the entire category is reclassified among the assets available for sale.
Loans and receivables
The assets, excluding financial derivative instruments, with a p re-established maturity and payments which are fixed or can be determined, not listed on active markets, which are not recorded in any of the other categories, are classified in this category. Specifically, the category includes all the loans and financing, the deposits from re-insurers with transferring companies and bonds not listed on active markets considered to be of long-term use. The loans and receivables are carried at amortised cost, net of any impairment losses, using the effective interest rate. The amortisation rate thus calculated is recorded in the income statement. On the closure of each set of financial statements, it is assessed if objective evidence exists of any permanent impairment losses.
Available for sale financial assets (AFS)
On a r esidual basis, this category includes all the equities, debt securities which are not classified as “loans and receivables”, “held to maturity investments”, and “financial assets at fair value through profit or loss”. As a r ule, equities classified as available for sale are valued at fair value with a m atching balance represented by a net equity reserve. In the event that the equities do not have a market price listed on an active market and whose fair value cannot be reliably determined, they are carried at cost, as are any related derivatives. By contrast, the mixed measurement model is used for debt securities, characterised by the joint existence of the amortised cost method and the valuation at fair value (with a matching balance represented by the same net equity reserve anticipated for equities). The net equity reserve remains recorded until the assets are disposed of or undergo a impairment loss. On occurrence of such events, the gains and losses recorded in the reserve are freed up and recorded in the income statement. On the closure of each set of financial statements, it is assessed if evidence exists of an impairment of the financial assets. Indicators of a possible impairment of the financial assets are for example: • significant financial difficulties of the issuer; • defaults or lack of payment of interest and principal; • the disappearance of an active market.
The process for recognising any impairment in particular envisages the identification of the assets which have lost value by checking of the presence: • for equities listed on regulated markets, of the performance of the security under more
than 40% with respect to the initial value recorded or a price lower than the initial value recorded for a continuous period of more 24 months;

136
• for listed debt securities and unlisted equities on r egulated markets, factors originating
inside the company subject to the evaluation; for example, significant difficulties of the issuer with deviations from budget targets, announcement of restructuring plans, downward review of the rating assigned by specialised companies higher than class “C”.
Financial assets at fair value through profit or loss
This category comprises the classification of all the financial assets included under trading activities, including derivatives, and all those which, despite not having been acquired in order to be sold over the short term, are included therein due to the Group’s decision as from their initial statement.
Specifically, the designated assets include the financial assets covering insurance or investment contracts whose investment risk is borne by the policyholders and those relating to the management of pension funds.
Initial recording takes place at cost, understood to be the fair value of the instrument net of costs or income directly or indirectly ascribable. Valuation gains and losses emerging subsequently from the changes in the fair value, are recorded directly in the income statement.
SUNDRY RECEIVABLES This category comprises the classification of the amounts receivable for premiums relating to
policyholders not yet received, amounts receivable from insurance agents and brokers and distributing banks, and co-insurance and reinsurance companies, amounts receivable for excesses and other receivables. The receivables are recorded at par value; since they are short-term, discounting back methods are not used. On the closure of each set of financial statements, an assessment is carried out on whether there is objective evidence of any impairment losses and, following the implementation of the impairment test, steps may be taken to effect a write-down.
OTHER ASSET ITEMS Non current assets or disposal group held for sale
All the non-current assets or those undergoing disposal whose sale is highly probable in accordance with the provisions established by IFRS 5, are recorded in this item. The non-current assets or disposal group held for sale are recorded at their book value or the fair value less costs to sell (discounted back in the event of sales which will conclude beyond 12 months) whichever is the lower.
Deferred acquisition costs
This category includes the acquisition commission relating to life insurance policies. Life acquisition commission is divided up, net of the portions pertaining to re-insurers, for a period of no longer than the duration of the policies, with a maximum limit of ten accounting periods, and in any event within the limit of the premium loadings present in the tariff. Acquisition commission relating to non-life insurance policies is not amortised as a result of the so-called Bersani bis Decree which introduced the faculty - for the policyholders - of

137
Notes to the accounts
withdrawing annually from long-term policies, without charges and by giving notice of sixty days.
Deferred tax assets
Deferred tax assets are recorded – except in the cases expressly anticipated by IAS 12 – for all the temporary differences, to the extent that it is probable that taxable income against which they can be used will be generated. In the presence of tax losses which can be carried forward or tax credits not utilised, deferred tax assets are recorded to the extent that it is probable that future taxable income will be available against which the afore-mentioned tax losses or unused tax credits can be used. The deferred tax assets are calculated on the basis of the tax rates and tax legislation in force or effectively in force as of the balance sheet date, and are subject to verification with regards to the recoverable nature if changes in the applicable tax legislation have occurred.
Current tax assets
Current tax assets include the assets relating to current taxes as established and disciplined by IAS 12. These assets are recorded on the basis of the tax rates in force.
Other assets The other assets mainly comprise deferred acquisition costs relating to investment contracts. The deferred acquisition costs are spread out over the estimated life of said contracts according to a constant percentage of the current value of the income generated by the investment contracts for the entire period of their permanence in the portfolio. The income margin determined at the time of the issue of contracts is checked on a periodic basis and any discrepancies are recorded directly in the income statement as additional amortisation of capitalised acquisition costs.
CASH AND CASH EQUIVALENTS Cash and cash equivalents and on-demand deposits recorded at par value are classified in this
category.
SHAREHOLDERS' EQUITY Shareholders' equity pertaining to the Group
This account group includes the instruments representative of the share capital, and the components representative of capital included in financial instruments making up t he associated equity reserves pertaining to the Group, such as convertible bonds and subordinated liabilities.
Share capital Capital reserves Revenue reserve and other reserves
The ordinary shares are stated at their nominal value as share capital. In particular, the item includes the share premium reserve of the Parent Company. The item includes:

138
• the gains and losses deriving from the initial application of the international accounting standards in accordance with the matters envisaged by IFRS 1;
• the disaster reserves and the equalisation reserves not permitted among the technical liabilities in accordance with IFRS 4;
• the reserves anticipated prior to the adoption of the international accounting standards; • the consolidation reserves.
Own shares
In accordance with the provisions of IAS 32, this item includes any instruments representative of the share capital of the company which draws up the consolidated financial statements, held by the company itself and the other consolidated companies.
Reserve for net exchange differences
This item includes the exchange differences to be charged against the shareholders’ equity, in accordance with IAS 21, deriving from foreign currency transactions.
Gains or losses on available for sale financial assets
The item includes the gains and losses deriving from the valuation of available for sale financial assets, as previously described in the corresponding item of the financial investments. The amounts are stated net of the corresponding deferred taxation and the portions pertaining to the policyholders.
Other gains or losses recognised directly in equity
The item includes the reserve deriving from changes in the shareholders’ equity of the investee companies in accordance with IAS 28.
Net shareholders' equity pertaining to minority interests
This account group comprises the instruments and components representative of the share capital which make up t he shareholders’ equity pertaining to minority shareholders. Specifically, the account group includes “gains or losses on available for sale financial assets” referable to shareholders’ equity pertaining to minority shareholders.
PROVISIONS AND ALLOWANCES The provisions are recorded when it is believed that steps will have to be taken to meet an
obligation (legal or implied) deriving from a past event or in relation to which deployment of resources is possible whose amount can be reliably calculated.
TECHNICAL PROVISIONS LIFE PROVISIONS
This item includes the technical provisions associated with insurance contracts, insurance contracts involving discretionary participation features and investment contracts involving discretionary participation features. Each year, at period end, an assessment of the adequacy of these provisions is made by means of the liability adequacy test. This test is carried out by comparing the mathematical

139
Notes to the accounts
provisions, less the deferred acquisition costs and the value of any other related intangible assets, with the current value of the future cash flows expected by the portfolio. These flows are obtained by projecting the expected flows as of the valuation date on the basis of hypothesis, considered reasonable, relating to the trend in reversals, expenses, redemption and the mortality. With regards to investment contracts not involving discretional profit-sharing, the separation of the component relating to the insurance risk is carried out if present. The technical provisions, disciplined by Article 36 of Italian Legislative Decree No. 209 dated September 7th, 2005, for the exercise of private life assurance, have been valued on the basis of the Actuarial Standards set forth by ISVAP Regulation No. 21 dated March 28th, 2008. They are adequate for covering the commitments towards policyholders; the technical calculation bases adopted are consistent with the provisions of titles IV, V and VI of the aforementioned regulation. The additional provisions provided to cover mortality or other risks, such as guaranteed benefits on maturity or guaranteed redemption values, are included among the mathematical provisions. The provisions of Articles 36 et seq. of ISVAP Regulation No. 21, dated March 28th, 2008, have been applied, regarding the determination of the foreseeable return of the additional provisions for financial risk, along with those of Articles 50 et seq. regarding the establishment and calculation of an additional provision for demographic risk. Furthermore, Article 55 of said regulation has been applied, envisaging the coverage of the credit risk of index-linked agreements with benefits falling due guaranteed by the companies. The provisions relating to acceptances are calculated in relation to the criteria envisaged in title I, chapter II, section I of the IIIrd part of the ISVAP Regulation No. 33 dated March 10th, 2010. The provisions relating to reinsurers include the gross amounts pertaining to the same and are determined in compliance with the contractual reinsurance agreements, on the basis of the gross amounts of the technical provisions pursuant to Article 36, paragraph 6 of Italian Legislative Decree No. 209 dated September 7th, 2005.
Provisions for outstanding claims Technical provisions for contracts where the investment risk is borne by
The provisions for outstanding claims, made up of the amounts necessary for covering the payment of capital and accrued returns, redemptions and claims to be settled, are stated in accordance with Article 36, paragraph 3 of Italian Legislative Decree No. 209 dated September 7th, 2005. The provisions relating to index-linked and unit-linked contracts and pension funds have been calculated taking into account both the contractual commitments and the financial assets linked to said contracts.

140
the policyholders and provisions for pension funds
They are formed in accordance with title VI of ISVAP Regulation No. 21 dated March 28th, 2008 and Article 38 of Italian Legislative Decree No. 173 dated May 26th, 1997 and cover the commitments deriving from the insurance of the life classes whose return is determined in relation to investments for which the policyholder bears the risk or in relation to an index.
Shadow accounting Provision for risk of insolvency (default) and liquidity
The application of the IAS/IFRS standards involves mismatch between the methods for valuing the assets and those for the related liabilities; the only exception being in relation to index-linked type contracts. The misalignments can be traced back to the recording in the accounts of both the capital losses and capital gains from the valuation of the assets valued at fair value against liabilities which are not affected by these changes. In relation to life contracts linked to separate management arrangements, by means of an accounting technique known as shadow accounting, IFRS 4 makes it p ossible to limit the effects of these misalignments. This technique makes it possible to allocate part of the fair value changes in the related hedging assets to the technical provisions associated with segregated funds. An additional provision has been made, based on A rticle 55 o f ISVAP Regulation No. 21, dated March 28th, 2008, for the hedging of the risk of insolvency which constitutes an allocation aimed at protecting the company against the risk of insolvency of issuers of securities provided to cover the technical provisions of policies with guarantee on m aturity given by the company. On the basis of Article 54 of the afore-mentioned regulation, the need for a provision against the liquidity risk of the assets hedging the reserves of index-linked contracts has also been ascertained.
NON-LIFE PROVISIONS Provision for unearned premiums
This item includes the technical provisions associated with insurance contracts. In accordance with Article 37, paragraph 4 of Italian Legislative Decree No. 209 dated September 7th, 2005, the provision for non-life insurance premiums comprises both the provision for premium fractions and the provision for current risks. The provision for premium fractions is calculated analytically using the pro-rata accruals method (title II, chapter I, section I of ISVAP Regulation No. 16, dated March 4th, 2008) on the basis of the gross premiums recorded, as established by Article 45 of Italian Legislative Decree No. 173 dated May 26th, 1997, having deducted the acquisition commission and the other acquisition costs, limited to the directly chargeable costs, for the portion ascribable to the accounting period. The book value thus obtained has been supplemented by the provisions for security, hail, other natural disasters and damages deriving from nuclear energy, calculated according to the criteria set out in title II, chapter I, section III of ISVAP Regulation No. 16, dated March 4th, 2008. The provision for current risks is calculated by class and represents the value to make provision for, covering the risks threatening individual companies after the end of the accounting period, so as to cover all the compensation and costs deriving from insurance contracts stipulated by the end of the accounting period, if their amount exceeds that of the

141
Notes to the accounts
Provision for outstanding claims
provision for premium fractions and the premiums which will be collectable by virtue of these policies, according to title II, chapter I, section II of ISVAP Regulation No. 16, dated March 4th, 2008. The premiums’ provisions relating to transfers to re-insurers have been determined, in accordance with Article 37, paragraph 11 of Italian Legislative Decree No. 209 dated September 7th, 2005, on the basis of methods consistent with those for direct business and, in any event, in accordance with reinsurance contractual agreements. The provisions relating to acceptances are calculated in relation to the criteria envisaged in title I, chapter III, section I of the IIIrd part of the ISVAP Regulation No. 33 dated March 10th, 2010. In accordance with Article 37, paragraph 5 of Italian Legislative Decree No. 209 dated September 7th, 2005, the provision for outstanding claims is determined on the basis of a prudent evaluation of the claims which occurred during that accounting period or in previous ones which have not yet been settled, based on objective elements, as well as of the related settlement costs. The companies make reference, when defining the claims provisions, to the concept of last estimated cost, identifying this value in accordance with the provisions of the ISVAP Regulation No. 16 dated March 4th, 2008 (title II, chapter II, section I), in accordance with a mixed evaluation system. Specifically, for the calculation of the charge relating to the claims, the companies adopted a two-stage procedure: during the first stage, which is applied for all the business classes, steps are taken to separately evaluate each claim (inventory method), based on the analysis of the documentation relating to each individual damage case, carried out by the staff tasked with settling the claims. During the second stage, adopted where the requisites for significance and consistency from a method point of view are present, in compliance with the provisions of Article 27, paragraph 4 of the afore-mentioned regulation, an additional check is made carried out via statistical-actuarial procedures. With regard to the assessment of the cost of the current generation, the Company avails itself, as envisaged by Article 27, paragraph 5, of the average cost approach (with the exception of the credit and security classes) for the classes which due to technical features lend themselves to the application of the same criteria. With regard to the claims for the current generation, which do not present sufficient numerousness and quantitative and qualitative standardisation, the inventory method is applied. With reference to the credit and security classes, the provision for claims is established on the basis of the provisions laid down by ISVAP Regulation No. 16 dated March 4th, 2008 (title II, chapter II, section IV). Pursuant to Article 37, paragraph 6 of Italian Legislative Decree No. 209 dated September 7th, 2005, the provision includes the evaluation of the claims which have occurred but have not been reported as of the year end date, determined on the basis of the provisions laid down by ISVAP Regulation No. 16 dated March 4th, 2008 (title II, chapter II, section II). The provision for outstanding claims regarding Card and No Card claims of the land vehicle TPL class is established on the basis of Article 33, paragraph 1 of ISVAP Regulation No. 16

142
dated March 4th, 2008, in the event that the Company is the handler of the same, and Article 33, paragraph 2 of the same regulation if the Company is the debtor. The total amount of the claims provision is calculated in relation to the provisions of Article 34 of said regulation. The portions of the claims’ provisions pertaining to re-insurers are determined in accordance with Article 37, p aragraph 11 of Italian Legislative Decree No. 209 da ted September 7th, 2005, adopting the same criteria used for the direct business provisions and taking into account the contractual clauses of the agreements. The claims provisions relating to acceptances are calculated in relation to the criteria envisaged in title I, chapter III, section II of the IIIrd part of the ISVAP Regulation No. 33 dated March 10th, 2010. The criteria used for the determination of the non-life technical provisions, the premiums’ provisions (supplemented by means of current risk provisions and allowance) and provisions for outstanding claims are in line with the matters envisaged by the LAT former IFRS 4.
Other technical provisions
They include the senescence provision of the health class for the rise in the age of the policyholders, determined in accordance with Article 45 et seq. of ISVAP Regulation No. 16, dated March 4th, 2008, and title I, chapter III, Section IV of the IIIrd part of ISVAP Regulation No. 33 dated March 10th, 2010.
FINANCIAL LIABILITIES This account group includes the financial liabilities valued at fair value through profit or loss
and the financial liabilities carried at amortised cost.
Financial liabilities at fair value through profit or loss
This item includes the financial liabilities falling within the sphere of trading activities, and the liabilities relating to index and unit-linked investment contracts, where the risk of the investments is borne by the policyholders. The valuation is made at fair value and the gains or losses which emerge are booked to the income statement.
Other financial liabilities
The item includes the financial liabilities defined and disciplined by IAS 39 not included in the category financial liabilities at fair value through profit or loss, but carried at amortised cost. Subordinated liabilities, for which the right to reimbursement by the creditor - in the event of winding up of the company - may only be exercised after all the other creditors and bonds have been satisfied, are classified in this item. The item also includes deposits received from reinsurers, other loans obtained and provisions linked to agreements with specific provision of assets.
PAYABLES
The item includes the payables deriving from insurance and other transactions. In particular, the account group includes the payables from direct and indirect insurance transactions.

143
Notes to the accounts
The account group also includes the liabilities associated with defined benefit plans in favour of the employees, which involve disbursements subsequent to the termination of the employment relationship and the other long-term benefits (including therein the employee severance indemnity) which, in compliance with IAS 19, are subject to an actuarial assessment by means of use of the so-called “Project Unit Credit Method”. According to this method, the liability is determined by taking into account a series of variables (such as the mortality rate, the forecast of future salary changes, the estimated rate of inflation, the foreseeable return on the investments, etc.). The liability recorded in the financial statements represents the effective value of the obligation foreseeable, net of any assets serving the plans, adjusted to reflect any actuarial losses or gains not amortised. The discounting back of the future cash flows is carried out on the basis of the interest rate of high quality corporate securities. The actuarial hypotheses used for the purposes of the calculation are periodically reviewed so as to confirm their validity. The other long-term benefits concern the length-of-service premiums which mature in the 25th and 35th year of service with some companies as anticipated by the related CCNL (National Collective Labour Agreement). The frequency of the evaluations and the method of accounting are similar to those used for the defined benefit pension plans. Following the reform of the employee severance indemnity (TFR), culminating in the implementing decrees of the 2007 Finance Bill concerning the transfer of employee severance indemnities (TFR) and Supplementary welfare (Italian Official Gazette No. 26 dated February 1st, 2007), the application of the afore-mentioned method differs according to whether the company being assessed has a number of employees less than or at least equal to 50. On the basis of Italian Law No. 296/06, for companies with at least 50 employees, the transfer of the portions of employee severance indemnities (TFR) to a specific Treasury Fund set up with INPS (national social security institute) is envisaged. In line with the matters indicated by the OIC (Italian Accounting Organisation) in the attachment to Operating Guide No. 1 for the transition to the international accounting standards (section 13), steps were not taken to make the actuarial calculation relating to the employee severance indemnity (TFR) accruing as from January 1st, 2007 for companies with at least 50 employees. This is equivalent to considering the employee severance indemnity accrued up until December 31st, 2006 t o be a defined benefit plan (and therefore subject to actuarial calculation) and the severance indemnity as from January 1st, 2007 to the Treasury Fund set up with INPS to be a fixed contribution plan (and therefore not subject to actuarial calculation). With reference to the employee severance indemnity accrued up until December 31st, 2006, since the contribution period has fully matured, the weighting of the outlays no longer applies. With regards to companies with less than 50 employees, in the absence of transfer of the contributions subsequent to December 31st, 2007 to the Treasury Fund set up with INPS, the entire liability has been considered to be a d efined benefit plan. Actuarial gains and losses realised during the year have been recorded in the financial statements for all companies in the Group.

144
OTHER LIABILITY ITEMS Liabilities of disposal group held for sale
This item contains all the non-current liabilities or liabilities of disposal group whose sale is highly probable. The non-current liabilities or liabilities of disposal group held for sale are stated at their book value or the fair value less costs to sell (discounted back in the event of sales which will be finalised beyond 12 months) whichever is lower.
Current and deferred tax liabilities
Current taxes are calculated on the basis of the taxable income for the period. The liabilities for current taxes are stated at the value which is expected to be paid, applying the rates and tax legislation in force. Deferred taxes are included which have arisen from taxable temporary differences due to the deferral in the taxability of positive income elements realised and recorded in the income statement, which will be settled in subsequent accounting periods when the afore-mentioned revenues will be taxed. When the results of the transactions are booked directly to the shareholders’ equity, the current taxes and liabilities for deferred taxes are also booked to shareholders’ equity.
Other liabilities The other liabilities mainly include deferred revenues (DIR – deferred income reserve) relating to investment contracts. The IAS/IFRS standards envisage a different method of determination and representation of the provision for management costs; specifically, the component referring to policies no longer classified as i nsurance but as “i nvestment” (DIR – deferred income reserve) is classified among the other liabilities and is assigned to the income statement on the basis of the timing of the costs incurred for the management of the policies.
INCOME STATEMENT
REVENUES
Net premiums This item includes the net premiums relating to insurance contracts and financial instruments featuring discretional profit-sharing, net of transfers under reinsurance.
Income and charges deriving from financial instruments at fair value through profit or loss
This item comprises realised gains and losses, interest, dividends and positive and negative changes in the value of the financial assets and liabilities at fair value through profit or loss. The item also includes the charges on the financial liabilities linked to investment contracts.
Income deriving from investments in
This account group includes the income generated by investments in subsidiaries, associates and joint ventures recorded in the corresponding asset item.

145
Notes to the accounts
subsidiaries, associates and joint ventures Income deriving from other financial instruments and investment property
The income from financial instruments and other investments includes the income deriving from financial instruments not valued at fair value through profit or loss and from investment property. In particular, the following is included: interest income on financial instruments valued using the effective interest method, other income from investments, including dividends and revenues which derive from the use, by third parties, of the properties intended for investment purposes; the gains realised following the sale of a financial asset or liability or investment property, and the positive changes deriving from the write-back of a permanent loss in value (reversal of impairment).
Other revenues Other revenues include the commission income for financial services provided, revenues deriving from the sale of assets, from the provision of services other than those of a financial nature and from the use by third parties of the tangible assets and the other assets of the Company. Also included are realised gains and value write-backs relating to intangible assets and other assets, the exchange differences to be charged to the income statement in accordance with IAS 21 and other net technical income associated with insurance policies. Specifically, the account group includes commission income associated with investment contracts.
COSTS
Net charges relating to claims
The charges relating to claims include the amounts paid out during the period for claims, maturities and redemptions as w ell as the amount relating to the changes in the technical provisions, net of the recoveries and the transfers under reinsurance. This account also includes the component to be booked to the income statement concerning the change in the deferred liabilities due to policyholders and the change in the provision for the risk of default.
Charges deriving from investments in subsidiaries, associates and joint ventures
This item includes the charges deriving from investments in subsidiaries, associates and joint ventures recorded in the corresponding asset item.
Charges deriving from other financial instruments and investment property
The item includes the charges deriving from financial instruments not valued at fair value through profit or loss and charges deriving from investment property. Specifically, the costs relating to investment property include condominium fees and maintenance and repair expenses not increasing the value of the investment property, the losses realised following the derecognition of an investment property, amortisation and depreciation and value reductions (impairment). Charges deriving from financial instruments include interest expense stated using the criteria of the effective interest rate, the losses realised following the derecognition of a financial asset

146
or liability and value reductions (impairment). This account also includes administrative costs, comprising general expenses and staff costs, as well as those relating to the management of financial instruments, investment property and equity investments.
Operating expenses
For the insurance companies, operating expenses mainly include commission, other acquisition costs and the administrative costs relating to contracts falling within the scope of IFRS 4 and to financial instruments without discretional profit-sharing. The account also includes the administrative costs of the companies who do not carry out insurance activities.
Other costs The item includes commission expense for financial services received, the other net technical charges associated with insurance contracts, the exchange differences to be charged to the income statement in accordance with IAS 21, the portions of provisions for the year, the losses generated, the impairment losses and the amortisation/depreciation relating to both the tangible assets which do not represent investment property, and intangible assets.
Current taxes
The income taxes calculated in accordance with current legislation are recorded in this item. Compliance with the tax consolidation scheme does not lead to exceptions or changes to the standards illustrated above.
Deferred taxes The item includes income taxes due in future accounting periods, relating to taxable or deductible temporary differences.
Profit (loss) from discontinued operations
This item contains the non-current profits (losses) or those belonging to disposal group whose sale is highly probable.


Notes to the accounts Part C – Information on the consolidated statement of financial position and income statement


151
Notes to the accounts
In accordance with ISVAP Regulation No. 7 dated July 13th, 2007, the statement of financial position by sector of activities is presented below. Table 16– Statement of financial position by sector of activities (ISVAP Regulation No. 7 dated July 13th, 2007)
Non-life business Life business Other Eliminations between sectors Total
(€ thousands) 2012 2011 2012 2011 2012 2011 2012 2011 2012 2011
1 INTANGIBLE ASSETS 187,014 173,514 67,292 54,847 91,906 93,074 -35,745 6,177 310,467 327,612 2 TANGIBLE ASSETS 27,429 21,822 874 661 76,617 5,385 0 0 104,920 27,868
3 TECHNICAL PROVISIONS - REINSURANCE AMOUNT 594,696 563,005 99,417 96,178 0 0 -20,746 -18,730 673,367 640,453
4 INVESTMENTS 2,806,095 2,606,735 13,225,889 12,805,257 198,636 176,120 -994,377 -919,595 15,236,243 14,668,517 4.1 Investment property 0 0 0 0 173,693 159,250 -758 -1,292 172,935 157,958
4.2 Investments in subsidiaries, associates and joint ventures 617,024 663,163 229,563 241,144 143 127 -764,533 -801,326 82,197 103,108
4.3 Held to maturity investments 107,352 105,313 179,841 180,168 0 0 0 0 287,193 285,481 4.4 Loans and receivables 322,169 331,159 918,968 1,185,077 717 280 -2,501 0 1,239,353 1,516,516
4.5 Available for sale financial assets 1,628,124 1,480,598 8,314,202 7,132,151 24,083 16,463 -226,585 -116,977 9,739,824 8,512,235
4.6 Financial assets at fair value through profit or loss 131,426 26,502 3,583,315 4,066,717 0 0 0 0 3,714,741 4,093,219
5 SUNDRY RECEIVABLES 615,484 729,804 219,212 130,226 119,819 16,787 -178,758 -89,921 775,757 786,896
6 OTHER ASSET ITEMS 288,793 374,851 442,850 677,485 5,959 5,540 2,467 5,131 740,069 1,063,007 6.1 Deferred acquisition costs 0 0 11,810 9,457 0 0 0 0 11,810 9,457 6.2 Other assets 288,793 374,851 431,040 668,028 5,959 5,540 2,467 5,131 728,259 1,053,550
7 CASH AND CASH EQUIVALENTS 181,456 37,626 410,053 354,933 16,202 14,679 0 0 607,711 407,238
TOTAL ASSETS 4,700,967 4,507,357 14,465,587 14,119,587 509,139 311,585 -1,227,159 -1,016,938 18,448,534 17,921,591
1 SHAREHOLDERS' EQUITY 1,128,063 964,143 1,210,271 973,874 293,130 187,580 -1,022,702 -902,131 1,608,762 1,223,466
2 PROVISIONS AND ALLOWANCES 20,290 19,990 8,381 6,553 1,149 1,193 0 0 29,820 27,736
3 TECHNICAL PROVISIONS 3,036,665 2,977,795 11,711,515 11,627,811 0 0 -20,746 -23,939 14,727,434 14,581,667
4 FINANCIAL LIABILITIES 75,218 82,169 1,033,876 1,094,482 157,805 77,421 -2,501 0 1,264,398 1,254,072
4.1 Financial liabilities at fair value through profit or loss 0 0 930,684 962,190 2,729 0 0 0 933,413 962,190
4.2 Other financial liabilities 75,218 82,169 103,192 132,292 155,076 77,421 -2,501 0 330,985 291,882 5 PAYABLES 297,210 328,715 187,574 120,908 53,740 42,698 -178,545 -89,709 359,979 402,612 6 OTHER LIABILITY ITEMS 143,521 134,545 313,970 295,959 3,315 2,693 -2,665 -1,159 458,141 432,038
TOTAL SHAREHOLDERS' EQUITY AND LIABILITIES 4,700,967 4,507,357 14,465,587 14,119,587 509,139 311,585 -1,227,159 -1,016,938 18,448,534 17,921,591
Part C Statement of Financial Position – Assets

152
1. INTANGIBLE ASSETS
Table 17 – Intangible assets
Changes
(€ thousands) 2012 2011 Abs. amount %
Goodwill 198,870 206,594 -7,724 -3.7
Other intangible assets: 111,597 121,018 -9,421 -7.8
insurance portfolios 15,077 21,886 -6,809 -31.1
software 70,405 69,750 655 0.9
models and projects 2,160 1,953 207 10.6
patent rights, trademarks and similar rights 402 403 -1 -0.2
assets in process of formation 23,553 27,026 -3,473 -12.9
Total 310,467 327,612 -17,145 -5.2
1.1 Goodwill
The change compared to last year includes € 16.689 million attributable to the increase following the goodwill generated by the partial, non-proportionate spin-off of B.P.Vi. Fondi SGR in Cattolica Immobiliare and then subsequently in Cattolica and € 24.413 million due to the reduction for impairment losses. On April 1st, the partial, non-proportionate spin-off of B.P.Vi. Fondi SGR within Cattolica Immobiliare took place. The transaction led mainly to the recording of financial assets for € 7.057 million and cash at bank and in hand for € 1.609 million, as well as payables related to staff. The goodwill mentioned above corresponds to the surplus between the cost of the investment in B.P.Vi Fondi SGR and the total of the net assets subject to spin-off, and was recorded on the basis of the expert appraisal which confirms the value. The goodwill, as illustrated in the accounting policies is recorded at the related cost, net of any impaiment losses in accordance with the provisions of IFRS 3. Table 18 - Goodwill – changes during the period
(€ thousands) Goodwill Gross balance as at December 31st, 2011 229,788 Accumulated amortisation 23,194 Cumulative permanent losses 0
Net balance as at December 31st, 2011 206,594
Increases due to: 16,689 business combinations 16,689 Other 0
Decreases due to: 0 business combinations 0 Other 0
Gross balance as at December 31st, 2012 246,477 Other changes in acc. Amortisation 0 Accumulated amortisation 23,194 Impairment losses 24,413 Cumulative impairment losses 24,413 Net balance as at December 31st, 2012 198,870

153
Notes to the accounts
The accumulated amortisation in the above table refers to amortisation prior to the application of the international accounting standards. In order to ascertain any impairment losses, the goodwill has been allocated to the cash generating units (or CGU) or to groups of units in observance of the maximum aggregation restriction which cannot exceed the individual operating sector (non-life, life and other). Therefore, when assigning the goodwill to the cash generating units, the minimum level at which the goodwill is monitored for internal management control purposes was considered, or rather the Cattolica Danni CGUs, the Vita Canale Proprietario CGU (originating from the union of the Cattolica Previdenza and Cattolica Vita CGUs in relation to the decision to distribute life products with annual premium of Cattolica Previdenza via the Cattolica agent network) and the legal entities included within the scope of consolidation, taking into account the corporate restructuring operations that took place over the years which do not make it possible in the future to map out the value of the individual goodwill amounts which were allocated previously to the cash generating units identified in C.I.R.A., Duomo Previdenza, Duomo Uni One Assicurazioni, Eurosav, Persona Life and San Miniato Previdenza. The goodwill was assigned to the following business units: • € 122.638 concerning the cash flow generating unit known as Cattolica Danni, represented by the goodwill
relating to the purchase transactions of Duomo Assicurazioni and Uni One Assicurazioni which are now included in the Cattolica Danni CGU;
• € 33.964 million concerning the cash flow generating unit known as Vita Canale Proprietario, represented by the goodwill relating to the purchase transactions of Duomo Previdenza and Persona Life and the acquisition of a further 50% of Cattolica Previdenza;
• € 13.087 million in BCC Vita, relating to the purchase of 51% of the company; • € 3.44 million concerning the cash flow generating unit Risparmio & Previdenza, represented by the goodwill
relating to the acquisition of Eurosav which is now included in the Risparmio & Previdenza CGU; • € 3.257 million in Cattolica Life, relating to the initial purchase of 50% of the company; • € 2.977 million in Berica Vita, relating to the initial purchase of 50% of the company. The following consolidated goodwill by line from the individual IAS financial statements are also recorded: • € 15.021 million in Cattolica, relating to the partial spin-off of B.P.Vi. Fondi SGR within the same; • € 4.486 million in TUA Assicurazioni, relating to the purchase of the UBI business segment. The recoverable value of the CGUs is defined as the fair value, less cost to sell, or the value in use, whichever is the higher. It should be noted that due to the significant drop in Cattolica stock prices, the test based on the fair value - which refers the goodwill to the listed prices of the entity under review - fails to express the real value of the CGUs in question, considering that the stock market capitalisation expresses values lower than the pro-rata shareholders’ equity. So as to establish the recoverable value and subsequently compare with the book value of the CGUs, the value in use was therefore used since it is able to permit an impairment opinion guided by principles of economic rationality. The value in use of all the insurance companies is estimated on the basis of a t wo or three-stage accounting approach of the economic capital. In the application of the economic capital method, the first stage is represented by the discounting back of the economic profit (calculated on the basis of the RoEV - return on Embedded Value – for life assurance companies, or the profitability of the Embedded Value and on the basis of the RoNAV - return on Net Asset Value – for the non-life insurance companies, or the profitability of the adjusted shareholders’ equity, net of intangible assets). The second stage is gained by hypothesising the linear convergence of the economic profit of the last plan year towards the perpetually sustainable level. The third stage derives from

154
the terminal value of the business unit, obtained by capitalising the perpetually sustainable economic profit by means of an appropriate capitalisation rate. The impairment tests carried out as at December 31st, 2012, were based on the results for 2012 and 2013-2015 economic-financial projections for each CGU drawn up by management in observance of the guidelines provided by the Parent Company’s board of directors; they take into account the historic track record of the technical results achieved by each company, as well as the trends, in the estimate of the funding and profitability hypotheses, which are highlighted by the market, insurance and financial scenarios. With reference to the Berica Vita, Cattolica Life and ABC Assicura CGUs, a 10-year plan was considered, as envisaged by the bank-assurance agreements renewed during 2012; also with reference to the Vita Canale Proprietario CGU, a 10-year plan was used since the three-year time span is too short for being able to represent the future income-earning prospects of the venture. For the calculation of the terminal values, recourse was made to long-term estimates of two key variables: the book rate of return on the economic capital (RoEC) and the long-term nominal growth rate. The underlying hypothesis which the value in use of each group of units is the most sensitive to, are: • the combined ratio for the cash generating units falling within the non-life segment and the new business for
the cash generating units falling within the life segment; • the cost of own capital (Rs); • the long-term RoEC (the RoEC is the ratio between the economic profit and the economic capital); • the long-term growth rate (“g”). The cost of the capital has been estimated using the CAPM - Capital Asset Pricing Model. The parameters used for the purposes of the estimate of the value in use are: the beta ratio by class of activities, formulated on the basis of the market betas of the European insurance companies; the equity risk premium, in line with the consensus value disclosed in the reports of the market analysts; the risk free rates. The cost of own capital (Rs) for each business unit has been estimated on the basis of these elements, equal to 9.65% for life insurance companies and 8.38% for non-life companies. By contrast, the long-term growth rate ("g”) was 2% for all the CGUs. These basic assumptions, besides being in line with the long-term nominal growth rate of Italian GDP, are also consistent with the values used by the financial analysts of the insurance sector. Further to the tests carried out, the following impairment losses were recorded:
• € 9.6 million on the Vita Canale Proprietario CGU; • € 9.4 million on the BCC Vita CGU; • € 1.1 million on the Risparmio e Previdenza CGU; • € 2.644 million on the BCC Assicurazioni CGU; • € 1.669 million on the goodwill recorded due to the partial spin-off of B.P.Vi. Fondi SGR within Cattolica.
Sensitivity analysis was also carried out on the CGUs not subject to impairment loss, with reference to the cost of capital (+/- 0.5%) and the growth rate (+/- 0.5%). In none of the cases, also adopting the worst-case scenario (Rs +0.5% and g -0.5%), the recoverable value was lower than the book value.

155
Notes to the accounts
1.2 Other intangible assets According to IAS 38, the item “other intangible assets” includes assets which can be autonomously identified and which will generate future economic benefits in terms of cost savings or future income. Table 19 – Other intangible assets – changes during the period
(€ thousands) Insurance portfolios Software
Models and projects
Patent rights, trademarks and similar
rights
Assets in process of formation leasehold
improvements TOTAL
Gross balance as at December 31st, 2011 52,334 212,826 3,312 2,348 27,352 298,172
Accumulated amortisation 30,448 142,333 1,359 1,945 326 176,411
Cumulative permanent losses 0 743 0 0 0 743
Net balance as at December 31st, 2011 21,886 69,750 1,953 403 27,026 121,018
Increases due to: 0 29,107 904 0 24,935 54,946
Purchase 0 724 897 0 23,606 25,227
business combinations 0 0 0 0 0 0
Other 0 28,383 7 0 1,329 29,719
Decreases due to: 217 133 96 0 28,313 28,759
Sale 0 0 0 0 0 0
business combinations 0 0 0 0 0 0
Other 217 133 96 0 28,313 28,759
Gross balance as at December 31st, 2012 52,117 241,800 4,120 2,348 23,974 324,359
Amortisation 6,200 28,382 697 1 95 35,375
Other changes in acc. amortisation -217 -63 -96 0 0 -376
Accumulated amortisation 36,431 170,652 1,960 1,946 421 211,410
Reversal of impairment losses 0 0 0 0 0 0
Impairment losses 609 0 0 0 0 609
Cumulative impairment losses 609 743 0 0 0 1,352
Net balance as at December 31st, 2012 15,077 70,405 2,160 402 23,553 111,597
The “other intangible assets” held by the Group are characterised by a finite useful life and so these are subjected, as indicated in the accounting policies, to a systematic amortisation process whose period: • varies between 4 and 11 years for the insurance portfolios, on the basis of the average residual duration of the
underlying contracts; • is on average 5 years for software, models and projects, patent rights, trademarks and similar, except in specific
cases. There were no significant changes in the amortisation methods used during the accounting period. In pursuance of the matters anticipated by section 31 of IFRS 4, ot her intangible assets specifically include the following values of the insurance policies portfolios acquired as a result of business combinations:

156
• € 3.55 million for the acquisition of BCC Vita, in July 2009. The related amortisation period is 7 years; • € 2.286 million relating to the cash generating unit known as Vita Canale Proprietario, deriving from the
mergers of Duomo Previdenza and Persona Life within the Parent Company during 2007. This portfolio, net of the portion assigned to Cattolica, has an amortisation plan envisaged over 10 years;
• € 2.669 million relating to the cash generating unit known as Cattolica Danni, deriving from the spin-off of Duomo Uni One within Cattolica Assicurazioni. This portfolio, estimated with reference to the forecast income flows which can be achieved, has an amortisation plan envisaged over 11 years;
• € 89 thousand relative to cash generating unit Risparmio & Previdenza which, as detailed above, derives from the merger of Eurosav into Risparmio & Previdenza. The related amortisation period is 10 years.
The following values of the insurance policy portfolios recorded in the individual financial statements are also present: • € 4.667 million in relation to the matters envisaged in the non-life agreement entered into with ICCREA
Holding for the acquisition of 51% of BCC Vita which became effective due to the transfer of 49% of BCC Assicurazioni, in October 2010; The related amortisation period is 10 years;
• € 1.816 million, for the conclusion of a business transaction with the banking partner Banco di Credito Popolare di Torre del Greco by Cattolica. The transaction implemented in two instalments envisages amortisation plans of 6 years for the first instalment and 7 years for the second.
During the year the insurance policy portfolio undertaken further to the acquisitions of Berica Vita and Cattolica Life and the additional 50% of the policies portfolio of Cattolica Previdenza were amortised in full. Other intangible assets held by the company include software and assets in process of formation relating to projects being developed on software which mainly refer to Cattolica Services and include both projects completed and in use during the period and systems already operative, used in recent years, which during the year have been subject to development processes and adaptation in line with legal provisions, along with projects underway not yet completed and in function in 2012. The impairment tests on other intangible assets, as disciplined by IAS 36, carried out during the year, revealed a loss in value (impairment loss) of € 609 thousand with reference to the assets of Risparmio e Previdenza recorded following the conclusion of the commercial transaction with the banking partners Banco di Credito Popolare di Torre del Greco. The cumulative impairment losses during previous years were justified by the obsolescence of certain software.

157
Notes to the accounts
2. TANGIBLE ASSETS
Tangible assets, disciplined by IAS 16, showed the following changes during the year: Table 20 – Tangible assets
Changes
(€ thousands) 2012 2011 Abs. amount %
Property 94,747 18,778 75,969 n.s.
Other tangible assets: 10,173 9,090 1,083 11.9
furniture, office machines and internal means of transport 8,760 8,685 75 0.9
registered movable assets 659 57 602 n.s.
plant and equipment 585 348 237 68.1
inventories and miscellaneous assets 169 0 169 n.a.
Total 104,920 27,868 77,052 n.s.
n.s. = not significant
n.a. = not applicable
2.1 Property The item includes property used for the performance of the Group companies’ activities; in particular it includes the properties belonging to the Parent Company and Cattolica Agricola. 2.2 Other tangible assets The item comprises the assets disciplined by IAS 16, not included under the property category.

158
Table 21 – Property and other tangible assets – changes during the period
(€ thousands) Property
Furniture, office
machines and internal means
of transport
Movable assets recorded in
public registers
Plant and equipment
Inventories and
miscellaneous assets Total
Gross balance as at December 31st, 2011 26,817 80,030 250 3,420 0 110,517
Accumulated depreciation 8,039 71,345 193 3,072 0 82,649
Cumulative permanent losses 0 0 0 0 0 0
Net balance as at December 31st, 2011 18,778 8,685 57 348 0 27,868
Increases due to: 76,678 4,050 713 354 169 81,964
Purchase 76,678 3,613 713 354 169 81,527
business combinations 0 0 0 0 0 0
change of use 0 0 0 0 0 0
internal development 0 0 0 0 0 0
exchange gains 0 0 0 0 0 0
Other 0 437 0 0 0 437
Decreases due to: 0 278 104 0 0 382
Sale 0 10 104 0 0 114
business combinations 0 0 0 0 0 0
change of use 0 0 0 0 0 0
exchange losses 0 0 0 0 0 0
Other 0 268 0 0 0 268
Gross balance as at December 31st, 2012 103,495 83,802 859 3,774 169 192,099
Depreciation 709 3,691 91 117 0 4,608
Other changes in acc. amortisation 0 6 -84 0 0 -78
Accumulated depreciation 8,748 75,042 200 3,189 0 87,179
Reversal of impairment losses 0 0 0 0 0 0
Impairment losses 0 0 0 0 0 0
Cumulative impairment losses 0 0 0 0 0 0
Net balance as at December 31st, 2012 94,747 8,760 659 585 169 104,920
The increases in the item property included € 70.42 million referring to the purchases made by Cattolica Agricola and € 6.258 m illion in costs, incurred during the period, for the internal renovation and legislation adaptations of the portion of the Verona offices in Via Aspromonte. There was no properties under construction. The fair value of the properties held by the Group, at the end of the year, came to € 112.44 million. As indicated in the accounting policies, total property and other tangible assets held by the Group are subject to a systematic depreciation process using a r ate of 3% for properties used for the Group’s business activities and, except in specific cases, using a rate:

159
Notes to the accounts
• of 12% for ordinary office furniture and machines; • of 20% for electronic machines and hardware; • of 25% for registered movable assets; • of 15% for plant and equipment; • between 9% and 20% for other agricultural assets. No significant changes took place during the accounting period, either in the accounting estimates or the depreciation methods used. 3. TECHNICAL PROVISIONS - REINSURANCE AMOUNT
Table 22 – Analysis of technical provisions – reinsurance amount (ISVAP Regulation No. 7 dated July 13th, 2007)
Direct business Indirect business Total book value Changes
(€ thousands) 2012 2011 2012 2011 2012 2011 Abs. amount %
Non-life provisions 566,465 536,773 7,485 7,503 573,950 544,276 29,674 5.5
Provision for unearned premiums 110,605 102,935 3,031 1,726 113,636 104,661 8,975 8.6
Provision for outstanding claims 455,222 432,588 4,454 5,777 459,676 438,365 21,311 4.9
Other provisions 638 1,250 0 0 638 1,250 -612 -49.0
Life provisions 99,417 96,177 0 0 99,417 96,177 3,240 3.4
Provision for outstanding claims 6,023 8,443 0 0 6,023 8,443 -2,420 -28.7
Mathematical provisions 93,189 87,188 0 0 93,189 87,188 6,001 6.9 Technical provisions for contracts where the investment risk is borne by policyholders and provisions for pension funds
0 0 0 0 0 0 0 n.a.
Other provisions 205 546 0 0 205 546 -341 -62.5 Total technical provisions - reinsurance amount 665,882 632,950 7,485 7,503 673,367 640,453 32,914 5.1
n.a. = not applicable
The technical provisions – reinsurance amount are calculated using the method adopted for those pertaining to direct business. 4. INVESTMENTS
Table 23 - Investments
Changes
(€ thousands) 2012 2011 Abs. amount %
Investment property 172,935 157,958 14,977 9.5
Investments in subsidiaries, associates and joint ventures 82,197 103,108 -20,911 -20.3
Held to maturity investments 287,193 285,481 1,712 0.6
Loans and receivables 1,239,353 1,516,516 -277,163 -18.3
Available for sale financial assets 9,739,824 8,512,235 1,227,589 14.4
Financial assets at fair value through profit or loss 3,714,741 4,093,219 -378,478 -9.2
Total 15,236,243 14,668,517 567,726 3.9

160
4.1 Investment property “Investment property” is represented by the properties, not occupied by Group companies. The item includes land and buildings belonging to the Euripide, Macquarie Office Italy, Perseide funds and Cattolica Beni Immobili. The fair value of the investment property held by the Group, estimated by an external and independent expert, at the end of the year, amounted to € 179.063 million. Table 24 – Investment property – changes during the period
(€ thousands) Investment
property Gross balance as at December 31st, 2011 162,639 Accumulated depreciation 4,681 Cumulative permanent losses 0
Net balance as at December 31st, 2011 157,958 Increases due to: 17,200
Purchase 16,665 business combinations 0 change of use 0 internal development 0 exchange gains 0 Other 535
Decreases due to: 0 Sale 0 business combinations 0 change of use 0 exchange losses 0 Other 0
Gross balance as at December 31st, 2012 179,839 Depreciation 2,223 Other changes in acc. Depreciation 0 Accumulated depreciation 6,904
Reversal of impairment losses 0 Impairment losses 0
Cumulative impairment losses 0
Net balance as at December 31st, 2012 172,935
The increases mainly refer to the purchases made by Fondo Perseide for € 8.686 million and by Cattolica Beni Immobili for € 7.979 million. Decreases are attributable to the depreciation charged during the period for € 2.223 million. Revenues for rents generated during the period amounted to € 12.032 million (€ 11.434 million as at December 31st,). As indicated in the accounting policies, investment property is subject to a systematic depreciation process calculated in relation to the useful life generally equal to 50 years (2% depreciation rate) with the exception of

161
Notes to the accounts
buildings owned by the Perseide fund for which the useful life is 19 years, estimated in relation to the duration of the related right of common (depreciation rate of 5.37%). No significant changes took place during the accounting period, either in the accounting estimates or the depreciation methods used. As explained in the accounting policies and in the table presented below, the Group has applied the criteria of cost net of the accumulated depreciation and any impairment losses to total assets disciplined by IAS 40, IAS 16 and IAS 38. Table 25 – Analysis of tangible and intangible assets (ISVAP Regulation No. 7 dated July 13th, 2007)
(€ thousands) At cost At re-determined value
or at fair value Total book value
Investment property 172,935 172,935
Other property 94,747 94,747
Other tangible assets 10,173 10,173
Other intangible assets 111,597 111,597
4.2 Investments in subsidiaries, associates and joint ventures The item includes equity investments in subsidiary companies excluded from the scope of consolidation and in associated companies over which the Group exercises significant influence, which are accounted for using the equity method.
Table 26 - Investments in subsidiaries, associates and joint ventures
Changes
(€ thousands) 2012 2011 Abs. amount %
Subsidiary companies 50 50 0 0
Associated companies 82,147 103,058 -20,911 -20.3
Joint ventures 0 0 0 n.a.
Total 82,197 103,108 -20,911 -20.3
n.a. = not applicable
As a result of the tests carried out, as disciplined by IAS 36, no impairment losses were reported. The impairment test on equity investments in associated companies was carried out, on a c onsistent basis with previous years, making reference to the configuration of the fair value less cost to sell. In detail, with regard to the banking shareholding, the estimate of the fair value, less selling costs, moves from the estimate of the goodwill on the amount obtained by means of the application of standard ratios used in valuation practice. Equity investments in subsidiary companies

162
The item mainly comprises the cost of the equity investment in TUA Retail, a company which is not significant (not material) for consolidation purposes. Equity investments in associated companies The item includes the equity investments, accounted for using the equity method, in companies over which the Group exercises a significant influence. The net decrease with respect to the previous period is attributable for - € 26.095 million to the spin-off of B.P.Vi. Fondi SGR in Cattolica Immobiliare and subsequently in the Parent Company, for - € 2.68 million to the exit of Vegagest SGR from the associated companies given that the parent Company no longer has significant influence over the same, and for € 7.864 million to the increase in the shareholders’ equity of the associated companies. Table 27 – Analysis of non-consolidated equity investments (ISVAP Regulation No. 7 dated July 13th, 2007)
(€ thousands) Country Assets Type
% Direct
investment
% Total
holding
% Availability
of voting rights at ordinary
shareholders' meetings Book value
Name (1) (2) (3) (4) Cassa di Risparmio di San Miniato s.p.a. 086 7 b 25.07% 25.07% 82,119 Prisma s.r.l. 086 11 b 20.00% 20.00% 28 TUA Retail s.r.l. 086 11 a 0.00% 97.00% 50 (1) 1=Italian insurance; 2=EU insurance; 3=non-EU insurance; 4=insurance holding companies; 5=EU reinsurance; 6=non-EU reinsurance; 7=banks; 8=SGR; 9=other holding; 10=property 11=other.
(2) a=subsidiaries (IAS 27) ; b=associated companies (IAS 28); c=joint ventures (IAS 31).
(3) this is the product of the investment relationships relating to all the companies which, placed along the investment chain, may be interposed between the company that draws up the consolidated financial statements and the company in question. If the latter is directly invested in by several subsidiary companies, it is necessary to add together the individual products.
(4) Overall percentage available of the votes at ordinary shareholders' meeting if different from direct or indirect shareholding.
A summary of the most significant equity and income highlights achieved by the companies not included within the scope of consolidation, is presented below. Table 28 – Summary data of non consolidated subsidiary and associated companies and joint ventures
(€ thousands) Share
capital Shareholde
rs’
of which profit (+) or loss (-)
Name Registered
offices Total assets
Total liabilities equity
for the year Revenues
Subsidiary companies
TUA Retail s.r.l. Milan 50 519 462 57 3 926
Associated companies
Cassa di Risparmio di San Miniato s.p.a. (*) S. Miniato (PI) 159,824 3,206,123 3,027,097 179,026 -28,912 136,967
Prisma s.r.l. Milan 120 885 747 138 -60 839 (*) The balances for total assets, total liabilities, shareholders’ equity and the result for the year as of December 31st, 2011 have been shown since the 2012 financial statements had not yet been approved as of the date of approval of Cattolica Assicurazioni's financial statements by the Board of Directors.

163
Notes to the accounts
Financial Investments Financial investments included the financial instruments disciplined by IAS 39: held to maturity investments, loans and receivables, available for sale financial assets and financial assets at fair value through profit or loss. The benefits for the income statement as of December 31st deriving from reclassification carried out in 2008 amounted to € 16.693 million while the benefits for shareholders’ equity amounted to € 6.584 million (net of tax effects); as of December 31st the fair value of transferred securities came to € 94.426 million. No significant category reclassifications have taken place during the year and in previous periods, therefore compilation of the analysis of reclassified financial assets and the effects on the income statement and on comprehensive profitability pursuant ISVAP Regulation No. 7 dated July 13th, 2007 was not carried out. Table 29 - Financial investments
Changes
(€ thousands) 2012 2011 Abs. amount %
Held to maturity investments 287,193 285,481 1,712 0.6
Loans and receivables 1,239,353 1,516,516 -277,163 -18.3
Available for sale financial assets 9,739,824 8,512,235 1,227,589 14.4
Financial assets at fair value through profit or loss 3,714,741 4,093,219 -378,478 -9.2
Total 14,981,111 14,407,451 573,660 4.0
Table 30 – Analysis of financial assets (ISVAP Regulation No. 7 dated July 13th, 2007)
Financial assets at fair value through profit or loss
Financial investments (disciplined by IAS 39)
Held to maturity investments
Loans and receivables
Available for sale financial assets
Financial assets held for trading
Financial assets at fair value through
profit or loss
Total book value
(€ thousands) 2012 2011 2012 2011 2012 2011 2012 2011 2012 2011 2012 2011
Equities and derivatives valued at cost 0 0 0 0 9,165 0 0 0 0 0 9,165 0 Equities at fair value 0 0 0 0 316,173 339,795 259 542 9,378 18,576 325,810 358,913 of which listed securities 0 0 0 0 132,243 156,505 259 542 9,378 18,576 141,880 175,623 Debt securities 287,193 285,481 1,188,750 1,497,387 8,892,267 7,727,330 758,332 402,812 2,410,822 3,133,261 13,537,364 13,046,271 of which listed securities 287,193 285,481 0 0 8,793,969 7,648,905 749,723 388,503 1,598,181 2,582,840 11,429,066 10,905,729 UCI units 0 0 0 0 522,219 445,110 465 669 427,066 414,422 949,750 860,201 Loans and receivables due from banking customers 0 0 0 0 0 0 0 0 0 0 0 0 Interbank loans and receivables 0 0 0 0 0 0 0 0 0 0 0 0 Deposits with transferors 0 0 9,213 8,775 0 0 0 0 0 0 9,213 8,775 Receivable financial components of insurance policies 0 0 0 0 0 0 0 0 0 0 0 0 Other loans and receivables 0 0 41,353 10,037 0 0 0 0 0 0 41,353 10,037 Non-hedging derivatives 0 0 0 0 0 0 21,993 10,634 85,738 92,142 107,731 102,776 Hedging derivatives 0 0 0 0 0 0 5,712 10,630 0 0 5,712 10,630 Other financial investments 0 0 37 317 0 0 475 1,533 -5,499 7,998 -4,987 9,848
Total 287,193 285,481 1,239,353 1,516,516 9,739,824 8,512,235 787,236 426,820 2,927,505 3,666,399 14,981,111 14,407,451

164
For an analysis of the financial income and charges from investments, reference should be made to the specific table in the comments of the income statement. 4.3 Held to maturity investments All the financial assets, excluding derivatives, with a pre-established maturity and fixed or determinable payments, which the Group intends to or it’s able to hold until maturity, are classified in this category. As of December 31st, 2012, the held to maturity investments represented 1.9% of the total financial instruments disciplined by IAS 39 included under investments. In detail, the item mainly includes Italian government securities. 4.4 Loans and receivables The assets with a pre-established maturity and fixed or determinable payments, not listed on active markets, which are not recorded in any of the other categories, are classified in this category. Specifically, the category includes all the loans and financing, the deposits received from re-insurers with transferring companies and bonds not listed on active markets. As of the end of the accounting period, loans and receivables represented 8.3% of the total financial instruments disciplined by IAS 39 included under investments. Table 31 - Fair value of held to maturity investments and of loans and receivables
(€ thousands) Amortised cost Fair value
Held to maturity investments 287,193 296,448
Loans and receivables 1,239,353 1,170,575 Total 1,526,546 1,467,023
4.5 Available for sale financial assets This category includes all the financial assets, valued at fair value, other than derivative instruments, both debt instruments and equities, which are not classified in the other categories and are disciplined by IAS 39. Specifically, this category comprises the equity investments deemed to be strategic in companies which are not subsidiary or associated companies, whose fair value derives from prices taken from active markets, or, in the case of securities not listed on active markets, from commonly applied valuation methods. Specifically, the valuation methods adopted were chosen taking into account the pertinent sector. As of the end of the accounting period, available for sale financial assets represented 65% of the total financial instruments disciplined by IAS 39 included under investments. Following the performance of the impairment test on all the financial instruments included in the “loans and receivables”, “held to maturity investments”, and “available for sale financial assets ” categories, as disciplined by IAS 39, impairment losses were revealed, before tax effects, on shares for € 21.032 million, on bonds for € 2.185 million and on mutual investment funds for € 3.865 million, as well as reversal of impairment losses for € 7,257 million on bonds.

165
Notes to the accounts
4.6 Financial assets at fair value through profit or loss This category comprises the classification of financial assets, including derivatives, held for trading and those designated by the Group as valued at fair value, with a balancing entry in the income statement. Specifically, besides assets held for trading purposes, the item also includes the financial assets designated at fair value through profit or loss relating to : • insurance or investment contracts issued by the Group whose investment risk is borne by the policyholders; • the management of pension funds. As of the end of the accounting period, financial assets at fair value through profit or loss represented 24.8% of total financial instruments disciplined by IAS 39 included under investments. Furthermore, with reference to the securities positions issued by Icelandic banks, a recovery value was adopted, in line with that used in previous years, of 6.625% for Kaupthing, 3% for Glitnir and 1.25% for Landsbanki. The incidence of the Group’s exposure in instruments issued by Icelandic banks, included in the category “Financial assets at fair value through profit or loss”, comes to 0.01%. The Group does not have any instruments issued by the Lehman Brothers Group, by Madoff or subprime instruments in this category. Table 32 - Financial assets at fair value through profit or loss
Changes
(€ thousands) 2012 2011 Abs. amount %
Trading assets 787,236 426,820 360,416 84.4
Shares 259 542 -283 -52.2
Bonds 758,332 402,812 355,520 88.3
Investment funds 465 669 -204 -30.5
Derivatives 27,705 21,264 6,441 30.3
Other 475 1,533 -1,058 -69.0
Assets indicated by the Group 2,927,505 3,666,399 -738,894 -20.2
Shares 9,378 18,576 -9,198 -49.5
Bonds 2,410,822 3,133,261 -722,439 -23.1
Investment funds 427,066 414,422 12,644 3.1
Derivatives 85,738 92,142 -6,404 -7.0
Other -5,499 7,998 -13,497 n.s.
Total 3,714,741 4,093,219 -378,478 -9.2
n.s. = not significant

166
Derivatives The Group holds under its assets a hedging derivative represented by the option deriving from the agreement with Veneto Banca Holding regarding CARIFAC shares. With regard to non-hedging derivatives, those classified held for trading amount to € 21.993 million and essentially comprise swap agreements, while those at fair value through profit or loss come to € 85.738 million and are mainly represented by options and swaps (Class D). Furthermore, the Group possesses other financial instruments characterised by embedded derivatives; these instruments are classified in the category “Financial assets at fair value through profit or loss” and are valued at fair value; therefore steps were not taken to separate the embedded derivative as permitted by IAS 39.
***
During 2011, with the deterioration of the Greek economic crisis, an impairment was applied, of € 92.926 million, booking to the income statement the entire negative reserve for Greek securities in the portfolio classified under available for sale financial assets. As already mentioned under Significant events and other information in the Management report, during 2012 the Group took part in the exchange offering on Greek government securities for a value of € 27.291 million, which led to the recording of net capital gains for € 607 thousand. Steps were also taken to further dismantle part of the exposure in these securities. The table below provides a breakdown of the Cattolica Group’s residual exposures at December 31st, 2012 in Greek government debt securities and further below the exposure in government debt securities issued by other European Union countries.
Table 33 - Exposure in Greek Government debt securities
(€ thousands)
Nominal value as at December
31st, 2012
Fair value as at December 31st,
2012
Impairment in the income statement
Gross AFS provision
Available for sale financial assets 36,692 4,419 0 1,620
Financial assets at fair value through profit or loss 0 0 0 0
Total 36,692 4,419 0 1,620
Table 34 - Exposure in government debt securities issued by EU zone countries - Available for sale financial assets
Country Maturing Maturing between Maturing Total Gross AFS
(€ thousands) up to 5 years 6 and 10 years beyond 10 years fair value provision
Italy 3,207,701 2,893,447 520,479 6,621,627 89,731
Spain 1,640 210 0 1,850 -3
Portugal 0 0 0 0 0
Ireland 9,760 177,549 56,623 243,932 11,114
Other EU countries 8,645 9,584 4,419 22,648 4,204
TOTAL 3,227,746 3,080,790 581,521 6,890,057 105,046

167
Notes to the accounts
Table 35 - Exposure in government debt securities issued by EU zone countries - Financial assets at fair value through profit or loss
Country Maturing
Maturing between Maturing Total
(€ thousands) up to 5 years 6 and 10 years beyond 10 years fair value*
Italy 1,347,324 258,884 9,653 1,615,861
Spain 34,802 0 0 34,802
Portugal 0 0 0 0
Ireland 104 0 0 104
Other EU countries 41,722 19,079 3,806 64,607
TOTAL 1,423,952 277,963 13,459 1,715,374
* of which the value of financial assets at fair value through profit or loss amounts to € 973.246 million.
Table 36 - Exposure in government debt securities issued by EU zone countries - Held to maturity investments
Country Maturing Maturing Maturing Total Total
(€ thousands) up to 5 years between 6 and 10 years
beyond 10 years book value fair value
Italy 0 101,767 115,746 217,513 225,346
Spain 0 15,329 0 15,329 15,719
Portugal 0 0 0 0 0
Ireland 0 0 0 0 0
Other EU countries 0 0 0 0 0
TOTAL 0 117,096 115,746 232,842 241,065
***

168
Table 37 – Analysis of financial assets and liabilities by level (ISVAP Regulation No. 7 dated July 13th, 2007)
Level 1 Level 2 Level 3 Total
(€ thousands) 2012 2011 2012 2011 2012 2011 2012 2011 Available for sale financial assets 8,637,744 7,503,239 595,611 563,602 497,304 445,394 9,730,659 8,512,235
Financial assets at fair value Financial assets held for trading 740,543 355,573 37,550 49,079 9,143 22,168 787,236 426,820
through profit and loss Financial assets at fair value
through profit or loss 1,001,124 924,595 1,920,761 2,741,291 5,620 513 2,927,505 3,666,399
Total 10,379,411 8,783,407 2,553,922 3,353,972 512,067 468,075 13,445,400 12,605,454
Financial liabilities at fair value
Financial liabilities held
for trading 0 0 6,570 10,285 0 0 6,570 10,285 through profit and loss Financial
liabilities at fair value through profit or loss 0 0 926,843 951,905 0 0 926,843 951,905
Total 0 0 933,413 962,190 0 0 933,413 962,190
Table 38 – Analysis of changes in level 3 financial assets and liabilities (ISVAP Regulation No. 7 dated July 13th, 2007)
Financial assets Financial liabilities at fair value through profit and loss
Financial assets at fair value
through profit and loss
(€ thousands)
Available for sale financial assets
Financial assets held for trading
Financial assets at fair value
through profit or loss
Financial liabilities held
for trading
Financial liabilities at fair value through profit or loss
Opening balance 445,394 22,168 513 0 0 Purchases/Issues 62,132 3,048 0 0 0 Sales/Repurchases -4,322 -11,179 -508 0 0 Reimbursements 0 0 0 0 0 Gain or loss recorded in the income statement -2,220 -4,917 -1,614 0 0 Gain or loss recorded in other components of the statement of comprehensive income -2,103 0 0 0 0
Transfers in level 3 7,588 23 7,229 0 0 Transfers to other levels 0 0 0 0 0
Other changes -9,165 0 0 0 0
Closing balance 497,304 9,143 5,620 0 0

169
Notes to the accounts
Table 39- Analysis of assets and liabilities relating to contracts issued by insurance companies where the investment risk is borne by the policyholders and deriving from pension fund management (ISVAP Regulation No. 7 dated July 13th, 2007)
Benefits associated with investment funds and stock
market indices
Benefits associated with the management of pension funds Total
(€ thousands) 2012 2011 2012 2011 2012 2011
Assets in the financial statements 2,197,612 3,020,860 789,548 682,935 2,987,160 3,703,795
Intercompany assets* 0 0 0 0 0 0
Total assets 2,197,612 3,020,860 789,548 682,935 2,987,160 3,703,795
Financial liabilities in the financial statements 197,585 283,051 719,041 625,975 916,626 909,026
Technical provisions in the financial statements 2,000,027 2,737,809 70,507 56,960 2,070,534 2,794,769
Intercompany liabilities * 0 0 0 0 0 0
Total liabilities 2,197,612 3,020,860 789,548 682,935 2,987,160 3,703,795 * Assets and liabilities eliminated during the consolidation process
5. SUNDRY RECEIVABLES
Table 40 - Sundry receivables
Changes
(€ thousands) 2012 2011 Abs. amount %
Receivables deriving from direct insurance transactions 497,727 615,819 -118,092 -19.2
Policyholders 237,420 279,931 -42,511 -15.2
Insurance brokers 154,278 215,557 -61,279 -28.4
Insurance companies - current accounts 73,180 84,617 -11,437 -13.5
Policyholders and third parties for claims to be settled 32,849 35,714 -2,865 -8.0
Receivables deriving from reinsurance transactions 122,916 113,476 9,440 8.3
Insurance and reinsurance companies 116,569 106,109 10,460 9.9
Reinsurance brokers 6,347 7,367 -1,020 -13.8
Other receivables 155,114 57,601 97,513 n.s.
Total 775,757 786,896 -11,139 -1.4
n.s. = not significant
On the basis of the experience of previous accounting periods, the item was adjusted for a total of € 64.262 million for depreciations due to presumed payability. Other receivables included € 100 million in advance payments paid over by Fondo Euripide for the purchase of the property in Piazza Cordusio, Milan. This item also included amounts due for management fees deriving from the management of the internal and external funds of unit-linked products, as well as amounts receivable for advances to suppliers, amounts due from employees, amounts due from tenants, amounts due from guarantee funds and guarantee deposits.
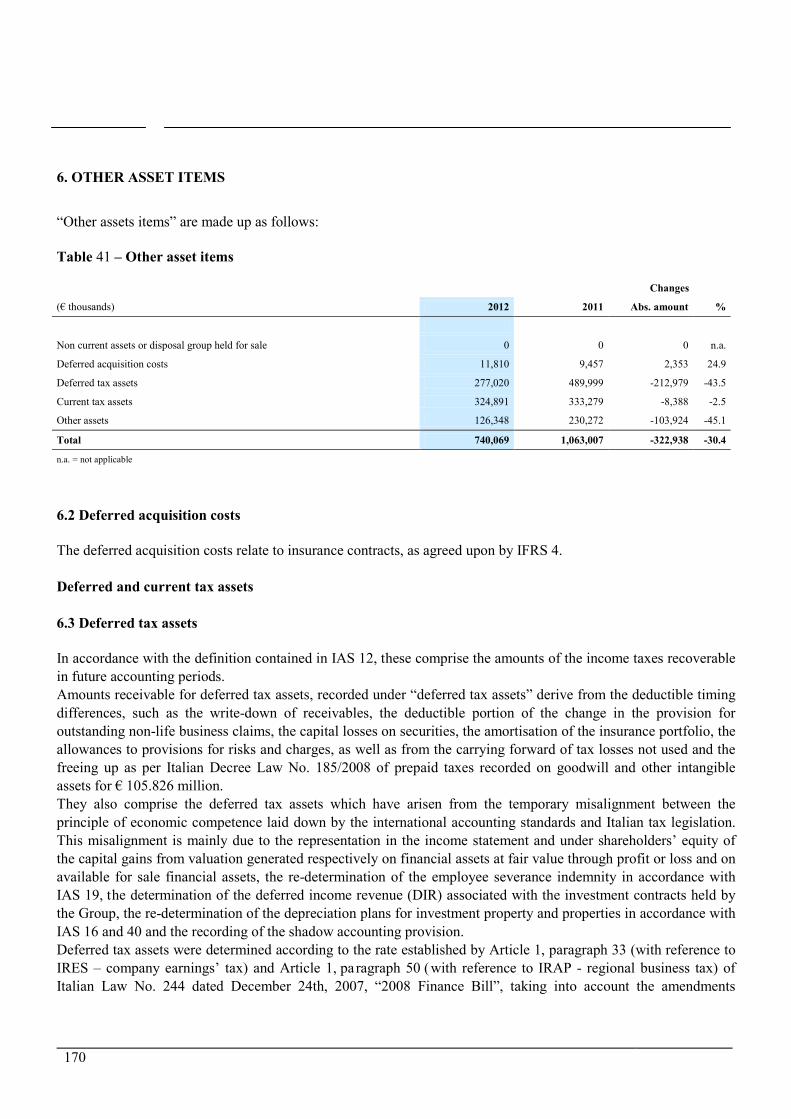
170
6. OTHER ASSET ITEMS
“Other assets items” are made up as follows: Table 41 – Other asset items
Changes
(€ thousands) 2012 2011 Abs. amount %
Non current assets or disposal group held for sale 0 0 0 n.a.
Deferred acquisition costs 11,810 9,457 2,353 24.9
Deferred tax assets 277,020 489,999 -212,979 -43.5
Current tax assets 324,891 333,279 -8,388 -2.5
Other assets 126,348 230,272 -103,924 -45.1
Total 740,069 1,063,007 -322,938 -30.4
n.a. = not applicable
6.2 Deferred acquisition costs The deferred acquisition costs relate to insurance contracts, as agreed upon by IFRS 4. Deferred and current tax assets 6.3 Deferred tax assets In accordance with the definition contained in IAS 12, these comprise the amounts of the income taxes recoverable in future accounting periods. Amounts receivable for deferred tax assets, recorded under “deferred tax assets” derive from the deductible timing differences, such as the write-down of receivables, the deductible portion of the change in the provision for outstanding non-life business claims, the capital losses on securities, the amortisation of the insurance portfolio, the allowances to provisions for risks and charges, as well as from the carrying forward of tax losses not used and the freeing up as per Italian Decree Law No. 185/2008 of prepaid taxes recorded on goodwill and other intangible assets for € 105.826 million. They also comprise the deferred tax assets which have arisen from the temporary misalignment between the principle of economic competence laid down by the international accounting standards and Italian tax legislation. This misalignment is mainly due to the representation in the income statement and under shareholders’ equity of the capital gains from valuation generated respectively on financial assets at fair value through profit or loss and on available for sale financial assets, the re-determination of the employee severance indemnity in accordance with IAS 19, the determination of the deferred income revenue (DIR) associated with the investment contracts held by the Group, the re-determination of the depreciation plans for investment property and properties in accordance with IAS 16 and 40 and the recording of the shadow accounting provision. Deferred tax assets were determined according to the rate established by Article 1, paragraph 33 (with reference to IRES – company earnings’ tax) and Article 1, paragraph 50 (with reference to IRAP - regional business tax) of Italian Law No. 244 dated December 24th, 2007, “2008 Finance Bill”, taking into account the amendments

171
Notes to the accounts
introduced by Article 23, pa ragraph 5 of Italian Decree Law No. 98 da ted July 6th, 2011 c ontaining “Urgent provisions for financial stabilisation” (so-called “corrective manoeuvre”). 6.4 Current tax assets They are represented by the amounts due from the tax authorities and mainly derive from the surplus emerging from the tax returns presented, withholdings made on bank interest, tax credits on income deriving from the equity investments in mutual investment funds, the advance tax on employee severance indemnities as per Article 3, paragraph 213 of Italian Law No. 662 dated December 23rd, 1996 and from amounts due from the tax authorities transferred to the Parent Company by the subsidiary companies who have complied with the tax consolidation system. The amounts due from the tax authorities also comprise the prepaid taxes pursuant to Italian Law No. 265 dated November 22nd, 20 02, concerning the taxation of the life provisions, and the amounts due from the tax authorities for the payment of the annual advance of tax on premiums envisaged by Article 9, paragraph 1 bis of Italian Law No. 1216. 6.5 Other assets This item includes transitory reinsurance accounts, deferred commission expense (DAC - deferred acquisition cost), and other assets. Table 42 - Other assets
Changes
(€ thousands) 2012 2011 Abs. amount %
Transitory reinsurance accounts 19,253 19,509 -256 -1.3
Deferred acquisition cost relating to investment contracts 1,733 2,802 -1,069 -38.2
Accruals and deferrals 3,841 172,029 -168,188 -97.8
of which for interest 1 168,933 -168,932 -100.0
of which for rental and other fees 3,840 3,096 744 24.0
Sundry assets 101,521 35,932 65,589 n.s.
Total 126,348 230,272 -103,924 -45.1
n.s. = not significant
The item “transitory reinsurance accounts” concerns the cost items of reinsurance receivable for 2012, which will be booked to the income statement during the subsequent accounting period, when all the cost and revenue components will be known. The item “deferred contracts relating to investment contracts” refers to the deferred acquisition costs associated with investment policies or contracts not complying with the definition of insurance policy as per IFRS 4. The change in the item accruals and deferrals derives from the reclassification, made in 2012, of the accrued income on securities in the asset items in which the related debt securities are recorded. Sundry assets include the amounts relating to the taxation on the mathematical provisions of the life classes accrued during the year and the balance of the liaison account between the life and non-life sectors of the Group insurance companies. The amount of € 24.447 million is matched by an equal balance under “Other liabilities”.

172
7. CASH AND CASH EQUIVALENTS
The item “Cash and cash equivalents” represents the balance as of the end of the accounting period of the current accounts held with various banks. Cash and cash equivalents amount to € 607.711 million and during the year disclosed an increase of € 200.473 million. The book value of these assets significantly approximates their fair value. Deposits and bank current accounts are remunerated at both fixed and floating rates.
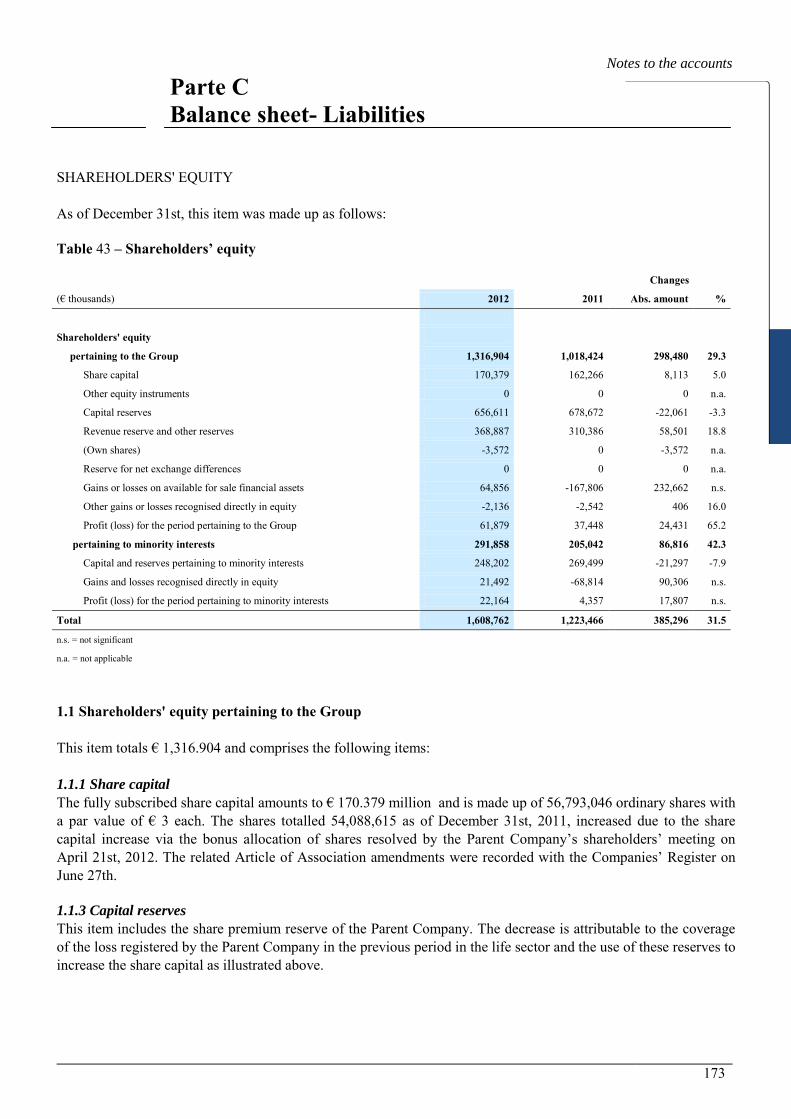
173
Notes to the accounts
SHAREHOLDERS' EQUITY As of December 31st, this item was made up as follows: Table 43 – Shareholders’ equity
Changes
(€ thousands) 2012 2011 Abs. amount %
Shareholders' equity
pertaining to the Group 1,316,904 1,018,424 298,480 29.3
Share capital 170,379 162,266 8,113 5.0
Other equity instruments 0 0 0 n.a.
Capital reserves 656,611 678,672 -22,061 -3.3
Revenue reserve and other reserves 368,887 310,386 58,501 18.8
(Own shares) -3,572 0 -3,572 n.a.
Reserve for net exchange differences 0 0 0 n.a.
Gains or losses on available for sale financial assets 64,856 -167,806 232,662 n.s.
Other gains or losses recognised directly in equity -2,136 -2,542 406 16.0
Profit (loss) for the period pertaining to the Group 61,879 37,448 24,431 65.2
pertaining to minority interests 291,858 205,042 86,816 42.3
Capital and reserves pertaining to minority interests 248,202 269,499 -21,297 -7.9
Gains and losses recognised directly in equity 21,492 -68,814 90,306 n.s.
Profit (loss) for the period pertaining to minority interests 22,164 4,357 17,807 n.s.
Total 1,608,762 1,223,466 385,296 31.5
n.s. = not significant
n.a. = not applicable
1.1 Shareholders' equity pertaining to the Group This item totals € 1,316.904 and comprises the following items: 1.1.1 Share capital The fully subscribed share capital amounts to € 170.379 million and is made up of 56,793,046 ordinary shares with a par value of € 3 each. The shares totalled 54,088,615 as of December 31st, 2011, increased due to the share capital increase via the bonus allocation of shares resolved by the Parent Company’s shareholders’ meeting on April 21st, 2012. The related Article of Association amendments were recorded with the Companies’ Register on June 27th. 1.1.3 Capital reserves This item includes the share premium reserve of the Parent Company. The decrease is attributable to the coverage of the loss registered by the Parent Company in the previous period in the life sector and the use of these reserves to increase the share capital as illustrated above.
Parte C Balance sheet- Liabilities

174
1.1.4 Revenue reserve and other reserves This item comprises the gains and losses deriving from the initial application of the international accounting standards (IFRS 1) and the reserves envisaged by the Italian Civil Code (consolidation reserve and legal reserve) and by special laws prior to the adoption of the international accounting standards. The change is attributable to the distribution of the profit for the previous year and the performance of the consolidation reserves. 1.1.5 Own shares At December 31st, the Parent Company held 360,808 own shares. 1.1.7 Gains or losses on available for sale financial assets The changes, net of the related deferred taxation, recorded during the period are mainly attributable to: • the transfer of net capital losses to the income statement following disposals, € 91.118 million, and impairment
for € 14.413 million; • net positive fair value changes in financial instruments included in the corresponding asset item for € 128.59
million. 1.2 Shareholders' equity pertaining to minority interests This account comprises the values pertaining to minority shareholders regarding the companies included in the scope of consolidation. With reference to the item gains or losses recorded directly under equity, changes were recorded during the year, net of the related deferred taxation, essentially due to: • the transfer of net capital losses to the income statement following disposals, € 26.95 million and impairment
for € 2.906 million; • net positive fair value changes in financial instruments included in the corresponding asset item for € 61.326
million. 2. PROVISIONS AND ALLOWANCES Table 44 – Provisions and allowances
Changes
(€ thousands) 2012 2011 Abs. amount %
Provisions and allowances 29,820 27,736 2,084 7.5
Table 45 – Provisions and allowances – changes during the period
(€ thousands) 2011 Increases Decreases 2012
Provisions and allowances 27,736 12,643 10,559 29,820

175
Notes to the accounts
As of December 31st, the item provisions and allowances mainly comprised amounts set aside for: • legal disputes and costs for € 11.982 million (€ 4.414 million was provided and € 2.935 used during the year); • formal notices or reports on findings which can be served by the ISVAP for the violations of Italian Law No.
57/01 or for other findings for € 5.161 million (€ 2.641 million was provided and € 2.193 million used during the year);
• sums which will be paid for the acceptance of any requests by beneficiaries for services depending on life assurance policies in relation to which prescription has taken place in favour of the Group for 921 thousand (€ 1.539 million was used during the year);
• disputes open relating to employment matters or tax aspects for € 6.712 million (€ 2.892 million was provided and € 3.271 million used during the year);
• the defence expense provision for € 1.188 million (€ 166 thousand was provided and € 40 thousand used during the year).
The outlays are envisaged over the short-term and therefore are not subject to any discounting. With regard to the legal and tax-related disputes, account is taken of the advice of legal/tax advisors with regard to the outcome of the same. With regard to the sanctions, ISVAP has taken into account those already communicated as well as the time series in the past registered by the insurance companies in the Group. 3. TECHNICAL PROVISIONS As referred to in the accounting policies, the item includes the commitments which derive from insurance contracts and those which derive from investment contracts involving Discretionary Participation Features (DPF), before amounts transferred to re-insurers. The fairness of the liabilities as of December 31st, 2012, was ascertained by means of the method envisaged by section 15 et seq. of IFRS 4 (liability adequacy test). The assessment was carried out on the liabilities relating to portfolios classified as insurance or investment contracts with Discretionary Participation Features (DPF). The test was carried out by comparing the technical provisions, decreased by the acquisition costs still to be amortised and the value of any other related intangible assets, with the current value of the expected cash flows generated by the contract, including the liquidation and management costs. In the event of insufficiency of the provisions, the difference is booked to the income statement with an increase of the liabilities. Since the current estimates have confirmed that the provisions provided as of December 31st, 2012 are adequate, no supplementary provision is required.

176
Table 46 – Analysis of technical provisions (ISVAP Regulation No. 7 dated July 13th, 2007)
Direct business Indirect business Total book value (€ thousands) 2012 2011 2012 2011 2012 2011
Non-life provisions 2,990,989 2,936,249 24,930 22,815 3,015,919 2,959,064
Provision for unearned premiums 693,156 617,755 8,383 7,939 701,539 625,694
Provision for outstanding claims 2,295,631 2,316,194 16,547 14,876 2,312,178 2,331,070
Other provisions 2,202 2,300 0 0 2,202 2,300 of which provisions provided following the assessment of fairness of the liabilities 0 0 0 0 0 0
Life provisions 11,706,940 11,618,011 4,575 4,592 11,711,515 11,622,603
Provision for outstanding claims 291,693 270,351 0 14 291,693 270,365
Mathematical provisions 9,288,042 9,137,212 4,488 4,490 9,292,530 9,141,702 Technical provisions for contracts where the investment risk is borne by the policyholders and provisions for pension funds
2,070,534 2,794,769 0 0 2,070,534 2,794,769
Other provisions 56,671 -584,321 87 88 56,758 -584,233 of which provisions provided following the assessment of fairness of the liabilities 0 0 0 0 0 0
of which deferred liabilities due from policyholders 2,594 -637,543 0 0 2,594 -637,543
Total technical provisions 14,697,929 14,554,260 29,505 27,407 14,727,434 14,581,667
NON-LIFE BUSINESS Provision for unearned premiums In accordance with Italian legislation, the item comprises both the provision for premium fractions, supplemented by the premium provision calculated for certain classes as per specific ministerial requirements, and the provision for unexpired risks. LIFE BUSINESS Mathematical provisions The mathematical provisions include those envisaged by ISVAP Regulation No. 21 dated March 28th, 2008. Technical provisions where the investment risk is borne by the policyholders and provisions deriving from the management of pension funds. This item exclusively comprises the provisions relating to index-linked and unit-linked polices and the provisions relating to pension funds. Other provisions Other provisions mainly comprise provisions for future costs associated with insurance contracts for € 46.135 million and the positive shadow accounting provision totalling € 2.594 million.

177
Notes to the accounts
4. FINANCIAL LIABILITIES Table 47 – Financial liabilities
Changes
(€ thousands) 2012 2011 Abs. amount %
Financial liabilities at fair value through profit or loss 933,413 962,190 -28,777 -3.0
Other financial liabilities 330,985 291,882 39,103 13.4
Total 1,264,398 1,254,072 10,326 0.8
4.1 Financial liabilities at fair value through profit or loss The item includes the financial liabilities at fair value through profit or loss, defined and disciplined by IAS 39, relating to:
• the investment contracts, not falling within the scope of IFRS 4, issued by Group insurance companies, where the risk of the investment is borne by the policyholders;
• the management of pension funds, not falling within the scope of IFRS 4. The item represents 73.8% of total financial liabilities. In detail, the technical provisions relating to investment contracts, which mainly comprise the provisions against index and unit-linked contracts, amount to € 197.585 million (€ 283.051 million at the end of the previous year), and the technical provisions against pension funds, amount in total to € 719.041 million (€ 625.975 million last year). 4.2 Other financial liabilities The item represents 26.2% of total financial liabilities. The item includes the financial liabilities defined and disciplined by IAS 39 not included in the category “Financial liabilities at fair value through profit or loss”, and therefore subordinated liabilities for € 80 million, deposits received from re-insurers which totalled € 68.392 million, technical provisions associated with investment contracts valued at amortised cost for € 30.018 million and loans for € 152.575 million. In detail, the features of the loans are as follows:
• a subordinated loan with an unspecified maturity amounting to € 80 million taken out with UBI and disbursed on September 30th, 2010. The interest rate equates to the 6-month Euribor uplifted by 200 basis points. The possibility of early repayment is envisaged as from September 30th, 2020. A subordination condition is envisaged with respect to all the unsubordinated creditors including the policyholders. This loan is allowed in full within the calculation of the elements making up the solvency margin.
• a mortgage loan of € 69.7 million taken out with ING Real Estate Finance (Spain) on October 4th, 2007 pertaining to Fondo Macquarie Office Italy. Following the amending document dated June 11th, 2009, the expiry was extended until October 4th, 2014. The interest rate equates to the 3-month Euribor uplifted by 175 basis points. The repayment of the principal is envisaged on expiry of the agreement, while the settlement of the interest is in quarterly instalments;
• a mortgage loan of € 6.873 million taken out with the Banca Intesa Group on March 24th, 2004 pertaining to Fondo Euripide. The interest rate equates to the 3-month Euribor uplifted by 85 ba sis points and is repayable in quarterly instalments until December 31st, 2019;

178
• a loan of € 25 million taken out with Banca Popolare di Sondrio on December 13th, 2012 and pertaining to Cattolica Services. The interest rate equates to the 3-month Euribor uplifted by 425 ba sis points and is repayable in quarterly instalments as from April 30th, 2013 until December 31st, 2017;
• a loan of € 4 million taken out with Cassa di Risparmio Ferrara on December 21st, 2012 and pertaining to Cattolica Services. The interest rate equates to 4.4% index-linked on the basis of the arithmetic average of the 3-month and 6-month Euribor and is repayable in quarterly instalments as from March 31st, 2013 until December 31st, 2016;
• a loan of € 3 million taken out with Banca di Verona on December 13th, 2012 and pertaining to Cattolica Services. The interest rate equates to the 3-month Euribor uplifted by 425 basis points and is repayable in quarterly instalments as from March 31st, 2013 until December 31st, 2016;
• the residual debt of € 40.612 million contracted with the Cassamarca Foundation on October 15th, 2012 relating to the purchase by Cattolica Agricola of Tenuta Ca’ Tron. The payment is envisaged in two instalments on December 31st, 2013 and 2014. The interest rate for the payment extension equates to 5.9984% and is paid in a single solution together with the second instalment;
• the residual debt of € 3.3 9 million contracted with the Cassamarca Foundation on O ctober 15th, 2012 relating to the purchase by Cattolica Beni Immobili of Tenuta Ca’ Tron. The payment is envisaged in two instalments on December 31st, 2013 and 2014. The interest rate for the payment extension equates to 5.9984% and is paid in a single solution together with the second instalment.
The table below provides an analysis of the financial liabilities undertaken by the Group, expressed according to nature and in accordance with the IAS classification criteria. Table 48 – Analysis of financial liabilities (ISVAP Regulation No. 7 dated July 13th 2007)
Financial liabilities at fair value through profit or loss Financial liabilities held
for trading
Financial liabilities at fair value through profit or
loss Other financial liabilities Total value for the period
(€ thousands) 2012 2011 2012 2011 2012 2011 2012 2011
Participative financial instruments 0 0 0 0 0 0 0 0
Subordinated liabilities 0 0 0 0 80,000 80,000 80,000 80,000 Liabilities from financial policies issued by insurance companies deriving:
0 0 926,843 951,905 30,018 52,372 956,861 1,004,277
from contracts where the investment risk is borne by the policyholders
0 0 197,585 283,051 0 0 197,585 283,051
from the management of pension funds 0 0 719,041 625,975 0 0 719,041 625,975
from other policies 0 0 10,217 42,879 30,018 52,372 40,235 95,251 Deposits received from re-insurers 0 0 0 0 68,392 82,089 68,392 82,089 Financial liability components of insurance contracts 0 0 0 0 0 0 0 0
Debt securities issued 0 0 0 0 0 0 0 0
Payables due to banking customers 0 0 0 0 0 0 0 0
Interbanking payables 0 0 0 0 0 0 0 0
Other loans received 0 0 0 0 0 0 0 0
Non-hedging derivatives 3,780 10,223 0 0 0 0 3,780 10,223
Hedging derivatives 2,729 0 0 0 0 0 2,729 0
Sundry financial liabilities 61 62 0 0 152,575 77,421 152,636 77,483
Total 6,570 10,285 926,843 951,905 330,985 291,882 1,264,398 1,254,072

179
Notes to the accounts
5. PAYABLES The account group comprises trade payables disciplined by IAS 39, mainly represented by payables deriving from direct insurance transactions, reinsurance payables and other payables. Table 49 - Payables
Changes
(€ thousands) 2012 2011 Abs. amount %
Payables deriving from direct insurance transactions 65,637 81,111 -15,474 -19.1
Insurance brokers 43,997 59,676 -15,679 -26.3
Insurance companies - current accounts 13,068 15,155 -2,087 -13.8
Policyholders for guarantee deposits and premiums 320 375 -55 -14.7
Guarantee funds in favour of policyholders 8,252 5,905 2,347 39.7
Payables deriving from reinsurance transactions 95,762 112,351 -16,589 -14.8
Insurance and reinsurance companies 94,773 110,963 -16,190 -14.6
Insurance brokers 989 1,388 -399 -28.7
Other payables 198,580 209,150 -10,570 -5.1
For taxes payable by policyholders 33,509 36,524 -3,015 -8.3
Amounts due to social security and welfare institutions 4,086 3,559 527 14.8
Sundry payables 160,985 169,067 -8,082 -4.8
Total 359,979 402,612 -42,633 -10.6
5.1 Payables deriving from direct insurance transactions “Payables deriving from direct insurance transactions” mainly comprise the amounts due to insurance brokers. In detail, amounts due to insurance brokers take into account the supplementary year-end registrations pertaining to the assessment of the production premiums and the timing mismatch registered in the settlement of the commission with the bank-assurance channel. 5.2 Payables deriving from reinsurance transactions “Payables deriving from reinsurance transactions” include the items with debt balances associated with reinsurance. 5.3 Other payables These include payables for taxes payable by insurers, amounts due to welfare and social security institutions and other sundry payables. In detail, the item sundry payables included amounts due to suppliers, due to employees, payables for premiums being collected and for the allowance for employee severance indemnities. The employee severance indemnity is subject to actuarial calculation which takes into account the future developments of the employment relationship. The future flows of the employee severance indemnity have been

180
discounted back as of the reference date on the basis of the method expressly requested by paragraph 64 of IAS 19, the so-called Projected Unit Credit Method, as explained in the accounting policies. The projected benefits which can be disbursed in the event of death, incapacity, resignation or retirement based on the applicable actuarial bases have been determined for all the employees active as of the date of assessment and distributed uniformly over all the years of service for each employee as from the date of employment until the date the events take place. As stated in the accounting policies, for Group companies with at least 50 e mployees, the employee severance indemnity accrued up to December 31st, 2006 is treated like a defined benefit plan and is therefore subject to actuarial calculation, while the employee severance indemnity allocated as from January 1st, 2007 to a specific Treasury Fund set up with INPS (national social security institute) is treated as a defined contribution plan. For the companies with less than 50 employees, the entire liability has been treated as a defined benefit plan. The employee severance indemnity recorded in the financial statements represents the effective value of the foreseeable obligation, net of any assets serving the plans, adjusted to reflect any actuarial losses or gains not amortised. The discounting back of the future cash flows is carried out on the basis of the interest rate of high quality corporate securities. The main hypotheses used are: discount rate of 2.54%, inflation rate of 2%, revaluation rate of 2.67% (already net of 11% taxation), salary increase of 3%, mortality according to the IPS55 table with rejuvenation of 5 years for women, invalidity equating to 100% of the mortality, retirement age of 65 years for men and 60 years for women. In relation to the resignation frequency, a table has been used in line with the expected value of the resignation rate over the long-term for the Parent Company. Table 50 – Employee severance indemnity and length-of-service bonus
(€ thousands)
EMPLOYEE SEVERANCE INDEMNITY
Balance as of Dec. 31st, 2011 18,628 Provision made 6,707 Used for indemnities paid out/advances 5,807 Other 849
Balance as of Dec. 31st, 2012 20,377
6. OTHER LIABILITY ITEMS Table 51 – Other liability items
Changes
(€ thousands) 2012 2011 Abs. amount %
Deferred tax liabilities 157,555 239,693 -82,138 -34.3
Current tax liabilities 232,344 121,792 110,552 90.8
Other liabilities 68,242 70,553 -2,311 -3.3
Total 458,141 432,038 26,103 6.0

181
Notes to the accounts
6.2 Deferred tax liabilities This item comprises the deferred tax liabilities defined and disciplined by IAS 12. As of December 31st, “deferred tax liabilities” included: • the deferred taxes which have arisen from taxable timing differences due to the deferral of the taxability of
positive income elements realised and recorded in the income statement, which will be settled when the afore-mentioned revenues will be taxed;
• the deferred taxes which have arisen from the temporary misalignment between the principle of economic competence laid down by the international accounting standards and tax legislation, due mainly to the statement in the income statement and under shareholders’ equity of the capital gains on valuations recorded respectively on the “financial assets at fair value through profit or loss” and on the “available for sale financial assets”, and to the recording of the shadow accounting provision.
Deferred tax liabilities were determined according to the rate established by Article 1, paragraph 33 (with reference to IRES – company earnings’ tax) and Article 1, paragraph 50 (with reference to IRAP - regional business tax) of Italian Law No. 244 dated December 24th, 2007, “2008 Finance Bill”, taking into account the amendments introduced by Article 23, pa ragraph 5 of Italian Decree Law No. 98 da ted July 6th, 2011 c ontaining “Urgent provisions for financial stabilisation” (so-called “corrective manoeuvre”). 6.3 Current tax liabilities This item comprises the current tax liabilities defined and disciplined under IAS 12. The item comprises the current residual liability for income taxes for the year, the liability deriving from the assessment of taxation on the life business mathematical provisions pertaining to the year, liabilities for withholding taxes made, as well as VAT to be paid over, along with the liability for substitute tax to be paid amounting to € 22.33 2 million, relating to the freeing up of prepaid taxes recorded on g oodwill and intangible assets as per Italian Decree Law No. 185/2008. 6.4 Other liabilities The item mainly comprises transitory reinsurance accounts, the deferred commission income associated with contracts not falling with the scope of IFRS 4, accrued expenses and deferred income and sundry liabilities. Table 52 - Other liabilities
Changes
(€ thousands) 2012 2011 Abs. amount % Deferred income revenue (DIR) 1,938 3,573 -1,635 -45.8
Transitory reinsurance accounts 17,916 20,675 -2,759 -13.3
Liaison account 24,447 13,536 10,911 80.6
Other liabilities 9,201 14,198 -4,997 -35.2
Accrued expenses and deferred income, of which: 14,740 18,571 -3,831 -20.6
for interest 9,354 14,464 -5,110 -35.3
other accruals and deferrals 5,386 4,107 1,279 31.1
Total 68,242 70,553 -2,311 -3.3

182
The “deferred income revenue” was mainly chargeable to index and unit-linked type investment contracts, where the risk of the investments is borne by the policyholders. The item “Transitory reinsurance accounts (liabilities)” comprises the positive components of income from receivable reinsurance which will be recorded as revenues when all the cost and revenue components are known. The item “other liabilities” also comprises the liaison account between the life and non-life sectors of the Group insurance companies which carry out insurance activities in both sectors. The amount of € 24.447 million is matched by an equal balance under assets. Deferred income includes the Parent Company’s portion of the extraordinary coupon relating to the bonds acquired with reference to the restructuring transactions of the main segregated fund entered into in 2005 and deferred to subsequent years on the basis of the residual duration of the securities.

183
Notes to the accounts
The income statement closed with a consolidated net profit of € 84.043 million (€ 41.805 million as at December 31st, 2011) of which € 46.842 million due to the non-life segment (€ 40.558 million as at December 31st, 2011), € 36.551 million to the life segment (- € 714 thousand as at December 31st, 2011) and € 650 thousand to the ‘Other’ segment (€ 1.961 million as at December 31st, 2011). INSURANCE BUSINESS With reference to insurance business, in addition to the matters illustrated below, reference should be made to the table in the management report “Reclassified consolidated income statement by segment of activities”. The table below shows the breakdown of the gross insurance premiums recorded relating to direct and indirect business. Table 53– Breakdown of direct and indirect gross premiums written by class and by geographic area
Classes Direct business Indirect business % (€ thousands) Italy Italy Abroad Total business of total 01 - Accident and injury 124,503 -5 336 124,834 3.4 02 – Health 97,656 0 18 97,674 2.7 03 - Land vehicle hulls 107,653 0 0 107,653 3.0 04 - Railway rolling stock 0 0 0 0 0 05 - Aircraft hulls 699 0 0 699 n.s. 06 - Ships (sea and inland water vessels) 1,429 0 186 1,615 n.s. 07 - Goods in transit 6,165 0 268 6,433 0.2 08 - Fire & natural forces 106,598 0 12,604 119,202 3.2 09 - Other damage to assets 139,631 388 405 140,424 3.8 10 - TPL - Land motor vehicles 868,158 0 402 868,560 23.6 11 - TPL – Aircraft 184 0 0 184 n.s. 12 - TPL - Shipping (sea & inland) 1,224 0 0 1,224 n.s. 13 - TPL –General 157,594 449 1 158,044 4.3 14 – Credit 797 0 0 797 n.s. 15 – Suretyship 12,408 0 51 12,459 0.4 16 - Sundry financial losses 24,596 0 0 24,596 0.7 17- Legal protection 11,293 0 0 11,293 0.3 18 – Assistance 24,856 0 0 24,856 0.7 Total non-life classes 1,685,444 832 14,271 1,700,547 46.3 Class I 1,307,649 101 0 1,307,750 35.6 Class III 199,799 0 0 199,799 5.4 Class IV 44 0 0 44 n.s. Class V 318,686 0 0 318,686 8.7 Class VI 12,244 0 0 12,244 0.3 Total life classes 1,838,422 101 0 1,838,523 50.0
Total insurance premiums 3,523,866 933 14,271 3,539,070 96.3 Class I 0 0 0 0 0 Class III 3,675 0 0 3,675 0.1 Class IV 0 0 0 0 0 Class V 0 0 0 0 0 Class VI 133,925 0 0 133,925 3.6 Total investment contracts 137,600 0 0 137,600 3.7
TOTAL PREMIUMS WRITTEN 3,661,466 933 14,271 3,676,670 100.0 n.s. = not significant
Parte C Income statement

184
Analysis is presented below relating to the technical insurance items and the insurance operating expenses net of the eliminations between sectors. Table 54 - Insurance business
2012 2011
(€ thousands) Gross balance Reinsurance
amount Net balance Gross balance Reinsurance
amount Net balance
Non-life business NET PREMIUMS 1,624,343 -249,948 1,374,395 1,615,886 -253,832 1,362,054
a. Premiums written 1,700,547 -263,115 1,437,432 1,641,222 -257,408 1,383,814 b. Change in provision for unearned premiums -76,204 13,167 -63,037 -25,336 3,576 -21,760 NET CHARGES RELATING TO CLAIMS -1,130,778 184,676 -946,102 -1,160,070 169,389 -990,681
a. Amounts settled -1,167,989 162,663 -1,005,326 -1,202,840 148,984 -1,053,856 b. Change in provision for outstanding claims 18,943 22,653 41,596 21,245 20,258 41,503
c. Change in recoveries 18,247 -28 18,219 21,683 -470 21,213
d. Change in other technical provisions 21 -612 -591 -158 617 459
Life business NET PREMIUMS 1,838,523 -51,042 1,787,481 2,137,046 -59,695 2,077,351 NET CHARGES RELATING TO CLAIMS -2,303,232 30,495 -2,272,737 -2,242,764 39,204 -2,203,560
a. Amounts settled -2,801,099 27,255 -2,773,844 -2,694,187 21,712 -2,672,475 b. Change in provision for outstanding claims -21,331 -2,420 -23,751 39,061 3,438 42,499
c. Change in mathematical provisions -150,353 6,001 -144,352 -141,870 14,018 -127,852 d. Change in technical provisions where the investment risk is borne by the policyholders and deriving from the management of pension funds 723,763 0 723,763 489,476 0 489,476
e. Change in other technical provisions -54,212 -341 -54,553 64,756 36 64,792
Table 55 - Analysis of insurance operating expenses
Non-life business Life business
(€ thousands) 2012 2011 2012 2011
Commission and other acquisition costs, net of commission and profit-sharing received from re-insurers -247,123 -236,031 -57,663 -69,838
Acquisition commission -254,291 -242,046 -52,779 -62,317
Other acquisition costs -47,763 -51,219 -19,320 -24,792
Change in deferred acquisition costs 0 0 2,353 1,271
Collection commission -6,043 -9,745 -8,379 -10,541
Commission and profit-sharing received from re-insurers 60,974 66,979 20,462 26,541
Operating expenses relating to investments -3,211 -3,523 -7,037 -6,444
Other administrative expenses -90,831 -92,473 -45,543 -43,163
Total -341,165 -332,027 -110,243 -119,445

185
Notes to the accounts
In addition to the matters observed in the above table, operating expenses relating to the investments, recorded during the year, comprise general expenses and expenses for employees relating to the management of investment property and equity investments. Commission and other acquisition costs, net of commission and profit-sharing received from re-insurers, include acquisition costs relating to insurance contracts and investment contracts with discretionary participation features. FINANCIAL OPERATIONS The table which follows discloses the income and charges deriving from financial operations as presented in the income statement for the year. Table 56 - Financial operations
Changes
(€ thousands) 2012 2011 Abs. amount %
Net income deriving from financial assets at fair value through profit or loss 227,864 26,935 200,929 n.s.
Income deriving from investments in subsidiaries, associates and joint ventures 0 107 -107 -100.0
Charges deriving from investments in subsidiaries, associates and joint ventures -3,662 -15,800 12,138 76.8 Result deriving from equity investment in subsidiaries, associates and joint ventures -3,662 -15,693 12,031 76.7
Income deriving from other financial instruments and investment property 812,851 550,119 262,732 47.8
Charges deriving from other financial instruments and investment property -244,980 -269,126 24,146 9.0
Result deriving from other financial instruments and investment property 567,871 280,993 286,878 n.s.
n.s. = not significant

186
Table 57 - Financial and investment income and charges (ISVAP Regulation No. 7 dated July 13th, 2007)
(€ thousands) Interest Other
income Other
charges Realised
gains Realised
losses
Total realised
income and charges
Result of investments 545,596 83,125 -21,680 355,497 -208,120 754,418
a. Deriving from investment property 0 12,032 0 0 0 12,032 b. Deriving from equity investment in subsidiaries, associates and joint ventures 0 0 -3,302 0 0 -3,302
c. Deriving from held to maturity investments 14,396 128 0 0 -9 14,515
d. Deriving from loans and receivables 73,419 6,831 -1,442 38,571 -22,306 95,073
e. Deriving from available for sale financial assets 351,328 35,329 -5,204 241,759 -168,386 454,826
f. Deriving from financial assets held for trading 10,421 913 -2,983 11,236 -3,199 16,388 g. Deriving from financial assets at fair value through profit or loss 96,032 27,892 -8,749 63,931 -14,220 164,886
Result of sundry receivables 912 0 0 0 0 912
Result of cash and cash equivalents 1,762 0 0 0 0 1,762
Result of financial liabilities -6,043 0 0 0 0 -6,043
a Deriving from financial liabilities held for trading 0 0 0 0 0 0 b Deriving from financial liabilities at fair value through profit or loss 0 0 0 0 0 0
c Deriving from other financial liabilities -6,043 0 0 0 0 -6,043
Result of payables -3,045 0 0 0 0 -3,045
Total 539,182 83,125 -21,680 355,497 -208,120 748,004

187
Notes to the accounts
Valuation capital gains Write-back
Valuation capital losses Write-down
Total unrealised
income and charges
Total income and charges
2012
Total income and charges
2011
147,114 7,257 -35,466 -27,442 91,463 845,881 279,353
0 0 -2,222 0 -2,222 9,810 9,356
0 0 0 -360 -360 -3,662 -15,693
0 0 0 0 0 14,515 11,221
0 0 0 0 0 95,073 67,358
153 7,257 0 -27,082 -19,672 435,154 191,119
8,055 0 -14,506 0 -6,451 9,937 6,079
138,906 0 -18,738 0 120,168 285,054 9,913
0 0 0 0 0 912 1,032
0 0 0 0 0 1,762 3,910
23,713 0 -71,107 0 -47,394 -53,437 7,940
3,886 0 0 0 3,886 3,886 4,013
0 0 -71,013 0 -71,013 -71,013 6,930
19,827 0 -94 0 19,733 13,690 -3,003
0 0 0 0 0 -3,045 0
170,827 7,257 -106,573 -27,442 44,069 792,073 292,235

188
Commission income Commission income mainly comprises the commission relating to investment contracts issued by the Group's insurance companies (DIR); specifically, the item includes the explicit and implicit premium loading encumbering the investment contracts issued. Commission expense The item comprises the acquisition costs associated with investments policies (DAC) recorded during the year. OTHER REVENUES AND OTHER COSTS Other revenues The item amounts to € 77.955 million, of which € 26.382 million in other net technical income associated with insurance contracts. Other revenues amount to € 51.573 million of which € 8.857 million relating to recoveries from provisions for risks and charges and € 6.11 million relating to compensation of damage in favour of Risparmio & Previdenza further to the conclusion of the arbitration processing vis-à-vis Banca Popolare di Bari as described in the management report. Other costs The item, which amounts to € 196.919 million, comprises the other net technical charges associated with insurance contracts for € 74.565 million and other charges for € 122.354 million, of which amortisation on intangible assets for € 35.375 million, impairment on intangible assets for € 25.022 million and provisions for risks and charges totalling € 12.643 million. INCOME TAXES FOR THE YEAR Table 58 – Income taxes for the year
Changes
(€ thousands) 2012 2011 Abs. amount %
Current taxes -134,338 -23,024 -111,314 n.s.
Change in prepaid taxes 2,132 79,486 -77,354 -97.3
Change in deferred taxes 57,410 -35,658 93,068 n.s.
Balance of deferred taxes 59,542 43,828 15,714 35.9
TOTAL -74,796 20,804 -95,600 n.s.
n.s. = not significant
This item records current taxes (IRES – company earnings tax and IRAP – regional business tax), deferred taxes of the individual Group companies recorded in observance of Accounting Standard No. 25 on i ncome taxes, and deferred taxes which have arisen from the temporary misalignment between the beginning of the economic period as laid down by the international accounting standards and tax legislation. The reconciliation between the effective average tax rate and the applicable tax rate is illustrated below.

189
Notes to the accounts
Table 59 – Reconciliation of the tax rate – analysis
(%) 2012 2011 Ordinary rate applicable 34.32% 34.32% Effect of increases/decreases 12.77% -133.45% Tax rate on pre-tax profit 47.09% -99.13%
The effect of the change with respect to the ordinary rate applicable is mainly attributable to the non-deductibility of the writedowns of the intangible assets and the impairment of certain available for sale securities in the portfolio. During the previous year, the tax rate had benefited from the freeing up of goodwill carried out in pursuance of Italian Decree Law No. 185/2008. STATEMENT OF COMPREHENSIVE INCOME The statement of comprehensive income for 2012 amounted to € 407.417 million, of which € 294.947 million pertaining to the Group. The analysis of the statement of other comprehensive income pursuant to ISVAP Regulation No. 7 dated July 13th, 2007, is presented below. The balances are stated net of taxation which is in any event indicated in the specific column. Table 60 - Analysis of the statement of other comprehensive income – net amounts (ISVAP Regulation No. 7 dated July 13th, 2007)
Charges Adjustments from reclassification to income statement
Other changes Total changes Taxation Balance
(€ thousands) 2012 2011 2012 2011 2012 2011 2012 2011 2012 2011 2012 2011
TOTAL OTHER COMPONENTS OF STATEMENT OF COMPREHENSIVE INCOME 187,987 -239,757 135,387 89,467 0 0 323,374 -150,290 168,974 -78,532 84,212 -239,162 Reserve for net exchange differences 0 0 0 0 0 0 0 0 0 0 0 0 Gains or losses on available for sale financial assets 187,581 -237,040 135,387 89,467 0 0 322,968 -147,573 168,762 -77,112 86,348 -236,620 Profits or losses on cash flow hedging instruments -2,729 0 0 0 0 0 -2,729 0 -1,426 0 -2,729 0 Profits or losses on instruments hedging a net investment in foreign operations 0 0 0 0 0 0 0 0 0 0 0 0 Provisions deriving from changes in the shareholders' equity of investee companies 3,135 -2,717 0 0 0 0 3,135 -2,717 1,638 -1,420 593 -2,542 Intangible assets revaluation reserve 0 0 0 0 0 0 0 Tangible assets revaluation reserve 0 0 0 0 0 0 0 0 0 0 0 0 Income and charges relating to non current assets or disposal group held for sale 0 0 0 0 0 0 0 0 0 0 0 0 Actuarial gains and losses and adjustments related to defined-benefit plans 0 0 0 0 0 0 0 0 0 0 0 0 Other items 0 0 0 0 0 0 0 0 0 0 0 0

190
Pursuant to ISVAP Regulation No. 7 da ted July 13th, 2007, the income statement by sector of activities, the analysis of the technical insurance items and the analysis of the insurance operating expenses, gross of elimination within sectors, are presented as follows. Table 61 – Income statement by sector of activities (ISVAP Regulation No. 7 dated July 13th, 2007)
Non-life Business Life Business Other Eliminations between sectors Total
(€ thousands) 2012 2011 2012 2011 2012 2011 2012 2011 2012 2011
1.1 Net premiums 1,374,395 1,362,054 1,787,481 2,077,351 0 0 0 0 3,161,876 3,439,405
1.1.1 Gross premiums written 1,636,785 1,749,056 1,838,523 2,137,047 0 0 -12,442 -133,170 3,462,866 3,752,933
1.1.2 Premiums transferred under reinsurance -262,390 -387,002 -51,042 -59,696 0 0 12,442 133,170 -300,990 -313,528
1.2 Commission income 0 0 2,933 4,551 0 0 0 0 2,933 4,551
1.3 Income and charges deriving from financial instruments at fair value through profit or loss
-8,065 1,551 235,929 25,384 0 0 0 0 227,864 26,935
1.4 Income deriving from investments in subsidiaries, associates and joint ventures
8,397 687 3,134 2,319 0 0 -11,531 -2,899 0 107
1.5 Income deriving from other financial instruments and investment property
159,457 94,381 646,827 451,450 12,484 11,494 -5,917 -7,206 812,851 550,119
1.6 Other revenues 152,184 161,876 61,117 58,649 2,923 1,593 -138,269 -126,435 77,955 95,683
1 TOTAL REVENUES AND INCOME 1,686,368 1,620,549 2,737,421 2,619,704 15,407 13,087 -155,717 -136,540 4,283,479 4,116,800
2.1 Net charges relating to claims -989,014 -1,035,126 -2,268,328 -2,208,971 0 0 38,503 49,856 -3,218,839 -3,194,241
2.1.2 Amounts paid and change in technical provisions -1,179,872 -1,302,100 -2,298,823 -2,248,176 0 0 44,685 147,442 -3,434,010 -3,402,834
2.1.3 Reinsurance portion 190,858 266,974 30,495 39,205 0 0 -6,182 -97,586 215,171 208,593
2.2 Commission expense -16 -57 -2,944 -3,362 0 0 0 0 -2,960 -3,419
2.3 Charges deriving from investments in subsidiaries, associates and joint ventures
-15,167 -14,219 -6,531 -16,057 -1,830 0 19,866 14,476 -3,662 -15,800
2.4 Charges deriving from other financial instruments and investment property
-63,213 -71,618 -175,491 -193,384 -5,565 -4,899 -711 775 -244,980 -269,126
2.5 Operating expenses -391,347 -378,835 -134,447 -137,955 -6,490 -5,023 75,004 65,923 -457,280 -455,890
2.6 Other costs -134,229 -106,687 -55,480 -63,063 -902 -1,070 -6,308 13,481 -196,919 -157,339
2 TOTAL COSTS AND CHARGES -1,592,986 -1,606,542 -2,643,221 -2,622,792 -14,787 -10,992 126,354 144,511 -4,124,640 -4,095,815
PRE-TAX PROFIT FOR THE PERIOD 93,382 14,007 94,200 -3,088 620 2,095 -29,363 7,971 158,839 20,985

191
Notes to the accounts
Table 62 – Analysis of technical insurance items (ISVAP Regulation No. 7 dated July 13th, 2007)
2012 2011
(€ thousands) Gross balance Reinsurance
amount Net balance Gross balance Reinsurance
amount Net balance
Non-life business NET PREMIUMS 1,636,785 -262,390 1,374,395 1,749,056 -387,002 1,362,054
a Premiums written 1,714,787 -277,355 1,437,432 1,783,685 -399,871 1,383,814 b Change in provision for unearned premiums -78,002 14,965 -63,037 -34,629 12,869 -21,760 NET CHARGES RELATING TO CLAIMS -1,179,872 190,858 -989,014 -1,302,100 266,974 -1,035,126
a Amounts settled -1,214,730 166,492 -1,048,238 -1,262,653 165,237 -1,097,416 b Change in provision for outstanding claims 16,590 25,006 41,596 -60,089 101,591 41,502
c Change in recoveries 18,247 -28 18,219 21,683 -470 21,213
d Change in other technical provisions 21 -612 -591 -1,041 616 -425
Life business NET PREMIUMS 1,838,523 -51,042 1,787,481 2,137,047 -59,696 2,077,351 NET CHARGES RELATING TO CLAIMS -2,298,823 30,495 -2,268,328 -2,248,176 39,205 -2,208,971
a Amounts settled -2,801,899 27,255 -2,774,644 -2,694,390 21,712 -2,672,678 b Change in provision for outstanding claims -21,331 -2,420 -23,751 39,061 3,438 42,499
c Change in mathematical provisions -145,144 6,001 -139,143 -147,079 14,019 -133,060 d Change in technical provisions where the investment risk is borne by the policyholders and deriving from the management of pension funds 723,763 0 723,763 489,476 0 489,476
e Change in other technical provisions -54,212 -341 -54,553 64,756 36 64,792 Table 63 – Analysis of insurance operating expenses (ISVAP Regulation No. 7 dated July 13th, 2007)
Non-life business Life business
(€ thousands) 2012 2011 2012 2011
Gross commission and other acquisition costs -323,076 -343,675 -84,236 -97,898
a Acquisition commission -258,668 -273,783 -56,511 -62,554
b Other acquisition costs -58,349 -60,148 -21,571 -26,074
c Change in deferred acquisition costs 0 0 2,353 1,271
d Collection commission -6,059 -9,744 -8,507 -10,541
Commission and profit-sharing received from re-insurers 65,340 99,600 20,462 26,541
Operating expenses relating to investments -4,635 -4,113 -10,643 -8,862
Other administrative expenses -128,976 -130,647 -60,030 -57,736
Total -391,347 -378,835 -134,447 -137,955


Notes to the accounts Part D – Other information


195
Notes to the accounts
Group headcount
Group employees calculated as per FTE, amounted to 1,406, as against 1,410 in the previous year.
Emoluments of Directors and Statutory Auditors
CONSOB resolution No. 18049, pub lished in 2011, implemented the provisions concerning remuneration contained in Article 123 ter of the Consolidated Finance Law and envisages the drawing up a nd subsequent approval by the 2013 s hareholders’ meeting of the report on remuneration for the companies, to be made public in accordance with the deadlines as per the formalities envisaged by current legislation, which in Section II includes the analytical indication of the fees paid during the year for any reason by the Parent Company and the subsidiary and associated companies.
Atypical and unusual transactions and non-recurring significant events and operations
With reference to non-recurrent significant events and transactions and positions or transactions deriving from atypical and/or unusual operations, reference should be made to the section “Other information” in the Management Report.
Information on risks
With regard to all the disclosure required by IFRS 7 concerning outstanding risks, reference should be made to the section “Risk management” in the Management Report.
Transactions with related parties
As already disclosed in the management report, pursuant to CONSOB Regulation No. 17221 dated March 12th, 2010, and subsequent amendments and additions, as from January 1st, 2011 the “Procedure for the handling of related party transactions” approved on N ovember 29th, 2010, applies to the situations envisaged by the regulations. It is hereby revealed that the Cattolica Group has entered into several extraordinary transactions with related parties, not atypical and/or unusual, aimed at rationalising and reorganising the corporate structure of the same, or growth by external lines. These transactions, some of which saw the direct involvement of the Parent Company, are illustrated in another section of the management report. On December 14th, the Parent Company and Banca Popolare di Vicenza s.c.p.a. renewed the strategic partnership agreement, extending the expiry to 2022. The transaction was resolved subject to consulting an independent financial advisor with regard to the compliance of the contractual set-up proposed with market conditions as well as the favourable opinion of the Related Parties Committee. With regard to transactions with related parties, considering the resolution procedures described in the Parent Company’s Report on Corporate Governance on the website www.cattolica.it, we inform that, for reporting purposes, a procedure has been set up for detecting the outstanding transactions, via the prior acquisition of the necessary information for the identification of the related parties in relation to international accounting standard IAS 24 and ISVAP Regulation No. 25 dated May 27th, 2008, and subsequent extrapolation of the transactions relating to the same. The table shows the statement of financial position and income statement positions deriving from the afore-mentioned related party transactions; the balance sheet values presented refer to
Part D Other information

196
December 31st, 2012. The values presented represent the transactions at December 31st, 2012 between Cattolica Group companies and related parties: Cassa di Risparmio di San Miniato Group and Banca Popolare di Vicenza Group. In particular, the following are indicated:
• the class C and D investments (shares and bonds) and current accounts which are subscribed under market conditions. The related financial income is also indicated (including the income of class D zero coupons);
• other receivables, payables, costs and revenues linked to the ordinary insurance business (mainly payables for commission);
• commission acknowledged to the network which is under market conditions. The column “Other related parties” includes the remuneration due to the directors and statutory auditors as well as the General Manager and the executive with strategic responsibilities of the Parent Company in the Group companies.
Table 64 - Transactions with related parties
Equity transactions and relationships Associated companies and their
subsidiary companies
Banca Pop. VI and its subsidiary companies
Other related parties Total
(€ thousands) Dec. 31st, 2012 Assets Shares 0 18,346 0 18,346 Loans granted 0 0 0 0 Bonds 1,399 605,725 0 607,124 Other receivables 0 1,775 0 1,775 Current account relationships 17,168 134,224 0 151,392 Total 18,567 760,070 0 778,637 Liabilities Loans received 0 0 0 0 Other payables 45 10,371 528 10,944 Total 45 10,371 528 10,944
Economic transactions and relationships Associated companies and their
subsidiary companies
Banca Pop. VI and its subsidiary companies
Other related parties Total
(€ thousands) Dec. 31st, 2012
Revenues and income Premiums 0 0 0 0 Financial income 15 45,250 0 45,265 Other revenues 63 0 0 63 Total 78 45,250 0 45,328 Costs and charges Claims 0 0 0 0 Commission 2,109 27,828 0 29,937 Other costs 0 279 7,338 7,617 Total 2,109 28,107 7,338 37,554

Certification of the consolidated financial statements pursuant to Article 81 ter of Consob Regulation No. 11971 dated May 14th, 1999 and subsequent amendments and additions
1. The undersigned, Giovan Battista Mazzucchelli, in his capacity as Managing Director, and Giuseppe Milone, in his capacity as Executive appointed to draw up the corporate accounting documents of Cattolica Assicurazioni Soc. Coop., hereby certify, also taking into account the matters envisaged by Article 154 bis, paragraphs 3 and 4 of Italian Legislative Decree No. 58 dated February 24th, 1998:
- the adequacy in relation to the characteristics of the business and
- the actual application,
of the administrative and accounting procedures for the formation of the consolidated financial statements during 2012.
2. The assessment of the adequacy of the administrative and accounting procedures for the formation of the consolidated financial statements as of December 31st, 2012, was based on a process established by Cattolica Assicurazioni Soc. Coop. on a consistent basis with the Internal Control – Integrated Framework model issued by the Committee of Sponsoring Organizations of the Treadway Commission which represents the reference framework generally accepted at international level.
3. It is also hereby certified that:
3.1 the consolidated financial statements as of December 31st, 2012:
a) have been drawn up in compliance with the international accounting standards recognized by the European Community in pursuance of EC Regulation No. 1606/2002 of the European Parliament and the Council dated July 19th, 2002, as well as the provisions pursuant to Italian Legislative Decree No. 38 dated February 28th, 2005, the Italian Civil Code, Italian Legislative Decree No. 209 dated September 7th, 2005 and the ISVAP provisions, regulations and circulars applicable;
b) are consistent with the results of the accounting ledgers and records;
c) are suitable for providing a true and fair view of the balance sheet, income statement and financial position of the issuer and all the companies included in the scope of consolidation;
3.2 the management report includes a reliable analysis of the performance and the management result, as well as of the position of the issuer and all the companies included in the scope of consolidation, together with the description of the main risks and uncertainties which they are exposed to.
Verona, Italy, March 13th, 2013
Signed: the Managing Director Signed: the Executive appointed to draw up
the corporate accounting documents
Giovan Battista Mazzucchelli Giuseppe Milone