Embed Size (px)
Citation preview

Consolidated financial statementsat 31 december 2019Azimut Holding S.p.A.


Consolidated financial statementsat 31 december 2019Azimut Holding S.p.A.

4 G r u p p o A z i m u t

5
Contents
Company bodies 7 Azimut Group's structure 8 Main indicators 10 Management report 13Baseline scenario 15Significant events of the year 19Azimut Group's financial performance for 2018 25 Key balance sheet figures 28Information about main Azimut Group companies 33Main risks and uncertainties 37Related-party transactions 41Organisational structure and corporate governance 41Human resources 42Research and development 42Significant events after the reporting date 42Business outlook 43Consolidated non-financial statement 43 Consolidated financial statements 81Consolidated balance sheet 83Consolidated income statement 85Consolidated statement of comprehensive income 87Consolidated statement of changes in shareholders' equity 88Consolidated cash flow statement 92 Notes to the consolidated financial statements 95Part A - Accounting policies 96Part B - Notes to the consolidated balance sheet 141Part C - Notes to the consolidated income statement 177Part D - Other information 189 Certification of the consolidated financial statements 201

6 G r u p p o A z i m u t

7
Company bodies
Board of DirectorsPietro Giuliani Chairman Paolo Martini Chief Executive Officer and Managing DirectorGabriele Blei Chief Executive Officer Massimo Guiati Chief Executive OfficerGiorgio Medda Chief Executive OfficerAlessandro Zambotti Chief Executive OfficerMirella Pardi (*) DirectorAmbra Zironi (*) DirectorAnna Maria Bortolotti DirectorNicola Colavito DirectorAntonio Andrea Monari Director Raffaella Pagani Director
Board of Statutory AuditorsVittorio Rocchetti Chairman Costanza Bonelli Standing Auditor Daniele Carlo Trivi Standing Auditor Maria Catalano Alternate Auditor Federico Strada Alternate Auditor
Independent AuditorsPricewaterhouseCoopers S.p.A.
Manager in Charge of Financial ReportingAlessandro Zambotti
(*) in office for one year (2019)

8 G r u p p o A z i m u t
Azimut group's structure
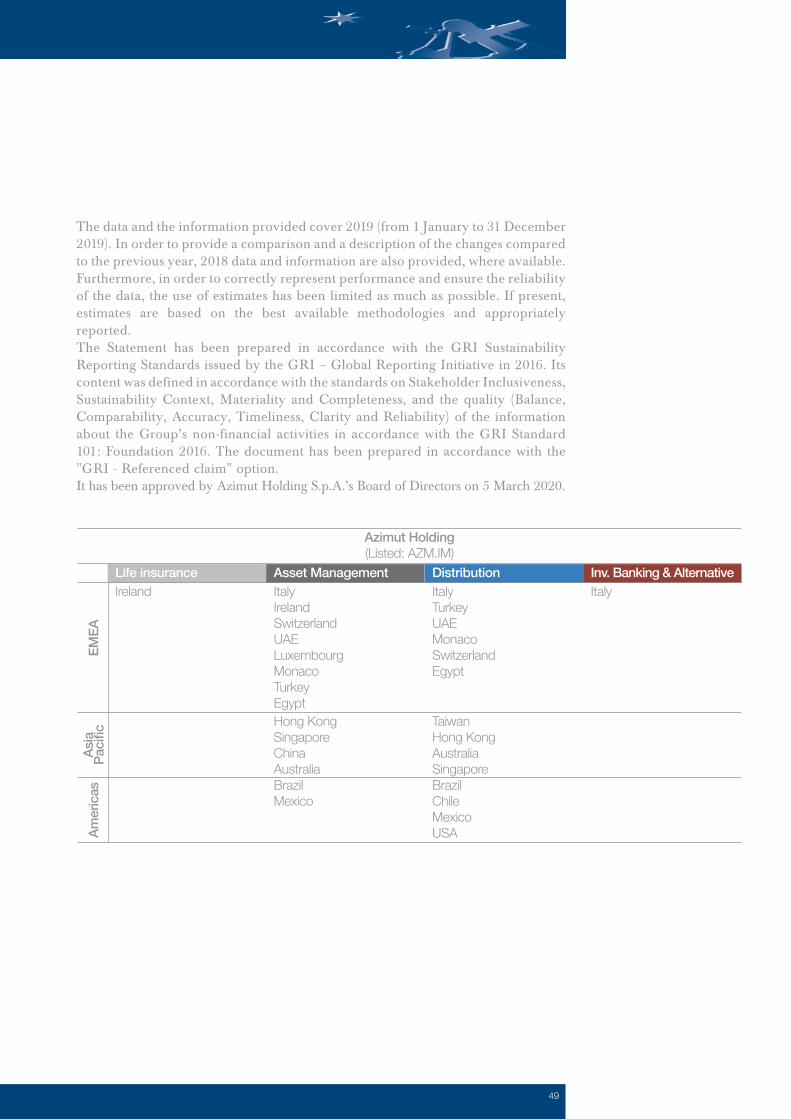
The Azimut Group operates globally in 18 countries and is comprised of the parent company, Azimut Holding S.p.A., and 89 subsidiaries.
AzimutHolding S.p.A.
(Listed:AZM.IM)
AN Zhong(AZ) IM(2011)
(100%)
Hong Kong
AZ InternationalHoldings(6)
(2010)
(100%)
Luxembourg
AZ Fund(4)
(1999)
(100%)
Luxembourg
Azimut Enterprises(2014)
(100%)
Italy
Azimut Libera Impresa Sgr(2014)
(100%)
Italy
AZ Swiss(5)
(2012)
(51%)
Switzerland
AZ Sestante(2015)
(100%)
Australia
AZ IM HK(2011)
(100%)
Hong Kong
AZ IM(2011)
(100%)
China
Azimut Capital Management(2004)
(100%)
Italy
Azimut Portföy(2011)
(100%)
Turkey
AZ Sinopro FP(2013)
(51%)
Taiwan
AZ Mèxico HoldingsSa de CV(2014)
(96%)
Mexico
CGM Azimut Monaco(3)
(2011)
(51%)
Monaco
AZ Sinopro IP(2)
(2013)
(100%)
Taiwan
AZ Andes Spa(2015)
(100%)
Chile
Màs Fondos S.a.(2014)
(100%)
Mexico
AZ NGA(2014)
(59%)
Australia
AZ Brasil Holdings(2013)
(100%)
Brazil
AZ US Holdings(2015)
(100%)
United States
Azimut DIFC(2017)
(100%)
United Arab Emirates
AACP(2019)
(96.5%)
United States
AZ Brasil Holdings(2013)
(100%)
Brasil
AZ Quest(2015)
(65%)
Brazil
Eskatos CM(2011)
(100%)
Luxembourg
AZ IM Singapore(2013)
(100%)
Singapore
Sigma Funda Mgmt(2016)
(67%)
Australia
Katarsis CA(2011)
(100%)
Switzerland
Azimut FinancialInsurance(2015)
(100%)
Italy
Azimut Egypt AM(2019)
(100%)
Egypt
Azimut Brasil WM Holdings(1)
(2019)
(96%)
Brasil
AZ Apice LLC(2016)
(75%)
United States
AZ Life Dac(2003)
(100%)
Ireland
Asset management
Distribution
Life Insurance
Alternatives
Source: company figures updated to 31 December 2019Note (1): controls the distribution companies M&O Consultoria, FuturaInvest and Azimut Brasil Wealth Management.Note (2): controls AZ Sinopro Insurance Planning.Note (3): controls 100% of CGM Italia S.p.A.. Note (4): 30% held by Azimut Capital Management SGR S.p.A. and 19% by Azimut Financial Insurance S.p.A., both wholly owned by Azimut Holding.Note (5): controls SDB Financial Solutions.Note (6): main subsidiaries with a majority investment.
Azimut ME(2019)
(100%)
United Arab Emirates

9
1989200459.118 countries4.61,7881,049,774370,011101121.28
Year of incorporationYear of flotation
Total assetsGeographical coverage
Inflows for 2019Financial advisors
Revenues for 2019Net profit for 2019
EmployeesShare price

10 G r u p p o A z i m u t
Total income: of which fixed management feesEBITNet profit for the year
811
607278215
2017748
629193122
20181,050
753464369
2019708
485280247
2015552
39419392
2014472
322182156
2013706
519205173
2016
Financial advisorsCustomers
Assets in fundmanagement(billions of euro)Net inflows(billions of euro)Customers' netweighted averageperformance
1,477163
thousand
21.4
3.1
4.20%
1,524173
thousand
26.7
4.8
4.80%
1,576195
thousand
31.2
4.5
1.60%
1,637198
thousand
35.8
3.5
3.60%
1,638208
thousand
40.2
4.2
2.20%
1,747218
thousand
39.8
2.3
-6.20%
1,788 218
thousand
46
2.5
8.5%
Main indicators
Financial indicators (in millions of euros)
Operating indicators

11
Mutual fundsDiscretionary portfolio managementAZ Life insuranceAdvisory
22%11% 4% 63%
63%22%11%4%
Breakdown of assetsunder management at 31 December 2019
Breakdown of assetsunder managementat 31 December 2019
Mutual funds
Discretionary portfolios
AZ Life Insurance
Advisory

12 G r u p p o A z i m u t
13
Management Report of theConsolidated financial statementsas at 31 December 2019

14 G r u p p o A z i m u t
15
Background scenarioGlobal growth in 2019 remained subdued. In the first half of 2019, the worldwide growth of real GDP (excluding the euro area) weakened. However, the most recent data point to a stabilisation in the second half of the year. The weak growth trend reflects the slowdown in both manufacturing and investment, worsened by increasing uncertainties in the political and economic policy framework, in addition to the exacerbation of trade tensions and the developments linked to Brexit. However, recent data indicate a stabilisation of operations worldwide, though at low levels. Real GDP continued to expand in the United States and Japan, while the growth of real operations picked up in the United Kingdom. In the third quarter of the year, in the United States, the solidity of the labour market and consumer spending, and favourable financial conditions continued to drive growth, while, in Japan, expansion was driven by robust domestic demand. In the United Kingdom, growth recovered thanks to a surprising expansion in net exports and solid private consumption trends. In China, the figures for the third quarter confirmed the gradual slowdown in operations, driven by investments, while growth stabilised in other emerging economies.International trade weakened in 2019 and is expected to grow at a more moderate pace than global operations in the medium term. Global inflationary pressures remained low, while the risks to international economic activities, though less marked overall, are still on a downward curve. However, the evaluations by corporate purchasing managers (Purchasing Managers’ Index, SME) suggest that, in the fourth quarter, the cycle is still unfavourable in the manufacturing sector.In December, the United States and China reached a first trade agreement (phase-one deal), which is preliminary to a wider discussion on economic relations between the two countries. The agreement averted the US tariff increases initially planned for mid-December and halved those introduced in September. The Chinese government has committed to increasing the imports of agricultural and energy goods from the United States and has offered guarantees on intellectual property protection and exchange rate policy. The agreement reduced the economic tensions between these two countries, which had begun in the first few months of 2018. However, overall, the current duties remain much higher than two years ago. At the end of 2019, the US Congress approved the new trade agreement between the United States, Mexico and Canada (United States-Mexico-Canada Agreement, USMCA), which replaces the 1994 agreement (North American Free Trade Agreement, NAFTA), tightening the rules on the origin of products and the production standards in the automotive sector.Conversely, the decision on duties on imports of cars and components from the European Union (EU) has been postponed until a later date. In the main advanced economies, consumer prices are growing at around 2% in the United States and even less in other areas. In the United States, long-term inflation expectations based on financial market returns remained broadly stable at around 1.8%.
Management reportof the Azimut Group
Financial markets andthe global economy

16 G r u p p o A z i m u t
Management reportof the Azimut Group
According to OECD’s November forecasts, the global economy would grow by 2.9% this year, as in 2019, the lowest value since the global financial crisis of 2008-09. The weakness of world trade and manufacturing production would continue to affect the economy. According to our estimates, international trade increased by just 0.6% in 2019 and will accelerate modestly in 2020.
The rising expectations for a trade agreement between China and the United States and the accommodative stance of the major central banks led to a shift in investors’ interest from the bond to the equity segment, pushing equity prices up. Long-term yields rose slightly, reflecting less pessimistic assessments of growth prospects. Since mid-October, long-term rates have risen in all major advanced economies, following a drop in fears about the outcome of trade negotiations between the United States and China and about Brexit. The yield on the German ten-year government bonds rose by 24 basis points to -0.20%. Spreads with German bonds fell by 33 basis points in Greece and 22 basis points in Ireland, while they remained substantially unchanged in Belgium, France, Portugal and Spain. In Italy, the spread widened by 14 basis points. The yield on Italian government bonds is almost equal to that on the Greek bonds and about 90 basis points higher than that on Spanish and Portuguese bonds.Equity prices in the main advanced and emerging countries rose. Indeed, since October, they have benefited from greater optimism about trade negotiations between the United States and China. The implied volatility of the stock markets fell.Since mid-October, the Euro exchange rate has remained substantially unchanged against the Dollar and in nominal effective terms. On the derivatives markets, short positions in Euro by non-traders prevail, pointing to an expected depreciation of the single currency. Risks include an appreciation of the Euro against the Dollar, as indicated by the one-month risk reversal.
EuropeIn the euro area, economic activities are held back by the weakness of the manufacturing sector, which, according to available indicators, would continue into the latter part of the year. According to the Eurosystem projections made in December, inflation would remain well below 2% over the next three years. The Governing Council of the ECB confirmed its accommodative stance. The economy was driven by domestic demand and, in particular, by consumption, which strengthened thanks to good employment performance. Given the weakness of world trade, the contribution of foreign trade was slightly negative. The product continued to expand in Spain, France and – to a lesser extent – Italy. It increased again in Germany, at a very low rate, though slightly above expectations.The weakness affected above all the industrial sector, where operations contracted again in the summer, with a particularly marked decline in Germany.
International financialmarkets

17
Conversely, added value in the services sector grew both in the area and the three largest economies. There is still a risk that, if prolonged, the weakness of the industrial sector will affect the services sector, even more markedly: the correlation between the variation in added value in the manufacturing and services sectors, which fell to low values in recent years, rose slightly.Domestic demand and, in particular, consumption, strengthened thanks to good employment performance. Given the weakness of world trade, the contribution of foreign trade was slightly negative. The product continued to expand in Spain, France and – to a lesser extent – Italy. It increased again in Germany, at a very low rate, though slightly above expectations.
Emerging marketsIn China, the economy slowed in the summer months. However, the most recent indicators point to a stabilisation. Growth declined more sharply in India and remained modest in Russia and Brazil. In the third quarter of 2019, world trade increased (by 2.6% year-on-year) and imports recovered in both advanced countries and emerging economies. However, the short-term outlook for international trade is unfavourable: global SME indices on foreign orders remain below the level indicating expansion.
The asset management sector closed December 2019 with net inflows of 10.26 billion euro and hit a new absolute record for assets under management, reaching 2,288 billion euro.Assets invested in collective portfolio management amount to 1,125 billion euro (49% of the total), while those in portfolio management amount to 1,162 billion euro (51% of the total).Inflows are positive for both portfolio management (6.4 billion) and collective portfolio management (3.8 billion, of which 3.2 billion from open-ended funds).Inflows of long-term funds (+3.4 billion) are driven by bonds (+2.3 billion), followed by equities (+560 million) and balanced funds (+416 million).
2019 shows total inflows of 34.9 billion euro. Net inflows, up by 16.4% on the previous year, account for the second best results ever achieved by the networks. 58% of net inflows was invested in assets under management products for a total of 20.3 billion euro, up by 51.9% on 2018 (13.4 billion euro). Total assets under custody products are positive at 14.7 billion euro, down by 12.0% on 2018 (16.7 billion euro).With respect to assets under management, 58.6% of net investments relates to the insurance sector, with inflows amounting to 11.9 billion euro (+40.5% on 2018). Net premiums paid on traditional life insurance policies almost doubled compared to 2018 (+85.0%) and amount to 4.9 billion euro, while net investments in financial insurance products amount to 6.9 billion euro (+19.9%), with 3.4 billion euro placed on unit-linked policies (+30.9%) and 3.5 billion euro on multi-line policies (10.8%).
Italy's assets under management market
Italy's financial productand service distribution market

18 G r u p p o A z i m u t
Significant events of the year Capitalisation transactions carried out by Azimut Holding S.p.A.In 2019, following the Board of Directors' resolutions of 7 March 2019 and 12 December 2019, Azimut Holding S.p.A. made a capital injection of 46.4 million euro, in tranches, to increase the share capital of the subsidiary AZ International Holdings SA and finance the Group's international development. Furthermore, during the year, it made a capital injection of 16.7 million euro to increase the share capital of Azimut Enterprises S.r.l..
Loan granted by Banco BPM to Azimut Holding S.p.A.On 22 February 2019, the Parent Company signed an unsecured loan agreement with Banco BPM worth 200 million euro at the best market terms currently available. The loan (part amortising and part bullet) expires on 31 December 2021. It provides the Group with increased financial flexibility in order to seize any growth and investment opportunity, including buyback programmes, without using the available cash in potentially non-optimal situations.On 31 December 2019, the Parent Company repaid the first instalment (Line A) of the loan granted by Banco BPM S.p.A. for a total amount of 20 million euro and repaid 120 million euro in advance.
Management reportof the Azimut Group
Net investments in UCI units amount to 4.8 billion euro (+13.7%) and account for 23.5% of this segment. The resources are focused on open collective portfolio management domiciled abroad, with net volumes totalling 4.4 billion euro (+41.1%). Closed-end securities funds investing in private markets also performed positively and increased, with net resources of 713 million euro (+59.9%), while Italian open-ended funds are negative for 305 million euro. Net inflows from discretionary portfolios amount to 2.7 billion euro (-136 million in 2018): net investments concentrated exclusively on discretionary funds, with net inflows of 2.8 billion euro, while net divestments of securities management amount to 125 million euro. In 2019, the net resources for open-ended UCI generated by the network’s activities amount to 14.2 billion euro, enabling the entire fund management system to end with a positive sign (3.8 billion euro). The contribution of the networks to the closed-end securities funds investing in private markets also played a fundamental role: inflows account for 47.5% of total net subscriptions on private markets funds (1.5 billion). Total financial instruments under custody are positive by 1.7 billion euro, down considerably on 2018 (9.2 billion): according to the breakdown of figures, certificates improved (1.7 billion) as well as shares (1.3 billion), exchange traded products (684 million) and bonds (267 million), while government bonds performed negatively (-3.1 billion). Liquidity inflows for 2019 were positive at 13.0 billion euro (+73.3% on 2018).
1.1The parent company -Azimut Holding S.p.A.

19
1.2AZ International Holdings SA and its direct and/or indirect subsidiaries
2019-2024 1.625% bondOn 5 December, Azimut Holding S.p.A. announced the completion of the placement to qualified investors, with the exclusion of the United States of America and other selected countries, of a senior unsecured fixed-rate Bond. The Bond has a nominal value of 500 million euro, a fixed-rate coupon of 1.625%, a five-year duration, maturing on 12 December 2024, and an expected rating “BBB-, Stable Outlook”, as stated by the rating agency Fitch Rating Ltd on 6 November 2019. The bonds were listed on the Official List of the Irish Stock Exchange plc, trading as Euronext Dublin and admitted to trading on its regulated market. The proceeds from the issue of the Bond may be used by Azimut Holding S.p.A. for general corporate purposes, and to fund potential investments and/or extraordinary transactions including, inter alia, the possible repurchase of the Company’s outstanding equity instruments and/or repay part of the Company’s indebtedness. Specifically, part of the proceeds were used to partially repay, for approximately 140 million euro, the 200 million euro loan granted by Banco BPM at the start of the year.
The Azimut Group carried out the following transactions during the year through its subsidiary AZ International Holdings SA.
Rasmala Egypt Asset Management On 8 January 2019, the Group signed an agreement to acquire 100% of Rasmala Egypt Asset Management (“Rasmala Egypt”), one of the largest independent asset managers in Egypt, from Rasmala Group (“Rasmala”), an independent alternative asset management group. Rasmala Egypt, founded in 1997, specialises on conventional and Shariah-compliant portfolio management with AUM of EGP 8.46 billion (USD 474 million), with a strong expertise in equity strategies (85% of total AUM). The company is based in Cairo. The total consideration is calculated based on a percentage of AUM and amounted to 11.2 million euro. The Azimut Group obtained control of Rasmala Egypt Asset Management on 30 June 2019 following the occurrence of the conditions precedent provided for in the relevant contract and the issue of some guarantees by the counterparty. The company was subsequently renamed Azimut Egypt Asset Management.
Youmy Wealth Management On 12 March 2019, through An Zhong (AZ) Investment Management Hong Kong Ltd, the Group signed an agreement with Youmy Wealth Management (“Youmy”). The agreement governs the strategic trade relationship between Youmy and An Zhong (AZ) Investment Management Hong Kong Ltd and is based on an increasing equity investment in Youmy, subject to the local authorities’ approval. Founded in 2014, Youmy is built on an innovative business model based on partnerships with family offices. Youmy now includes a network of 28 family offices in 15 cities

20 G r u p p o A z i m u t
across China. Youmy's expertise extends to the Private Equity and Venture Capital asset classes where their subsidiary manages just over RMB 1 billion of PE and VC funds. Youmy's founders include some of the pioneers of the wealth management industry in China with deep knowledge and insights on the needs of Chinese high net worth clients.
Spencer Fuller & Associates Spencer Fuller & Associates was acquired in March 2019. This financial advisory company based in Australia was acquired via the local sub-holding AZ NGA. The consideration amounted to approximately 4 million euro.
Sigma Fund Management PTY On 24 April 2019, the Board of Directors of the company approved the early dissolution of Sigma, empowering the directors to take the necessary actions, in accordance with local legislation, for its removal from the companies register. The company was struck off the companies register on 18 December 2019.
Kellaway Cridland Pty LtdIn August 2019, the acquisition of Kellaway Cridland PtY Ltd, an accounting services company based in Australia, was finalised through the local sub-holding AZ NGA. The consideration amounted to approximately 4.5 million euro.
Tempus Wealth Group PTY LtsIn November 2019, the acquisition of Tempus PtY Ltd, a pension advice company based in Australia, was finalised through the local sub-holding AZ NGA. The consideration amounted to approximately 3.5 million euro
AZIMUT (ME) LIMITEDIn February 2019, the Group opened a second office in the United Arab Emirates, namely in Abu Dhabi Global Market, following the in-principle approval obtained by the local regulator which enables it to operate by offering a complete platform of asset management services. The office includes a local management team and strengthens the offer for institutional customers with global investment solutions thanks to the Group's expertise.
Azimut Alternative Capital Partners LLCOn 14 November 2019, the Group, through its subsidiary AZ International Holdings SA, set up a newco based in New York (USA) called Azimut Alternative Capital Partners LLC ("AACP”), with the aim of investing in alternative asset managers specialised in private markets, including private equity, private credit, infrastructure and real estate. At the same time, Azimut signed an investment and shareholder agreement with AACP’s new CEO, Jeffry Brown, to achieve the objectives of the business plan, which, inter alia, aims to develop the main strategic permanent capital vehicle in the alternative sector.
Management reportof the Azimut Group
21
AACP was set up to build a new, diversified, multi-affiliated investment company, acquiring non-controlling interests in alternative asset managers and providing high value-added strategic services.
P&G S.G.R.’s acquisition by CGM Italia SGR During the previous year, Azimut Holding S.p.A., through its subsidiary CGM Italia SGR S.p.A. (“CGM”), entered into a sale and purchase agreement with P&G SGR S.p.A. (“P&G SGR”), that provides for the acquisition of P&G SGR’s business concerning the management of UCITS and alternative, non-reserved collective investment funds. P&G SGR, founded in 2005, is one of the main operators in Italy active in the ABS and structured credit sectors, focusing on absolute return strategies in niche markets and contributing to the birth of the European CDO market. P&G has been cooperating with Azimut Group since 2016, with a first joint project of a Luxembourg fund with sub-advisory agreement in favour of P&G (“AZ ABS”). Following this initiative, Azimut and P&G developed another project in the retail segment and launched the Azimut Private Debt fund in the first two months of 2019.The scope of the transaction includes the management mandates for the UCITS fund “AZ Multi Asset – ABS”, and the closed-end alternative, non-reserved investment fund “Azimut Private Debt”. As a result of the transaction, all the activities, relationships and contracts will be transferred within the scope of the Azimut Group. The agreement provides several representations and warranties, including indemnities, and non-compete clauses. The acquisition of P&G SGR was completed in June 2019 following the occurrence of the conditions precedent provided for in the relevant contract and the authorisation from the Bank of Italy. The total consideration amounted to 8 million euro.
2 - Other significant events of the year
On 24 January 2019, the Azimut Group submitted to the Luxembourg supervisory authority a new methodology to calculate variable performance fees on Luxembourg funds, which will generate significant cost savings for customers, in line with that set out in IOSCO principles. Specifically, the new methodology will be based on a benchmark annual calculation plus a spread pegged to several product categories while providing for an increase in fixed performance fees of approximately 50 basis points. Customers’ TER will remain in line with that applied by competitors and other market participants.In December 2019, the Luxembourg supervisory authority approved the new methodology to calculate variable performance fees on Luxembourg funds, in line with that set out in IOSCO principles. The new methodology will be applied gradually to the Group's Luxembourg mutual funds from 1 January 2020.
2.1New methodology tocalculate variable performance fees on Luxembourg funds

22 G r u p p o A z i m u t
The shareholders’ meeting (both ordinary and extraordinary) of 24 April 2019 resolved the following:
Approval of 2018 financial statementsThe shareholders’ meeting approved the 2018 financial statements, which included a Parent Company net profit of 186.3 million euro. The shareholders concurrently resolved to pay a dividend of 1.50 euro per ordinary share, pre-tax, which was paid as of 22 May 2019, 20 May 2019 ex-dividend payment date and 21 May 2019 as the record date. Each shareholder received (before withholding tax) a minimum of 3/4 by cash and the residual portion in shares of Azimut Holding, held as treasury shares by the company. These shares were assigned after the ex-dividend payment date on 20 May 2019. The portion of dividends to be paid in cash, the value and the allocation ratio of any dividend to be paid as shares, and the fractional rights arising from the allocation, were disclosed to the shareholders and the public on the third trading day prior to the ex-dividend payment date (20 May 2019), i.e., on 15 May 2019, based on the official price of Azimut Holding shares in the last five trading days, including 15 May 2019. The fractional rights arising from the share allocation were monetised based on the official price resulting from the transactions carried out on the last market trading day prior to the ex-dividend date, without expenses, fees or other charges for the shareholders. The shareholders also approved the payment to Fondazione Azimut Onlus of 1.6 million euro, equal to 1% of pre-tax consolidated profit and the payment of 12.21 euro for each profit-participating financial instrument held by Top Key People at the time of approval of payment of the dividend.
Appointment of the Board of Directors and the Board of Statutory Auditors The shareholders’ meeting appointed twelve members of the Board of Directors, of whom ten with a three-year term of office and two, representing the distribution network, for one year, confirming Mr. Pietro Giuliani as Chairman. The shareholders’ meeting also appointed the Board of Statutory Auditors for the next three years.
Proposal for purchase and allocation of treasury shares and consequent resolutionsFurthermore, the shareholders approved the purchase of up to 28,000,000 Azimut Holding S.p.A. ordinary shares, or 19.55% of the current share capital, including in one or more instalments, considering the shares already in portfolio upon purchase at a minimum unit price equal to at least the carrying amount of Azimut Holding S.p.A. ordinary shares and a maximum unit price of 50 euro.
Resolution on remuneration policies. Remuneration Report and resolution pursuant to article 123-ter, paragraph 6 of Legislative decree no. 58/98The Shareholders approved the Parent Company policy concerning the remuneration of members of the management boards, general managers and key managers, as well as the procedures used to adopt and implement said policy.
Management reportof the Azimut Group
2.2 Azimut Holding S.p.A. General Shareholders’ Meeting of 24 April 2019

23
Full demerger of CGM Italia SGR S.p.A. into Azimut Capital Management SGR S.p.A. and Azimut Libera Impresa SGR S.p.A.In December 2019, the operations necessary for the full demerger of CGM Italia SGR S.p.A. into Azimut Capital Management SGR S.p.A. and Azimut Libera Impresa SGR S.p.A. began pursuant to article 2506 of the Italian Civil Code. As part of this operation, for purely instrumental and functional reasons, the Parent Company will acquire 100% of CGM Italia SGR S.p.A. from CGM - Azimut Monaco Sa, given that it already holds indirectly this investment as the head of the chain of investors.As a result of the demerger, Azimut Capital Management SGR S.p.A. will be assigned the business unit that manages the alternative investment fund "CGM Azionario EUR" and third-party UCIs, portfolio management, order receipt and transmission and investment advice.As a result of the demerger, Azimut Libera Impresa SGR S.p.A. will be assigned the business unit comprising the activity carried out as the party entrusted with management of the "AZ Multi Asset - ABS” UCITS, the Italian alternative investment fund "Azimut Private Debt" and the reserved Luxembourg alternative fund called "AZ RAIF I - Corporate Cash Plus".The entire operation responds to the need to simplify the Group's corporate structure, as part of the reorganisation launched together with the Parent Company, whose aim is to streamline the Group's structure and related organisational-management structures and procedures, thereby generating cost savings, including in terms of administrative and accounting requirements.The entire operation is subject to the Bank of Italy's approval.
During the period 19 March 2018 - 21 November 2018, Azimut Capital Management SGR S.p.A. was subject to Consob (the Italian commission for listed companies and the stock exchange) regular inspection. The supervisory authorities provided the SGR's Board of Directors with the final report on the inspection on 28 February 2019. The SGR provided extensive feedback on the above report on 1 April 2019 by submitting an action plan to deal with the critical issues identified. The plan was subsequently integrated to meet the additional requests which resulted from the continuous interactions with the authorities. In this respect, the company was required to prepare a quarterly status report to be submitted to the supervisory authorities: the first report was submitted on 31 July 2019 and covered the progress of the implementation of the corrective measures at 30 June 2019, while the second was sent on 5 November 2019.At the same time, on 28 March 2019, Consob notified the commencement of a sanctioning procedure for violations subject to administrative sanctions against Azimut Capital Management SGR. In this respect, the related rebuttal arguments were filed on 14 June 2019. On 27 November 2019, an administrative sanction of 200,000 euro was imposed on Azimut Capital Management SGR S.p.A., which was duly paid.
2.2 Other significant eventsof the year

24 G r u p p o A z i m u t
Azimut group's financial performance for 2019The Azimut Group's consolidated net profit for 2019 amounts to 370,011 thousand euro (122,146 thousand euro in 2018), while consolidated EBIT came to 452,845 thousand euro (156,299 thousand euro in 2018).The performance of the year was also affected by the Group's ongoing expansion which strengthened its presence outside Europe. The Group is comprised of several companies which distribute, manage and promote financial and insurance products in many countries, including Luxembourg, Ireland, China (Hong Kong and Shanghai), Monaco, Switzerland, Singapore, Brazil, Mexico, Taiwan, Chile, Australia, Turkey, the United States, the United Arab Emirates and Egypt. Through the subsidiary AZ International Holdings SA, a wholly-owned subsidiary incorporated under Luxembourg law to act as an incubator, the Group continued its mission to develop, research, acquire and manage international partnerships. In 2019, 7 companies (12 in 2018) were acquired and/or set up and the Group's presence was strengthened thanks to the purchase of additional equity investments in previously acquired companies.The recruitment of financial advisors showed a positive balance: in 2019, the Group's network in Italy showed 146 new engagements, compared to 105 outgoing employees, bringing the total number of advisors in Italy to 1,788.
Management reportof the Azimut Group
Total assets under management at the end of 2019 reached 46 billion euro, up by 15.5% compared to the end of 2018. Total assets, including assets under custody, amounted to 59.1 billion euro, up by 16.4% on the previous year.
%30,662
10,090 5,678 1,507
-8,154 39,783 10,989 50,772
13.5%
18.5%7.0%
39.2%9.8%
15.5%19.5%16.4%
4,126
1,870 396 591
-797 6,186 2,139 8,325
34,788
11,960 6,074 2,098
-8,951 45,969 13,128 59,097
Mutual fundsDiscretionary portfoliomanagement and otherAZ Life insuranceAdvisoryDouble countingAUM, netSecurities, third-party funds and c/aTotal assets
Figures in millions of euro 31/12/2019 31/12/2018 ChangeAbsolute
Assets

25
Group total inflows were positive at 4.6 billion euro at 31 December 2019, up on 2018 (4.7%).
In order to provide a more effective representation of the results, the income statement has been reclassified and thus better reflects the content of the items according to operating criteria.The main reclassifications involved the following:• cost recoveries on portfolio management reported under “Fee and commission income” have been reclassified as “Other income” in the reclassified income statement;• net premiums and the corresponding change in the technical reserves, commissions and recovered expenses relating to insurance and investment products issued by AZ Life Dac, reported under “Net premiums”, “Change in technical reserves” and “Fee and commission income”, have been reclassified as “Insurance income”;• commission expenses paid to the distribution network, reported under “Fee and commission expense” are now classed as “Acquisition costs”; similarly, the Enasarco/ Firr contributions related to these commission expenses and the other trade expenses associated with the distribution network, recognised under “Administrative costs”, have been reclassified as “Acquisition costs”; the amount allocated to the supplementary indemnity reserve for agents (ISC) reported under the item “Provisions for risks and charges” has been reclassified as “Acquisition costs”;• administrative cost recoveries, reported under “Other operating income and costs”, were recognised as a reduction of “Overheads/administrative costs”;• interest expenses on loans were reported under “Interest expense” in the reclassified income statement.
%918
1,385-440341135
2,3392,0644,403
15.8%
-32.9%-73.6%-5.6%
129.6%7.2%1.9%4.7%
145
-456324-1917516940
209
1,063
929-116322310
2,5082,1044,612
Mutual fundsDiscretionary portfoliomanagement and otherAZ Life insuranceAdvisoryDouble countingTotal net inflows - Assets under managementSecurities, third-party funds and c/aTotal net inflows
Figures in millions of euro 2019 2018 ChangeAbsolute
Net inflows
Reclassified consolidated income statement

26 G r u p p o A z i m u t
5,401629,19856,5488,487
48,821748,454
(336,195)(203,650)(15,763)
(555,608)192,846(23,312)(6,238)(7,414)
155,882(24,836)
9,534140,58018,434
122,146
6,133752,741206,51713,28571,098
1,049,774(379,776)(200,201)(24,387)
(604,364)445,41016,936
678(11,871)451,153(58,413)(6,491)
386,25016,239
370,011
Acquisition feesFixed management feesVariable management feesOther incomeInsurance incomeTotal incomeAcquisition costsOverhead costs/administrative costsAmortisation/depreciation and provisionsTotal costsEBIT Net financial incomeNet non-recurring income (costs)Interest expensePre-tax profitIncome taxDeferred tax assets/liabilitiesNet profit (loss)Profit (loss) attributable to minority interestsGroup net profit
01/01/19 - 31/12/19Euro/000
01/01/18 - 31/12/18
Management reportof the Azimut Group
Consolidated EBIT and consolidated Group net profit for 2019 came to 445 million euro (193 million euro in 2018) and 370 million euro (122 million euro in 2018), respectively.Assets managed increased by 15.5% on 31 December 2018, generating fixed management fees of 753 million euro, in addition to variable management fees of 207 million euro.The increase in acquisition costs is in line with the increase in recurring fees and also reflects the recruitment of financial advisors during the year.Overhead costs were slightly down on the previous year, also benefiting from the effects of the adoption of IFRS 16 as of 1 January 2019. The effects are reflected in the increase in amortisation/depreciation and provisions and in net financial income (expenses).Net financial income also includes the positive effects of the fair value measurement of the investments in UCI units (10 million euro).

27
Key balance sheet figuresThe Group's key balance sheet figures are shown in the table below.
5,848,7784,974
220,578610,817400,730
7,085,877371,711177,068
5,582,010330,631624,457
7,085,877
6,691,95517,378
451,524683,099409,704
8,253,660960,000176,630
5,976,059369,440771,531
8,253,660
Financial assets at fair value through profit or lossFinancial assets at fair value through other comprehensive incomeFinancial assets at amortised cost and equity investmentsProperty, plant and equipment and intangible assetsOther assetsTotal assetsFinancial liabilities at amortised costTechnical reservesFinancial liabilities measured at fair valueOther liabilities and provisionsShareholders’ equityTotal liabilities and shareholders’ equity
31/12/2019Euro/000 31/12/2018
The comparative figures for the previous periods do not reflect the balances resulting from the retroactive application of IFRS 16. Indeed, for FTA purposes, the Group opted to apply the so-called modified retrospective approach, whereby the right of use is deemed equal to the lease liability. Reference should be made to the paragraph "Basis of preparation" of these consolidated financial statements for a description and a presentation of the effects of the adoption of IFRS 16.Financial assets at fair value through profit or loss increased by approximately 14% on 31 December 2018. These items mainly refer to the insurance activities carried out by AZ Life Dac: assets mainly relate to investments in unit-linked policies where the investment risk is borne by policyholders, while liabilities mainly relate to commitments from unit-linked policies classified as investment contracts. Furthermore, financial assets at fair value through profit or loss include the Group’s portions of UCI units which reflect the investment of the excess liquidity of operations. Financial assets at fair value through other comprehensive income increased on 31 December 2018 as a result of the investments in Youmy Wealth Management (2.7 million euro) and Gellify, a B2B innovation platform in which the Group subscribed a capital increase of 8 million euro. Investments in government bonds are also included.Financial assets at amortised cost mainly comprise cash equivalents with bank current accounts held by Group companies which increased from 106 million euro at 31 December 2018 to 245 million euro at 31 December 2019.

28 G r u p p o A z i m u t
Management reportof the Azimut Group
Property, plant and equipment and intangible assets increased as a consequence of the rise in intangible assets with a finite life due to the investments of the year and the recognition of right-of-use assets following the application of IFRS 16 which amounted to 40 million euro at 31 December 2019.Other assets mainly include tax assets (167 million euro), amounts due from financial advisors for loans and advanced commissions (approximately 18 million euro) and incentive costs relating to total inflow targets which are directly attributable to the existing contracts which meet the capitalisation requirements under the new category of costs incurred to fulfil a contract introduced by IFRS 15. They are included under Prepayments and amounted to 51 million euro at 31 December 2019.The increase in financial liabilities at amortised cost is due to a loan granted by Banco BPM on 28 February 2019 and divided into two lines, A and B, each amounting to 100 million euro. Line A is repayable in tranches while Line B is entirely due on 31 December 2021. The interest rate is calculated based on the Euribor plus 140 basis points for Line A and 160 basis points for Line B. On 31 December 2019, the loan was repaid in advance for 120 million euro, in addition to the payment of Line A due on the same date (20 million euro). The loan is subject to covenants. This item also includes the lease liabilities which arose as a result of the application of IFRS 16, amounting to 43 million euro at 31 December 2019.Financial liabilities at amortised cost also comprise the outstanding securities related to the “Azimut 2017-2022 2%” and the “Azimut 2019-2024 1.625%” bonds issued in December 2019. This transaction is described in the paragraph “Significant events of the year”.

29
With regard to the methods used to assess net financial position, reference was made to the recommendation issued by CESR (Committee of European Securities Regulators) dated 10 February 2005, and more specifically to the paragraph on “Capitalisation and indebtedness” in chapter II.
23174,441106,47867,963
148,649 323,113 -
(5,351)(5,351)
(5,351) 317,762
(348,815)(348,815)
(348,815)(31,053)
19387,639245,390142,249597,027
984,685 -
(25,774)(5,351)
(423)(20,000)
(25,774)
958,911 (39,491)(39,491)
(846,701)(349,172)(497,529)
(43,463)(43,463)
(929,655)29,256
A Cash B Cash equivalents: Due from banks Due from managed fundsC UCI units and government securitiesD Total cash A+B+CE Short-term financial receivablesF Short-term bank loansG Current portion of long-term debt: Bonds (Azimut '17-'22 Non-convertible) Bonds (Azimut '19-'24) Due to banks (Banco BPM loan)H Other short-term financial payablesI Short-term financial debt F+G+HJ Short-term financial debt (net) I-E-DK Long-term bank loans: Due to banks (Banco BPM loan)L Bonds Azimut '17-'22 Non-convertible Bond Azimut 19-24 BondM Other long-term payables Liabilities from the application of IFRS 16N Long-term financial debt K+L+MO Net financial position J+N
31/12/2019 31/12/2018
The Group's net financial position amounted to 29 million euro at 31 December 2019 (net financial indebtedness of 31 million euro at 31 December 2018).
Consolidated financial position
Euro/000

30 G r u p p o A z i m u t
Management reportof the Azimut Group
Receivables and payables include those of a financial nature only, whereas trade receivables and payables have been excluded. Receivables in the form of fees and commissions for managed funds and discretionary portfolios are also included and are considered as cash equivalents given that they are collected by the Group during the first few working days after the reporting date.The results were impacted by the liquidity used by operations, as well as by 166 million euro for the cash payment of dividends to shareholders and holders of profit-participating financial instruments and the payment to Fondazione Azimut Onlus of 1.6 million euro made in execution of the Shareholders’ resolution of 24 April 2019. For additional information about the other significant transactions of the year, reference should be made to the section “Significant events of the year”.
The changes of the year in financial debt items are shown in the following table:Loans raised and repaid during the year
350,000
-70,000-70,000
100,000100,000500,000
2022
20212021
202120212024
2%
Euribor + 1.4Euribor + 1.6
Euribor + 1.4Euribor + 1.6
1.625%
2.11%
2.00%2.00%
2.00%2.00%1.73%
Euro
EuroEuro
EuroEuroEuro
of which:“Azimut 2017-2022” Bond
of which:Banco BPM loan - Line ABanco BPM loan - Line B
of which:Banco BPM loan - Line ABanco BPM loan - Line B“Azimut 2019-2024” Bond
Euro/000
Balance at 01/01/2019
Redemptions
Issues:
EffectiveNominalCurrency
Interest rate Nominal amount
Expiry

31
On 21 May 2019, a total of 2,472,548 treasury shares were assigned as ordinary dividend.At 31 December 2019, Azimut Holding S.p.A.’s subsidiaries did not hold any treasury shares or shares of the Parent Company, either directly or via trust companies or third parties.At 31 December 2019, Azimut Holding S.p.A.’s treasury share portfolio therefore stood at 2,319,451 shares, or 1.619% of share capital.
Treasury shares
209,104
209,104
558,188248
(238,202)(143,750)(17,162)
(356)6,340
(4,399)
370,01116,239
386,250
607,7532,106
609,859
558,18875,121
(238,202)(143,750)(17,162)
3,460(125,511)
32,027(6,341)
747,68923,843
771,532
Holding opening balance Adjustments due to changes in calendar yearTotal Holding shareholders’ equityAdjustments:Results of consolidated companiesSubsidiary consolidation effectsAzimut Holding S.p.A. dividend cancellationCancellation of subsidiaries' dividendsAZ International Holdings SA Group dividend cancellationEquity accounted investmentsLiabilities measured at fair valueAdjustments due to IAS/IFRS changesTax adjustmentsTotal Group shareholders’ equityMinority interestTotal shareholders’ equity
Euro/000 Shareholders’ equityat 31/12/19
of which Profitfor the year
Reconciliation of AzimutHolding S.p.A.'s shareholders' equity and net profit to consolidated shareholders' equity and net profit

32 G r u p p o A z i m u t
Management reportof the Azimut Group
Information about main Azimut group companies
The following information is given about the business activities and the financial performance of the companies directly and indirectly controlled by the Parent Company in accordance with the Group's accounting policies.• AZ Fund Management SA, wholly owned, carries out mutual fund management activities. During the year, it achieved a profit of 325 million euro compared to a profit of approximately 164 million in 2018. At 31 December 2019, total net assets under management stood at approximately 24 billion euro.• AZ Life dac, wholly owned, carries out insurance activities. During the year, it achieved a profit of 33 million euro compared to a profit of approximately 24 million euro in 2018• Azimut Capital Management SGR S.p.A., wholly owned, manages harmonised Italian funds, pension funds, alternative funds and discretionary funds. The net profit for 2019 amounts to 144 million euro compared to a profit of 47 million euro in 2018. At 31 December 2019, total assets under management stood at approximately 7.9 billion euro, of which 1.4 billion euro related to mutual funds and 6.5 billion euro to discretionary funds.• Azimut Financial Insurance S.p.A., wholly owned, carries out insurance mediation, except for reinsurance mediation, and bank products' placement and distribution activities. In 2019, it achieved a profit of 52 million euro compared to a profit of 27 million euro in 2018.• AZ International Holdings SA, wholly owned, is a Luxembourg-based holding company through which the Group continued its research, development, acquisition and management of foreign partnerships. Through this company, the Group is present in 15 countries, including Luxembourg, Ireland, China (Hong Kong and Shanghai), Monaco, Switzerland, Singapore, Brazil, Mexico, Taiwan, Chile, Australia, Turkey, the United States, the United Arab Emirates and Egypt. In 2019, it incurred a loss of 6 million euro compared to a loss of 4 million euro in 2018.• Azimut Libera Impresa SGR S.p.A., wholly owned, manages private equity funds. In 2019, it incurred a loss of 1 million euro compared to a loss of 432 thousand euro in 2018.• Azimut Enterprises Holding S.r.l., wholly owned, is a company investing in unlisted companies, including Programma 101 Sicaf S.p.A., Siamosoci S.r.l. and Cofircont Compagnia Fiduciaria S.r.l. which contribute to diversifying the Group's business. Programma 101 Sicaf S.p.A. is a venture capital company specialised in early stage investments in the digital sector, while Siamosoci S.r.l. acts as start-up incubator. Cofircont Compagnia Fiduciaria S.r.l. is a fiduciary company. In 2019, it incurred a loss of 997 thousand euro compared to a loss of 743 thousand euro in 2018.

33
Specifically, through the subsidiary AZ International Holdings SA, the Azimut Group is pursuing an international growth strategy which mainly translates into partnerships with local operators, the acquisition of majority investments in asset management and/or advisory and distribution companies. The list of AZ International Holdings SA's partnerships is given below, broken down by geographical area:
Europe • Katarsis Capital Advisors SA, a wholly-owned Swiss company, which carries out actuarial and financial advisory activities. • Eskatos Capital Management SARL, a Luxembourg company wholly owned through Katarsis Capital Advisors SA, which carries out fund management activities. • AZ Swiss & Partners, a Swiss company, 51% owned, which carries out advisory and assistance activities with respect to investments and vis-à-vis authorised intermediaries and institutional investors and asset management.• SDB Financial Solutions SA a Swiss company, 51% owned by AZ Swiss & Partners, which carries out advisory and assistance activities with respect to investments and asset management.• CGM - Azimut Monaco, wholly owned, which carries out asset management, financial advisory and order receipt and transmission activities. • CGM Italia SGR S.p.A., wholly owned through CGM - Azimut Monaco, which carries out asset management, order receipt and transmission, placement and advisory activities.
Turkey• Azimut Portfoy Yonetimi AS, wholly owned, which carries out asset management activities.
United Arab Emirates• Azimut (DIFC) Limited, wholly owned, directly controlled by AZ International Holdings SA. The company allows to operate locally through a “class 3” license granted by the Dubai Financial Services Authority (“DFSA”). Consequently, it offers a wide range of financial services, including collective investment plans, discretionary portfolios and financial advisory.• Azimut (ME) Limited, based in the United Arab Emirates, a direct wholly- owned subsidiary of AZ International Holdings Sa.
Egypt• Rasmala Egypt Asset Management ,(now Azimut Egypt Asset Management), based in Cairo, wholly owned by AZ International Holdings Sa. It carries out fund management activities.
Europa, Middle East and Africa

34 G r u p p o A z i m u t
Management reportof the Azimut Group
Asia-Pacific
Americas
South East Asia • AN Zhong (AZ) IM Limited, wholly owned, which carries out equity investment management activities. • AN Zhong (AZ) IM HK Limited, wholly owned through AN Zhong (AZ) IM Limited, is a financial advisory company based in Hong Kong. • AZ Investment Management, wholly owned through AN Zhong (AZ) IM Limited, is a financial advisory company operating in the Chinese market. In January 2019, the company was granted approval from the Asset Management Association of China (AMAC) to register as a private fund manager (PFM) in China.• AZ Sinopro Financial Planning Ltd, 51% owned, is a holding company. • AZ Sinopro Insurance Planning Ltd 51% owned through AZ Sinopro Investment Planning (51% owned, in turn, through AZ Sinopro Financial Planning), is a securities investment consulting enterprise which distributes asset management products in Taiwan.• AZ Investment Management Singapore Ltd, wholly owned, is an independent company based in Singapore which provides advisory services.
Australia • Next Generation Advisory Pty Ltd, 58.44% owned, is a financial advisory company that acted as the holding company for the Group's investments made in 50 financial advisory and asset allocation companies. For a list of these companies, reference should be made to Section 4 - Other aspects of the notes to the consolidated financial statements.• AZ Sestante directly controlled by AZ International Holdings SA which owns 100% thereof, acts as a trustee and manager of mutual funds in Australia. The company was set up to launch and offer funds locally.
United States• AZ US Holding INC was incorporated by AZ International Holdings S.A. in 2016 and is wholly owned by it. AZ US Holding INC, in turn, incorporated: • AZ Apice Capital Management LLC in which it owns a 74.69% investment. This company, in the start-up phase, carries out financial planning and portfolio management activities for non-resident US citizens.• Azimut Alternative Capital Partners LLC, based in the United States and 96.5% owned by AZ US Holding Inc. It was set up in December 2019.
Latin America • AZ Brasil Holdings Ltda, wholly owned, is a Brazilian company which carries out equity investment management activities.• AZ Quest Partecipacoe SA, 62.69% owned through AZ Brasil Holdings LTDA, is a Brazilian independent company which carries out asset management activities.

35
• AZ Quest Investimentos Ltda, 62.69% owned through AZ Brasil Holdings LTDA, is a Brazilian independent company which carries out asset management activities. It carries out portfolio management and distribution activities.• AZ Brasil Wealth Management Holding SA 89.43% owned by AZ Brasil Holdings Ltds, is a Brazilian equity investment management company. • M&O Consultoria Ltda, 89.43% owned through AZ Brasil Wealth Management Holding SA, is a company operating in the asset and wealth management sectors.• Azimut Brasil Wealth Management Ltda 71.66% owned through AZ Brasil Wealth Management Holding SA, is a company operating in the distribution sector.• Futurainvest Investimentos e Participacoes Ltda, 89.43% owned through Azimut Brasil Wealth Management Holding SA, is a Brazilian wealth management company specialised in the development of tailor-made investment strategies for Brazilian private investors.• Futurainvest Holding SA 89.43% owned through Azimut Brasil Holdings Ltda, is a Brazilian-based holding company.• Azimut Brasil DTVM Ltda, 99.9% owned through Futurainvest Holding SA, is a financial institution, regulated by Banco Central, which is authorised to distribute financial products.• AZ México Holdings S.A., wholly owned, is a Mexican holding company. • Mas Fondos SA, wholly owned through AZ Mèxico Holdings S.A., carries out distribution activities in the asset management sector.• AZ Andes SA, wholly owned by AZ International Holdings SA, is a Chilean advisory company.

36 G r u p p o A z i m u t
Management reportof the Azimut Group
Key risks and uncertainties
Key risksFor the purposes of risk monitoring, the Group has identified the key risks as follows:
Strategic risk is defined as a current or potential risk of a reduction in earnings or capital as a result of changes in operations or of incorrect, inadequate decision-making and failure to respond to the competitive scenario.This risk depends firstly on the profitability profile generated by the sale of services and products by financial advisors, by the management of funds and by incorrect or imprudent evaluation of market trends in terms of customers and products to be placed. Sales activity is monitored through reports on the sales performance by geographic area and by financial products sold. Financial advisors and their respective Managing Directors (financial advisors responsible for coordinating specific areas of the country) also meet regularly to keep track of the market situation and take the relevant steps to preserve the competitiveness of each geographic area. Finally, market research and analyses by the research and marketing department are used to compare results to those of Azimut’s competitors and monitor the performance of funds.The periodic reporting of the results achieved, specifically about the financial position and results of operations, plays a fundamental role in monitoring the impact of the strategic decisions made by governance bodies, identifying any necessary corrective measures.
The Group’s companies mainly recruit financial advisors with years of experience in the field, gained while working for rival companies or in bank retail services. The process of recruiting individual financial advisors is strict and involves both local branches and the marketing departments of the Group. Moreover, in addition to past experience, qualifications and references gained on the market are also considered. In the case of the subsidiary Azimut Capital Management, its horizontal structure requires that financial advisors are able to perform their jobs autonomously: by focusing on this aspect during recruitment, the company tends to avoid choosing inexperienced candidates. In order to limit the risks arising from any fraudulent action taken by financial advisors in the performance of their duties, the Group purposely entered into insurance policies against loyalty risks and professional liability insurance for the financial advisors themselves (with the maximum annual claims deemed adequate for said advisors to operate). Finally, the marketing department works closely with the Internal Audit department to share the information required to monitor the conduct of individual financial advisors.Internal control over financial advisors is based on the identification and analysis of possible irregularities in remote monitoring and inspections at financial advisors'
Strategic risk
Sales network risks
37
Operational risk
Outsourcing risks
offices. These controls are carried out also to check compliance with presentation criteria, correct keeping of archives and fulfilments vis-à-vis the body in charge of the Financial Advisors' register.Should any irregularity be detected, or in case of non-compliance with the code of conduct, the financial advisors directly involved or their managers are asked to prepare a specific report to give explanations or to take adequate measures.
Operational risk is related to potential losses due to inadequate or defective aspects of procedure, human resources, internal processes, or external events. As well as being generally evaluated in quantitative terms, monitored and mitigated in accordance with current regulations, this risk is also subject to qualitative assessment for the individual Group companies.Therefore, the Group uses a process to identify and assess the operational risks based on Risk Self-Assessment methods, which take account of the frequency and severity of identified risk events.This procedure allows the companies to establish appropriate control and monitoring techniques, i.e. measures to limit the negative effects of any adverse conditions to which the Group is exposed. Given the presence of this type of risk, the Group has established the following measures to monitor and limit the effects: • mapping of main company procedures, by means of an analysis of existing procedures and interviews with the managers of the various departments;• identifying the significant risks within the mapped procedures;• evaluation of control measures (primary or secondary level) in respect of risk areas, highlighting any unmonitored situations;• defining and implementing a reporting system via the Internal Control and Risk Management Committee, in order to report the final results on the unmonitored risks and any action taken.
The administrative and IT activities of the Italian operating companies of the Group are outsourced.When the contracts with Objectway Financial Software S.p.A. and Deloitte Enterprise Risk Service S.r.l. (the Group’s main outsourcers) were signed, establishing the method used in the performance of the outsourced services, purposely created service level agreements (SLA) were also drawn up to guarantee the adequacy of the services provided and allow group Companies to take action against the supplier in the event of any economic losses arising from problems in the supply of these services.Another measure to ensure that services are performed correctly was the creation of an Operating Committee, whose members come from both the Group’s operating companies affected by the agreement and the supplier company, to establish the procedures, define the timescales, and monitor the correct execution of all services

38 G r u p p o A z i m u t
Management reportof the Azimut Group
provided. The committee meets at least once a month and the participants are provided with a copy of the minutes of the meeting afterwards.
Reputational risk originates from risk factors such as compliance, strategy, outsourcing and other specific variables such as the public scenario, significance of the trademark and company image, exposure to external communication processes. In order to limit this type of risk, a series of procedures has been put in place aimed at minimising both its cause and effect, the most important aspects being:• complaints received by Group companies are monitored constantly, so as to analyse any problems caused by management activities, consultancies, placement and distribution activities and/or operating errors and the effects that these may have on the company’s reputation; • a mapping of corporate risks of all Group companies is periodically updated, in order to identify which departments, procedures and activities are most subject to reputational risks; • the monitoring of the Internal Control and Risk Management Committee, where the presence of managers allows for top-down management of action to be taken to limit reputational risks or respond to any events caused by them;• the Marketing and Investor Relations departments, centralised at Group level, have sole responsibility for dealing with public relations/external communications and the company’s image; • an Internal Code of Conduct governs the treatment of any action that gives rise to conflicts of interest, cases of insider trading or market abuse and any penalties as a result of failure to comply with such regulations.In accordance with the regulations for the treatment of privileged information pursuant to Article 115 bis of Italian Legislative Decree No. 58/98 (TUF - Consolidated Law on Finance), Azimut Holding S.p.A. established a register for itself and on the behalf of its subsidiaries, by creating a database with the technical/operating features required to guarantee that logical and physical security requirements are met, records cannot be changed and that information is easily accessible.
Compliance risk is related to legal and administrative sanctions, significant financial losses or damage to reputation as a result of non-compliance with laws and regulations or internal procedures (e.g. by-laws, codes of conduct, corporate governance codes).Given that all levels of the company are exposed to this risk, limiting its effects mainly involves ensuring that personnel take adequate responsibility in the performance of their work by complying with the internal code of conduct, code of ethics and procedure manual.The Compliance function, which has been centralised within Azimut Capital Management SGR S.p.A. since 1 January 2019, ensures that internal procedures are
Reputational risk
Compliance risk

39
in line with the goal of preventing any breaches of current law or internal regulations. In more detail, the Compliance department:• proposes any organisational and procedural changes to ensure adequate
protection against any identified risks of non-compliance;• submits a report to all relevant bodies, including the Supervisory Body (pursuant
to Italian Legislative Decree No. 231/2001), the Board of Statutory Auditors, the Internal Control and Risk Management Committee;
• controls the efficiency of organisational changes (structures, processes, procedures);
• constantly monitors any changes to regulations governing the investment service sector, and circulates the relevant information to all parties concerned.
As regards financial risks, proprietary trading by Group companies is exposed to market risks. Moreover, the financial instruments in question are easily liquidated and are monitored closely, most being flexible and money market mutual fund units managed by the Group companies.As for credit risk, there are no specific problems given the nature of the Group’s activity.
Liquidity risk arises when the company is unable to gain access, under reasonable economic conditions, to the financial resources required to ensure its efficiency.The main factors that determine liquidity levels are the resources provided from or used by administrative and investment activities, as well as loan expiry and renewal or liquidity of investments and market conditions.The Group has no liquidity issues. In order to mitigate this risk, it adopted a policy for the optimisation of financial resources management. Specifically, the Group maintains an adequate level of liquidity available thanks to constant cash flow generation and by monitoring forecast needs based on financial planning.
Key uncertaintiesThe uncertainties to which the Group is exposed derive from the specific nature of its core business, particularly as far as the strict correlation is concerned between income and certain types of fee items, the performance of which is determined by the results generated by the management of listed products and the performance in terms of capital inflow. The generation of these revenues and the relative amount are by nature volatile and heavily influenced by the returns offered by the funds and the risk appetite of the customers during the period considered. These factors are, in turn, affected by the performance of reference markets and, more generally, of the national and international economies. There is therefore a risk that Group's revenues and operating results may be negatively affected by prolonged financial market crises.
Financial risks
Liquidity risk

40 G r u p p o A z i m u t
Management reportof the Azimut Group
Related-party transactions
Pursuant to Consob Regulation on Related Parties1, on 22 November 2010 the Board of Directors of Azimut Holding S.p.A. approved the procedures that ensure transparency and fairness of related-party transactions (“Related-Party Transaction Procedure” available on Azimut’s website at www.azimut-group.com).With reference to paragraph 8 of Article 5 of the Consob Regulation on periodic disclosure of related-party transactions, the Group did not engage in any “significant” transactions during 2019. No other atypical or unusual transactions were performed.Disclosures on other related-party transactions are provided in paragraph “Related-Party Transactions” in Part D, Section 6 of the Notes to the consolidated financial statements.
Organisational structure and corporate governance
Azimut Holding S.p.A. complies with corporate governance regulations in force in Italy. Moreover, the corporate governance structure partially reflects the recommendations contained in the Code of Conduct for Listed Companies published by Borsa Italiana. For more information reference should be made to the attached Report on corporate governance and ownership structure prepared pursuant to Article 123-bis of the Consolidated Law on Finance (TUF).Azimut Holding S.p.A. has established a risk management and internal control system over financial reporting, using as a reference the “COSO Report”, under which the Internal Control in the broadest sense is “a process effected by an entity's Board of Directors, management and other personnel, designed to provide reasonable assurance regarding the achievement of objectives”; specifically, the objective of reliable financial reporting.The key characteristics of the risk management and internal control system over financial reporting are described in the Report on corporate governance and ownership structure.
1 Consob resolution No. 17221 of 12 March 2010 as subsequently amended.

41
Human resources
At 31 December 2019, the Group’s personnel amounted to 962, broken down as follows:
133194635962
144185682
1,011
ManagersMiddle managersOffice staffTotal
Position 2019 2018
The increase in employees at 31 December 2019 over the previous year mainly reflects the consolidation of recently acquired companies.
Privacy
The General Data Protection Regulation (GDPR) no. 2016/679 came fully into force last year, introducing EU legislation in the area of data protection.The Group companies complied with the GDPR provisions by:• approving a specific data processing policy;• adopting organisational procedures which regulate internal processes and the provisions on data information security; and• adopting a Code of Conduct pursuant to Article 40 of the GDPR.
Research and development
The research and development activities undertaken by the Azimut Group focus exclusively on the “research” of investment instruments and services and on the sale of these products. The Group is constantly committed to designing and implementing investment tools that meet the increasingly sophisticated needs of current and potential customers (see also the section on “Significant events of the year”).

42 G r u p p o A z i m u t
Management reportof the Azimut Group
Significant events after the reporting date
The main events that occurred after 31 December 2019, the reporting date of the consolidated financial statements, until 5 March 2020, the date on which the Board of Directors approved the draft consolidated financial statements, are as follows:• In January and February 2020, the company made a capital injection of 23.5 million
euro to increase the share capital of the subsidiary AZ International Holdings SA.• On 24 February 2020, Azimut Holding’s Board of Directors, based on the authorisation
issued pursuant to Article 2357 of the Italian Civil Code by the Shareholders' Meeting of 24 April 2019, valid until 23 October 2020, resolved to avail itself of the above authorisation and to purchase, in a tranche, treasury shares for an indicative amount of up to 50 million euro, and a maximum amount per share of 50 euro. As per the above resolution, 1,570,061 treasury shares were purchased, for a total of 20 million euro.
On 6 February 2020, Azimut Holding S.p.A.’s Board of Directors approved a capital contribution to Azimut Libera Impresa SGR S.p.A. of up to 18 million euro, to be disbursed in the form of a shareholder loan. On 28 February 2020, Azimut Holding S.p.A. disbursed a first tranche of the shareholder loan amounting to 3 million euro. For the sake of completeness, it should be noted that, at the preparation date of these consolidated financial statements, the spread of Covid 19 ("Coronavirus”) became a factor of macroeconomic instability, which, in the first few weeks of 2020, initially impacted the economy in China and subsequently spread to other countries, including Italy. This factor could also have a significant impact on the global outlook for future growth, affecting the general macroeconomic scenario, the financial markets, including the sectors in which the Group operates, also in light of the decisions made by government authorities to contain the spread of the epidemic, with a consequent impact on global financial markets.This factor is a non-adjusting event in accordance with IAS 10.21-22. Indeed, although the Coronavirus hit the People's Republic of China near the reporting date, the World Health Organization declared the existence of an international emergency only at the end of January 2020. Furthermore, from the end of January 2020, cases have been diagnosed also in other countries, leading to the adoption of specific decisions both in China and in other countries. Based on the information currently available, it is not possible to determine the possible impacts that may affect the economy and the reference sector in the first quarter of 2020 and the following months with a sufficient degree of reliability - also considering the possibility that such emergency may terminate in the following months, depending on the containment measures envisaged by the governments and competent authorities of the countries affected by the spread of the virus.

43
Business outlook
Given the positive results of the main subsidiaries in early months of the year, consolidated performance is expected to be positive this year.This year’s financial position and results of operations will also be affected by financial market trends, whose volatility is also particularly high following the spread of the Coronavirus described above.


2019 consolidated non-financialstatementAzimut Holding S.p.A.

46 G r u p p o A z i m u t

47
Contents
Methodology 46 Azimut group 49 Management report 13Our values 50Business Model 53The Group's Governance 56Business ethics and integrity 57 The group’s sustainability 61The Group’s stakeholders and materiality analysis 62Non-financial risks 67
A sustainable offer 71Products offered 71Azimut Libera Impresa - savings as a driver for SME growth 74Attention to our customers 76
Our people 77The development and growth of our people 88
Our commitment to the community 90Fondazione Azimut 91
Environmental protection 95
Gri index 96

48 G r u p p o A z i m u t
Management reportof the Azimut Group
The Consolidated non-financial statement (the “Statement” or “CNFS”) of the Azimut Group (“Azimut” or the “Group”) has been prepared pursuant to Articles 3 and 4 of Legislative Decree no. 254 of 30 December 2016, as subsequently amended and integrated by the Group. The aim of this document is to provide an understanding of the Group’s organisational model, operations, the main risks and performance indicators in terms of environmental, social and personnel topics as well as respect for human rights and the fight against active and passive corruption which are relevant to the Group’s operations and characteristics during the reporting period (1 January 2019 - 31 December 2019), in line with Article 3 of Legislative Decree no. 254/2016.The reporting scope of the 2019 CNFS has been extended compared to 2018, in order to provide a clear and transparent representation of the economic, social and environmental performance of the entire Group. Therefore, the companies operating in the following countries were included: • China• Chile• Egypt• United Arab Emirates• Hong Kong• Singapore• United States• TaiwanThe reporting scope comprises Azimut Holding S.p.A. and its subsidiaries, consolidated on a line-by-line basis at 31 December 2019, except for SDB Financial Solution SA which, to date, is not integrated into the environmental and human resources data management systems. These restrictions do not affect the presentation of the Group’s results and operations as required by Legislative Decree no. 254/2016. The reporting scope is consistent with the above, unless subject to further restrictions for some data and information, explicitly indicated in the document which, however, do not affect the understanding of the Group’s performance with respect to the topics covered by Legislative Decree no. 254/16. The ownership structure is unchanged in terms of scope and reporting period. This Statement describes the non-financial information that was considered material for the Group, its business model and how it creates and maintains the value generated by its services in the medium and long term. All Corporate functions participated in the process to identify stakeholders, in the definition of material topics and in the drafting of the Statement. The results were consolidated by the relevant internal Work Group and subsequently validated by Top Management.Finally, the information about Fondazione Azimut Onlus, an entity not included in the Group’s consolidation scope, is a quality aspect necessary to understand its focus on the social context in which it operates.
Methodology
49
The data and the information provided cover 2019 (from 1 January to 31 December 2019). In order to provide a comparison and a description of the changes compared to the previous year, 2018 data and information are also provided, where available. Furthermore, in order to correctly represent performance and ensure the reliability of the data, the use of estimates has been limited as much as possible. If present, estimates are based on the best available methodologies and appropriately reported.The Statement has been prepared in accordance with the GRI Sustainability Reporting Standards issued by the GRI – Global Reporting Initiative in 2016. Its content was defined in accordance with the standards on Stakeholder Inclusiveness, Sustainability Context, Materiality and Completeness, and the quality (Balance, Comparability, Accuracy, Timeliness, Clarity and Reliability) of the information about the Group’s non-financial activities in accordance with the GRI Standard 101: Foundation 2016. The document has been prepared in accordance with the "GRI - Referenced claim" option.It has been approved by Azimut Holding S.p.A.’s Board of Directors on 5 March 2020.
EMEA
Amer
icas
Asia
Pa
cific
Azimut Holding(Listed: AZM.IM)
Life insuranceIreland Italy
IrelandSwitzerlandUAELuxembourgMonacoTurkeyEgyptHong KongSingaporeChinaAustraliaBrazilMexico
ItalyTurkeyUAEMonacoSwitzerlandEgypt
TaiwanHong KongAustraliaSingaporeBrazilChileMexicoUSA
ItalyAsset Management Distribution Inv. Banking & Alternative

50 G r u p p o A z i m u t
Management reportof the Azimut Group
In Italy, Azimut Capital Management SGR S.p.A. promotes and manages Italian mutual funds, Italian alternative investment funds and open-ended pension funds, and provides investment portfolio individual management services on behalf of third parties. Azimut Capital Management also distributes the Group’s and third-party’s products through its network of financial advisors, while Azimut Financial Insurance S.p.A. places insurance and banking products. Azimut Libera Impresa SGR S.p.A. specialises in the management of alternative funds for entrepreneurs and SMEs.The main foreign companies are AZ Fund Management SA (founded in Luxembourg in 1999), which manages the umbrella funds AZ Fund 1 and AZ Multi Asset, and the Irish-based AZ Life DAC, which provides life insurance products.
The Group has always operated in accordance with the following values: Fairness, Transparency, Independence, Freedom, Loyalty, Trust, Innovation and Sustainability. These values are set out in the Charter of Values defined by Azimut in 2019 with the aim of disseminating a behavioural model which guides the way each person interacts in the various work situations and encourages a standardised approach to interacting with the Group's various stakeholders. These values guide Azimut's approach to business and facilitate the generation of positive outcomes in terms of sustainable development for the main categories of stakeholders: the People who make up Azimut, its Customers, Shareholders, Local Communities and Suppliers.
FairnessAdequately respond to the expectations and needs of the various types of customers, employees and shareholders by forging a relationship of trust and quality that guarantees mutual satisfaction.Provide working conditions that respect the dignity of the People and that are effective in harnessing the value of human resources and combating all forms of discrimination and cronyism.Adequately respond to the expectations and needs of the various types of Customers, forging a relationship of trust and quality that guarantees mutual satisfaction.Operate in a manner consistent with the expectations of each Shareholder and share strategic business decisions.Establish relations with the principal types of stakeholders within the country to promote and launch initiatives aimed at Local Communities in a non-discriminatory manner.Impartially identify Suppliers and business partners capable of responding adequately to the needs of the Group.
Our values

51
TransparencyPromote a clear and transparent style of communication with all stakeholders to maximise satisfaction, especially among customers. Encourage a collaborative approach to work that fosters continuous learning of People and facilitates the transfer of knowledge, offering clear and shared opportunities for growth and career development.Establish effective channels of communication to guarantee that Customers are provided with clear, timely and complete information on the costs and risks of the products and services offered. Share the Group's financial results and cultural achievements with Shareholders.Share and publicise the initiatives promoted by the Group to stimulate the development of the Local Communities.Adopt clear and transparent Supplier selection systems.
IndependenceServe our customers with the sole purpose of satisfying their savings and investment needs, offering solutions for every situation.Define clear roles and responsibilities for the People of the Group and avoid inappropriate sales pressures.Develop a range of products and services tailored to meet the actual needs of Customers.Foster ongoing relationships with Shareholders without being influenced by them and acknowledging their opinions as an incentive for continuous improvement.Select and establish business relations with Suppliers who share the same values as the Group.
FreedomFoster an environment that is unencumbered by external influences and where everyone is free to communicate and perform their activities while respecting the cultural traditions of the communities in which the Group operates.Encourage dialogue and freedom of opinion between People at work by adopting decision-making processes that enhance the Group's capacity to generate new ideas and proposals.Do business without having to withstand the pressure and establish long-lasting relationships with Customers on equal terms.To be dynamic and enterprising with the autonomy to act that is not affected by any inappropriate influence from Shareholders but that pursues value creation for the Group and its stakeholders as its ultimate goal.Always consider cultural traditions when identifying and implementing initiatives intended to develop Local Communities.

52 G r u p p o A z i m u t
Management reportof the Azimut Group
LoyaltyEnsure that the relationships established are fair and respectful of the interests of all parties involved to create an environment of mutual trust that strengthens the Group's reputation and the long-term sustainability of the business.Foster respect and loyalty in corporate relations both between the People of the Group and external stakeholders.Protect the confidentiality of Customer information. Act for the benefit of the Group and its Shareholders by engaging in behaviours that are consistent with corporate values and professional ethics. Fully implement all the commitments expressed by the Group towards the Community. Promote a collaborative approach with Suppliers to focus efforts on mutual satisfaction and value creation.
TrustEncourage the establishment and preservation of trustworthy relations, both between the people of the Group and in the relations it has with external stakeholders.Care for and respect for People's work regardless of the differences in values and feelings of the individual.Involve Customers in the Group's activities to guarantee relationships based on trust and fostering behaviour which is in line with the Group's reputation.Establish a stable and ongoing relationship of trust with Shareholders. Establish meaningful and collaborative social and cultural relations with the Community thereby strengthening the Group's reputation.
InnovationEncourage the creation of an environment that spurs innovation both in the products offered and in the relevant business processes.Encourage the constant and ongoing improvement and growth in the skills and knowledge of the People.Encourage constant dialogue with Customers to identify and acknowledge innovative proposals and communicate company news to them. Share the driving forces of the market in terms of innovation with Shareholders.Encourage consultation/listening with Suppliers to foster the continuous development of innovative and responsible processes and products.
SustainabilityEncourage the sustainable development of the economy through an investment approach that considers ESG variables.Raise awareness of the Group's People on diversity issues and encourage the spread of a sustainability culture among them.Offer products and services that increasingly consider ESG issues to meet the needs of Customers who are sensitive to these issues. Promote and encourage relations within the social fabric of the Local Communities to create shared value.Favour Suppliers who share the Group's ESG values.Encourage and share strategic decisions with Shareholders who are focused on generating value for the Group over time.

53
A highly integratedbusiness model ensuresa correct assetallocation approach which meets customers’ expectations aboutrisks/returns.
We are totally independent of bank, insurance or industrial groups.This enables us to operate freely.
1,900 people, including management, managers, financial advisors and employees, are long-term shareholders, who focuson creating value for stakeholders.
Our business model isa new reference pointfor the industry, thanksto the launch of innovative funds.
Independence Integrated business model
Alignmentof interests Innovation
The Group operates on the basis of independence, integration, involvement, internationalisation and innovation criteria.
IndependenceAzimut declares itself totally independent from banks, insurance companies or industrial groups, ensuring free operations. With a float equal to approximately 74% of capital, the Group’s Holding company is one of the few real public companies in the Italian stock exchange.
IntegrationThe Group’s core activities (management and distribution) operate in strict synergy to respond in a coordinated manner to customers’ needs. Product design, management and consultancy are part of the same process whose definitive goal is customer satisfaction.
InvolvementMost financial advisors, employees and managers are also the Parent Company’s shareholders, with an investment therein of approximately 21.7% of capital. In accordance with a Shareholders’ Agreement, shareholders/collaborators are fundamental in ensuring the Group’s driving stability and the alignment of interests among all stakeholders. This significant involvement of staff in the control of the companies is rather unique in Italy’s financial sector.
InternationalisationAgain with a view to diversification and development, an expansion strategy began in 2010 in geographical areas which could be of interest in many respects. Azimut identified different geographical areas in order to identify local partners with the same characteristics as the Group (independence, professionalism, expertise) and built a network of companies to place the products of the Parent Company and/or its subsidiaries, while providing the Group with management skills in specific markets.This resulted in a management team made up of 95 managers and analysts, based in 17 countries and 4 continents, therefore active around the clock and able to monitor over 1,300 companies which may become the object of investment. Finally, the average seniority of the team members is 17 years.
The Group was set up and developed based on some distinctive features which contributed significantly to its success.
Business model

54 G r u p p o A z i m u t
BrazilChileMexicoUSA
Asset ManagementDistribution
Ireland ItalyLuxembourgUAEMonacoSwitzerlandTurkey
Australia China Hong KongSingapore Taiwan
Egypt*
Azimut overseas business stands at 28% of Total Assets at Feb 2019
InnovationAzimut’s commitment is characterised by its ability to provide customers with appealing investment instruments not yet available on the market. Over the years, many types of unique funds were launched confirming the Group’s commitment to innovation. Product innovation has always been present in the company’s business, with the launch of several tactical and strategic products which met the needs of different types of domestic and international customers with which the Group interacts. The distribution of the portfolio under management among the products offered on the market shows that they are well received and increasingly raise customers’ interest for new offers.
Management reportof the Azimut Group

55
BrazilChileMexicoUSA
Asset ManagementDistribution
Ireland ItalyLuxembourgUAEMonacoSwitzerlandTurkey
Australia China Hong KongSingapore Taiwan
Egypt*
Italian Equity
Income Dynamic
Conservative
Income
AlternativeCash Global
Unconstrained Bond Fund
Global Infrastructure
Italian Excellence FundsQuant
Funds*
Bond Target
GlobalConservativeAllocation
FundsMarket Neutral
Core Brands
Sustainable Equity Trend
Cat Bond Fund
Eskatos
Plus
Global MacroConservative
RMB Funds
Hybrid BondsSmart RiskPremia Arbitrage
Macro VolatilitySolidity F1 Conservative
Munis YieldF1 Alpha Plus
European Equity
Global Quality
Hig
her R
isk
Innovative
Low
er R
isk
Classic
TrendEuropean Absolute
CEEMEA
CommodityAlpha Commodity Japan
Real Plus
New WorldOpportunities
Turkey
Income Opportunities
Small Cap Europe FoF Global Growth
Global Currencies
Equity OptionsTarget Funds
StrategicTrend
Long/ShortEurope
GlobalIncome
Asia AbsoluteEquity Options
Global Macro
MultistrategyUS ShortTerm Bond
America European Dynamic Sukuk
58% of Azimut’s portfolio is concentrated on the funds launched after 2008, confirming the Group’s ability to meet customers’ expectations.
The Parent Company Azimut Holding S.p.A. has a traditional governance structure which comprises a Shareholders’ Meetings, a Board of Directors (BoD) with administrative functions and a Board of Statutory Auditors with administration controls functions. The Board of Directors has the widest ordinary and extraordinary powers to manage the Company (except for those reserved to the Shareholders as per the law). It comprises 12 members (four women and eight men) appointed by the Shareholders’ Meeting. With respect to the composition of the BoD, the presence of four independent directors is particularly important. This number is in line with the provisions of the Corporate Code of Conduct for Listed Companies.
Note: the graph is only indicative and does not include Funds of Funds and MultiassetsSource: Azimut 31.12.2019
42%
Pre 2008 2008-2013 2013-2019
32%25%
Breakdown of the portfolio under management - investment instruments by year of launch
Summarized Azimutproduct offering
The group’s governance
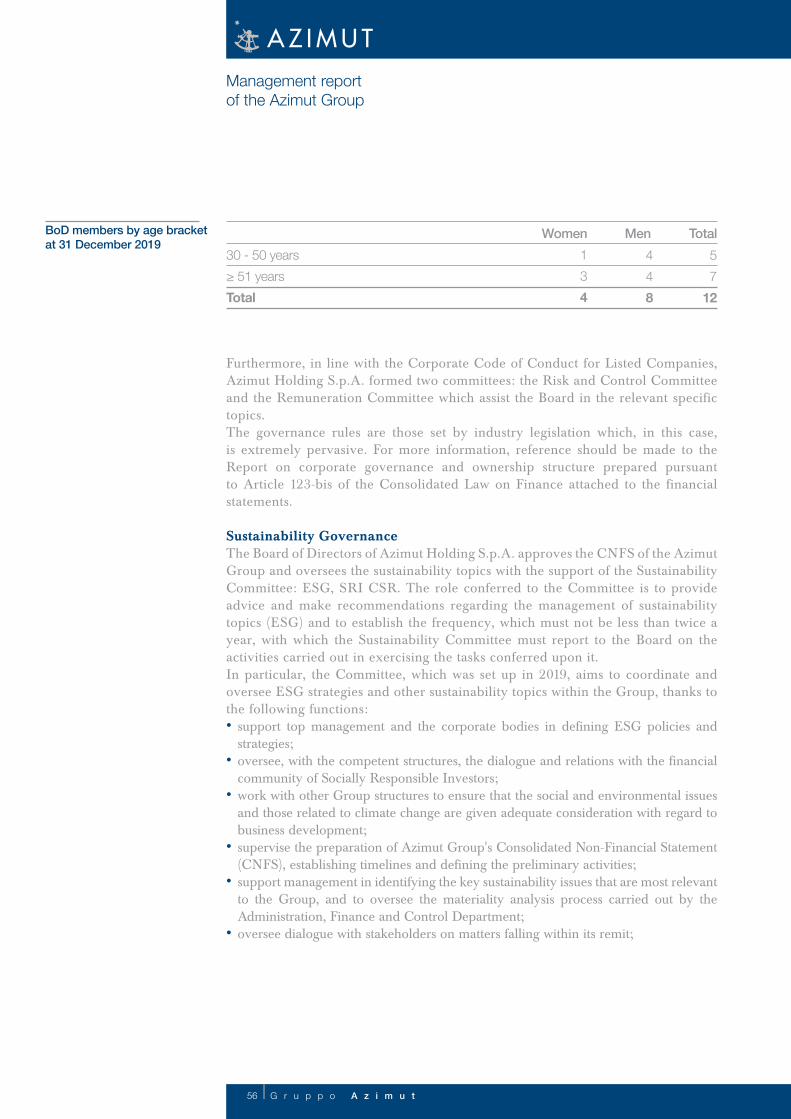
56 G r u p p o A z i m u t
Management reportof the Azimut Group
Furthermore, in line with the Corporate Code of Conduct for Listed Companies, Azimut Holding S.p.A. formed two committees: the Risk and Control Committee and the Remuneration Committee which assist the Board in the relevant specific topics. The governance rules are those set by industry legislation which, in this case, is extremely pervasive. For more information, reference should be made to the Report on corporate governance and ownership structure prepared pursuant to Article 123-bis of the Consolidated Law on Finance attached to the financial statements.
Sustainability GovernanceThe Board of Directors of Azimut Holding S.p.A. approves the CNFS of the Azimut Group and oversees the sustainability topics with the support of the Sustainability Committee: ESG, SRI CSR. The role conferred to the Committee is to provide advice and make recommendations regarding the management of sustainability topics (ESG) and to establish the frequency, which must not be less than twice a year, with which the Sustainability Committee must report to the Board on the activities carried out in exercising the tasks conferred upon it. In particular, the Committee, which was set up in 2019, aims to coordinate and oversee ESG strategies and other sustainability topics within the Group, thanks to the following functions:• support top management and the corporate bodies in defining ESG policies and
strategies; • oversee, with the competent structures, the dialogue and relations with the financial
community of Socially Responsible Investors; • work with other Group structures to ensure that the social and environmental issues
and those related to climate change are given adequate consideration with regard to business development;
• supervise the preparation of Azimut Group's Consolidated Non-Financial Statement (CNFS), establishing timelines and defining the preliminary activities;
• support management in identifying the key sustainability issues that are most relevant to the Group, and to oversee the materiality analysis process carried out by the Administration, Finance and Control Department;
• oversee dialogue with stakeholders on matters falling within its remit;
30 - 50 years≥ 51 yearsTotal
BoD members by age bracketat 31 December 2019
57
12
Total448
Men1 3 4
Women
57
• establish social and environmental guidelines by drawing up multi-year action plans together with the interested structures, as well as, monitoring their implementation;
• support training and communication initiatives on social and environmental matters.A Work Group, cross-functional and transversal with regard to the expertise of its members, provides operational support to the Committee, which is mainly comprised of directors, in defining and developing initiatives and projects. In carrying out its activities, the Work Group, with the approval of the Sustainability Committee: ESG, SRI, CSR, may make use of the direct involvement and/or support of corporate functions that, from time to time, may be functional for performing such activities. Furthermore, Azimut intends to set up a sustainable investment committee in 2020.
With respect to ethics, all personnel (management, middle management, staff and financial advisors) are required to comply with a Code of Ethics posted on the Group's website. Furthermore, some subsidiaries adopt further Codes of Conduct, where necessary and in line with specific business needs and applicable local legislation.The Code of Ethics sets out the general principles which must be complied with by all Group companies’ collaborators in several business areas. The breach of the principles of the Code of Ethics is punished at corporate level regardless of the disciplinary actions taken by the competent supervisory authority and/or the courts.The Code of Ethics sets out the general principles which characterise all Group’s operations, without prejudice to strict compliance with the rules governing the sector. It describes the standards of behaviour in several corporate areas, including human resources and employment policies, conflicts of interest, compliance with operational procedures, safeguarding the company’s assets, the Supervisory Body’s functions, external relationships and, specifically, with the media.The Code of Ethics is binding also for Azimut’s suppliers and outsourcers.The standards of behaviour to be complied with are subsequently analysed in detail in specific codes:• Charter of Values• ESG policy• An Internal code of conduct for employees, collaborators, directors and
statutory auditors• An Internal code of conduct for financial advisors and their collaborators• An AML and combating the financing of terrorism policy• A policy on media relationships• A policy on social media• A policy about the whistleblowing mechanism• A policy about reputational risks
Business ethics and integrity
58 G r u p p o A z i m u t
• A policy on data protection• Directives on information security• A Policy on Market Abuse, Internal and Insider Dealing.
The main aim of these internal documents is to apply the general principles of the Code of Ethics (loyalty, seriousness, honesty, ability, transparency) to specific environments. Each code includes the rules of behaviour applicable to different areas of legislation.Two chapters of the Internal code of conduct for employees, collaborators, directors and statutory auditors, for example, focus on insider dealing and the management of personal transactions. Other provisions prevent potential fraud risks (rules on registrations, proxies, domiciliation and correspondence address) or corruption risks (rules on presents and gifts).The Internal code of conduct for financial advisors and their collaborators describes in detail the rules of conduct applicable to off-premises offer processes, focusing, in particular, on the confidentiality obligations, insider dealing, personal transactions and conflicts of interest. Specific rules are established in terms of proxies, registrations in more than one name and customers’ correspondence address, which are considered hot issues when preventing fraud against customers.The policy on reputational risks is particularly important. Indeed, this aspect is also closely related to the policies on media relationships and social media. In this regard, Azimut has committed to steer the behaviour and act transparently vis-à-vis the employees and financial advisors, to the benefit of the Group and all its stakeholders.Furthermore, Azimut introduced a whistleblowing policy which enables all employees, financial advisors and collaborators to report unlawful behaviour within the Group. In practice, Azimut has provided an IT, web-based tool called Company Protection which enables users to report unlawful behaviour, including anonymously, and allows direct communication through a chat with the Whistleblowing managers. After the reporting, the whistleblower obtains a unique personal code which must be used to receive updates on the reported facts and to provide additional information. The whistleblower is adequately protected, while complying with the rights of defence of the party who allegedly acted unlawfully. At the same time, the Group appointed the Parent Company’s Internal Audit manager and the chairman of the Board of Statutory Auditors as managers of the Whistleblowing unit.There were no reports through the whistleblowing channel in 2019.Finally, during the year, there were no cases of corruption or of non-compliance with environmental and socio-economic laws and regulations or with laws and regulations on product information, labelling and marketing.
Management reportof the Azimut Group

59
Respect for human rightsThe Azimut Group promotes an inclusive corporate culture, which condemns all forms of discrimination and enhances cultural diversities and personal characteristics.According to the Code of Ethics, personnel must be selected “on the principles of equal opportunity and without any discrimination regarding the private life or opinions of the candidates”.In 2019, there were no discrimination events or breach of human rights.
Anti-money Laundering (AML)The Group adopted a policy which sets out the general guidelines and each subsidiary's roles and responsibilities in terms of AML and combating the financing of terrorism.The AML department centrally supervises the operations of the functions in charge of this activity, checking the operations of each company, including through periodic inspections to check compliance with the guidelines and the company policy.The functions in charge of anti-money laundering controls in each Group company report to the central manager every quarter. The central manager, in turn, assesses the reliability, suitability and awareness of each entity in dealing with the AML risk and combating the financing of terrorism. The results of the assessment are subsequently sent to the Parent Company's Board of Statutory Auditors, the Risk and Control Committee and the Board of Directors.Reference should be made to the Management Report for additional information about the organisational model adopted by the Group in respect of AML issues.
Privacy Given the sensitivity of the issue (customers’ savings), the Group adopted a data protection policy which covers all customers’ information. Customers are provided with all information about the processing of their data before signing a contract and, where permitted by law, they must give their consent to data processing.Furthermore, specific data processing training courses are provided to both employees and financial advisors.Azimut avails itself of an international company for the certification of privacy-related issues and in the event of relevant new risk management initiatives should weaknesses related to the General Data Protection Regulation (GDPR) - Regulation (EU) 2016/679, which came into force in Italy on 25 May 2018, be identified.The Group’s foreign units adopted privacy policies in line with the relevant regulations in force in each country.In 2019, there were no privacy infringements.

60 G r u p p o A z i m u t
2. The group’s sustainability
The Group operates in compliance with the principles of environmental, social and governance (ESG) sustainability. In order to highlight this approach, the Group’s ESG Policy is designed to identify, assess and manage ESG factors, which may involve both risks and opportunities, in the pursuit of corporate goals. The ESG principles outlined in this Policy are inextricably linked to the underlying criteria of independence, integration, participation, internationalisation and innovation, which have historically played a fundamental role in the Group's success.Azimut has always been committed to being involved in the local communities of the countries in which it operates with the goal of having a positive impact on the real economy. In November 2019, Azimut announced its new sustainable investment strategy, unveiling a plan that places it among the main European players in complying with ESG principles and makes it Italy’s manager with the largest assets dedicated to ESG investments (at the end of 2019, they amounted to about 9 billion euro) and to small and medium-sized Italian companies (about 10 billion euro through Azimut Libera Impresa by 2024).Furthermore, in 2020, Azimut intends to launch a 100% ESG line of funds, by creating the Azimut Sustainable brand. In line with its strategy, Azimut has voluntarily decided to adhere to the Principles for Responsible Investment (PRI), a set of investment principles that promote a series of actions to incorporate ESG issues into investment practices and enrich the information provided to investors on this topic. Furthermore, to monitor and mitigate its environmental impact and analyse the related risks and opportunities, in 2019, Azimut became a signatory of the CDP (formerly the Carbon Disclosure Project) with the status of investor signatory and, in 2020, it will participate in the completion of the climate change questionnaire. Thanks to these commitments with the CDP, a non-profit association that offers companies and countries a system to measure, detect, manage and share information on climate change globally, the Group will become increasingly aware of how it directly and indirectly impacts the environment and will better understand the repercussions of climate change on the current and future business model. Finally, through Azimut Capital Management, the Group is a member of the Forum for Sustainable Finance, a non-profit association that brings together financial operators and other organisations interested in the environmental and social impact of investments. Through its membership, Azimut seeks to highlight its interest and commitment to sustainable investment, with the goal of integrating environmental, social and governance criteria into its financial products and processes.

61
The main stakeholders were identified by assessing the importance of each category for the Group's business, based on a judgement (which derives from experience) about the term and the stability of the relationship with the stakeholders.Other important stakeholders, such as suppliers and outsourcers, have not been included in the stakeholders’ list since they are selected from time to time based on current needs and using specific procedures. Furthermore, their activities are governed and monitored by specific contractual arrangements.
As part of its activities, the Group interacts with a series of internal and external stakeholders who are subject to specific relationship guidelines. The dialogue with stakeholders is extremely important since the services offered (asset management) is intangible on the one hand, and totally relevant to customers and the community on the other.Azimut Group's stakeholder map is given below:
Financial community/Shareholderswith whom the company maintainsa continuous dialogue to createmedium/long-term value
Institutions andregulatorswhich carry outsupervisory activitiesand regulate theindustry in which the company operates
Employeeswho, based on their employment contract, work for the company
Financial advisorswho provide third parties with consultancies on financial instruments on behalf of the company
Customersto whom the company offers diversified investment solutions which meet different needs
Local communitiesinvolved in social and cultural environments with which the company interacts as part of its operations
The group’s stakeholders and materiality analysis

62 G r u p p o A z i m u t
This category includes all parties to which the Company offers investment solutions and ongoing consultancies to manage the investment portfolio.
RelationshipCustomers are assisted by financial advisors based on a customised relationship and ongoing support. Every day, through the company intranet site, Azimut Capital Management SGR S.p.A. provides the financial advisors with documents and information which may be used to support customer relationships. Furthermore, Azimut’s customers can also access directly via the web the data about their investments and assess over time the characteristics of the products acquired, the returns and the market risk to which they are exposed.
This category includes all parties providing financial instrument consultancy services to third parties on behalf of the Company. They enter into an agency contract with Azimut Capital Management SGR S.p.A..
RelationshipFinancial advisors are carefully selected as they represent the Group before customers. They are constantly updated about the markets through a dedicated intranet site. They also benefit from a company TV which broadcasts interviews and communications about the investment sector. All financial advisors participate in an annual meeting and in specific meetings throughout the year, divided by area groups or categories. Considerable attention is given to the possibilities for regular opinion exchanges in order to monitor the level of satisfaction of these stakeholders. .
Azimut places humans at the heart of its system. Regardless of their level, the Group companies’ employees are carefully selected and assisted throughout their career path. At 31 December 2019, the Group had 1,010 employees (to the extent of the scope considered). This figure includes financial advisors with a relationship of employment in the country in which they operate, but does not include 1,929 financial advisors operating in Italy, who are not employees.
Customers
Financial advisors
Employees
Management reportof the Azimut Group

63
RelationshipInternal communication is fundamental to promoting the involvement of employees and collaborators. Employees receive the main information about employee benefits and the company through a dedicated intranet site and may also access a detailed daily press review which, in addition to Azimut’s news on digital and print media, covers the main issues of the financial market, focusing, in particular, on the assets under management industry.Italian and foreign employees also receive by e-mail financial press releases from the Corporate Communications department, covering, for example, acquisitions, monthly inflows, consolidated results and significant events, as well as the main communications, including the message of the Group’s CEO.
The parties with whom the Company creates a continued dialogue to create value in the medium/long-term.
RelationshipInvestor Relations’ and Media Relations’ activities are entirely focused on providing the financial community and shareholders with information about the Holding Company and the Group. In 2019, 43 press releases were published, covering the monthly performance of inflows, the news for the Group and periodic financial reporting. Institutional shareholders, analysts and potential investors participate in periodic meetings held through the internet and specific road shows on invitation. In 2019, 150 conference calls were held with analysts and institutional investors, and over 100 direct meetings were held in the world’s main financial centres, specifically in Northern America and Northern Europe.
The parties which perform representation, supervisory and regulatory activities in the industry in which the company operates.
Luxembourg 3%
Mexico 9%
Monaco 3%
Singapore 2%
Switzerland 3%
Taiwan 2%
Turkey 4%
USA 0%
Australia 40%
Brazil 11%
Chile 0%
China 2%
Ireland 2%
Italy 15%
Egypt 2%
United Arab Emirates 2%
Employees by country at 31 December 2019
Financial community/shareholders
Institutions and regulators

64 G r u p p o A z i m u t
RelationshipAzimut has regular contacts with the supervisory authorities of all the countries in which the Group operates, without prejudice to compliance with regulatory obligations. In Italy, where the Group has been operating for a long time, Azimut Capital Management SGR S.p.A. actively participates in the initiatives launched by industry associations (Assogestioni and Assoreti) and the financial advisors are members of the Anasf trade association, in which they hold management positions in elective bodies.
The parties involved in social and cultural situations with whom the company interacts while performing its activities.
RelationshipThe widespread presence of financial advisors and customers in the local areas creates and strengthens relationships with local communities (associations, bodies representing the interests of the local social context) which result, above all, in the organisation of meetings which mainly provide training and information about financial market-related issues, savings and investments.The participation in local life supports cultural and sports initiatives. Fondazione Azimut’s activities, which are clearly separated from the Group’s business, focus on poverty and social exclusion issues and inevitably entail interacting with the local institutions which pursue the same goals (church or municipal bodies).In 2017, the Group carried out its first materiality analysis to identify the material non-financial issues based on a process which entails the following stages: 1. mapping of stakeholders: identification of the parties that influence and are influenced
by the Company, considering the reference industry, the practices in place among peers and competitors, and the Group’s business model and characteristics;
2. identifying economic, environmental and social sustainability topics which may be potentially relevant to the Group's business and its stakeholders;
3. management's assessment and validation of the potentially material non-financial topics;
4. validation of the analysis carried out with top management.The process made it possible to identify the factors which have a significant impact on the organisation and which considerably influence the Group's ability to create value in the short, medium and long-term, and a list of material non-financial topics.Since Azimut operates in a dynamic context subject to rapid changes and in line with the Group's growing commitment to ESG issues, the materiality analysis was updated for the purposes of preparing the 2019 CNFS. This analysis led to the integration of the material issues already identified with those related to climate change and respect for diversity. With respect to the latter, the Group, given the importance that emerged from both external stakeholders and the Company, decided to include it separately within the material topics for 2019.
Community
Management reportof the Azimut Group

65
Scope of the DecreeFight against active and passive corruption
Employee-related topics
Social-related topics
• Institutions and regulators• Financial community/ shareholders• Employees• Financial advisors
• Community• Customers
• Business ethics, anti-money laundering and fight against corruption
• Human capital management and development
• Financial advisors’ training and network management
• Diversity and inclusion• Product portfolio innovation • Customer satisfaction• Financial education and
development of local communities
• Responsible marketing and transparent communication
They are listed below as follows:• Business ethics, anti-money laundering and fight against corruption• Human capital management and development• Financial advisors’ training and network management• Product portfolio innovation• Customer satisfaction• Financial education and development of local communities• Climate change and management of environmental resources• Respect for human rights • Responsible marketing and transparent communication• Diversity and inclusionThe relationship between Azimut’s material non-financial topics, the scope of the Decree and the stakeholders involved are described below:
Material topic for Azimut Stakeholders involved
Respect for human rights
Environmental-related topics
• Community• Customers• Employees• Financial advisors• Community• Customers
• Respect for human rights
• Climate change and management of environmental resources
Some topics covered by the Statement have been part of Azimut’s distinctive features well before the implementation of the regulatory reporting obligation. The focus on employees’ and advisors’ involvement in company management resulted, for example, in a broad shareholder base since the set-up of the network comprised of regional stock brokerage companies (SIM) (1989) and in the subsequent management buy-out (2001) which led to the flotation in 2004. Employees, managers and financial advisors have been and remain a significant part of the shareholder base and are unique in this industry.

66 G r u p p o A z i m u t
An operation to strengthen the shareholder base of employees, managers and financial advisors was launched in June 2018 which also enables the employees who joined the Group after the first management buy-out to participate in the Shareholders’ Agreement. As a result, 1,206 shareholders participating in the Shareholders’ Agreement acquired approximately 7 million Azimut Holding ordinary shares, equal to 5.0% of share capital.
The Azimut Group has in place a risk management system which identifies, assesses and controls the risks to which it is exposed in all areas of activity. The risks identified are regularly monitored to ensure ongoing operations and the achievement of corporate goals. For additional information about the risk and internal control management structure adopted by the Group, reference should be made to the Report on corporate governance and ownership structure prepared pursuant to Article 123-bis of the Consolidated Law on Finance. For additional information about the main risks identified and how they are monitored, reference should be made to the “Key risks and uncertainties” section of the Management Report.Azimut Holding S.p.A. has recently strengthened its governance system by introducing the Operational & Reputational Risk Management function alongside the Risk Management department.The control process over operational risks relies on a monitoring cyclical pattern based on:• Risk identification;• Risk assessment and measurement;• Control implementation.Which entails the following:• Determining the acceptable level of risk; • Risk mitigation and management;• Transfer of risk (where possible).
Management reportof the Azimut Group
Non-financial risks

67
Risks and related event types are mapped for all business areas in accordance with the Basel II framework, analysing, for each process and activity, the procedures in place and performing assessments with the managers.
Identification and assessmentof operational risksand controls
Map of processesMacro-objectives: Promotion, Management, Steering, Administration, Legal, etc.
Analysis of activitiesReference process,description, inputs, outputs, responsibilities, referenceproduct, outsourcing
Association of proceduresScope of the activitiesPlayers involvedMethodologyLine controls IT tools usedReference legislation
Risks analysed Related event types
Process analysisActivities, responsibilities,time cycles, information flows, decision-making
Human Resources Internal offences
External offences
Personnel relationship and safety at workProcesses
Systems
External events
Customers, products and operational procedures
Disasters and other events
Technological systems and public utility services
Process execution, delivery and management
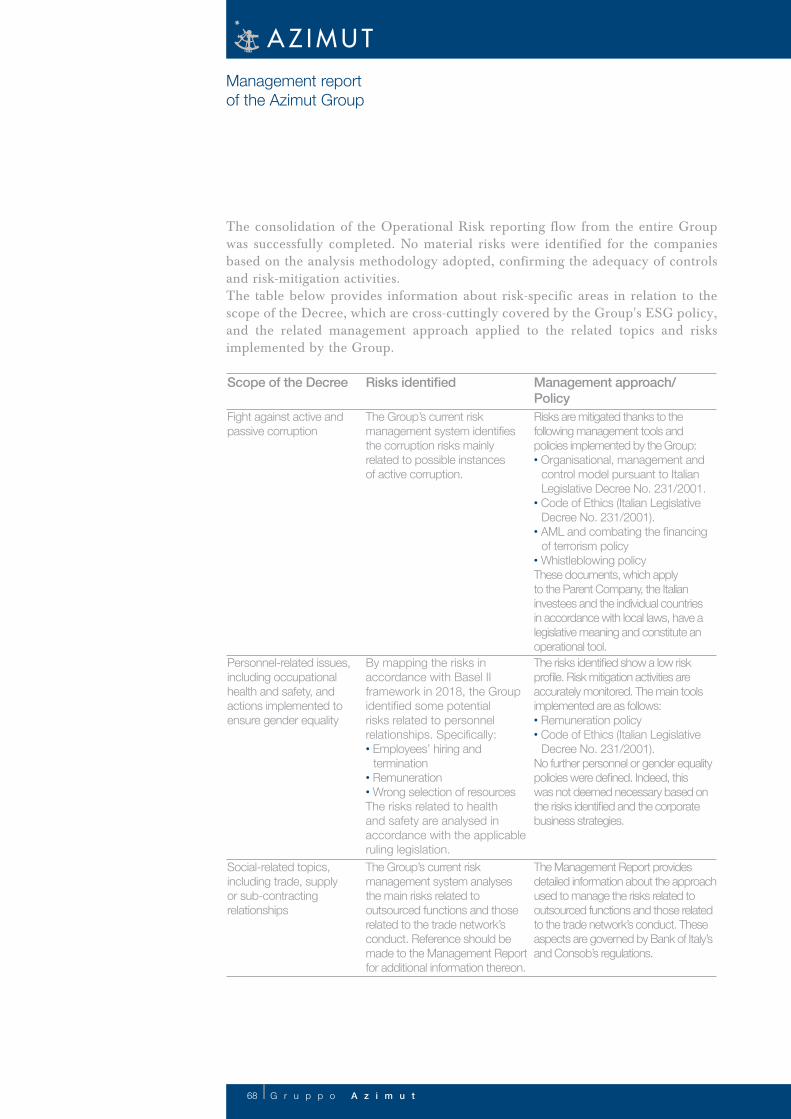
68 G r u p p o A z i m u t
Risks are mitigated thanks to the following management tools and policies implemented by the Group:• Organisational, management and
control model pursuant to Italian Legislative Decree No. 231/2001.
• Code of Ethics (Italian Legislative Decree No. 231/2001).
• AML and combating the financing of terrorism policy
• Whistleblowing policyThese documents, which apply to the Parent Company, the Italian investees and the individual countries in accordance with local laws, have a legislative meaning and constitute an operational tool. The risks identified show a low risk profile. Risk mitigation activities are accurately monitored. The main tools implemented are as follows:• Remuneration policy• Code of Ethics (Italian Legislative
Decree No. 231/2001).No further personnel or gender equality policies were defined. Indeed, this was not deemed necessary based on the risks identified and the corporate business strategies.
The Management Report provides detailed information about the approach used to manage the risks related to outsourced functions and those related to the trade network’s conduct. These aspects are governed by Bank of Italy’s and Consob’s regulations.
Management reportof the Azimut Group
The consolidation of the Operational Risk reporting flow from the entire Group was successfully completed. No material risks were identified for the companies based on the analysis methodology adopted, confirming the adequacy of controls and risk-mitigation activities.The table below provides information about risk-specific areas in relation to the scope of the Decree, which are cross-cuttingly covered by the Group's ESG policy, and the related management approach applied to the related topics and risks implemented by the Group.
Scope of the Decree
Fight against active andpassive corruption
Personnel-related issues, including occupational health and safety, and actions implemented to ensure gender equality
Social-related topics, including trade, supply or sub-contracting relationships
The Group’s current risk management system identifies the corruption risks mainly related to possible instancesof active corruption.
By mapping the risks in accordance with Basel II framework in 2018, the Group identified some potential risks related to personnel relationships. Specifically:• Employees’ hiring and
termination• Remuneration• Wrong selection of resources The risks related to health and safety are analysed in accordance with the applicable ruling legislation.The Group’s current risk management system analyses the main risks related to outsourced functions and those related to the trade network’s conduct. Reference should be made to the Management Report for additional information thereon.
Risks identified Management approach/Policy
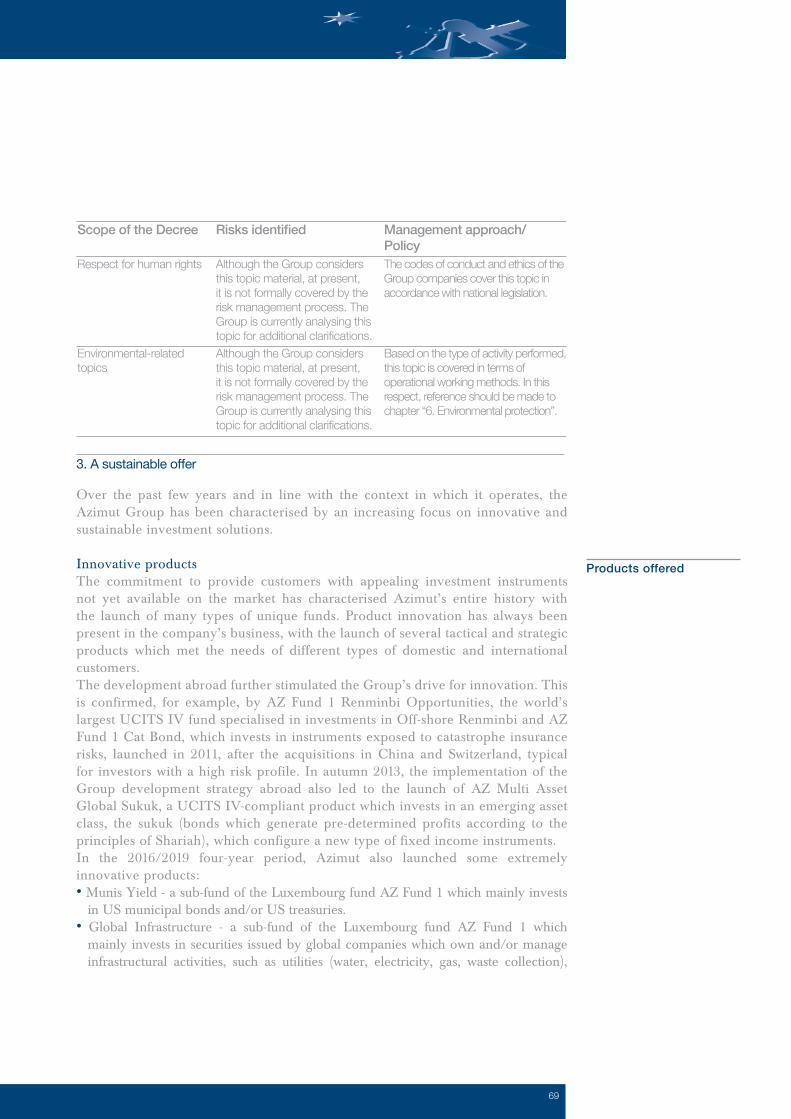
69
The codes of conduct and ethics of the Group companies cover this topic in accordance with national legislation.
Based on the type of activity performed, this topic is covered in terms of operational working methods. In this respect, reference should be made to chapter “6. Environmental protection”.
Scope of the Decree
Respect for human rights
Environmental-relatedtopics
Although the Group considers this topic material, at present, it is not formally covered by the risk management process. The Group is currently analysing this topic for additional clarifications.Although the Group considers this topic material, at present, it is not formally covered by the risk management process. The Group is currently analysing this topic for additional clarifications.
Risks identified Management approach/Policy
3. A sustainable offer
Over the past few years and in line with the context in which it operates, the Azimut Group has been characterised by an increasing focus on innovative and sustainable investment solutions.
Innovative productsThe commitment to provide customers with appealing investment instruments not yet available on the market has characterised Azimut’s entire history with the launch of many types of unique funds. Product innovation has always been present in the company’s business, with the launch of several tactical and strategic products which met the needs of different types of domestic and international customers.The development abroad further stimulated the Group’s drive for innovation. This is confirmed, for example, by AZ Fund 1 Renminbi Opportunities, the world’s largest UCITS IV fund specialised in investments in Off-shore Renminbi and AZ Fund 1 Cat Bond, which invests in instruments exposed to catastrophe insurance risks, launched in 2011, after the acquisitions in China and Switzerland, typical for investors with a high risk profile. In autumn 2013, the implementation of the Group development strategy abroad also led to the launch of AZ Multi Asset Global Sukuk, a UCITS IV-compliant product which invests in an emerging asset class, the sukuk (bonds which generate pre-determined profits according to the principles of Shariah), which configure a new type of fixed income instruments.In the 2016/2019 four-year period, Azimut also launched some extremely innovative products:• Munis Yield - a sub-fund of the Luxembourg fund AZ Fund 1 which mainly invests
in US municipal bonds and/or US treasuries.• Global Infrastructure - a sub-fund of the Luxembourg fund AZ Fund 1 which
mainly invests in securities issued by global companies which own and/or manage infrastructural activities, such as utilities (water, electricity, gas, waste collection),
Products offered

70 G r u p p o A z i m u t
transport and storage of raw materials, toll roads, airports, telecommunications, ports, railway networks and other socio-economic infrastructures. This instrument provides individual savers with a type of management that is usually reserved to institutional investors.
• Azimut Private Debt Fund – this closed-end investment fund was launched in 2018. It has a recommended duration of seven years and invests in financial instruments related to loans to businesses. This instrument provides savers with a type of investment that is usually reserved to institutional investors.
• New World Opportunities and Income Opportunities – equity and bond sub-funds of AZ Fund whose objective is medium and long term capital growth through the active management of a portfolio of securities issued by companies or governments around the world. The sub-funds offer an absolutely innovative model in terms of management, leveraging on the specific global expertise developed over time by the various management companies belonging to the Azimut Group.
• DEMOS I - the first closed-end private equity fund created for the retail sector thanks to Azimut Libera Impresa’s expertise and continuous search for financial innovation. A real democratisation of the investment strategy, designed to enable even small investors to access opportunities which, to date, have been reserved only for institutional investors and contribute, together with companies, to the development of the real economy. The aim of the fund is to increase the value of the capital raised over time by achieving yields higher than those of investments characterised by lower risk and greater liquidity.
• Global Invest - first global private equity fund of funds set up by Azimut with sub-advisory agreement in favour of Hamilton Lane, one of the world's leading players specialising in alternative fund management.
Sustainable productsThe Group's product policy places a strong emphasis on complying with the sustainability principles of the decisions underlying the construction of investment portfolios. Sustainable investment principles are defined as investments in economic activities that contribute to environmental and social objectives or investments in companies that pursue appropriate corporate governance and organisational policies. In 2019, the Luxembourg-based Group company confirmed its sustainable products AZ Multi Asset - Sustainable Equity Trend, AZ Multi Asset - Sustainable Hybrid Bond and launched the new fund of funds AZ Fund 1 Equity Global ESG. Furthermore, new sustainable investments are expected to be launched in 2020 with a particular focus on theme-based investments for the first time.Equity Global ESG is a sub-fund of AZ Fund whose aim is to select investment funds with a global/regional focus that meet ESG criteria, in order to provide investors with access to the best global expertise. The innovative approach to investments combines the natural objectives of financial results with the concurrent achievement of a positive impact from an environmental, social and corporate governance point of view, by investing in financial instruments issued by companies that meet these criteria.

71
AZ Multi Asset - Sustainable Equity Trend and AZ Multi Asset - Sustainable Hybrid Bond are two sub-funds of the AZ Multi Asset mutual fund, with an investment policy focused on issuers adopting the ESG sustainability standards. AZ Multi Asset - Sustainable Equity Trend combines security selection with analysis based on ESG sustainability criteria while AZ Multi Asset - Sustainable Hybrid Bonds fund (previously active abroad) invests in hybrid/subordinated and/or perpetual bonds, issued by issuers which comply with ESG criteria. With respect to these sub-funds, AZ Fund Management’s investment process provides for the identification (assisted by Vontobel AM acting as the advisor) of a basket of ESG sustainable equities, followed by the manager's selection of those to be invested in. In other cases, the manager chooses the financial instrument to be included in the sub-fund’s portfolio and subsequently asks the advisor to check the sustainability of the investment, using ESG criteria. In February 2020, AZ Multi Asset - Sustainable Equity Trend was merged into AZ Fund - AZ Equity - Global ESG and the AZ Bond - Sustainable Hybrid sub-fund changed from AZ Multi Asset Fund to AZ Fund 1.In 2019, Azimut declared its intention to invest 7 billion euro (around 30% of the funds managed by AZ Fund Management) in companies and assets with a sustainability rating of at least BBB, calculated on the basis of MSCI's ESG research data. At the end of 2019, these investments amounted to 9 billion euro, represented by about 20 funds, thereby exceeding the target set. For these portfolios, the investment process involves the identification of a basket of "sustainable ESG" securities and, subsequently, the selection of the securities to be invested in by the asset management company. The Group develops an internal ESG score to build portfolios with an ESG rating, calculated using the criteria established by the research company MSCI, that is at least equal to or better than "BBB".
Furthermore, from 2019, every six months, Azimut is awarded an ESG rating by Vigeo Eiris on 27 product sub-funds, 15 of which belong to the Azimut Sustainable range, and on about ten institutional mandates. Vigeo Eiris is a rating and research agency specialising in sustainability.
EQUITIESGLOBAL GROWTH SELECTOR HYBRID BONDS CORE BRANDS
GLOBAL INFRASTRUCTURE SUSTAINABLE HYBRID BONDS DIVIDEND PREMIUM
AMERICAN TREND SOLIDITY EUROPEAN DYNAMIC
EUROPEAN TREND CGM OPPORTUNISTIC CORP BOND FORMULA MACRO DYNAMIC TRADING
AZ EQUITY GLOBAL ESG CGM OPPORTUNISTIC USD CORP BOND STRATEGIC TREND
FORMULA 1 ABSOLUTE US INCOME TOP RATING
RIN G.A.M.E.S.
TREND
BONDS ALLOCATION/BALANCED

72 G r u p p o A z i m u t
By announcing the set up, in 2020, of Azimut Sustainable, the new range of sustainable products, the Group launches an ESG investment offer unique in Italy in terms of product variety and quantity of dedicated resources. This new line of funds is based on the respect of sustainability principles in the construction of investment portfolios that contribute to environmental and social objectives or investments in companies that pursue appropriate corporate governance and organisational policies. Within its ESG policy, the Group's sustainable product policy can be seen through its structured approach which uses various management development techniques: • Exclusion: negative screening based on pre-defined investment rules that excludes
companies whose controversial activities are the core business or whose related risks are not mitigated by management;
• Best in class: positive screening for companies that are leaders in sustainable development;
• ESG integration: integration of ESG factors in the construction of portfolios with particular attention given to achieving a sustainable balance due to the complexity of the portfolios' investments;
• Sustainability themed and Impact investing: themed and impact-oriented investments where investors sacrifice part of their potential return for support and impact in achieving ESG objectives.
In order to further strengthen the ESG product range, the Group intends to create a full SRI line and theme-based investments in June 2020.
Products for social purposesAzimut has always had a social focus: indeed, it was one of the first asset management companies to launch a fund on the Italian market which allocated the returns of the invested money to the humanitarian organisations selected by customers (1995 Fondo Azimut Solidarietà). Today, this opportunity is extended to the investors of the AZ Fund Equity Global ESG. Again in respect of investments which consider the environmental and social impact, the initiative launched by the Group in Brazil, where the AZ Quest Azimut Impacto fund was launched, continued. The fund finances social initiatives (environment, education, development of communities’ health care) using 30% of the management fees received. AZ Quest Azimut Impacto is the first instrument launched in Brazil available to retail investors who intend to participate in initiatives with a social impact.
Azimut strongly believes that personal savings can be the driving force behind the development of small and medium-sized enterprises, which are the economic and also social backbone of our country.Therefore, Azimut Libera Impresa is an integrated platform of products and services intended for entrepreneurs/SMEs on the one hand, and investors/savers
Azimut Libera Impresa - savings as a driver forSME growth

73
on the other. Its objective is to encourage the injection of liquidity into the real economy to stimulate growth and make it sustainable over time while offering returns and value creation to savers/investors.At the end of 2019, Azimut also announced the set up of a new real estate and infrastructure division, which will enable the Group to begin operations in property investments, focusing also on social infrastructure.Azimut's challenge is therefore not limited solely to investments in equity or debt. Azimut is committed to supporting entrepreneurs and management in implementing business strategies aimed at:• Encouraging internationalisation by leveraging the Made in Italy brand• Managing generational transitions• Strengthening the management structure / corporate governance• Stimulating growth through acquisitions ("buy and build")• Improving the organisation and business processesThis platform, which is also available to retail investors, is an excellent opportunity for the democratisation of investments in asset classes that have historically been restricted to institutional investors. Investing in the real economy makes it possible to tap into the rich productive landscape of Italian enterprises/initiatives characterised by strong business skills, high rates of growth and innovation with some specific advantages such as the decorrelation of the value of private markets from the performance of listed financial markets and an increasingly favourable regulatory environment, the adoption of expansive tax policies and the increased transparency of unlisted assets.In 2019, there were many innovations aimed at strengthening the Group's commitment to offering its customers alternative investments, in particular:• the launch of the new ITALIA 500 fund, created in collaboration with P101, focused
on investments in startups and innovative SMEs and which is currently being authorised by the competent authorities. After operating for five years in the world of startups with SiamoSoci and Mamacrowd, and in venture capital in Italy through the partnership with P101 Sgr, Azimut strengthens its collaboration by launching the new closed-end non-reserved alternative investment fund with 40 million euro in inflow target and a minimum subscription amount of 5 thousand euro. The target companies are startups with turnover of up to 5 million euro and SMEs based mainly in Italy, operating on technologies, products and/or services related to industrial and digital sectors, with turnover of between 5 and 50 million euro. The fund has a ten year duration;
• partnership with the Gellify B2B innovation platform: the asset management group has participated as lead investor in a 15 million euro financing round in the platform that selects, invests and grows innovative startups in the digital sector and connects them with established companies with a view to open innovation;
• launch of an agreement with London-based fintech Wiserfunding which, based on a proprietary algorithm, is revolutionising the world of credit risk assessment for
74 G r u p p o A z i m u t
SMEs. Today, Wiserfunding operates throughout Europe using a highly advanced technology that, starting from the legacy of the world's first and most famous scoring model (Z-Score), has developed specific models for SMEs applying the most sophisticated artificial intelligence technologies to automate and standardise as much as possible the credit risk assessment process of SMEs. The Azimut Group will be able to offer this service that replicates the rating agencies' process in an automated manner to Italian companies on an exclusive basis.
Furthermore, confirming the growing commitment to ESG issues, the majority of investments in Azimut Libera Impresa funds apply an exclusion approach to companies that manifestly do not guarantee respect for human rights in the conduct of their business and that produce or market, for example:• tobacco;• pornographic material;• weapons or armaments (including parts thereof exclusively intended for their use);• electronic solutions or programs that are specifically designed to allow illegal: (i)
access to electronic networks, (ii) downloading of data in electronic format; • research, development and technical application in relation to human cloning; • research, development and technical application in relation to genetically modified
organisms; • casino and similar activities; • gaming and betting or the production or marketing of related products; • buying gold and retail trading of precious metals. Furthermore, during the year, Azimut also began developing a fund which, in addition to excluding certain companies from the investment universe, integrates sustainability and responsibility factors into its management strategy by incorporating them into the investment process and selection. For example, the parameters under consideration include environmental, social and governance criteria. With respect to the offer of property and infrastructure for 2020, investments are planned in a closed-end fund aimed at maximising the net results to be distributed among the participants, while generating a positive social and/or environmental impact that is measurable and favourable. These objectives will be pursued both by optimising returns, i.e., by selling the assets acquired by the fund, even after their valuation, and by allocating the invested assets to the development of initiatives with ex ante identifiable and ex post measurable social returns. In implementing its investment policy, the fund will pursue the goals of sustainability and responsibility in investments, in line with the main industry standards and, in particular, the ESG principles.

75
Customers are the Group’s main asset. Efforts are all for customers, in terms of both management (performance, innovation and product range) and consultancies (long-term tailor-made support by experienced professionals).Customers’ growth and loyalty are the Group’s common goals, at all levels. Customer satisfaction is monitored above all by analysing data (investments/divestments) for each customer, by number and type of complaint.In 2019, complaints from Italian customers (the main group in quantitative terms) totalled 169. Complaints accounted for approximately 0.8 out of a thousand customers.Furthermore, the Internal Audit function checked Italian customers’ degree of satisfaction through a specific questionnaire, to the extent of the Italian companies of the Group. According to this project, called "Customer Satisfaction", an area manager, in collaboration with a reference advisor, visits a customer and invites him/her to fill in a questionnaire which measures the degree of satisfaction and checks that the financial advisor did not engage in any non-compliant behaviour. In 2019, the questionnaire was sent to a sample of customers in the various commercial areas. Of the 1,293 customers who replied to the questionnaire, 53.4% was extremely satisfied of the relationship with Azimut, 42.2% was satisfied, 3.9% was rather satisfied and only 0.5% was rather dissatisfied.
Responsible marketing and transparent communicationAzimut strictly adheres to sector legislation on information and promotional communications and, during the three-year period, did not receive any objection from the supervisory body.Transparent communication to the public and customers, beyond legal obligations, is an essential element when developing long-term successful customer relationships.Every month, through the intranet, financial advisors receive a series of information sheets about each product managed by the group which describe the performance, the portfolio and volatility. The financial advisors use these sheets to assist customers.
4. Our people
Management quality, transparent and effective communication to the market, the accuracy of the support provided to financial advisors and the service provided to customers are fundamental to business stability and growth. People who, in the various functions and in all geographical areas, work to achieve these results are committed to ongoing assessment and enhancement. At the end of 2019, the Group's workforce consisted of 1,010 employees and 1,929 financial advisors.
Attention to ourcustomers

76 G r u p p o A z i m u t
ItalyAustraliaBrazilChileChina Hong KongChina ShanghaiEgyptUnited Arab EmiratesIrelandLuxembourgMexicoPrincipality of MonacoSingaporeSwitzerlandTaiwanTurkeyThe USATotal
Employees
Despite the still considerable importance of employees in Italy, where the Group has been active for almost 30 years, and in Europe, where the development in Luxembourg and Ireland began 10 years ago, the number of employees in other countries and continents is growing rapidly as a consequence of the internationalisation effort. Placement systems for asset management services have different organisational structures in the various geographical areas. In Italy, placement is the responsibility of personnel other than employees, i.e., authorised off-premises financial advisors, while in some countries it is the responsibility of employees. This explains, for example, the high number of employees in Australia (400). Indeed, this figure includes both the employees holding management/administrative/organisational roles, and those acting as advisors and focused on customer relationships.
Employees by country and gender2
8618135
-----24
386-9-
21-
382
62219441532625
397
121016 25
0 458
11514465
-----
13215627
-21
-12
-474
9418166345
2110142547259
228
144
552
201325100
-----
15259433
-30
-33
-856
156400110
498
231616308632213224394
1,010
31/12/201831/12/2019
WomenWomen MenMen TotalTotal
Management reportof the Azimut Group
2 The increase in the total number of employees at 31 December 2019 compared to the previous year also takes into account the expansion of the reporting scope as described in the section “Methodology".

77
1952
311382
19 58
381 458
101125248474
125130297552
120177559856
144 188 678
1,010
20182019
WomenWomen MenMen TotalTotal
Employees by position and gender
Top Management/DirectorsMiddle ManagementStaffTotal
The balance of middle and top management (approximately 33% of the total at year end) reveals the Group’s commitment to select skilled professionals and is also the result of the decision to outsource a series of back-office activities to specialist companies which perform these activities with considerable expertise and significant economies of scale.The breakdown by position and gender in the various countries shows that Italy’s gender balance is greater than in other countries, although, for some countries, the small numbers make the comparison of little significance.Furthermore, the feasibility study of smart working mechanisms which reconcile private and work life continued.
The breakdown of employees by age bracket is relevant for the purposes of growth outlook (employees below 29), compared to long-standing presence (30-50 years old) and expected generational turnover (over 51).
Employees by age bracket and position
473595
177
6137
118216
120177599856
144188678
1,010
Top ManagementMiddle ManagementStaffTotal
20182019
73139318530
83146392621
03
146149
05
168173
≤ 29 years≤ 29 years 30-50 years
30-50 years
≥ 51years
≥ 51years
TotalTotal

78 G r u p p o A z i m u t
434 24
458
Most employees (96%) are offered an open-ended contract. Furthermore, 91% of employees have full time contracts; part-time contracts account for 9% and mainly relate to women3, following their request during particular periods of time in order to look after their children.
Employees by type of contract (fixed-term/open-ended) and by gender
Open-endedFixed-termTotal
Management reportof the Azimut Group
ItalyAustraliaBrazilChileChina Hong KongChina ShanghaiEgyptUnited Arab EmiratesIrelandLuxembourgMexicoPrincipality of MonacoSingaporeSwitzerlandTaiwanTurkeyThe USATotal
Employees by type of employment, gender and country
9416966345
2110142547249
228
144
539
60150441532524
396
129
16250
383
012000000000100000
13
269000001010101000
75
9418166345
2110142547259
228
144
552
62219441532625
397
121016250
458
MenWomen
31/12/2019 Full-timeFull-time Part-timePart-time TotalTotal
3 16% of the Group’s women work on a part-time basis, compared to 2% of men.
35428
382
45717
474
53814
552
81145
856
97238
1,010
31/12/201831/12/2019
WomenWomen MenMen TotalTotal

79
Authorised off-premises financial advisors, who account for most of the Group's placement activities, are typical of Italy’s financial market. They must pass an exam to enter on a Register managed and monitored by a specific Public Body (Supervisory Body which holds the Single Register of Financial Advisors), are subject to very stringent rules of conduct and the breach of said rules of conduct is punished with different types of penalties, up to the removal from the Register and, consequently, disqualification.
In the other countries where the Group operates, financial advisors are governed by different regulations and the employment relationships with the companies managing and providing investment services are also different.In Italy, Azimut’s over 1,800 financial advisors have an agency contract with Azimut Capital Management SGR S.p.A. for asset management advisory and placement and with Azimut Financial Insurance S.p.A. for insurance products advisory and placement. They are not employees but must work exclusively for Azimut.In Italy, financial advisors are grouped into local areas coordinated by a manager (Managing Director) and several area managers, assisted by various team managers. All these coordination levels have an agency relationship with Azimut Capital Management SGR S.p.A. and their remuneration is based on fees. Managing directors report directly to the commercial department with which they meet every week to plan and monitor the main results achieved and comment on any feedback from customers and the degree of achievement of corporate targets.The 1,929 financial advisors include approximately 266 resources who make up the Wealth Management division, i.e., professionals specialised in dealing with high-end customers. The sales department consists of 7 Managing Directors, 31 Area Managers, 17 RWMs and 85 Team Managers.
ItalyAustraliaBrazilIrelandLuxembourgMexicoPrincipality of MonacoSwitzerlandTurkeyTotal
Employees by type of employment, gender and country
11312865132156262112
455
821083524
3859
21304
2160000100
19
4730000100
78
11514465132156272112
474
861813524
3869
21382
MenWomen
At 31/12/2018 Full-timeFull-time Part-timePart-time TotalTotal
Financial advisors

80 G r u p p o A z i m u t
At the end of 2018, authorised off-premises financial advisors, entered on the Register managed by the specific Supervisory Body, total 55,311, of which 35,099 are active. Of these, 22,330 operate for Assoreti system companies, i.e., companies (banks, stock brokerage and asset management companies), similar to Azimut in terms of market operations.According to the information provided in the website of the Supervisory Body which holds the Single Register of Financial Advisors (www.organismocf.it), women account for approximately 20% of the members, while no percentage is available concerning those who actually work in this field.The percentage of women operating as Azimut’s financial advisors (20% in 2019 and 18.7% in 2018) is substantially in line with Italy’s figures on gender balance. However, in recent years, there has been a promising growth trend in women. The quality of financial advisors’ work results from objective and numerical figures, such as the average amount of assets under management assigned to the company, via the same, the stability of the relationship which reflects customer satisfaction (when financial advisors move to a new company, usually, customers follow them, clearly with negative consequences for the previous company, but also for the customer, in the case of disinvestment penalties) and the compliance of work with internal rules and policies. In Azimut, the broad shareholder base and the provisions of the Shareholders’ Agreement create stability among financial advisors, generating major advantages for the Group and, in general, customers.Financial advisors’ loyalty policies not only provide for the participation and avoidance of commercial pressure as per the above corporate structure, but are also aimed at creating a positive environment which promotes economic and professional satisfaction.Every year, a research company (FINER Finance Explorer) carries out a survey among financial advisors and the so-called private bankers (in Azimut, they are represented by the Wealth Management segment) to assess the principal company and provide for actions to resolve any critical issues.In the 2019 survey among financial advisors, 53% of Azimut interviewees stated they were utterly satisfied of their relationship with the principal company, up on 46% in 2018, while 44% was partially satisfied and only 3% was rather dissatisfied. Similarly to last year, Azimut ranks fourth in terms of satisfaction in the sample of
Management reportof the Azimut Group
Financial advisors by age and gender
≤ 29 years30-50 years> 51 yearsTotal
19146165330
21169197387
28515893
1,436
37540965
1,542
47661
1,0581,766
58709
1,1621,929
31/12/201831/12/2019
WomenWomen MenMen TotalTotal

81
Incoming employees by age bracket and gender
≤ 29 years30-50 years> 51 yearsTotal
396211
112
396712
118
297615
120
405919
118
6813826
232
7912631
236
20182019
WomenWomen MenMen TotalTotal
companies considered.The survey also reveals the opinions by topic and identifies areas for improvement which are carefully considered by the Group’s central management.
Turnover4
The possibility for all the Group’s workers (employees and advisors) to participate in the management of the Holding, of which most of them are shareholders pursuant to the Shareholders’ Agreement, is the first and main loyalty element. This peculiarity is fundamental in driving stability.
Once the employment relationship has been consolidated, Azimut’s policy promotes long-term relationships which result in average corporate seniority of about 10 years (this figure refers to Italian companies since it is too early to make similar estimates for the foreign companies which joined the Group too recently). This is a significant figure considering that Azimut grew significantly, especially since the Parent Company’s flotation in 2004. Another fundamental element of personnel’s and management’s stability was and still is the fact that the founding members are still at the head of the Group.Every year, during the traditional Christmas party for all employees of the headquarters, the employees who celebrate 10, 20 and 30 years with the Company receive an award. The stability of the contractual relationships confirms the employees’ satisfaction with the work environment and the remuneration system. Internal career is also a decisive factor in personnel retention. Indeed, some top positions in the Group, e.g., the CFO and the Head of Risk, have been selected among the Group’s personnel.Employees’ loyalty and satisfaction are the responsibility of the Human Resources department, which also use training tools, such as weekly in-house English courses, private health insurance for top and middle managers and agreements with external bodies to the benefit of all employees (e.g. reduced rates to use public means of transport in Milan).
Employees
4 The increases and decreases generated by scope changes are excluded from the calculation. For information about the latter, reference should be made to the Methodology section of this CNFS.

82 G r u p p o A z i m u t
Management reportof the Azimut Group
Incoming employees by country, age bracket and gender
24000000000
1102000
19
09001000001010000
12
1442904043163
2504030
118
3611205102036751390
118
ItalyAustraliaBrazilChileChina Hong KongChina ShanghaiEgyptUnited Arab EmiratesIrelandLuxembourgMexicoPrincipality of MonacoSingaporeSwitzerlandTaiwanTurkeyThe USATotal
MenWomen
721504023051
1000010
59
234404002021640170
67
517400020112402020
40
118800100014101220
39
< 29 years< 29 years31/12/2019 30-50 years
30-50 years
≥ 50years
≥ 50years
TotalTotal

83
Incoming employees by country, age bracket and gender
370000410
15
470000000
11
31302764
13621
120
29617113226
112
ItalyAustraliaBrazilIrelandLuxembourgMexicoPrincipality of MonacoSwitzerlandTurkeyTotal
MenWomen
24151563
11110
76
17334012113
62
48
12012101
29
8213101113
39
< 29 years< 29 yearsAt 31/12/2018 30-50 years
30-50 years
≥ 51years
≥ 51years
TotalTotal
Young employees to join the Group are selected, inter alia, with the collaboration of the best Italian universities and the organisation of internships for both students and new graduates. Trainees are present in different corporate areas and are one of the recruitment bases of new employees, when necessary. Group companies also collaborate with “Alternanza Scuola-Lavoro” work-study initiatives, to the extent of compatible studies. In 2019, the Group offered 10 extracurricular trainees on-the-job training in order to introduce them to the labour market. They are paid beyond the legal minimal amount required.With respect to the overall composition of employees by gender at the end of 2019, new employee hires point to an improvement in the rebalancing of numbers, to which the Group pays considerable attention. Incoming employees account for approximately 23%.
Outgoing employees by age bracket and gender
≤ 29 years30-50 years> 51 yearsTotal
16311259
17 43 1171
12341157
114721 79
286523
116
289032
150
20182019
WomenWomen MenMen TotalTotal

84 G r u p p o A z i m u t
Outgoing employees by country, gender and age bracket
62 0 000000 1 4 2 24 00 0
21
460000000 0001000 0
11
308
10010300 2
11 3 2621 0
79
2524100020036021250
71
ItalyAustraliaBrazilChileChina Hong KongChina ShanghaiEgyptUnited Arab EmiratesIrelandLuxembourgMexicoPrincipality of MonacoSingaporeSwitzerlandTaiwanTurkeyThe USATotal
MenWomen
214 6000300 1 61 02 21 0
47
15130 0001003 3 0 11 24 0
43
324010000 0100000 0
11
65 1000100 0 3000 0 10
17
< 29 years< 29 years31/12/2019 30-50 years
30-50 years
≥ 50years
≥ 50years
TotalTotal

85
Outgoing employees by country, gender and age bracket
541000100
11
080002101
12
14169148104
57
1367115116
59
ItalyAustraliaBrazilIrelandLuxembourgMexicoPrincipality of MonacoSwitzerlandTurkeyTotal
MenWomen
787136002
11
1166103013
31
241012002
12
0121010002
16
< 29 years< 29 yearsAt 31/12/2018 30-50 years
30-50 years
≥ 51years
≥ 51years
TotalTotal
Outgoing employees (voluntary resignations and retirement) are typical of a highly competitive industry, as that in which the Group operates. Specifically, in 2019, the turnover of outgoing employees was around 15%.
Azimut attracts and develops talents though the many projects focused on young advisors it implements over time. In 2017, Azimut launched a three-year project for young advisors with a high potential. The project involves those already operating in the investment advisory industry and willing to start a professional career path with an independent player. It focuses on training new professionals with dedicated technical and commercial training paths, using rewarding systems and a pre-defined career path. In line with the plan, the Millennials division had 99 financial advisors at year end, bringing the number of under 35 financial advisors operating at Azimut to 118.In 2019, the incoming turnover of financial advisors is around 9% while the outgoing turnover is approximately 5% (any significant changes between 2019 and 2018 could be due to the expanded reporting scope).The percentage growth of women to total advisors is confirmed by the hiring of new figures. In the past three years, women accounted for 20/30% of incoming advisors. This is a considerable increase in gender balance, considering that this industry is historically male-oriented.
Financial advisors
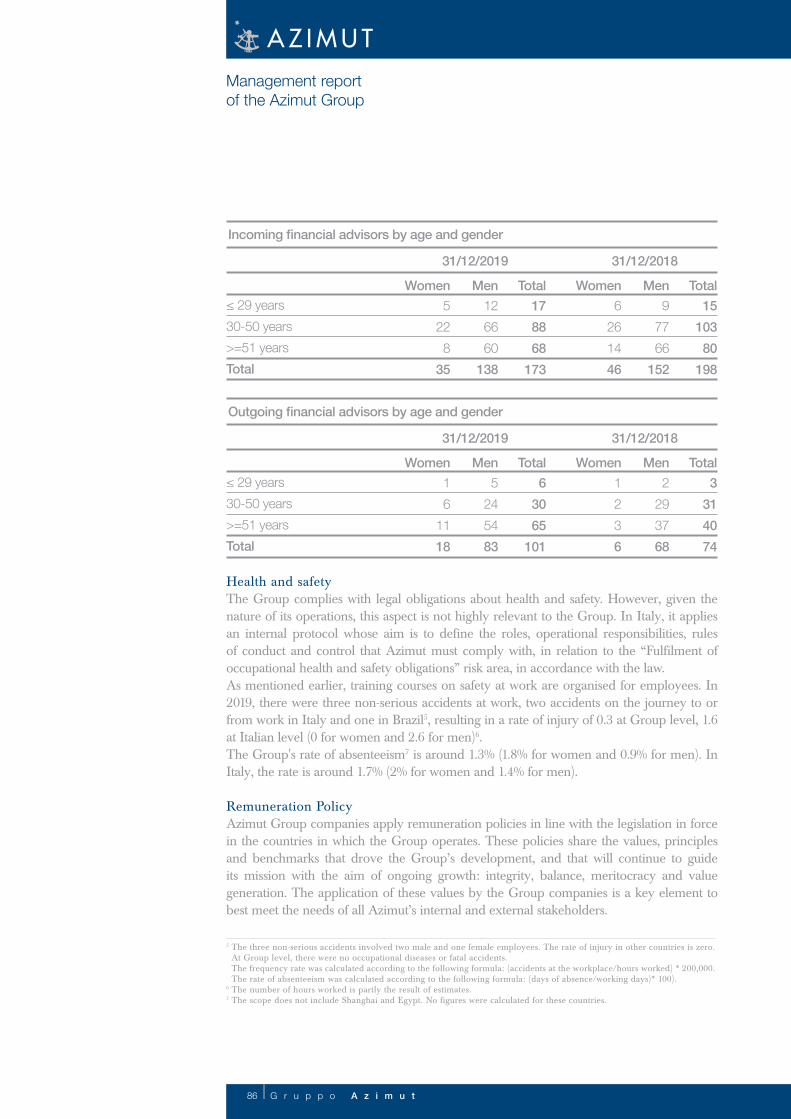
86 G r u p p o A z i m u t
Health and safetyThe Group complies with legal obligations about health and safety. However, given the nature of its operations, this aspect is not highly relevant to the Group. In Italy, it applies an internal protocol whose aim is to define the roles, operational responsibilities, rules of conduct and control that Azimut must comply with, in relation to the “Fulfilment of occupational health and safety obligations” risk area, in accordance with the law.As mentioned earlier, training courses on safety at work are organised for employees. In 2019, there were three non-serious accidents at work, two accidents on the journey to or from work in Italy and one in Brazil5, resulting in a rate of injury of 0.3 at Group level, 1.6 at Italian level (0 for women and 2.6 for men)6.The Group's rate of absenteeism7 is around 1.3% (1.8% for women and 0.9% for men). In Italy, the rate is around 1.7% (2% for women and 1.4% for men).
Remuneration PolicyAzimut Group companies apply remuneration policies in line with the legislation in force in the countries in which the Group operates. These policies share the values, principles and benchmarks that drove the Group’s development, and that will continue to guide its mission with the aim of ongoing growth: integrity, balance, meritocracy and value generation. The application of these values by the Group companies is a key element to best meet the needs of all Azimut’s internal and external stakeholders.
Incoming financial advisors by age and gender
Outgoing financial advisors by age and gender
Management reportof the Azimut Group
≤ 29 years30-50 years>=51 yearsTotal
≤ 29 years30-50 years>=51 yearsTotal
6261446
1236
5228
35
16
1118
97766
152
2293768
126660
138
5245483
1510380
198
3314074
178868
173
63065
101
31/12/2018
31/12/2018
31/12/2019
31/12/2019
Women
Women
Women
Women
Men
Men
Men
Men
Total
Total
Total
Total
5 The three non-serious accidents involved two male and one female employees. The rate of injury in other countries is zero. At Group level, there were no occupational diseases or fatal accidents. The frequency rate was calculated according to the following formula: (accidents at the workplace/hours worked) * 200,000. The rate of absenteeism was calculated according to the following formula: (days of absence/working days)* 100).6 The number of hours worked is partly the result of estimates.7 The scope does not include Shanghai and Egypt. No figures were calculated for these countries.

87
The remuneration policy first and foremost motivates, encourages and rewards those who, for several reasons, profitably share their experience and skills with the Group, thus directly participating in its development. Meanwhile, an adequate and balanced remuneration structure is a necessary part of the complex governance structure: a fundamental role for all those who see the Group as a landmark in ensuring the quality of the wide range of services currently available, based on an interpretation that revolves around customer safeguard, satisfaction and protection, and increasingly more dedicated to insourcing.In a highly competitive scenario, such as that of the investment industry, the remuneration policy is clearly a factor of interest which attracts the best skills. Therefore, it is carefully considered also from this point of view.
THE DEVELOPMENT AND GROWTH OF OUR PEOPLE
Employees are carefully selected as they represent a decisive factor in the quality of the services offered. The Group applies procedures whereby candidates are selected based on company needs and technical and aptitude abilities, transparently and in accordance with the following criteria: • specific skills with respect to role or tasks;• equal treatment;• economic conditions in line with the position held and the roles and responsibilities
assigned;• reliability.Furthermore, the Group ensures working conditions that respect the dignity of the individual, equal opportunities and a suitable working environment. All employees, regardless of their level, participate in training courses, which mainly relate to legislation and constant updates. Azimut implemented an international IT platform which manages the development plans of the employees of all the countries in which it is based in order to consistently develop projects for its employees.In 2019, training hours amounted to approximately 5,679 and involved all employees (2018: 4,8028). Specifically, 375 hours focused on occupational health and safety, 3,140 hours on soft skills (including language courses), 400 hours on privacy protection, 176 hours on anti-corruption and 1,589 hours on other types of training.In 2019, average training hours amount to 12 for top managers (13 hours for women and 11 hours for men), 8 hours for middle managers (9 hours for women and 8 for men) and 4 hours for staff (4 hours for women and 4 for men). In 2018, Azimut implemented an international IT platform which manages the development plans of the employees of all the countries in which it is based in order to consistently develop projects for its employees. The possibility of extending the use of the platform to the provision of e-learning training worldwide is currently being considered.
8 The increase on the previous year reflects the change in the reporting scope, the company reorganisations that took place during the year and the training courses provided cyclically over the years in relation to regulatory updates.
Employees

88 G r u p p o A z i m u t
It adopted a protocol to define roles, operating responsibilities, standards of behaviour and control that Azimut Holding S.p.A. intends to respect, in relation to various activities of the “Personnel selection, hiring and management” risk area, in compliance with ruling legislation and the principles of transparency, objectivity and truthfulness of the information and to prevent, when performing said activities, the following types of crimes: corruption, undue induction to give or promise benefits, bribery among private individuals, fraud.
In Azimut, training has always been considered a fundamental driver for development which enables financial advisors to obtain and develop the skills necessary to meet the many and complex needs of customers in a context where assets, as a whole, are the object of the consultancy. Therefore, great attention is paid to the design of new specific training paths according to the characteristics of the financial advisors and the new requests from the market and the context in which they operate. In 2019, a total of 133,910 hours were provided (2018: 96,207). Specifically, in Italy, 99,355.5 hours related to mandatory training (maintaining or registration with the Single Register of Intermediaries and the Body Register of Agents and Mediators) and 33,329 hours related to non-mandatory training (specialisations).Of the total amount of hours, 25,451 were provided to female financial advisors and 108,459 to male financial advisors.Specialisation covered wealth planning and private insurance, corporate, social security and corporate welfare and advisory topics. All courses were held by industry specialists or leading training companies and were intended to implement the skills necessary to operate at best, with additional information about technical, trade and relationship issues. In Italy, financial advisors’ performance is monitored using quantitative-qualitative parameters. Specifically, the acquisition of new customers is monitored as well as inflows as an indicator of customers’ confidence, the stability of customers and several indicators used to produce a profile on the behaviour of the financial advisor. The latter is subsequently monitored using specific irregularity indicators developed by Assoreti trade association. In the event of doubts about the behaviour of a financial advisor, the Sales department reports the fact to the Internal Audit function which acts in order to guarantee utmost fairness, moral integrity and compliance with the applicable laws and internal and external provisions in force. The entire process is designed and implemented using also a risk-based approach which, on the one hand, identifies the main risks inherent in financial advisors’ operations as part of the definition of controls and the tools and methodologies to be used, and, on the other, focuses control activities on the issues and the financial advisors who are potentially most at risk, including from a reputational viewpoint, for Azimut Group companies. Specifically, controls are performed through the following activities:• definition of financial advisors’ risk profiles;• on-site inspections;• analysis of irregularity indicators;• analysis of customers’ claims.
Financial advisors

89
Azimut’s financial advisors’ good reputation is confirmed by the very low number of complaints. The Internal Audit department regularly checks financial advisors’ operations and behaviour and systematically plans visits to the offices.
5. Our commitment to the community
Azimut has created a work group dedicated to CSR aimed at promoting culture and responsibility in full compliance with the Charter of Values. This group is the result of the Company's need and desire to channel the social responsibility activities of an ever-increasing number of employees and consultants. It will take the form of a professional and personal commitment on the part of the Group's stakeholders, in an organised, structured and shared project. The CSR Work Group functions as a single team and is committed to constantly drawing attention to sustainability and the implementation of social responsibility initiatives that benefit the community and the country. Customers and financial advisors in Italy are based in thousands of different locations in all regions and the context in which they live is important to the Group which must know and acknowledge it in order to grow and provide services to an increasingly large number of potential customers.The Work Group was formed in full respect of gender equality, with the awareness that inclusion is a way of promoting "diversity".The CSR project aims to create an ecosystem of values, which are contagious and unrelenting, where Azimut serves as the link between individuals, businesses, associations, local communities, universities and schools of all levels. The activities are a response to local needs and are systematically and consistently carried out, focusing on topics such as philanthropy, financial education, support for the disadvantaged, the promotion of culture, art and sports activities. The resources involved, which continue to grow in number, are actively participating in specific training courses. The training has made advisors even more focused on a holistic approach to protecting people and their loved ones.This commitment is confirmed by the fact that, in 2019, the Group allocated approximately 1 million euro, or 89% of its event marketing budget, to CSR activities. These activities are reflected in the organisation of philanthropic, sports and cultural events, as well as financial education.In this respect, in 2019, Azimut Capital Management SGR S.p.A., through its network of local relationships with financial advisors, promoted and organised more than 505 public events in Italy, of which 321 of a financial nature (this figure also includes the financial education provided by Azimut Libera Impresa), 116 of a cultural nature (sponsorships, exhibitions, concerts), 40 sports sponsorships and 28 meetings on philanthropy.Furthermore, Azimut has always believed in the value of financial education which, indeed, accounts for 46% of the budget allocated to CSR activities in 2019, believing that a more informed and knowledgeable saver can help create value across the entire economic system.

90 G r u p p o A z i m u t
Specifically, over the years Azimut has: • Issued publications on financial education using plain language that can be easily
understood even by people who are not professionals in the sector. • Held meetings and events across the country organised by its network of financial
advisors to provide training and information on topics relating to financial markets, savings and investments.
• Developed a mobile app to provide savers with the tools to interpret the information they receive every day from the business and financial world, and to help them make informed choices.
Furthermore, in October 2019, again with respect to financial education, Azimut allocated a further significant budget for the organisation of the "Azimut Libera Impresa Expo" event, whose aim is to create a meeting point between the real economy and asset management and to show the positive and driving effect that sustainable finance can have on stakeholders and local communities.
Furthermore, in October 2019, again with respect to financial education, Azimut allocated a further significant budget for the organisation of the "Azimut Libera Impresa Expo" event, whose aim is to create a meeting point between the real economy and asset management and to show the positive and driving effect that sustainable finance can have on stakeholders and local communities. "Azimut Libera Impresa Expo” was held in October 2019 and was organised to create a meeting point between the real economy and asset management. This event, which was organised by Azimut Holding S.p.A. and Azimut Libera Impresa Sgr, involved a vast network of entrepreneurs and investors in two days of events and conferences focused on the real economy in Italy. With over 250 Italian and international speakers, 60 conferences and more than 10,000 participants, this event was an opportunity to promote Azimut's commitment to creating a dialogue between the real economy and asset management. Among the issues covered, Azimut organised two panel discussions on the topics of Sustainability and CSR:• The first panel - Finance for Sustainable Development - aimed to highlight the
growing emphasis placed on developing innovative projects that focus on economic, social and environmental impact in the medium and long term, and to highlight the role that sustainable finance can play in this area. The speeches were attended by representatives of Azimut and the world of finance in general, with particular interest in Principles of Responsible Investment (PRI) issues;
• The second panel - Finance and business for the growth of local communities - focused on the reasons behind the need to create a new business culture, highlighting how sustainable finance has a positive and driving impact on stakeholders and local communities through its inherent role of providing capital for promoting and developing sustainable practices.
Finally, certain products included in Azimut's range of products confirm the focus on CSR issues. The Italian launch of this Luxembourg product, AZ Multi Asset Sustainable Equity Trend, is combined with the option, for customer, to activate the solidarity service.

91
Thanks to this service, customers can allocate part of the income periodically distributed by the Sub-fund to a non-profit-making organisation (Onlus). Furthermore, similar initiatives were organised in Brazil thanks to the AZ Quest Azimut Impacto fund. In addition, donations (specifically, for the treatment of cancer and AIDS) are regularly planned by the Group’s local company.
Fondazione Azimut was formally set up in 2008 and obtained the first licence to operate in Lombardy in March 2010. Its operational area was subsequently extended to Italy as a whole in 2012.Azimut Holding S.p.A. is the main contributor of the Fondazione to which, every year, it allocates 1% of its consolidated gross profit (Article 32 of the By-laws). Set up as a non-profit-making organisation, the Fondazione will be classified as a third sector organisation once the Single National Register comes into force pursuant to the Italian Legislative Decree No. 117 of 3 July 2017 (Third Sector Code).According to its By-laws, Fondazione Azimut’s operations are limited to the economic and social distress area. The Board of Directors has immediately approved that the resources of the Fondazione were to be entirely allocated to charitable activities, excluding any operating costs (personnel, office, etc.).The first initiatives were launched in 2011 in Lombardy and financed the projects proposed by several organisations.From 2012 to the end of 2015, the Fondazione acted directly in the risk of poverty area. Group companies’ collaborators (employees, managers, financial advisors) were invited to become volunteers by reporting families which were temporarily in need of financial help and to commit to support them until the emergency is over. Approximately 150 Azimut’s collaborators participated in the initiative and submitted to the Fondazione detailed proposals concerning 400/600 people on a rotation basis. The people considered aid-worthy received a spending voucher (“Ticket Services” issued by Edenred) ranging between 100 and 300 euro per month for 18/24 months. Every quarter, Azimut’s volunteers reported on the progress of the situation. Overall, 2,000 people received support.From 2011 to 2017, the Fondazione allocated over 4.5 million euro to the above initiatives.Starting from 2016, the Fondazione invited all the Group’s collaborators to think about new ways of using resources and implementing projects which can structurally improve the life of the beneficiaries of the initiatives.Collaborators were asked to submit projects and, in the last four years (2016-2019), the Fondazione’s BoD examined approximately one hundred proposals. Some of them were selected and implemented or launched in 2018 and 2019.Specifically:• In Turin, Fondazione Azimut contributed to the construction of a shelter home for women in the former military arsenal. This is now managed by Sermig (Youth Missionary Service) which since 1983 has used these premises for extremely important
Fondazione Azimut

92 G r u p p o A z i m u t
Management reportof the Azimut Group
solidarity initiatives. Sermig’s Nuova Accoglienza Femminile shelter home covers approximately 1000 sq. m. and provides evening/night care (from 4 p.m. to 8 a.m.) to 17 women in rooms with 2, 3 and 4 bed places and residential care to 20 women with children in double or triple rooms. The facility also provides for common living spaces (kitchen, canteen, laundry) and services facilitating independence. The shelter was inaugurated by the President of the Italian Republic Sergio Mattarella on 26 November 2018. In 2019, both the night-time reception area and the residential area were fully operational.• In Brescia, Fondazione Azimut financed the restructuring of the former monastic
building of the Santa Giovanna Antida parish to turn it into a temporary residence for individuals and small families who, through the collaboration of Il Calabrone cooperative, which is extremely active and experienced in poverty issues, are assisted in the research of a permanent job and house.
The renovation was completed at the end of 2018 and, in 2019, the facility hosted about ten people (eight Italians, two immigrants) aged between 35 and 45 years with an average stay of six months. These people came out of difficult family or existential situations and were accompanied towards economic and housing autonomy.
• In Acireale (CT), Fondazione Azimut financed the launch of an agricultural business on abandoned land made available by the church. Outdoor poultry farming and oil production have already started. The business employs two people. Part of the production is sold to support the activities and another part is donated to provincial charitable organisations. In 2019, work began on the preparation for a vineyard for the production of fine wine.
• In Savona, Fondazione Azimut helped to bring together the demand for and the supply of houses with modest prices, in collaboration with a number of city life players (Rotary club, the municipal authorities, the church and business associations). The aim is to find private parties who are willing to lease houses to economically fragile people against a guarantee provided by Fondazione Azimut through a fund set up to cover no-fault overdue payments.
In addition, the tenant is assisted with the search for sure income through work grants and support in the pursuit of economic stability. At the end of 2019, the Abit-Abile project began with the allocation of 4 housing units to 4 families (for a total of 17 people including 9 children) and the allocation of work grants to two people from January 2020.
• In Bologna, during the year, Fondazione Azimut financed a significant part of the works for the construction of a shelter home for families with children treated at the paediatric ward of the Bellaria Hospital. The building, which was made available by the San Lazzaro parish, will provide free or low-rate accommodation based on the economic conditions of the families of children in the cancer and psychiatric ward of the hospital. The facility will be managed by the Associazione Bimbo Tu which has operated in the paediatric ward of the hospital for years, with success and as confirmed by many volunteers.
The building’s restructuring will result in two small apartments, a larger apartment
93
and 19 modular rooms (from one to five people). The facility will have a kitchen with dining area, a laundry/ironing room, lounges, a chapel, a meeting room and study or play areas. Outside, there will be a garden also available to children with disabilities.
• In Naples, Fondazione Azimut financed the purchase of the equipment and materials necessary for training courses (tailoring, computer, pizza making) for a hundred young people living in areas where the rate of early school leaving is high. The courses are managed by the Associazione Opera Salute Fanciullo which has been active in Naples since 1949.
• In Pavia, Fondazione Azimut is awaiting the authorisations to build a dormitory for women in distress in the area made available by the San Salvatore parish which already provides a number of services (canteen, day centre, cloakroom service, support) to people in a persistent poverty situation. Fondazione Azimut will finance a large part of the construction.
• In Verona, in 2019, the building works necessary for the construction of a protected shelter for women victims of violence began. The shelter, made available on free loan basis for several years by a private individual, is financed by Fondazione Azimut and will be managed by the Associazione Protezione della Giovane di Verona.
A similar project will be launched in 2020 in Padua.• In Genoa, since 2019, a charity association has been financially supported, which
manages two nurseries which accommodate the children of families in difficulty who, for different reasons, could not be accommodated in public facilities.
• Finally, in 2019, support continued to homes run by a Franciscan convent in Trastevere in Rome and Valmontone and to a temporary residence in Grosseto run by the Maria SS. Addolorata parish.
The most important project of 2019 (and of the following years) is that underway in Palermo, where Fondazione Azimut collaborates in the redevelopment of the Danisinni area (a deprived urban area in the city centre) to restructure abandoned houses and reactivate crafts and agriculture employment. The agricultural business is already active, providing work for fragile people (former prisoners), and small buildings intended for residence and services for the neighbourhood are being renovated.
6. Environmental protection
The focus on environmental sustainability and climate change is now of common sensibility and applies to both managers when selecting the fund portfolios, and employees’ daily activities.Specifically, the environmental impact of the Group's operations is limited to consumption linked to office work. For the purposes of this document, the impact is essentially considered in terms of paper consumption and electricity used. Water consumption is related to the personnel in the offices. Therefore, this aspect is not relevant.Following the inclusion of environmental crimes in the list of crimes covered by

94 G r u p p o A z i m u t
Management reportof the Azimut Group
Legislative Decree no. 231 of 8 June 2001 on administrative liability, Azimut adopted a Protocol to manage environmental requirements (Protocol 18) which sets out the types of behaviour to be followed.Electricity: In 2019, the Group consumed 2,251 MWh of electricity purchased from the grid (2018: 2,039 MWh)9. The Group is committed to reducing energy consumption also by installing IT equipment with a low energy impact (AAA) and adopting best practices promoted among employees. The energy intensity index10 for 2019 was 2.23 MWh/employee while, in 2018, it was 2.38 MWh/employee. This reduction reflects the Group's commitment to reducing its environmental impact (the index provides a more comparable representation of energy consumption between 2019 and 2018, since it is not affected by the enlarged reporting scope).Emissions: the Group calculated (using Terna’s 2017 conversion factors) Scope 2 location based indirect emissions, amounting to 1,027 tCO2eq arising from energy consumption (2018: 892.52 6 t CO2eq).The emission intensity indicator11 for 2019 was 1.02 t CO2eq /employee while, in 2018, it was 1.04 t CO2eq /employee. Paper consumption: in 2019, the Group used 37 tonnes of paper12 (2018: 56 tonnes13).The Group promotes communication standards mainly based on digital and IT tools, except for the documentation which must be made available also in paper form and the reports to be sent to the customers. Specifically, financial advisors were asked to use and assisted in the use of tablets to communicate with customers in order to avoid printing, where possible. By completing the 2019 CDP questionnaire, the Group will provide further details about its environmental impact and the strategies implemented to mitigate the negative impacts generated.
9 This figure is partly the result of estimates: the 2018 figure has been restated to align the same calculation method. As the 2019 consolidation scope was extended, the two figures cannot be compared. For further details on 2018 consumption, reference should be made to the 2018 CNFS. 10 The energy intensity index is calculated by dividing consumption (MWh) by the total number of employees 11 This indicator is calculated by dividing emissions (t CO2eq) by the total number of employees 12 The figure includes all Group companies, excluding those operating in Australia, which use digital dossiers, thereby excluding paper use. It also excludes Egypt and the United Arab Emirates as the data is not available.13 In 2018, paper consumption was extraordinary and is due to the need to re-print most of the contractual materials and forms following the coming into force of the General Data Protection Regulation (GDPR-Regulation (EU) 2016/679) which amended the references to personal data processing.

95
Chapter/ Referenceparagraph
Methodology
Azimut Group
GRI-ReferencedTopic-Specific Standards (2016)This topic is covered byGRI 102: GeneralDisclosures
This content refers toGRI 102: GeneralDisclosures
This content refers toGRI 205: Anti-corruptionand GRI 103:Management Approach
This content refers toGRI 102: GeneralDisclosures
GRI-ReferencedTopic-Specific Disclosure
Disclosure 102-1:Name of the organization
Disclosure 102-52:Reporting cycle
Disclosure 102-16:Values, principles, standards, and norms of behaviour
Disclosure 205-3:Confirmed incidentsof corruption andactions taken
Disclosure 102-53:Contact point for questions regarding the report
Disclosure 102-17: Mechanisms for advice and concerns about ethicsDisclosure 102-18:Governance structure
Disclosure 102-2:Activities, brands, products,and servicesDisclosure 102-5:Ownership and legal formDisclosure 102-6:Markets served
Disclosure 102-56:External assurance
Disclosure 102-49:Significant changes from previous reporting periodsin the list of material topicsand topic boundariesDisclosure 102-50:Reporting period
-
-
-
-
-
-
-
-
-
-
Reporting on requirementsunder point a.i. (“Marketsserved, including the geographical locations where products and services are offered”).
-
-
Notes
GRI INDEX

96 G r u p p o A z i m u t
GRI INDEX
Azimut Group
The Group’ssustainability
This content refersto GRI 406:Non-discrimination andGRI 103: Management Approach
This content refers toGRI 418: CustomerPrivacy and GRI 103 Management Approach
This topic is covered byGRI 419: Socioeconomic Compliance
This content refers toGRI 417: Marketing and Labelling and GRI 103: Management Approach
Disclosure 406-1:Incidents of discrimination and corrective actions taken
Disclosure 418-1:Substantiated complaints concerning breaches of customer privacy and lossesof customer dataDisclosure 419-1:Non-compliance with lawsand regulations in the socialand economic area
Disclosure 417-2: Incidents of non-compliance concerning product and service information and labellingDisclosure 417-3:Incidents of non-compliance concerning marketing communications
Reporting on the requirements under point a.i (“Percentage of governance bodies by gender”) and point a.ii (“Percentage of governance bodies by age”) in absolute values and not as a percentage.
-
-
-
-
-
-
-
-
-
-
-
This content refers toGRI 405: Diversity andEqual Opportunity andGRI 103: Management Approach
This content refers toGRI 102: GeneralDisclosures
Disclosure 405-1:Diversity of governancebodies and employees
Disclosure 102-13:Membership of associationsDisclosure 102-40:List of stakeholder groupsDisclosure 102-42: Identifying and selecting stakeholdersDisclosure 102-43: Approachto stakeholder engagementDisclosure 102-47:List of material topicsDisclosure 102-15: Key impacts, risks, and opportunitiesDisclosure 102-43: Approachto stakeholder engagement

97
GRI INDEX
This content refers toGRI 401: Employment and GRI 103: Management Approach
This content refers toGRI 403: OccupationalHealth and Safety andGRI 103 ManagementApproach
This content refers toGRI 405: Diversity and Equal Opportunity andGRI 103: Management Approach
This content refers toGRI 404: Training andEducation and GRI 103: Management Approach
Disclosure 401-1:Total number and rate of new employee hires and turnoverby age, gender and geographical area
Disclosure 403-2:Types of injury and rates ofinjury, occupational diseases,lost days, and absenteeism,and number of work-related fatalities
Disclosure 405-1:Diversity of governancebodies and employees
Disclosure 404-1: Average hours of training per employee
Our people This content refers toGRI 102: General Disclosures
Disclosure 102-16:Values, principles, standards, and norms of behaviourDisclosure 102-7: Scale of the organization
Disclosure 102-8: Information on employees and other workers
-
Reporting on the requirements under point a.i (“Scale of the organization, including: total employees”)Reporting on the requirements under point a. (“Total employees by employment contract (permanent and temporary), by gender”) and point c. (“Total employees by employment type (full-time and part-time), by gender”)Reporting on the requirements under point a. (“Total number and rate of new employee hires during the reporting period, by age, gender and geographical area”) and point b. (Total number and rate of turnover during the reporting period, by age, gender and geographical area”) in absolute values.Reporting on the requirements under point a. Types of injury and rates of injury, absenteeism, and number of work-related fatalities and occupational diseases by gender and geographical area.
Reporting on the requirements under point b.i (“Percentage of employees by employment contract and gender”) and point b.ii (Percentage of employees by employment contract and age”) in absolute values.
-

98 G r u p p o A z i m u t
Our commitment tothe community
Environmental protection
See Fondazione Azimut’sactivities
Reporting on the requirements under point e. (“Total energy consumption within the organization”) in MWh.
Reporting on the requirements under point a. (“Total location-based GHG emissions in CO2 equivalent tonnes”).
-
Reporting on the requirements under point a. “Energy intensity ratio for the organization” in MWh/employees.
Reporting on the requirements under point a. “GHG emissions intensity ratio for the organization” in CO2eq/employees.
This content refers toGRI 102: GeneralDisclosuresThis content refers to GRI 302: Energy and GRI 103: Management Approach
This content refers toGRI 305: Emissions andGRI 103: Management Approach
This content refers to GRI 307: Environmental compliance and GRI 103: Management Approach
Disclosure 102-12:External initiatives
Disclosure 302-1:Energy consumption withinthe organization
Disclosure 305-2:Energy indirect (Scope 2)GHG emissions
Disclosure 307-1:Non-compliance with environmental laws and regulations
Disclosure 302-3:Energy intensity
Disclosure 305-4:GHG emissions intensity
On behalf of the Board of DirectorsChief Executive Officer(Gabriele Blei)
Milan, 5 March 2020
GRI INDEX

99

100 G r u p p o A z i m u t

101
Consolidated balance sheetas at 31 december 2019

102 G r u p p o A z i m u t
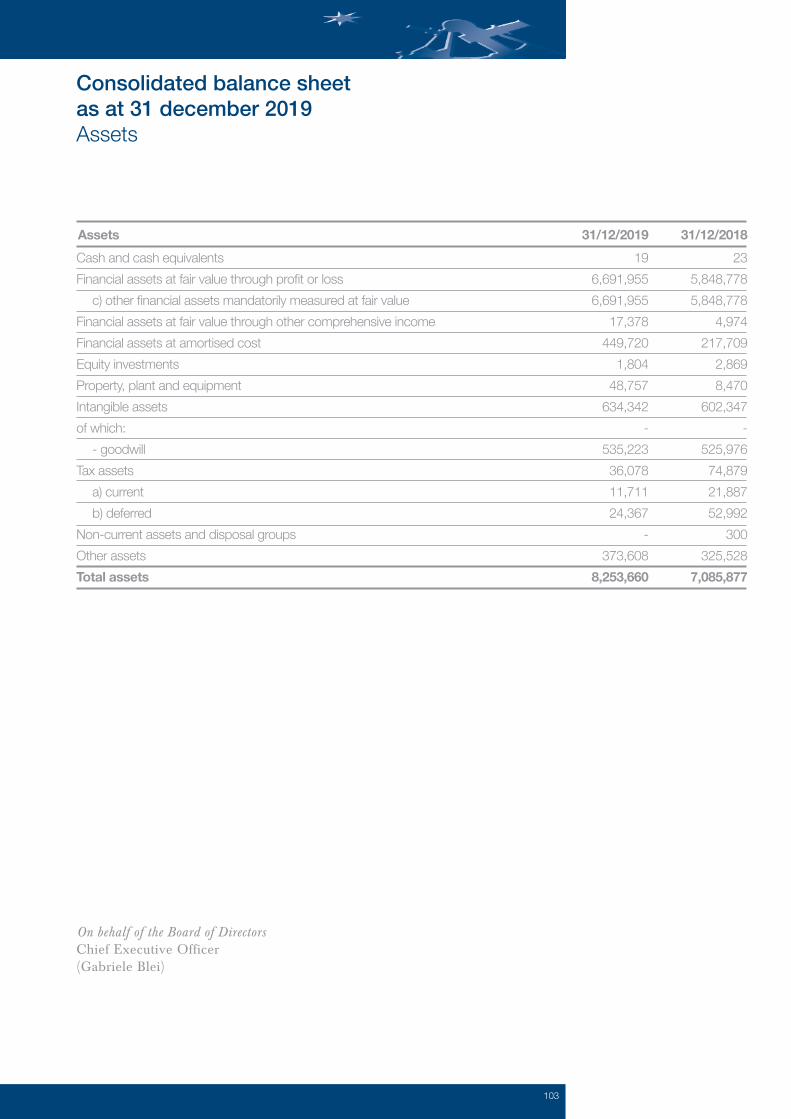
103
Consolidated balance sheetas at 31 december 2019Assets
19 6,691,955 6,691,955
17,378 449,720
1,804 48,757
634,342 -
535,223 36,078 11,711 24,367
- 373,608
8,253,660
23 5,848,778 5,848,778
4,974 217,709
2,869 8,470
602,347 -
525,976 74,879 21,887 52,992
300 325,528
7,085,877
Cash and cash equivalentsFinancial assets at fair value through profit or loss c) other financial assets mandatorily measured at fair valueFinancial assets at fair value through other comprehensive incomeFinancial assets at amortised costEquity investmentsProperty, plant and equipmentIntangible assetsof which: - goodwillTax assets a) current b) deferredNon-current assets and disposal groupsOther assetsTotal assets
Assets 31/12/2019 31/12/2018
On behalf of the Board of DirectorsChief Executive Officer(Gabriele Blei)

104 G r u p p o A z i m u t
Consolidated balance sheetas at 31 december 2019Liabilities and Shareholders’ Equity
371,711 17,546
354,165 177,068
5,582,010 72,505 4,356
68,149 217,527
2,812 37,787 37,787 32,324
-46,337 36,000
173,987 288,003
-5,512 122,146 23,846
7,085,877
960,000 107,525 852,475 176,630
5,976,059 78,514 14,532 63,982
242,212 3,011
45,70345,703 32,324
-23,713 36,000
173,987 161,711
-2,631 370,011 23,842
8,253,660
Financial liabilities at amortised cost a) Payables b) Outstanding securitiesTechnical reserves where the investment risk is borne by policyholdersFinancial liabilities designated at fair valueTax liabilities: a) current b) deferredOther liabilitiesStaff severance pay (TFR)Provisions for risks and charges: c) other provisionsShare capitalTreasury shares (-)Equity instrumentsShare premium reserveReservesValuation reservesProfit (loss) for the yearMinority interestsTotal liabilities
Liabilities and Shareholders’ Equity (Euro/000) 31/12/2019 31/12/2018
On behalf of the Board of DirectorsChief Executive Officer(Gabriele Blei)

105
699,010 (304,791)394,219
3 1,198
(8,922)(9)(9)
(22,138)(13,666)(8,472)2,111
166,035 50,789
(166,859)416,427
(240,699)(97,608)
(143,091)(4,280)(2,295)
(12,522)(522)
(260,318)190
0156,299(15,302)140,997
(417)18,434
941,057 (324,449)616,608
24 994
(14,570)5858
19,4028,286
11,1167,465
276,296 769
(160,449)746,597
(251,522)(108,375)(143,147)(10,159)(10,758)(13,248)
8,496(277,191)
(17)(16,544)452,845(64,903)387,942
(1,692)16,239
Fee and commission incomeFee and commission expenseNet fee and commission incomeDividends and similar incomeInterest income and similar incomeInterest expense and similar chargesProfits (losses) on disposal or repurchase of: b) financial assets at fair value through other comprehensive incomeNet gains (losses) on other financial assets and financial liabilities at fair value through profit or loss a) assets and liabilities designated at fair value b) other financial assets mandatorily measured at fair valueNet premiumsNet profits (losses) on financial instruments at fair value through profit or lossChange in technical reserves where the investment risk is borne by policyholders Redemptions and claimsTotal incomeAdministrative costs: a) personnel costs b) other administrative costsNet accruals to provisions for risks and chargesNet impairment losses/reversals of impairment losses on property, plant and equipmentNet impairment losses/reversals of impairment losses on intangible assetsOther operating income and costsOperating expenseProfits (losses) on equity investmentsImpairment losses on goodwillPre-tax profit (loss) from continuing operationsIncome tax on profit from continuing operationsNet profit (loss) from continuing operationsGains/(losses) of discontinued operations, net of taxesProfit (loss) for the year attributable to minority interests
Items (Euro/000) 31/12/2019 31/12/2018
Consolidated income statementfor the year ended 31 December 2019

106 G r u p p o A z i m u t
Consolidated income statementfor the year ended 31 December 2019
0.9000.900
2.6412.641
Basic earnings per share - EuroDiluted earnings per share - Euro
2019 2018
On behalf of the Board of DirectorsChief Executive Officer(Gabriele Blei)

107
Consolidated statement ofcomprehensive income
140,997
159
3,662 (417)
3,551 144,548 18,434
126,114
387,942
(247)
3,193 (1,692)1,189
389,131 16,239
372,892
Profit (loss) for the yearOther comprehensive income, net of taxes, not transferred to profit or lossDefined benefit plansOther comprehensive income, net of taxes, transferred to profit or lossExchange rate differencesNon-current assets held for saleTotal other comprehensive income (expense), net of taxesComprehensive income Consolidated comprehensive income attributable to minority interestsConsolidated comprehensive income attributable to the parent company
31/12/19Items 31/12/18
On behalf of the Board of DirectorsChief Executive Officer(Gabriele Blei)

108 G r u p p o A z i m u t
Balance at 31/12/18
Changesin opening
balance
Balance at 01/01/19
Reserves Dividends and other
distributions
Changesin reserves
Allocation of prior year profit (loss)
Items
Share capital
Share premium reserve
Other reserves:
a) income-related
b) other
Valuation reserves
Equity instruments
Treasury shares
Profit (loss) for the year
Group shareholders’ equity
Shareholders’ equity attributableto minority interests
32,324
173,987
396,918
(108,915)
(5,512)
36,000
(46,337)
122,146
600,611
23,846
32,324
173,987
396,918
(108,915)
(5,512)
36,000
(46,337)
122,146
600,611
23,846
-
(84,365)
(122,146)
(206,511)
Consolidated statementof changes in shareholders’equity at 31 december 2019

109
32,324
173,987
270,626
(108,915)
(2,631)
36,000
(23,713)
370,011
747,689
70,203
(58,262)
(4,337)
16,239
23,843
Issue of new shares
Shareholders’ equity transactions
(41,927)
22,624
(19,303)
(16,242)
2,881
370,011
372,892
16,239
On behalf of the Board of DirectorsChief Executive Officer(Gabriele Blei)
Treasuryshare
purchases
Changesin equity
instruments
Otherchanges
Consolidatedcomprehensive
income for 2019
Groupshareholders’
equity at 31/12/19
Shareholders’ equity
attributable to minority
interests at 31/12/19
Extraordinary dividend
distribution
Changes during the year

110 G r u p p o A z i m u t
32,324
173,987
383,478
(104,409)
(13,542)
36,000
(130,028)
214,786
592,596
19,592
32,324
173,987
411,443
(104,409)
(9,480)
36,000
(130,028)
214,786
624,623
19,592
(14,525)
(214,786)
(229,311)
-
27,965
4,062
32,027
Balance at 31/12/2017
Changes in openingbalance
Balance at 01/01/2018
Reserves Dividendsand other
distributions
Changesin reserves
Allocation of prior year profit
Items
Share capital
Share premium reserve
Reserves:
a) income-related
b) other
Valuation reserves
Equity instruments
Treasury shares
Profit (loss) for the year
Group shareholders’ equity
Shareholders’ equity attributableto minority interest
Consolidated statementof changes in shareholders’equity at 31 December 2018

111
(40,070)
(40,070)
32,324
173,987
396,918
(108,915)
(5,512)
36,000
(46,337)
122,146
600,611
63,803
(52,680)
(5,711)
18,434
23,846
Issue of new shares
Shareholders’ equity transactions
(4,506)
123,761
119,255
(14,180)
3,968
122,146
126,114
18,434
Treasuryshare
purchases
Changesin equity
instruments
Otherchanges
Consolidatedcomprehensive
income for 2018
Group shareholders’
equity at 31/12/18
Shareholders’ equity
attributable to minorityinterests at
31/12/18
Extraordinary dividend
distribution
Changes during the year
On behalf of the Board of DirectorsChief Executive Officer(Gabriele Blei)

112 G r u p p o A z i m u t
Indirect method
Consolidated cash flow statement
A. Operating activities149,496122,146
0
00
14,8174,2808,026
417(190)
893,7930
1,017,845(626)
(1,301)(11,919)
(110,206)(1,047,529)
(2,358)
(1,023,451)(50,789)29,069(4,240)
459,632370,011
0
00
24,00610,15954,1871,692(423)
446,2890
(388,313)(6,805)
(12,085)(18,813)(20,273)968,080588,712
394,049
(438)(14,243)981,424
1. Operations profit (loss) for the year (+/-) gains/losses on held-for-trading financial assets and financial assets/liabilities at fair value through profit or loss (-/+) gains/losses on hedging activities (-/+) net impairment losses for credit risk (+/-) net impairment losses on property, plant and equipment and intangible assets (+/-) net accruals to provisions for risks and charges and other expenses/income (+/-) taxes and tax credits still to be paid (+) net impairment losses on discontinued assets, net of tax (+/-) other changes (+/-)2. Cash generated from or used by financial assets held-for-trading financial assets financial assets measured at fair value other assets mandatorily measured at fair value financial assets at fair value through other comprehensive income financial assets at amortised cost other assets3. Cash generated from or used by financial liabilities financial liabilities at amortised cost financial liabilities held-for-trading financial liabilities measured at fair value technical reserves other liabilitiesNet cash generated from or used by operating activities
2019 2018
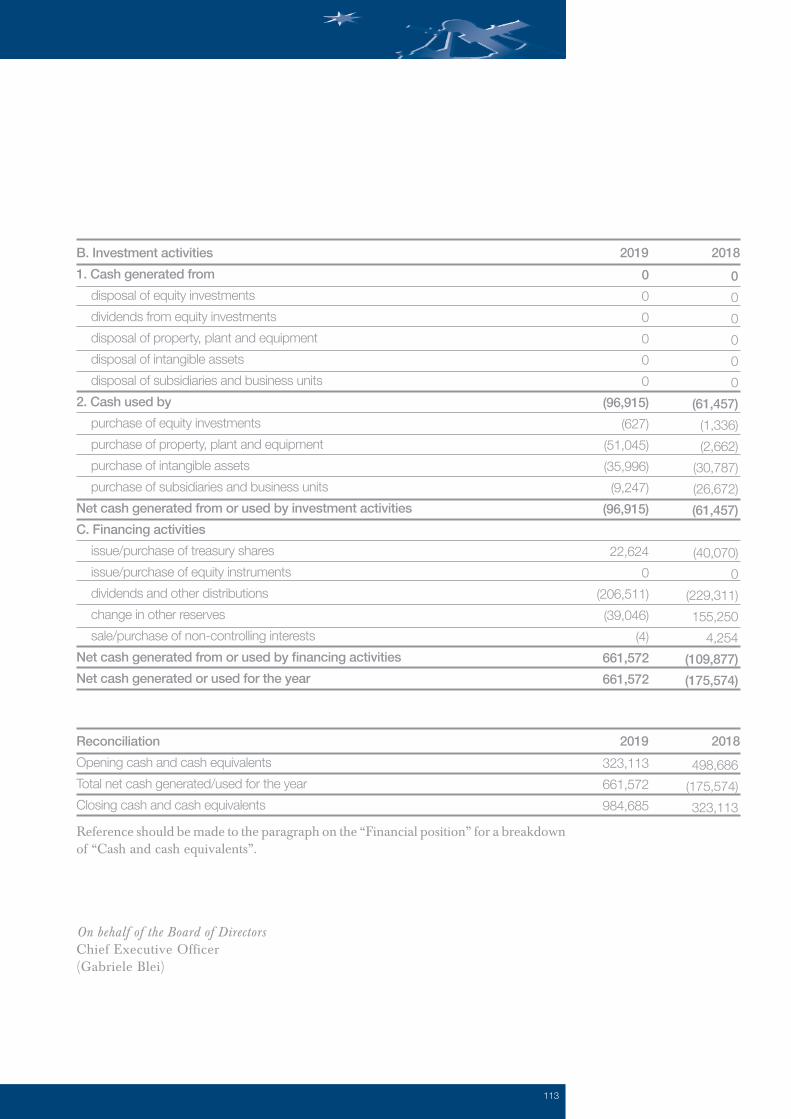
113
000000
(61,457)(1,336)(2,662)
(30,787)(26,672)(61,457)
(40,070)
0(229,311)155,250
4,254(109,877)(175,574)
000000
(96,915)(627)
(51,045)(35,996)(9,247)
(96,915)
22,6240
(206,511)(39,046)
(4)661,572661,572
B. Investment activities1. Cash generated from disposal of equity investments dividends from equity investments disposal of property, plant and equipment disposal of intangible assets disposal of subsidiaries and business units2. Cash used by purchase of equity investments purchase of property, plant and equipment purchase of intangible assets purchase of subsidiaries and business unitsNet cash generated from or used by investment activitiesC. Financing activities issue/purchase of treasury shares issue/purchase of equity instruments dividends and other distributions change in other reserves sale/purchase of non-controlling interestsNet cash generated from or used by financing activities Net cash generated or used for the year
2019 2018
498,686(175,574)323,113
323,113661,572984,685
ReconciliationOpening cash and cash equivalentsTotal net cash generated/used for the yearClosing cash and cash equivalents
2019 2018
On behalf of the Board of DirectorsChief Executive Officer(Gabriele Blei)
Reference should be made to the paragraph on the “Financial position” for a breakdown of “Cash and cash equivalents”.

114 G r u p p o A z i m u t

115
Notes to the consolidatedfinancial statements

116 G r u p p o A z i m u t
Notes to the consolidatedfinancial statements
Part A - Accounting policies
A.1 General information
The consolidated financial statements comply with the International Accounting Standards (IAS) / International Financial Reporting Standards (IFRS) issued by the International Accounting Standards Board (IASB) and the related interpretations of the IFRS Interpretations Committee (IFRIC), endorsed by the European Commission and in force on 31 December 2019, implementing Italian Legislative Decree No. 38/2005 and Regulation (EC) No. 1606/2002. There were no departures from IAS/IFRS.For information about the standards that came into force in 2019, reference should be made to “Section 2 - General reporting criteria” which also describes the impacts, if any, on the Group.
The consolidated financial statements have been drawn up voluntarily in accordance with the instructions issued by the Bank of Italy about the financial statements of asset management companies, within the Measure “IFRS financial statements of intermediaries other than banking intermediaries" of 30 November 2018. The Instructions lay down the mandatory financial statement schedules and how they must be filled in, and the content of the notes thereto for asset management companies that were adequately adjusted to better represent the Group's financial position and business activities, which include the Irish insurance company Az Life Dac. In particular, the balance sheet and income statement include the items which are typical of the insurance business, taking as a reference IVASS Regulation No. 7 dated 13 July 2007 concerning the provisions governing the consolidated financial statements of insurance companies drawn up on the basis of IAS/IFRS. The consolidated financial statements have also been drawn up based on the interpretative documents on the application of IAS/IFRS in Italy prepared by the Italian Accounting Standard Setter (OIC), and the European Securities and Markets Authority (ESMA) and Consob (the Italian Commission for Listed Companies and the Stock Exchange) documents which refer to specific IAS/IFRS. The accounting standards used to prepare these consolidated financial statements, specifically the classification, recognition, measurement and derecognition of financial assets and liabilities, and the recognition of income and expense changed compared to those applied to the 2018 consolidated financial statements.The changes are mainly due to the mandatory application of IFRS 16 “Leases” starting from 1 January 2019.The consolidated financial statements comprise the consolidated balance sheet, the consolidated income statement, the consolidated statement of comprehensive income, the consolidated statement of changes in shareholders’ equity, the consolidated cash flow statement and these notes and are accompanied by the
Section 1Statement of compliance with IAS/IFRS
Section 2General reporting criteria

117
management report on the performance of the companies included in the scope of consolidation.These notes are comprised of four parts: A – Accounting policies, B – Notes to the balance sheet, C – Notes to the income statement, D – Other information.In accordance with the provisions set forth in Article 5, paragraph 2 of Italian Legislative Decree No. 38/2005, the consolidated financial statements have been drawn up by adopting the euro as the reporting currency. Unless otherwise specified, the amounts shown in the financial statements and the notes thereto, as well as those presented in the management report, are in thousands of euro.The consolidated financial statements have been prepared clearly and give a true and fair view of the Group's financial position, results of operations, changes in shareholders' equity and cash flows.The consolidated financial statements have been prepared in accordance with IAS 1 “Presentation of financial statements” and in line with the general assumptions of the “Framework for the preparation and presentation of financial statements” (the framework) prepared by the IASB, specifically with respect to the fundamental principle of substance over form14, the relevance and materiality of financial information, the accruals basis of accounting and the going concern assumption. Except for that provided for or permitted by IAS/IFRS or one of their interpretations or Bank of Italy's provisions on the financial statements of asset management companies, assets and liabilities and costs and revenue are not offset.These consolidated financial statements have been prepared based on the going concern assumption. Financial, operating and other indicators15 have been considered which, as also shown in the document issued on 6 February 2009 by the supervisory authorities Bank of Italy, Consob and IVASS, may highlight problems that could compromise the stability and going concern assumption of the company if not taken into proper consideration.Although the economic outlook for the future is still uncertain, also in light of the impact of the spread of the COVID-19 epidemic described in the section "Significant events after the reporting date" in the Management Report, the joint assessment of the past and current financial position and results of operations of the Group, its operating guidelines, business model and the risks to which business activity is exposed16, leads us to believe that there is no doubt that the Group can continue to operate on a going concern basis for the foreseeable future.
14 Transactions and other corporate events have been recognised and presented in accordance with the principle of substance over form.15 Examples of which are shown in audit standard No. 570 on “Going Concerns”.16 As described in the Management Report.
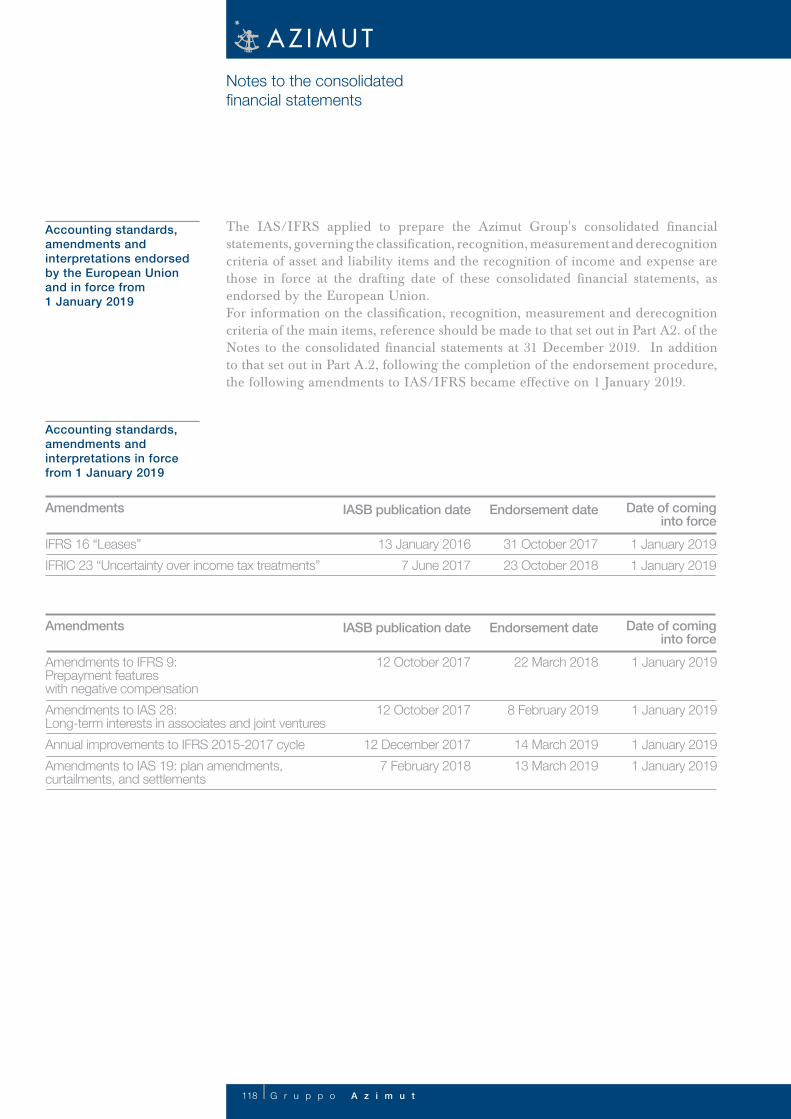
118 G r u p p o A z i m u t
The IAS/IFRS applied to prepare the Azimut Group's consolidated financial statements, governing the classification, recognition, measurement and derecognition criteria of asset and liability items and the recognition of income and expense are those in force at the drafting date of these consolidated financial statements, as endorsed by the European Union.For information on the classification, recognition, measurement and derecognition criteria of the main items, reference should be made to that set out in Part A2. of the Notes to the consolidated financial statements at 31 December 2019. In addition to that set out in Part A.2, following the completion of the endorsement procedure, the following amendments to IAS/IFRS became effective on 1 January 2019.
Accounting standards, amendments and interpretations endorsedby the European Unionand in force from 1 January 2019
Accounting standards, amendments and interpretations in forcefrom 1 January 2019
Notes to the consolidated financial statements
13 January 20167 June 2017
31 October 201723 October 2018
1 January 20191 January 2019
IFRS 16 “Leases”IFRIC 23 “Uncertainty over income tax treatments”
Endorsement date IASB publication dateAmendments Date of cominginto force
12 October 2017
12 October 2017
12 December 20177 February 2018
1 January 2019
1 January 2019
1 January 20191 January 2019
22 March 2018
8 February 2019
14 March 201913 March 2019
Amendments to IFRS 9:Prepayment featureswith negative compensationAmendments to IAS 28:Long-term interests in associates and joint venturesAnnual improvements to IFRS 2015-2017 cycleAmendments to IAS 19: plan amendments, curtailments, and settlements
Endorsement date IASB publication dateAmendments Date of cominginto force

119
Following the European Community’s endorsement of IFRS 16, which became effective in 2019, the Group carried out an in-depth analysis of the areas affected by the new standard, defining their qualitative and quantitative impacts.The main effects of the FTA (1 January 2019) of this standard are described below.
30 January 201418 May 2017
n.a.*1 January 2021
n.a.*---
IFRS 14 “Regulatory deferral accounts”IFRS 17 “Insurance contracts”
Endorsement date IASB publication dateStandards Date of cominginto force
* The European Commission does not intend to start the endorsement process concerning IFRS 14 (interim standard) pending the publication of the final standard governing tariff-regulated activities.
Accounting standards, amendments and interpretations whichwill come into force
22 October 2018
31 October 2018
16 January 2020
1 January 2020
1 January 2020
1 January 2020
---
29 November 2019
15 January 2020
Amendments to IFRS 3:Definition of a businessAmendments to IAS 1 and IAS 8: Definition of materialAmendments to IFRS 9, IAS 39 and IFRS 17: Interest rate benchmark reform
Endorsement date IASB publication dateAmendments Date of cominginto force

120 G r u p p o A z i m u t
Transition to IFRS 16
The following accounting standard, as well as IFRS amendments and interpretations were applied for the first time as from 1 January 2019.On 13 January 2016, the IASB published IFRS 16 – Leases which replaced IAS 17–Leases, and IFRIC 4 Determining whether an Arrangement contains a Lease, SIC-15 Operating Leases—Incentives and SIC-27 Evaluating the Substance of Transactions Involving the Legal Form of a Lease. The standard introduces a new definition of lease and a control-based criterion (right of use) to distinguish between leases and contracts for the provision of services, specifically: the identification of the asset, its right of substitution, the right to obtain substantially all the economic benefits from the use of the asset and, finally, the right to direct the identified asset’s use.It provides a single lessee accounting model, requiring lessees to recognise assets and liabilities for all leases unless, including operating ones. By contrast, the standard does not introduce significant changes in accounting by lessors.Finally, for FTA purposes, the Group opted to apply the so-called modified retrospective approach, whereby the right of use is deemed equal to the lease liability, without modifying the 2018 comparative information in accordance with paragraphs C7-C13 of IFRS 16. Specifically, with respect to the leases previously classified as operating leases, the group recognised:• a financial liability equal to the present value of the residual future lease payments
at the date of transition, discounted at their incremental borrowing rate ruling at the date of transition;
• a right of use equal to the amount of the financial liability at the date of transition, net of any prepayments and accrued income/accrued expenses and deferred income related to the lease and recognised in the balance sheet at the reporting date.
The right of use and the lease liability were estimated at 56.6 million euro at 1 January 2019. The decision to adopt the modified approach (option B) has no impact on shareholders’ equity.
Notes to the consolidated financial statements

121
The table below shows the reconciliation between the consolidated financial statements and shareholders’ equity as at 31 December 2018 and the consolidated financial statements and shareholders' equity as at 1 January 2019 calculated under IFRS 16.
54,385 340
1,858 56,583
56,583 56,583
62,916 62,916
6,333
56,583
ASSETSProperty, plant and equipment Right of use - buildings Right of use - cars Right of use - printers TotalLIABILITIES Payables Lease liabilities Total
Operating lease commitments (IAS 17) not discounted at 31 December 2018Operating lease liabilities to be recognised in the balance sheetas at 1 January 2019, not discounted Discount effect on operating lease liabilities Total lease liabilities (IFRS 16) at 1 January 2019
Impact at the date of transition(01/01/2019)
Euro/000
Reconciliation of lease liabilities 01/01/2019
The table below shows the impact of the adoption of IFRS 16 at the date of transition.

122 G r u p p o A z i m u t
Notes to the consolidated financial statements
23
5,848,778 4,974
217,709
2,869 65,053
602,347 74,879
325,528 7,142,160
428,254 74,129
354,165 177,068
5,582,010
72,505 217,527
2,812 37,787 32,324
-46,337 36,000
173,987 288,003
-5,512 122,146 23,846
7,142,460
56,583
56,583
23
5,848,778 4,974
217,709
2,869 8,470
602,347 74,879
325,528 7,085,577
371,711 17,546
354,165 177,068
5,582,010
72,505 217,527
2,812 37,787 32,324
-46,337 36,000
173,987 288,003
-5,512 122,146 23,846
7,085,877
56,583
56,583
ASSETSCash and cash equivalentsFinancial assets at fair value through profit or lossFinancial assets at fair value through other comprehensive incomeFinancial assets at amortised costEquity investmentsProperty, plant and equipmentIntangible assetsTax assetsOther assetsTotal assets
LIABILITIESFinancial liabilities at amortised cost: b) Payables c) Outstanding securitiesTechnical reserves where the investment riskis borne by policyholders Financial liabilities measured at fair valueTax liabilitiesOther liabilitiesStaff severance pay (TFR)Provisions for risks and chargesShare capitalTreasury shares (-)Equity instrumentsShare premium reserveReservesValuation reservesProfit (loss) for the yearMinority interestsTotal liabilities
01/01/2019
01/01/2019
EFFECTS IFRS 16
EFFECTS IFRS 16
31/12/2018
31/12/2018
thousands of euro
thousands of euro

123
The Group adopted IFRS 16 availing itself of the exemption allowed by paragraph 5(a) of said standard on the short-term leases of the following asset categories: • buildings for office use;• company cars;• printers.Similarly, it availed itself of the exemption allowed by paragraph 5(b) of IFRS 16 related to leases where the underlying asset has a low value (i.e., assets underlying the lease assets never exceed 5 thousand euro, when new). The exemption applied mainly to the following categories:• computers, telephones and tablets;• printers;• other electronic devices.For these leases, the adoption of IFRS 16 had no effect on the recognition of the lease liability and the related right-of-use asset. However, lease payments are recognised in profit or loss on a straight-line basis over the term of the relevant leases. With regard to non-lease components, based on the lease payments related to buildings (e.g., considering the existence of building management fees) and those related to cars and electronic devices (considering the existence of additional ancillary costs), the Group separated them and recognised them separately from lease components and did not consider them together with the latter components when determining the lease liability and the related right-of-use asset.Furthermore, with respect to transition provisions, the Group also availed itself of the following practical expedients available when opting for the modified retrospective approach:• excluding initial direct costs from the measurement of the right-of-use asset at 1
January 2019;• using the information available at the date of transition to determine the lease
term, specifically with respect to the exercise of options to extend or terminate early a lease.
The transition to IFRS 16 also introduces some elements of professional judgement that involve the definition of certain accounting policies and the use of assumptions and estimates in relation to the lease term and the incremental borrowing rate. The main elements are summarised below:• for contracts containing a lease that have an intangible asset as the underlying
asset the Group opted not to apply IFRS 16;• lease term: the Group has analysed all the lease contracts, establishing for each
of them the lease term, given by the “not cancellable” period, together with the effects of any extension or early termination clauses, the exercise of which was considered reasonably certain.
Specifically, for buildings, the valuation considered the specific facts and circumstances of each asset: regardless of the contractual period ("first period" in the case of, for example, the first 6 years of a 6 + 6 term, or "second or subsequent

124 G r u p p o A z i m u t
period"), the reasonable certainty of contract renewal was always considered for leases for which the renewal option is provided, especially when tacit: (e.g., in Italian companies, when the lessor waives the right to refuse the renewal of the lease at the first expiry date for Italy as per Article 29 of Law no. 392/78);With regard to the other categories of assets, mainly company cars and equipment, the Group has generally considered it unlikely that any extension or early termination clauses will be exercised in view of the Group's usual practice: with regard to cars, the car lease does not provide for renewal, while with regard to IT devices, we have included printers and photocopiers for which the term for the remaining duration of the lease coincides with its expiry date when there is no express renewal clause.
Definition of incremental borrowing rateIn order to determine the correct secured and unsecured IBR, the following steps were taken:• for Group companies belonging to the foreign scope: 1. the secured credit curve for each foreign country was calculated starting
from the risk-free rate of the relevant country to which the 0.20% credit spread associated with the Group was added on each node;
2. the unsecured credit curve for each foreign country was calculated starting from the unsecured Italy credit curve to which the differential between the Italy risk-free rate and the risk-free rates of the relevant foreign country was added/subtracted.
• for Group companies belonging to the Italian scope, identified as the combination of the Italy risk-free rate, the credit spread of the company and the characteristics of the underlying asset.
The application of the incremental borrowing rate included an estimate of a different rate at the range of the residual contractual term (compared to the cut-off date of 1 January 2019), in line with the maturity dates of the rates.The operations carried out to create the Italy secured and unsecured IBR curves are shown below:1. the secured credit curve was identified as the combination of the Italy risk-
free curve (I40 Mid YTM EUR ITALIA TIT SOVR 01/01/2019) and the credit spread of the company, calculated considering the yield on the 5-year bond issued by the Parent Company maturing in 2022 (representing the cost of the company's debt).
The differential between the 2% yield of this bond at the 5-year node and the yield of the Italy risk-free curve at the same maturity (1.80%) determined the 0.20% credit spread. In order to determine the secured credit curve, this differential was applied at all nodes of the risk-free curve;
2. the unsecured credit curve BS110 Rnd mid EUR Italia Banche BBB+, BBB, BBB Curva rend BVAL 31/12/18 Rend includes both the risk-free component and the credit spread component associated with the group of a basket of BBB-rated companies.
Notes to the consolidated financial statements
125
The main events that occurred after 31 December 2019, the reporting date of the consolidated financial statements, until 5 March 2020, the date on which the Board of Directors approved the draft consolidated financial statements, are as follows:• In January and February 2020, the company made capital injections totalling
23.5 million euro to increase the share capital of the subsidiary AZ International Holdings SA.
• On 24 February 2020, Azimut Holding’s Board of Directors, based on the authorisation issued pursuant to Article 2357 of the Italian Civil Code by the Shareholders' Meeting of 24 April 2019, valid until 23 October 2020, resolved to avail itself of the above authorisation and to purchase, in a tranche, treasury shares for an indicative amount of up to 50 million euro, and a maximum amount per share of 50 euro. As per the above resolution, 1,570,061 treasury shares were purchased, for a total of 20 million euro.
• On 6 February 2020, Azimut Holding S.p.A.’s Board of Directors approved a capital contribution to Azimut Libera Impresa SGR S.p.A. of up to 18 million euro, to be disbursed in the form of a shareholder loan. On 28 February 2020, Azimut Holding S.p.A. disbursed a first tranche of the shareholder loan amounting to 3 million euro.
For the sake of completeness, it should be noted that, at the preparation date of these consolidated financial statements, the spread of Covid 19 ("Coronavirus”) became a factor of macroeconomic instability, which, in the first few weeks of 2020, initially impacted the economy in China and subsequently spread to other countries, including Italy. This factor could also have a significant impact on the global outlook for future growth, affecting the general macroeconomic scenario, the financial markets, including the sectors in which the Group operates, also in light of the decisions made by government authorities to contain the spread of the epidemic, with a consequent impact on global financial markets.This factor is a non-adjusting event in accordance with IAS 10.21-22. Indeed, although the Coronavirus hit the People's Republic of China near the reporting date, the World Health Organization declared the existence of an international emergency only at the end of January 2020. Furthermore, from the end of January 2020, cases have been diagnosed also in other countries, leading to the adoption of specific decisions both in China and in other countries. Based on the information currently available, it is not possible to determine the possible impacts that may affect the economy and the reference sector in the first quarter of 2020 and the following months with a sufficient degree of reliability - also considering the possibility that such emergency may terminate in the following months, depending on the containment measures envisaged by the governments and competent authorities of the countries affected by the spread of the virus.
The consolidated financial statements were authorised for publication by Azimut Holding S.p.A.’s Board of Directors on 5 March 2020.
Section 3Significant events afterthe reporting date

126 G r u p p o A z i m u t
Risks and uncertainties related to estimatesThe preparation of the consolidated financial statements also entails the use of estimates and assumptions that may have a significant impact on the carrying amounts recognised in the balance sheet and the income statement, and on the disclosure about contingent assets and liabilities. The computation of such estimates is based on the use of available information and the adoption of subjective assessments, also based on historical experience, used to develop reasonable assumptions underlying the recognition of operations. Because of their nature, the estimates and assumptions used may change from year to year. Consequently, it cannot be excluded that the currently reported amounts may differ, also significantly, in the next few years following the change in the subjective assessments used. These estimates mainly relate to:• the estimates and assumptions underlying the valuation models for the fair value
recognition of financial instruments not listed on active markets (level 2 and 3 of the fair value hierarchy), mainly comprising cross put and call options agreed with non-controlling investors and related to the residual capital of the acquired companies;
• the identification of loss events;• the assumptions used to identify impairment losses, if any, on intangible assets
and reported equity investments (IAS 36).In relation to events that occurred after the reporting date, particularly with respect to the macro-economic scenario, the recent global spread of the COVID-19 mentioned above should be noted. This may constitute a new and significant factor of instability, which could influence, above all, the growth expectations of the world economies and, consequently, the performance of financial markets, also impacting the Group's ability to achieve its financial and earnings targets, especially in the short term. Based on the information currently available, it is not possible to determine the possible impacts that may affect the economy, the reference sector and the accounting estimates in the first quarter of 2020 and the following months with a sufficient degree of reliability - also considering the possibility that such emergency may terminate in the following months, depending on the containment measures envisaged by the governments and competent authorities of the countries affected by the spread of the virus.
Notes to the consolidated financial statements
Section 4Other information

127
The consolidated financial statements include the balance sheet and income statement figures of Azimut Holding S.p.A. and the companies directly or indirectly controlled by the latter.
SubsidiariesThe Azimut Group consolidation scope has been established in accordance with IFRS 10. Specifically, subsidiaries are those companies in respect of which the Azimut Group is exposed, or has rights, to variable returns from its involvement with the investees and has the ability to affect those returns through its power over the investees. Control exists only when the following elements simultaneously exist: (i) the power to direct the relevant activities; (ii) exposure, or rights, to variable returns from involvement with the investee; (iii) the ability to use its power over the investee to affect the amount of its returns. Subsidiaries are consolidated on a line-by-line basis as of the acquisition date, i.e., the date on which the Group acquires control in accordance with IFRS 10. They are deconsolidated when the Group no longer controls them.
AssociatesAssociates are those companies subject to significant influence, i.e. companies in which the Azimut Group, either directly or indirectly, holds at least 20% of the voting rights (including “potential” voting rights) or in which – despite holding a smaller percentage of voting rights – has the power to participate in the financial and operating policy decisions, such as the participation in shareholders' agreements, due to specific legal relationships. These companies are consolidated using the equity method whereby on initial recognition the investment is recognised at cost, and the carrying amount is increased or decreased based on the investee’s share of equity, using the most recently approved financial statements of the companies. The difference between the carrying amount of the equity investment and the investee's share of equity is included in the carrying amount of the investee.
Changes to the consolidation scopeCompared to 31 December 2019, the consolidation scope saw the entry of the following companies:• Rasmala Egypt Asset Management (now Azimut Egypt Asset Management),
based in Egypt, following its 100% acquisition by AZ International Holdings Sa;• Azimut (ME) Limited, based in the United Arab Emirates, directly wholly-
owned by AZ International Holdings Sa;• Spencer Fuller & Associates, Spencer Fuller Lending Solutions Pty Ltd, Kellaway
Cridland Pty Ltd, Kellaway Cridland Pty Ltd and Tempus Wealth Group Pty Ltd, in which AZ Next Generation has a direct and indirect investment of 58.44%, respectively;
• Azimut Alternative Capital Partners LLC, based in the United States and 96.5% owned by AZ US Holding Inc;
Section 5Consolidation scopeand methods

128 G r u p p o A z i m u t
while the following companies left the consolidation scope: Azimut Global Counseling S.r.l. (sold to third parties), Sigma Funds Management PTY Ltd (which ceased operations) and Azimut Analytics S.r.l. (in voluntary liquidation).The agreements governing the acquisition of the Australian companies provided for the exchange of the shares of each acquired company with AZ NGA shares and the progressive repurchase of these shares over the next ten years. The residual 51% was paid in cash to the founding members. For information about the acquisitions of the past twelve months, with reference to the difference between the fair value of the assets acquired and the liabilities assumed and the consideration paid to acquire the investments and the amount attributed to "Customer Relationships", reference should made to section 11 - Intangible Assets.Conversely, with respect to the acquisition of Rasmala Egypt Asset Management (now Azimut Egypt Asset Management), the difference between the fair value of the assets acquired and the liabilities assumed and the consideration paid to acquire the investments, totalling 9.548 thousand euro, was entirely allocated to goodwill. The residual two companies which joined the consolidation scope in 2019 (Azimut (ME) Limited and Azimut Alternative Capital Partners LLC) are newcos.
Azimut Holding S.p.A.’s direct and indirect subsidiaries are listed below.

129
A. Wholly-owned companies consolidatedon a line-by-line basis
1. Azimut Capital Management SGR S.p.A.
2. AZ Fund Management SA
3. AZ Life Dac
4. Azimut Enterprises S.r.l.
5. Azimut Libera Impresa SGR S.p.A.
6. Azimut Financial Insurance S.p.A.
7. AZ International Holdings S.A.
8. An Zhong (AZ) Investment Management
9. An Zhong (AZ) Investment Management Hong Kong Ltd
10. AZ Investment Management (Shanghai) Co. Ltd.
11. CGM - Azimut Monaco
12. CGM Italia SGR S.p.A.
13. AZ Swiss & Partners SA
14. SDB Financial Solutions SA
15. Katarsis Capital Advisors SA
16. Eskatos Capital Management Sarl
17. AZ Sinopro Financial Planning Ltd
18. AZ Sinopro Investment Planning Ltd
19. AZ Sinopro Insurance Planning Ltd
20. AZ Investment Management Singapore Ltd
21. AZ Brasil Holdings Ltda
22. AZ Quest Participações SA
23. AZ Quest Investimentos Ltda
24. Azimut Brasil Wealth Management Holding S.A.
25. M&O Consultoria, Planejamento e Análise de Valores Mobiliários Ltda
1.Wholly-owned subsidiaries
Italy
Luxembourg
Ireland
Italy
Italy
Italy
Luxembourg
Hong Kong
Hong Kong
Shanghai
Monaco
Italy
Switzerland
Switzerland
Switzerland
Luxembourg
Taiwan
Taiwan
Taiwan
Singapore
Brazil
Brazil
Brazil
Brazil
Brazil
1
1
1
1
1
1
1
1
1
1
1
1
1
1
1
1
1
1
1
1
1
1
1
1
1
100
51
30
19
100
100
100
100
100
100
100
100
100
100
51
51
100
100
51
51
51
100
99.9
62.69
62.69
89.43
89.43
100
51
30
19
100
100
100
100
100
100
100
100
100
100
51
51
100
100
51
51
51
100
99.9
62.69
62.69
89.43
89.43
Azimut Holding S.p.A.
Azimut Holding S.p.A.
Azimut Capital Management Sgr S.p.A.
Azimut Financial Insurance S.p.A.
Azimut Holding S.p.A.
Azimut Holding S.p.A.
Azimut Holding S.p.A.
Azimut Holding S.p.A.
Azimut Holding S.p.A.
AZ International Holdings SA
An Zhong (AZ) Investment Management
An Zhong (AZ) Investment Management Hong Kong Ltd
AZ International Holdings SA
CGM - Azimut Monaco
AZ International Holdings SA
AZ Swiss & Partners SA
AZ International Holdings SA
Katarsis Capital Advisors SA
AZ International Holdings SA
AZ Sinopro Financial Planning Ltd
AZ Sinopro Investment Planning Ltd
AZ International Holdings SA
AZ International Holdings SA
AZ Brasil Holdings Ltda
AZ Quest Participações SA
AZ Brasil Holdings Ltda
Azimut Brasil Wealth Management Holding S.A.
Name Registeredoffice
Type of ownership (*) Stake
Shareholder % Stake
Votingrights %

130 G r u p p o A z i m u t
26. Futurainvest Investimentos e Participações Ltda
27. Azimut Brasil Wealth Management Ltda
28. Futurainvest Holding SA
29. Azimut Brasil DTVM Ltda
30. Azimut Portföy Yönetimi A.Ş.
31. AZ Mexico Holdings S.A. de CV
32. Mas Fondos S.A.
33. AZ Next Generation Advisory PTY Ltd
34. Eureka Whittaker Macnaught PTY Ltd
35. Pride Advice PTY Ltd
36. Lifestyle Financial Planning Services (LFPS) PTY Ltd
37. Eureka Financial Group PTY Ltd
38. Pride Financial PTY Ltd
39. Wise Planners PTY Ltd
40. Domane Financial Advisers PTY LTD
41. Financial Lifestyle Partners PTY Ltd
42. Harvest Wealth PTY Ltd
43. RI Toowoomba PTY Ltd
44. Empowered Financial Partners PTY Ltd
45. Wealthwise PTY Ltd
46. Priority Advisory Group PTY Ltd
47. Sterling Planners PTY Ltd
48. Logiro Unchartered PTY Ltd
49. Aspire Pty Ltd
50. On-Track Financial Solutions Pty Ltd
51. AZ Sestante Ltd
52. Pride SMSF PTY Ltd
53. Priority Advisory Trust
54. Priority Lifestile Advice Pty Ltd
55. Peters & Partners PTY Ltd
56. Menico Tuck Parrish Financial Solution Pty Ltd
57. AZ Next Generation Accounting PTY Ltd
58. Azimut (DIFC) Limited (formerly AZ New Horizon Ltd)
Brazil
Brazil
Brazil
Brazil
Turkey
Mexico
Mexico
Australia
Australia
Australia
Australia
Australia
Australia
Australia
Australia
Australia
Australia
Australia
Australia
Australia
Australia
Australia
Australia
Australia
Australia
Australia
Australia
Australia
Australia
Australia
Australia
Australia
Australia
United Arab Emirates
1
1
1
1
1
1
1
1
1
1
1
1
1
1
1
1
1
1
1
1
1
1
1
1
1
1
1
1
1
1
1
1
1
1
89.43
71.66
99.9
99.9
100
100
100
58.44
58.44
58.44
58.44
58.44
58.44
58.44
58.44
58.44
58.44
58.44
58.44
58.44
58.44
58.44
58.44
58.44
58.44
100
58.44
58.44
29.22
29.22
58.82
58.44
58.44
100
89.43
71.66
99.9
99.9
100
100
100
58.44
58.44
58.44
58.44
58.44
58.44
58.44
58.44
58.44
58.44
58.44
58.44
58.44
58.44
58.44
58.44
58.44
58.44
100
58.44
58.44
29.22
29.22
58.82
58.44
58.44
100
Azimut Brasil Wealth Management Holding S.A.
Azimut Brasil Wealth Management Holding S.A.
AZ Brasil Holdings Ltda
Futurainvest Holding SA
AZ International Holdings SA
AZ International Holdings SA
AZ Mexico Holdings S.A. de CV
AZ International Holdings SA
AZ Next Generation Advisory PTY Ltd
AZ Next Generation Advisory PTY Ltd
AZ Next Generation Advisory PTY Ltd
AZ Next Generation Advisory PTY Ltd
AZ Next Generation Advisory PTY Ltd
AZ Next Generation Advisory PTY Ltd
Wise Planners PTY Ltd
AZ Next Generation Advisory PTY Ltd
AZ Next Generation Advisory PTY Ltd
AZ Next Generation Advisory PTY Ltd
AZ Next Generation Advisory PTY Ltd
AZ Next Generation Advisory PTY Ltd
AZ Next Generation Advisory PTY Ltd
AZ Next Generation Advisory PTY Ltd
AZ Next Generation Advisory PTY Ltd
Logiro Unchartered PTY Ltd
AZ Next Generation Advisory PTY Ltd
AZ International Holdings SA
Pride Financial Pty Ltd
Priority Advisory Group PTY Ltd
Wise Planners Pty Ltd
Priority Advisory Group Pty Ltd
AZ Next Generation Advisory Accounting PTY Ltd
AZ Next Generation Advisory PTY Ltd
AZ Next Generation Advisory PTY Ltd
AZ International Holdings SA
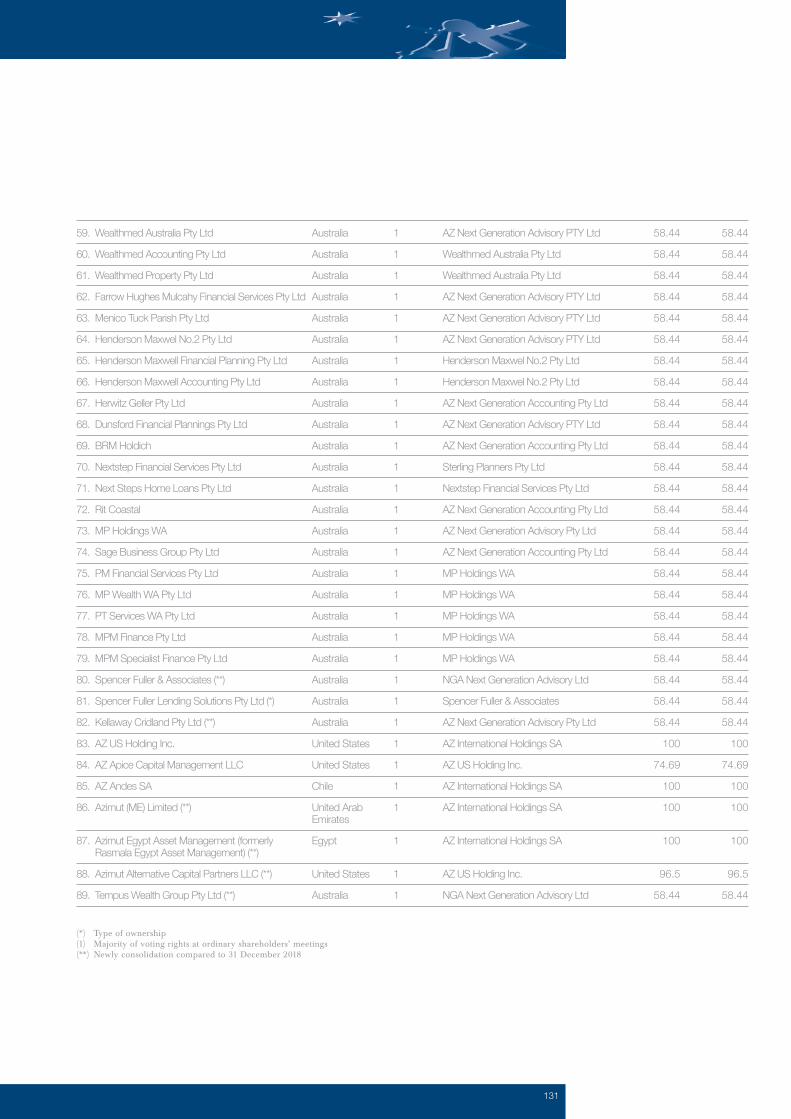
131
59. Wealthmed Australia Pty Ltd
60. Wealthmed Accounting Pty Ltd
61. Wealthmed Property Pty Ltd
62. Farrow Hughes Mulcahy Financial Services Pty Ltd
63. Menico Tuck Parish Pty Ltd
64. Henderson Maxwel No.2 Pty Ltd
65. Henderson Maxwell Financial Planning Pty Ltd
66. Henderson Maxwell Accounting Pty Ltd
67. Herwitz Geller Pty Ltd
68. Dunsford Financial Plannings Pty Ltd
69. BRM Holdich
70. Nextstep Financial Services Pty Ltd
71. Next Steps Home Loans Pty Ltd
72. Rit Coastal
73. MP Holdings WA
74. Sage Business Group Pty Ltd
75. PM Financial Services Pty Ltd
76. MP Wealth WA Pty Ltd
77. PT Services WA Pty Ltd
78. MPM Finance Pty Ltd
79. MPM Specialist Finance Pty Ltd
80. Spencer Fuller & Associates (**)
81. Spencer Fuller Lending Solutions Pty Ltd (*)
82. Kellaway Cridland Pty Ltd (**)
83. AZ US Holding Inc.
84. AZ Apice Capital Management LLC
85. AZ Andes SA
86. Azimut (ME) Limited (**)
87. Azimut Egypt Asset Management (formerly Rasmala Egypt Asset Management) (**)
88. Azimut Alternative Capital Partners LLC (**)
89. Tempus Wealth Group Pty Ltd (**)
Australia
Australia
Australia
Australia
Australia
Australia
Australia
Australia
Australia
Australia
Australia
Australia
Australia
Australia
Australia
Australia
Australia
Australia
Australia
Australia
Australia
Australia
Australia
Australia
United States
United States
Chile
United ArabEmirates
Egypt
United States
Australia
1
1
1
1
1
1
1
1
1
1
1
1
1
1
1
1
1
1
1
1
1
1
1
1
1
1
1
1
1
1
1
58.44
58.44
58.44
58.44
58.44
58.44
58.44
58.44
58.44
58.44
58.44
58.44
58.44
58.44
58.44
58.44
58.44
58.44
58.44
58.44
58.44
58.44
58.44
58.44
100
74.69
100
100
100
96.5
58.44
58.44
58.44
58.44
58.44
58.44
58.44
58.44
58.44
58.44
58.44
58.44
58.44
58.44
58.44
58.44
58.44
58.44
58.44
58.44
58.44
58.44
58.44
58.44
58.44
100
74.69
100
100
100
96.5
58.44
AZ Next Generation Advisory PTY Ltd
Wealthmed Australia Pty Ltd
Wealthmed Australia Pty Ltd
AZ Next Generation Advisory PTY Ltd
AZ Next Generation Advisory PTY Ltd
AZ Next Generation Advisory PTY Ltd
Henderson Maxwel No.2 Pty Ltd
Henderson Maxwel No.2 Pty Ltd
AZ Next Generation Accounting Pty Ltd
AZ Next Generation Advisory PTY Ltd
AZ Next Generation Accounting Pty Ltd
Sterling Planners Pty Ltd
Nextstep Financial Services Pty Ltd
AZ Next Generation Accounting Pty Ltd
AZ Next Generation Advisory Pty Ltd
AZ Next Generation Accounting Pty Ltd
MP Holdings WA
MP Holdings WA
MP Holdings WA
MP Holdings WA
MP Holdings WA
NGA Next Generation Advisory Ltd
Spencer Fuller & Associates
AZ Next Generation Advisory Pty Ltd
AZ International Holdings SA
AZ US Holding Inc.
AZ International Holdings SA
AZ International Holdings SA
AZ International Holdings SA
AZ US Holding Inc.
NGA Next Generation Advisory Ltd
(*) Type of ownership(1) Majority of voting rights at ordinary shareholders’ meetings(**) Newly consolidation compared to 31 December 2018
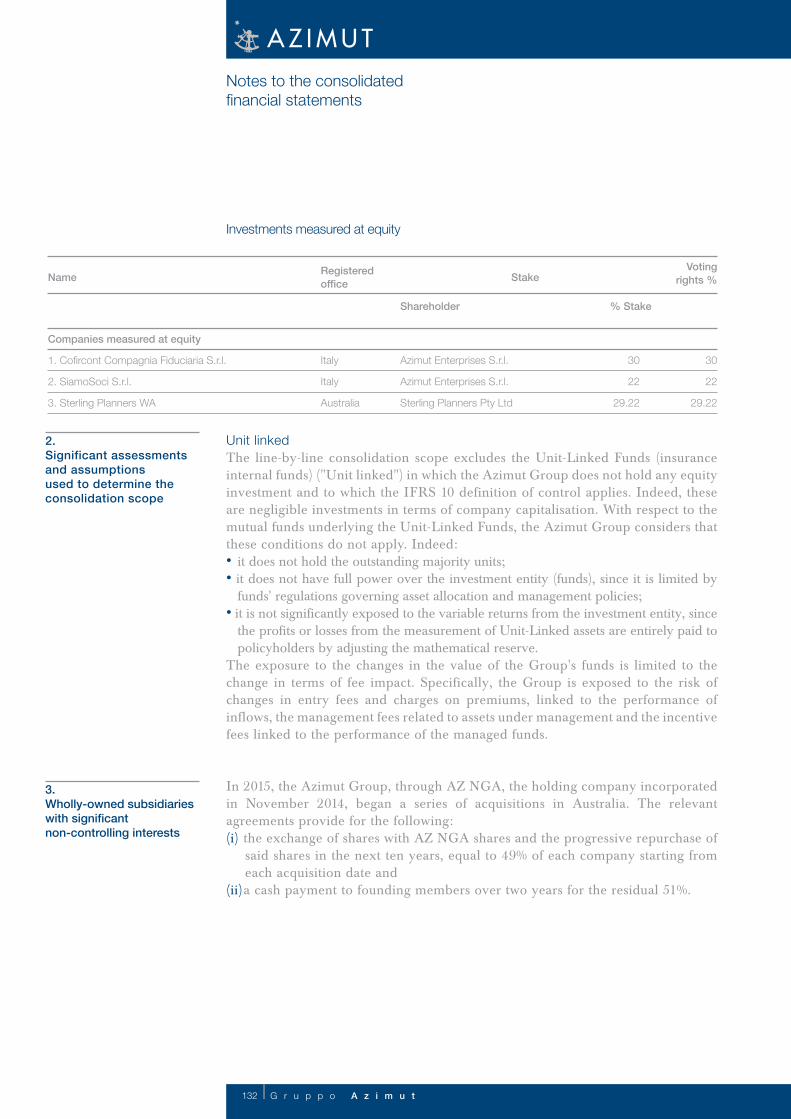
132 G r u p p o A z i m u t
Unit linkedThe line-by-line consolidation scope excludes the Unit-Linked Funds (insurance internal funds) ("Unit linked") in which the Azimut Group does not hold any equity investment and to which the IFRS 10 definition of control applies. Indeed, these are negligible investments in terms of company capitalisation. With respect to the mutual funds underlying the Unit-Linked Funds, the Azimut Group considers that these conditions do not apply. Indeed:• it does not hold the outstanding majority units;• it does not have full power over the investment entity (funds), since it is limited by
funds' regulations governing asset allocation and management policies;• it is not significantly exposed to the variable returns from the investment entity, since
the profits or losses from the measurement of Unit-Linked assets are entirely paid to policyholders by adjusting the mathematical reserve.
The exposure to the changes in the value of the Group's funds is limited to the change in terms of fee impact. Specifically, the Group is exposed to the risk of changes in entry fees and charges on premiums, linked to the performance of inflows, the management fees related to assets under management and the incentive fees linked to the performance of the managed funds.
In 2015, the Azimut Group, through AZ NGA, the holding company incorporated in November 2014, began a series of acquisitions in Australia. The relevant agreements provide for the following: (i) the exchange of shares with AZ NGA shares and the progressive repurchase of
said shares in the next ten years, equal to 49% of each company starting from each acquisition date and
(ii) a cash payment to founding members over two years for the residual 51%.
3.Wholly-owned subsidiaries with significantnon-controlling interests
2. Significant assessments and assumptions used to determine the consolidation scope
Notes to the consolidated financial statements
Investments measured at equity
Companies measured at equity
1. Cofircont Compagnia Fiduciaria S.r.l.
2. SiamoSoci S.r.l.
3. Sterling Planners WA
Italy
Italy
Australia
30
22
29.22
30
22
29.22
Azimut Enterprises S.r.l.
Azimut Enterprises S.r.l.
Sterling Planners Pty Ltd
Name Registeredoffice Stake
Shareholder % Stake
Votingrights %
133
4.Significant restrictions
5.Other information
There are no significant legal, contractual or regulatory restrictions within the Azimut Group which may limit the Parent Company's ability to transfer cash and cash equivalents or other assets to other Group companies, or guarantees which may limit the distribution of dividends, capital or loans and advances granted to or repaid by other Group companies.
Basis of consolidationInvestments in subsidiaries are consolidated on a line-by-line basis, while interests in jointly-controlled entities and associates are measured using the equity method.
Line-by-line methodUnder this consolidation method, the companies' balance sheet and income statements figures are consolidated line-by-line. The carrying amount of equity investments is offset against the residual equity of the subsidiary after allocating the relevant portions of equity and profit or loss to non-controlling interests. Positive differences are recognised under “Intangible assets” as goodwill, after allocation to the subsidiary's asset or liability items measured at fair value, upon acquisition and first-time consolidation. Conversely, negative differences are taken to profit or loss.For the purposes of consolidation, the financial statements at 31 December 2019 of consolidated companies were used. They were prepared in accordance with the IFRS and Group criteria to which they make reference. The financial statements used are those prepared by the Boards of Directors of each company, duly reclassified and adjusted to comply with the above standards and criteria. The data about individual financial statements are obtained through the information included in the reporting packages of the consolidated companies at 31 December 2019.The Parent Company’s financial statements and those of the subsidiaries have been consolidated on a line-by-line basis, including all subsidiaries and assuming all assets, liabilities, costs and income of each subsidiary, while eliminating the carrying amount of the equity investments against the relevant share/quotaholders' equity, as set out by the IFRS. The assets, liabilities, costs and income generated by transactions among consolidated companies have been eliminated in full, as have the profits and losses generated by transactions among consolidated companies which do not involve third parties.The positive differences between the equity investments consolidated on a line-by-line basis and the related net fair value of the acquired assets and assumed liabilities, were considered as goodwill on consolidation upon first consolidation and tested for impairment to check the adequacy of their carrying amount every year.For consolidated companies that prepare their financial statements in a functional currency other than that of the Parent Company, the amounts expressed in currencies other than the euro were translated as follows: for the balance sheet, using the closing rate, and for the income statement, using the average exchange rate

134 G r u p p o A z i m u t
for the year. The differences arising from the translation of opening shareholders’ equity using closing rates, along with those triggered by the use of closing and average exchange rates for the year are classified under the specific item Exchange rate differences in the Valuation reserve.
Equity methodThe equity investments over which the Group has significant influence or has joint control, as defined by IAS 28, are measured using the equity method.Under this method, the equity investment is initially recognised at cost and the carrying amount is increased or decreased to reflect the parent's share of profit or loss of the investee earned/incurred after the acquisition date. The share of the profit (loss) for the year attributable to the parent is recognised in the latter's income statement. The dividends received from an investee decrease the carrying amount of the equity investment. Furthermore, the carrying amount may be adjusted also following the change in the equity interest in the investee, due to changes in the latter's equity not recognised in the income statement. These changes include those arising from the translation of foreign currency items. The portion related to these changes is recognised directly in equity. When the investee incurs losses and these losses exceed the carrying amount of the investment, the latter's carrying amount is zeroed and any further losses are recognised only when the parent has legal or constructive obligations or has made payments on behalf of the investee. If the investee subsequently earns a profit, the parent recognises the share of profit attributable to it only when it has reached the same amount of the previously unrecognised loss.The consolidation of associates and/or jointly-controlled entities considers the financial statements prepared and approved by the board of directors of each company.
Business combinations carried out in 2019With respect to the adoption of IFRS 3 and the fair value measurement of the assets and liabilities of the companies acquired in 2019, the relevant standard provides for the provisional allocation of the acquisition cost, to be finalised within 12 months of the acquisition date.
A.2 Key financial statements items
This section describes the accounting standards used to prepare the consolidated financial statements at 31 December 2019, specifically the classification, recognition, measurement and derecognition of assets and liabilities items, and the recognition of income and expense. The accounting standards have been applied consistently in the current and previous years.
Notes to the consolidated financial statements

135
1Financial assets at fair value through profit or loss (FVTPL)
ClassificationThis item comprises financial assets other than those classified under financial assets at fair value through other comprehensive income and financial assets at amortised cost. Specifically, it may include: • held-for-trading financial assets; • equity instruments, except for the possibility of classifying them under the new
category: financial assets at fair value through other comprehensive income, not transferred to profit or loss;
• financial assets mandatorily measured at fair value, which did not meet the requirements necessary for application of the amortised cost method;
• financial assets not held as part of a hold to collect (“HTC”) business model or a mixed business model whose objective is achieved by collecting the contractual cash flows of the financial assets in portfolio or through a sale transaction which is an integral part of the strategy (“Hold to Collect and Sell” business model);
• financial assets designated at fair value, i.e., the financial assets designated as such upon initial recognition and when the relevant requirements are met. With respect to this category, an entity may irrevocably designate a financial asset at fair value through profit or loss if, and only if, it eliminates or significantly reduces a measurement inconsistency;
• derivatives, to be recognised under held-for-trading financial assets when the fair value is positive and under liabilities, if negative. Offsetting is possible only to the extent of transactions carried out with the same counterparty when there is a legally enforceable right of setoff and an entity has the intention to settle a financial asset and a financial liability net. Derivatives include those embedded in hybrid financial instruments - where the host contract is a financial liability - which were recognised separately.
Reclassifications of financial assets, except for equity instruments for which no reclassification is allowed, are not allowed between other categories of financial assets unless an entity’s business model objective for its financial assets changes. In such cases, which must not be frequent, the financial assets may be reclassified from the fair value through profit or loss category to one of the two other categories introduced by IFRS 9 (fair value through other comprehensive income and amortised cost). The amount of the reclassification is the fair value upon reclassification and the effects of the reclassification are applied prospectively as of the reclassification date. In this case, the effective interest rate of the reclassified financial asset is calculated based on its fair value at the reclassification date and this date is considered as the initial recognition date for credit risk stage assignment for impairment purposes.Specifically, this item includes:• investments relating to insurance contracts (unit-linked policies) issued by the Irish
subsidiary AZ Life Dac where the investment risk is borne by policyholders and comprise UCI units;
• financial assets comprised of UCI units held by the Group companies in the context of liquidity management policies.

136 G r u p p o A z i m u t
RecognitionFinancial assets are initially recognised at the settlement date for debt instruments and equity instruments, at the disbursement date for loans and at the signing date for derivatives.Upon initial recognition, financial assets at fair value through profit or loss are recognised at fair value, without considering transaction costs or proceeds that are directly attributable to the instrument.
Measurement and recognition of income and expenseSubsequent to initial recognition, financial assets at fair value through profit or loss are measured at fair value. The effects of the application of this measurement criteria are taken to profit or loss.The fair value of financial instruments quoted in an active market is calculated using market prices. When no active market exists, commonly-used estimate methods and valuation models are applied which consider all risk factors related to the instruments and which are based on market data, such as: valuation of quoted instruments with similar characteristics, calculation of discounted cash flows, models to recalculate option prices, amounts recognised in recent similar transactions, etc.. The cost criterion is used to estimate the fair value of equity instruments and derivatives related to equity instruments, not quoted in an active market, only on a residual basis and limited to few circumstances, i.e., when none of the above methods can be used or in the case of a large range of fair value measurement possibilities, when cost is the most significant estimate.
DerecognitionFinancial assets are derecognised when the contractual rights to the cash flows generated by the assets expire or when the asset is sold and all the risks and rewards of ownership have been transferred.
ClassificationThis category includes the financial assets which meet both the following conditions:• the financial asset is held within a business model whose objective is achieved by
both collecting contractual cash flows and selling financial assets (“Hold to Collect and Sell” business model);
• the contractual terms of the financial asset give rise on specified dates to cash flows that are solely payments of principal and interest on the principal outstanding amount (SPPI test passed). It also includes equity instruments, not held for trading, for which the option to designate a financial asset at fair value through other comprehensive income is exercised upon initial recognition.
Specifically, this item includes:• debt instruments under a Hold to Collect and Sell business model which passed the
SPPI test;• equity investments, other than in subsidiaries, associates or jointly-controlled entities,
not held for trading, for which the option to designate a financial asset at fair value through other comprehensive income has been exercised.
Notes to the consolidated financial statements
2Financial assets at fair value through other comprehensive income (FVTOCI)
137
Reclassifications of financial assets, except for equity instruments for which no reclassification is allowed, are not allowed between other categories of financial assets unless an entity’s business model objective for its financial assets changes.In such cases, which must not be frequent, the financial assets may be reclassified from the fair value through other comprehensive income category to one of the two other categories introduced by IFRS 9 (fair value through profit or loss and amortised cost). The amount of the reclassification is the fair value upon reclassification and the effects of the reclassification are applied prospectively as of the reclassification date. With respect to the reclassification from this category to that of the amortised cost, the cumulative gain or loss recognised in the fair value reserve is taken as an adjustment to the fair value of the financial asset at the reclassification date.Conversely, with respect to the reclassification to the fair value through profit or loss category, the cumulative gain or loss previously recognised in the fair value reserve is reclassified from equity to profit or loss.
RecognitionFinancial assets are initially recognised at the settlement date based on their fair value, inclusive of transaction costs/proceeds that are directly attributable to the acquisition of the financial instrument.The costs/proceeds which, despite having the above characteristics, are repaid by the counterparty or fall under administrative internal ordinary costs, are excluded.The initial fair value of a financial instrument is usually equal to the purchase cost incurred.
Measurement and recognition of income and expenseSubsequent to initial recognition, financial assets are recognised at their fair value, recognising any fair value gains or losses on the amortised cost in the specific shareholders’ equity reserve in the statement of comprehensive income until disposal or impairment.Equity instruments classified under this category are measured at fair value and the amounts recognised as a balancing entry in shareholders’ equity (Statement of comprehensive income) are not subsequently taken to profit or loss, including in the event of disposal (OCI exemption). Dividends are the only item related to equity instruments which is taken to profit or loss. Fair value is calculated based on the criteria already described in respect of Financial assets at fair value through profit or loss. The cost criterion is used to estimate the fair value of the equity instruments included in this category, not quoted in active market, only on a residual basis and limited to few circumstances, i.e., when none of the above methods can be used or in the case of a large range of fair value measurement possibilities, when cost is the most significant estimate.
DerecognitionFinancial assets are derecognised when the contractual rights to the cash flows generated by the assets expire or when the asset is sold and all the risks and rewards of ownership have been transferred.

138 G r u p p o A z i m u t
ClassificationThis item includes the amounts due from banks, from financial institutions, from customers and managed funds, or all receivables involving fixed payments or in any case payments which are definable and are not listed on an active market.
RecognitionFinancial assets are initially recognised at the settlement date for debt instruments and at the disbursement date for receivables. Upon initial recognition, financial assets are measured at fair value, including transaction costs or proceeds that are directly attributable to the instrument.Specifically, with respect to receivables, the disbursement date normally coincides with the date the contract is signed. When this is not the case, upon signing of the contract, a loan commitment is recognised which ceases when the relevant amount is disbursed. Receivables are initially recognised at fair value, equal to the amount granted, or the subscription price, including the cost/income directly referable to the individual receivable and determinable from the beginning of the operation, even when settled at a later date.The costs which, despite having the above characteristics, are repaid by the counterparty or fall under administrative internal ordinary costs, are excluded.
Measurement and recognition of income and expenseSubsequent to initial recognition, receivables are measured at amortised cost, equal to the initially recognised amount decreased/increased by the repayment of principal, net impairment losses/reversals of impairment losses and amortisation - calculated using the effective interest method - of the difference between the amount disbursed and the repayable one upon maturity, which usually refers to the costs/income directly allocated to individual receivables.The effective interest rate is the rate that discounts estimated future cash payments through the expected life of the receivable to obtain exactly the carrying amount upon initial recognition, which includes both directly attributable transaction revenues/costs and all fees paid or received by the parties to the contract. This method is based on a financial logic and enables entities to allocate the economic effect of income/expense over the residual life of the loan.The measurement criteria are closely related to the stage to which the loan is assigned, where stage 1 comprises performing loans, stage 2 under-performing loans, i.e., those loans where the credit risk rose significantly compared to initial recognition and stage 3 non-performing loans, i.e., those loans which show a significant impairment loss.Impairment losses are taken to profit or loss. Those related to performing loans under stage 1 are calculated considering a one-year expected loss, while those under stage 2 refer to the life time expected credit losses. Performing loans are measured using the following parameters: probability of default (PD), loss given default (LGD) and exposure at default (EAD), derived from historical internal series. With respect to impaired loans, the loss to be recognised in profit or loss
Notes to the consolidated financial statements
3Financial assetsat amortised cost

139
4Equity investments
is calculated based on an analytical measurement process or based on similar categories and, hence, allocated analytically to each position and considering forward looking information and possible alternative recovery scenarios.Impaired loans comprise the financial instruments classified as bad loans, unlikely-to-pay exposures/overdrawn and/or past-due exposures by more than 90 days in accordance with Bank of Italy’s regulations, in line with IAS/IFRS and European supervisory regulations. The expected cash flows consider the expected recovery time and the expected realisable value of guarantees, if any. The original effective rate of each asset is unchanged over time even though the relationship has been restructured, resulting in a change in the contractual rate or the relationship, in practice, no longer bears contractual interest. If the reasons for the impairment loss no longer apply following an event subsequent to the initial recognition, the original amount is reversed through profit or loss. Reversals of impairment losses shall not exceed the amortised cost of the instrument had no impairment losses been recognised. Reversals of impairment losses relating to the passing of time are taken to net interest income. The amortised cost coincides with the nominal amount.
DerecognitionReceivables are derecognised when they are no longer recoverable or when they are transferred, when all risks and rewards incidental to the receivables are substantially transferred.
ClassificationEquity investments include equity investments that are deemed to be strategic investments. Companies are classified as associates when the Group has significant influence thereon, but not control or joint control over their financial and operating policies. The Group has a significant influence on a company when it holds at least 20% of the voting rights, unless it can be clearly demonstrated that this is not the case. The possible exercise or conversion of potential voting rights is a factor to be considered in deciding whether significant influence exists.
Recognition and measurement Equity investments in associates are recognised using the equity method which provides for initial recognition at cost. The equity investment is subsequently adjusted to reflect the share of the profit (or loss) of the associate after the date of acquisition.Minority interest does not include any potential voting rights.Since goodwill included in the carrying amount of a given investment in an associate is not recognised separately, this value is not subjected to a separate impairment test, in line with the provisions set forth in IAS 36 Impairment of assets. On the other hand, the investment’s full carrying amount is tested for impairment pursuant to IAS 36, by comparing its recoverable amount – calculated based on the value in use – and its corresponding carrying amount, whenever the application of the provisions

140 G r u p p o A z i m u t
set forth in IAS 36 indicates a potential impairment. The differences between the value of the equity investment and the associate’s shareholders’ equity are included in the associate’s carrying amount, whereas the share of the profits/(losses) generated during the year by the associate in question is recognised in the consolidated income statement. Any impairment losses on the equity investment pursuant to IAS 36 are recognised in the income statement.
ClassificationThey include business properties, technical plant, furniture and fixtures, other machinery and equipment of any kind and leasehold improvements.With reference to business properties, IAS 16 establishes that land is to be recognised separately from buildings since only the latter is subject to depreciation as the useful life is not indefinite. This separation is necessary only in the case of self-contained properties: no separation is necessary if the property consists of a portion of the building (for example an apartment), since in this case the company does not own the surrounding land or land beneath. Azimut Group owns portions of property and therefore no separation was adopted for their measurement.
Recognition and measurement They are initially recognised at cost, including the additional costs directly attributable to the acquisition and start-up of the asset. They are subsequently measured at cost, less depreciation and impairment losses. Depreciation is charged annually on a straight-line basis over the remaining useful life.The rights of use acquired as part of the leases and related to the use of asset (for lessees) and the assets under operating lease (for lessors) are also included.Leasehold improvements are recognised under assets since the tenant essentially has control over the assets and may receive economic benefits therefrom. Therefore, they are depreciated over a period corresponding to the remaining duration of the lease.
DerecognitionProperty, plant and equipment are derecognised upon disposal or when the asset has been retired and future benefits are not expected from its disposal.
ClassificationIntangible assets include goodwill, customer relationships and application software for long-term use.
RecognitionGoodwill on consolidation is determined, on first-time consolidation, based on the difference between the fair value of the subsidiaries’ shareholders’ equity and the carrying amount of the investments.
Notes to the consolidated financial statements
6Intangible assets
5Property, plant andequipment

141
8Other assets
7 Tax assets and liabilities
MeasurementGoodwill and goodwill on consolidation are not amortised systematically, but are tested for impairment annually to check the adequacy of the carrying amount in accordance with that set out in IAS 36 Impairment of assets. Software is recognised at cost, net of amortisation and impairment losses. Such assets are amortised based on their estimated residual useful life.Customer relationships are recognised on a ten-year horizon, based on the historical percentage of deterioration of assets under management (AUM).
Recognition of income componentsThe amount of the impairment, determined on the basis of the difference between the carrying amount and its recoverable amount, if lower, is recognised in the income statement.
DerecognitionIntangible assets are derecognised at the date of disposal and when no future economic benefits are expected.
Current taxes are calculated in accordance with ruling tax rates and legislation. When they are not paid, they are recognised under liabilities. Income taxes are recognised in the income statement, except for those related to items directly credited or debited to equity. The provision for taxes is recognised based on a prudent estimate of the current and deferred tax charge.The balance-sheet liability method is applied to deferred taxes. Specifically, deferred tax assets and liabilities are calculated in respect of the temporary differences – without time limits – arising between the carrying amount of assets and liabilities and their value for tax purposes. Deferred tax assets are recognised to the extent their recovery is probable, based on the company's ability to generate ongoing positive taxable income.
This item includes assets which are not ascribable to other assets items. Other assets include prepayments related to the incentives paid to financial advisors, including incentive costs, which usually remunerate sales activities carried out over several years, related to total inflow targets and are directly attributable to existing contracts that meet the capitalisation requirements under the new cost category (contract costs) introduced by IFRS 15. In this case, an amortisation period was defined, related to the payback period of the costs incurred upon transfer of the services covered by the investment contracts to customers, based on the contractual term set out in the stability pact agreed with the individual financial advisor, i.e., the minimum time horizon within which, in the event of exit, the advisor is required to return any related incentives received. This item also includes prepayments on the fee and commission expenses payable to the sales network for the sale of “no load” products. These funds do not charge an entry fee, but are able to break-even by charging an exit fee

142 G r u p p o A z i m u t
for a specific amount of time. Therefore, they are recognised in the income statement over the foregoing period in accordance with the matching principle.Finally, other assets include the prepayments generated by the deferral of commission expenses incurred for the purchase of unit-linked policies classified as investment contracts.
ClassificationThis item comprises Due to banks, Due to financial institutions, Due to customers, Lease liabilities and Outstanding securities.
PayablesMeasurement and recognitionShort-term trade payables (due within one year) are recognised at their par value. Payables in the form of medium/long-term loans, initially recognised at the amount collected, net of transaction costs if any, are subsequently measured at amortised cost using the effective interest rate method.
DerecognitionPayables are derecognised once settled.
Outstanding securitiesThis item includes the bonds issued by Azimut Holding S.p.A.
RecognitionOutstanding securities are recognised when issued or when a new placement takes place based on the “settlement date” principle. They are initially recognised at fair value which usually corresponds with the collected amount or the issue price, adjusted to reflect any additional cost and income directly attributable to funding or issue transactions. Internal administrative costs are not included. The fair value of outstanding securities issued at below-the-market conditions is subject to a specific estimate and the difference with respect to market value is taken directly to the income statement. In the case of convertible debt instruments, the costs borne for the bond issue are allocated proportionally to the debt component and the equity component.
Measurement and recognition of income and expenseSubsequent to initial recognition, the debt component is measured at amortised cost, using the effective interest rate method. Interest expense is recognised under Interest expense and similar charges in the income statement, using the effective interest rate method.
DerecognitionOutstanding securities are derecognised after expiry or settlement. They are derecognised also when previously issued securities are repurchased. The
Notes to the consolidated financial statements
9Financial liabilities at amortised cost

143
11Financial liabilities measured at fair value
10Technical reserves where the investment risk isborne by policyholders
12Other liabilities
difference between the carrying amount of the security and the amount paid to repurchase it is taken to the income statement. A new placement of own securities subsequent to their repurchase is considered a new issue with the recognition of the new placement price, with no impact on the income statement.
Commitments to holders of unit-linked policies issued by AZ Life Dac, classified as insurance contracts since they include a considerable insurance risk, are measured based on actuarial criteria, by taking account of the value of the financial assets to which the benefits are linked.
This item includes:(i) the commitments to policyholders arising from the unit-linked policies issued
by AZ Life Dac, classified as investment contracts where the investment risk is borne by policyholders;
(ii) the liabilities arising from the future exercise of the call options of the residual portion of share capital of some recently acquired companies;
(iii) the covered warrant which provides employees/managers with the option to subscribe the purchase or sale of a specific underlying financial asset at a pre-established price and date.
Recognition and measurementThe measurement of call options reflects the amount to be paid – in Azimut Holding shares, where contractually provided for – to sellers, following the exercise of the call options. The measurement reflects the estimated amount to be paid to the seller, based on the estimate of the future parameters set out in the relevant contracts, including AUM, profit for the year and price of the Azimut Holding shares, which are subject to specific sensitivity analyses. The change in the amount on first recognition is taken to the income statement.
DerecognitionFinancial liabilities are derecognised once settled.
ClassificationThis item includes liabilities that are not ascribable to other liability items. This item includes: (i) the liabilities for the purchase of residual equity investments in some
subsidiaries, as per the relevant agreements. In addition, this item includes the deferred income arising from the deferral of fee and commission income on the premiums of unit-linked policies classified as investment contracts over the expect term of the policies;
(ii) the liabilities in the form of the contractual commitments relating to fees and commissions, including retention fees, to be paid to financial advisors in

144 G r u p p o A z i m u t
14Provisions for risks and charges
13Staff severance pay (TFR)
the medium/long-term (over 12 months), calculated on the basis of actuarial criteria and representing the best estimate of the expense required to settle the foregoing liabilities.
RecognitionShort-term liabilities (due within 12 months) and trade payables are recognised at their par value.
DerecognitionOther liabilities are derecognised once settled.
In accordance with the legislation governing TFR introduced by Legislative Decree dated 5 December 2005, the staff severance pay (TFR), to the extent of the portion accrued until 31 December 2007, qualifies as a defined benefit plan and is therefore subject to actuarial measurement, using the Projected Unit Credit Method (PUCM) which projects future cash flows based on historical analyses, statistics and probabilistic analyses and applying adequate demographic techniques. Cash flows are discounted using the market interest rate. Actuarial calculations are performed by independent actuaries.Service costs are included under personnel costs item “Administrative costs; a) personnel costs”, net of the contributions paid, those pertaining to prior years not yet recognised, interest accrued and expected income arising from plan assets. In accordance with IAS 19, actuarial gains and losses are recognised in a specific Valuation reserve.
RecognitionAccruals to provisions for risks and charges are recognised if, and only if:• there is a present obligation (legal or constructive) as a result of past events;• it is probable that an outflow of resources will be required to generate economic
benefits; and• a reliable estimate can be made of the amount of the obligation.
MeasurementThe amount accrued is the best estimate of the expense required to settle the obligation at the reporting date and reflects the risks and uncertainties that inevitably characterise many facts and circumstances. The amount accrued is equal to the present value of the outflow required to settle the obligation. The future facts which may affect the expense required to settle the obligation are considered only when there is objective evidence that they will take place.The accruals to the provisions for risks and charges also include the risk arising from any tax disputes.
DerecognitionAccruals are derecognised when the use of resources that generate economic benefits to settle the obligation becomes improbable.
Notes to the consolidated financial statements

145
15Costs and income
16Treasury shares
17Profit-participating financial instruments
18Business combinations and changes in equity investments
Cost are recognised on an accrual basis. Those incurred to obtain and fulfil contracts with customers are recognised in profit or loss when the related income is recognised.Income is recognised when received, or when it is probable the future benefits will be received and when such benefits can be reliably calculated. Specifically:• interest is recognised on an accruals basis using the contractual interest rate or
the effective interest rate when the amortised cost method is applied;• fee and commission income from services is recognised based on the relevant
contractual agreements at the time the services are provided.Fees for portfolio management, consultancy and management of mutual funds are recognised over the term of the service.
They are recognised as a decrease in shareholders’ equity. Profits or losses arising from the purchase, sale, issue or elimination of treasury shares are not recognised in the income statement, but in shareholders’ equity.
The profit-participating financial instruments issued by Azimut Holding S.p.A. as per the Shareholders' resolution of 29 April 2010 and subsequent resolutions of the Parent Company's Board of Directors are recognised under Equity instruments at the subscription amount, equal to their fair value, increasing shareholders’ equity. Indeed, under the By-laws, they have an indefinite life, are issued with no obligation for the Parent Company to repay the amount paid by investors, participate in the allocation of the Parent Company's residual assets in case of liquidation, in subordination to the creditors and shareholders. These instruments are not transferable, except to the Parent Company (at their fair value and subject to specific conditions). In this case, the relevant equity rights are suspended. Furthermore, these instruments entitle their holders to receive a part of the Company's profit as per the By-laws subject to, inter alia, the Shareholders' approval of dividend distribution.
Business combinations are recognised in accordance with the acquisition method (IFRS 3) whereby the identifiable acquired assets and assumed liabilities, including contingent ones, are recognised at their fair value at the acquisition date (i.e., the date on which the Group obtains effective control of the company). The fair value of acquired assets and assumed liabilities is calculated within one year of the acquisition. For each business combination, minority interests in the acquiree, if any, are recognised at fair value or in proportion to the minority interests' percentage in the net identifiable assets of the acquiree at fair value. Goodwill is initially measured at cost, being the excess amount of the sum of the consideration paid and the minority interests over the fair value of the net assets acquired by the Group (net of assumed liabilities). When the sum is below the fair value of the net assets of the acquiree, the difference is taken to the income statement. In
146 G r u p p o A z i m u t
Notes to the consolidated financial statements
a business combination achieved in stages, the Group recalculates the interest it already held in the company owned prior to obtaining control at the respective fair value calculated at the date control was acquired, recognising any resulting gain or loss in the income statement. Changes in the investment held in a subsidiary that do not entail the loss of control are recognised as Group's equity transactions. Acquisition-related costs are recognised in the income statement of the year in which they are incurred. Transactions carried out among two or more Group companies for reorganisation purposes are not considered business combinations. Transactions between jointly-controlled entities are recognised in the Group's financial statements using the acquiree's consistent amounts when they do not have a significant impact on the future cash flows.
ClassificationShare-based payments are settled by granting Azimut Holding S.p.A. ordinary shares (granting of rights to freely subscribe the shares when specific performance targets are achieved), against the services performed by the financial advisors to the subsidiaries, over a five-year plan.
RecognitionGiven the difficulties in reliably determining the fair value of the services received against the equity instruments, the cost allocated to subsidiaries is the best possible estimate of fair value, considering the performance targets at the reporting date.
Measurement and recognition of income componentsWith respect to equity-settled share-based payments, the liabilities assumed are measured at the fair value of the latter and recognised under “Reserves – Other equity reserves”. The balancing entry is recognised under “Fee and commission expense”.
DerecognitionNo instrument was settled at the expiry date of the plan (31 December 2019) because at least 4 of the 5 relevant conditions were not met. The liability was removed from “Reserves - Other equity reserves” and reversed to profit or loss in “Fee and commission expense”.
Non-current assets held for sale or discontinued operations whose sale is deemed highly probable are classified under “Non-current assets held for sale and discontinued operations” and “Liabilities related to discontinued operations”. These assets/liabilities are measured at the lower of their carrying amount and their fair value less costs to sell, except for some types of assets (e.g., financial assets under the scope of IFRS 9) whereby IFRS 5 specifically provides for the application of the accruals basis of accounting.Income and expense (net of the tax effect) related to discontinued operations or operations recognised as such during the year, are recognised separately in profit or loss.
19Share-based payments
20Non-current assets held for sale and discontinued operations

147
A.3 Disclosure about financial asset transfers between portfoliosA.3.1. Transfers between portfoliosThe Group did not transfer any financial assets between portfolios during the year.
A.4. Fair value disclosure
Qualitative informationThe fair value of other financial assets mandatorily measured at fair value is based on the prices reported on the respective markets on the last day of trading in the reference period. At the end of each year, impairment tests are carried out to establish which financial assets are to be impaired. This test is performed for each individual financial instrument, considering the impairment effects in accordance with IFRS 9. Financial assets are derecognised when the contractual rights to the cash flows generated by the assets expire or when the asset is sold and all the risks and rewards of ownership have been transferred.
Quantitative informationIn accordance with the provisions of IFRS 7 and IFRS 13, the Group companies classify fair value measurement of financial assets and financial liabilities based on a hierarchy that conveys the nature of inputs used. The levels are as follows:• Level 1: (unadjusted) quoted prices in active markets for assets and liabilities
identical to those subject to measurement;• Level 2: inputs other than unadjusted quoted prices (as per level 1) that are
directly (as in the case of prices) or indirectly (deriving from prices) observable market data;
• Level 3: inputs based on unobservable market data.
Specifically, the fair value of a financial instrument measured at level 1 corresponds to the unadjusted price, at which the instrument – or an identical instrument – is sold on an active market on the measurement date. For classification at level 1, prices are measured together with all other characteristics of the financial asset or financial liability: if the quoted price is adjusted in order to take account of specific conditions that require adjustment, the financial instrument is classified under a level other than level 1.Analyses for classification at other levels within the fair value hierarchy are performed analytically for each individual financial asset or liability held/issued; these analyses and measurement criteria are applied consistently over time.With respect to the financial instruments held as part of liquidity management policies and financial liabilities issued, according to the Group's main policies:• government bonds and open-ended mutual funds, whose fair value is designated
as level 1 if represented by the Net Asset Value (NAV) provided by the fund manager at the measurement date, are classified as level 1; conversely, with

148 G r u p p o A z i m u t
Notes to the consolidated financial statements
respect to listed funds and Exchange Traded Funds (ETF), level 1 fair value is equal to the closing price of the relevant stock market, and the liquidity to be invested relating to unit-linked policies issued;
• level 2 reflects the investments related to the unit-linked policies issued (where the investment risk is borne by policyholders), the associated financial liabilities and the bonds issued;
• level 3 reflects the equity securities reported as “Financial assets at fair value through other comprehensive income” measured at cost and financial liabilities related to the commitments to purchase the residual equity investments in some subsidiaries in accordance with ruling contractual agreements. With respect to liabilities, the measurement reflects the estimated amount to be paid to the seller, based on the estimate of the future parameters set out in the relevant contracts, including AUM and profit for the year and which are subject to specific sensitivity analyses. The change in the amount on first recognition is taken to the income statement. The liabilities also include the covered warrant issued by Azimut Capital Management Sgr S.p.A. to some employees (managers) which provides for the subscription of the purchase or sale of a specific underlying financial asset at a pre-established price and date. Financial liabilities are derecognised once settled.
A.4.5 Fair value hierarchyA.4.5.1 Assets and liabilities measured at fair value on a recurring basis: breakdown by fair value level
2,817
2,817
76,639
76,639
14,902
14,902
74,521
74,521
5,682,438
5,682,438
5,505,370
5,505,370
6,070,751
6,070,751
5,901,538
5,901,538
166,3402,157
168,497
621,1892,476
623,665
1. Financial assets at fair value through profit or lossa) held-for-trading financial assetsb) financial assets designated at fair valuec) financial assets mandatorily measured at fair value2. Financial assets at fair value through other comprehensive income3. Hedging derivatives4. Property, plant and equipment5. Intangible assetsTotal1. Held-for-trading financial liabilities2. Financial liabilities designated at fair value3. Hedging derivativesTotal
Level 3Level 3 Level 2Level 2
31/12/201831/12/2019
Level 1Level 1
Financial assets/liabilities measuredat fair value

149
A.4.5.2 Annual change in financial assets measured at Level 3 fair value on a recurring basis
2,817 12,296
12,296
-211-133
-78
14,902
1. Opening balance2. Increases 2.1. Purchases 2.2. Profits allocated to: 2.2.1 Profit or loss of which: gains 2.2.2 Shareholders’ equity 2.3. Transfers from other levels 2.4. Other increases3. Decreases 3.1. Sales 3.2. Redemptions 3.3. Losses charged to: 3.3.1 Profit or loss of which: losses 3.3.2 Shareholders’ equity 3.4. Transfers from other levels 3.5. Other decreases4. Closing balance
of which: b) financial
assets designated at fair value
of which: a) held-
for-trading financial
assets
Total Hedging derivatives
Intangible assets
Financialassets
at fair valuethrough other
comprehensiveincome
Property, plant and
equipment
of which: c) other
financial assets
mandatorily measured at
fair value
FINANCIAL ASSETS
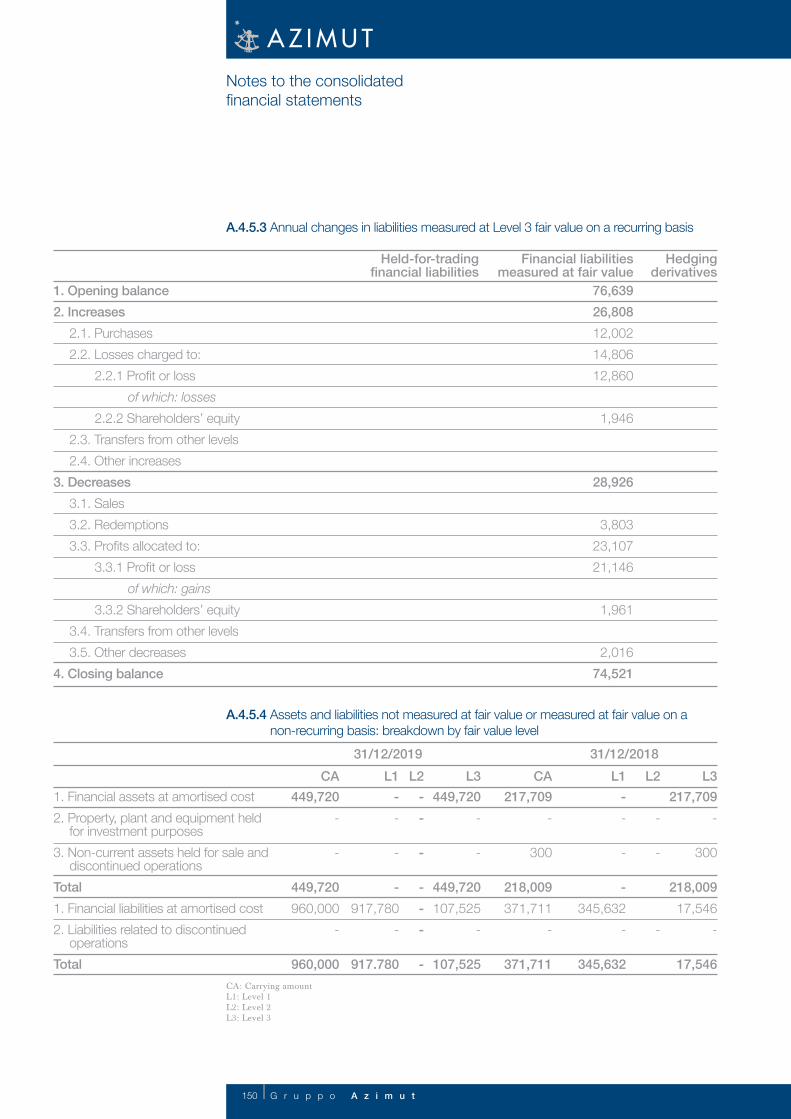
150 G r u p p o A z i m u t
-
-
-
A.4.5.3 Annual changes in liabilities measured at Level 3 fair value on a recurring basis
A.4.5.4 Assets and liabilities not measured at fair value or measured at fair value on a non-recurring basis: breakdown by fair value level
76,63926,80812,00214,80612,860
1,946
28,926
3,80323,10721,146
1,961
2,016
74,521
217,709 -
300
218,009
17,546 -
17,546
449,720 -
-
449,720 107,525
-
107,525
- - - -
917,780 -
917.780
- - - -
345,632 -
345,632
- - - - - - -
217,709 -
300
218,009
371,711 -
371,711
449,720 -
-
449,720 960,000 -
960,000
1. Opening balance2. Increases 2.1. Purchases 2.2. Losses charged to: 2.2.1 Profit or loss of which: losses 2.2.2 Shareholders’ equity 2.3. Transfers from other levels 2.4. Other increases3. Decreases 3.1. Sales 3.2. Redemptions 3.3. Profits allocated to: 3.3.1 Profit or loss of which: gains 3.3.2 Shareholders’ equity 3.4. Transfers from other levels 3.5. Other decreases4. Closing balance
1. Financial assets at amortised cost 2. Property, plant and equipment held for investment purposes3. Non-current assets held for sale and discontinued operationsTotal1. Financial liabilities at amortised cost 2. Liabilities related to discontinued operationsTotal
Hedging derivatives
L3L3 L2L231/12/201831/12/2019
L1L1 CACA
Financial liabilitiesmeasured at fair value
Held-for-tradingfinancial liabilities
CA: Carrying amountL1: Level 1L2: Level 2L3: Level 3
Notes to the consolidated financial statements

151
A.5 - Disclosure about the “Day one profit/loss”
The Group did not carry out transactions which entailed recognition of the so-called “day one profit/loss”.
The Azimut Group operates via various companies, each specialising in the sale, marketing, and management of financial and insurance products (essentially unit-linked).As a matter of fact, the nature of the various products and services offered, the structure of the management and operating processes, the type of customers, as well as the methods adopted for the distribution of products and services are sufficiently similar as to ensure that the risks and benefits of the various Group companies do not differ to any great extent but, on the contrary, have many comparable features.Although it operates as a single structure, dedicated in its entirety to asset management and the sale of investment instruments, in which the contributions made by the individual companies appear to be indistinguishable, in accordance with IFRS 8, the Group chose the allocation by geographical areas as the method to measure its performance and make significant economic decisions.Indeed, the Group identified four geographical areas:• the first area (Italy) reflects the activity carried out by the companies directly
controlled by Azimut Holding S.p.A., each specialising in the distribution, promotion and management of financial and insurance products (basically unit-linked products) and operating as a single structure, dedicated in its entirety to asset management and the sale of investment instruments, in which the contributions made by the individual companies appear to be indistinguishable and operating results are revised periodically by management for the purpose of decisions regarding allocation of resources and measurement of results and company performance. This area also includes the foreign product companies AZ Fund Management SA and AZ Life Dac;
• the three other areas (Europe, Middle East & Africa, America and Asia & Pacific) refer to the activity carried out by the foreign companies belonging to the Luxembourg company AZ International Holdings SA, wholly owned by Azimut Holding S.p.A.. Foreign companies are also specialised in the management, promotion and distribution of financial and asset management products, each in the relevant geographical area and in accordance with the same above-mentioned business model. Therefore, management set out a consolidated reporting system for AZ International Holdings SA which, in turn, must send the Parent Company Azimut Holding a consolidated reporting package for all foreign companies broken down according to the above geographical areas.
This section shows the consolidated figures broken down by geographical area, according to the reporting system selected by management and in line with the information disclosed to the market.
Operating segment disclosure (IFRS 8)

152 G r u p p o A z i m u t
Notes to the consolidated financial statements
The main figures broken down by geographical area are as follows:
The breakdown by company of the above geographical areas is described in the section on the impairment test in the notes to these consolidated financial statements.With respect to the information about the financial position required by IFRS 8, the Group’s management does not show or analyse a different breakdown of assets and liabilities other than that approved in the separate and consolidated financial statements.In accordance with paragraph 34 of IFRS 8, it is noted that the Group has no customers which account for more than 10% of consolidated revenue.
Earnings per shareBasic earnings per share are calculated by dividing the net profit for the year by the average number of outstanding ordinary shares.There were no earnings-dilutive transactions to be disclosed at 31 December 2019.
* Outstanding shares are calculated net of treasury shares held by Azimut Holding S.p.A. at the reporting date.
319,535 18,226 25,794 52,872
791,390 49,838 48,254 51,575
0.900135,710,934
0.900135,710,934
603,929 58,044 37,755 46,869
36,938 3,904 4,933 4,997
2.641140,110,863
2.641140,110,863
579,311 39,124 35,756 44,819
41,999 4,805 6,148 6,146
ItalyEurope - Middle EastAmericasAsia-Pacific
Basic earnings per share Average number of outstanding shares (*)Diluted earnings per share Average number of outstanding shares (*)
Total income -
2018
Fee and commission
income - 2019
Fee and commission
income - 2018
2018
Totalincome -
2019
Net assets at 31/12/18
2019
Net assets at 31/12/19
Area (Euro/000)

153
Part B - Notes to the consolidated balance sheet
Assets
“Cash and cash equivalents” amount to 19 thousand euro and refer to cash on hand.
This item amounts to 6,691,955 thousand euro (5,848,778 thousand euro at 31 December 2018).
2.5 Other financial assets mandatorily measured at fair value: breakdown
Section 1Cash and cash equivalents
Section 2Financial assets at fair value through profit or loss (FVTPL)
1. Debt securities 1.1 Structured securities 1.2 Other debt securities2. Equity instruments 3. UCI units4. Loans 4.1 Repurchase agreements4.2 OtherTotal
- - - -
5,682,438 - - -
5,682,438
- - - - - - - - -
- - - -
166,340 - - -
166,340
- - - -
6,070,751 - - -
6,070,751
- - - -
621,204 - - -
621,204
- - - - - - - - -
Items/ValueLevel 1 Level 1 Level 3Level 3 Level 2Level 2
Total 31/12/2019 Total 31/12/2018
“UCI units” (Level 1) refers to the units in mutual funds managed by the Azimut Group as part of the Group’s liquidity management policies.“UCI units” (Level 2) refers to liquidity and investments, respectively, measured at fair value, relating to unit-linked policies issued by AZ Life Dac, where the investment risk is borne by policyholders.

154 G r u p p o A z i m u t
3.1 Financial assets at fair value through other comprehensive income: breakdown
This item amounts to 17,378 thousand euro (31 December 2018: 4,974 thousand euro). It comprises minority interests over which the Group has no control, significant influence or joint control (14,902 thousand euro) and government securities in portfolio held as part of the Group's liquidity (2,476 thousand euro).
1. Debt instruments - of which: government securities2. Equity instruments 3. LoansTotal
2,817
2,817
14,902 2,157
2,157
14,902
14,902
2,476 2,476
2,476
- - - - -
- - - - -
Items/ValueLevel 1 Level 1 Level 3Level 3 Level 2Level 2
Total 31/12/2019 Total 31/12/2018
Section 3Financial assets at fair value through other comprehensive income (FVTOCI)
Notes to the consolidated financial statements
2.6 Other financial assets mandatorily measured at fair value: breakdown by debtor/issuer
- -
6,691,955 -
- -
5,848,778 -
1. Equity instruments of which: banks of which: other financial companies of which: non-financial companies of which: insurance companies3. Debt securities a) Public administrations b) Banks c) Other financial companies of which: insurance companies d) Non-financial companies3. UCI units4. Loans a) Public administrations b) Banks c) Other financial companies of which: insurance companies d) Non-financial companies e) Households
Total31/12/2019
Total 31/12/2018
Items/Value

155
3.2 Financial assets at fair value through other comprehensive income: breakdown by debtor/issuer
Financial assets at fair value through other comprehensive income increased on 31 December 2018 mainly as a result of the investments in Youmy Wealth Management (2.7 million euro) and Gellify, a B2B innovation platform in which the Group subscribed a capital increase of 8 million euro.
1. Debt securities a) Public administrations b) Banks c) Other financial companies of which: insurance companies d) Non-financial companies2. Equity instruments a) Banks b) Other financial companies of which: insurance companies c) Non-financial companies d) Other3. Loans a) Public administrations b) Banks c) Other financial companies of which: insurance companies d) Non-financial companies e) Households
2,157 2,157
2,816 819
1,159 838
-
2,476 2,476
14,902 1,067
1,159 12,676
-
Items/Value Total 31/12/2019 Total 31/12/2018
2,476
2,4762,157
X X X
Debt securitiesLoansTotal 31/12/2019Total 31/12/2018of which: acquired or originated impaired financial assets
Total impairment lossesGross balance
Thirdstage
Thirdstage
Second stage
Second stage
of which: instruments
with low credit risk
Firststage
Firststage
Total partial write-offs (*)
3.3 Financial assets at fair value through other comprehensive income: gross balance and total impairment losses
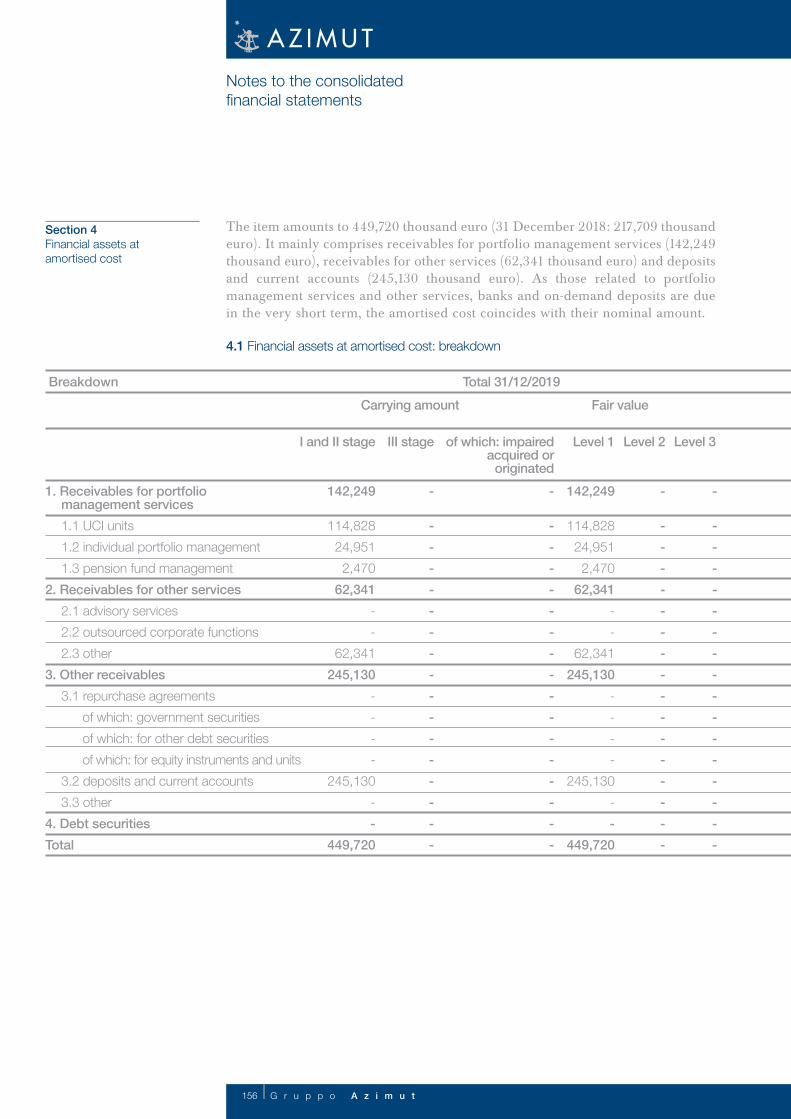
156 G r u p p o A z i m u t
Notes to the consolidated financial statements
The item amounts to 449,720 thousand euro (31 December 2018: 217,709 thousand euro). It mainly comprises receivables for portfolio management services (142,249 thousand euro), receivables for other services (62,341 thousand euro) and deposits and current accounts (245,130 thousand euro). As those related to portfolio management services and other services, banks and on-demand deposits are due in the very short term, the amortised cost coincides with their nominal amount.
4.1 Financial assets at amortised cost: breakdown
Section 4Financial assets atamortised cost
1. Receivables for portfolio management services 1.1 UCI units 1.2 individual portfolio management 1.3 pension fund management2. Receivables for other services 2.1 advisory services 2.2 outsourced corporate functions 2.3 other3. Other receivables 3.1 repurchase agreements of which: government securities of which: for other debt securities of which: for equity instruments and units 3.2 deposits and current accounts 3.3 other4. Debt securitiesTotal
142,249
114,828 24,951 2,470
62,341 - -
62,341 245,130
- - - -
245,130 - -
449,720
142,249
114,828 24,951 2,470
62,341 - -
62,341 245,130
- - - -
245,130 - -
449,720
-
- - - - - - - - - - - - - - - -
-
- - - - - - - - - - - - - - - -
-
- - - - - - - - - - - - - - - -
-
- - - - - - - - - - - - - - - -
BreakdownCarrying amount Fair value
Total 31/12/2019
I and II stage Level 1 III stage Level 2of which: impaired acquired or
originated
Level 3

157
-
- - - - - - - - - - - - - - - -
-
- - - - - - - - - - - - - - - -
67,963
63,349 2,678 1,937 43,482 - -
43,482 106,264 - - - -
106,264 - -
217,709
67,963
63,349 2,678 1,937 43,482 - -
43,482 106,264 - - - -
106,264 - -
217,709
-
- - - - - - - - - - - - - - - -
-
- - - - - - - - - - - - - - - -
Carrying amount Fair value
I and II stage Level 1 III stage Level 2of which: impaired acquired or
originated
Level 3
Total 31/12/2018
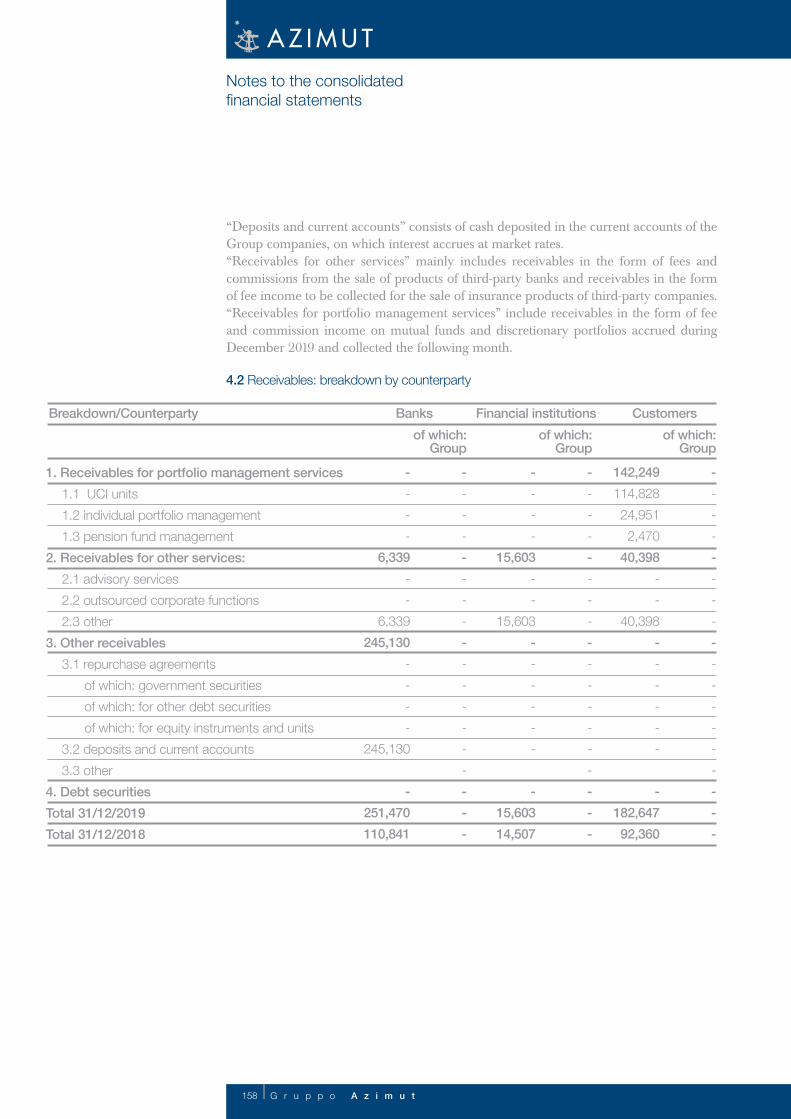
158 G r u p p o A z i m u t
4.2 Receivables: breakdown by counterparty
- - - - - - - - - - - - - - - -
- -
- - - - - - - - - - - - - -
- - - -
- - - - - - - - - - - - - - -
- - -
142,249 114,828 24,951 2,470
40,398 - -
40,398 - - - - - -
-
182,647 92,360
- - - -
15,603 - -
15,603 -
- - - - -
-
15,603 14,507
- - - -
6,339 - -
6,339 245,130
- - - -
245,130
- 251,470 110,841
1. Receivables for portfolio management services 1.1 UCI units 1.2 individual portfolio management 1.3 pension fund management2. Receivables for other services: 2.1 advisory services 2.2 outsourced corporate functions 2.3 other3. Other receivables 3.1 repurchase agreements of which: government securities of which: for other debt securities of which: for equity instruments and units 3.2 deposits and current accounts 3.3 other4. Debt securitiesTotal 31/12/2019Total 31/12/2018
Financial institutionsBanks Customersof which:
Groupof which:
Groupof which:
Group
Breakdown/Counterparty
Notes to the consolidated financial statements
“Deposits and current accounts” consists of cash deposited in the current accounts of the Group companies, on which interest accrues at market rates.“Receivables for other services” mainly includes receivables in the form of fees and commissions from the sale of products of third-party banks and receivables in the form of fee income to be collected for the sale of insurance products of third-party companies.“Receivables for portfolio management services” include receivables in the form of fee and commission income on mutual funds and discretionary portfolios accrued during December 2019 and collected the following month.

159
9.1 Equity investments: informationThe item amounts to 1,804 thousand euro (2,869 thousand euro in 2018). It comprises equity investments in associates.
Section 9Equity investments
Azimut Enterprises S.r.l.Azimut Enterprises S.r.l.Sterling Planners Pty Ltd
ItalyItalyAustralia
302229.22
3022
29.22
Companies measured at equity1. Cofircont Compagnia Fiduciaria S.r.l.2. SiamoSoci S.r.l.3. Sterling Planners WA
Stake Votingrights %
Registeredoffice
Shareholder Stake %
Name
9.2 Annual changes in equity investments
2,869 727 705
22
1,792
42 1,750 1,804
Total valueA. Opening balanceB. Increases B.1 Purchases B.2 Reversals of impairment losses B.3 Revaluations B.4 Other changesC. Decreases C.1 Sales C.2 Impairment losses C.3 Other changesD. Closing balance
982822
982822
--
1. Cofircont Compagnia Fiduciaria S.r.l.2. SiamoSoci S.r.l.
Carryingamount
Dividendsreceived
Fair value (*)Name
9.3 Significant equity investments: accounting figures
(*) As these companies are not listed, fair value coincides with the carrying amount.

160 G r u p p o A z i m u t
8,470 -
139 1,538
284 6,508
- - - - - -
8,470
8,392 -
73 1,309
215 6,795
40,365 -
38,482 - -
1,883 48,757
1. Company-owned a) land b) buildings c) furniture & fixtures d) electronic systems e) other2. Right of use: assets acquired under leases a) land b) buildings c) furniture & fixtures d) electronic systems e) otherTotal
Total 31/12/2018Total 31/12/2019Items/Value
The item amounts to 48,757 thousand euro (8,470 thousand euro at 31 December 2018).
10.1 Breakdown of “Property, plant and equipment - business purposes: breakdown of assets at cost”
Section 10Property, plant andequipment
Notes to the consolidated financial statements

161
9,058-7,520 1,538
86 86
-316
-316
1,308
-7,836 9,144 1,308
311-172 139
54,385
54,385 -15,968
-7,540
-8,428
38,556 -16,140
54,696 38,556
-
-
2,377-2,093
284 13 13
-82
-82
215
-2,175 2,390 215
23,690-17,181
6,509 4,988
2,790
2,198 -2,820
-2,820
8,677
-20,001 28,678 8,677
35,436-26,966
8,470 59,472
2,889
56,583 -19,186
- -10,758
-8,428 48,756
-46,152 94,908 48,757
D. Gross closing balance D.1 Total net impairment losses D.2 Net closing balanceB. Increases B.1 Purchases B.2 Leasehold improvements B.3 Reversals of impairment losses B.4 Increases in fair value taken to: a) shareholders’ equity b) profit or loss B.5 Exchange rate gains B.6 Transfers from investment property B.7 Other changesC. Decreases C.1 Sales C.2 Depreciation C.3 Impairment losses charged to: a) shareholders’ equity b) profit or loss C.4 Decreases in fair value charged to: Charged to: a) shareholders’ equity b) profit or loss C.5 Exchange rate losses C.6 Transfers to: a) property, plant and equipment held for investment purposes b) assets held for sale C.7 Other changesD. Net closing balance D.1 Total net impairment losses D.2 Net closing balanceE. Measurement at cost
OtherElectronicsystems
Furniture & fixturesBuildingsLand Total
10.5 Property, plant and equipment – business purposes: annual changes

162 G r u p p o A z i m u t
Section 11Intangible assets
Depreciation rates are as follows:
This item amounts to 634,342 thousand euro (602,347 thousand euro at 31 December 2018).
11.1 Breakdown of “Intangible assets”
3%12%
15%-20-25%25%20%
based on the remainingduration of the lease
BuildingsFurniture & fixturesOther:Systems Motor vehiclesElectronic office equipmentLeasehold improvements
% rateDescription
525,976 76,371
- 76,371
602,347
535,223 99,119
- 99,119
634,342
--- --
--- --
1. Goodwill2. Other intangible assets 2.1 generated internally 2.2 otherTotal
Total 31/12/2018Total 31/12/2019Assetsat cost
Assetsat cost
Assets at fair value
Assets at fair value
• “Goodwill” refers to: • the acquisition by Azimut Holding S.p.A. (formerly Tumiza S.p.A.) of the merged company Azimut Holding S.p.A., completed on 12 February 2002. This company wholly owned (directly or indirectly) all the companies of the Azimut Group. This item was calculated as the difference between the initial cost of the equity investment, at acquisition date, and the shareholders’ equity of the subsidiaries at 31 December 2001. Following the merger by incorporation of Azimut Holding S.p.A. into Tumiza S.p.A., with accounting effects on 1 July 2002, a portion of goodwill on consolidation, equal to 176.3 million euro amortised by 26.4 million euro prior to the adoption of IFRS, was included in “Goodwill" in the separate financial statements of Azimut Holding S.p.A.; • the acquisitions carried out through the subsidiary AZ international Holding SA to expand the Group abroad.
Notes to the consolidated financial statements

163
Goodwill and changes on the previous year are shown below:
--0-
6,203----
9,548
15,75115,140
----
15,140--0
30,891
--0--
-15,101----
-15,101--
-1,442--
-1,442--0
-16,543
--0--
193----
193-4,582
----
-4,582-714
--714
-5,103
292,145173
292,31831,425
-22,3989,2326,756
255
70,066
123,70450
1,4421,247
592127,03530,4376,122
36,559525,978
292,145173
292,31831,4256,2037,4909,2326,756
2559,548
70,909134,262
500
1,247592
136,15129,7236,122
35,845535,223
Azimut Holding S.p.A. (formerly Tumiza S.p.A.)Azimut Libera Impresa SGR S.p.A.Total Azimut/Italy CGUCGM - Azimut Monaco CGM Italia SGR S.p.A. (P&G BU)AZ Swiss & PartnersAzimut PortföyKatarsis Capital AdvisorsAzimut (DIFC) LimitedRasmala Egypt Asset Management(now Azimut Egypt Asset Management)Total Europe, Middle East & Africa CGUAZ NGA and subsidiariesAZ SestanteSigma Funds ManagementAZ Sinopro Financial PlanningAZ Investment Management SingaporeTotal Asia & Pacific CGUAzimut Brasil Holdings and subsidiariesMas FondosTotal America CGUTotal
Newacquisitions
Write-downs2019
Otherchanges
Total31/12/2018
Total31/12/2019
Company
In 2019, the Group continued to expand in the Australian market, completing the following acquisitions of Australian companies through the Australian sub-holding AZ NGA:• on 25 March 2019, it acquired 100% of Spencer Fuller & Associates Pty Ltd and
Spencer Fuller Lending Solutions Pty Ltd (together "Spencer"); • on 5 August 2019, it acquired 100% of Kellaway Cridland Pty Ltd (“Kellaway”); • on 6 November 2019, it acquired 100% of Tempus Wealth Group Pty Ltd (“Tempus”). The Group also acquired 100% of the Egyptian management company Rasmala Egypt Asset Management (subsequently renamed Azimut Egypt Asset Management), directly through the Luxembourg sub-holding AZ International Holdings SA. The aim is to

164 G r u p p o A z i m u t
expand its presence in the EMEA region and penetrate a new market. Furthermore, it acquired a business unit from the Italian-based P&G SGR S.p.A. through the subsidiary CGM Italia SGR S.p.A.. This business unit mainly relates to certain management mandates for UCITS funds and alternative non-reserved UCI funds, specifically in the structured credit and ABS segment, in addition to the team and contracts related to said management mandates. The following table summarises the fair value of the assets and liabilities related to the above business combinations at the acquisition date and the related goodwill or customer relationships (in thousand of euros):
Goodwill and customer relationships were calculated on a provisional basis as their calculation is based on preliminary estimates and assumptions: fair value adjustments, which may differ considerably, will be recognised when final information, including assessments and other analyses, is available, however within one year from the acquisition date.The impairment losses recognised during the year relate to the write-off of goodwill previously recognised on Sigma Funds Management, which was put into liquidation in 2019, and the Sogenel business unit, which was acquired by AZ Swiss, as a result of a significant decrease in profitability and assets related to this business unit.Finally, "Other changes" relates to adjustments to goodwill which was previously allocated on a provisional basis to two Australian acquisitions completed in the fourth quarter of 2018 whose Purchase Price Allocation ("PPA") procedure was completed in the previous year. The related amounts were subsequently allocated to customer relationships.
Notes to the consolidated financial statements
4,5404,540
382 -
1,174-1,273
283 4,2572,8871,370
3,4883,488
- 4,293
- -810
3,483 5
1,122-1,117
11,21111,2111,716
- 2,064
-2,117 1,663 9,548
- 9,548
3,9833,983
161,4871,044
-2,081 466
3,517714
2,803
8,0008,000
- -
175-127
48 7,9521,7496,203
Purchase priceTotal purchase price (A)Cash and cash equivalentsGoodwillOther assetsOther liabilitiesFair value of the net assets acquired (B)Difference (A – B) allocated to: - Customer relationships - Goodwill
Kellaway2019 business combinations
Tempus RasmalaSpencer P&G BU

165
9,8233,6896,134
1,812893919
Previously-allocated goodwill - of which: allocated to customer relationshipsGoodwill recognised at 31 December 2019
MP Holdings WA Ltd
Sage Business Group Pty Ltd
Other changes
For additional information, see the reconciliation table below:
“Other intangible assets – Other” refers to:• Trademarks of 46,271 thousand euro, of which the “Azimut” trademark amounting to
35,338 thousand euro;• Software totalling 30,088 thousand euro;• Other intangible assets of 22,759 thousand euro.
“Other intangible assets” includes customer relationships relating to:• the amount allocated to customer relationships relating to the business unit acquired
from Sofia SGR S.p.A. last year and amortised over the residual useful life of 10 years (13,008 thousand euro);
• the amount allocated to customer relationships relating to AZ NGA’s acquisitions of the past 12 months described above and amortised over the residual useful life of 10 years (9,304 thousand euro);
• the amount allocated to customer relationships relating to the business unit acquired from P&G SGR during the year and amortised over the residual useful life or the fund duration whose management mandate was acquired (1,749 thousand euro).
Under IAS 38, these are intangible assets from which the buyer will probably obtain future economic benefits.

166 G r u p p o A z i m u t
11.2 Intangible assets: annual changes
The amortisation rates for intangible assets with a finite useful life are as follows:
602,34745,23945,239
-13,244
-13,244
634,342
A. Opening balanceB. Increases B.1 Purchases B.2 Reversals of impairment losses B.3 Increases in fair value taken to: - shareholders’ equity - profit or loss B.4 Other changesC. Decreases C.1 Sales C.2 Amortisation C.3 Impairment losses charged to: - shareholders’ equity - profit or loss C.4 Decreases in fair value charged to: - shareholders’ equity - profit or loss C.5 Other changesD. Closing balance
Total
33%Application software% rateDescription
Notes to the consolidated financial statements

167
Impairment testIntroductionPursuant to Legislative Decree 38/2005, the Azimut Group prepares the financial statements in accordance with the International Accounting Standards (IAS) / International Financial Reporting Standards (IFRS) endorsed by the European Commission, pursuant to Regulation (EC) No. 1606/2002 issued by the European Parliament and Council. As regards disclosure of equity investments, goodwill and trademarks (asset with indefinite useful life), the IFRS, specifically IAS 36 “Impairment of assets”, stipulate that the company must perform annual impairment tests as part of the preparation of both separate and consolidated financial statements. This impairment test is used to identify any impairment loss of Intangible assets. More specifically:• Goodwill on consolidation• Goodwill• Trademark.Although the Group operates as a single structure, dedicated in its entirety to asset management and the sale of investment instruments, in which the contributions made by the individual companies appear to be indistinguishable, starting from last year, the impairment test has been performed on a higher number of significant cash-generating units (“CGUs”), totalling 4, reflecting management’s decisions when identifying operating/geographical reporting segments under IFRS 8. This is due to the fact that, under IAS 36, a CGU cannot be larger than an operating segment as defined by paragraph 5 of IFRS 8. The first CGU reflects the activity carried out by Azimut Holding S.p.A.’s direct subsidiaries, each specialising in the distribution, promotion and management of financial and insurance products (basically unit-linked products) and operating as a single structure, dedicated entirely to asset management and the sale of investment instruments, in which the contributions made by the individual companies appear to be indistinguishable and operating results are revised periodically by management for the purpose of decisions regarding allocation of resources and measurement of results and company performance.The other three CGUs relate to the activities carried out by the foreign companies of the Luxembourg-based AZ International Holdings Sa, wholly owned by Azimut Holding S.p.A., which are shown and classified by geographical segment. Foreign companies also specialise in the management, promotion and distribution of financial and asset management products, each in the relevant geographical segment and in accordance with the same integrated business model of the above-mentioned CGU. Therefore, management adopted a consolidated reporting system for AZ International Holdings SA which, in turn, sends the Parent Company, Azimut Holding, a consolidated reporting package for all foreign companies. The companies belonging to the various CGUs are shown and classified below by geographical area. Impairment tests were carried out by individual country and at consolidation level by geographical area.

168 G r u p p o A z i m u t
Notes to the consolidated financial statements
CGUs related to AZ International Holdings’ subsidiariesThe CGU of AZ International Holdings SA is part of the Azimut Group to promote the development of the distribution of financial products, including in the relevant markets in which the companies of the above CGU operate.The impairment test carried out on this CGU relates to goodwill arising on consolidation.The companies belonging to the three CGUs of AZ International are shown and classified below by geographical area. Impairment tests were carried out by individual country and at consolidation level by geographical area.
Azimut/Italy CGU
Europe, Middle East & Africa CGU
ItalyItalyItalyItalyItalyItalyItaly
Europe, Middle East & AfricaEurope, Middle East & AfricaEurope, Middle East & AfricaEurope, Middle East & AfricaEurope, Middle East & AfricaEurope, Middle East & AfricaEurope, Middle East & AfricaEurope, Middle East & Africa
LuxembourgLuxembourgIrelandItalyItalyItalyItaly
DubaiAbu DhabiSwitzerlandSwitzerlandSwitzerlandMonacoTurkeyEgypt
AZ Fund ManagementAZ International Holdings SAAZ Life DacAzimut Capital Management SGRAzimut Enterprises S.r.l.Azimut Financial Insurance S.p.A.Azimut Libera Impresa SGR S.p.A.
Azimut (DIFC) LimitedAzimut ME LimitedAZ Swiss & Partners SAKatarsis Capital Advisors SASDB Financial Solutions SACGM - Azimut MonacoAzimut Portföy Yönetimi A.Ş.Rasmala Egypt Asset Management(now Azimut Egypt Asset Management)
Geographical area
Geographical area
Company
Company
Country
Country

169
AZ Next Generation Advisory PTY LtdEureka Whittaker Macnaught PTY LtdPride Advice PTY LtdLifestyle Financial Planning Services (LFPS) PTY LtdEureka Financial Group PTY LtdPride Financial PTY LtdWise Planners PTY LtdDomane Financial Advisers PTY LTDFinancial Lifestyle Partners PTY LtdHarvest Wealth PTY LtdRI Toowoomba PTY LtdEmpowered Financial Partners PTY LtdWealthwise PTY LtdPriority Advisory Group PTY LtdSterling Planners PTY LtdLogiro Unchartered PTY LtdAspire Pty Ltd On-Track Financial Solutions Pty Ltd AZ Sestante Ltd Pride SMSF PTY Ltd Priority Advisory TrustPriority Lifestile Advice Pty LtdPeters & Partners PTY Ltd Menico Tuck Parrish Financial Solution Pty Ltd AZ Next Generation Accounting PTY LtdWealthmed Australia Pty Ltd Wealthmed Accounting Pty Ltd Wealthmed Property Pty Ltd Farrow Hughes Mulcahy Financial Services Pty LtdMenico Tuck Parish Pty Ltd Henderson Maxwel No.2 Pty Ltd Henderson Maxwell Financial Planning Pty Ltd Henderson Maxwell Accounting Pty Ltd
Asia & Pacific CGU
Asia & PacificAsia & PacificAsia & PacificAsia & PacificAsia & PacificAsia & PacificAsia & PacificAsia & PacificAsia & PacificAsia & PacificAsia & PacificAsia & PacificAsia & PacificAsia & PacificAsia & PacificAsia & PacificAsia & PacificAsia & PacificAsia & PacificAsia & PacificAsia & PacificAsia & PacificAsia & PacificAsia & PacificAsia & PacificAsia & PacificAsia & PacificAsia & PacificAsia & PacificAsia & PacificAsia & PacificAsia & PacificAsia & Pacific
AustraliaAustraliaAustraliaAustraliaAustraliaAustraliaAustraliaAustraliaAustraliaAustraliaAustraliaAustraliaAustraliaAustraliaAustraliaAustraliaAustraliaAustraliaAustraliaAustraliaAustraliaAustraliaAustraliaAustraliaAustraliaAustraliaAustraliaAustraliaAustraliaAustraliaAustraliaAustraliaAustralia
Geographical area Company Country
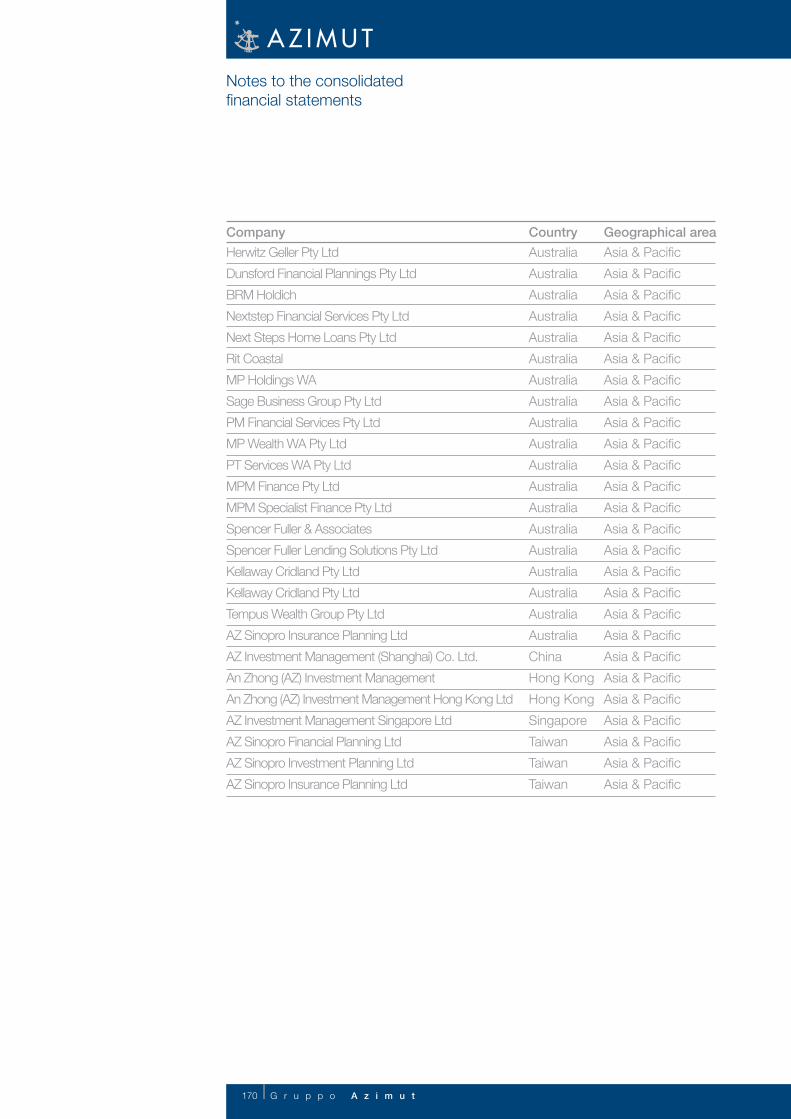
170 G r u p p o A z i m u t
Herwitz Geller Pty LtdDunsford Financial Plannings Pty Ltd BRM Holdich Nextstep Financial Services Pty Ltd Next Steps Home Loans Pty LtdRit Coastal MP Holdings WA Sage Business Group Pty Ltd PM Financial Services Pty Ltd MP Wealth WA Pty Ltd PT Services WA Pty Ltd MPM Finance Pty Ltd MPM Specialist Finance Pty Ltd Spencer Fuller & Associates Spencer Fuller Lending Solutions Pty Ltd Kellaway Cridland Pty Ltd Kellaway Cridland Pty Ltd Tempus Wealth Group Pty Ltd AZ Sinopro Insurance Planning LtdAZ Investment Management (Shanghai) Co. Ltd.An Zhong (AZ) Investment ManagementAn Zhong (AZ) Investment Management Hong Kong LtdAZ Investment Management Singapore LtdAZ Sinopro Financial Planning LtdAZ Sinopro Investment Planning LtdAZ Sinopro Insurance Planning Ltd
Notes to the consolidated financial statements
Asia & PacificAsia & PacificAsia & PacificAsia & PacificAsia & PacificAsia & PacificAsia & PacificAsia & PacificAsia & PacificAsia & PacificAsia & PacificAsia & PacificAsia & PacificAsia & PacificAsia & PacificAsia & PacificAsia & PacificAsia & PacificAsia & PacificAsia & PacificAsia & PacificAsia & PacificAsia & PacificAsia & PacificAsia & PacificAsia & Pacific
AustraliaAustraliaAustraliaAustraliaAustraliaAustraliaAustraliaAustraliaAustraliaAustraliaAustraliaAustraliaAustraliaAustraliaAustraliaAustraliaAustraliaAustraliaAustraliaChinaHong KongHong KongSingaporeTaiwanTaiwanTaiwan
Geographical area Company Country

171
AZ Brasil Holdings LtdaAZ Quest Participações SAAZ Quest Investimentos LtdaAzimut Brasil Wealth Management Holding SAAzimut Brasil Wealth Management LtdaFuturainvest Holding SAAzimut Brasil DTVM LtdaAZ Andes S.p.A.AZ Mexico Holdings S.A. De CVMas Fondos S.A.AZ US Holding Inc.AZ Apice Capital Management LLCAlternative Capital Management LLC
AmericasAmericasAmericasAmericasAmericasAmericasAmericasAmericasAmericasAmericasAmericasAmericasAmericas
BrazilBrazilBrazilBrazilBrazilBrazilBrazilChileMexicoMexicoThe USAThe USAThe USA
Geographical area Company Country
America CGU
Calculation of the vale in use of each CGUThe value in use of these assets is calculated using the Discounted Cash Flow method, based on the following assumptions:• Discount rate calculated using 31 December 2019 as the reference date and
determined using the weighted average cost of capital (WACC) approach: • Risk free: 10-year Italian government bonds, average 2019; • Cost of capital (Ke) calculated using the CAPM (unlevered) method: • Cost of debt calculated using the average cost of debt of Azimut Holding prudently
rounded to 1.8%; • Beta: Calculated on a 5-year timescale with daily readings (source: Bloomberg); • Market risk premium: extra return for investments in shares rather than risk-free
securities (Source: Credit Suisse Global Equity Strategy); • Cash flows: To calculate Cash Flow an approximate estimate is made based on net profit for the
year, gross of amortisation/depreciation. Profits were determined based on assumptions (strategic lines) that will be used to
develop the new 2020 - 2024 business plan.• Terminal values: To calculate Terminal values, the net profit of the last explicit forecast period gross of
amortisation/depreciation was considered, assuming a g growth rate of 2%.

172 G r u p p o A z i m u t
Notes to the consolidated financial statements
9,0%d 3.809.397.595
d 3.992.623.818
d 4.198.856.100
d 4.432.717.682
d 4.700.159.512
d 5.008.973.724
d 5.369.565.392
d 5.796.148.003
d 6.205.856.787
8,5%d 3.977.550.183
d 4.182.836.135
d 4.415.624.605
d 4.681.839.236
d 4.989.236.404
d 5.348.173.439
d 5.772.798.607
d 6.282.960.223
-2,5%d 6.041.724.757
8,0%d 4.166.816.170
d 4.398.531.529
d 4.663.518.959
d 4.969.499.084
d 5.326.781.487
d 5.749.449.212
d 6.257.259.078
d 6.878.819.009
-5,0%d 5.877.592.727
7,5%d 4.381.438.452
d 4.645.198.683
d 4.949.761.764
d 5.305.389.534
d 5.726.099.816
d 6.231.557.932
d 6.850.239.319
d 7.624.985.491
-7,5%d 5.713.460.698
6,96%d 4.626.878.407
d 4.930.024.444
d 5.283.997.581
d 5.702.750.421
d 6.205.856.787
d 6.821.659.629
d 7.592.801.132
d 8.586.541.834
-10,0%d 5.549.328.668
6,5%d 4.910.287.124
d 5.262.605.628
d 5.679.401.025
d 6.180.155.642
d 6.793.079.939
d 7.560.616.773
d 8.549.719.276
d 9.872.481.445
-12,5%d 5.385.196.638
6,0%d 5.241.213.676
d 5.656.051.630
d 6.154.454.496
d 6.764.500.248
d 7.528.432.413
d 8.512.882.717
d 9.829.439.617
d 11.680.257.067
-15,0%d 5.221.064.608
5,5%d 5.632.702.234
d 6.128.753.351
d 6.735.920.558
d 7.496.248.054
d 8.476.053.158
d 9.786.397.790
d 11.628.482.024
d 14.408.366.873
-17,5%d 5.065.932.578
0,0%0,5%1,0%1,5%2,0%2,5%3,0%3,5%
G
Difference between value in use and the carrying amount of the CGUWACC
Difference between value in use and the carrying amount of the CGU - decrease in cash flows
Calculation of the weighted average cost of capital:Starting from 2019, in order to adjust the discount rates to the Group’s current and future financial structure, the weighted average cost of capital has been calculated by weighting the cost of debt and the cost of equity. The respective weights, 15% for the debt component and 85% for the equity component, are the result of a comparison between the Group's financial structure and the average of listed companies comparable by sector and market.
Impairment test on the Azimut CGUs Sensitivity Analysis

173
-17,5%d 215.493.632
-15,0%d 225.568.881
Impairment Test - Europe, Middle East & Africa CGUSensitivity Analysis
Impairment Test - Asia & Pacific CGUSensitivity Analysis
9,0%d 141.016.165
d 152.102.761
d 164.581.400
d 178.731.824
d 194.914.111
d 213.599.746
d 235.418.315
d 261.229.844
9,0%d 104.155.024
d 112.601.102
d 122.107.679
d 132.887.868
d 145.215.987
d 159.451.226
d 176.073.222
d 195.737.166
d 286.020.372
d 214.623.287
8,5%d 151.190.690
d 163.612.069
d 177.697.561
d 193.805.594
d 212.405.487
d 234.123.938
d 259.817.026
d 290.685.726
8,5%d 111.906.261
d 121.369.215
d 132.099.937
d 144.371.487
d 158.541.406
d 175.087.129
d 194.660.842
d 218.177.482
-2,5%d 275.945.127
-2,5%d 206.770.608
8,0%d 162.642.737
d 176.663.299
d 192.697.076
d 211.211.227
d 232.829.560
d 258.404.208
d 289.130.610
d 326.739.766
8,0%d 120.630.752
d 131.312.007
d 143.526.987
d 157.631.585
d 174.101.036
d 193.583.518
d 216.992.750
d 245.644.457
-5,0%d 265.869.878
-5,0%d 198.917.929
7,5%d 175.629.136
d 191.588.559
d 210.016.967
d 231.535.182
d 256.991.390
d 287.575.493
d 325.020.475
d 371.888.577
7,5%d 130.524.077
d 142.682.488
d 156.721.765
d 173.144.943
d 192.508.194
d 215.808.019
d 244.327.035
d 280.040.084
-7,5%d 255.794.629
-7,5%d 191.065.251
6,96%d 190.480.041
d 208.822.708
d 230.240.805
d 255.578.572
d 286.020.376
d 323.281.184
d 369.941.175
d 430.070.130
6,96%d 141.837.988
d 155.811.944
d 172.128.850
d 191.431.869
d 214.623.287
d 243.009.613
d 278.556.499
d 324.364.419
-10,0%d 245.719.379
-10,0%d 183.212.572
6,5%d 207.628.448
d 228.946.427
d 254.165.754
d 284.465.259
d 321.551.893
d 367.993.774
d 427.841.659
d 507.879.366
6,5%d 154.902.124
d 171.142.757
d 190.355.545
d 211.438.556
d 241.692.190
d 277.072.914
d 322.666.707
d 383.641.671
-12,5%d 235.644.130
-12,5%d 175.359.893
6,0%d 227.652.049
d 252.752.936
d 282.910.142
d 319.822.602
d 366.046.377
d 425.613.187
d 505.275.005
d 617.263.694
6,0%d 170.156.663
d 189.279.221
d 212.253.824
d 240.374.768
d 275.589.330
d 320.968.995
d 381.657.595
d 466.973.711
-15,0%d 167.507.214
5,5%d 251.340.118
d 281.355.025
d 318.093.311
d 364.098.972
d 423.384.716
d 520.670.643
d 614.130.906
d 782.335.318
5,5%d 188.202.897
d 211.069.093
d 239.057.346
d 274.105.745
d 319.271.283
d 379.673.520
d 464.587.065
d 592.729.891
-17,5%d 159.654.535
0,0%0,5%1,0%1,5%2,0%2,5%3,0%3,5%
0,0%0,5%1,0%1,5%2,0%2,5%3,0%3,5%
G
G
Difference between value in use and the carrying amount of the CGU
Difference between value in use and the carrying amount of the CGU
WACC
WACC
Difference between value in use and the carrying amount of the CGU - decrease in cash flows
Difference between value in use and the carrying amount of the CGU - decrease in cash flows

174 G r u p p o A z i m u t
As shown in the tables above, the sensitivity analyses carried out on the most significant variables in terms of sensitivity to the recoverable amount of the identified CGUs, i.e., the weighted average cost of capital, the "g" growth rate and the income flows used, do not in any case lead to the identification of recoverable amounts below the related carrying amounts.
Tax assetsThis item amounts to 36,078 thousand euro (74,879 thousand euro at 31 December 2018). The breakdown is as follows:
Impairment Test - America CGUSensitivity Analysis
Section 12Tax assets and tax liabilities
21,88752,99274,879
11,71124,36736,078
CurrentDeferredTotal
Total 31/12/2018Total 31/12/2019Breakdown
12.1 Breakdown of “Tax assets: current and deferred”
“Deferred tax assets” mainly include: • 3,313 thousand euro arising from the lease instalments deductible in future years
following the sale and lease-back transaction related to the Azimut trademark;
Notes to the consolidated financial statements
9,0%d 22.020.576
d 26.317.535
d 31.154.023
d 36.638.464
d 42.910.418
d 50.152.623
d 58.609.095
d 68.613.164
d 78.221.513
8,5%d 25.964.033
d 30.778.328
d 36.237.604
d 42.480.778
d 49.689.750
d 58.107.418
d 68.065.582
d 80.029.717
-2,5%d 74.071.942
8,0%d 30.402.634
d 35.836.743
d 42.051.137
d 49.226.877
d 57.605.742
d 67.518.000
d 79.426.982
d 94.003.592
-5,0%d 69.922.371
7,5%d 35.435.882
d 41.621.496
d 48.764.005
d 57.104.065
d 66.970.418
d 78.824.248
d 93.333.351
d 111.502.432
-7,5%d 65.772.800
6,96%d 41.191.855
d 48.301.132
d 56.602.388
d 66.422.836
d 78.221.513
d 92.663.110
d 110.747.655
d 134.052.521
-10,0%d 61.623.229
6,5%d 47.838.259
d 56.100.711
d 65.875.254
d 77.618.779
d 91.992.869
d 109.992.879
d 133.188.806
d 164.209.934
-12,5%d 57.473.658
6,0%d 55.599.035
d 65.327.672
d 77.016.044
d 91.322.628
d 109.238.102
d 132.325.092
d 163.200.532
d 206.605.267
-15,0%d 53.324.087
5,5%d 64.780.090
d 76.413.310
d 90.652.387
d 108.483.326
d 131.461.378
d 162.191.130
d 205.391.056
d 270.583.960
-17,5%d 49.174.516
0,0%0,5%1,0%1,5%2,0%2,5%3,0%3,5%
G
Difference between value in use and the carrying amount of the CGU
WACC
Difference between value in use and the carrying amount of the CGU - decrease in cash flows

175
• 9,880 thousand euro related to tax losses;• 974 thousand euro relating to the adjustment of the carrying and tax amounts
(Italian regional production tax, IRAP) of the trademark and goodwill pursuant to Article 1, paragraph 51 of Italian Law 244/2007 (2008 Budget Law) and offset against future tax liabilities arising from amortisation/depreciation and other negative items deducted off the balance sheet (as indicated in EC section of the Modello Unico tax return) up until the tax year ended 31 December 2007;
• the remaining portion, i.e. the temporary differences resulting from the different timing criteria of IRES (Italian corporate income tax) and IRAP tax deductibility for some cost items compared to that recognised in the income statement.
As regards deferred tax assets recognised on tax losses, in accordance with IAS 12, the probability of these losses being recovered in subsequent tax years was assessed. Based on the assumptions pursuant to current tax regulations and related changes of the year, the ability of future taxable income, at Group level, comprising the companies which have adopted the tax consolidation regime, was assessed, generating the recognition of deferred tax assets on losses.
Tax liabilitiesThis item amounts to 78,514 thousand euro (72,505 thousand euro at 31 December 2018). The breakdown is as follows:
12.2 Breakdown of “Tax liabilities: current and deferred”:
4,35668,14972,505
14,53263,98278,514
CurrentDeferredTotal
Total 31/12/2018Total 31/12/2019Breakdown
“Deferred tax liabilities” mainly includes deferred tax liabilities relating to the temporary difference between the carrying and tax amounts of the trademark (10,450 thousand euro) and the deferred tax liabilities recognised on the temporary difference between the carrying and tax amounts of goodwill (36,401 thousand euro). These tax liabilities, recognised in accordance with IAS 12, are not reasonably expected to become actual costs given that the aforementioned temporary differences will only be reduced following a negative impairment test that leads to the recognition of an impairment loss on goodwill and the trademark, and in the case of disposal of these assets. Moreover, this item includes deferred IRES and IRAP taxes on unallocated earnings of subsidiaries at 31 December 2019.

176 G r u p p o A z i m u t
10.3 Changes in deferred tax assets (balancing entry in income statement)
48,5147,3205,171
5,171
2,150 2,9031,7591,759
1,144 52,931
52,9312,3092,309
2,309
30,91713,6048,3115,293
17,313 24,323
1. Opening balance2. Increases 2.1 Deferred tax assets recognised in the year: a) from previous years b) due to changes in accounting policies d) other 2.2 New taxes or increased tax rates 2.3 Other increases3. Decreases 3.1 Deferred tax assets eliminated during the year a) reversals b) write-off of irrecoverable tax c) due to changes in accounting policies d) other 3.2 Decreases in tax rates 3.3 Other decreases4. Closing balance
Total31/12/2018
Total 31/12/2019
Notes to the consolidated financial statements

177
1. Opening balance2. Increases 2.1 Deferred tax liabilities recognised in the year: a) from previous years b) due to changes in accounting policies c) other 2.2 New taxes or increased tax rates 2.3 Other increases3. Decreases 3.1 Deferred tax liabilities eliminated during the year a) reversals b) due to changes in accounting policies c) other 3.2 Decreases in tax rates 3.3 Other decreases4. Closing balance
10.4 Changes in deferred tax liabilities (balancing entry in income statement)
56,4234,8294,829
4,829 0
10,919 10,919 6,801 4,117
- 50,333
50,3339,3038,666
8,666
637 13,470 13,470 13,470
46,166
Total31/12/2018
Total31/12/2019
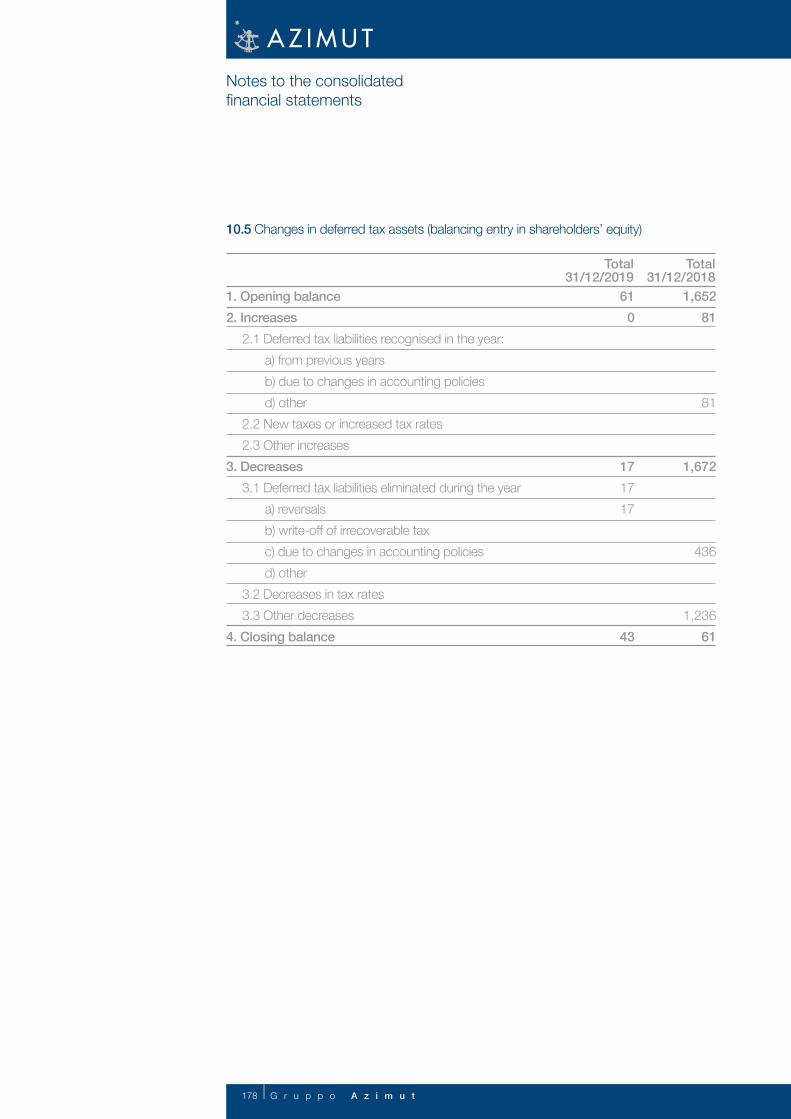
178 G r u p p o A z i m u t
Total31/12/2018
Total31/12/2019
10.5 Changes in deferred tax assets (balancing entry in shareholders’ equity)
1. Opening balance2. Increases 2.1 Deferred tax liabilities recognised in the year: a) from previous years b) due to changes in accounting policies d) other 2.2 New taxes or increased tax rates 2.3 Other increases3. Decreases 3.1 Deferred tax liabilities eliminated during the year a) reversals b) write-off of irrecoverable tax c) due to changes in accounting policies d) other 3.2 Decreases in tax rates 3.3 Other decreases4. Closing balance
1,65281
81
1,672
436
1,236 61
610
17 17 17
43
Notes to the consolidated financial statements
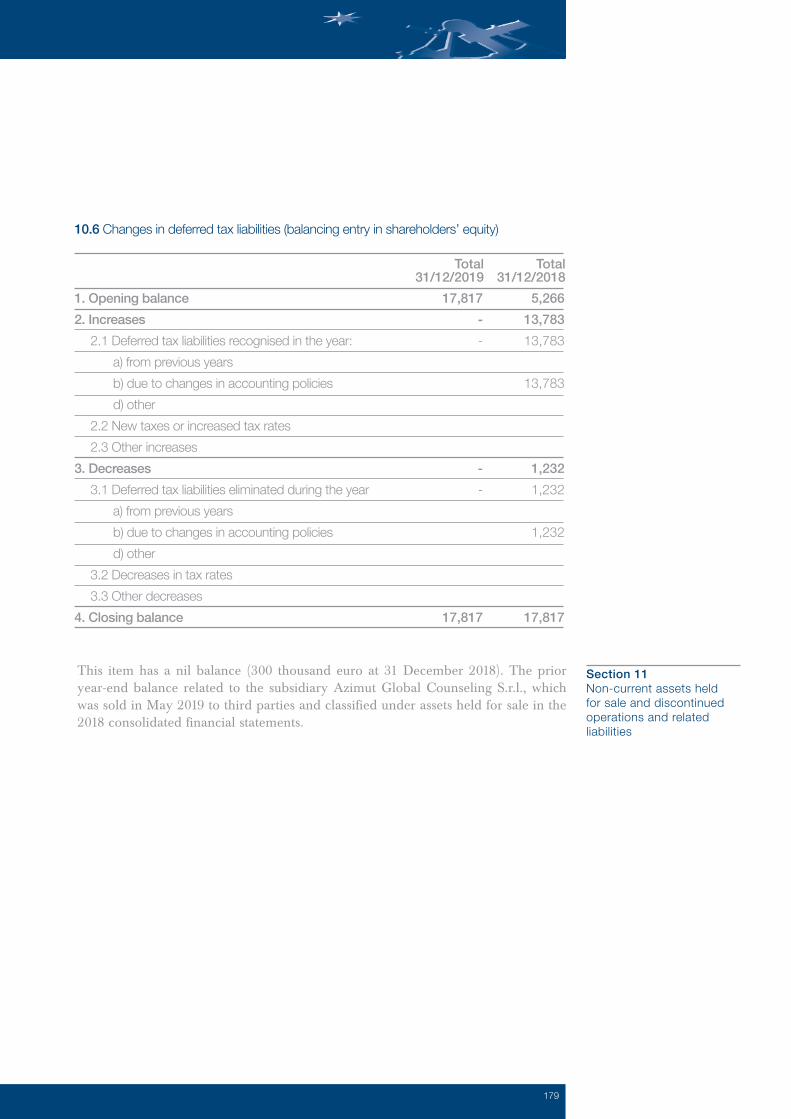
179
Total31/12/2018
Total31/12/2019
10.6 Changes in deferred tax liabilities (balancing entry in shareholders’ equity)
1. Opening balance2. Increases 2.1 Deferred tax liabilities recognised in the year: a) from previous years b) due to changes in accounting policies d) other 2.2 New taxes or increased tax rates 2.3 Other increases3. Decreases 3.1 Deferred tax liabilities eliminated during the year a) from previous years b) due to changes in accounting policies d) other 3.2 Decreases in tax rates 3.3 Other decreases4. Closing balance
5,266 13,783 13,783
13,783
1,232 1,232
1,232
17,817
17,817 - -
- -
17,817
This item has a nil balance (300 thousand euro at 31 December 2018). The prior year-end balance related to the subsidiary Azimut Global Counseling S.r.l., which was sold in May 2019 to third parties and classified under assets held for sale in the 2018 consolidated financial statements.
Section 11Non-current assets held for sale and discontinued operations and relatedliabilities

180 G r u p p o A z i m u t
“Due from Inland Revenue” includes amounts related to mathematical reserves of 115,479 thousand euro.“Due from financial advisors” mainly includes loans granted to financial advisors amounting to 11,063 thousand euro, which generate interest income in line with the Euribor plus spread, in addition to advance commissions paid to the same financial advisors amounting to 5,995 thousand euro. The terms for repayment of these loans vary on average from 12 to 36 months."Other receivables" mainly comprises virtual stamp duties of 82,032 thousand euro and receivables related to the payment of capital gain tax advances of 34,431 thousand euro.“Prepayments” includes the assets generated via the deferral of acquisition costs for the unit-linked policies issued by the Group’s Irish insurance company, classified as investment contracts. The item also includes incentive costs relating to total inflow target which are directly attributable to the existing contracts which meet the requirements for deferral to the new category of costs incurred to fulfil a contract introduced by IFRS 15. They amount to 51,182 thousand euro at 31 December 2019. These costs are amortised on the basis of that described in the accounting policies section and, in particular, over the term of the so-called "stability pact" in place with the individual financial advisor to whom the incentive has been granted. The amortisation was 26,605 thousand euro in 2019.
Due from Inland RevenueDue from financial advisorsOther receivablesPrepaymentsTotal
113,973 18,579
137,83155,145
325,528
115,703 17,924
167,11772,864
373,608
Total31/12/2018
Total31/12/2019
The item amounts to 373,608 thousand euro (325,528 thousand euro at 31 December 2018).
14.1 Breakdown of “Other assets”
Section 12Other assets
Notes to the consolidated financial statements

181
Liabilities
This item amounts to 960,000 thousand euro (371,711 thousand euro at 31 December 2018). The breakdown is as follows:
Financial liabilities at amortised cost: breakdown
Section 1Financial liabilities atamortised cost
4,5314,531
- -
4,891 4,891
- -
8,123- -
8,123- - - - - -
17,546- -
17,54617,546
1,334 1,334
- -
3,236 3,236
- - - - - -
102,955 - - - -
43,463 59,492
107,525 - -
107,525 107,525
1. Due to sales networks: 1.1 for UCI sales 1.2 for individual portfolio management sales 1.3 for pension fund sales2. Payables for asset management services: 2.1 for proprietary portfolio management 2.2 for discretionary portfolio management 2.3 for other3. Payables for other services: 3.1 advisory services 3.2 outsourced corporate functions 3.3 other4. Other payables 4.1 repurchase agreements of which: government securities of which: for other debt securities of which: for equity instruments and units 4.2 Lease liabilities 4.3 Other payablesTotalFair value - Level 1Fair value - Level 2Fair value - Level 3Total fair value
Total 31/12/2019 Total 31/12/2018Breakdown/Value
The item “Due to sales networks” mainly includes commissions accrued and to be settled for the sale of fund units.The increase in “Other payables” comprises a loan granted by Banco BPM on 28 February 2019 and divided into two lines, A and B, each originally amounting to 100 million euro.

182 G r u p p o A z i m u t
1.2 “Financial liabilities at amortised cost” breakdown by counterparty
- - - - - - - - - - - - - - - - -
- -
--
- - - - - - - - - - - - - - - - -
- -
--
- - - - - - - - - - - - - - - - -
- -
--
- - - -
3,236 3,236
- - - - - -
43,463 - - - -
43,463 -
46,699 5,819
264 264
- - - - - - - - - - - - - - -
264
8,472
1,070 1,070
- - - - - - - - - -
59,492 - - - -
59,492 60,562 3,255
1. Due to sales networks 1.1 for UCI sales 1.2 for individual portfolio management sales 1.3 for pension fund sales2. Payables for asset management services: 2.1 for proprietary portfolio management 2.2 for discretionary portfolio management 2.3 for other3. Payables for other services: 3.1 advisory services received 3.2 outsourced corporate functions 3.3 other4. Other payables 4.1 repurchase agreements of which: government securities of which: for other debt securities of which: for equity instruments and units 4.2 Lease liabilities 4.3 Other payablesTotal 31/12/2019Total 31/12/2018
Financial companiesBanks Customersof which:
Groupof which:
Groupof which:
Group
Breakdown/Counterparty
Notes to the consolidated financial statements
Line A is repayable in tranches while Line B is entirely due on 31 December 2021. The interest rate is calculated based on the Euribor plus 140 basis points for Line A and 160 basis points for Line B. The loan is subject to covenants. On 31 December 2019, the company repaid the first instalment (Line A) of the loan for 20 million euro and repaid a total of 120 million euro in advance.

183
Section 4Financial liabilities measuredat fair value
1.2 Breakdown of “Financial liabilities at amortised cost”: “Outstanding securities”
1. SecuritiesBondsOther securitiesTotal
852,475
- 852,475
354,165 -
354,165
-
- -
-
- -
917,780 -
917,780
345,632 -
345,632
-
- -
-
- -
BreakdownCarrying amount
Carrying amount
Fair value Fair value
Level 1 Level 1Level 2 Level 2Level 3 Level 3
Total 31/12/2019 Total 31/12/2018
This item comprises:• the “Azimut 2017-2022 2.000%” bond amounting to 354,523 thousand euro,
originally composed of 3,500 bonds with a nominal amount of 100,000 euro and a duration of five years issued on 27 March 2017. The amount refers to total bonds sold and includes the charges incurred by the company for the issue and placement, in addition to interest expense accrued at 31 December 2019 which will be paid on the pre-established date. The bond bears annual fixed interest of 2.000%;
• the “Azimut 2019-2024 1.625%” bond amounting to 497,952 thousand euro, originally composed of 5,000 bonds with a nominal amount of 100,000 euro and a duration of five years issued on 12 December 2019. The amount refers to total bonds sold and includes the charges incurred by the company for the issue and placement, in addition to interest expense accrued at 31 December 2019 which will be paid on the pre-established date. The bond bears annual fixed interest of 1.625%.
1.3 Subordinated securitiesThe company has no subordinated securities.
Technical reserves where the investment risk is borne by policyholders This item amounts to 176,630 thousand euro (177,068 thousand euro at 31 December 2018) and refers to the commitments arising from the unit-linked policies issued by the subsidiary AZ Life Dac, classified as insurance contracts.
This item amounts to 5,976,059 thousand euro (5,582,010 thousand euro at 31 December 2018) and mainly includes the commitments arising from the unit-linked policies issued by the subsidiary AZ Life Dac (5,901,538 thousand euro), classified as investment contracts (level 2). At 31 December 2019, the financial liabilities measured at fair value (level 3) generated gains for 8,286 thousand euro, which were recognised in the income statement caption “Net result of financial assets and financial liabilities measured at fair value”.

184 G r u p p o A z i m u t
1. Payables2. Debt securities bonds other securitiesTotal
5,976,059 -
- - 5,976,059
5,582,010 -
- - 5,582,010
5,505,370 - -
- 5,505,370
5,901,538 - -
- 5,901,538
- -
- -
-
- -
- -
-
74,521 - - -
74,521
76,639 - - -
76,639
LiabilitiesCarrying amount
Carrying amount
Fair value Fair value
Level 1 Level 1Level 2 Level 2Level 3 Level 3
Total 31/12/2019 Total 31/12/2018
This item also includes level 3 financial liabilities measured at fair value. These liabilities arose mainly from the future exercise of the call options of the residual portion of share capital of some companies that were acquired, but are not wholly owned.
4.1 Breakdown of “Financial liabilities measured at fair value”
Notes to the consolidated financial statements

185
Eureka Whittaker MacnaughtPride AdviceLifestyle Financial Planning ServicesWise PlannersFinancial Lifestyle PartnersHarvest WealthRI ToowoombaEmpowered Financial PartnersWealthwise Pty LtdPriority Advisory Group Sterling Planners Pty Ltd Logiro Unchartered Pty LtdOn Track Financial Solutions Pty LtdBRM HoldichMP Holdings WAPeters & Partners Pty LtdMenico Tuck Parrish Financial Solutions Pty LtdWealthmed Australia Pty LtdHenderson Maxwel Pty LtdHurwitz Geller Pty LtdDunsford Financial Plannings Pty LtdSage Business Group Pty LtdFarrow Hughes Mulcahy Financial Services Pty LtdSpencer Fuller & AssociatesKellaway Cridland Pty LtdTempus Wealth Group Pty LtdAZ Quest Participações SAAzimut Brasil Wealth Management Holdings SACGM-Azimut MonacoMas Fondos S.A.AZ Sinopro Financial Planning LtdTotal
1,259625
1,689311801650
1,461160
1,7731,3552,421
9971,152
367 3,184 1,352 461 1,286
1,768876
1,252429
1,978- - -
29,5481,324
15,614245
- 74,339
1,344688
1,754283900740
1,7420
2,0221,5892,5821,1771,319
4383,688
0540
1,5120
1,0301,432
5152,3231,5741,7322,131
31,4163,202
00
6,84874,521
Fair value measurement
31/12/2018
Fair value measurement
31/12/2019
Company
They are listed below:

186 G r u p p o A z i m u t
Notes to the consolidated financial statements
Section 7Tax liabilities
Section 9Other liabilities
Due to suppliersDue to Inland Revenue and tax authoritiesDue to employeesDue to social security bodiesOther payablesDue to Financial AdvisorsDeferred incomeTotal
62,4458,4658,6085,086
75,63453,3913,898
217,527
77,4358,477
14,0784,358
73,78262,8521,230
242,212
Total31/12/2018
Total31/12/2019
The measurement reflects the discounted amount to be paid to non-controlling interests, following the exercise of the call options. The measurement reflects an estimate of the discounted amount to be paid to the seller. This amount is based on the estimate of key parameters (future income statement, balance sheet and financial position parameters set out in the relevant contracts), that are subject to specific sensitivity analyses. With respect to level 3 financial liabilities measured at fair value and the related measurement at 31 December 2019, net gains of 8,146 thousand euro under were recognised in the income statement under “Net result of financial assets and financial liabilities measured at fair value”.
“Tax liabilities” are described in detail in section 12 of assets to which reference should be made.
This item amounts to 242,212 thousand euro (217,527 thousand euro at 31 December 2018) and is broken down as follows:
“Deferred income” includes liabilities arising from the deferral of fee and commission income on the premiums of unit-linked policies issued by the Irish insurance company AZ Life Dac, classified as investment contracts."Due to financial advisors" mainly includes amounts due for commissions of December 2019 paid in January 2019, in addition to other accruals relating to 2019, which will be paid during the subsequent year, and other contractual commitments for commissions, including loyalty commissions, to be paid to financial advisors over the medium-long term.“Other payables” includes the residual amount to be paid to purchase the remaining 49% of Augustum Opus SIM S.p.A. (now merged into Azimut Capital Management SGR S.p.A.) to minority investors (the company’s former shareholders) (14,000 thousand) and the deferred consideration to purchase the business unit of Sofia SGR in liquidation calculated based on the assets under management transferred to Azimut

187
Capital Management SGR and their net profitability (11,305 thousand euro), which will be paid after 24 months of the acquisition date of the business unit (May 2018), provided that the relevant contractual clauses are complied with.
10.1 Staff severance pay (TFR): annual changesThis item amounts to 3,011 thousand euro (2,812 thousand euro at 31 December 2018) and refers to TFR accrued by personnel employed by the Group companies at 31 December 2019.
A. Opening balanceB. Increases B1. Provisions for the year B2. Other increasesC. Decreases C1. Payments made C2. Other decreasesD. Closing balance
2,965742566176
-895-659-236
2,812
2,8121,301
708593
-1,102-715-387
3,011
Total31/12/2018
Total31/12/2019
Section 10Staff severance pay (TFR)
10.2 Other information As set out in the section on “Accounting policies”, staff severance pay was calculated in accordance with IAS 19, based on the following specific technical, demographic and financial assumptions:
Demographic assumptionsIn order to determine the probabilities of removal of personnel in service due to death, the SIM/F 2000 table was used (ISTAT – Italian National Institute of Statistics - mortality table by gender), prudentially reduced by 20%. Decreases due to disability were calculated using the relevant INPS (the Italian social security institution) tables, reduced by 20%. Pension, which is considered the main reason for outgoing employees, was subject to a timescale equal to meeting the minimum requirement (contribution period or seniority), calculated in accordance with ruling legislation. The following parameters were used for other technical, non-financial factors: • Turnover: 1.5% unchanged; • Advance: 2% unchanged; • Amount paid in advance: 70%. Finally, assessment of the allocation of TFR to private pension funds was carried out based on the behaviour observed on assessment (lack or partial adherence to private pension funds), without making any assumption on the future decisions of the personnel different from the current ones.

188 G r u p p o A z i m u t
Financial assumptionsIAS 19 requires utilisation of financial technical factors. These assumptions reflect their influence on the prospective trend of flows (following remuneration increases and forecast inflation scenarios) and on discounting of the Company's estimated liability at the measurement date. Indeed, the discount rate is the main financial assumption on which the analysis results depend. • Inflation: a constant rate of 2.00% was used with respect to the future inflation
scenario to be used for remuneration and TFR revaluation. • Interest rates: the future liability to employees was discounted using the yield curve
of debt securities in accordance with IAS 19.
This item amounts to 45,703 thousand euro (37,787 thousand euro at 31 December 2018).
11.1 Breakdown of “Provisions for risks and charges”
“Other provisions for risks and charges” comprises the supplementary indemnity provision for customers calculated on an actuarial basis in accordance with IFRS and the provision for legal disputes related to the risks arising from disputes with customers, equal to the present value of the charge deemed necessary to settle the obligations.
Section 11Provisions for risks and charges
1. Commitments and guarantees issued2. Company pension funds3. Other provisions for risks and charges 3.1 tax and legal disputes 3.2. personnel costs 3.3 otherTotal
- 0
37,787 7,554
- 30,233 37,787
45,703 7,308
- 38,395 45,703
Total 31/12/2018Total 31/12/2019Items/Value
Notes to the consolidated financial statements

189
11.2 “Provisions for risks and charges”: annual changes
A. Opening balanceB. Increases B.1 Provisions for the year B.2 Changes due to time B.3 Changes due to adjustments to the discount rate B.4 Other changesC. Decreases C.1 Utilisation of the year C.2 Changes due to adjustments to the discount rate C.3 Other changesD. Closing balance
37,78713,83313,833
- - -
5,9175,862
- 55
45,703
AmountOther provisions for risks and charges
Section 12Shareholders’ Equity
1. Share capital 1.1 Ordinary shares 1.2 Other shares
Types of shares32,32432,324
-
Amount
1. Treasury shares 1.1 Ordinary shares 1.2 Other shares
Types of shares23,71323,713
-
Total
12.1 Breakdown of “Share Capital”
12.2 Breakdown of “Treasury Shares”
At 31 December 2019, the fully paid-up and subscribed share capital was composed of 143,254,497 ordinary shares, with a total value of 32,324 thousand euro.
At 31 December 2019, Azimut Holding S.p.A. held 2,319,451 treasury shares at an average carrying amount of 10.22 euro per share.
12.3 Breakdown of “Equity instruments”This item amounts to 36,000 thousand euro and relates to the issue amount, as per the shareholders' resolution of 29 April 2010, of 1,500,000 profit-participating financial instruments (equal to their fair value calculated by an independent leading company).
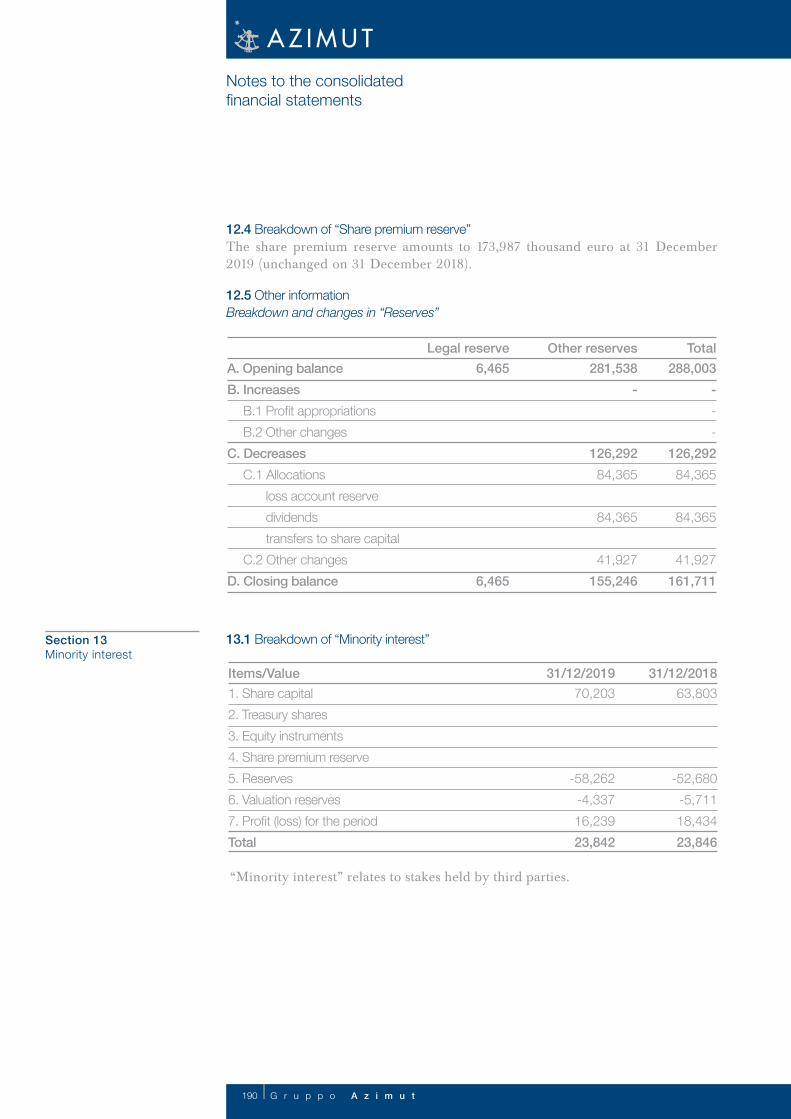
190 G r u p p o A z i m u t
12.5 Other informationBreakdown and changes in “Reserves”
A. Opening balanceB. Increases B.1 Profit appropriations B.2 Other changesC. Decreases C.1 Allocations loss account reserve dividends transfers to share capital C.2 Other changesD. Closing balance
288,003 - - -
126,292 84,365
84,365
41,927 161,711
281,538 -
126,292 84,365
84,365
41,927 155,246
6,465
6,465
TotalOther reserves Legal reserve
Notes to the consolidated financial statements
12.4 Breakdown of “Share premium reserve”The share premium reserve amounts to 173,987 thousand euro at 31 December 2019 (unchanged on 31 December 2018).
13.1 Breakdown of “Minority interest”
1. Share capital2. Treasury shares3. Equity instruments4. Share premium reserve5. Reserves6. Valuation reserves7. Profit (loss) for the periodTotal
63,803
-52,680-5,71118,43423,846
70,203
-58,262-4,33716,23923,842
31/12/201831/12/2019Items/Value
Section 13Minority interest
“Minority interest” relates to stakes held by third parties.

191
Part C - Notes to the income statement
1.1 Breakdown of “Fee and commission income and expense” Section 1Fee and commissionincome and expense
554,758 174,632
3,348 11
1,316 734,066
33,843 21,282
- 1,000
56,125
13,577 10,587
- 1,316
25,480
2,680 - -
2,680 818,350
478,781 55,603 3,174
15 1,098
538,671
35,337 670
- 972
36,979
11,580 - -
1,333 12,913
2,181
- -
2,181 590,744
478,781 55,603 3,174
15 1,098
538,671
35,337 670
- 972
36,979
11,580 - -
1,333 12,913
2,181
- -
2,181 590,744
554,758 174,632
3,348 11
1,316 734,066
33,843 21,282
- 1,000
56,125
13,577 10,587
- 1,316
25,480
2,680 - -
2,680
818,350
- - - - - - - - - -
- - - - - -
- - -
-
- - - - - - - - - -
- - - - - -
- - -
-
A. Asset management 1. Proprietary portfolio management 1.1 Mutual funds Management fees Incentive fees Entry / redemption fees Switch fees Other fees Total mutual fund fees 1.2 Individual portfolio management Management fees Incentive fees Entry / redemption fees Other fees Total individual portfolio management fees 1.3 Open-ended pension funds Management fees Incentive fees Entry / redemption fees Other fees Total open-ended pension fund fees 2. Discretionary portfolio management Management fees Incentive fees Other fees Total discretionary portfolio management feesTotal asset management fees (A)
Total 31/12/2019Services Total 31/12/2018
Net feeand
comm.
Net feeand
comm.
Fee and comm.
expense
Fee and comm.
expense
Fee and comm. income
Fee and comm. income

192 G r u p p o A z i m u t
108,266 10,998 76,778
244 16,923 3,322
- 699,010
108,266 10,998 76,778
244 16,923 3,322
-304,791 394,219
122,706 13,483 89,816
283 13,848 5,277
- 941,057
122,706 13,483 89,816
283 13,848 5,277
-324,449 616,608
- - - - -
-324,449 -324,449
- - - - -
-304,791 -304,791
B. Other services Advisory services Sales commissions Order intake Insurance products Other services Fee expenses for sales, distribution and order intakeTotal fees and commissions (A+B)
Total 31/12/2019Services Total 31/12/2018
Net feeand
comm.
Net feeand
comm.
Fee and comm.
expense
Fee and comm.
expense
Fee and comm. income
Fee and comm. income
Notes to the consolidated financial statements

193
1.2 Fee and commission expense: breakdown by type and counterparty
- - - - - - - - - - - - - - - - - - - - - - - - - -
12,334 12,334
- - - - - - - - - - - - - - - - - - - - - - - - - -
1,071 1,071
- - - - - - - - - - - - - - - - - - - - - - - - - -
324,449 324,449
- - - - - - - - - - - - - - - - - - - - - - - - - -
- -
- - - - - - - - - - - - - - - - - - - - - - - - - -
- -
- - - - - - - - - - - - - - - - - - - - - - - - - -
- -
- - - - - - - - - - - - - - - - - - - - - - - - - -
311,044 311,044
- - - - - - - - - - - - - - - - - - - - - - - - - -
- -
A. ASSET MANAGEMENT 1. Proprietary portfolio management 1.1 Sales fees UCI Individual portfolio management Pension funds 1.2 Maintenance fees UCI Individual portfolio management Pension funds 1.3 Incentive fees UCI Individual portfolio management Pension funds 1.4 Other fees and commissions UCI Individual portfolio management Pension funds 2. Discretionary portfolio management UCI Individual portfolio management Pension funds Total asset management fees (A)B. Other services Advisory services Other services Total fees for other services (B) Fee expenses for sales, distribution and order intakeTotal fees and commissions (A+B)
Financialinstitutions
OtherBanks Total
of which:Group
of which:Group
of which:Group
of which:Group
Services

194 G r u p p o A z i m u t
“Fee and commission expense - other services” comprises the reversal of the cost accrued until 2018 (20 million euro) related to the Long-term incentive plan described below, since the relevant goals were not achieved.Specifically, the conditions of the Long-term incentive plan (2015-2019 Plan) provided that the Beneficiaries would meet a specific service condition, i.e., that the Azimut Group achieves specific performance and result goals (performance condition) as described below:1) cumulative net profit of 1 billion euro in 2015 - 2019;2) a 15 billion euro increase in adjusted shareholders’ equity, excluding acquisitions, if
any, and the market effect;3) achieving the 50 billion euro assets under management threshold;4) acquiring at least 15 thousand new customers during the plan term;5) achieving a trading price of Azimut Holding S.p.A. shares on Borsa Italiana equal to
or greater than 35 euro each.
Since at least four of the five above goals were not achieved at the end of the service period, no Azimut Holding S.p.A. shares were assigned. Consequently, the cost accrued by the subsidiaries Azimut Capital Management Sgr S.p.A. and Azimut Financial Insurance S.p.A. was reversed to profit or loss.This was an equity-settled plan which granted Azimut Holding S.p.A. ordinary shares against the services provided by the Beneficiaries over the term of the plan. Therefore, it fell under the scope of IFRS 2 for equity-settled payments.
Notes to the consolidated financial statements

195
- - - -
7
903 903
- - -
289 - 1,198
-
Section 2Dividends andsimilar income
Section 3Interest
This item amounts to 24 thousand euro (3 thousand euro in 2018).
2.1 Breakdown of item 30 “Dividends and similar income”
3.1 Breakdown of “Interest income and similar income”This item amounts to 994 thousand euro (1,198 thousand euro in 2018).
“Other assets” includes interest accrued solely on loans granted to financial advisors.
24
24 0
3
3
A. Held-for-trading financial assetsB. Other financial assets mandatorily measured at fair valueC. Financial assets at fair value through other comprehensive incomeD. Equity investmentsTotal
Total 31/12/2018Total 31/12/2019
Income fromUCI units
Income from UCI units
Dividends Dividends
1. Financial assets at fair value through profit or loss: 1.1. Held-for-trading financial assets 1.2. Financial assets designated at fair value 1.3 Other financial assets mandatorily measured at fair value2. Financial assets at fair value through other comprehensive income3. Financial assets at amortised cost: 3.1. Due from banks 3.2. Due from financial companies 3.3 Due from customers 4. Hedging derivatives5. Other assets6. Financial liabilitiesTotalof which: interest income on impairedfinancial assets
Items/Technical forms
Items/Income
Other Total 31/12/2019
Total 31/12/2018
- - - -
48
- - - - - - -
48 -
- - - -
-
- - - - - - -
- -
- - - -
-
614
614 - - - - - 614 -
- - - -
-
-
- - - -
332 -
332 -
- - - -
48
614
614 - - -
332 -
994 -
Deposits and current
accounts
Repurchase agreements
Debt instruments

196 G r u p p o A z i m u t
--
- - -
- - - -
3.2 Breakdown of “Interest expense and similar charges”This item amounts to 14,570 thousand euro (8,922 thousand euro in 2018).
This item reflects a profit of 58 thousand euro (a loss of 9 thousand euro in 2018).
6.1 Breakdown of “Profits (losses) on disposal or repurchase”
“Due to banks - other loans” is mainly composed of interest expense arising from the loans raised by the Parent Company.
Section 6Profits (losses) on disposalor repurchase
1. Financial liabilities at amortised cost 1.1. Payables 1.2. Outstanding securities2. Held-for-trading financial liabilities3. Financial liabilities measured at fair value4. Other liabilities5. Hedging derivatives6. Financial assetsTotalof which: interest expense on lease liabilities
Items/Technical forms Deposits and current
accounts
Other Total 31/12/2019
Total 31/12/2018
- - - - -
-1,637 - -
-1,637 -1,267
-12,933 -5,127 -7,806
- -
-1,637 - -
-14,570 -1,267
-8,487 -1,120 -7,367
- -
-435 - -
-8,922
-5,127 -5,127
- - -
---
-5,127
-7,806 -
-7,806 - - - --
-7,806
Loans Repurchase agreements
-
- -
-9
-9
--9
-9
-9
--9
-
- -
58
58
- 58
58
58
- 58
1. Financial assets 1.1 Financial assets at amortised cost: - due from banks - due from financial companies - due from customers 1.2 Financial assets at fair value through other comprehensive income - debt instruments - loans 1.3 Other financial assetsTotal (1)2. Financial liabilities at amortised cost 2.1 Payables 2.2 Outstanding securitiesTotal (2)Total (1+2)
Total 31/12/2019Items/Income items Total 31/12/2018
Netresult
Netresult
LossLoss ProfitProfit
Notes to the consolidated financial statements

197
7.1 Breakdown of net gains (losses) on financial assets and financial liabilities at fair value through profit or loss: assets and liabilities designated at fair value
7.2 Breakdown of “Net gains (losses) on financial assets and financial liabilities at fair value through profit or loss”: other financial assets mandatorily measured at fair value
This item mainly includes the effect recognised in profit or loss of the fair value measurement of the put and call options in place to purchase the residual portion of the share capital of some subsidiaries that are not wholly owned (8,146 thousand euro).
Section 7Net gains (losses) on financial assets and financial liabilities atfair value through profit or loss
8,286
8,286
11,116 11,116
11,116
8,051 8,051
8,051
8,286
8,286
3,065 3,065
3,065
1. Financial assets 1.1 Debt instruments 1.2 Loans2. Financial assets and financial liabilities in foreign currency: exchange rate differences3. Financial liabilities 3.1 Payables 3.2 Debt instrumentsTotal
1. Financial assets 1.1 Debt instruments of which: government securities 1.2. Equity instruments 1.3. UCI units of which: owned UCI 1.4 Loans 2. Financial assets and financial liabilities in foreign currency: exchange rate differencesTotal
Netresult
Netresult
Losses on disposal
Losses on disposal
Profits on disposal
Profits on disposal
Gains
Gains
Losses
Losses
Items/Income items
Items/Income items

198 G r u p p o A z i m u t
1. Employees a) wages and salaries b) social security c) staff severance pay (TFR) d) pension contributions e) TFR provisions f) accrual to the pension provision and similar obligations: defined contribution defined benefit g) private pension plans: defined contribution defined benefit h) other employee benefits2. Other personnel3. Directors and Statutory Auditors4. Early retirement costs5. Cost recoveries for employees seconded to other companies6. Reimbursed costs for employees seconded to the companyTotal
77,242 62,754 8,434
- -
1,273 - - -
54 54
- 4,727 1,135
19,231 - -
-
-97,608
Total31/12/2018
88,058 69,995 11,841
- -
1,029 - - -
23 23
- 5,170 1,659
18,658 - -
-
-108,375
Total31/12/2019
Items
9.1 Breakdown of “Personnel costs”This item amounts to 108,375 thousand euro (97,608 thousand euro in 2018). The breakdown is as follows:
Section 9Administrative costs
Notes to the consolidated financial statements
“Net premiums” amount to 7,465 thousand euro (2,111 thousand euro in 2018) for premiums relating to unit-linked policies issued by the Irish insurance company AZ Life Dac, classified as insurance contracts.
This item amounts to 276,296 thousand euro (166,035 thousand euro in 2018) and is composed of realised gains and losses and changes in the value of financial assets and liabilities, relating to unit-linked policies, and measured at fair value.
Net premiums
Net profits (losses) on financial instruments at fair value through profit or loss
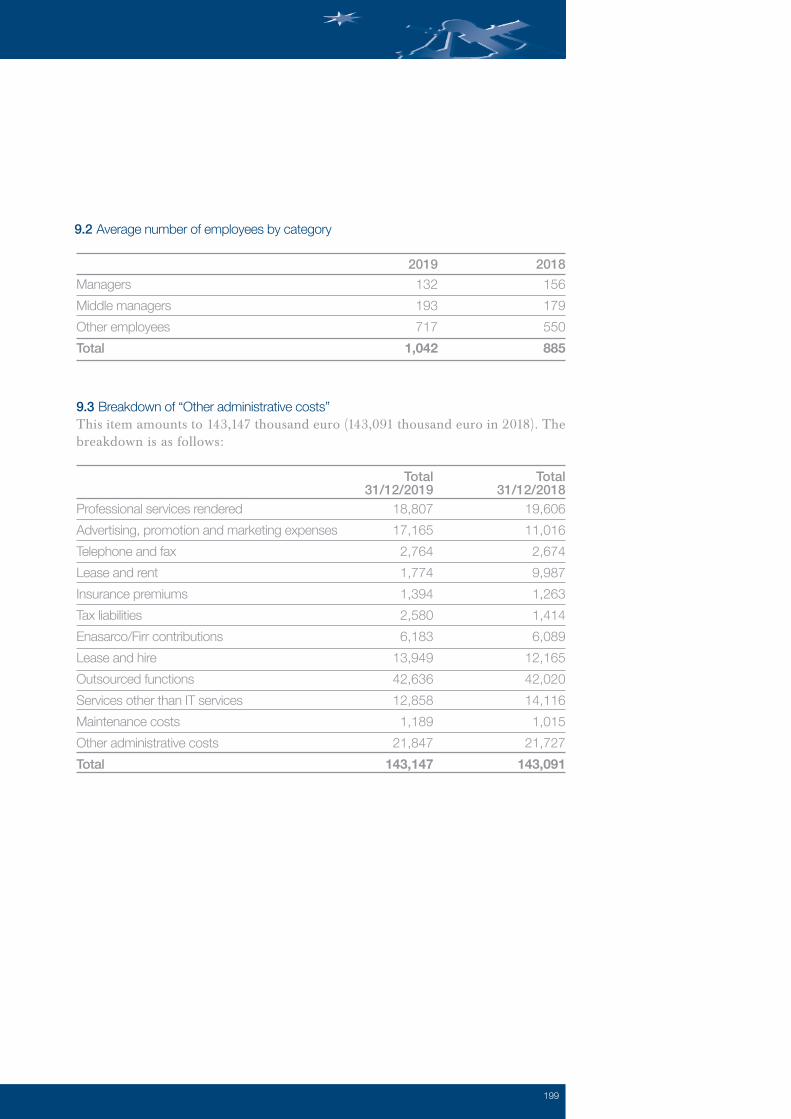
199
Professional services renderedAdvertising, promotion and marketing expensesTelephone and faxLease and rentInsurance premiumsTax liabilitiesEnasarco/Firr contributionsLease and hireOutsourced functionsServices other than IT servicesMaintenance costsOther administrative costsTotal
9.3 Breakdown of “Other administrative costs”This item amounts to 143,147 thousand euro (143,091 thousand euro in 2018). The breakdown is as follows:
19,606 11,016 2,674 9,987 1,263 1,414 6,089
12,165 42,020 14,116 1,015
21,727 143,091
Total31/12/2018
18,807 17,165 2,764 1,774 1,394 2,580 6,183
13,949 42,636 12,858 1,189
21,847 143,147
Total31/12/2019
9.2 Average number of employees by category
ManagersMiddle managersOther employeesTotal
156179550885
2018132193717
1,042
2019

200 G r u p p o A z i m u t
Notes to the consolidated financial statements
10.1 Breakdown of “Net accruals to provisions for risks and charges”This item amounts to 10,159 thousand euro (4,280 thousand euro in 2018) and includes the accrual to the supplementary indemnity provision for agents (9,723 thousand euro) and the net accrual to the provision for sundry risks and charges (435 thousand euro), related to risks for disputes with customers, as described in the note to “Provisions for risks and charges” – Section 11 of Liabilities.
In 2019, net impairment losses on property, plant and equipment based on depreciation are broken down as follows:
11.1 Breakdown of “Net impairment losses/reversals of impairment losses on property, plant and equipment”
Section 10Net accruals to provisionsfor risks and charges
Section 11Net impairment losses/reversals of impairment losses on property, plant and equipment
1. Group-owned business purposes investment purposes2. Under finance lease business purposes investment purposesTotal
Items/Impairment losses and reversals
2,683 2,683
- 8,075 8,075
- 10,758
--- - - - -
--- - - - -
Net result
2,683 2,683
- 8,075 8,075
- 10,758
Reversals of impairment
losses
Impairment losses
Depreciation
1. Goodwill2. Other intangible assets 2.1 Group-owned generated internally other (software packages) 2.2 Under finance leaseTotal
Items/Impairment losses and reversals
- 13,248 13,248
- 13,248
- 13,248
Net result
- 13,248 13,248
- 13,248
- 13,248
--- - ---
--- - ---
Reversals of impairment
losses
Impairment losses
Amortisation
In 2019, net impairment losses on intangible assets based on amortisation are broken down as follows:
12.1 Breakdown of “Net impairment losses/reversals of impairment losses on intangible assets”
Section 12Net impairment losses/reversals of impairmentlosses on intangible assets

201
Section 14Profits (losses) on equity investments
13.1 Breakdown of “Other operating income and costs”This item is negative by 8.496 thousand euro (a negative 522 thousand euro in 2018) and is mainly comprised of trade expenses and current account bank charges, in addition to charge-backs made to financial advisors.
14.1 Breakdown of “Profits (losses) on equity investments” This item is a loss of 17 thousand euro (a profit of 190 thousand euro in 2018).
16.1 Breakdown of “Impairment losses on goodwill”This item reflects the impairment loss on the goodwill of Sigma (16,544 thousand euro), following its voluntary liquidation, and that on the goodwill of AZ Swiss, following the acquisition of Sogenel business unit.
Section 13Other operating income and costs
Section 16Impairment losseson goodwill
1. Income 1.1 Revaluations 1.2 Profits on disposal 1.3 Reversals of impairment losses 1.4 Other increases2. Costs 2.1 Write-downs 2.2 Losses on disposal 2.3 Impairment losses 2.4 Other costsNet result
Items 2018--
(17)(17)
(17)
410410
(220)(220)
190
2019

202 G r u p p o A z i m u t
Current income taxes for the year mainly refer to IRAP and IRES paid by the Group’s Italian companies, taxes payable by the foreign companies as well as the income and charges from tax consolidation amounting to the taxes receivable and due on taxable income transferred to the Parent Company by the Group’s Italian subsidiaries that have adopted the tax consolidation regime pursuant to Article 117 of Italian Presidential Decree 917/86.Taxes for the Group’s foreign companies are calculated in accordance with the tax regulations in force in the individual countries of residence. “Change in deferred tax assets” includes the release of deferred tax assets on the amount of the lease instalment deductible during the year and the recognition of deferred tax assets on temporary differences resulting from the different timing criteria of IRES tax deductibility.The same item also includes the deferred tax liabilities on dividends to be paid by the subsidiaries within the consolidation scope.
18.2 Reconciliation of theoretical and effective tax charge
1. Current taxes2. Changes in current taxes of previous years3. Decrease in current taxes for the year3.bis Decrease in current taxes for the year due to tax credits pursuant to Italian Law No. 214/20114. Change in deferred tax assets 5. Change in deferred tax liabilitiesTotal
Breakdown Total31/12/2018
58,675
11,295 -4,804 64,903
24,764
-2,606 -6,845 15,314
Total31/12/2019
18.1 Breakdown of “Income tax on profit from continuing operations”Section 18Income tax on profit from continuing operations
Notes to the consolidated financial statements
Pre-tax profitApplicable theoretical rateTheoretical tax chargeEffect of increases Effect of decreasesChange in deferred tax assetsChange in deferred tax liabilitiesOther increases (decreases)Current IRAP taxesDecreases due to foreign companies excluded from tax consolidation (CNM)Taxes as per the financial statements
31/12/2019Reconciliation of theoretical and effective tax rate 452,845 24
108,683 7,203
(94,551)7,441
(7,595)456
12,04031,22764,903

203
Section 19Gains (losses) on discontinued operations, net of taxes
Section 20Profit (loss) for the yearattributable to minority interest
This item is a loss of 1,692 thousand (417 thousand euro in 2018) and relates to the sale of the investment in Mofid Entekhab Asset Management.
This item is positive by 16,239 thousand euro (18,434 thousand euro in 2018) and reflects the net balance of profits and losses attributable to minority interest in consolidated companies.
Section 1Specific references tobusiness activities
Part D - Other information
1.1 Information on commitments, guarantees and third-party assets1.1.1 Commitments and guarantees issued to third parties At 31 December 2019, the Group had commitments to Banco BPM S.p.A. for a total of 1.2 million euro relating to sureties issued in favour of the subsidiary Azimut Capital Management SGR S.p.A..No collateral was issued at 31 December 2019.As regards the business activities of AZ Life dac, for as long as there is no change in its shareholding structure, Azimut Holding S.p.A. has made a commitment to the IFSRA (Irish Financial Services Regulatory Authority) to provide the insurance company with the necessary capital in the event that it is unable to meet an adequate solvency margin, in accordance with the relevant regulations.
1.1.2 Commitments relating to guaranteed pension fundsAzimut Capital Management SGR S.p.A. has a unit of the Azimut Previdenza pension fund, known as “Guaranteed”, the management of which is assigned to Intesa San Paolo Vita S.p.A.. This Azimut Previdenza pension fund guarantees the policyholder at least the amount of capital invested (net of all charges to be paid by the policyholder, as well as any advances and redemptions), in addition to a guaranteed minimum return of 2% per annum once certain requirements have been met.The company did not recognise a provision for risks since the actuarial valuations carried out by the expert confirm that the balance of the fund for net commissions is below the value of the guarantee given, net of the coverage offered by Intesa San Paolo Vita S.p.A..

204 G r u p p o A z i m u t
1.1.5 Third-party assets under custodyThird-party assets and securities entrusted by customers using individual and collective portfolio management services are deposited at the custodian bank BNP Paribas. Third-party assets and securities entrusted by customers and invested in hedge funds are deposited with BNP Paribas. Third-party assets and securities entrusted by customers and invested in Luxembourg funds are deposited with the custodian bank BNP Paribas. Third-party assets and securities entrusted by customers invested in the discretionary portfolios of CGM Italia SGR S.p.A. and GCM - Azimut Monaco, are mainly deposited with: Banca Popolare Commercio e Industria, UBS Milano, Banca Generali and Banca BSI Monaco. Third-party assets and securities entrusted by customers and invested in Luxembourg Eskatos funds are deposited with the custodian bank Banque Privée Edmond de Rothschild. Third-party assets and securities entrusted by customers and invested in Turkish funds are deposited with the custodian banks Takasbank and Euroclear.Third-party assets and securities entrusted by customers to AZ Investment Management are deposited with the custodian bank ICB, Shanghai Branch. Third-party assets and securities entrusted by customers and invested in Brazilian funds are deposited with the custodian bank Banco BTG Pactual SA.Third-party assets and securities entrusted by customers and invested in Mexican funds are deposited with the custodian bank Banco S3 (a JV of Santander+Caceis).
UCI units deposited with BNP PARIBASUCI units deposited with Banque De Rothschild LuxembourgUCI units deposited with Banco BTG Pactual SaUCI units deposited with Banco S3 UCI units deposited with TakasbankAzimut Holding S.p.A. treasury shares depositedwith Banco BPN S.p.A.Azimut Holding S.p.A. treasury shares depositedwith BCC Treviglio Azimut Holding S.p.A. treasury shares depositedwith Intesa San PaoloTotal
124,427 25,094 5,721
9,458
20,975
15,254
200,929
498,569 19,421 10,934
557 1,460
15,310
34,048 -
580,298
Own securities deposited with third parties 31/12/201831/12/2019
Notes to the consolidated financial statements
1.1.4 Own securities deposited with third parties

205
1.2 Information on assets under management1.2.1 Total net UCI (breakdown by country)
1. Proprietary portfolio managementItalyLuxembourgMonacoSwitzerlandTurkeyBrazilChileChinaMexicoSingaporeTaiwanAustraliaUnited Arab EmiratesEgyptTotal proprietary portfolio management
1,865,613 23,171,347
228,601 643,672 196,004
3,892,980 16,873 69,116
166,598 14,385
204 305,262 91,673
30,662,328
2,216,102 25,183,994
227,046 738,687 468,596
4,912,444 10,835 82,807
233,463 11,474
256 333,405 326,361 42,694
34,788,165
UCI 31/12/201831/12/2019
1.2.2 Total value of portfolio management activity
9,618,7411,322,018
-
8,565,856738,795
-
1. Proprietary portfolio management2. Discretionary portfolio management3. Portfolio management delegated to third parties
Total 31/12/2018Total 31/12/2019
of which investedin AM company
funds
of which investedin AM company
funds

206 G r u p p o A z i m u t
1.2.3 Total value of pension fundsNet value of pension funds managed by Azimut Capital Management SGR S.p.A. at 31 December 2019:
1.2.5 Advisory services: number of contracts in placeAt 31 December 2019, there are 182,255 contracts.
1. Proprietary portfolio management 1.1 Open-ended pension funds: Azimut Previdenza Comparto Protetto Azimut Previdenza Comparto Equilibrato Azimut Previdenza Comparto Crescita Azimut Previdenza ObbligazionarioTotal proprietary portfolio management2. Discretionary portfolio management 2.1 Pension funds: open-ended closed-ended other forms of pension fundsTotal discretionary portfolio management3. Portfolio management delegated to third parties 3.1 Pension funds open-ended Azimut Previdenza Comparto Garantito closed-ended other forms of pension fundsTotal portfolio management delegated to third parties
- 334,781 263,286 52,314
650,381 - - - - -
144,712 - -
144,712
- 455,953342,24968,689
866,892 - - - -
- 154,457
- -
154,457
Total at 31/12/2018
Total at 31/12/2019
Notes to the consolidated financial statements

207
3.1 Financial risksAs regards financial risks, the Group’s proprietary trading is exposed to market risks. Moreover, the financial instruments in question are easily liquidated and are monitored closely, most being mutual fund units managed by the Group companies. As for credit risk, there are no specific problems given the nature of the corporate activity.At 31 December 2019, the Group held only funds managed by Group companies in its proprietary portfolio as part of liquidity management policies.
The financial risks associated with the use of liquidity refer to flexible mutual funds, such as AZ Fund Multiasset whose goal is the appreciation of capital by investing in the Eurozone in the equity, bond and liquidity markets to the extent of UCIs managed by AZ Fund Management SA.As regards financial risks linked to the investment held in Eskatos Multistrategy ILS Fund, this UCI is an asset that is completely uncorrelated with the normal risks that instruments usually present on the market are subject to.As regards controls over financial management, the risk management function controls the risk profile of the managed portfolio and provides the Investment Department with a market risk assessment risk. Specifically, the assessment is performed by analysing the portfolios of the individual funds and monitoring, on an on-going basis, the significant risk factors identified, such as the average financial duration, exposure to various asset classes and financial instruments, currency exposure and the credit rating of the issuers.In general, the assessment of the portfolios’ risk profile is performed ex-post both in absolute terms (volatility understood as the standard annual deviation) and in relative terms compared to the benchmark (tracking error volatility). With regard to the ex-ante assessment of the market risk, the risk management function uses external providers to calculate the Value at Risk (VaR) of the managed portfolio. Where necessary, the VaR represents the basis for the establishment of the limits within which the manager may accept the risk. In addition, the risk management function monitors the development of the risk models adopted and the return of the funds in relation to peers and the benchmark, where disclosed.
3.2 Operational risksThis form of risk includes those that are typical of the various business operating procedures.In the broader framework of its own activities, the Risk Management function “maps out” and monitors the risks, through specific analyses based on an internally-developed model approved by the internal control and risk management committee. The operating model applied associates an index which summarises the risk level, to each type of risk identified, based on the combination of empirical findings, theoretical assessments and interviews with operators. The results of the analyses are subsequently presented, analysed and discussed with the internal control and risk management committee. Where necessary, the latter takes the necessary measures in respect of the irregularities identified.Since the Company's incorporation, the losses arising from the above-mentioned
Section 3Information on riskmanagement andhedging policies

208 G r u p p o A z i m u t
operational risks have never been significant.With respect to operational risks arising from outsourced functions, when the relevant contract was signed, the Company agreed the terms and conditions governing the provision of the outsourced services and prepared specific service level agreements whereby the outsourcer undertakes to provide its supplies at an appropriate qualitative service level, allowing the Company to take action against the supplier in the event of any economic losses arising from problems in the provision of services. Another measure to ensure that services are performed correctly was the creation of an Operating Committee, whose members come from both Azimut Capital Management SGR S.p.A. and the supplier company, to establish the procedures, define the timescales, and monitor the correct execution of all services provided. This Committee meets at least once a month. Minutes are drawn after the meeting which are subsequently discussed with the participants.
4.1 Company shareholders’ equity4.1.1 Qualitative informationFor information on the individual items of the consolidated shareholders’ equity, please refer to part B of these notes.
Notes to the consolidated financial statements
Section 4Information onshareholders’ equity

209
1. Share capital2. Share premium reserve3. Reserves income-related a) legal b) statutory c) treasury shares d) other other4. (Treasury shares)5. Valuation reserves Financial assets at fair value through other comprehensive income Property, plant and equipment Intangible assets Foreign investment hedge Cash flow hedge Exchange rate differences Non-current assets held for sale and discontinued operations Special revaluation laws Actuarial gains/losses on defined benefit plans Share of valuation reserves for investments measured at equity6. Equity instruments7. Profit (loss) for the yearTotal
32,324173,987288,003
6,465
390,453-108,915-46,337-5,512
276
-5,798
10
36,000122,146 600,611
32,324173,987161,711
6,465
264,161-108,915-23,713-2,631
29
-2,605
-55
36,000370,011747,689
Items/Value 31/12/201831/12/2019
4.1.2 Quantitative information4.1.2.1 Company shareholders’ equity: breakdown

210 G r u p p o A z i m u t
10. Profit (loss) for the year Other comprehensive income not transferred to profit or loss20. Equity instruments at fair value through other comprehensive income: a) changes in fair value b) transfers to other equity items30. Financial liabilities designated at fair value through profit or loss (change in credit rating) a) changes in fair value b) transfers to other equity items40. Hedges of equity instruments at fair value through other comprehensive income: a) changes in fair value (hedged item) changes in fair value (hedging instrument)50. Property, plant and equipment60. Intangible assets70. Defined benefit plans80. Non-current assets held for sale and discontinued operations90. Share of valuation reserves of investments measured at equity100. Income taxes on other comprehensive income not transferred to profit or lossOther comprehensive income transferred to profit or loss110. Foreign investment hedge: a) changes in fair value b) transfer to profit or loss c) other changes120. Exchange rate differences: a) changes in fair value b) transfer to profit or loss c) other changes130. Cash flow hedge: a) changes in fair value b) transfer to profit or loss c) other changes
Items
Section 5Statement ofcomprehensive income
140,997306
147
159
3,662
3,662
387,942 (312)
(65)
(247)
3,193
3,193
31/12/201831/12/2019
Notes to the consolidated financial statements

211
(417)
(417)
3,551144,54818,434
126,114
(1,692)
(1,692)
1,189389,131 16,239
372,892
140. Hedging instruments (non-designated items) a) changes in fair value b) transfer to profit or loss c) other changes150. Financial assets (other than equity instruments) at fair value through other comprehensive income: a) changes in carrying amount b) transfer to profit or loss - credit risk adjustments - profits/losses on disposal c) other changes160. Non-current assets held for sale and discontinued operations: a) changes in fair value b) transfer to profit or loss c) other changes170. Share of valuation reserves of investments measured at equity:measured at equity: a) changes in fair value b) transfer to profit or loss - impairment losses - profits/losses on disposal c) other changes180. Income taxes on other comprehensive income transferred to profit or loss190. Total other comprehensive income (expense)200. Comprehensive income (Items 10+190)210. Consolidated comprehensive income attributable to minority interests200. Consolidated comprehensive income attributable to the parent company

212 G r u p p o A z i m u t
6.1 Information on key management feesDirectors' fees amount to 17,781 thousand euro in 2019.Fees for the Board of Statutory Auditors, calculated based on the parameters in force, amount to 606 thousand euro.
6.2 Related-party disclosuresRelated-party transactions refer to commercial transactions carried out by Azimut Holding S.p.A. with its subsidiaries and associates, and among its subsidiaries and/or associates in 2019. They are part of the Group's ordinary business and were conducted on an arm’s length basis.Moreover:• for the use of the trademark, the subsidiary Azimut Capital Management SGR
S.p.A. pays Azimut Holding S.p.A. contractually established annual royalties totalling 2,000 thousand euro;
• Azimut Holding S.p.A., as the Parent Company, and Azimut Capital Management SGR S.p.A., Azimut Financial Insurance S.p.A., Azimut Libera Impresa SGR S.p.A. and Azimut Enterprises Holding S.r.l. as subsidiaries, have adopted the tax consolidation regime;
• a contractually established annual fee (totalling 1,000 thousand euro) is payable for the coordination activities carried out by the Parent Company on behalf of the subsidiary Azimut Capital Management SGR S.p.A.;
• Azimut Holding S.p.A. has issued sureties to the subsidiary Azimut Capital Management SGR S.p.A..
Azimut Capital Management SGR S.p.A. has disbursed loans to several financial advisors, identified as related parties, to develop their business. The terms and conditions of these loans are at arm’s length. At 31 December 2019, they amounted to 11,063 thousand euro. Moreover, the Group’s directors who also act as managers of mutual funds are exempt from paying fees and commissions on any personal investments made in the funds they manage. An annual fee calculated based on contractually established percentages is payable for the Risk Management, Internal Audit, Compliance and Anti-money Laundering control activities carried out by Azimut Capital Management SGR S.p.A in favour of Azimut Holding S.p.A., Azimut Libera Impresa SGR S.p.A. and CGM Italia Sgr S.p.A.. The balance at 31 December 2019 is 561 thousand euro.An annual fee calculated based on contractually established percentages is payable for the IT/operation activities carried out by Azimut Capital Management SGR S.p.A. in favour of AZ Fund Management Sa. The balance at 31 December 2019 is 2,897 thousand euro.Moreover, in June 2019, Azimut Capital Management SGR S.p.A. paid the covered warrant issued in 2018 and subscribed by the Group’s employees, some of whom are also directors of the Parent Company and its subsidiaries. The instruments exercised by the Group’s employees who also act as directors are equal to 261 for a total
Section 6Related-party transactions
Notes to the consolidated financial statements
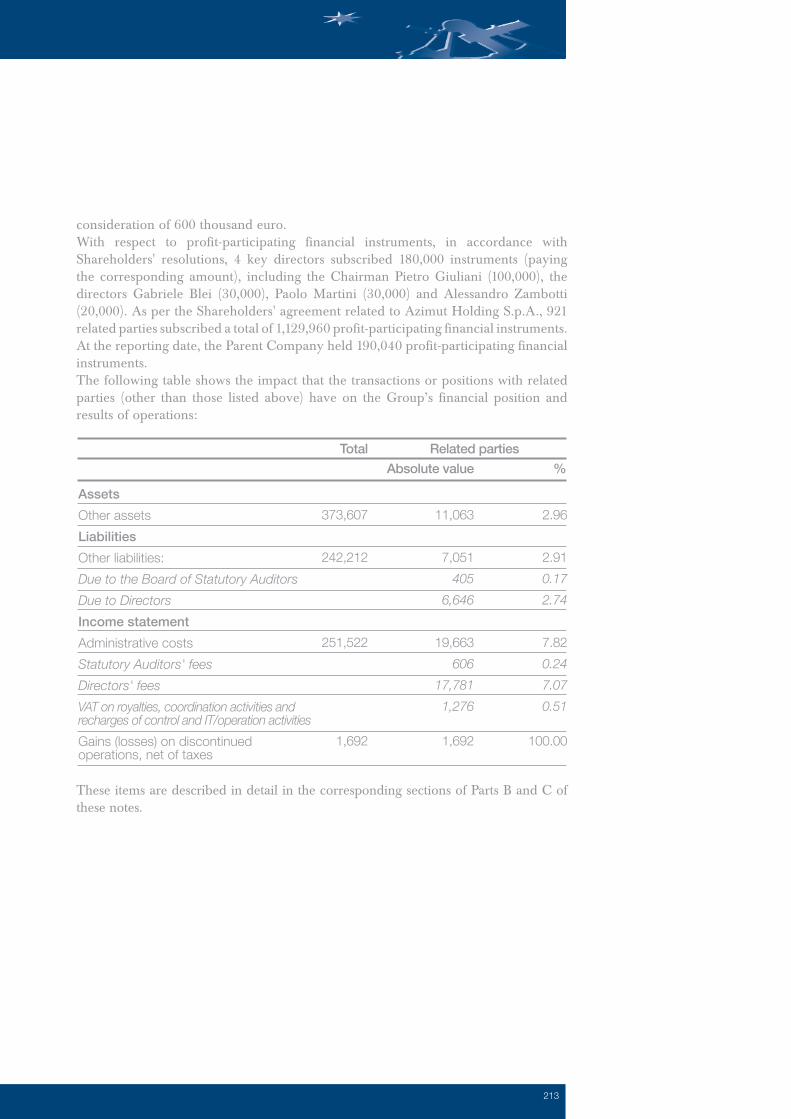
213
consideration of 600 thousand euro.With respect to profit-participating financial instruments, in accordance with Shareholders' resolutions, 4 key directors subscribed 180,000 instruments (paying the corresponding amount), including the Chairman Pietro Giuliani (100,000), the directors Gabriele Blei (30,000), Paolo Martini (30,000) and Alessandro Zambotti (20,000). As per the Shareholders' agreement related to Azimut Holding S.p.A., 921 related parties subscribed a total of 1,129,960 profit-participating financial instruments. At the reporting date, the Parent Company held 190,040 profit-participating financial instruments. The following table shows the impact that the transactions or positions with related parties (other than those listed above) have on the Group’s financial position and results of operations:
11,063
7,051 405 6,646
19,663
60617,781
1,276
1,692
2.96
2.91 0.17 2.74
7.82 0.24 7.07 0.51
100.00
373,607
242,212
251,522
1,692
AssetsOther assetsLiabilitiesOther liabilities:Due to the Board of Statutory AuditorsDue to Directors Income statementAdministrative costsStatutory Auditors' feesDirectors' feesVAT on royalties, coordination activities and recharges of control and IT/operation activitiesGains (losses) on discontinued operations, net of taxes
Related partiesTotalAbsolute value %
These items are described in detail in the corresponding sections of Parts B and C of these notes.
214 G r u p p o A z i m u t
7.1 LeasesThis section provides the information required to the lessee by IFRS 16 which has not been already included in other sections of these consolidated financial statements.
Qualitative information This item provides the qualitative information required by paragraph 60 of IFRS 16. The costs of leases where the underlying asset has a low value (i.e., below 5,000 euro) and the term is 12 months or less are recognised under “Other administrative costs” in the income statement. These costs coincide with the invoice related to the lease payment of the period (quarterly or monthly). The costs relating to these contracts, which mainly refer to IT devices/cars/offices, will continue to be recognised in the income statement as operating costs.
Quantitative information In 2019, the costs of leases with a term of 12 months or less that were entered into at the reporting date amount to 93 thousand euro, while the costs of leases where the underlying asset has a low value amount to 5 thousand euro.The specific notes to the balance sheet and the income statement provide information about the right-of-use assets acquired as part of the leases.
8.1 Average number of financial advisors In 2019, the average number of financial advisors amounted to 1,767.
8.2 Dividends paidThe unit dividend for 2019 amounted to 1.2 euro per ordinary share and was paid in May 2019 in cash. Treasury shares were assigned in the ratio of one treasury share every 56 shares held.
8.3 Significant non-recurring events and transactionsThe significant non-recurring events and transactions which marked 2019 refer to the acquisitions carried out through the subsidiary AZ International Holding SA and the bond issue.
Section 7Leases
Section 8Other information

215
8.4 Audit and non-audit service feesPursuant to Article 149-duodecies of Consob Regulation No. 11971/99 and subsequent amendments and supplements, the breakdown of fees (net of VAT and expenses) due to the independent auditors and companies within its network for auditing and non-auditing services during 2019 is as follows:
PricewaterhouseCoopers S.p.A.
PricewaterhouseCoopers S.p.A. networkPricewaterhouseCoopers S.p.A.PricewaterhouseCoopers S.p.A. networkPricewaterhouseCoopers S.p.A.PricewaterhouseCoopers S.p.A.
Parent Company Azimut Holding S.p.A.Subsidiaries (*)Subsidiaries (**)Parent Company Azimut Holding S.p.A. (**)Subsidiaries (***)Parent Company Azimut Holding S.p.A. (****)Subsidiaries (*****)
107367 93240329271
1,641
Audit
Other services
Certification services
GROUP TOTAL(in thousands of euro)
Fees Service providerService Recipient
(*) This amount includes: 188 thousand euro for the audit of the funds managed by Azimut Capital Management Sgr S.p.A., CGM Italia Sgr S.p.A. and Azimut Libera Impresa Sgr S.p.A., not included in the income statement as the related cost is borne by the Funds. (**) This amount includes the limited assurance on the non-financial statement prepared in accordance with ruling legislation and included in the management report.(***) This amount includes the assistance provided to the Luxembourg subsidiary AZ Fund Management SA (18 thousand euro) as part of the checks performed in connection with the eligibility assessment required by the UCITS regulation and the fees (14 thousand euro) for the transfer pricing assistance provided to the subsidiary AZ Sestante.(****) This amount mainly includes the fees related to the comfort letter for the convertible bond issue (52 thousand euro) and the certification services (35 thousand euro) related to the review of the condensed consolidated interim financial statements of Azimut Holding S.p.A..(*****) This amount mainly includes the audit fees for Solvency II purposes of the Irish subsidiary AZ Life dac (30 thousand euro), the fees for the certification services on the merger of the mutual funds managed by Azimut Capital Management Sgr S.p.A. required by the Bank of Italy’s measure of 19 January 2015 as subsequently amended (15 thousand euro), and the fees for the regular certification services carried out in accordance with local legislation on the subsidiary Azimut (DIFC) Limited (13 thousand euro).

216 G r u p p o A z i m u t
Certification of the consolidated financial statements pursuant to Article 81-ter of Consob regulation no. 11971 of 14 May 1999 and subsequent amendments and supplements
1. The undersigned, Gabriele Blei, Chief Executive Officer, and Alessandro Zambotti, manager in charge of financial reporting of Azimut Holding S.p.A., hereby represent, having also taken into account the provisions of Article 154- bis, paragraphs 3 and 4 of Italian Legislative Decree No. 58 of 24 February 1998: • the adequacy in view of the nature of the business and • the effective application of the administrative and accounting procedures used for the preparation of the 2019 consolidated financial statements.
2. The evaluation of the adequacy of the administrative and accounting procedures for the preparation of the consolidated financial statements at 31 December 2019 is based on a process designed by Azimut Holding S.p.A. in line with the Internal Control – Integrated Framework model issued by the Committee of Sponsoring Organizations of the Treadway Commission (COSO), an internationally accepted reference framework.
3. The undersigned also represents that: 3.1. the consolidated financial statements at 31 December 2019: • were prepared in accordance with the International Financial Reporting Standards endorsed by the European Commission pursuant to Regulation (EC) 1606/2002 of the European Parliament and Council, of 19 July 2002; • are consistent with the accounting books and records; • and provide a true and fair view of the financial position and results of operations of the issuer and the companies included in its scope of consolidation;
3.2. the management report contains a reliable analysis of the consolidated operating performance and results, in addition to the position of the issuer and the consolidated companies and a description of the main risks and uncertainties to which they are exposed.
Milan, 5 March 2020
The Manager in charge of financial reporting(Alessandro Zambotti)
Chief Executive Officer(Gabriele Blei)

217
Azimut Holding S.p.A.2019 separate financial statements

218 G r u p p o A z i m u t

219
Contents2019 Annual report
Company bodies and independent auditors 206
Management Report 208 1. Macroeconomic scenario 208 2. General information about the company 210 3. Azimut shares 211 4. Performance 211 Financial performance 211 Balance sheet figures 212 Net financial position 214 Shareholders' equity, own funds and minimum capital requirements 216 Performance of direct subsidiaries 216 5. Company transactions and other significant events of the year 217 6. Organisational structure and corporate governance 219 7. Other information 220 Risk management and control 220 Related-party disclosures 220 Intra-group relations 221 Research and development 221 Secondary and branch offices 221 Marketing activities 221 Treasury shares 221 8. Significant events after the reporting date 222 9. Business outlook 222 Profit allocation plan 223
Financial statements 225Balance sheet 226 Income statement 228 Statement of comprehensive income 229 Statement of changes in shareholders’ equity 230 Cash flow statement 234 Notes to the separate financial statements 237Part A - Accounting policies 239 Part B - Notes to the balance sheet 264 Part C - Notes to the income statement 289 Part D - Other information 298
Annexes 307Annex A: List of equity investments held 308 Annex B: List of significant equity investments,pursuant to Article 125 of Consob (Italian Securities and Exchange Commission) Regulation No. 11971/99 as amended. 310
Certification of the separate financial statements 313

220 G r u p p o A z i m u t
221
Board of Directors
Pietro Giuliani Chairman Paolo Martini Chief Executive Officer and Managing DirectorGabriele Blei Chief Executive Officer Massimo Guiati Chief Executive OfficerGiorgio Medda Chief Executive OfficerAlessandro Zambotti Chief Executive OfficerMirella Pardi (*) DirectorAmbra Zironi (*) DirectorAnna Maria Bortolotti DirectorNicola Colavito DirectorAntonio Andrea Monari Director Raffaella Pagani Director
Board of Statutory Auditors
Vittorio Rocchetti Chairman Costanza Bonelli Standing Auditor Daniele Carlo Trivi Standing Auditor Maria Catalano Alternate Auditor Federico Strada Alternate Auditor
Independent Auditors
PricewaterhouseCoopers S.p.A.
Manager in charge of financial reporting
Alessandro Zambotti
Company bodies
(*) in office for one year (2019)

222 G r u p p o A z i m u t
Management report
Dear Shareholders,the separate financial statements of Azimut Holding S.p.A. at 31 December 2019 are submitted to your examination and approval. They show a net profit for the year of 209,104,487 euro (186,332,579 euro in 2018).
Background scenarioGlobal growth in 2019 remained subdued. In the first half of 2019, the worldwide growth of real GDP (excluding the euro area) weakened. However, the most recent data point to a stabilisation in the second half of the year. The weak growth trend reflects the slowdown in both manufacturing and investment, worsened by increasing uncertainties in the political and economic policy framework, in addition to the exacerbation of trade tensions and the developments linked to Brexit. However, recent data indicate a stabilisation of operations worldwide, though at low levels. Real GDP continued to expand in the United States and Japan, while the growth of real operations picked up in the United Kingdom. In the third quarter of the year, in the United States, the solidity of the labour market and consumer spending, and favourable financial conditions continued to drive growth, while, in Japan, expansion was driven by robust domestic demand. In the United Kingdom, growth recovered thanks to a surprising expansion in net exports and solid private consumption trends. In China, the figures for the third quarter confirmed the gradual slowdown in operations, driven by investments, while growth stabilised in other emerging economies.International trade weakened in 2019 and is expected to grow at a more moderate pace than global operations in the medium term. Global inflationary pressures remained low, while the risks to international economic activities, though less marked overall, are still on a downward curve. However, the evaluations by corporate purchasing managers (Purchasing Managers’ Index, SME) suggest that, in the fourth quarter, the cycle is still unfavourable in the manufacturing sector.In December, the United States and China reached a first trade agreement (phase-one deal), which is preliminary to a wider discussion on economic relations between the two countries. The agreement averted the US tariff increases initially planned for mid-December and halved those introduced in September. The Chinese government has committed to increasing the imports of agricultural and energy goods from the United States and has offered guarantees on intellectual property protection and exchange rate policy. The agreement reduced the economic tensions between these two countries, which had begun in the first few months of 2018. However, overall, the current duties remain much higher than two years ago. At the end of 2019, the US Congress approved the new trade agreement between the United States, Mexico and Canada (United States-Mexico-Canada Agreement, USMCA), which replaces the 1994 agreement (North American Free Trade Agreement, NAFTA), tightening the rules on the origin of products and the production standards in the automotive sector.Conversely, the decision on duties on imports of cars and components from the
1.Macroeconomic scenario

223
European Union (EU) has been postponed until a later date. In the main advanced economies, consumer prices are growing at around 2% in the United States and even less in other areas. In the United States, long-term inflation expectations based on financial market returns remained broadly stable at around 1.8%.According to OECD’s November forecasts, the global economy would grow by 2.9% this year, as in 2019, the lowest value since the global financial crisis of 2008-09. The weakness of world trade and manufacturing production would continue to affect the economy. According to our estimates, international trade increased by just 0.6% in 2019 and will accelerate modestly in 2020.
Italy's assets under management marketThe asset management sector closed December 2019 with net inflows of 10.26 billion euro and hit a new absolute record for assets under management, reaching 2,288 billion euro.Assets invested in collective portfolio management amount to 1,125 billion euro (49% of the total), while those in portfolio management amount to 1,162 billion euro (51% of the total).Inflows are positive for both portfolio management (6.4 billion) and collective portfolio management (3.8 billion, of which 3.2 billion from open-ended funds).Inflows of long-term funds (+3.4 billion) are driven by bonds (+2.3 billion), followed by equities (+560 million) and balanced funds (+416 million).
Italy's financial product and service distribution market2019 shows total inflows of 34.9 billion euro. Net inflows, up by 16.4% on the previous year, account for the second best results ever achieved by the networks. 58% of net inflows was invested in assets under management products for a total of 20.3 billion euro, up by 51.9% on 2018 (13.4 billion euro). Total assets under custody products are positive at 14.7 billion euro, down by 12.0% on 2018 (16.7 billion euro).With respect to assets under management, 58.6% of net investments relates to the insurance sector, with inflows amounting to 11.9 billion euro (+40.5% on 2018). Net premiums paid on traditional life insurance policies almost doubled compared to 2018 (+85.0%) and amount to 4.9 billion euro, while net investments in financial insurance products amount to 6.9 billion euro (+19.9%), with 3.4 billion euro placed on unit-linked policies (+30.9%) and 3.5 billion euro on multi-line policies (10.8%). Net investments in UCI units amount to 4.8 billion euro (+13.7%) and account for 23.5% of this segment. The resources are focused on open collective portfolio management domiciled abroad, with net volumes totalling 4.4 billion euro (+41.1%). Closed-end securities funds investing in private markets also performed positively and increased, with net resources of 713 million euro (+59.9%), while Italian open-ended funds are negative for 305 million euro.

224 G r u p p o A z i m u t
Management report
Net inflows from discretionary portfolios amount to 2.7 billion euro (-136 million in 2018): net investments concentrated exclusively on discretionary funds, with net inflows of 2.8 billion euro, while net divestments of securities management amount to 125 million euro. In 2019, the net resources for open-ended UCI generated by the network’s activities amount to 14.2 billion euro, enabling the entire fund management system to end with a positive sign (3.8 billion euro). The contribution of the networks to the closed-end securities funds investing in private markets also played a fundamental role: inflows account for 47.5% of total net subscriptions on private markets funds (1.5 billion). Total financial instruments under custody are positive by 1.7 billion euro, down considerably on 2018 (9.2 billion): according to the breakdown of figures, certificates improved (1.7 billion) as well as shares (1.3 billion), exchange traded products (684 million) and bonds (267 million), while government bonds performed negatively (-3.1 billion). Liquidity inflows for 2019 were positive at 13.0 billion euro (+73.3% on 2018).
Azimut Holding S.p.A. (the “Company”) is the Parent Company of the Azimut Group which is Italy's main independent holding company, with assets under management of approximately 59 billion euro at 31 December 2019. The Group is specialised in asset management and provides financial advisory services, mainly through its network of financial advisors.The Company has been listed on the Milan stock exchange since July 2004 and is included, inter alia, in the FTSE MIB and the Euro Stoxx 600 indices. Its shareholding structure is comprised of over 1,900 investment managers, financial advisors and employees who signed a shareholders' agreement which ensures the stability and quality of performance and represents a unique example of commitment and independence.The Company carries out management and coordination activities and, at 31 December 2019, had 9 managers and 6 other resources, including middle managers and office staff. For additional information about workforce figures, reference should be made to Part C, section 9 of the Notes to the financial statements. The Company has not set up any secondary offices in Italy, nor is it engaged in any activity through branch offices.In its role as consolidating entity, the Company participates in the tax consolidation regime pursuant to Article 117 and subsequent articles of the Income Tax Consolidation Act, together with the subsidiaries Azimut Capital Management SGR S.p.A., Azimut Financial Insurance S.p.A., Azimut Libera Impresa SGR S.p.A. and Azimut Enterprises S.r.l.. The relationships arising from this taxation regime are regulated by a specific contract.
2.General informationabout the company

225
3.Azimut shares
The stock price (reference price) of the Azimut shares rose from 9.53 euro at 28 December 2018 to 21.28 euro at 30 December 2019.At 31 December 2019, outstanding shares numbered 143,254,497. On the same date, the capitalisation was approximately 3 billion euro.In 2019, the Company continued to develop its relations with institutional investors, which account for the majority of the shareholding structure. Following approval of annual financial statements and interim reports, the Company organised conference calls and road shows on the main European markets and in the U.S. In March 2020, the Azimut Holding S.p.A. share was covered by the analysts of thirteen Italian and foreign investment firms.
Operating profit came to 209 million euro in 2019 (186 million euro in 2018) mainly due to 2019 dividends amounting to 238 million euro (223 million euro at 31 December 2018). Dividends from Azimut Holding S.p.A. group companies include an interim
Financial performance
Fee and commission incomeNet fee and commission incomeDividends and similar incomeInterest income and similar incomeInterest expense and similar chargesProfits/losses on disposal or repurchase of financial assets and liabilitiesNet gains (losses) on financial assets and financial liabilities at fair value through profit or lossTotal incomeAdministrative costs a) personnel costs b) other administrative costsNet accruals to the provisions for risks and chargesImpairment losses on property, plant and equipmentand intangible assetsOther operating income and costsOperating profitProfits (losses) on equity investmentsIncome taxGains (losses) on discontinued operations, net of taxesProfit for the year
In euro2,000,0002,000,000
222,754,88939,371
(7,525,430)
(6,851,368)
210,417,462(25,527,125)(11,274,895)(14,252,230)
150,000(753,842)
2,055,543186,342,038
01,830,541
(1,840,000)186,332,579
2,000,0002,000,000
238,201,822103,534
(12,137,858)
8,600,243
236,767,741(24,942,993)(9,249,647)
(15,693,346)0
(1,139,482)
1,096,521211,781,787
0(2,677,300)
209,104,487
20182019
4.Performance

226 G r u p p o A z i m u t
Management report
dividend on the profit for 2019 from the subsidiary AZ Fund Management SA of 139 million euro paid in December 2019 (the interim dividend on the profit for 2018 collected in December 2018 from the same subsidiary amounted to 72 million euro).Interest expense amounted to 12 million euro in 2019. The increase on 2018 is due to the rise in the Company’s financial indebtedness, as described in the note to “Liabilities measured at amortised cost”.
The comparative figures for the previous year do not reflect the balances resulting from the retroactive application of IFRS 16. Indeed, for FTA purposes, the Company opted to apply the so-called modified retrospective approach, whereby the right of use is deemed equal to the lease liability. Reference should be made to the paragraph "Basis of preparation" of these separate financial statements for a description and a presentation of the effects of the adoption of IFRS 16.Financial assets at fair value through profit or loss increased considerably on 31 December 2018 as a result of the liquidity investments following the new bond issue (Group’s UCI units). Financial assets at amortised cost comprise cash deposited in bank current accounts. The Parent Company has in place a cash pooling arrangement with some of its subsidiaries.
Equity investments rose by approximately 46 million euro on the 2018 year-end balance mainly as a consequence of (i) capital injections to increase the share capital of the subsidiary AZ International Holdings SA by about 46.4 million euro, (ii) the capital injection to increase the share capital of Azimut Enterprises S.r.l. by 16.7 million euro(iii) 2 million euro paid to purchase Azimut Libera Impresa SGR special shares held by the managers of the Antares Fund, managed by said SGR, as per the agreements entered into on 31 July 2019. At the same time, the special shares were transformed into ordinary shares, and (iv) 1 million euro paid to the former non-controlling
Balance sheet figuresThe Company's key balance sheet figures are shown in the reclassified table below.
Financial assets at fair value through profit or lossFinancial assets at amortised costEquity investmentsProperty, plant and equipment and intangible assetsTax assetsOther asset itemsTotal assets
Assets
312%723%
7%1%
-75%148%47%
340,311,353104,337,60546,221,3211,198,675
-23,681,59936,540,974
504,928,329
109,092,11814,439,318
703,537,534188,144,56431,618,23324,769,198
1,071,600,965
449,403,471118,776,923749,758,855189,343,239
7,936,63461,310,172
1,576,529,294
%AbsoluteChange31/12/201831/12/2019

227
investors of Augustum Opus Sim S.p.A. (merged into Azimut Capital Management SGR S.p.A. in 2017).This item also decreased by 20 million euro, reflecting the 31 December 2019 balance of the incentive plan in favour of the financial advisors operating for Azimut Holding S.p.A.’s subsidiaries (Azimut Capital Management SGR S.p.A. and Azimut Financial Insurance S.p.A.), whose remuneration comprised Parent Company’s shares (share-based payments) upon achieving specific targets that were not complied with. This item has a balancing entry in a specific equity reserve.
Property, plant and equipment and intangible assets increased as a consequence of the rise in intangible assets with a finite life due to the investments of the year and the recognition of right-of-use assets following the application of IFRS 16 which amounted to 0.8 million euro at 31 December 2019. Intangible assets, which include goodwill (approximately 150 million euro), software and trademarks (roughly 39 million euro) and office machinery, are substantially unchanged compared to the previous year.
The decrease in Other asset items relates to the change in Group company balances as a result of the cash pooling arrangement and the IRES receivable from Azimut Capital Management SGR S.p.A. for national tax consolidation purposes.
Financial liabilities at amortised costTax liabilitiesOther liability itemsShare capitalTreasury sharesEquity instrumentsReserves and share premium reserveProfit for the yearTotal liabilities and shareholders’ equity
Liabilities and shareholders' equity
158%-9%
-85%0%
-49%0%
-12%12%47%
558,598,938-4,785,365
-45,388,4380
22,623,7830
-48,892,49722,771,908
504,928,329
354,165,37552,570,66553,615,55132,324,092
-46,336,57836,000,000
402,929,281186,332,579
1,071,600,965
912,764,31347,785,3008,227,113
32,324,092-23,712,79536,000,000
354,036,784209,104,487
1,576,529,294
%AbsoluteChange31/12/201831/12/2019
The increase in Financial liabilities at amortised cost is due to a loan granted by Banco BPM on 28 February 2019 and divided into two lines, A and B, each amounting to 100 million euro. Line A is repayable in tranches while Line B is entirely due on 31 December 2021. The interest rate is calculated based on the Euribor plus 140 basis points for Line A and 160 basis points for Line B. The loan is subject to covenants. On 31 December 2019, the loan was repaid in advance for 120 million euro, in addition to the payment of Line A due on the same date (20 million euro). This item also includes the lease liabilities which arose as a result of the application of IFRS 16, amounting to 0.8 million euro at 31 December 2019.

228 G r u p p o A z i m u t
Management report
Financial liabilities at amortised cost also comprise the Outstanding securities related to the “Azimut 2017-2022 2%” and the “Azimut 2019-2024 1.625%” bonds issued in December 2019. This transaction is described in the paragraph “Significant events of the year” of the management report.
Other liabilities decreased significantly in respect of intercompany balances and, specifically, the payment of the amounts due to AZ Fund Management SA and Azimut Financial Insurance S.p.A., following the cash pooling arrangement.
The decrease in Treasury shares is due to last year’s partial dividend distribution through the allocation of Azimut Holding shares. Changes in this item are described in the paragraph “Significant events of the year”.
Net financial positionAt 31 December 2019, the net financial position was negative by 358 million euro, up on the balance at 31 December 2018 (-240 million euro).The balance was impacted by the liquidity generated by operating activities, as well as by the cash payment of dividends to shareholders (166 million euro), in addition to the following main transactions carried out during the year:• in 2019, following the Board of Directors' resolutions of 7 March 2019 and 12
December 2019, Azimut Holding S.p.A. made a capital injection of 46.4 million euro to increase the share capital of the subsidiary AZ International Holdings Sa and finance the Group's international development;
• a capital injection of 16.7 million euro in 2019 to increase the share capital of Azimut Enterprises S.r.l..
During the year, the Company recognised dividend income from its investees for 238 million euro, of which 139 million euro as interim dividends from AZ Fund Management SA. The Company entered into a cash-pooling arrangement with its subsidiaries AZ Fund Management SA, Azimut Capital Management SGR S.p.A. and Azimut Financial Insurance S.p.A., to centralise treasury with Azimut Holding S.p.A. and increase the efficiency of the Group’s liquidity management, while maintaining legal and operational independence. The service provided refers solely to the organisation and management of non-bank current account items and offsetting intercompany commercial transactions. The service provides for a one-month Euribor plus a 10bp spread.

229
With regard to the methods used to assess net financial position, reference was made to the recommendation issued by CESR (Committee of European Securities Regulators) dated 10 February 2005, and more specifically to the paragraph on “Capitalisation and indebtedness” in chapter II. Receivables and payables include those of a financial nature only, whereas trade receivables and payables have been excluded.
A Cash B Cash equivalents: Due from banksC Financial assets at fair value through profit or lossD Total cash A+B+CE Short-term financial receivablesF Short-term bank loansG Current portion of long-term debt: Azimut 17-22 Bond Azimut 19-24 Bond Due to banks (Banco BPM loan)H Other short-term financial payablesI Short-term financial debt F+G+HJ Short-term financial debt (net) I-E-DK Long-term bank loans Due to banks (Banco BPM loan)L Bonds Azimut 17-22 Bond Azimut 19-24 BondM Other long-term payables Liabilities from the application of IFRS 16N Long-term financial debt K+L+MO Net financial debt J+N
7,23114,439,31814,439,31899,241,747
113,688,296--
-5,350,685-5,350,685
00-
-5,350,685108,337,611
00
-348,814,690-348,814,690
0-
-348,814,690-240,477,079
5,887118,776,923118,776,923435,815,774554,598,584
--
-25,773,630-5,350,685
-422,945-20,000,000
--25,773,630528,824,954-39,490,814 -39,490,814
-846,701,545 -349,172,414 -497,529,131
-798,324 -798,324
-886,990,682-358,165,729
31/12/201831/12/2019Items
The Company's net financial position may be analysed as follows:

230 G r u p p o A z i m u t
Management report
AZ Fund Management SA manages the Luxembourg-based umbrella funds, AZ Fund 1 and AZ Multiasset. During the year, it achieved a profit of 325 million euro compared to a profit of approximately 164 million in 2018.AZ life Dac is Azimut Group's Irish-based company authorised to provide life insurance services in Ireland as per the Central Bank of Ireland's measure of 13 January 2004. AZ Life Dac, which also operates through the Milan branch, provides customers with personalised assistance designed specifically for them. In fact, AZ Life Dac offers solutions differentiated based on customer type through different Unit-Linked policies, including based on the customer's investment strategies. During the year, it achieved a profit of 33 million euro compared to a profit of approximately 24 million euro in 2018.Azimut Capital Management SGR S.p.A. is an independent asset management company that manages 15 Italian funds harmonised with Directive 2009/65/EC, an Italian hedge fund and a pension fund. Furthermore, it provides investment portfolio individual management services on behalf of third parties, including under delegation arrangements. The company manages the closed-end alternative investment fund “Azimut Private Debt”, which was set up in June 2017 and which became operative in February 2019. The net profit for 2019 amounts to 144 million euro compared to a profit of 47 million euro in 2018.Azimut Enterprises Holding S.r.l. is a company investing in unlisted companies, including Programma 101 Sicaf S.p.A., Siamosoci S.r.l. and Cofircont Compagnia Fiduciaria S.r.l. which contribute to diversifying the Group's business. Programma 101 Sicaf S.p.A. is a venture capital company specialised in early stage investments in the digital sector,
Shareholders' equity, own funds and minimum capital requirementsThe development of shareholders' equity at 31 December 2019 primarily reflects the decisions regarding the allocation of the profit for the year made when approving the 2018 financial statements which entailed cash payment of dividends of 182 million euro and payment of profit-participating financial instruments held by top key people, in addition to a donation of 1.6 million euro to Fondazione Azimut Onlus. For additional information, reference should be made to the relevant section of these notes.
Performance of direct subsidiaries
1. AZ Fund Management SA 2. AZ Life Dac3. Azimut Capital Management SGR S.p.A.4. Azimut Enterprises S.r.l.5. AZ International Holdings SA6. Azimut Financial Insurance S.p.A.7. Azimut Libera Impresa SGR S.p.A.
163,508,402 23,509,422 47,441,839
-742,576 -4,030,762 26,548,152
-432,164
325,438,483 32,682,256
143,553,036 -998,550
-6,694,312 51,501,461 -1,104,140
LuxembourgIreland
ItalyItaly
LuxembourgItaly Italy
2018profit (loss)
2019profit (loss)
Registeredoffice

231
5.Company transactionsand other significantevents of the year
while Siamosoci S.r.l. acts as start-up incubator. Cofircont Compagnia Fiduciaria S.r.l. is a fiduciary company. In 2019, the Company acquired Gellify which specialises in the B2B innovation platform, by subscribing a capital increase of 8 million euro. During the year, Azimut Analytics S.r.l. was put into voluntary liquidation and subsequently wound up as resolved by the quotaholders in their meeting on 11 December 2019. In 2019, it incurred a loss of 999 thousand euro compared to a loss of 743 thousand euro in 2018.AZ International Holdings SA is a Luxembourg-based holding company through which the Group continued its research, development, acquisition and management of foreign partnerships. Through this company, the Group is present in 15 countries, including Luxembourg, Ireland, China (Hong Kong and Shanghai), Monaco, Switzerland, Singapore, Brazil, Mexico, Taiwan, Chile, Australia, Turkey, the United States, the United Arab Emirates and Egypt. In 2019, it incurred a loss of 6 million euro compared to a loss of 4 million euro in 2018.Azimut Financial Insurance S.p.A. carries out insurance mediation, except for reinsurance mediation, and bank products' placement and distribution activities. In 2019, it achieved a profit of 52 million euro compared to a profit of 27 million euro in 2018. Azimut Libera Impresa SGR S.p.A. manages private equity funds. In 2019, it incurred a loss of 1 million euro compared to a loss of 432 thousand euro in 2018.
Azimut Holding S.p.A.Capitalisation transactions carried out by Azimut Holding S.p.A.In 2019, following the Board of Directors' resolutions of 7 March 2019 and 12 December 2019, Azimut Holding S.p.A. made a capital injection of 46.4 million euro, in tranches, to increase the share capital of the subsidiary AZ International Holdings SA and finance the Group's international development. During the year, Azimut Holding S.p.A. made several capital injections totalling 16.7 million euro to increase the share capital of Azimut Enterprises S.r.l..
Loan granted by Banco BPM to Azimut Holding S.p.A.On 22 February 2019, the Parent Company signed an unsecured loan agreement with Banco BPM worth 200 million euro at the best market terms currently available. The loan, part amortising (Line A) and part bullet (Line B) expires on 31 December 2021. It provides the Group with increased financial flexibility in order to seize any growth and investment opportunity, including buyback programmes, without using the available cash in potentially non-optimal situations.The first instalment falling due was paid on 31 December 2019 (20 million euro - Line A) and a total of 120 million euro was repaid early on both Lines.
2019-2024 1.625% bondOn 5 December, Azimut Holding S.p.A. announced the completion of the placement to qualified investors, with the exclusion of the United States of America and other

232 G r u p p o A z i m u t
Management report
selected countries, of a senior unsecured fixed-rate Bond. The Bond has a nominal value of 500 million euro, a fixed-rate coupon of 1.625%, a five-year duration, maturing on 12 December 2024, and an expected rating “BBB-, Stable Outlook”, as stated by the rating agency Fitch Rating Ltd on 6 November 2019. The bonds were listed on the Official List of the Irish Stock Exchange plc, trading as Euronext Dublin and admitted to trading on its regulated market. The proceeds from the issue of the Bond may be used by Azimut Holding S.p.A. for general corporate purposes, and to fund potential investments and/or extraordinary transactions including, inter alia, the possible repurchase of the Company’s outstanding equity instruments and/or repay part of the Company’s indebtedness. Specifically, part of the proceeds were used to partially repay, for approximately 140 million euro, the 200 million euro loan granted by Banco BPM at the start of the year.
Azimut Holding S.p.A. General Shareholders’ Meeting of 24 April 2019The shareholders’ meeting (both ordinary and extraordinary) of 24 April 2019 resolved the following:
Approval of 2018 financial statementsThe shareholders’ meeting approved the 2018 financial statements, which included a Parent Company net profit of 186.3 million euro. The shareholders concurrently resolved to pay a dividend of 1.50 euro per ordinary share, pre-tax, which was paid as of 22 May 2019, 20 May 2019 ex-dividend payment date and 21 May 2019 as the record date. Each shareholder received (before withholding tax) a minimum of 3/4 by cash and the residual portion in shares of Azimut Holding, held as treasury shares by the company. These shares were assigned after the ex-dividend payment date on 20 May 2019. The portion of dividends to be paid in cash, the value and the allocation ratio of any dividend to be paid as shares, and the fractional rights arising from the allocation, were disclosed to the shareholders and the public on the third trading day prior to the ex-dividend payment date (20 May 2019), i.e., on 15 May 2019, based on the official price of Azimut Holding shares in the last five trading days, including 15 May 2019. The fractional rights arising from the share allocation were monetised based on the official price resulting from the transactions carried out on the last market trading day prior to the ex-dividend date, without expenses, fees or other charges for the shareholders. The shareholders also approved the payment to Fondazione Azimut Onlus of 1.6 million euro, equal to 1% of pre-tax consolidated profit and the payment of 12.21 euro for each profit-participating financial instrument held by Top Key People at the time of approval of payment of the dividend.
Appointment of the Board of Directors and the Board of Statutory Auditors The shareholders’ meeting appointed twelve members of the Board of Directors, of whom ten with a three-year term of office and two, representing the distribution network, for one year, confirming Mr. Pietro Giuliani as Chairman. The shareholders’ meeting also appointed the Board of Statutory Auditors for the next three years.

233
Proposal for purchase and allocation of treasury shares and consequent resolutionsFurthermore, the shareholders approved the purchase of up to 28,000,000 Azimut Holding S.p.A. ordinary shares, or 19.55% of the current share capital, including in one or more instalments, considering the shares already in portfolio upon purchase at a minimum unit price equal to at least the carrying amount of Azimut Holding S.p.A. ordinary shares and a maximum unit price of 50 euro.
Resolution on remuneration policies. Remuneration Report and resolution pursuant to article 123-ter, paragraph 6 of Legislative decree no. 58/98The Shareholders approved the Parent Company policy concerning the remuneration of members of the management boards, general managers and key managers, as well as the procedures used to adopt and implement said policy.
Full demerger of CGM Italia SGR S.p.A. into Azimut Capital Management SGR S.p.A. and Azimut Libera Impresa SGR S.p.A.In December 2019, the operations necessary for the full demerger of CGM Italia SGR S.p.A. into Azimut Capital Management SGR S.p.A. and Azimut Libera Impresa SGR S.p.A. began pursuant to article 2506 of the Italian Civil Code. As part of this operation, for purely instrumental and functional reasons, the Parent Company will acquire 100% of CGM Italia SGR S.p.A. from CGM - Azimut Monaco Sa, given that it already holds indirectly this investment as the head of the chain of investors.As a result of the demerger, Azimut Capital Management SGR S.p.A. will be assigned the business unit that manages the alternative investment fund "CGM Azionario EUR" and third-party UCIs, portfolio management, order receipt and transmission and investment advice.As a result of the demerger, Azimut Libera Impresa SGR S.p.A. will be assigned the business unit comprising the activity carried out as the party entrusted with management of the "AZ Multi Asset - ABS” UCITS, the Italian alternative investment fund "Azimut Private Debt" and the reserved Luxembourg alternative fund called "AZ RAIF I - Corporate Cash Plus".The entire operation responds to the need to simplify the Group's corporate structure, as part of the reorganisation launched together with the Parent Company, whose aim is to streamline the Group's structure and related organisational-management structures and procedures, thereby generating cost savings, including in terms of administrative and accounting requirements.The entire operation is subject to the Bank of Italy's approval.
Azimut Holding S.p.A. complies with corporate governance regulations in force in Italy. Moreover, the corporate governance structure partially reflects the recommendations contained in the Corporate Code of Conduct for Listed Companies published by Borsa Italiana.
6.Organisational structureand corporate governance
234 G r u p p o A z i m u t
Management report
Azimut Holding S.p.A. has established a risk management and internal control system over financial reporting, using as a reference the “COSO Report”, under which the Internal Control in the broadest sense is “a process effected by an entity's Board of Directors, management and other personnel, designed to provide reasonable assurance regarding the achievement of objectives”, specifically, the objective of reliable financial reporting.For more information about the corporate governance structure, reference should be made to the “Report on corporate governance and ownership structure” prepared pursuant to Article 123-bis of the Consolidated Law on Finance available on the Company's website (www.azimut-group.com), Azimut Governance section, and attached to the financial statements.
Risk management and control With respect to the main risks to which Azimut Holding S.p.A. and its Group are exposed, the following risks were identified:• Strategic risk• Sales network risks• Operational risk• Outsourcing risk• Reputational risk• Compliance risk• Financial risks• Liquidity riskAzimut Holding S.p.A. mainly manages and coordinates direct and indirect equity investments. Consequently, the exposure to operational risks is not significant. The Group's operating companies monitor the operational risks inherent to the specific business of asset management companies. Monitoring of operational risks is comprised of the following activities: risk mapping, risk event analysis, risk assessment, risk management and reporting.For additional information about the risks and uncertainties to which the Company and the Group are exposed, reference should be made to that set out in the “Consolidated financial statements of Azimut Holding S.p.A. at 31 December 2019 – Management Report” and “Part D – Other information, Section 3 – Information on risk management and hedging policies” of the “Notes to the Separate financial statements of Azimut Holding S.p.A. at 31 December 2019”, and the “Report on corporate governance and ownership structure” pursuant to Article 123-bis of the Consolidated Law on Finance available on the Company's website (www.azimut-group.com), Azimut Governance section.
Related-party disclosuresPursuant to Consob Regulation on Related Parties (Resolution No. 17221 of 10 March 2010, as amended), on 22 November 2010, the Board of Directors of Azimut Holding S.p.A. approved the procedures that ensure transparency and fairness
7.Other information

235
of related-party transactions (“Related-Party Transaction Procedure” available on Azimut’s website at www.azimut-group.com).With reference to paragraph 8 of Article 5 of the Consob Regulation on periodic disclosure of related-party transactions, the Company did not engage in any “significant” transactions during 2019. No other atypical or unusual transactions were performed.
Intra-group relationsFor information on relations with Group companies, reference should be made to Part D, Section 5 of the Notes to the financial statements on related-party transactions.
Research and developmentThe Company is not engaged in any research and development activities.
Secondary and branch officesThe Company has not set up any secondary offices in Italy, nor is it engaged in any activity through branch offices.
Marketing, communication and training activitiesIn 2019, the main marketing and communication initiatives to support the commercial activities of the Italian distribution network were promoted on various channels and covered various contents, focusing mainly on digitisation and real economy. In particular, the latter aspect was the focus of the Azimut Libera Impresa EXPO event dedicated to promoting the meeting between private savings and businesses, which took place at the end of October 2019 at Rho Fiera Milan exhibition centre. Around 14 thousand people participated in the event which catalysed much of the marketing, internal and external communication activities. After this event, an institutional advertising campaign dedicated to real economy investments was launched, mainly on the web, with films, displays and banners in December 2019. The campaign will continue later in the new year. Other important initiatives include those relating to digital tools that led to the redevelopment of the website azimut.it, an information access point for advisors and customers, and the launch of the websites relating to Azimut Libera Impresa Sgr and Azimut Alternative Capital Partners as well as the first release of the AZ Fund Management website. Furthermore, during the year, 15 brochures and leaflets were produced, 5 digital direct marketing campaigns were launched and about 500 events were developed in collaboration with financial advisors. The commitment to internal communication was significant and saw the launch of the new corporate TV platform, the sending of more than 500 e-mails, the production of more than 200 videos as content for the corporate TV and the launch of 20 SMS campaigns for the network of financial advisors. With respect to training, in 2019, 132,685 hours of training were provided to approximately 1,800 advisors (compared to 96,207 in 2018), of which 99,355 hours for the maintenance of professional requirements (Consob, IVASS, OAM

236 G r u p p o A z i m u t
and EFPA) and 33,329 hours for non-compulsory training (management courses, university masters degrees and specialisation courses). Training activities related to the development of skills on real economy investments for the advisors’ network was particularly important and involved three specific courses and 12 other courses with a wider focus, for a total of about 12,000 hours of training provided.
Treasury sharesOn 21 May 2019, a total of 2,472,548 treasury shares were assigned as ordinary dividend.At 31 December 2019, Azimut Holding S.p.A.’s subsidiaries did not hold any treasury shares or shares of the Parent Company, either directly or via trust companies or third parties.At 31 December 2019, Azimut Holding S.p.A.’s treasury share portfolio therefore stood at 2,319,451 shares, or 1.619% of share capital.
The main events that occurred after 31 December 2019, the reporting date of the separate financial statements, until 5 March 2020, the date on which the Board of Directors approved the draft separate financial statements, are as follows:• in January and February 2020, the Company made capital injections totalling
23.5 million euro to increase the share capital of the subsidiary AZ International Holdings SA;
• on 24 February 2020, Azimut Holding’s Board of Directors, based on the authorisation issued pursuant to Article 2357 of the Italian Civil Code by the Shareholders' Meeting of 24 April 2019, valid until 23 October 2020, resolved to avail itself of the above authorisation and to purchase, in a tranche, treasury shares for an indicative amount of up to 50 million euro, and a maximum amount per share of 50 euro. As per the above resolution, 1,570,061 treasury shares were purchased, for a total of 20 million euro.
• On 6 February 2020, Azimut Holding S.p.A.’s Board of Directors approved a capital contribution to Azimut Libera Impresa SGR S.p.A. of up to 18 million euro, to be disbursed in the form of a shareholder loan. On 28 February 2020, Azimut Holding S.p.A. disbursed a first tranche of the shareholder loan amounting to 3 million euro.
For the sake of completeness, it should be noted that, at the preparation date of these separate financial statements, the spread of Covid 19 ("Coronavirus”) became a factor of macroeconomic instability, which, in the first few weeks of 2020, initially impacted the economy in China and subsequently spread to other countries, including Italy. This factor could also have a significant impact on the global outlook for future growth, affecting the general macroeconomic scenario, the financial markets, including the sectors in which the Company operates, also in light of the decisions made by government authorities to contain the spread of the epidemic, with a consequent impact on global financial markets.This factor is a non-adjusting event in accordance with IAS 10.21-22. Indeed,
Management report
8.Significant events afterthe reporting date

237
9.Business outlook
although the Coronavirus hit the People's Republic of China near the reporting date, the World Health Organization declared the existence of an international emergency only at the end of January 2020. Furthermore, from the end of January 2020, cases have been diagnosed also in other countries, leading to the adoption of specific decisions both in China and in other countries.Based on the information currently available, it is not possible to determine the possible impacts that may affect the economy and the reference sector in the first quarter of 2020 and the following months with a sufficient degree of reliability - also considering the possibility that such emergency may terminate in the following months, depending on the containment measures envisaged by the governments and competent authorities of the countries affected by the spread of the virus.
These separate financial statements were authorised for publication by the Company's Board of Directors on 5 March 2020.
Given the positive results of the main subsidiaries for 2019 and considering the dividends proposed by the boards of directors of said companies at the respective shareholders’ meetings, the Company is expected to generate a profit for 2019.

238 G r u p p o A z i m u t
Profit allocation plan
Milan, 5 March 2020
On behalf of the Board of DirectorsChief Executive Officer(Gabriele Blei)
Dear Shareholders,The Board of Directors of Azimut Holding S.p.A. submits to your approval the separate financial statements at 31 December 2019.The separate financial statements show a profit for the year of 209,104,487 euro, which we propose to allocate as follows:• 4,510,450.56 euro, or 1% of pre-tax consolidated profit, to be paid to the
charitable organisation Fondazione Azimut ONLUS pursuant to Article 32 of the By-laws;
• a gross dividend of 1 euro to the Shareholders for each of the shares comprising the Company’s share capital, excluding any treasury shares held on the day preceding the ex-dividend date, payable according to the ordinary terms;
• 37.00 euro for each Profit-participating Financial Instrument held by Top Key People at the time of approval of payment of the dividend, equal to 0.00001% of consolidated profit, under Article 32 of the By-laws.
We propose that the dividend be paid and that the treasury shares be allocated as of 20 May 2020, 18 May 2020 as the ex-dividend payment date and 19 May 2020 as the record date.

239
Azimut holding S.p.A.Financial statements for the year ended 31 December 2019

240 G r u p p o A z i m u t
On behalf of the Board of DirectorsChief Executive Officer (Gabriele Blei)
10. Cash and cash equivalents20. Financial assets at fair value through profit or loss c) other financial assets mandatorily measured at fair value 40. Financial assets at amortised cost70. Equity investments80. Property, plant and equipment90. Intangible assets of which: - goodwill100. Tax assets a) current b) deferred110. Non-current assets held for sale and discontinued operations120. Other assetsTotal assets
Assets7,231
109,092,118 109,092,118 14,439,318
703,537,534 355,486
187,789,078
149,829,432 31,618,233
138,347 31,479,886
300,000 24,461,967
1,071,600,965
5,887 449,403,471 449,403,471
118,776,923 749,758,855
985,196 188,358,043
149,829,432 7,936,634
155,835 7,780,799
-
61,304,284 1,576,529,294
31/12/201831/12/2019
Balance sheet as at31 December 2019Assets

241
On behalf of the Board of DirectorsChief Executive Officer (Gabriele Blei)
Balance sheet as at31 December 2019Liabilities and Shareholders’ Equity
10. Financial liabilities at amortised cost a) Payables b) Outstanding securities60. Tax liabilities a) current b) deferred80. Other liabilities90. Staff severance pay (TFR)110. Share capital120. Treasury shares (-)130. Equity instruments140. Share premium reserve150. Reserves160. Valuation reserves170. Profit (loss) for the yearTotal liabilities and shareholders' equity
Liabilities and Shareholders’ Equity354,165,375
- 354,165,375 52,570,665
9,169 52,561,496 52,915,280
700,271 32,324,092 -46,336,578 36,000,000
173,986,916 228,849,252
93,113 186,332,579
1,071,600,965
912,764,313 60,289,138
852,475,175 47,785,299
906,150 46,879,149 7,848,583
378,531 32,324,092
-23,712,795 36,000,000
173,986,916 180,038,678
11,190 209,104,487
1,576,529,294
31/12/201831/12/2019

242 G r u p p o A z i m u t
10. Fee and commission income 30. Net fee and commission income 40. Dividends and similar income50. Interest income and similar income60. Interest expense and similar charges100. Net gains (losses) on financial assets and financial liabilities at fair value through profit or loss b) Other financial assets mandatorily measured at fair value110. Total income140. Administrative costs: a) personnel costs b) other administrative costs150. Net accruals to provisions for risks and charges160. Net impairment losses/reversals of impairment losses on property, plant and equipment170. Net impairment losses/reversals of impairment losses on intangible assets180. Other operating income and costs190. Operating expense240. Pre-tax profit (loss) from continuing operations200. Profits (losses) on equity investments250. Income tax on profit from continuing operations260. Net profit (loss) from continuing operations270. Gains (losses) on discontinued operations, net of tax280. Profit (loss) for the year
2,000,000 2,000,000
238,201,822 103,534
(12,137,858)8,600,243
8,600,243236,767,741(24,942,993)(9,249,647)
(15,693,346)0
(306,340)
(833,143)1,096,521
(24,985,954)211,781,787
0(2,677,300)
209,104,487 -
209,104,487
Items2,000,000 2,000,000
222,754,889 39,371
(7,525,430)(6,851,368)
(6,851,368)210,417,462(25,527,125)(11,274,895)(14,252,230)
150,000(265,397)
(488,445)2,055,543
(24,075,424)186,342,038
- 1,830,541
188,172,579 -1,840,000
186,332,579
31/12/201831/12/2019
Income statement for the yearended 31 december 2019
On behalf of the Board of DirectorsChief Executive Officer(Gabriele Blei)

243
10. Profit (loss) for the year Other comprehensive income, net of taxes, not transferred to profit or loss 70. Defined benefit plans Other comprehensive income, net of taxes, transferred to profit or loss 170. Total other comprehensive income (expense), net of taxes180. Comprehensive income (Items 10+170)
Items186,332,579
57,97757,977
057,977
186,390,556
209,104,487(81,923)(81,923)
0(81,923)
209,022,564
31/12/201831/12/2019
Statement of comprehensiveincome
On behalf of the Board of DirectorsChief Executive Officer(Gabriele Blei)

244 G r u p p o A z i m u t
32,324,092
173,986,915
209,336,156
19,513,097
36,000,000
93,113
(46,336,578)
186,332,579
611,249,374
32,324,092
173,986,915
209,336,156
19,513,097
36,000,000
93,113
(46,336,578)
186,332,579
611,249,374
(20,178,111)
(186,332,579)
(206,510,690)
Balance at 31/12/18
Changes in openingbalance
Balance at 01/01/19
Reserves Dividendsand other
distributions
Changesin reserves
Allocation of prior year profit
Items
Share capital
Share premium reserve
Other reserves:
a) income-related
b) other
Equity instruments
Valuation reserves
Treasury shares
Profit (loss) for the year
Shareholders’ equity
Statement of changesin shareholders’ equityat 31 december 2019

245
32,324,092
173,986,915
180,525,582
(486,903)
36,000,000
11,190
(23,712,795)
209,104,487
607,752,568
Issue of new shares
Shareholders’ equity transactions
(20,000,000)
(20,000,000)
(8,632,463)
22,623,783
13,991,321
(81,923)
209,104,487
209,022,564
Treasuryshare
purchases
Changesin equity
instruments
Otherchanges
Comprehensive income for
2019
Shareholders’ equity at
31 December 2019
Extraordinary dividend
distribution
Changes during the year
On behalf of the Board of DirectorsChief Executive Officer(Gabriele Blei)

246 G r u p p o A z i m u t
32,324,092
173,986,915
239,374,804
13,866,120
36,000,000
682,113
(130,028,451)
208,842,024
575,047,617
32,324,092
173,986,915
239,374,804
14,513,097
36,000,000
35,136
(130,028,451)
208,842,024
575,047,617
646,977
(646,977)
(20,469,433)
(20,469,433)
Balance at 31/12/16
Changes in openingbalance
Balance at 01/01/17
Reserves Dividendsand other
distributions
Changesin reserves
Allocation of prior year profit
Items
Share capital
Share premium reserve
Reserves:
a) income-related
b) other
Equity instruments
Valuation reserves
Treasury shares
Profit (loss) for the year
Shareholders’ equity
Statement of changesin shareholders’ equityat 31 December 2018
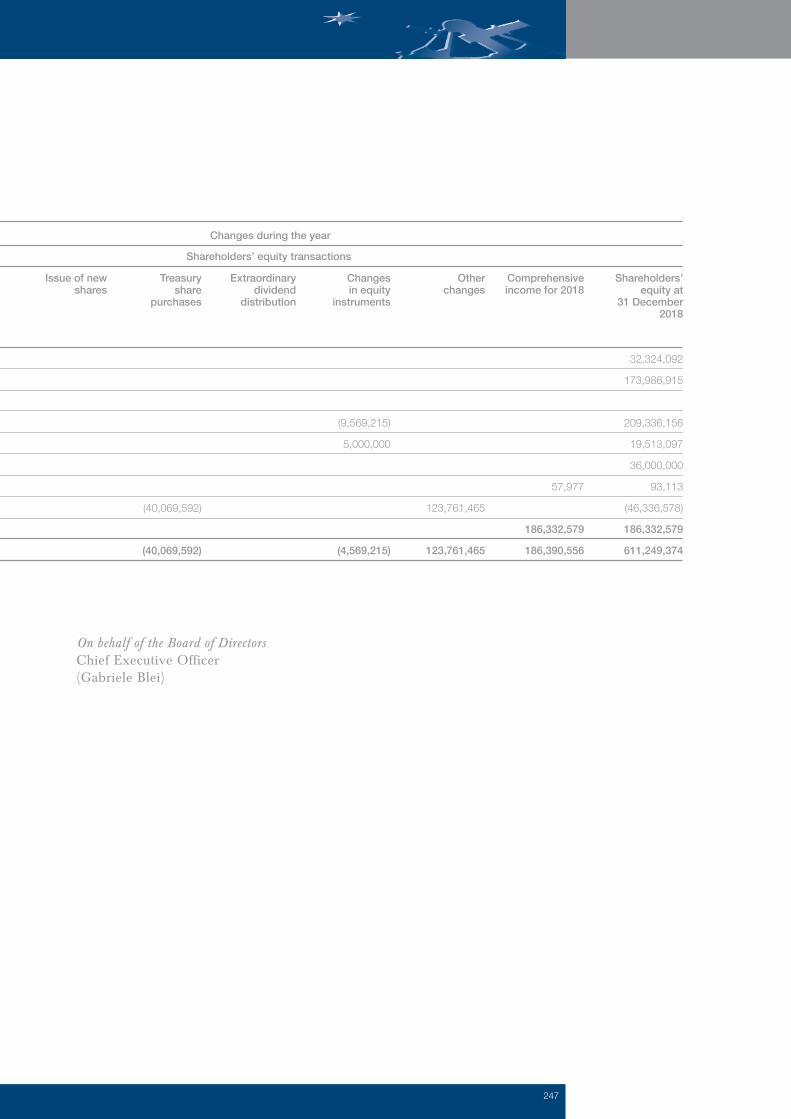
247
(40,069,592)
(40,069,592)
32,324,092
173,986,915
209,336,156
19,513,097
36,000,000
93,113
(46,336,578)
186,332,579
611,249,374
Issue of new shares
Shareholders’ equity transactions
(9,569,215)
5,000,000
(4,569,215)
123,761,465
123,761,465
57,977
186,332,579
186,390,556
Treasuryshare
purchases
Changesin equity
instruments
Otherchanges
Comprehensive income for 2018
Shareholders’ equity at
31 December 2018
Extraordinary dividend
distribution
Changes during the year
On behalf of the Board of DirectorsChief Executive Officer(Gabriele Blei)

248 G r u p p o A z i m u t
Indirect method
Cash flow statement
186,301,637 186,332,579
0
00
753,842(150,000)
(2,474,784)1,840,000
16,009,208
00
(941,106) 0
16,950,314(57,620,039)
(9,650,610)
(47,969,429)144,690,806
000000
203,589,615 209,104,487
0
00
1,139,4830
(7,077,301)0
422,945(4,138,399)
00
(3,737,326) 0
(401,073)502,319,844558,175,993
(55,856,149)701,771,060
300,000300,000
0000
A. OPERATING ACTIVITIES1. Operations profit (loss) for the year (+/-) gains/losses on held-for-trading financial assets and other financial assets/liabilities at fair value through profit or loss (-/+) gains/losses on hedging activities (-/+) net impairment losses for credit risk (+/-) net impairment losses on property, plant and equipment and intangible assets (+/-) net accruals to provisions for risks and charges and other expenses/income (+/-) taxes and tax credits still to be paid (+) net impairment losses on discontinued assets, net of tax (+/-) other changes (+/-)2. Cash generated from or used by financial assets held-for-trading financial assets financial assets designated at fair value other financial assets mandatorily measured at fair value other assets measured at fair value through other comprehensive income assets measured at amortised cost other assets3. Cash generated from or used by financial liabilities financial liabilities at amortised cost financial liabilities held-for-trading financial liabilities designated at fair value other liabilitiesNet cash generated from or used by operating activitiesB. INVESTMENT ACTIVITIES1. Cash generated from disposal of equity investments dividends from equity investments disposal of property, plant and equipment disposal of intangible assets disposal of business units
2019 2018

249
(79,801,661)(77,021,395)
(59,777)(2,720,489)
0(79,801,661)
83,691,873(9,511,238)
(229,311,457)(155,130,822)(90,241,677)
(68,559,479)(66,221,321)
(936,050)(1,402,108)
0(68,259,479)
22,623,783(8,714,386)
(206,510,690)(192,601,293)440,910,287
2. Cash used by purchase of equity investments purchase of property, plant and equipment purchase of intangible assets purchases of business unitsNet cash generated from or used by investment activitiesC. FINANCING ACTIVITIES issue/purchase of treasury shares change in other reserves issue/purchase of equity instruments dividends and other distributionsNet cash generated from (or used by) financing activitiesNet cash generated (or used) for the year
2019 2018
203,929,973 (90,241,677)113,688,296
113,688,296 440,910,287554,598,583
Opening cash and cash equivalentsTotal net cash generated/used for the yearClosing cash and cash equivalents
Reconciliation 2019 2018
Reference should be made to the paragraph on the “financial position” of the Management Report for a breakdown of “Cash and cash equivalents.
On behalf of the Board of DirectorsChief Executive Officer(Gabriele Blei)

250 G r u p p o A z i m u t

251
Azimut Holding S.p.A.Notes to the separate financialstatements for the yearended 31 December 2019

252 G r u p p o A z i m u t

253
Notes to the separatefinancial statements
Part A - Accounting policies
A.1 General information
The separate financial statements comply with the International Accounting Standards (IAS) / International Financial Reporting Standards (IFRS) issued by the International Accounting Standards Board (IASB) and the related interpretations of the IFRS Interpretations Committee (IFRIC), endorsed by the European Commission and in force on 31 December 2019, implementing Italian Legislative Decree No. 38/2005 and Regulation (EC) No. 1606/2002. There were no departures from IAS/IFRS.For information about the standards that came into force in 2019, reference should be made to “Section 2 – General reporting criteria” which also describes the impacts, if any, on the Company.
The separate financial statements have been drawn up voluntarily in accordance with the instructions issued by the Bank of Italy about the financial statements of asset management companies, within the Measure “IFRS financial statements of intermediaries other than banking intermediaries" of 30 November 2018. This was due also to ensure consistency between the separate and consolidated financial statements. The instructions lay down the mandatory financial statements schedules and how they must be filled in, and the content of the notes thereto for asset management companies. These financial statements comprise the balance sheet, the income statement, the statement of comprehensive income, the statement of changes in shareholders’ equity, the cash flow statement (prepared using the indirect method) and these notes. They are accompanied by the management report on the performance of the Company.These notes are comprised of four parts: Part A - Accounting policiesPart B - Notes to the balance sheetPart C - Notes to the income statementPart D - Other information
The following annexes are included in these notes and represent an integral part thereof:• list of equity investments held (Annex A);• list of significant equity investments, pursuant to Article 125 of Consob (Italian
Securities and Exchange Commission) Regulation No. 11971/99 as amended (Annex B).
Section 1Statement of compliancewith IAS/IFRS
Section 2General reporting criteria

254 G r u p p o A z i m u t
Notes to the separatefinancial statements
These financial statements are denominated in euro.They have been prepared based on the going concern assumption. Financial, operating and other indicators17 have been considered which, as also shown in the document issued on 6 February 2009 by the supervisory authorities Bank of Italy, Consob and IVASS, may highlight problems that could compromise the stability and going concern assumption of the Company if not taken into proper consideration.Although the economic outlook for the future is still uncertain, also in light of the impact of the spread of the COVID-19 epidemic described in the section "Significant events after the reporting date" in the Management Report, the joint assessment of the past and current financial position and results of operations of the Company, its operating guidelines, the subsidiaries’ business model and the risks to which business activity is exposed18, leads us to believe that there is no doubt that the Company can continue to operate on a going concern basis for the foreseeable future.The separate financial statements have been prepared clearly and give a true and fair view of the Company's financial position, results of operations, changes in shareholders' equity and cash flows.The separate financial statements have been prepared in accordance with IAS 1 “Presentation of financial statements” and in line with the general assumptions of the “Framework for the preparation and presentation of financial statements” (the framework) prepared by the IASB, specifically with respect to the fundamental principle of substance over form19, the relevance and materiality of financial information, the accruals basis of accounting and the going concern assumption. Except for that provided for or permitted by IAS/IFRS or one of their interpretations or Bank of Italy's provisions on the financial statements of asset management companies, assets and liabilities and costs and revenue are not offset.
Accounting standards, amendments and interpretations endorsed by the European Union and in force from 1 January 2019The IAS/IFRS applied to prepare the separate financial statements, governing the classification, recognition, measurement and derecognition criteria of asset and liability items and the recognition of income and expense are those in force at the drafting date of these financial statements, as endorsed by the European Union.For information on the classification, recognition, measurement and derecognition criteria of the main items, reference should be made to that set out in Part A.2 of the Notes to the separate financial statements at 31 December 2019.In addition to that set out in Part A.2, following the completion of the endorsement procedure, the following amendments to IAS/IFRS became effective on 1 January 2019.
17 Examples of which are shown in audit standard No. 570 on “Going Concerns”.18 As described in the Management Report.19 Transactions and other corporate events have been recognised and presented in accordance with the principle of substance over form.

255
Accounting standards, amendments and interpretations in force from 1 January 2019
13 January 20167 June 2017
31 October 201723 October 2018
1 January 20191 January 2019
IFRS 16 “Leases”IFRIC 23 “Uncertainty over income tax treatments”
Endorsementdate
IASB publicationdate
Amendments Date of cominginto force
12 October 2017
12 October 2017
12 December 20177 February 2018
22 March 2018
8 February 2019
14 March 201913 March 2019
1 January 2019
1 January 2019
1 January 20191 January 2019
Amendments to IFRS 9:Prepayment features with negative compensationAmendments to IAS 28:Long-term interests in associates and joint venturesAnnual improvements to IFRS 2015-2017 cycleAmendments to IAS 19:plan amendments, curtailments, and settlements
Endorsementdate
IASB publicationdate
Amendments Date of cominginto force
Accounting standards, amendments and interpretations which will come into force
30 January 201418 May 2017
n.a.*---
n.a.*1 January 2021
IFRS 14 “Regulatory deferral accounts”IFRS 17 “Insurance contracts”
Endorsementdate
IASB publicationdate
Standards Date of cominginto force
* The European Commission does not intend to start the endorsement process concerning IFRS 14 (interim standard) pending the publication of the final standard governing tariff-regulated activities.
22 October 2018
31 October 2018
16 January 2020
---
29 November 2019
15 January 2020
1 January 2020
1 January 2020
1 January 2020
Amendments to IFRS 3:Definition of a businessAmendments to IAS 1 and IAS 8:Definition of materialAmendments to IFRS 9, IAS 39 and IFRS 17:Interest rate benchmark reform
Endorsementdate
IASB publicationdate
Amendments Date of cominginto force

256 G r u p p o A z i m u t
Notes to the separatefinancial statements
Transition to IFRS 16The following standards, amendments and interpretations were applied for the first time starting from 1 January 2019.On 13 January 2016, the IASB published IFRS 16 – Leases which replaced IAS 17–Leases, and IFRIC 4 Determining whether an Arrangement contains a Lease, SIC-15 Operating Leases—Incentives and SIC-27 Evaluating the Substance of Transactions Involving the Legal Form of a Lease. The standard introduces a new definition of lease and a control-based criterion (right of use) to distinguish between leases and contracts for the provision of services, specifically: the identification of the asset, its right of substitution, the right to obtain substantially all the economic benefits from the use of the asset and, finally, the right to direct the identified asset’s use.It provides a single lessee accounting model, requiring lessees to recognise assets and liabilities for all leases unless, including operating ones. By contrast, the standard does not introduce significant changes in accounting by lessors.Finally, for FTA purposes, the Company opted to apply the so-called modified retrospective approach, whereby the right of use is deemed equal to the lease liability, without modifying the 2018 comparative information in accordance with paragraphs C7-C13 of IFRS 16. Specifically, with respect to the leases previously classified as operating leases, the Company recognised:• a financial liability equal to the present value of the residual future lease payments
at the date of transition, discounted at their incremental borrowing rate ruling at the date of transition;
• a right of use equal to the amount of the financial liability at the date of transition, net of any prepayments and accrued income/accrued expenses and deferred income related to the lease and recognised in the balance sheet at the reporting date.
The right of use and the lease liability were estimated at 943,443 million euro at 1 January 2019. The decision to adopt the modified approach (option B) has no impact on shareholders’ equity.The table below shows the impact of the adoption of IFRS 16 at the date of transition.
769,202 130,497 43,744
943,443
943,443 943,443
ASSETSProperty, plant and equipment Right of use - buildings Right of use - cars Right of use - printers TotalLIABILITIES PayablesLease liabilities Total
Figures in euro Impact at the date of transition(01/01/2019)

257
The table below shows the reconciliation between the consolidated financial statements and shareholders’ equity as at 31 December 2018 and the consolidated financial statements and shareholders' equity as at 1 January 2019 calculated under IFRS 16.
7,231
109,092,118
14,439,318 703,537,534 1,298,929 187,789,078 31,618,233 300,000
24,461,967
1,072,544,408
943,443
943,443
7,231 109,092,118
14,439,318
703,537,534 355,486 187,789,078 31,618,233 300,000
24,461,967
1,071,600,965
1,071,071 1,071,071
-127,628 943,443
AssetsCash and cash equivalentsFinancial assets at fair value throughprofit or lossFinancial assets at amortised costEquity investmentsProperty, plant and equipmentIntangible assetsTax assetsNon-current assets held for saleand discontinued operationsOther assetsTotal assets
Operating lease commitments (IAS 17) not discounted at 31 December 2018Operating lease liabilities to be recognised in the balance sheetas at 1 January 2019, not discounted Discount effect on operating lease liabilities Total lease liabilities (IFRS 16) at 1 January 2019
Figures in euro
Reconciliation of lease liabilities 01/01/2019
01/01/2019EFFECTS OFIFRS 16
31/12/2018

258 G r u p p o A z i m u t
355,108,818
943,443 354,165,375 52,570,665 52,915,280 700,271 32,324,092
-46,336,578 36,000,000 173,986,916 228,849,252
93,113 186,332,579
1,072,544,408
943,443
943,443
354,165,375
- 354,165,375
52,570,665 52,915,280 700,271 32,324,092
-46,336,578 36,000,000 173,986,916 228,849,252 93,113
186,332,579 1,071,600,965
LiabilitiesFinancial liabilities at amortised cost: b) Payables c) Outstanding securitiesTax liabilitiesOther liabilitiesStaff severance pay (TFR)Share capitalTreasury shares (-)Equity instrumentsShare premium reserveReservesValuation reservesProfit (loss) for the yearTotal liabilities
Figures in euro 01/01/2019EFFECTS OFIFRS 16
31/12/2018
The Company adopted IFRS 16 availing itself of the exemption allowed by paragraph 5(a) of said standard on the short-term leases of the following asset categories: • buildings for office use;• company cars;• printers.Similarly, it availed itself of the exemption allowed by paragraph 5(b) of IFRS 16 related to leases where the underlying asset has a low value (i.e., assets underlying the lease assets never exceed 5 thousand euro, when new). The exemption applied mainly to the following categories:• computers, telephones and tablets;• printers;• other electronic devices.For these leases, the adoption of IFRS 16 had no effect on the recognition of the lease liability and the related right-of-use asset. However, lease payments are recognised in profit or loss on a straight-line basis over the term of the relevant leases. With regard to non-lease components, based on the lease payments related to buildings (e.g., considering the existence of building management fees) and those related to cars and electronic devices (considering the existence of additional ancillary costs), the Company separated them and recognised them separately from lease components and did not consider them together with the latter components when determining the lease liability and the related right-of-use asset.

259
Furthermore, with respect to transition provisions, the Company also availed itself of the following practical expedients available when opting for the modified retrospective approach:• excluding initial direct costs from the measurement of the right-of-use asset at 1
January 2019;• using the information available at the date of transition to determine the lease
term, specifically with respect to the exercise of options to extend or terminate early a lease.
The transition to IFRS 16 also introduces some elements of professional judgement that involve the definition of certain accounting policies and the use of assumptions and estimates in relation to the lease term and the incremental borrowing rate. The main elements are summarised below:• for contracts containing a lease that have an intangible asset as the underlying
asset the Company opted not to apply IFRS 16;• Lease term: the Company has analysed all the lease contracts, establishing for
each of them the lease term, given by the “not cancellable” period, together with the effects of any extension or early termination clauses, the exercise of which was considered reasonably certain.
Specifically, for buildings, the valuation considered the specific facts and circumstances of each asset: regardless of the contractual period ("first period" in the case of, for example, the first 6 years of a 6 + 6 term, or "second or subsequent period"), the reasonable certainty of contract renewal was always considered for leases for which the renewal option is provided, especially when tacit: (e.g., when the lessor waives the right to refuse the renewal of the lease at the first expiry date for Italy as per Article 29 of Law no. 392/78);With regard to the other categories of assets, mainly company cars and equipment, the Company has generally considered it unlikely that any extension or early termination clauses will be exercised in view of the Group's usual practice: with regard to cars, the car lease does not provide for renewal, while with regard to IT devices, we have included printers and photocopiers for which the term for the remaining duration of the lease coincides with its expiry date when there is no express renewal clause.Definition of incremental borrowing rate: a secured credit curve was used for properties and IT devices (a combination of the Italy risk-free rate and the group credit spread of 0.20% derived from the 5-year bond with a yield of 2% issued by the company) as well as an unsecured curve extrapolated by Bloomberg, identified on the basis of Azimut Holding's BBB rating for company cars.

260 G r u p p o A z i m u t
Notes to the separatefinancial statements
The main events that occurred after 31 December 2019, the reporting date of the separate financial statements, until 5 March 2020, the date on which the Board of Directors approved the draft separate financial statements, are as follows:• in January and February 2020, the Company made capital injections totalling
23.5 million euro to increase the share capital of the subsidiary AZ International Holdings SA;
• on 24 February 2020, Azimut Holding’s Board of Directors, based on the authorisation issued pursuant to Article 2357 of the Italian Civil Code by the Shareholders' Meeting of 24 April 2019, valid until 23 October 2020, resolved to avail itself of the above authorisation and to purchase, in a tranche, treasury shares for an indicative amount of up to 50 million euro, and a maximum amount per share of 50 euro. As per the above resolution, 1,570,061 treasury shares were purchased, for a total of 20 million euro.
• On 6 February 2020, Azimut Holding S.p.A.’s Board of Directors approved a capital contribution to Azimut Libera Impresa SGR S.p.A. of up to 18 million euro, to be disbursed in the form of a shareholder loan. On 28 February 2020, Azimut Holding S.p.A. disbursed a first tranche of the shareholder loan amounting to 3 million euro.
For the sake of completeness, it should be noted that, at the preparation date of these separate financial statements, the spread of Covid 19 ("Coronavirus”) became a factor of macroeconomic instability, which, in the first few weeks of 2020, initially impacted the economy in China and subsequently spread to other countries, including Italy. This factor could also have a significant impact on the global outlook for future growth, affecting the general macroeconomic scenario, the financial markets, including the sectors in which the Company operates, also in light of the decisions made by government authorities to contain the spread of the epidemic, with a consequent impact on global financial markets.This factor is a non-adjusting event in accordance with IAS 10.21-22. Indeed, although the Coronavirus hit the People's Republic of China near the reporting date, the World Health Organization declared the existence of an international emergency only at the end of January 2020. Furthermore, from the end of January 2020, cases have been diagnosed also in other countries, leading to the adoption of specific decisions both in China and in other countries. Based on the information currently available, it is not possible to determine the possible impacts that may affect the economy and the reference sector in the first quarter of 2020 and the following months with a sufficient degree of reliability - also considering the possibility that such emergency may terminate in the following months, depending on the containment measures envisaged by the governments and competent authorities of the countries affected by the spread of the virus.These separate financial statements were authorised for publication by the Company's Board of Directors on 5 March 2020.
Section 3Significant events afterthe reporting date

261
Section 4Other information
Risks and uncertainties related to estimatesThe preparation of the separate financial statements also entails the use of estimates and assumptions that may have a significant impact on the carrying amounts recognised in the balance sheet and the income statement, and on the disclosure about contingent assets and liabilities. The computation of such estimates is based on the use of available information and the adoption of subjective assessments, also based on historical experience, used to develop reasonable assumptions underlying the recognition of operations. Because of their nature, the estimates and assumptions used may change from year to year. Consequently, it cannot be excluded that the currently reported amounts may differ, also significantly, in the next few years following the change in the subjective assessments used. These estimates mainly relate to:• the estimates and assumptions underlying the valuation models for the fair value
recognition of financial instruments not listed on active markets (level 2 and 3 of the fair value hierarchy);
• the identification of loss events pursuant to IAS 39;• the assumptions used to identify impairment losses, if any, on intangible assets
and reported equity investments (IAS 36).In relation to events that occurred after the reporting date, particularly with respect to the macro-economic scenario, the recent global spread of the COVID-19 mentioned above should be noted. This may constitute a new and significant factor of instability, which could influence, above all, the growth expectations of the world economies and, consequently, the performance of financial markets, also impacting the Parent Company's ability to achieve its financial and earnings targets, especially in the short term. Based on the information currently available, it is not possible to determine the possible impacts that may affect the economy, the reference sector and the accounting estimates in the first quarter of 2020 and the following months with a sufficient degree of reliability - also considering the possibility that such emergency may terminate in the following months, depending on the containment measures envisaged by the governments and competent authorities of the countries affected by the spread of the virus.
A.2 Key financial statements items
This section describes the accounting standards used to prepare the separate financial statements at 31 December 2019, specifically the classification, recognition, measurement and derecognition of assets and liabilities items, and the recognition of income and expense. The accounting standards have been applied consistently in the current and previous years.
262 G r u p p o A z i m u t
ClassificationThis item comprises financial assets other than those classified under financial assets at fair value through other comprehensive income and financial assets at amortised cost. Specifically, it may include:• held-for-trading financial assets; • equity instruments, except for the possibility of classifying them under the new
category: financial assets at fair value through other comprehensive income, not transferred to profit or loss;
• financial assets mandatorily measured at fair value, which did not meet the requirements necessary for application of the amortised cost method;
• financial assets not held as part of a hold to collect (“HTC”) business model or a mixed business model whose objective is achieved by collecting the contractual cash flows of the financial assets in portfolio or through a sale transaction which is an integral part of the strategy (“Hold to Collect and Sell” business model);
• financial assets designated at fair value, i.e., the financial assets designated as such upon initial recognition and when the relevant requirements are met. With respect to this category, an entity may irrevocably designate a financial asset at fair value through profit or loss if, and only if, it eliminates or significantly reduces a measurement inconsistency;
• derivatives, to be recognised under held-for-trading financial assets when the fair value is positive and under liabilities, if negative. Offsetting is possible only to the extent of transactions carried out with the same counterparty when there is a legally enforceable right of setoff and an entity has the intention to settle a financial asset and a financial liability net. Derivatives include those embedded in hybrid financial instruments - where the host contract is a financial liability - which were recognised separately.
Reclassifications of financial assets, except for equity instruments for which no reclassification is allowed, are not allowed between other categories of financial assets unless an entity’s business model objective for its financial assets changes. In such cases, which must not be frequent, the financial assets may be reclassified from the fair value through profit or loss category to one of the two other categories introduced by IFRS 9 (fair value through other comprehensive income and amortised cost). The amount of the reclassification is the fair value upon reclassification and the effects of the reclassification are applied prospectively as of the reclassification date. In this case, the effective interest rate of the reclassified financial asset is calculated based on its fair value at the reclassification date and this date is considered as the initial recognition date for credit risk stage assignment for impairment purposes.
RecognitionFinancial assets are initially recognised at the settlement date for debt instruments and equity instruments, at the disbursement date for loans and at the signing date for derivatives.
1Financial assets at fair value through profit or loss (FVTPL)

263
2Financial assets atamortised cost
Upon initial recognition, financial assets at fair value through profit or loss are recognised at fair value, without considering transaction costs or proceeds that are directly attributable to the instrument.
Recognition of income componentsSubsequent to initial recognition, financial assets at fair value through profit or loss are measured at fair value. The effects of the application of this measurement criteria are taken to profit or loss.The fair value of financial instruments quoted in an active market is calculated using market prices. When no active market exists, commonly-used estimate methods and valuation models are applied which consider all risk factors related to the instruments and which are based on market data, such as: valuation of quoted instruments with similar characteristics, calculation of discounted cash flows, models to recalculate option prices, amounts recognised in recent similar transactions, etc.. The cost criterion is used to estimate the fair value of equity instruments and derivatives related to equity instruments, not quoted in an active market, only on a residual basis and limited to few circumstances, i.e., when none of the above methods can be used or in the case of a large range of fair value measurement possibilities, when cost is the most significant estimate.
DerecognitionFinancial assets are derecognised when the contractual rights to the cash flows generated by the assets expire or when the asset is sold and all the risks and rewards of ownership have been transferred.
ClassificationThis item includes the amounts due from banks, from financial institutions, from customers or all receivables involving fixed payments or in any case payments which are definable and are not listed on an active market.
RecognitionFinancial assets are initially recognised at the settlement date for debt instruments and at the disbursement date for receivables. Upon initial recognition, financial assets are measured at fair value, including transaction costs or proceeds that are directly attributable to the instrument.Specifically, with respect to receivables, the disbursement date normally coincides with the date the contract is signed. When this is not the case, upon signing of the contract, a loan commitment is recognised which ceases when the relevant amount is disbursed. Receivables are initially recognised at fair value, equal to the amount granted, or the subscription price, including the cost/income directly referable to the individual receivable and determinable from the beginning of the

264 G r u p p o A z i m u t
Notes to the separatefinancial statements
operation, even when settled at a later date.The costs which, despite having the above characteristics, are repaid by the counterparty or fall under administrative internal ordinary costs, are excluded.
Recognition of income componentsSubsequent to initial recognition, receivables are measured at amortised cost, equal to the initially recognised amount decreased/increased by the repayment of principal, net impairment losses/reversals of impairment losses and amortisation - calculated using the effective interest method - of the difference between the amount disbursed and the repayable one upon maturity, which usually refers to the costs/income directly allocated to individual receivables.The effective interest rate is the rate that discounts estimated future cash payments through the expected life of the receivable to obtain exactly the carrying amount upon initial recognition, which includes both directly attributable transaction revenues/costs and all fees paid or received by the parties to the contract. This method is based on a financial logic and enables entities to allocate the economic effect of income/expense over the residual life of the loan.The measurement criteria are closely related to the stage to which the loan is assigned, where stage 1 comprises performing loans, stage 2 under-performing loans, i.e., those loans where the credit risk rose significantly compared to initial recognition and stage 3 non-performing loans, i.e., those loans which show a significant impairment loss.Impairment losses are taken to profit or loss. Those related to performing loans under stage 1 are calculated considering a one-year expected loss, while those under stage 2 refer to the life time expected credit losses. Performing loans are measured using the following parameters: probability of default (PD), loss given default (LGD) and exposure at default (EAD), derived from historical internal series. With respect to impaired loans, the loss to be recognised in profit or loss is calculated based on an analytical measurement process or based on similar categories and, hence, allocated analytically to each position and considering forward looking information and possible alternative recovery scenarios.Impaired loans comprise the financial instruments classified as bad loans, unlikely-to-pay exposures/overdrawn and/or past-due exposures by more than 90 days in accordance with Bank of Italy’s regulations, in line with IAS/IFRS and European supervisory regulations. The expected cash flows consider the expected recovery time and the expected realisable value of guarantees, if any. The original effective rate of each asset is unchanged over time even though the relationship has been restructured, resulting in a change in the contractual rate or the relationship, in practice, no longer bears contractual interest. If the reasons for the impairment loss no longer apply following an event subsequent to the initial recognition, the original amount is reversed through profit or loss. Reversals of impairment losses shall not exceed the amortised cost of the instrument had no impairment losses been recognised. Reversals of impairment losses relating to the passing of time are taken to net interest income. The amortised cost coincides with the nominal amount.

265
3Equity investments
DerecognitionReceivables are derecognised when they are no longer recoverable or when they are transferred, when all risks and rewards incidental to the receivables are substantially transferred.
ClassificationThis item includes investments in subsidiaries, jointly-controlled entities, associates or companies subject to significant influence. A subsidiary is an entity in which the investor holds, directly or indirectly through its subsidiaries, more than half the voting rights (51%). Control exists when the investor holds half, or a smaller percentage, of votes at shareholders' meetings provided that it has:a) control over more than one half of the voting rights by virtue of an agreement with other investors;b) the power to govern the financial and operating policies of the investee under a statute or an agreement;c) the power to appoint or remove the majority of the members of the Board of Directors or equivalent governing Body and control over the investee is held by such Board or Body;d) the power to cast the majority of votes at meetings of the Board of Directors or equivalent governing Body and control over the investee is held by such Board or Body.A jointly-controlled entity is a company subject to contractual, shareholders or other arrangements for the joint management of the business and the appointment of directors. An associate is a company in which an entity holds 20% or more of the voting power or the investor has significant influence, including due to specific legal relationships, such as the participation in shareholders' agreements. Significant influence is the power to participate in the financial and operating policy decisions of the investee without having control or joint control over those policies.Moreover, the cost of equity investments increased as a result of the recognition of incentive plans (see the note to “Share-based payments”), entailing the granting of the Company’s shares to the financial advisors of subsidiaries.
Recognition and measurement Equity investments are recognised at purchase cost, net of impairment losses, if any. If there is evidence that an equity investment may be impaired, its recoverable amount is estimated, considering the present value of the future cash flows that the equity investment may generate, including the final disposal amount. Should the recoverable amount be lower than the carrying amount, the related difference is taken to the income statement.

266 G r u p p o A z i m u t
Notes to the separatefinancial statements
Recognition of income components Dividends received from investees are recognised as income when the right to receive them arises, i.e., when their distribution is approved.
DerecognitionEquity investments are derecognised when the contractual rights to the cash flows arising therefrom expire or when they are sold substantially transferring all risks and rewards incidental to ownership.
ClassificationThey include technical plant, furniture and fixtures, vehicles and office machinery and equipment of any kind and leasehold improvements.The rights of use acquired as part of the leases and related to the use of asset (for lessees) and the assets under operating lease (for lessors) are also included.
Recognition and measurement They are initially recognised at cost, including the additional costs directly attributable to the acquisition and start-up of the asset. They are subsequently measured at cost, less depreciation and impairment losses. Depreciation is charged annually on a straight-line basis over the remaining useful life.Leasehold improvements are recognised under assets since the tenant essentially has control over the assets and may receive economic benefits therefrom. Therefore, they are depreciated over a period corresponding to the remaining duration of the lease.Under IFRS 16, leases are recognised using the right-of-use asset model, whereby, at the commencement date, the lessee has a financial obligation to make payments to the lessor to offset its right to use the underlying asset during the lease term.When the asset is made available to the lessee for use (commencement date), the lessee recognises both the lease liability and the right-of-use asset.Right-of-use assets, recognised using IFRS 16, are measured using the cost model in accordance with IAS 16 Property, plant and equipment. In this case, the asset is subsequently depreciated and tested for impairment, whenever an impairment indicator is identified.
DerecognitionProperty, plant and equipment are derecognised upon disposal or when the asset has been retired and future benefits are not expected from its disposal.
ClassificationIntangible assets include goodwill, the “Azimut” trademark (purchased at the end of the finance lease) and the application software for long-term use.
4Property, plant andequipment
5Intangible assets

267
6Tax assets and liabilities
7Other assets
8Financial liabilitiesat amortised cost
8.1Payables
Recognition and measurement Software is recognised at cost, net of amortisation and impairment losses. Such assets are amortised based on their estimated residual useful life. Goodwill is not amortised, but is periodically tested for impairment. Impairment tests are carried out every year (or whenever there is evidence of impairment). To this end, the cash generating unit to which goodwill is to be allocated is identified. The amount of the impairment is determined on the basis of the difference between the carrying amount of goodwill and its recoverable amount, if lower. Recoverable amount is the higher of a cash generating unit's fair value less costs of disposal and its value in use. The related adjustments are taken to the income statement.
DerecognitionIntangible assets are derecognised at the date of disposal and when no future economic benefits are expected.
Current taxes are calculated in accordance with ruling tax rates and legislation. When they are not paid, they are recognised under liabilities. Income taxes are recognised in the income statement, except for those related to items directly credited or debited to equity. The provision for taxes is recognised based on a prudent estimate of the current and deferred tax charge.The balance sheet liability method is applied to deferred taxes. Specifically, deferred tax assets and liabilities are calculated in respect of the temporary differences – without time limits – arising between the carrying amount of assets and liabilities and their value for tax purposes. Deferred tax assets are recognised to the extent their recovery is probable, based on the Company's ability to generate ongoing positive taxable income.
This item includes assets which are not ascribable to other assets items.
ClassificationThis item comprises Due to banks, Due to financial institutions, Due to customers, Lease liabilities and Outstanding securities.
Recognition and measurementShort-term trade payables (due within one year) are recognised at their par value. Payables in the form of medium/long-term loans, initially recognised at the amount collected, net of transaction costs if any, are subsequently measured at amortised cost using the effective interest method. Lease liabilities recognised under IFRS 16 are also included.

268 G r u p p o A z i m u t
8.2Outstanding securities
Notes to the separatefinancial statements
9Other liabilities
Derecognition Payables are derecognised once settled.
This item includes the bonds issued by Azimut Holding S.p.A..
RecognitionOutstanding securities are recognised when issued or when a new placement takes place based on the “settlement date” principle. They are initially recognised at fair value which usually corresponds with the collected amount or the issue price, adjusted to reflect any additional cost and income directly attributable to funding or issue transactions. Internal administrative costs are not included. The fair value of outstanding securities issued at below-the-market conditions is subject to a specific estimate and the difference with respect to market value is taken directly to the income statement. In the case of convertible debt instruments, the costs borne for the bond issue are allocated proportionally to the debt component and the equity component.
Measurement and recognition of income and expenseSubsequent to initial recognition, the debt component is measured at amortised cost, using the effective interest method. Interest expense is recognised under Interest expense and similar charges in the income statement, using the effective interest rate method.
DerecognitionOutstanding securities are derecognised after expiry or settlement. They are derecognised also when previously issued securities are repurchased. The difference between the carrying amount of the security and the amount paid to repurchase it is taken to the income statement. A new placement of own securities subsequent to their repurchase is considered a new issue with the recognition of the new placement price, with no impact on the income statement.
ClassificationThis item includes liabilities that are not ascribable to other liability items.
RecognitionShort-term liabilities (due within 12 months) and trade payables are recognised at their par value.
DerecognitionOther liabilities are derecognised once settled.

269
10Staff severance pay (TFR)
11Provisions for risksand charges
12Costs and income
In accordance with the legislation governing TFR introduced by Legislative Decree dated 5 December 2005, the staff severance pay (TFR), recognised under liability item 100 to the extent of the portion accrued until 31 December 2008, qualifies as a defined benefit plan and is therefore subject to actuarial measurement, using the Projected Unit Credit Method (PUCM) which projects future cash flows based on historical analyses, statistics and probabilistic analyses and applying adequate demographic techniques. Cash flows are discounted using the market interest rate. Actuarial calculations are performed by independent actuaries.The costs arising from the plan are recognised under personnel costs, item 140 Administrative costs; a) personnel costs, net of the contributions paid, those pertaining to prior years not yet recognised, interest accrued and expected income arising from plan assets. In accordance with IAS 19, actuarial gains and losses are recognised in a specific Valuation reserve.
RecognitionAccruals to provisions for risks and charges are recognised if, and only if:• there is a present obligation (legal or constructive) as a result of past events;• it is probable that an outflow of resources will be required to generate economic
benefits; and• a reliable estimate can be made of the amount of the obligation.
MeasurementThe amount accrued is the best estimate of the expense required to settle the obligation at the reporting date and reflects the risks and uncertainties that inevitably characterise many facts and circumstances. The amount accrued is equal to the present value of the expense required to settle the obligation where the effect of the present value is a significant aspect. The future facts which may affect the expense required to settle the obligation are considered only when there is objective evidence that they will take place.
DerecognitionAccruals are derecognised when the use of resources that generate economic benefits to settle the obligation becomes improbable.
Cost are recognised on an accrual basis. Those incurred to obtain and fulfil contracts with customers are recognised in profit or loss when the related income is recognised.Income is recognised when received, or when it is probable the future benefits will be received and when such benefits can be reliably calculated. Specifically:• interest is recognised on an accruals basis using the contractual interest rate or the
effective interest rate when the amortised cost method is applied;• dividends are recognised in the income statement on the date their distribution is
approved.

270 G r u p p o A z i m u t
Notes to the separatefinancial statements
• fee and commission income from services is recognised based on the relevant contractual agreements at the time the services are provided.
Fees for portfolio management, consultancy and management of mutual funds are recognised over the term of the service.
They are recognised as a decrease in shareholders’ equity. Profits or losses arising from the purchase, sale, issue or elimination of treasury shares are not recognised in the income statement, but in shareholders’ equity.
The profit-participating financial instruments issued by Azimut Holding S.p.A. as per the Shareholders' resolution of 29 April 2010 and subsequent resolutions of the Company's Board of Directors are recognised under Equity instruments at the subscription amount, equal to their fair value, increasing shareholders’ equity. Indeed, under the By-laws, they have an indefinite life, are issued with no obligation for the Company to repay the amount paid by investors, participate in the allocation of the Company's residual assets in case of liquidation, in subordination to the Company's creditors and shareholders. These instruments are not transferable, except to the Parent Company (at their fair value and subject to specific conditions). In this case, the relevant equity rights are suspended. Furthermore, these instruments entitle their holders to receive a part of the Company's profit as per the By-laws subject to, inter alia, the Shareholders' approval of dividend distribution.
ClassificationShare-based payments are settled by granting Azimut Holding S.p.A. ordinary shares (granting of rights to freely subscribe the shares when specific performance targets are achieved), against the services performed by the financial advisors to the subsidiaries Azimut Capital Management SGR S.p.A. and Azimut Financial Insurance S.p.A. over the term of the Plan.
RecognitionGiven the difficulties in reliably determining the fair value of the services received against the equity instruments, the cost allocated is the best possible estimate of fair value, considering the performance targets at 31 December 2019.
Measurement and recognition of income componentsWith respect to equity-settled share-based payments, the liabilities assumed are measured at the fair value of the latter and recognised under item 150. “Reserves – Other equity reserves”. The balancing entry is recognised under item 70. “Equity investments”.
13Treasury shares
14Profit-participatingfinancial instruments
15Share-based payments

271
DerecognitionNo instrument was settled at the expiry date of the plan (31 December 2019) because at least 4 of the 5 relevant conditions were not met. The liability was removed from item 150. “Reserves – Other equity reserves” and item 70. “Equity investments”.
Non-current assets held for sale or discontinued operations whose sale is deemed highly probable are classified under “Non-current assets held for sale and discontinued operations” and “Liabilities related to discontinued operations”. These assets/liabilities are measured at the lower of their carrying amount and their fair value less costs to sell, except for some types of assets (e.g., financial assets under the scope of IFRS 9) whereby IFRS 5 specifically provides for the application of the accruals basis of accounting.Income and expense (net of the tax effect) related to discontinued operations or operations recognised as such during the year, are recognised separately in profit or loss.
A.3 Disclosure about financial asset transfers between portfolios
The Company did not transfer any financial assets between portfolios during the year.
A.4 Fair value disclosure
Qualitative informationIn accordance with the provisions of IFRS 7 and IFRS 13, the Company classifies fair value measurement of financial assets and financial liabilities based on a hierarchy that conveys the nature of inputs used. The levels are as follows:• level 1: (unadjusted) quoted prices in active markets for assets and liabilities identical
to those subject to measurement;• level 2: inputs other than unadjusted quoted prices (as per level 1) that are directly
(as in the case of prices) or indirectly (deriving from prices) observable market data;• level 3: inputs based on unobservable market data.Specifically, the fair value of a financial instrument measured at level 1 corresponds to the unadjusted price, at which the instrument – or an identical instrument – is sold on an active market on the measurement date. For classification at level 1, prices are measured together with all other characteristics of the financial asset or financial liability: if the quoted price is adjusted in order to take account of specific conditions that require adjustment, the financial instrument is classified under a level other than level 1.
16Non-current assets held for sale and discontinued operations
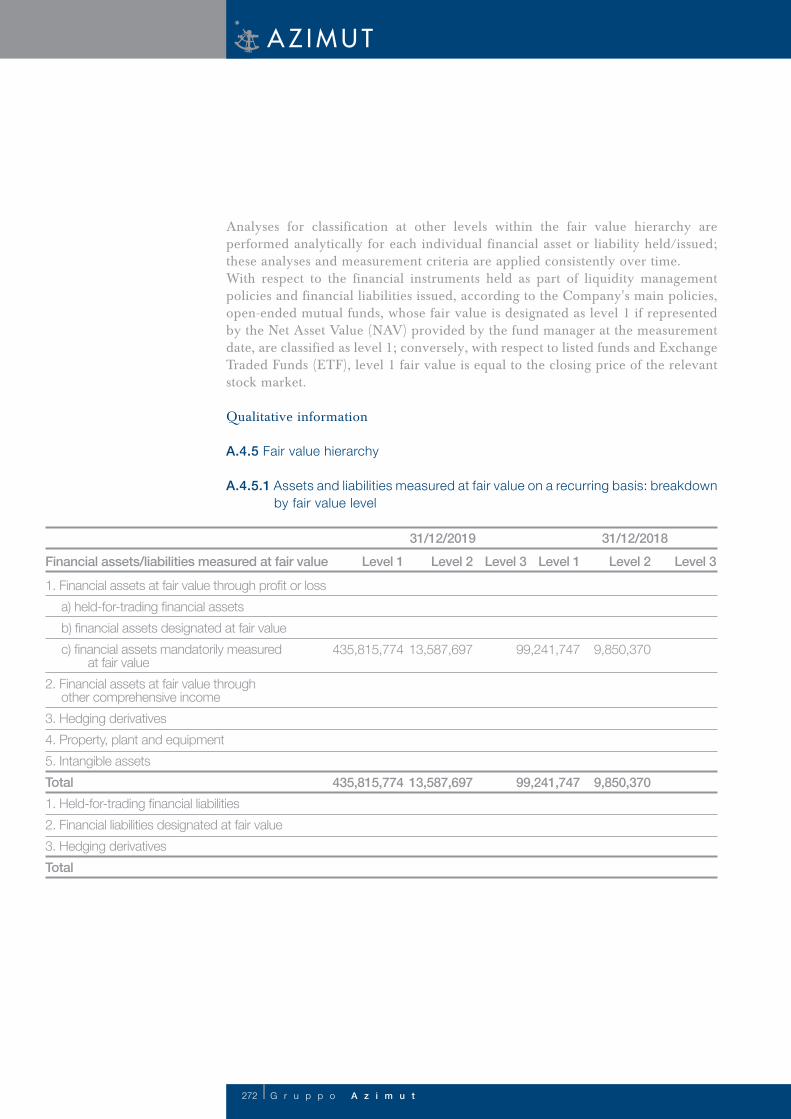
272 G r u p p o A z i m u t
Analyses for classification at other levels within the fair value hierarchy are performed analytically for each individual financial asset or liability held/issued; these analyses and measurement criteria are applied consistently over time.With respect to the financial instruments held as part of liquidity management policies and financial liabilities issued, according to the Company's main policies, open-ended mutual funds, whose fair value is designated as level 1 if represented by the Net Asset Value (NAV) provided by the fund manager at the measurement date, are classified as level 1; conversely, with respect to listed funds and Exchange Traded Funds (ETF), level 1 fair value is equal to the closing price of the relevant stock market.
Qualitative information
A.4.5 Fair value hierarchy
A.4.5.1 Assets and liabilities measured at fair value on a recurring basis: breakdown by fair value level
1. Financial assets at fair value through profit or loss a) held-for-trading financial assets b) financial assets designated at fair value c) financial assets mandatorily measured at fair value2. Financial assets at fair value through other comprehensive income3. Hedging derivatives4. Property, plant and equipment5. Intangible assetsTotal1. Held-for-trading financial liabilities2. Financial liabilities designated at fair value3. Hedging derivativesTotal
435,815,774
435,815,774
13,587,697
13,587,697
9,850,370
9,850,370
99,241,747
99,241,747
Level 1 Level 1 Level 3Level 3 Level 2Level 231/12/2019
Financial assets/liabilities measured at fair value31/12/2018

273
1. Financial assets at amortised cost 2. Property, plant and equipment held for investment purposes3. Non-current assets held for sale and discontinued operationsTotal1. Financial liabilities at amortised cost 2. Liabilities related to discontinued operationsTotal
- -
-
- - -
-
- -
-
- - -
-
118,776,923 -
-
118,776,923 852,475,175
-
852,475,175
14,439,318 -
300,000
14,739,318
354,165,375 -
354,165,375
118,776,923 -
-
118,776,923
- -
-
14,439,318 -
300,000
14,739,318
- -
-
- -
-
-
917,780,000 -
917,780,000
- -
-
-
345,632,000 -
345,632,000
L1 L3 L3CA CAL2 L231/12/2019
Assets/liabilities not measuredat fair value or measured at fairvalue on a non-recurring basis
31/12/2018
A.4.5.2 Annual change in assets measured at Level 3 fair value on a recurring basisAt the reporting date, the Company does not hold financial assets measured at level 3 fair value on a recurring basis.
A.5 Disclosure about the “Day one profit/lossThe Company did not carry out transactions which entailed recognition of the so-called day one profit/loss.
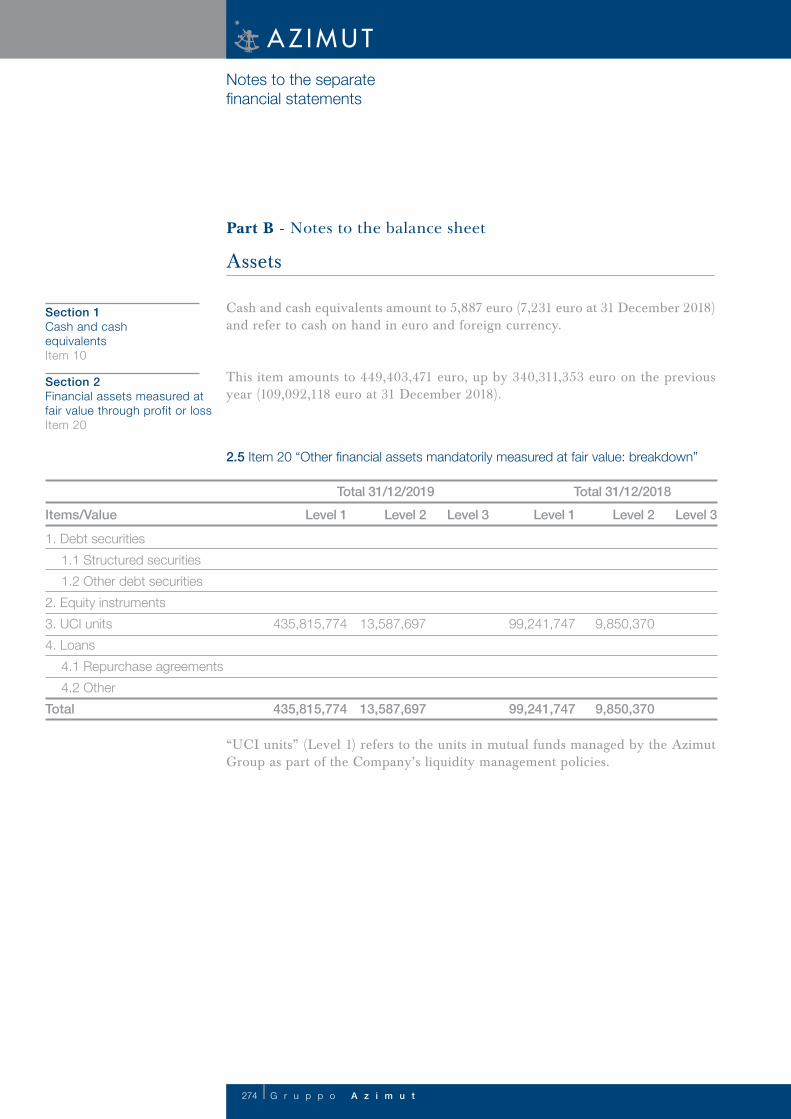
274 G r u p p o A z i m u t
Notes to the separatefinancial statements
Part B - Notes to the balance sheet
Assets
Cash and cash equivalents amount to 5,887 euro (7,231 euro at 31 December 2018) and refer to cash on hand in euro and foreign currency.
This item amounts to 449,403,471 euro, up by 340,311,353 euro on the previous year (109,092,118 euro at 31 December 2018).
Section 1Cash and cashequivalentsItem 10
Section 2Financial assets measured at fair value through profit or loss Item 20
1. Debt securities 1.1 Structured securities 1.2 Other debt securities2. Equity instruments 3. UCI units4. Loans 4.1 Repurchase agreements 4.2 OtherTotal
435,815,774
435,815,774
99,241,747
99,241,747
13,587,697
13,587,697
9,850,370
9,850,370
Items/Value Level 1 Level 1Level 3 Level 3Level 2 Level 2Total 31/12/2019 Total 31/12/2018
“UCI units” (Level 1) refers to the units in mutual funds managed by the Azimut Group as part of the Company’s liquidity management policies.
2.5 Item 20 “Other financial assets mandatorily measured at fair value: breakdown”

275
2.6 Other financial assets mandatorily measured at fair value: breakdown by debtor/issuer
1. Equity instruments of which: banks of which: other financial companies of which: non-financial companies of which: insurance companies2. Debt securities a) Public administrations b) Banks c) Other financial companies of which: insurance companies d) Non-financial companies3. UCI units4. Loans a) Public administrations b) Banks c) Other financial companies of which: insurance companies d) Non-financial companies e) Households
- -
109,092,118
- -
449,403,471
Items/Value Total 31/12/2018
Total 31/12/2019
With respect to the nature and form of risks arising from the above financial assets, reference should be made to section 3 – Part D “Other information – Information on risk management and hedging policies”.

276 G r u p p o A z i m u t
1. Receivables for portfolio management services 1.1 UCI units 1.2 individual portfolio management 1.3 pension fund management2. Receivables for other services 2.1 advisory services 2.2 outsourced corporate functions 2.3 other3. Other receivables 3.1 repurchase agreements of which: government securities of which: for other debt securities of which: for equity instruments and units 3.2 deposits and current accounts 3.3 other4. Debt securitiesTotal
-
-
118,776,923
118,776,923
118,776,923
-
-
118,776,923
118,776,923
118,776,923
-
- - - - - - - - - - - - - - - -
-
- - - - - - - - - - - - - - - -
-
- - - - - - - - - - - - - - - -
-
- - - - - - - - - - - - - - - -
BreakdownCarrying amount Fair value
Total 31/12/2019
First and second
stage
Level 1Third stage
Level 2of which: impaired acquired or
originated
Level 3
This item amounts to 118,776,923 euro, up by 104,337,605 euro on the previous year (14,439,318 euro at 31 December 2018).
4.1 Item 40 “Financial assets at amortised cost: breakdown” This item is composed of cash deposited in bank current accounts which bear interest at market rates.
Section 4Financial assets atamortised costItem 40
Notes to the separatefinancial statements

277
-
- - - - - - - - - - - - - - - -
-
- - - - - - - - - - - - - - - -
-
14,439,318
14,439,318
14,439,318
-
14,439,318
14,439,318
14,439,318
-
- - - - - - - - - - - - - - - -
-
- - - - - - - - - - - - - - - -
Carrying amount Fair value
First andsecond
stage
Level 1Thirdstage
Level 2of which: impaired acquired or
originated
Level 3
Total 31/12/2018

278 G r u p p o A z i m u t
Notes to the separatefinancial statements
1. Receivables for portfolio management services: 1.1 UCI units 1.2 individual portfolio management 1.3 pension fund management2. Receivables for other services: 2.1 advisory services 2.2 outsourced corporate functions 2.3 other3. Other receivables 3.1 repurchase agreements of which: government securities of which: for other debt securities of which: for equity instruments and units 3.2 deposits and current accounts 3.3 other4. Debt securitiesTotal 31/12/2019Total 31/12/2018
132,065
132,065
132,065 132,169
132,065
132,065
132,065 132,169
118,644,858
118,644,858
118,644,858 14,307,149
0 0
0 0
0 0
Breakdown/Counterpartyof which:
Groupof which:
Groupof which:
Group
Financial institutionsBanks Customers
This item amounts to 749,758,855 euro (703,537,534 euro at 31 December 2018), up by 46,221,321 euro on the previous year-end balance.
7.1 Equity investments: informationThe details of the Company’s equity investments are provided in annex A to these notes. They relate to the financial statements of the wholly-owned subsidiaries at 31 December 2019.In accordance with IAS 36 governing impairment tests, the carrying amount of the Company's equity investments was tested for impairment in order to identify any impairment indicators. Reference should be made to section 9.1, paragraph "Impairment test" for information on the methodology applied.
Section 7Equity investmentsItem 70
4.2 Financial assets at amortised cost: breakdown by debtor/issuer

279
“Increases” are comprised of:• purchases, which refer to: • 2,054,167 euro paid to purchase Azimut Libera Impresa SGR special shares held
by the managers of the Antares Fund, managed by said SGR, as per the agreements entered into on 31 July 2019. At the same time, the special shares were transformed into ordinary shares;
• other changes that refer to: • capital injections to increase the share capital of AZ International Holdings SA,
with registered office in Luxembourg (46,400,000 euro) and Azimut Enterprises S.r.l. (16,687,154 euro), which were made during the year, and the payment of an additional tranche to Augustum Opus Sim S.p.A. (now merged into Azimut Capital Management Sgr S.p.A.) shareholders.
“Decreases” is comprised of:• other changes that refer to: • the current value (20,000,000 euro), recognised as an increase in “Equity
investments” up to 31 December 2018, equal to the fair value of the incentive plan for the Group’s financial advisors at the same date, with a balancing entry in an equity reserve. At 31 December 2019, the targets set out in the five-year plan were not achieved. Consequently, the amount accrued up to 31 December 2018 was written off from “Equity investments”.
7.2 Annual changes in equity investments
703,537,53466,221,3212,054,167
64,167,15420,000,000
-
20,000,000 749,758,855
703,537,53466,221,3212,054,167
64,167,15420,000,000
-
20,000,000 749,758,855
A. Opening balanceB. Increases B.1 Purchases B.2 Reversals of impairment losses B.3 Revaluations B.4 Other changesC. Decreases C.1 Sales C.2 Impairment losses C.3 Other changesD. Closing balance
TotalNon-group equityinvestments
Group equity investments

280 G r u p p o A z i m u t
“Other” includes electronic office equipment (personal computers, printers and monitors) and the telephone system.The disclosure required by IFRS 16 is provided in the section “Transition to IFRS 16” of these notes.
1. Company-owned a) land b) buildings c) furniture & fixtures d) electronic systems e) other2. Right of use: assets acquired under leases a) land b) buildings c) furniture & fixtures d) electronic systems e) otherTotal
355,486
23,337
332,149
355,486
197,386
17,741
179,645787,810
697,089
90,720985,196
Items/Value Total 31/12/2018
Total 31/12/2019
Notes to the separatefinancial statements
8.1 Breakdown of item 80 “Property, plant and equipment – business purposes: breakdown of assets at cost”
This item amounts to 985,196 euro, up by 629,710 euro on 355,486 euro at 31 December 2018.The breakdown is as follows:
Section 8Property, plant and equipment Item 80

281
A. Opening gross balance D.1 Total net impairment losses A.2 Opening net balanceB. Increases B.1 Purchases B.2 Leasehold improvements B.3 Reversals of impairment losses B.4 Increases in fair value taken to: a) shareholders’ equity b) profit or loss B.5 Exchange rate gains B.6 Transfers from investment property B.7 Other changesC. Decreases C.1 Sales C.2 Depreciation C.3 Impairment losses charged to: a) shareholders’ equity b) profit or loss C.4 Decreases in fair value charged to: Charged to: a) shareholders’ equity b) profit or loss C.5 Exchange rate losses C.6 Transfers to: a) property, plant and equipment held for investment purposes b) assets held for sale C.7 Other changesD. Net closing balance D.1 Total net impairment losses D.2 Net closing balanceE. Measurement at cost
187,479-164,142
23,3370 0
-5,596
-5,596
17,741-169,738187,479187,479
769,202
769,202-72,113
-72,113
697,089-72,113769,202769,202
-
-
2,282,700-1,927,214
355,486950,999
7,556
943,443-321,290
0-306,340
-14,950 985,195
-2,233,5543,218,7493,218,749
OtherFurniture & fixtures
Electronic systemsBuildingsLand Total
8.5 Property, plant and equipment – business purposes: annual changes
2,095,221-1,763,072
332,149181,797
7,556
174,241-243,581
-228,631
-14,950 270,365
-1,991,7032,262,0682,262,068
0000

282 G r u p p o A z i m u t
This item amounts to 188,358,043 euro, up by 568,965 euro on the previous year-end balance (187,789,078 euro at 31 December 2018). This item is broken down as follows:
9.1 Breakdown of item 90 “Intangible assets”
Depreciation is calculated based on the following rates:
Over the lease term25%20%12%25%
PropertiesMotor vehiclesElectronic office equipmentFurniture & fixturesOther assets
% RateDescription
“Goodwill” of an original amount of 176.3 million euro, of which 26.4 million amortised prior to the adoption of the IFRS, and corresponding to the portion of goodwill arising from merger that had not been allocated as an increase in the carrying amount of equity investments, relates to the goodwill paid by Azimut Holding S.p.A. (formerly Tumiza S.p.A.) to purchase the Group in 2002 by acquiring the entire share capital of Azimut Holding S.p.A., incorporated in December of the same year.“Other intangible assets – other” refers to the cost of software (3,190,388 euro) and the Azimut trademark.
Impairment test With respect to "goodwill" and "trademarks" (recognised as an intangible asset with an indefinite useful life), IAS 36 “Impairment of assets” stipulates that the Company must perform annual impairment tests to check the adequacy of the amounts recognised during the drafting of the financial statements. The aim of the impairment test is to identify any impairment loss: should the test identify the non-recoverability of accounting balances, the Company shall recognise an impairment loss on the asset.
Section 9Intangible assets Item 90
149,829,43137,959,647
37,959,647
187,789,078
1. Goodwill2. Other intangible assets 2.1 generated internally 2.2 otherTotal
Total 31/12/2018Total 31/12/2019Assetsat cost
Assetsat cost
Assets at fair value
Assets at fair value
149,829,43138,528,612
38,528,612
188,358,043
Notes to the separatefinancial statements

283
For the purposes of the impairment test carried out at Group level, four significant cash-generating units (“CGUs”) were identified, reflecting management’s decisions when identifying operating/geographical areas for the purposes of disclosures under IFRS 8. This is due to the fact that, under IAS 36, a CGU cannot be larger than an operating segment as defined by paragraph 5 of IFRS 8. The first CGU, to which the Company's goodwill and trademarks were allocated, reflects the activity carried out by the companies directly controlled by Azimut Holding S.p.A., each specialising in the distribution, promotion and management of financial and insurance products (basically unit-linked products) and operating as a single structure, dedicated in its entirety to asset management and the sale of investment instruments, in which the contributions made by the individual companies appear to be indistinguishable and operating results are revised periodically by management for the purpose of decisions regarding allocation of resources and measurement of results and company performance.The other three refer to the activity carried out by the foreign companies belonging to the Luxembourg company AZ International Holdings SA, wholly owned by Azimut Holding S.p.A., aimed at identifying, acquiring and managing new foreign partnerships.The impairment test of the Azimut CGU, to which goodwill and the trademark were allocated, had a positive outcome.The value in use of these assets is calculated using the Discounted Cash Flow method, based on the following assumptions:1) Discount rate calculated using 31 December 2019 as the reference date and determined using the weighted average cost of capital (WACC) approach: • Risk free: 10-year Italian government bonds, average 2019; • Cost of capital (Ke) calculated using the CAPM (unlevered) method: • Cost of debt calculated using the average cost of debt of Azimut Holding prudently rounded to 1.8%; • Beta: Calculated on a 5-year timescale with daily readings (source: Bloomberg); • Market risk premium: extra return for investments in shares rather than risk- free securities (Source: Credit Suisse Global Equity Strategy). 2) Cash flows To calculate Cash Flow an approximate estimate is made based on net profit for the year, gross of amortisation/depreciation. Profits were determined based on assumptions (strategic lines) that will be used to develop the new 2020 – 2024 business plan.3) Terminal values To calculate Terminal values, the net profit of the last explicit forecast period gross of amortisation/depreciation was considered, assuming a g growth rate of 2%.

284 G r u p p o A z i m u t
The table below shows the results of the sensitivity analysis (with the WACC on the x axis and the terminal growth rate on the y axis) which did not identify any impairment loss.
Sensitivity Analysis
As shown in the tables above, the sensitivity analyses carried out on the most significant variables in terms of sensitivity to the recoverable amount of the identified CGU, i.e., the weighted average cost of capital, the "g" growth rate and the income flows used, do not in any case lead to the identification of recoverable amounts below the related carrying amounts.
Notes to the separatefinancial statements
9,0%d 3.809.397.595
d 3.992.623.818
d 4.198.156.100
d 4.432.717.682
d 4.700.159.512
d 5.008.973.724
d 5.369.565.392
d 5.796.148.003
€ 6.205.856.787
8,5%d 3.977.550.183
d 4.182.836.135
d 4.415.624.605
d 4.681.839.236
d 4.989.236.404
d 5.348.173.439
d 5.772.798.607
d 6.282.960.223
-2,5%d 6.041.724.757
8,0%d 4.166.816.170
d 4.398.531.529
d 4.663.518.959
d 4.969.499.084
d 5.326.781.487
d 5.749.449.212
d 6.257.259.078
d 6.878.819.009
-5,0%d 5.877.592.727
7,5%d 4.381.438.452
d 4.645.198.683
d 4.949.761.764
d 5.305.389.534
d 5.726.099.816
d 6.231.557.932
d 6.850.239.319
d 7.624.985.491
-7,5%d 5.713.460.698
6,96%d 4.626.878.407
d 4.930.024.444
d 5.283.997.581
d 5.702.750.421
d 6.205.856.787
d 6.821.659.629
d 7.592.801.132
d 8.586.541.834
-10,0%d 5.549.328.668
6,5%d 4.910.287.124
d 5.262.605.628
d 5.679.401.025
d 6.180.155.642
d 6.793.079.939
d 7.560.616.773
d 8.549.712.276
d 9.872.481.445
-12,5%d 5.385.196.638
6,0%d 5.241.213.676
d 5.656.051.630
d 6.154.454.496
d 6.764.500.248
d 7.528.432.413
d 8.512.882.717
d 9.829.439.617
d 11.680.257.067
-15,0%d 5.221.064.608
5,5%d 5.632.702.234
d 6.128.753.351
d 6.735.920.558
d 7.496.248.054
d 8.476.053.158
d 9.786.397.790
d 11.628.482.024
d 14.408.366.873
-17,5%d 5.056.932.578
0,0%0,5%1,0%1,5%2,0%2,5%3,0%3,5%
G
Difference between value in use and the carrying amount of the CGUWACC
Difference between value in use and the carrying amount of the CGU - decrease in cash flows

285
9.2 Intangible assets: annual changes
187,789,078 1,402,108 1,402,108
833,143
833,143
188,358,043
A. Opening balanceB. Increases B.1 Purchases B.2 Reversals of impairment losses B.3 Increases in fair value taken to: - shareholders’ equity - profit or loss B.4 Other changesC. Decreases C.1 Sales C.2 Amortisation C.3 Impairment losses charged to: - shareholders’ equity - profit or loss C.4 Decreases in fair value charged to: - shareholders’ equity - profit or loss C.5 Other changesD. Closing balance
Total
The above purchases refer exclusively to software packages, which are amortised using the following rates:
33%Software packages% rateDescription
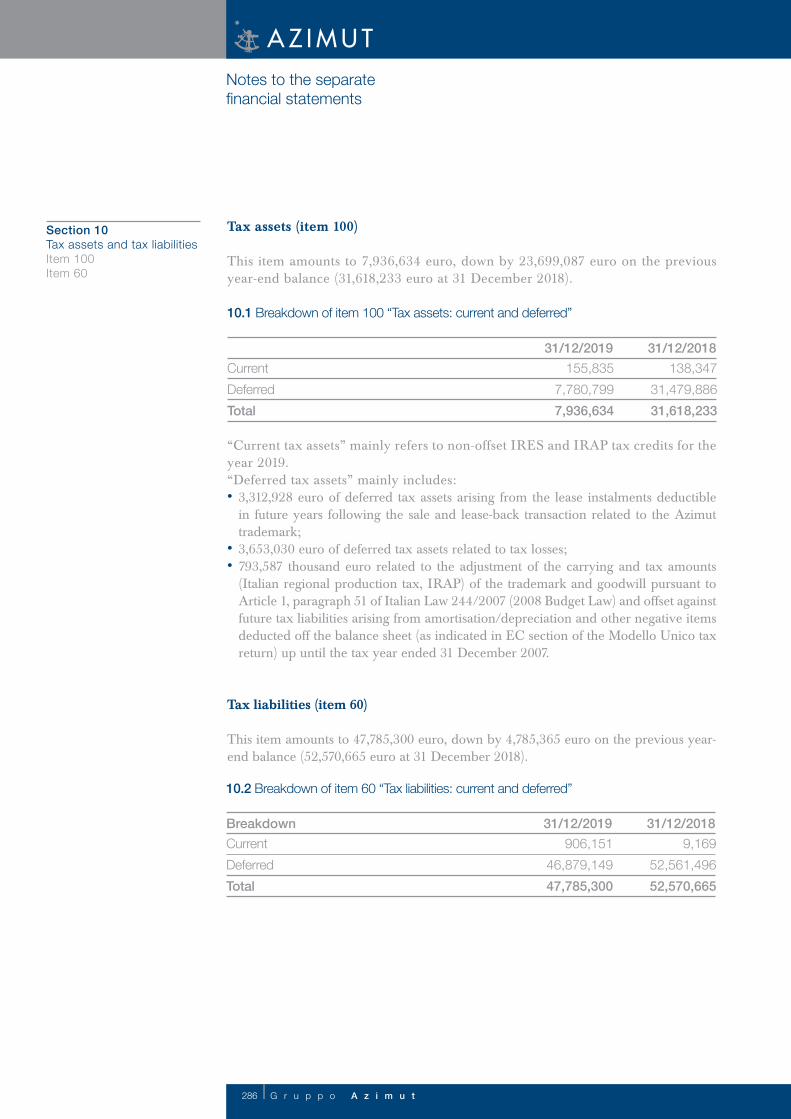
286 G r u p p o A z i m u t
138,34731,479,886 31,618,233
155,8357,780,799 7,936,634
CurrentDeferredTotal
31/12/201831/12/2019
Tax assets (item 100)
This item amounts to 7,936,634 euro, down by 23,699,087 euro on the previous year-end balance (31,618,233 euro at 31 December 2018).
10.1 Breakdown of item 100 “Tax assets: current and deferred”
Section 10Tax assets and tax liabilitiesItem 100Item 60
Notes to the separatefinancial statements
9,169 52,561,496 52,570,665
906,151 46,879,149 47,785,300
CurrentDeferredTotal
31/12/201831/12/2019Breakdown
10.2 Breakdown of item 60 “Tax liabilities: current and deferred”
“Current tax assets” mainly refers to non-offset IRES and IRAP tax credits for the year 2019. “Deferred tax assets” mainly includes: • 3,312,928 euro of deferred tax assets arising from the lease instalments deductible
in future years following the sale and lease-back transaction related to the Azimut trademark;
• 3,653,030 euro of deferred tax assets related to tax losses;• 793,587 thousand euro related to the adjustment of the carrying and tax amounts
(Italian regional production tax, IRAP) of the trademark and goodwill pursuant to Article 1, paragraph 51 of Italian Law 244/2007 (2008 Budget Law) and offset against future tax liabilities arising from amortisation/depreciation and other negative items deducted off the balance sheet (as indicated in EC section of the Modello Unico tax return) up until the tax year ended 31 December 2007.
Tax liabilities (item 60)
This item amounts to 47,785,300 euro, down by 4,785,365 euro on the previous year-end balance (52,570,665 euro at 31 December 2018).
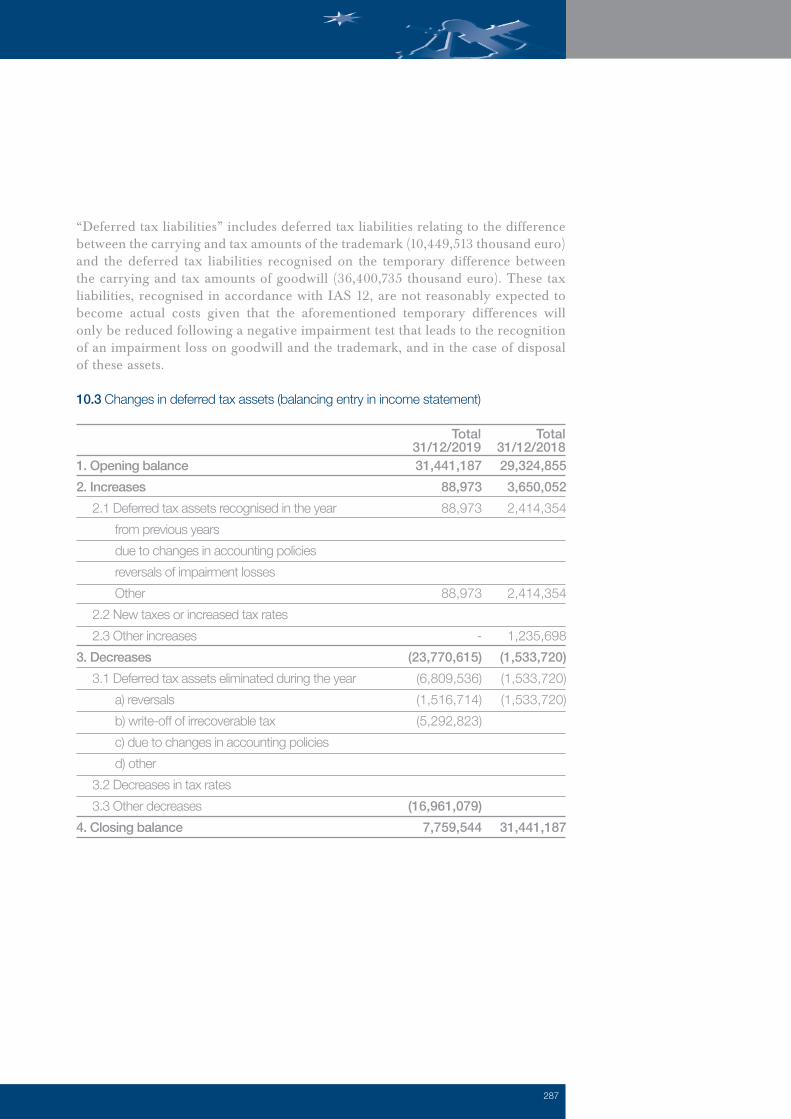
287
1. Opening balance2. Increases 2.1 Deferred tax assets recognised in the year from previous years due to changes in accounting policies reversals of impairment losses Other 2.2 New taxes or increased tax rates 2.3 Other increases3. Decreases 3.1 Deferred tax assets eliminated during the year a) reversals b) write-off of irrecoverable tax c) due to changes in accounting policies d) other 3.2 Decreases in tax rates 3.3 Other decreases4. Closing balance
29,324,855 3,650,052
2,414,354
2,414,354
1,235,698 (1,533,720)(1,533,720)(1,533,720)
31,441,187
31,441,187 88,973
88,973
88,973
- (23,770,615)
(6,809,536)(1,516,714)(5,292,823)
(16,961,079)7,759,544
Total31/12/2018
Total31/12/2019
“Deferred tax liabilities” includes deferred tax liabilities relating to the difference between the carrying and tax amounts of the trademark (10,449,513 thousand euro) and the deferred tax liabilities recognised on the temporary difference between the carrying and tax amounts of goodwill (36,400,735 thousand euro). These tax liabilities, recognised in accordance with IAS 12, are not reasonably expected to become actual costs given that the aforementioned temporary differences will only be reduced following a negative impairment test that leads to the recognition of an impairment loss on goodwill and the trademark, and in the case of disposal of these assets.
10.3 Changes in deferred tax assets (balancing entry in income statement)
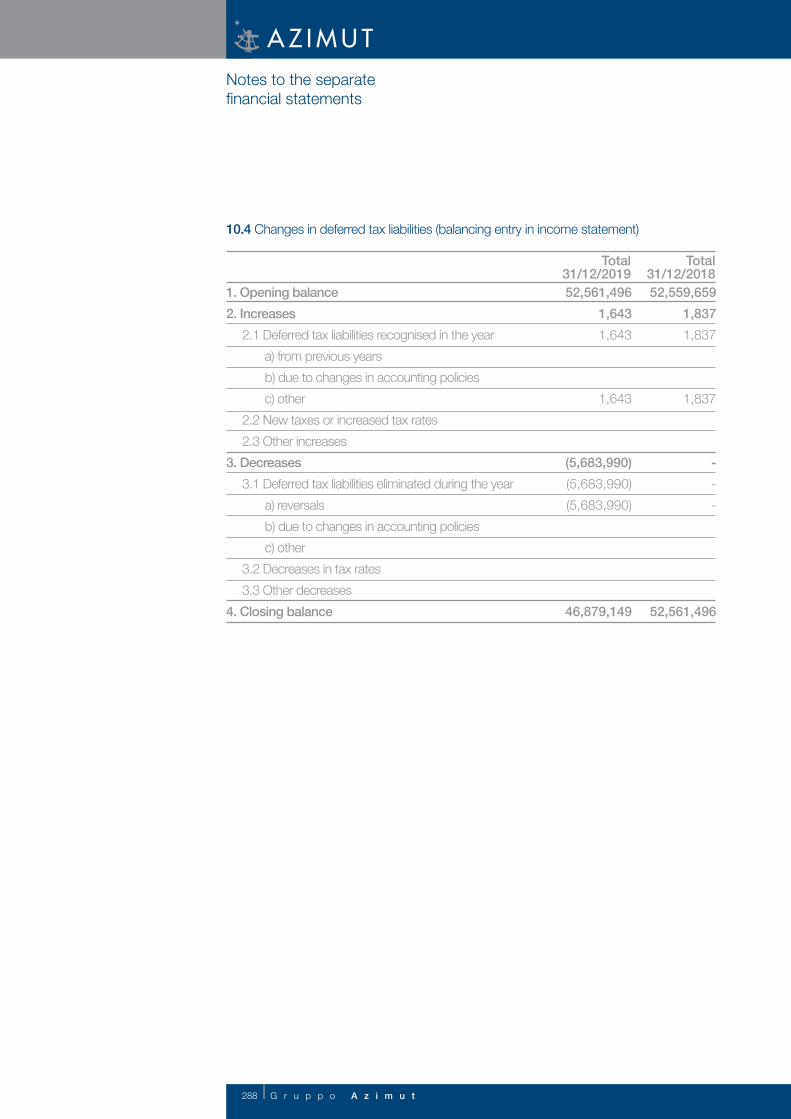
288 G r u p p o A z i m u t
10.4 Changes in deferred tax liabilities (balancing entry in income statement)
52,559,659 1,837
1,837
1,837 ---
52,561,496
52,561,496 1,643 1,643
1,643
(5,683,990)(5,683,990)(5,683,990)
46,879,149
1. Opening balance2. Increases 2.1 Deferred tax liabilities recognised in the year a) from previous years b) due to changes in accounting policies c) other 2.2 New taxes or increased tax rates 2.3 Other increases3. Decreases 3.1 Deferred tax liabilities eliminated during the year a) reversals b) due to changes in accounting policies c) other 3.2 Decreases in tax rates 3.3 Other decreases4. Closing balance
Total31/12/2018
Total31/12/2019
Notes to the separatefinancial statements

289
10.5 Changes in deferred tax assets (balancing entry in shareholders’ equity)
1,710,293
(1,671,593)
(435,895)
(1,235,698)38,700
38,700
(17,444)(17,444)
21,256
1. Opening balance2. Increases 2.1 Deferred tax assets recognised in the year a) from previous years b) due to changes in accounting policies c) other 2.2 New taxes or increased tax rates 2.3 Other increases3. Decreases 3.1 Deferred tax assets eliminated during the year a) reversals b) write-off of irrecoverable tax c) due to changes in accounting policies d) other 3.2 Decreases in tax rates 3.3 Other decreases4. Closing balance
Total31/12/2018
Total31/12/2019

290 G r u p p o A z i m u t
10.6 Changes in deferred tax liabilities (balancing entry in shareholders’ equity)
652,708
(652,708)
(652,708) 0
-
-
1. Opening balance2. Increases 2.1 Deferred tax assets recognised in the year from previous years due to changes in accounting policies 2.2 New taxes or increased tax rates 2.3 Other increases Other3. Decreases 3.1 Deferred tax assets eliminated during the year a) reversals b) due to changes in accounting policies c) other 3.2 Decreases in tax rates 3.3 Other decreases4. Closing balance
Total31/12/2018
Total31/12/2019
28,340 16,634,107 7,378,247
421,274 24,461,967
- 17,983,638 42,521,721
798,92661,304,285
Due from Inland Revenue Other receivablesDue from Group companiesPrepaymentsTotal
31/12/201831/12/2019Breakdown
This item has a nil balance (300 thousand euro at 31 December 2018). Indeed, the subsidiary Azimut Global Counseling S.r.l. was sold on 16 May 2019.
This item amounts to 61,304,285 euro, up by 36,842,318 euro on the previous year end (24,461,967 euro at 31 December 2018).
12.1 Breakdown of item 120 “Other assets”
Section 11Non-current assets held forsale and discontinued operations and related liabilities Item 110 of assets anditem 70 of liabilities
Section 12Other assets Item 120
Notes to the separatefinancial statements

291
Liabilities
This item amounts to 912,764,313 euro, up by 558,598,938 euro on the previous year (354,165,375 euro at 31 December 2018).
1.1 Financial liabilities at amortised cost: breakdown
Section 1Financial liabilities atamortised cost Item 10
-
-
798,324 59,490,814 60,289,138
60,289,138 60,289,138
1. Due to sales networks: 1.1 for UCI sales 1.2 for individual portfolio management sales 1.3 for pension fund sales2. Payables for asset management services: 2.1 for proprietary portfolio management 2.2 for discretionary portfolio management 2.3 for other3. Payables for other services: 3.1 advisory services 3.2 outsourced corporate functions 3.3 other4. Other payables 4.1 repurchase agreements of which: government securities of which: for other debt securities of which: for equity instruments and units 4.2 Lease liabilities 4.3 Other payablesTotalFair value – Level 1Fair value – Level 2Fair value – Level 3Total fair value
Total 31/12/2019Breakdown/Value Total 31/12/2018
“Due from Group companies” mainly includes: • the 2 million euro receivable from the subsidiary Azimut Capital Management SGR
S.p.A. in the form of royalties on the Azimut trademark due for 2019;• the receivables from the subsidiary Azimut Capital Management SGR S.p.A. for direct
taxes (IRES) arising from the 2019 tax benefit, transferred to the Parent Company following adoption of the tax consolidation regime (22.3 million euro) and from the subsidiary AZ Fund Management for the cash pooling arrangement (18.2 million euro).

292 G r u p p o A z i m u t
1. Securities bonds other securitiesTotal
852,475,175 852,475,175
852,475,175
917,780,000 917,780,000
917,780,000
354,165,375 354,165,375
354,165,375
345,632,000 345,632,000
345,632,000
BreakdownCA CAFair value Fair value
L2 L2L3 L3L1 L1
Total 31/12/2019 Total 31/12/2018
This item comprises: • the “Azimut 2017-2022 2.000%” bond amounting to 354,523,099 euro originally
composed of 3,500 bonds for a nominal amount of 100,000 euro, with a duration of five years and issued on 27 March 2017. The amount refers to total bonds sold and includes the charges incurred by the company for the issue and placement, in addition to interest expense accrued at 31 December 2019 which will be paid on the pre-established date. The bond bears annual fixed interest of 2.000%;
• the “Azimut 2019-2024 1.625%” bond amounting to 497,952,076 euro originally composed of 5,000 bonds for a nominal amount of 100,000 euro, with a duration of five years and issued on 12 December 2019. The amount refers to total bonds sold and includes the charges incurred by the company for the issue and placement, in addition to interest expense accrued at 31 December 2019 which will be paid on the pre-established date. The bond bears annual fixed interest of 1.625%.
1.3 Subordinated securitiesThe company has no subordinated securities.
Notes to the separatefinancial statements
The increase in “Other payables” comprises a loan granted by Banco BPM on 28 February 2019 and divided into two lines, A and B, each originally amounting to 100 million euro. Line A is repayable in tranches while Line B is entirely due on 31 December 2021. The interest rate is calculated based on the Euribor plus 140 basis points for Line A and 160 basis points for Line B. The loan is subject to covenants. On 31 December 2019, the Company repaid the first instalment (Line A) of the loan for 20,000,000 euro and repaid a total of 120,000,000 euro in advance.
1.2 Breakdown of “Financial liabilities at amortised cost”: “Outstanding securities”
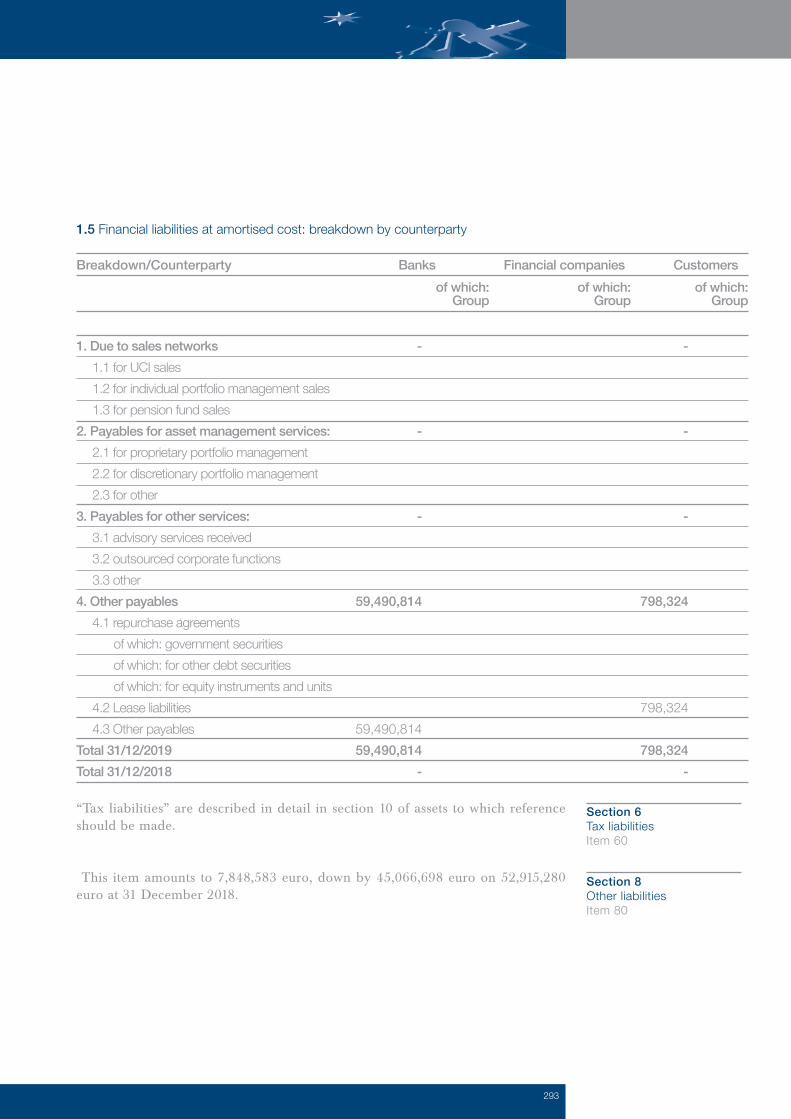
293
Section 6Tax liabilities Item 60
Section 8Other liabilities Item 80
“Tax liabilities” are described in detail in section 10 of assets to which reference should be made.
This item amounts to 7,848,583 euro, down by 45,066,698 euro on 52,915,280 euro at 31 December 2018.
1.5 Financial liabilities at amortised cost: breakdown by counterparty
1. Due to sales networks 1.1 for UCI sales 1.2 for individual portfolio management sales 1.3 for pension fund sales2. Payables for asset management services: 2.1 for proprietary portfolio management 2.2 for discretionary portfolio management 2.3 for other3. Payables for other services: 3.1 advisory services received 3.2 outsourced corporate functions 3.3 other4. Other payables 4.1 repurchase agreements of which: government securities of which: for other debt securities of which: for equity instruments and units 4.2 Lease liabilities 4.3 Other payablesTotal 31/12/2019Total 31/12/2018
-
-
-
59,490,814
59,490,814 59,490,814
-
-
-
-
798,324
798,324
798,324 -
Breakdown/Counterpartyof which:
Groupof which:
Groupof which:
Group
Financial companiesBanks Customers

294 G r u p p o A z i m u t
“Due to Group companies” mainly comprises the amount due to the subsidiaries Azimut Financial Insurance S.p.A, Azimut Libera Impresa SGR S.p.A. and Azimut Enterprises S.r.l for the IRES liabilities transferred for national tax consolidation purposes. The decrease is due to the payment of the liabilities incurred in the previous year with AZ Fund Management SA and Azimut Financial Insurance S.p.A., as part of the cash pooling arrangement.
This item amounts to 378,531 euro, down by 321,740 euro on the previous year-end balance (700,271 euro at 31 December 2018).
9.1"Staff severance pay (TFR)": annual changes
"Other decreases" includes the actuarial gain of the year with a direct balancing entry in a specific equity reserve, net of the related tax effect and the substitute tax, in addition to the staff severance pay (TFR) transferred to other Group companies following the transfer of employees.
8.1 Breakdown of item 90 “Other liabilities”
2,534,310 456,058
1,193,823 311,373
1,342,555 47,077,033
128 52,915,280
2,723,425 234,910 695,660 131,857
1,063,067 1,932,997 1,066,669 7,848,583
Due to suppliersDue to Company bodiesDue to Inland RevenueDue to social security bodiesDue to employeesDue to Group companiesOther payablesTotal
31/12/201831/12/2019
722,367109,011109,011
131,10770,66860,439
700,271
700,271101,670101,670
423,41045,099
378,311378,531
A. Opening balanceB. Increases B1. Provisions for the year B2. Other increasesC. Decreases C1. Payments made C2. Other decreasesD. Closing balance
Total 31/12/2018Total 31/12/2019
Section 9Staff severance pay (TFR) Item 90
Notes to the separatefinancial statements
295
9.2 "Other information”In accordance with that set out in the Part A - Section A.2 on the accounting standards applied to individual financial statements items, staff severance pay was calculated pursuant to IAS 19, based on the following specific technical, demographic and financial assumptions:
Demographic assumptionsIn order to determine the probabilities of removal of personnel in service due to death, the SIM/F 2000 table was used (ISTAT – Italian National Institute of Statistics – mortality table by gender), prudentially reduced by 20%. Decreases due to disability were calculated using the relevant INPS (the Italian social security institution) tables, reduced by 20%. Pension, which is considered the main reason for outgoing employees, was subject to a timescale equal to meeting the minimum requirement (contribution period or seniority), calculated in accordance with ruling legislation. The following parameters were used for other technical, non-financial factors: • Turnover: 1.5% unchanged; • Advance: 2% unchanged; • Amount paid in advance: 70%.Finally, assessment of the allocation of TFR to private pension funds was carried out based on the behaviour observed on assessment (lack or partial adherence to private pension funds), without making any assumption on the future decisions of the personnel different from the current ones.
Financial assumptionsIAS 19 requires utilisation of financial technical factors. These assumptions reflect their influence on the prospective trend of flows (following remuneration increases and forecast inflation scenarios) and on discounting of the Company's estimated liability at the measurement date. Indeed, the discount rate is the main financial assumption on which the analysis results depend. • Inflation: a constant rate of 2.00% was used with respect to the future inflation
scenario to be used for remuneration and TFR revaluation. • Interest rates: the future liability to employees was discounted using the yield curve
of debt securities in accordance with IAS 19.
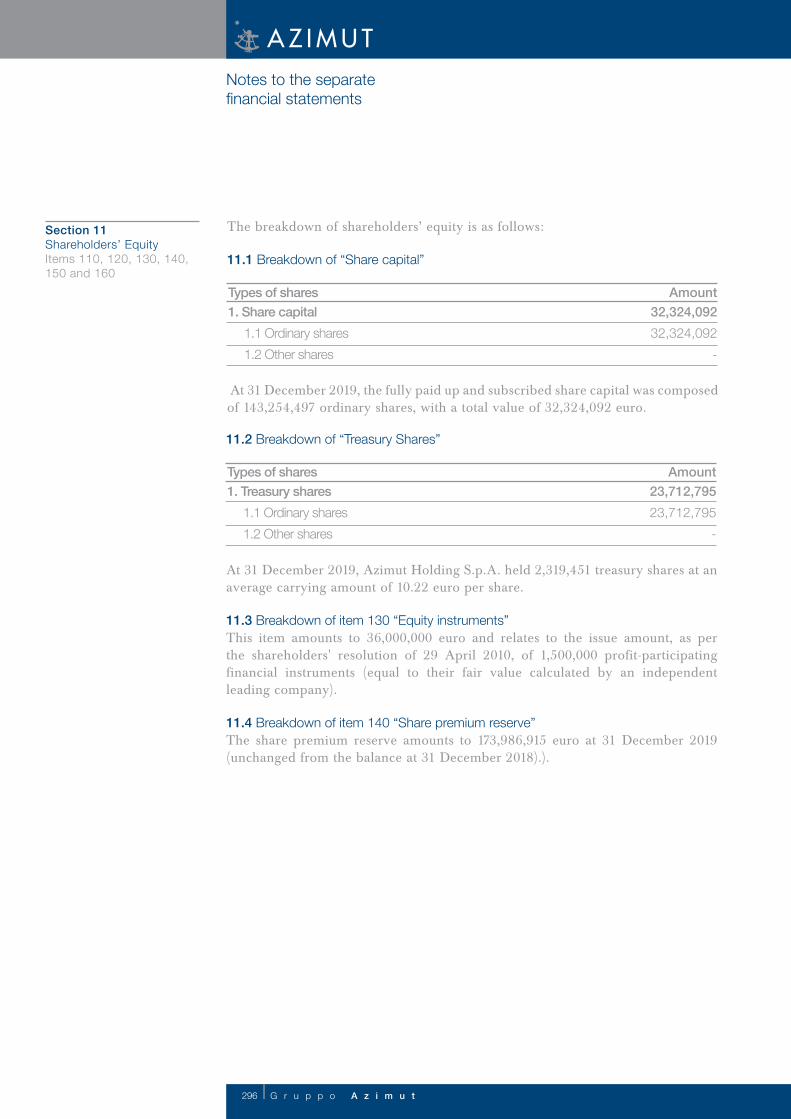
296 G r u p p o A z i m u t
The breakdown of shareholders’ equity is as follows:
11.1 Breakdown of “Share capital”
11.2 Breakdown of “Treasury Shares”
At 31 December 2019, the fully paid up and subscribed share capital was composed of 143,254,497 ordinary shares, with a total value of 32,324,092 euro.
At 31 December 2019, Azimut Holding S.p.A. held 2,319,451 treasury shares at an average carrying amount of 10.22 euro per share.
11.3 Breakdown of item 130 “Equity instruments”This item amounts to 36,000,000 euro and relates to the issue amount, as per the shareholders' resolution of 29 April 2010, of 1,500,000 profit-participating financial instruments (equal to their fair value calculated by an independent leading company).
11.4 Breakdown of item 140 “Share premium reserve”The share premium reserve amounts to 173,986,915 euro at 31 December 2019 (unchanged from the balance at 31 December 2018).).
32,324,09232,324,092
-
23,712,79523,712,795
-
1. Share capital 1.1 Ordinary shares 1.2 Other shares
1. Treasury shares 1.1 Ordinary shares 1.2 Other shares
Amount
Amount
Types of shares
Types of shares
Section 11Shareholders’ Equity Items 110, 120, 130, 140,150 and 160
Notes to the separatefinancial statements

297
228,849,252000
-48,810,573-20,178,111
-20,178,111
-28,632,462180,038,679
222,384,434000
-48,810,573-20,178,111
-20,178,111
-28,632,462173,573,861
6,464,818
6,464,818
A. Opening balance B. Increases B.1 Profit appropriations B.2 Other changesC. Decreases C.1 Allocations loss account reserve dividends transfers to share capital C.2 Other changesD. Closing balance
Total Other reserves
Legal reserve
11.5 Other information Breakdown of item 150 “Reserves”
The following gives a breakdown of shareholders’ equity, showing the origin and level of availability and distributability of the items, in accordance with Article 2427 paragraph 7-bis of the Italian Civil Code.
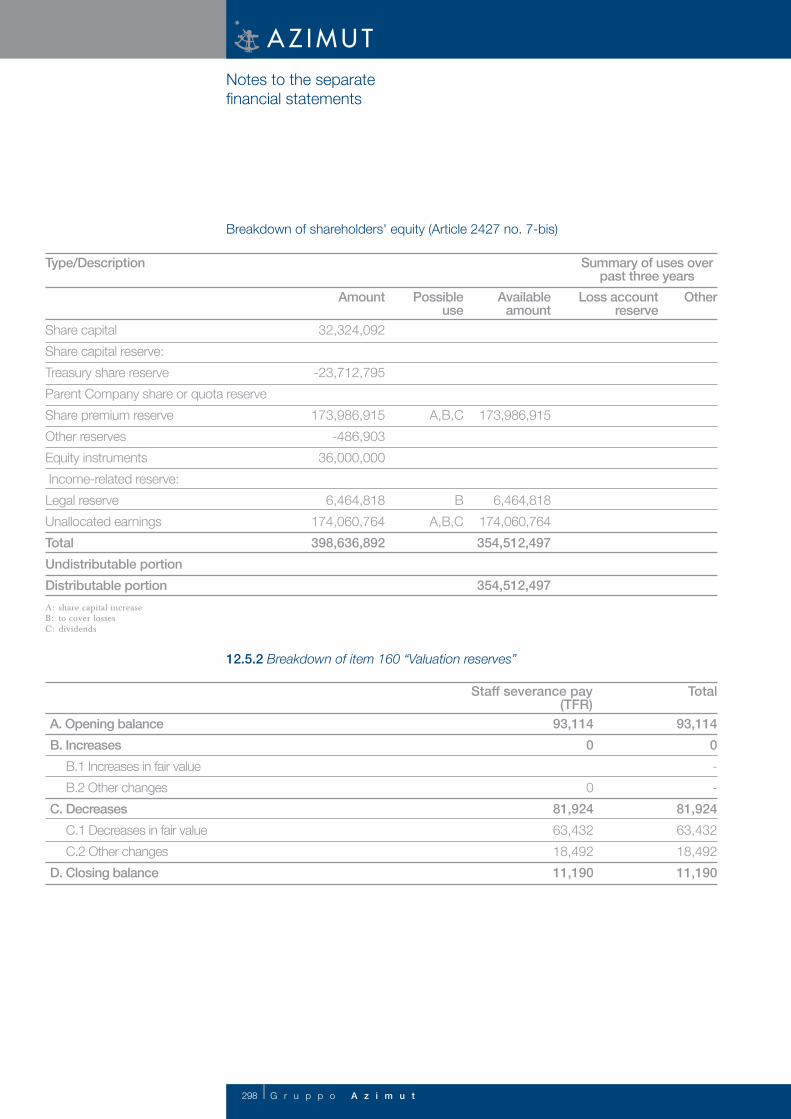
298 G r u p p o A z i m u t
Share capitalShare capital reserve:Treasury share reserveParent Company share or quota reserveShare premium reserve Other reservesEquity instruments Income-related reserve:Legal reserveUnallocated earningsTotalUndistributable portionDistributable portion
Breakdown of shareholders' equity (Article 2427 no. 7-bis)
A: share capital increaseB: to cover lossesC: dividends
173,986,915
6,464,818174,060,764
354,512,497
354,512,497
A,B,C B
A,B,C
32,324,092
-23,712,795
173,986,915-486,903
36,000,000
6,464,818174,060,764 398,636,892
Summary of uses over past three years
Type/Description
OtherLoss account reserve
Available amount
Possibleuse
Amount
93,1140- -
81,92463,43218,49211,190
93,1140 0
81,92463,432 18,49211,190
A. Opening balanceB. Increases B.1 Increases in fair value B.2 Other changesC. Decreases C.1 Decreases in fair value C.2 Other changesD. Closing balance
Total Staff severance pay(TFR)
12.5.2 Breakdown of item 160 “Valuation reserves”
Notes to the separatefinancial statements

299
A. Asset management1. Proprietary portfolio management 1.1 Mutual funds Management fees Incentive fees Entry / redemption fees Switch fees Other feesTotal mutual fund fees 1.2 Individual portfolio management Management fees Incentive fees Entry / redemption fees Other feesTotal individual portfolio management fees 1.3 Open-ended pension funds Management fees Incentive fees Entry / redemption fees Other feesTotal open-ended pension fund fees2. Discretionary portfolio management Management fees Incentive fees Other feesTotal discretionary portfolio management feesTotal asset management fees (A)B. Other services Advisory services RoyaltiesTotal fees for other services (B)Total fees and commissions (A+B)
Section 1Fee and commissionincome and expensesItems10 and 20
Part C - Notes to the income statement
This item amounts to 2,000,000 euro (unchanged from last year) and include royalties on the "Azimut" trademark for the year, charged to Azimut Capital Management SGR S.p.A.
1.1 “Fee and commission income and expense”
2,000,000 2,000,0002,000,000
2,000,000 2,000,0002,000,000
2,000,000 2,000,0002,000,000
2,000,000 2,000,0002,000,000
Total 31/12/2019Services Total 31/12/2018Net fee
andcomm.
Net feeand
comm.Fee and comm.
expenseFee and comm.
expenseFee and comm. income
Fee and comm. income

300 G r u p p o A z i m u t
This item amounts to 238,201,822 euro, up by 15,446,933 euro on the previous year (222,754,889 euro in 2018).
2.1 Breakdown of “Dividends and similar income”
“Dividends from equity investments” may be analysed as follows:
The amount related to the subsidiary AZ Fund Management SA also includes the interim dividend whose distribution was approved during the year.
Interest incomeThis item amounts to 103,534 euro (39,371 euro in 2018), up by 64,163 euro on the previous year. It is entirely comprised of gross interest income on current accounts.
238,201,822238,201,822
222,754,889222,754,889
A. Held-for-trading financial assetsB. Other financial assets mandatorily measured at fair valueC. Financial assets measured at fair value through other comprehensive incomeD. Equity investmentsTotal
Total 31/12/2018Total 31/12/2019Items/Income
Similarincome
Similarincome
DividendsDividends
15,900,00085,844,88927,550,000
-93,460,000
222,754,889
47,001,600149,750,22226,500,000
14,950,000 0
238,201,822
Azimut Capital Management SGR S.p.A.AZ Fund Management SAAzimut Financial Insurance S.p.A.AZ Life DacAzimut Partecipazioni S.r.l.(now merged into Azimut Capital Management)Total
20182019Description
Section 2Dividends andsimilar income Item 40
Section 3Interest Items 50 and 60
Notes to the separatefinancial statements

301
103,534
103,534 -
103,534
103,534 -
39,371
39,371
-
1. Financial assets at fair value through profit or loss: 1.1 Held-for-trading financial assets 1.2. Financial assets designated at fair value 1.3 Other financial assets mandatorily measured at fair value2. Financial assets at fair value through other comprehensive income3. Financial assets at amortised cost: 3.1. Due from banks 3.2. Due from financial companies 3.3 Due from customers 4. Hedging derivatives5. Other assets6. Financial liabilitiesTotalof which: interest income on impaired financial assets
Deposits and current
accounts
Repurchase agreements
Debt securities
Items/Technical forms Total 31/12/2018
Total 31/12/2019
Other
Interest expenseThis item amounts to 12,137,857 euro (7,525,430 euro in 2018), up by 4,612,427 euro on the previous year. The increase is due to the rise in the Parent Company’s indebtedness following the signing of a new loan agreement with Banco BPM, which was partly repaid early at 31 December 2019, and the issue of the above new bond.
3.1 Breakdown of “Interest income and similar income”

302 G r u p p o A z i m u t
Section 7Net gains (losses) on financial assets and financial liabilitiesat fair value through profit or loss
1. Financial assets 1.1 Debt instruments of which: government securities 1.2. Equity instruments 1.3. UCI units of which: owned UCI 1.4 Loans2. Financial assets and financial liabilities in foreign currency: exchange rate differencesTotal
8,600,243 8,600,243
8,600,243
-24,721 -24,721
-24,721
-394,035 -394,035
-394,035
6,255,491 6,255,491
6,255,491
2,763,509 2,763,509
2,763,509
Items/Income items Netresult
Profits on disposal
Losses on disposal
Gains Losses
7.2 Breakdown of “Net gains (losses) on financial assets and financial liabilities at fair value through profit or loss”: other financial assets mandatorily measured at fair value
Notes to the separatefinancial statements
3.2 Breakdown of “Interest expense and similar charges”
59,609 7,366,890
--
98,932 --
7,525,430
4,066,051 7,805,771
- -
266,035 - -
12,137,857 23,079
7,805,771
X X X
7,805,771
X X
266,035
X 34,948 23,079
4,066,051
X X X
4,066,051
X X X -
1. Financial liabilities at amortised cost 1.1. Payables 1.2. Outstanding securities2. Held-for-trading financial liabilities2. Financial liabilities measured at fair value4. Other liabilities5. Hedging derivatives6. Financial assetsTotalof which: interest expense on lease liabilities
SecuritiesRepurchase agreements
LoansItems/Technical forms Total 31/12/2018
Total 31/12/2019
Other

303
7,951,6145,211,9201,536,709
351,518
851,467-
3,323,281- -
-
11,274,895
6,773,0504,364,6481,064,696
201,678
1,142,027-
2,476,597- -
-
9,249,647
1. Employees a) wages and salaries b) social security c) staff severance pay (TFR) d) pension contributions e) TFR provisions f) accrual to the pension provision and similar obligations: defined contribution defined benefit g) private pension plans: defined contribution defined benefit h) other employee benefits2. Other personnel3. Directors and Statutory Auditors4. Early retirement costs5. Cost recoveries for employees seconded to other companies6. Reimbursed costs for employees seconded to the companyTotal
Total 31/12/2018
Total 31/12/2019
Items/Sectors
21127
40
1464
24
ManagersMiddle managersOffice staffTotal
31/12/201831/12/2019Position
9.2 Average number of employees by category
This item amounts to 24,942,994 euro, down by 584,132 euro on the previous year (25,527,125 euro in 2018).
9.1 Breakdown of item 140.a. “Personnel costs”
The decrease in the average number of employees at 31 December 2019 relates to the transfer of the employees of the control and IT&Operation functions from Azimut Holding S.p.A. to Azimut Capital Management SGR S.p.A..
Section 9Administrative costsItem 140

304 G r u p p o A z i m u t
Notes to the separatefinancial statements
9.3 Breakdown of item 140.b. “Other administrative costs”
Section 11Net impairment losses/reversalsof impairment losses onproperty, plant and equipment Item 160
306,340165,656140,684
306,340
306,340165,656140,684
306,340
1. Business purposes Company-owned Right of use acquired under leases 2. Held for investment purposes Company-owned Right of use acquired under leases Total
AmortisationItems/Impairment losses and reversals Net resultReversals of impairment
losses
Impairmentlosses
11.1 Breakdown of item 160 “Net impairment losses/reversals of impairment losses on property, plant and equipment”
4,211,584 207,582 63,253
701,927 4,214,404 4,853,482
14,252,230
4,717,639 227,487 37,124 2,943,334 6,018,572 1,749,191 15,693,346
Professional services renderedInsurance premiumsIndirect taxesAdvertising, promotion and marketing expensesOutsourcing and EDP servicesExpenses for acquisition of non-professional goods and servicesTotal
31/12/201831/12/2019

305
12.1 Breakdown of item 170 “Net impairment losses/reversals of impairment losses on intangible assets”
This item amounts to 1,096,521 euro (2018: 2,055,543 euro) and mainly includes recharged amounts for coordination and management activities by the Parent Company and other amounts recharged to subsidiaries.
Taxes for the year amount to 2,677,300 euro (positive by 1,830,541 in 2018).
Section 12Net impairmentlosses/reversals of impairment losses on intangible assets Item 170
Section 13Other operating incomeand costs Item 180
Section 18Income tax on profit from continuing operations Item 250
- 833,143 833,143
- 833,143
- 833,143
- 833,143
833,143 -
833,143 -
833,143
- -
- - -
- -
- - -
1. Goodwill2. Other intangible assets 2.1 Group-owned generated internally other (software packages) 2.2 right of use acquired under leases Total
AmortisationItems/Impairment losses and reversals Net resultReversals of impairment
losses
Impairmentlosses
18.1 Breakdown of “Income tax on profit from continuing operations”
734,933
444,738650,870
1,830,541
-1,639,084
-6,720,563 5,682,347
-2,677,300
1. Current taxes2. Changes in current taxes of previous years3. Decrease in current taxes for the year3.bis Decrease in current taxes for the year due to tax credits pursuant to Italian Law No. 214/20114. Change in deferred tax assets 5. Change in deferred tax liabilitiesTotal
Total31/12/2018
Total31/12/2019
Breakdown

306 G r u p p o A z i m u t
This item has a nil balance in 2019 (negative for 1,840,000 in 2018) and relates to the loss due to the sale of the investment in Azimut Global Counseling S.r.l. which was sold to third parties in May 2019.
Section 19Gains (losses) on discontinued operations, net of taxes Item 270
Notes to the separatefinancial statements
18.2 Reconciliation of theoretical and effective tax charge
24.00%24.43%
-1.35%-1.70%-1.92%1.18%
-1.51%-1.29%-3.39%-3.39%5.57%5.57%5.56%5.75%
50,827,629899,550
-55,523,539
-54,310,015-733,333-480,190
6,550,369-5,682,656
468,480-2,719,367
5,226,164
170,194309
5,396,6672,677,300
211,781,787
3,748,124231,348,079
226,291,731
3,055,5562,000,792
27,293,20423,677,733
93,827,0103,055,556
5,557
IRESPre-tax profitTheoretical IRES tax burdenEffect of increases Effect of decreasesOf which: Dividends Trademark amortisation OtherChange in deferred tax assetsChange in deferred tax liabilitiesOther changesIRES tax for the yearIRES effective tax rateIRAP taxable incomeChange in deferred tax assetsChange in deferred tax liabilitiesIRAP tax for the yearTotal income tax for the year
% rateTaxTaxable income2019
Current income taxes for the year mainly refers to IRAP of the year, calculated in accordance with ruling legislation and income from tax consolidation amounting to the taxes receivable and due on taxable income transferred to the Parent Company by the Group’s Italian subsidiaries that have adopted the tax consolidation regime pursuant to Article 117 of Italian Presidential Decree 917/86.

307
Part D - Other information
1.1 Information on commitments, guarantees and third-party assets1.1.1 Commitments and guarantees issued to third parties At 31 December 2019, the Company had commitments to Banco Bpm S.p.A. totalling 1.2 million euro related to sureties issued in favour of the subsidiary Azimut Capital Management sgr S.p.A..No collateral was issued at 31 December 2019.As regards the business activities of AZ Life dac, for as long as there is no change in its shareholding structure, Azimut Holding S.p.A. has made a commitment to the IFSRA (Irish Financial Services Regulatory Authority) to provide the insurance company with the necessary capital in the event that it is unable to meet an adequate solvency margin, in accordance with the relevant regulations.
1.1.4 Own securities deposited with third parties
3.1 Financial risksAs regards financial risks, the Company's proprietary trading is exposed to market risk. Moreover, the financial instruments in question are easily liquidated and are monitored closely, most being mutual fund units managed by the Group companies. As for credit risk, there are no specific problems given the nature of the corporate activity.At 31 December 2019, Azimut Holding S.p.A. held only funds managed by Group companies in its proprietary portfolio as part of liquidity management policies. Details at the reporting date:
Section 1Specific references tobusiness activities
Section 3Information on riskmanagement and hedging policies
93,371,033 15,721,085 9,457,718
20,974,800
15,254,400
154,779,036
439,051,142 10,352,329 15,309,917
34,048,000
-
498,761,388
UCI units deposited with BNP PARIBASUCI units deposited with Banque De Rothschild LuxembourgAzimut Holding S.p.A. treasury shares depositedwith Banco BPN S.p.A.Azimut Holding S.p.A. treasury shares depositedwith BCC Treviglio Azimut Holding S.p.A. treasury shares depositedwith Intesa San PaoloTotal
31/12/201831/12/2019Own securities deposited with third parties
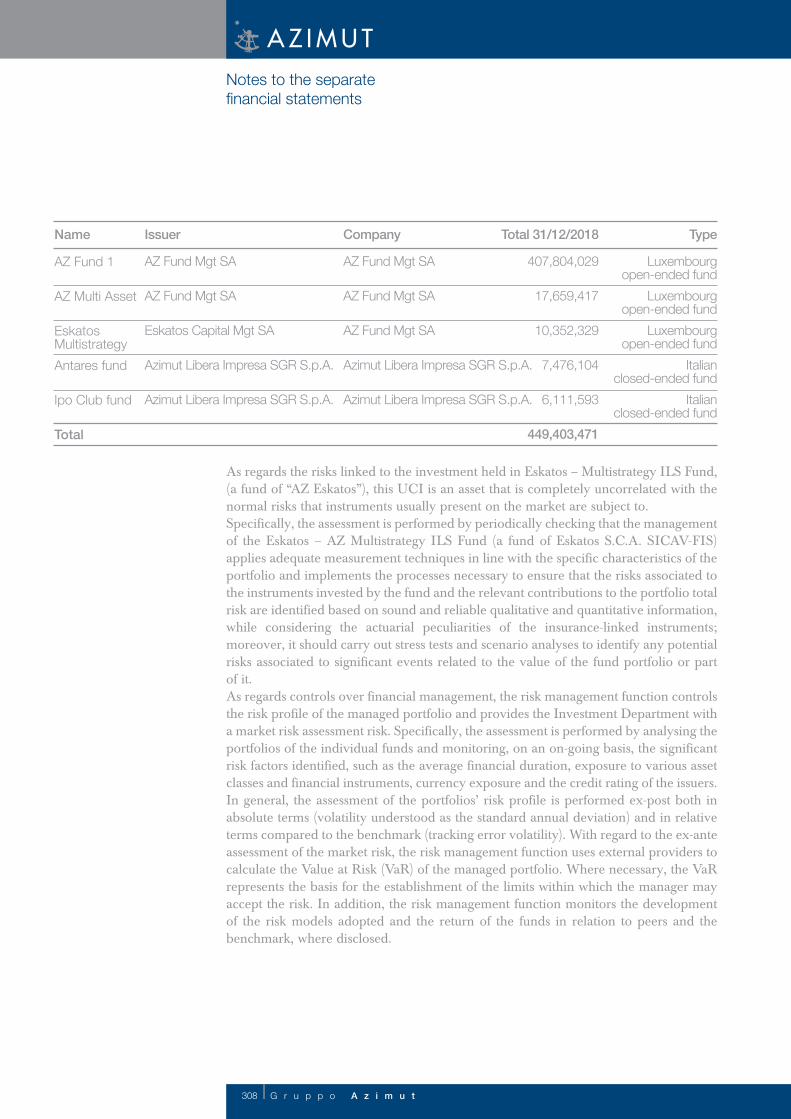
308 G r u p p o A z i m u t
Notes to the separatefinancial statements
As regards the risks linked to the investment held in Eskatos – Multistrategy ILS Fund, (a fund of “AZ Eskatos”), this UCI is an asset that is completely uncorrelated with the normal risks that instruments usually present on the market are subject to.Specifically, the assessment is performed by periodically checking that the management of the Eskatos – AZ Multistrategy ILS Fund (a fund of Eskatos S.C.A. SICAV-FIS) applies adequate measurement techniques in line with the specific characteristics of the portfolio and implements the processes necessary to ensure that the risks associated to the instruments invested by the fund and the relevant contributions to the portfolio total risk are identified based on sound and reliable qualitative and quantitative information, while considering the actuarial peculiarities of the insurance-linked instruments; moreover, it should carry out stress tests and scenario analyses to identify any potential risks associated to significant events related to the value of the fund portfolio or part of it.As regards controls over financial management, the risk management function controls the risk profile of the managed portfolio and provides the Investment Department with a market risk assessment risk. Specifically, the assessment is performed by analysing the portfolios of the individual funds and monitoring, on an on-going basis, the significant risk factors identified, such as the average financial duration, exposure to various asset classes and financial instruments, currency exposure and the credit rating of the issuers.In general, the assessment of the portfolios’ risk profile is performed ex-post both in absolute terms (volatility understood as the standard annual deviation) and in relative terms compared to the benchmark (tracking error volatility). With regard to the ex-ante assessment of the market risk, the risk management function uses external providers to calculate the Value at Risk (VaR) of the managed portfolio. Where necessary, the VaR represents the basis for the establishment of the limits within which the manager may accept the risk. In addition, the risk management function monitors the development of the risk models adopted and the return of the funds in relation to peers and the benchmark, where disclosed.
AZ Fund Mgt SA
AZ Fund Mgt SA
Eskatos Capital Mgt SA
Azimut Libera Impresa SGR S.p.A.
Azimut Libera Impresa SGR S.p.A.
AZ Fund Mgt SA
AZ Fund Mgt SA
AZ Fund Mgt SA
Azimut Libera Impresa SGR S.p.A.
Azimut Libera Impresa SGR S.p.A.
Luxembourgopen-ended fund
Luxembourgopen-ended fund
Luxembourgopen-ended fund
Italianclosed-ended fund
Italianclosed-ended fund
407,804,029
17,659,417
10,352,329
7,476,104
6,111,593
449,403,471
AZ Fund 1 AZ Multi Asset EskatosMultistrategyAntares fund Ipo Club fund
Total
Name Total 31/12/2018Issuer Company Type

309
Section 4Information onshareholders' equity
3.2 Operational risksQualitative informationThis form of risk includes those that are typical of the various business operating procedures.The risk management function “maps out” the risks in the broader framework of its own activities, preparing and constantly maintaining an up-to-date database of the risks identified. This is then discussed by the Internal Control and Risk Management Committee, which analyses the risks at Group level. Activities which show significant risk values are analysed and assessed by this Committee and, if required, the necessary action is subsequently taken.
4.1 Company shareholders’ equity4.1.1 Qualitative informationFor information on the individual shareholders’ equity items, please refer to Part B of these notes.

310 G r u p p o A z i m u t
Notes to the separatefinancial statements
32,324,092 173,986,915 228,849,253
6,464,818
202,871,338 19,513,097
-46,336,578 93,113
-
93,113
36,000,000 186,332,579 611,249,374
32,324,092 173,986,915 180,038,679
6,464,818
174,060,764 -486,903
-23,712,795 11,190
-
11,190
36,000,000 209,104,487
607,752,568
1. Share capital2. Share premium reserve3. Reserves income-related a) legal b) statutory c) treasury shares d) other other4. (Treasury shares)5. Valuation reserves Financial assets at fair value through other comprehensive income Property, plant and equipment Intangible assets Foreign investment hedge Cash flow hedge Exchange rate differences Non-current assets held for sale and discontinued operations Special revaluation laws Actuarial gains/losses on defined benefit plans Share of valuation reserves for investments measured at equity6. Equity instruments7. Profit (loss) for the yearTotal
Items/Value Total 31/12/2018
Total 31/12/2019
4.1.2 Quantitative information4.1.2.1 Company shareholders’ equity: breakdown

311
186,332,579 57,977
57,977
209,104,487 (81,923)
(81,923)
10. Profit (loss) for the year Other comprehensive income not transferred to profit or loss20. Equity instruments at fair value through other comprehensive income: a) changes in fair value b) transfers to other equity items30. Financial liabilities designated at fair value through profit or loss (change in credit rating) a) changes in fair value b) transfers to other equity items40. Hedges of equity instruments at fair value through other comprehensive income: a) changes in fair value (hedged item) changes in fair value (hedging instrument)50. Property, plant and equipment60. Intangible assets70. Defined benefit plans80. Non-current assets held for sale and discontinued operations90. Share of valuation reserves of investments measured at equity100. Income taxes on other comprehensive income not transferred to profit or lossOther comprehensive income transferred to profit or loss110. Foreign investment hedge: a) changes in fair value b) transfer to profit or loss c) other changes120. Exchange rate differences: a) changes in fair value b) transfer to profit or loss c) other changes130. Cash flow hedge: a) changes in fair value b) transfer to profit or loss c) other changes140. Hedging instruments (non-designated items) a) changes in fair value b) transfer to profit or loss c) other changes
31/12/201831/12/2019Items
Section 5Statement ofcomprehensive income

312 G r u p p o A z i m u t
57,977186,390,556 186,390,556
(81,923)209,022,564 209,022,564
150. Financial assets (other than equity instruments) at fair value through other comprehensive income: a) changes in carrying amount b) transfer to profit or loss credit risk adjustments profits/losses on disposal c) other changes160. Non-current assets held for sale and discontinued operations: a) changes in fair value b) transfer to profit or loss c) other changes170. Share of valuation reserves of investments measured at equity: measured at equity: a) changes in fair value b) transfer to profit or loss impairment losses profits/losses on disposal c) other changes180. Income taxes on other comprehensive income transferred to profit or loss190. Total other comprehensive income (expense)200. Comprehensive income (Items 10+190)200. Consolidated comprehensive income attributable to the parent company
6.1 Information on key management feesAt 31 December 2019, directors' fees amounted to 2,141,897 euro and the fees for the Board of Statutory Auditors members stood at 264,069 euro.The Board of Directors is composed of 12 members. The Board of Statutory Auditors has three standing members.
6.2 Related-party disclosuresRelated-party transactions refer exclusively to commercial transactions carried out by Azimut Holding S.p.A. with its subsidiaries in 2019. These transactions are part of the Group’s ordinary operations and are conducted on an arm’s length basis. The most important commercial transactions are described below:• for use of the trademark, the subsidiary Azimut Capital Management SGR S.p.A.
pays Azimut Holding S.p.A. annual royalties totalling 2,000,000 euro, established by contract;
• Azimut Holding S.p.A., as the Parent Company, Azimut Capital Management Sgr S.p.A., Azimut Financial Insurance S.p.A., Azimut Enterprises S.r.l. and Azimut Libera Impresa Sgr S.p.A., as subsidiaries, have adopted the tax consolidation regime;
Section 6Related-party transactions
Notes to the separatefinancial statements
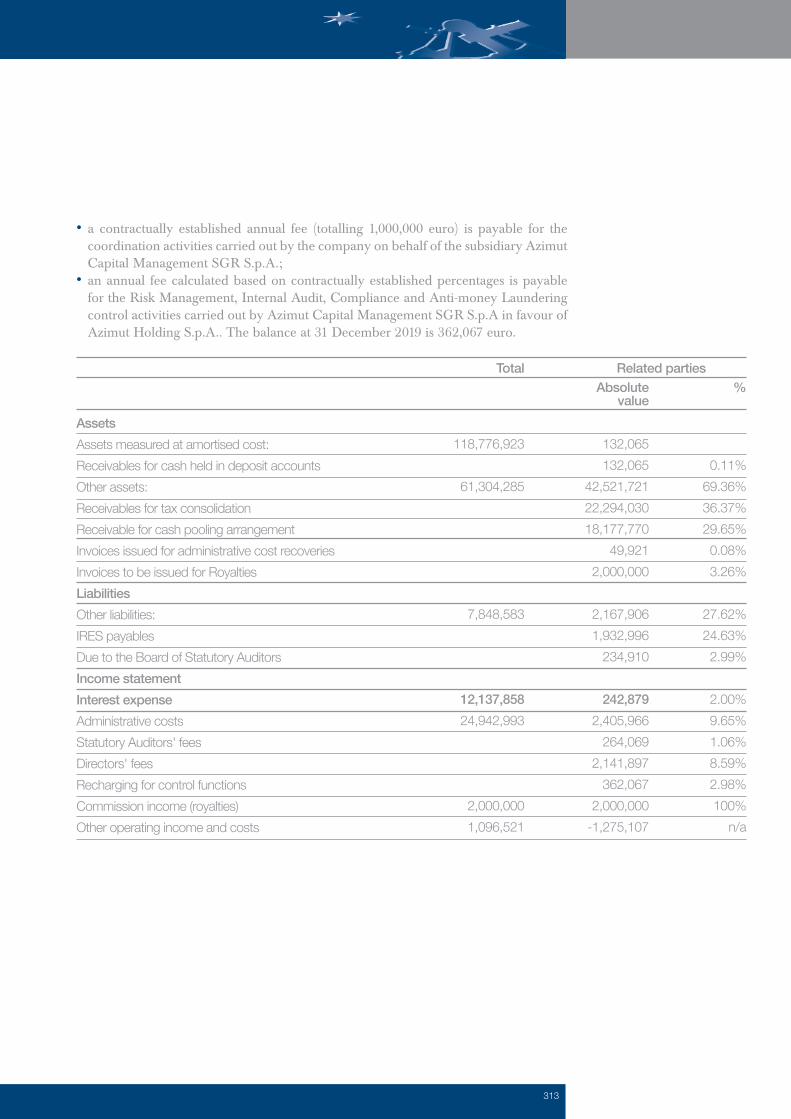
313
AssetsAssets measured at amortised cost:Receivables for cash held in deposit accountsOther assets:Receivables for tax consolidationReceivable for cash pooling arrangementInvoices issued for administrative cost recoveriesInvoices to be issued for RoyaltiesLiabilitiesOther liabilities:IRES payablesDue to the Board of Statutory AuditorsIncome statementInterest expenseAdministrative costs Statutory Auditors' feesDirectors' feesRecharging for control functionsCommission income (royalties)Other operating income and costs
0.11%69.36%36.37%29.65%0.08%3.26%
27.62%24.63%2.99%
2.00%9.65%1.06%8.59%2.98%100%
n/a
132,065132,065
42,521,72122,294,03018,177,770
49,9212,000,000
2,167,9061,932,996
234,910
242,879 2,405,966
264,0692,141,897
362,0672,000,000
-1,275,107
118,776,923
61,304,285
7,848,583
12,137,858 24,942,993
2,000,000 1,096,521
%Absolutevalue
Total Related parties
• a contractually established annual fee (totalling 1,000,000 euro) is payable for the coordination activities carried out by the company on behalf of the subsidiary Azimut Capital Management SGR S.p.A.;
• an annual fee calculated based on contractually established percentages is payable for the Risk Management, Internal Audit, Compliance and Anti-money Laundering control activities carried out by Azimut Capital Management SGR S.p.A in favour of Azimut Holding S.p.A.. The balance at 31 December 2019 is 362,067 euro.

314 G r u p p o A z i m u t
This section provides the information required to the lessee by IFRS 16 which has not been already included in other sections of these consolidated financial statements.
Qualitative information This item provides the qualitative information required by paragraph 60 of IFRS 16. The costs of leases where the underlying asset has a low value (i.e., below 5,000 euro) and the term is 12 months or less are recognised under “Other administrative costs” in the income statement. These costs coincide with the invoice related to the lease payment of the period (quarterly or monthly). The costs relating to these contracts, which mainly refer to IT devices/cars/offices, will continue to be recognised in the income statement as operating costs. Quantitative information In 2019, there were no cost of leases where the term is 12 months or less and no cost of leases where the underlying asset has a low value.The specific notes to the balance sheet and the income statement provide information about the right-of-use assets acquired as part of the leases.
8.1 Dividends paidThe unit dividend for 2019 amounted to 1.2 euro per ordinary share and was paid in May 2019 in cash. Treasury shares were assigned in the ratio of one treasury share every 56 shares held.
8.2 Significant non-recurring events and transactionsDuring the year, Azimut Holding S.p.A. did not carry out non-recurring equity transactions that were not disclosed in these notes.There were no atypical and/or unusual transactions.
8.3 Audit and non-audit service feesPursuant to Article 149-duodecies of Consob Regulation No. 11971/99 and subsequent amendments and supplements, the breakdown of fees (net of VAT and expenses) due to the independent auditors and companies within its network for auditing and non-auditing services during 2019 is as follows:
Section 7Leases
Section 8Other information
Notes to the separatefinancial statements

315
AuditTax services for compliance stampCertification servicesOther servicesTotal
106,7914,500
87,59740,200
239,088
PricewaterhouseCoopers S.p.A.PricewaterhouseCoopers S.p.A.PricewaterhouseCoopers S.p.A. (**)PricewaterhouseCoopers S.p.A. (*)
Service Fees(Euro)
Serviceprovider
(*) This amount includes the limited assurance on the non-financial statement prepared in accordance with ruling legislation and included in the management report.(**) This amount mainly includes the fees related to the comfort letter for the convertible bond issue (52 thousand euro) and the certification services (35 thousand euro) related to the review of the condensed consolidated interim financial statements of Azimut Holding S.p.A..
On behalf of the Board of DirectorsChief Executive Officer (Gabriele Blei)

316 G r u p p o A z i m u t

317
Annexes

318 G r u p p o A z i m u t
Annex A
Equity investments
3,239,925
10,012,150
330,438,190
350,948,358
35,237,786
6,423,758
13,458,687
51%
100%
100%
100%
100%
100%
100%
51%
100%
100%
100%
100%
100%
100%
Luxembourg
Ireland
Milan
Luxembourg
Milan
Milan
Milan
Carrying amountat 31/12/2019
Stake Votingrights
Registered office
Name AssetsA. Wholly-owned subsidiaries
AZ Fund Management SA
Mutual funds
AZ Life Dac
Life insurance
Azimut Capital Management SGR S.p.A.
Mutual and speculative funds management
AZ International Holdings SA
Equity investment management
Azimut Enterprises Holding S.r.l.
Service provider
Azimut Libera Impresa SGR S.p.A.
Mutual funds
Azimut Financial Insurance S.p.A.
Insurance agent and distribution of bank products

319
Totalassets
Totalincome
Profit (loss) for the most recent year
ListedShareholders’ equity
134,272,823
6,263,428,067
429,407,280
318,246,212
32,496,266
6,435,725
98,843,472
641,721,563
117,616,241
505,625,481
2,737,844
97,322
5,499,970
77,988,420
268,659,999
155,484,554
236,344,546
345,232,600
32,388,505
2,768,245
67,645,857
325,428,483
32,682,256
143,553,036
-6,694,312
-998,550
-1,104,140
51,501,461
NO
NO
NO
NO
NO
NO
NO
On behalf of the Board of DirectorsChief Executive Officer (Gabriele Blei)

320 G r u p p o A z i m u t
Azimut Holding S.p.A.
Azimut Holding S.p.A.Azimut Capital Management SGR S.p.A.Azimut Financial Insurance S.p.A.
Azimut Holding S.p.A.
Azimut Holding S.p.A.
Azimut Holding S.p.A.
Azimut Holding S.p.A.
Azimut Holding S.p.A.
AZ International Holdings SA
An Zhong (AZ) Investment Management
An Zhong (AZ) Investment Management Hong Kong Ltd
AZ International Holdings SA
CGM – Azimut Monaco
AZ International Holdings SA
AZ Swiss & Partners SA
AZ International Holdings SA
Katarsis Capital Advisors SA
AZ International Holdings SA
AZ Sinopro Financial Planning Ltd
AZ Sinopro Investment Planning Ltd
AZ International Holdings SA
AZ International Holdings SA
AZ Brasil Holdings Ltda
AZ Quest Participações SA
AZ Brasil Holdings Ltda
Azimut Brasil Wealth Management Holding S.A.
Azimut Brasil Wealth Management Holding S.A.
Azimut Brasil Wealth Management Holding S.A.
AZ Brasil Holdings Ltda
Futurainvest Holding SA
Annex B
Statement of significant equity investments pursuant to Article 125 of Consob regulation No. 11971/1999Reporting date: 31 December 2019
1. Azimut Capital Management SGR S.p.A.
2. AZ Fund Management SA
3. AZ Life DAC
4. Azimut Enterprises S.r.l.
5. Azimut Libera Impresa SGR S.p.A.
6. Azimut Financial Insurance S.p.A.
7. AZ International Holdings S.A.
8. An Zhong (AZ) Investment Management
9. An Zhong (AZ) Investment Management Hong Kong Ltd
10. AZ Investment Management (Shanghai) Co. Ltd.
11. CGM – Azimut Monaco
12. CGM Italia SGR S.p.A.
13. AZ Swiss & Partners SA
14. SDB Financial Solutions SA
15. Katarsis Capital Advisors SA
16. Eskatos Capital Management Sarl
17. AZ Sinopro Financial Planning Ltd
18. AZ Sinopro Investment Planning Ltd
19. AZ Sinopro Insurance Planning Ltd
20. AZ Investment Management Singapore Ltd
21. AZ Brasil Holdings Ltda
22. AZ Quest Participações SA
23. AZ Quest Investimentos Ltda
24. Azimut Brasil Wealth Management Holding S.A.
25. M&O Consultoria, Planejamento e Análise de Valores Mobiliários Ltda
26. Futurainvest Investimentos e Participações Ltda
27. Azimut Brasil Wealth Management Ltda
28. Futurainvest Holding SA
29. Azimut Brasil DTVM Ltda
Italy
Luxembourg
Ireland
Italy
Italy
Italy
Luxembourg
Hong Kong
Hong Kong
Shanghai
Monaco
Italy
Switzerland
Switzerland
Switzerland
Luxembourg
Taiwan
Taiwan
Taiwan
Singapore
Brazil
Brazil
Brazil
Brazil
Brazil
Brazil
Brazil
Brazil
Brazil
100
513019
100
100
100
100
100
100
100
100
100
100
51
51
100
100
51
51
51
100
99.9
62.69
62.69
89.43
89.43
89.43
71.66
99.9
99.9
Direct
DirectIndirectIndirect
Direct
Direct
Direct
Direct
Direct
Indirect
Indirect
Indirect
Indirect
Indirect
Indirect
Indirect
Indirect
Indirect
Indirect
Indirect
Indirect
Indirect
Indirect
Indirect
Indirect
Indirect
Indirect
Indirect
Indirect
Indirect
Indirect
Name Country Type of ownership
Shareholder
Stake
% stake

321
30. Azimut Portföy Yönetimi A.Ş.
31. AZ Mexico Holdings S.A. de CV
32. Mas Fondos S.A.
33. AZ Next Generation Advisory PTY Ltd
34. Eureka Whittaker Macnaught PTY Ltd
35. Pride Advice PTY Ltd
36. Lifestyle Financial Planning Services (LFPS) PTY Ltd
37. Eureka Financial Group PTY Ltd
38. Pride Financial PTY Ltd
39. Wise Planners PTY Ltd
40. Domane Financial Advisers PTY LTD
41. Financial Lifestyle Partners PTY Ltd
42. Harvest Wealth PTY Ltd
43. RI Toowoomba PTY Ltd
44. Empowered Financial Partners PTY Ltd
45. Wealthwise PTY Ltd
46. Priority Advisory Group PTY Ltd
47. Sterling Planners PTY Ltd
48. Logiro Unchartered PTY Ltd
49. Aspire Pty Ltd
50. On-Track Financial Solutions Pty Ltd
51. AZ Sestante Ltd
52. Pride SMSF PTY Ltd
53. Priority Advisory Trust
54. Priority Lifestile Advice Pty Ltd
55. Peters & Partners PTY Ltd
56. Menico Tuck Parrish Financial Solution Pty Ltd
57. AZ Next Generation Accounting PTY Ltd
58. Azimut (DIFC) Limited (formerly AZ New Horizon Ltd)
59. Wealthmed Australia Pty Ltd
60. Wealthmed Accounting Pty Ltd
61. Wealthmed Property Pty Ltd
62. Farrow Hughes Mulcahy Financial Services Pty Ltd
63. Menico Tuck Parish Pty Ltd
64. Henderson Maxwel No.2 Pty Ltd
Turkey
Mexico
Mexico
Australia
Australia
Australia
Australia
Australia
Australia
Australia
Australia
Australia
Australia
Australia
Australia
Australia
Australia
Australia
Australia
Australia
Australia
Australia
Australia
Australia
Australia
Australia
Australia
Australia
United Arab Emirates
Australia
Australia
Australia
Australia
Australia
Australia
100
100
100
58.44
58.44
58.44
58.44
58.44
58.44
58.44
58.44
58.44
58.44
58.44
58.44
58.44
58.44
58.44
58.44
58.44
58.44
100
58.44
58.44
29.2229.22
58.82
58.44
58.44
100
58.44
58.44
58.44
58.44
58.44
58.44
AZ International Holdings SA
AZ International Holdings SA
AZ Mexico Holdings S.A. de CV
AZ International Holdings SA
AZ Next Generation Advisory PTY Ltd
AZ Next Generation Advisory PTY Ltd
AZ Next Generation Advisory PTY Ltd
AZ Next Generation Advisory PTY Ltd
AZ Next Generation Advisory PTY Ltd
AZ Next Generation Advisory PTY Ltd
Wise Planners PTY Ltd
AZ Next Generation Advisory PTY Ltd
AZ Next Generation Advisory PTY Ltd
AZ Next Generation Advisory PTY Ltd
AZ Next Generation Advisory PTY Ltd
AZ Next Generation Advisory PTY Ltd
AZ Next Generation Advisory PTY Ltd
AZ Next Generation Advisory PTY Ltd
AZ Next Generation Advisory PTY Ltd
Logiro Unchartered PTY Ltd
AZ Next Generation Advisory PTY Ltd
AZ International Holdings SA
Pride Financial Pty Ltd
Priority Advisory Group PTY Ltd
Wise Planners Pty LtdPriority Advisory Group Pty Ltd
AZ Next Generation Advisory Accounting PTY Ltd
AZ Next Generation Advisory PTY Ltd
AZ Next Generation Advisory PTY Ltd
AZ International Holdings SA
AZ Next Generation Advisory PTY Ltd
Wealthmed Australia Pty Ltd
Wealthmed Australia Pty Ltd
AZ Next Generation Advisory PTY Ltd
AZ Next Generation Advisory PTY Ltd
AZ Next Generation Advisory PTY Ltd
Indirect
Indirect
Indirect
Indirect
Indirect
Indirect
Indirect
Indirect
Indirect
Indirect
Indirect
Indirect
Indirect
Indirect
Indirect
Indirect
Indirect
Indirect
Indirect
Indirect
Indirect
Indirect
Indirect
Indirect
IndirectIndirect
Indirect
Indirect
Indirect
Indirect
Indirect
Indirect
Indirect
Indirect
Indirect
Indirect
Name Country Type of ownership
Shareholder
Stake
% stake

322 G r u p p o A z i m u t
65. Henderson Maxwell Financial Planning Pty Ltd
66. Henderson Maxwell Accounting Pty Ltd
67. Herwitz Geller Pty Ltd
68. Dunsford Financial Plannings Pty Ltd
69. BRM Holdich
70. Nextstep Financial Services Pty Ltd
71. Next Steps Home Loans Pty Ltd
72. Rit Coastal
73. MP Holdings WA
74. Sage Business Group Pty Ltd
75. PM Financial Services Pty Ltd
76. MP Wealth WA Pty Ltd
77. PT Services WA Pty Ltd
78. MPM Finance Pty Ltd
79. MPM Specialist Finance Pty Ltd
80. Spencer Fuller & Associates
81. Spencer Fuller Lending Solutions Pty Ltd
82. Kellaway Cridland Pty Ltd
83. AZ US Holding Inc.
84. AZ Apice Capital Management LLC
85. AZ Andes SA
86. Azimut (ME) Limited
87. Rasmala Egypt Asset Management (now Azimut Egypt Asset Management)
88. Azimut Alternative Capital Partners LLC
89. Tempus Wealth Group Pty Ltd
90. AZ Industry & Innovation S.r.l. in liquidation
91. Programma 101 Sicaf S.p.A.
92. Siamosoci S.r.l.
93. Cofircont Compagnia Fiduciaria S.r.l.
94. Club Italia 2 Investimenti S.p.A.
95. Sterling Planners WA
96. Mofid Entekhab Asset Management
97. Gellify
Australia
Australia
Australia
Australia
Australia
Australia
Australia
Australia
Australia
Australia
Australia
Australia
Australia
Australia
Australia
Australia
Australia
Australia
United States
United States
Chile
United Arab Emirates
Egypt
United States
Australia
Italy
Italy
Italy
Italy
Italy
Australia
Iran
Italy
58.44
58.44
58.44
58.44
58.44
58.44
58.44
58.44
58.44
58.44
58.44
58.44
58.44
58.44
58.44
58.44
58.44
58.44
100
74.69
100
100
100
96.5
58.44
40
22.49
22.1
30
16.12
29.2
20.0
10.2
Henderson Maxwel No.2 Pty Ltd
Henderson Maxwel No.2 Pty Ltd
AZ Next Generation Accounting Pty Ltd
AZ Next Generation Advisory PTY Ltd
AZ Next Generation Accounting Pty Ltd
Sterling Planners Pty Ltd
Nextstep Financial Services Pty Ltd
AZ Next Generation Accounting Pty Ltd
AZ Next Generation Advisory Pty Ltd
AZ Next Generation Accounting Pty Ltd
MP Holdings WA
MP Holdings WA
MP Holdings WA
MP Holdings WA
MP Holdings WA
NGA Next Generation Advisory Ltd
Spencer Fuller & Associates
AZ Next Generation Advisory Pty Ltd
AZ International Holdings SA
AZ US Holding Inc.
AZ International Holdings SA
AZ International Holdings SA
AZ International Holdings SA
AZ US Holding Inc.
NGA Next Generation Advisory Ltd
Azimut Holding S.p.A.
Azimut Enterprises S.r.l.
Azimut Enterprises S.r.l.
Azimut Enterprises S.r.l.
Azimut Enterprises S.r.l.
Sterling Planners Pty Ltd
AZ International Holdings SA
Azimut Enterprises S.r.l.
Indirect
Indirect
Indirect
Indirect
Indirect
Indirect
Indirect
Indirect
Indirect
Indirect
Indirect
Indirect
Indirect
Indirect
Indirect
Indirect
Indirect
Indirect
Indirect
Indirect
Indirect
Indirect
Indirect
Indirect
Indirect
Direct
Indirect
Indirect
Indirect
Indirect
Indirect
Indirect
Indirect
Name Country Type of ownership
Shareholder
Stake
% stake

323
Certification of the separate financial statements pursuant to Article 81-ter of Consob regulation no. 11971 of 14 May 1999 and subsequent amendments and supplements
1. The undersigned, Gabriele Blei, Chief Executive Officer, and Alessandro Zambotti, manager in charge of financial reporting of Azimut Holding S.p.A., hereby represent, having also taken into account the provisions of Article 154-bis, paragraphs 3 and 4 of Italian Legislative Decree No. 58 of 24 February 1998:
• the adequacy in view of the nature of the business and • the effective application of the administrative and accounting procedures used for the preparation of
the 2019 separate financial statements.
2. The evaluation of the adequacy of the administrative and accounting procedures for the preparation of the separate financial statements at 31 December 2019 is based on a process designed by Azimut Holding S.p.A. in line with the Internal Control – Integrated Framework model issued by the Committee of Sponsoring Organisations of the Treadway Commission (COSO), an internationally accepted reference framework.
3. The undersigned also represent that: 3.1 the separate financial statements at 31 December 2019: • were prepared in accordance with the International Financial Reporting Standards endorsed by the European Commission pursuant to Regulation (EC) 1606/2002 of the European Parliament and Council, of 19 July 2002; • are consistent with the accounting books and records; • give a true and fair view of the financial position and results of operations of the issuer;
3.2 the management report contains a reliable analysis of the operating performance and results, in addition to the position of the issuer, and a description of the main risks and uncertainties to which it is exposed.
Milan, 5 March 2020
Chief Executive Officer(Gabriele Blei)
Manager in charge of financial reporting(Alessandro Zambotti)