Embed Size (px)
Citation preview

Consolidated Financial Section 2021
Contents
Consolidated Balance Sheet P. 1Consolidated Statement of Income P. 3Consolidated Statement of Comprehensive Income P. 4Consolidated Statement of Changes in Equity P. 5Consolidated Statement of Cash Flows P. 6Notes to Consolidated Financial Statements P. 7
Note:Consolidated Financial Section contains audited English-language financial statements in which certain items have been changed for the convenience of overseas readers.

1
Millions of YenThousands of
U.S. Dollars (Note 1)
2021 2020 2021
ASSETS
CURRENT ASSETS:
Cash and cash equivalents (Notes 7 and 18) ¥ 198,760 ¥ 159,902 $ 1,795,321
Money held in trust (Note 18) 13,500 14,000 121,940
Marketable securities (Notes 5, 7 and 18) 1,503 4,029 13,576
Short-term investments (Note 18) 233 28 2,105
Notes and accounts receivable (Note 18):
Construction contracts 40,628 64,630 366,977
Other 11,253 11,827 101,644
Total receivables 51,881 76,457 468,621
Operating loans (Note 18) 120,980 127,592 1,092,765
Inventories (Notes 7 and 8) 23,918 16,428 216,042
Prepaid expenses—whole-building lease and other expenses (Note 23)
70,238 69,187 634,432
Other current assets 26,697 23,464 241,143
Allowance for doubtful accounts (594) (482) (5,365)
Total current assets 507,116 490,605 4,580,580
PROPERTY, PLANT AND EQUIPMENT (Notes 9 and 17):
Land (Note 7) 76,200 76,432 688,285
Buildings and structures (Note 7) 106,034 101,676 957,764
Machinery and equipment 49,249 49,044 444,847
Furniture and fixtures 9,214 9,416 83,226
Lease assets (Note 17) 6,153 6,723 55,577
Total 246,850 243,291 2,229,699
Accumulated depreciation (74,705) (67,987) (674,781)
Net property, plant and equipment 172,145 175,304 1,554,918
INVESTMENTS AND OTHER ASSETS:
Investment securities (Notes 5 and 18) 31,397 27,995 283,597
Subordinated bonds and subordinated trust beneficiary right (Notes 6 and 18)
9,384 10,643 84,762
Investments in associated companies (Note 18) 17,341 17,805 156,634
Goodwill (Note 23) 12,225 1,043 110,424
Intangible assets 26,837 27,240 242,408
Guarantee deposits (Note 7) 27,808 29,023 251,179
Deferred tax assets (Note 14) 93,322 83,234 842,941
Other assets 27,501 22,524 248,405
Allowance for doubtful accounts (Note 6) (5,621) (5,127) (50,772)
Total investments and other assets 240,194 214,380 2,169,578
TOTAL ¥ 919,455 ¥ 880,289 $ 8,305,076
Consolidated Balance SheetDaito Trust Construction Co., Ltd. and Consolidated SubsidiariesMarch 31, 2021

2
Millions of YenThousands of
U.S. Dollars (Note 1)
2021 2020 2021
LIABILITIES AND EQUITY
CURRENT LIABILITIES:
Short-term bank loans (Notes 7 and 10) ¥ 690 ¥ — $ 6,232
Current portion of long-term bank loans (Notes 7, 10 and 18) 12,444 21,640 112,402
Current portion of bonds 140 — 1,265
Current portion of long-term lease obligations (Note 17) 193 211 1,743
Accounts payable (Note 18) 27,580 54,760 249,119
Advance s received—construction contracts 40,815 40,259 368,666
Income taxes payable (Note 18) 22,494 30,082 203,179
Advances received—whole-building lease and other (Note 23) 94,867 89,571 856,896
Accrued employees' bonuses 20,372 14,131 184,012
Deposits received (Note 18) 10,404 10,004 93,975
Other current liabilities 69,068 57,861 623,865
Total current liabilities 299,067 318,519 2,701,354
LONG-TERM LIABILITIES:
Long-term bank loans (Notes 7,10 and 18) 83,345 61,110 752,823
Bonds 130 — 1,174
Long-term lease obligations (Note 17) 362 515 3,270
Liability for retirement benefits (Note 11) 14,847 15,229 134,107
Provision for repair of whole-building lease system (Notes 3 and 23)
169,780 151,863 1,533,556
Deposits received for guarantee (Note 18) 32,212 33,645 290,958
Other long-term liabilities 11,505 13,247 103,921
Total long-term liabilities 312,181 275,609 2,819,809
EQUITY (Note 12) :
Common stock—authorized,329,541 thousand shares; issued, 68,918 thousand shares in 2021 and 68,918 thousand shares in 2020
29,061 29,061 262,497
Capital surplus 34,541 34,541 311,995
Stock acquisition rights (Note 13) 389 483 3,514
Retained earnings 266,899 243,349 2,410,794
Treasury stock—at cost, 872 thousand shares in 2021 and 485 thousand shares in 2020
(15,352) (11,021) (138,669)
Accumulated other comprehensive income:
Unrealized gain on available-for-sale securities 3,636 767 32,843
Deferred gain on derivatives under hedge accounting 267 258 2,411
Land revaluation surplus (7,584) (7,584) (68,503)
Foreign currency translation adjustments (5,807) (3,842) (52,452)
Defined retirement benefit plans (1,927) (3,012) (17,406)
Total 304,123 283,000 2,747,024
Noncontrolling interests 4,084 3,161 36,889
Total equity 308,207 286,161 2,783,913
TOTAL ¥ 919,455 ¥ 880,289 $ 8,305,076
See notes to consolidated financial statements.

3
Daito Trust Construction Co., Ltd. and Consolidated SubsidiariesYear Ended March 31, 2021
Consolidated Statement of Income
Millions of YenThousands of
U.S. Dollars (Note 1)
2021 2020 2021
NET SALES:
Construction contracts (Note 3) ¥ 401,710 ¥ 551,104 $ 3,628,489
Real estate 1,014,262 973,694 9,161,431
Other 72,943 61,495 658,865
Total net sales 1,488,915 1,586,293 13,448,785
COST OF SALES:
Construction contracts 297,239 391,992 2,684,843
Real estate 905,183 874,962 8,176,163
Other 47,628 36,875 430,205
Total cost of sales 1,250,050 1,303,829 11,291,211
Gross profit 238,865 282,464 2,157,574
SELLING, GENERAL AND ADMINISTRATIVE EXPENSES (Note 15) 152,127 154,507 1,374,104
Operating income 86,738 127,957 783,470
OTHER INCOME (EXPENSES):
Interest and dividend income 575 705 5,194
Interest expense (Note 10) (290) (211) (2,619)
Other—net (Note 16) 3,747 4,564 33,845
Other income—net 4,032 5,058 36,420
INCOME BEFORE INCOME TAXES 90,770 133,015 819,890
INCOME TAXES (Note 14) :
Current 40,781 51,572 368,359
Deferred (12,378) (9,272) (111,806)
Total income taxes 28,403 42,300 256,553
NET INCOME 62,367 90,715 563,337
NET INCOME ATTRIBUTABLE TO NONCONTROLLING INTERESTS 81 334 732
NET INCOME ATTRIBUTABLE TO OWNERS OF THE PARENT ¥ 62,286 ¥ 90,381 $ 562,605
Yen U.S. Dollars
PER SHARE OF COMMON STOCK (Note 21) :
Basic net income ¥ 909.31 ¥ 1,306.71 $ 8.21
Diluted net income 908.84 1,305.77 8.21
Cash dividends applicable to the year 455.00 653.00 4.11
See notes to consolidated financial statements.

4
Daito Trust Construction Co., Ltd. and Consolidated SubsidiariesYear Ended March 31, 2021
Consolidated Statement of Comprehensive Income
Millions of YenThousands of
U.S. Dollars (Note 1)
2021 2020 2021
NET INCOME ¥ 62,367 ¥ 90,715 $ 563,337
OTHER COMPREHENSIVE INCOME (Note 20) :
Unrealized gain (loss) on available-for-sale securities 2,869 (5,720) 25,915
Deferred gain on derivatives under hedge accounting 9 36 81
Foreign currency translation adjustments (1,965) (634) (17,749)
Defined retirement benefit plans 1,082 (14) 9,773
Total other comprehensive income (loss) 1,995 (6,332) 18,020
COMPREHENSIVE INCOME ¥ 64,362 ¥ 84,383 $ 581,357
TOTAL COMPREHENSIVE INCOME ATTRIBUTABLE TO:
Owners of the parent ¥ 64,283 ¥ 84,040 $ 580,643
Noncontrolling interests 79 343 714
See notes to consolidated financial statements.

5
Consolidated Statement of Changes in EquityDaito Trust Construction Co., Ltd. and Consolidated SubsidiariesYear Ended March 31, 2021
Thousands Millions of Yen
Accumulated Other Comprehensive Income
Number of Shares of
Common Stock Outstanding
Common Stock
Capital Surplus
Stock Acquisition
RightsRetained Earnings
Treasury Stock
Unrealized Gain on Available-
for-Sale Securities
Deferred Gain on Derivatives under Hedge Accounting
Land Revaluation
Surplus
Foreign Currency
Translation Adjustments
Defined Retirement
Benefit Plans Total
Noncontrolling Interests Total Equity
BALANCE, APRIL 1, 2019 ¥ 72,168 ¥ 29,061 ¥ 34,541 ¥ 492 ¥ 297,952 ¥ (55,566) ¥ 6,487 ¥ 222 ¥ (7,584) ¥ (3,208) ¥ (2,989) ¥ 299,408 ¥ 2,890 ¥ 302,298
Net income attributable to owners of the parent 90,381 90,381 90,381
Cash dividends, ¥617 per share (43,620) (43,620) (43,620)
Purchase of treasury stock (4,229) (59,941) (59,941) (59,941)
Disposal of treasury stock 248 (125) 3,245 3,120 3,120
Retirement of treasury stock (101,241) 101,241 — —
Changes in the parent’s ownership interest due to transactions with noncontrolling interests
2 2 2
Net change in the year (9) (5,720) 36 (634) (23) (6,350) 271 (6,079)
BALANCE, MARCH 31, 2020 68,187 29,061 34,541 483 243,349 (11,021) 767 258 (7,584) (3,842) (3,012) 283,000 3,161 286,161
Net income attributable to owners of the parent 62,286 62,286 62,286
Cash dividends, ¥549 per share (37,724) (37,724) (37,724)
Purchase of treasury stock (1,147) (11,379) (11,379) (11,379)
Disposal of treasury stock 520 (1,016) 7,048 6,032 6,032
Changes in the parent’s ownership interest due to transactions with noncontrolling interests
4 4 4
Net change in the year (94) 2,869 9 (1,965) 1,085 1,904 923 2,827
BALANCE, MARCH 31, 2021 ¥ 67,560 ¥ 29,061 ¥ 34,541 ¥ 389 ¥ 266,899 ¥ (15,352) ¥ 3,636 ¥ 267 ¥ (7,584) ¥ (5,807) ¥ (1,927) ¥ 304,123 ¥ 4,084 ¥ 308,207
Thousands of U.S. Dollars (Note 1)
Accumulated Other Comprehensive Income
Common Stock
Capital Surplus
Stock Acquisition
RightsRetained Earnings
Treasury Stock
Unrealized Gain on Available-
for-Sale Securities
Deferred Gain on Derivatives under Hedge Accounting
Land Revaluation
Surplus
Foreign Currency
Translation Adjustments
Defined Retirement
Benefit Plans Total
Noncontrolling Interests Total Equity
BALANCE, MARCH 31, 2020 $ 262,497 $ 311,995 $ 4,363 $2,198,075 $ (99,548) $ 6,928 $ 2,330 $ (68,503) $ (34,703) $ (27,206) $2,556,228 $ 28,552 $2,584,780
Net income attributable to owners of the parent 562,605 562,605 562,605
Cash dividends, $4.96 per share (340,746) (340,746) (340,746)
Purchase of treasury stock (102,782) (102,782) (102,782)
Disposal of treasury stock (9,176) 63,661 54,485 54,485
Changes in the parent’s ownership interest due to transactions with noncontrolling interests
36 36 36
Net change in the year (849) 25,915 81 (17,749) 9,800 17,198 8,337 25,535
BALANCE, MARCH 31, 2021 $ 262,497 $ 311,995 $ 3,514 $2,410,794 $ (138,669) $ 32,843 $ 2,411 $ (68,503) $ (52,452) $ (17,406) $2,747,024 $ 36,889 $2,783,913
See notes to consolidated financial statements.

6
Consolidated Statement of Cash FlowsDaito Trust Construction Co., Ltd. and Consolidated SubsidiariesYear Ended March 31, 2021
Millions of YenThousands of
U.S. Dollars (Note 1)
2021 2020 2021
OPERATING ACTIVITIES:Income before income taxes ¥ 90,770 ¥ 133,015 $ 819,890 Adjustments for:
Income taxes—paid (51,554) (49,788) (465,667)Depreciation and amortization 15,801 15,002 142,724 Impairment losses 155 34 1,400 Changes in operating assets and liabilities, net of merger effects:
Decrease (increase) in notes and accounts receivable 24,569 (9,132) 221,922 Decrease (increase) in inventories (3,081) 5,129 (27,829)Decrease (increase) in prepaid expenses— whole-building lease and other
22 (1,030) 199
Decrease (increase) in operating loans 6,612 (34,333) 59,724 Increase (decrease) in accounts payable (28,442) 9,074 (256,905)Increase in advances received—whole-building lease and other 5,298 23,704 47,855 Increase (decrease) in advances received—construction contracts 556 (7,882) 5,022 Increase (decrease) in deposits received for guarantee (1,432) (465) (12,935)Increase in deposits received 125 1,222 1,129 Increase in allowance for doubtful accounts 607 812 5,483 Increase (decrease) in accrued employees' bonuses 6,181 (7,232) 55,831 Increase in liability for retirement benefits 1,179 1,826 10,649 Increase in provision for repair of whole-building lease system 17,917 17,130 161,837
Other—net 13,178 5,043 119,031 Total adjustments 7,691 (30,886) 69,470 Net cash provided by operating activities 98,461 102,129 889,360
INVESTING ACTIVITIES:Proceeds from time deposits — 2,000 —Payments for time deposits (12) (1,002) (108)Proceeds from money held in trust 500 2,000 4,516 Purchases of marketable and investment securities (1,602) (5,969) (14,470)Proceeds from sales and redemption of marketable and investment securities
4,030 12,510 36,401
Payments for purchase of property, plant and equipment (7,563) (19,130) (68,314)Payments for purchase of intangible assets (5,885) (8,231) (53,157)Payment for acquisition of shares of a subsidiary resulting in the consolidation scope (Note 2a and 3)
(13,896) — (125,517)
Other—net (312) (479) (2,818)Net cash used in investing activities (24,740) (18,301) (223,467)
FINANCING ACTIVITIES:Repayments of short-term bank loans (100) — (903)Proceeds from long-term bank loans 95,886 10,700 866,101 Repayment of long-term bank loans (85,094) (20,066) (768,621)Dividends paid (37,724) (43,620) (340,746)Repurchase of treasury stock (11,379) (59,941) (102,782)Proceeds from disposal of treasury stock 4,501 1,906 40,656 Dividends paid to noncontrolling interests (134) (134) (1,210)Other—net (271) (255) (2,449)
Net cash used in financing activities (34,315) (111,410) (309,954)FOREIGN CURRENCY TRANSLATION ADJUSTMENTS ON CASH AND CASH EQUIVALENTS
(548) (130) (4,950)
NET INCREASE (DECREASE) IN CASH AND CASH EQUIVALENTS 38,858 (27,712) 350,989 CASH AND CASH EQUIVALENTS, BEGINNING OF YEAR 159,902 187,614 1,444,332 CASH AND CASH EQUIVALENTS, END OF YEAR ¥ 198,760 ¥ 159,902 $ 1,795,321
See notes to consolidated financial statements.

7
Daito Trust Construction Co., Ltd. and Consolidated SubsidiariesYear Ended March 31, 2021
Notes to Consolidated Financial Statements
1. BASIS OF PRESENTATION OF CONSOLIDATED FINANCIAL STATEMENTS
The accompanying consolidated financial statements have been prepared in accordance with the provisions set
forth in the Japanese Financial Instruments and Exchange Act and its related accounting regulations and in
accordance with accounting principles generally accepted in Japan, which are different in certain respects as to
the application and disclosure requirements of International Financial Reporting Standards.
In preparing these consolidated financial statements, certain reclassifications and rearrangements have been
made to the consolidated financial statements issued domestically in order to present them in a form which is
more familiar to readers outside Japan. In addition, certain reclassifications have been made in the 2020 consol-
idated financial statements to conform them to the classifications used in 2021.
The consolidated financial statements are stated in Japanese yen, the currency of the country in which Daito
Trust Construction Co., Ltd. (the "Company") is incorporated and operates. The translations of Japanese yen
amounts into U.S. dollar amounts are included solely for the convenience of readers outside Japan and have
been made at the rate of ¥110.71 to $1, the approximate rate of exchange at March 31, 2021. Such translations
should not be construed as representations that the Japanese yen amounts could be converted into U.S. dol-
lars at that or any other rate.
2. SUMMARY OF SIGNIFICANT ACCOUNTING POLICIES
a. Consolidation —The consolidated financial statements as of March 31, 2021, include the accounts of the
Company and its 31 (31 in 2020) significant subsidiaries (together, the "Group").
Under the control and influence concepts, those companies in which the Company, directly or indirectly, is
able to exercise control over operations are fully consolidated, and those companies over which the Group
has the ability to exercise significant influence are accounted for by the equity method.
Investments in three (three in 2020) associated companies are accounted for by the equity method.
Investments in two associated companies are stated at cost. If the equity method of accounting had been
applied to the investments in those companies, the effect on the accompanying consolidated financial state-
ments would not be material.
All significant intercompany balances and transactions have been eliminated in consolidation. All material
unrealized profit included in assets resulting from transactions within the Group is also eliminated.
b. Business Combination —Business combinations are accounted for using the purchase method. Acquisition-
related costs, such as advisory fees or professional fees, are accounted for as expenses in the periods in
which the costs are incurred. If the initial accounting for a business combination is incomplete by the end of
the reporting period in which the business combination occurs, an acquirer shall report in its financial state-
ments provisional amounts for the items for which the accounting is incomplete. During the measurement
period, which shall not exceed one year from the acquisition, the acquirer shall retrospectively adjust the
provisional amounts recognized at the acquisition date to reflect new information obtained about facts and
circumstances that existed as of the acquisition date and that would have affected the measurement of the
amounts recognized as of that date. Such adjustments shall be recognized as if the accounting for the busi-
ness combination had been completed at the acquisition date. The acquirer recognizes any bargain purchase
gain in profit or loss immediately on the acquisition date after reassessing and confirming that all of the
assets acquired and all of the liabilities assumed have been identified after a review of the procedures used

8
in the purchase price allocation. A parent's ownership interest in a subsidiary might change if the parent pur-
chases or sells ownership interests in its subsidiary. The carrying amount of noncontrolling interest is
adjusted to reflect the change in the parent's ownership interest in its subsidiary while the parent retains its
controlling interest in its subsidiary. Any difference between the fair value of the consideration received or
paid and the amount by which the noncontrolling interest is adjusted is accounted for as capital surplus as
long as the parent retains control over its subsidiary.
c. Cash Equivalents —Cash equivalents are short-term investments that are readily convertible into cash and
exposed to insignificant risk of changes in value.
Cash equivalents include time deposits and certificates of deposit, both of which mature within three
months of the date of acquisition.
d. Inventories —Construction projects in progress and real estate for sale are stated at cost determined specif-
ically by project. Materials and other inventories are mainly stated at the lower of cost, determined by the
moving-average method, or net selling value.
e. Marketable and Investment Securities —Marketable and investment securities are classified and
accounted for, depending on management's intent, as follows:
(1) held-to-maturity debt securities, for which there is a positive intent and ability to hold to maturity are
reported at amortized cost; and (2) available-for-sale securities, which are not classified as the aforemen-
tioned securities, except for nonmarketable available-for-sale securities, are reported at fair value, with
unrealized gains and losses, net of applicable taxes, reported in a separate component of equity.
Nonmarketable available-for-sale securities are stated at cost determined by the moving-average method.
For other-than-temporary declines in fair value, investment securities are reduced to net realizable value by a
charge to income.
f. Property, Plant and Equipment —Property, plant and equipment are stated at cost. Depreciation of prop-
erty, plant and equipment of the Company and its consolidated subsidiaries are computed substantially by
the declining-balance method based on the estimated useful lives of the assets, while the straight-line
method is applied to buildings acquired on or after April 1, 1998, building improvements and structures
acquired on or after April 1, 2016, principal machinery and equipment, and all property and equipment of
consolidated foreign subsidiaries. The range of useful lives is principally from 10 to 60 years for buildings and
structures, from 3 to 22 years for machinery and equipment, and from 2 to 20 years for furniture and fix-
tures. Leased assets are depreciated using the straight-line method over the estimated useful lives of
assets which are the term of the respective leases.
g. Long-Lived Assets —The Group reviews its long-lived assets for impairment whenever events or changes in
circumstance indicate the carrying amount of an asset or asset group may not be recoverable. An impair-
ment loss is recognized if the carrying amount of an asset or asset group exceeds the sum of the
undiscounted future cash flows expected to result from the continued use and eventual disposition of the
asset or asset group. The impairment loss would be measured as the amount by which the carrying amount
of the asset exceeds its recoverable amount, which is the higher of the discounted cash flows from the con-
tinued use and eventual disposition of the asset or the net selling price at disposition.
h. Goodwill —The difference between the acquisition cost and net assets at the time of acquisition is amor-
tized principally over 20 years on a straight-line basis.

9
i. Land Revaluation —Under the "Law of Land Revaluation," the Company elected a one-time revaluation of its
own-use land to a value based on real estate appraisal information as of March 31, 2002. The resulting land
revaluation excess represents unrealized appreciation of land and is stated, net of income taxes, as a com-
ponent of equity. There was no effect on the statement of income. Continuous readjustment is not permit-
ted unless the land value subsequently declines significantly such that the amount of the decline in value
should be removed from the land revaluation excess amount.
j. Allowance for Doubtful Accounts —The allowance for doubtful accounts is stated at amounts considered
to be appropriate based on the Group's past credit loss experience and an evaluation of potential losses in
the receivables outstanding. The allowance for doubtful accounts related to the subordinated bonds and
subordinated trust beneficiary rights issued by special-purpose entities “SPEs” is stated based on an evalu-
ation of potential losses due to the deteriorating fiscal condition of the SPEs.
k. Accrued Employees' Bonuses —The Company and certain consolidated subsidiaries have provided for
employees' bonuses and have recorded a liability at the estimated amount payable to employees.
l. Retirement and Pension Plans —The Company and certain consolidated subsidiaries have contributory
funded defined benefit pension plans and unfunded retirement benefit plans for employees. Other consoli-
dated domestic subsidiaries have unfunded retirement benefit plans.
The Company and certain consolidated subsidiaries account for the liability for retirement benefits based on
the projected benefit obligations and plan assets at the balance sheet date. The projected benefit obligations
are attributed to periods on a benefit formula basis. Actuarial gains and losses are recognized in profit or loss
approximately over 6 years and 8 years, respectively, and past service costs are recognized in profit or loss
over approximately 8 years,
however, no longer than the expected average remaining service period of the employees.
The discount rate is determined using a single weighted-average discount rate reflecting the estimated tim-
ing and amount of the benefit payments.
m. Provision for Repair of Whole-Building Lease System —A certain consolidated subsidiary has provided for
a provision for repair of whole-building lease systems to cover probable costs of restoration and repairs
being borne in the future based on the whole-building lease contracts. See Note 23 for a description of the
whole-building lease system.
n. Stock Options— The accounting standard for stock options requires companies to measure the cost of
employee stock options based on the fair value at the date of grant and recognize compensation expense
over the vesting period as consideration for receiving goods or services. The standard also requires compa-
nies to account for stock options granted to non-employees based on the fair value of either the stock option
or the goods or services received. In the consolidated balance sheet, the stock option is presented as a
stock acquisition right as a separate component of equity until exercised. The standard covers equity-settled,
share-based payment transactions, but does not cover cash-settled, share-based payment transactions. In
addition, the standard allows unlisted companies to measure options at their intrinsic value if they cannot
reliably estimate fair value.
o. Employee and Directors Stock Ownership Plan —In December 2013, the Accounting Standard Board of
Japan ("ASBJ") issued Practical Issues Task Force ("PITF") No. 30, “Practical Solution on Transactions of
Delivering the Company’s Own Stock to Employees etc. through Trusts”. This PITF is effective for the begin-
ning of annual periods beginning on or after April 1, 2014, with earlier application permitted from the begin-
ning of annual periods first ending after the date of issuance of this PITF, and applied retrospectively.
10
In accordance with the PITF, upon the transfer of treasury stock to the Employee Stock Ownership Trust (the
“Trust”) by the entity, any difference between the book value and fair value of the treasury stock shall be
recorded in capital surplus. At year-end, the entity shall record (1) the entity stock held by the Trust as trea-
sury stock in equity, (2) all other assets and liabilities of the Trust on a line-by-line basis, and (3) a liability/
asset for the net of (i) any gain or loss on delivery of the stock by the Trust to the employee shareholding
association, (ii) dividends received from the entity for the stock held by the Trust, and (iii) any expenses relat-
ing to the Trust.
The Company applied this PITF effective April 1, 2014. As for the trust contracts concluded before April 1,
2014, the Company applied transitional accounting (as stipulated in this PITF) and continued the previous
accounting treatment.
p. Research and Development Costs —Research and development costs are charged to income as incurred.
q. Construction Contracts —Construction revenue and construction costs are recognized by the percent-
age-of-completion method, if the outcome of a construction contract can be estimated reliably. When total
construction revenue, total construction costs and the stage of completion of the contract at the consoli-
dated balance sheet date can be reliably measured, the outcome of a construction contract is deemed to be
estimated reliably. If the outcome of a construction contract cannot be reliably estimated, the complet-
ed-contract method should be applied. When it is probable that the total construction costs will exceed total
construction revenue, an estimated loss on the contract should be immediately recognized by providing for a
loss on the construction contracts.
r. Income Taxes —The provision for income taxes is computed based on pretax income included in the consol-
idated statement of income. The asset and liability approach is used to recognize deferred tax assets and lia-
bilities for the expected future tax consequences of temporary differences between the carrying amounts
and the tax bases of assets and liabilities. Deferred taxes are measured by applying currently enacted tax
law rates to the temporary differences.
s. Foreign Currency Transactions —All short-term and long-term monetary receivables and payables denomi-
nated in foreign currencies are translated into Japanese yen at the exchange rates at the consolidated bal-
ance sheet date. The foreign exchange gains and losses from translation are recognized in the consolidated
statement of income to the extent that they are not hedged by forward exchange contracts.
t. Foreign Currency Financial Statements —The accounts of the consolidated foreign subsidiaries are trans-
lated into Japanese yen at the current exchange rate as of the consolidated balance sheet date except for
equity, which is translated at the historical rate. Differences arising from such translation are shown as
"Foreign currency translation adjustments" under accumulated other comprehensive income in a separate
component of equity.
u. Derivatives and Hedging Activities —a. The Group uses derivative financial instruments to manage its
exposure to fluctuations in foreign currency exchange rates. Foreign exchange forward contracts are utilized
by the Group to reduce foreign currency exchange risk. The Group does not enter into derivatives for trading
or speculative purposes.
Derivative financial instruments and foreign currency transactions are classified and accounted for as fol-
lows: (1) all derivatives are recognized as either assets or liabilities and measured at fair value, and gains or
losses on derivative transactions are recognized in the consolidated statement of income; and (2) for deriva-
tives used for hedging purposes, if such derivatives qualify for hedge accounting because of high correlation
11
and effectiveness between the hedging instruments and the hedged items, gains or losses on derivatives
are deferred until maturity of the hedged transactions.
The foreign currency forward contracts employed to hedge foreign exchange exposure for imports are mea-
sured at fair value and the unrealized gains/losses are recognized in income. Forward contracts applied for
forecasted (or committed) transactions are also measured at fair value but the unrealized gains/losses are
deferred until the underlying transactions are completed.
Accounts payable denominated in foreign currencies for which foreign exchange forward contracts are used
to hedge the foreign currency fluctuations are translated at the contracted rate if the forward contracts qual-
ify for hedge accounting.
v. Consumption Tax —Consumption tax is accounted for by the tax exclusion method.
w. Per Share Information—Basic net income per share is computed by dividing net income attributable to
common shareholders by the weighted-average number of common shares outstanding for the period, ret-
roactively adjusted for stock splits.
Diluted net income per share reflects the potential dilution that could occur if securities were exercised or
converted into common stock. Diluted net income per share of common stock assumes full conversion of
the outstanding warrants at the beginning of the year (or at the time of issuance) with an applicable adjust-
ment for related interest expense, net of tax, and full exercise of outstanding warrants.
Cash dividends per share presented in the accompanying consolidated statement of income are dividends
applicable to the respective years, including dividends to be paid after the end of the year.
x. New Accounting Pronouncements
1: Accounting standard for revenue recognition
On March 30, 2018, the ASBJ issued ASBJ Statement No. 29, "Accounting Standard for Revenue
Recognition," and ASBJ Guidance No. 30, "Implementation Guidance on Accounting Standard for Revenue
Recognition." The core principle of the standard and guidance is that an entity should recognize revenue to
depict the transfer of promised goods or services to customers in an amount that reflects the consider-
ation to which the entity expects to be entitled in exchange for those goods or services. An entity should
recognize revenue in accordance with that core principle by applying the following steps:
Step 1: Identify the contracts with a customer
Step 2: Identify the performance obligations in the contract
Step 3: Determine the transaction price
Step 4: Allocate the transaction price to the performance obligations in the contract
Step 5: Recognize revenue when the entity satisfies a performance obligation
The accounting standard and guidance are effective for annual periods beginning on or after April 1, 2021.
Earlier application is permitted for annual periods beginning on or after April 1, 2018.
The Group expects to apply the accounting standard and guidance for annual periods beginning on or April
1, 2021 and is in the process of measuring the effects of applying the accounting standard and guidance in
future applicable periods.
12
2: Accounting standard for fair value measurement
On July 4, 2019, the ASBJ issued ASBJ Statement No. 30, "Accounting Standard for Fair Value
Measurement" and ASBJ Guidance No. 31, "Implementation Guidance on Accounting Standard for Fair
Value Measurement," and revised related ASBJ Statements and ASBJ Guidance (the "New Accounting
Standards"). Under the New Accounting Standards, nonmarketable available-for-sale equity securities are
stated at cost, while under the current accounting standards, nonmarketable available-for-sale securities
are stated at cost. The New Accounting Standards are effective for the annual periods beginning on or
after April 1, 2021. Earlier application is permitted for annual periods beginning on or after April 1, 2020, or
annual periods ending on or after March 31, 2020.
The Group expects to apply the accounting standard and guidance for annual periods beginning on or April
1, 2021, and is in the process of measuring the effects of applying the accounting standard and guidance
in future applicable periods.
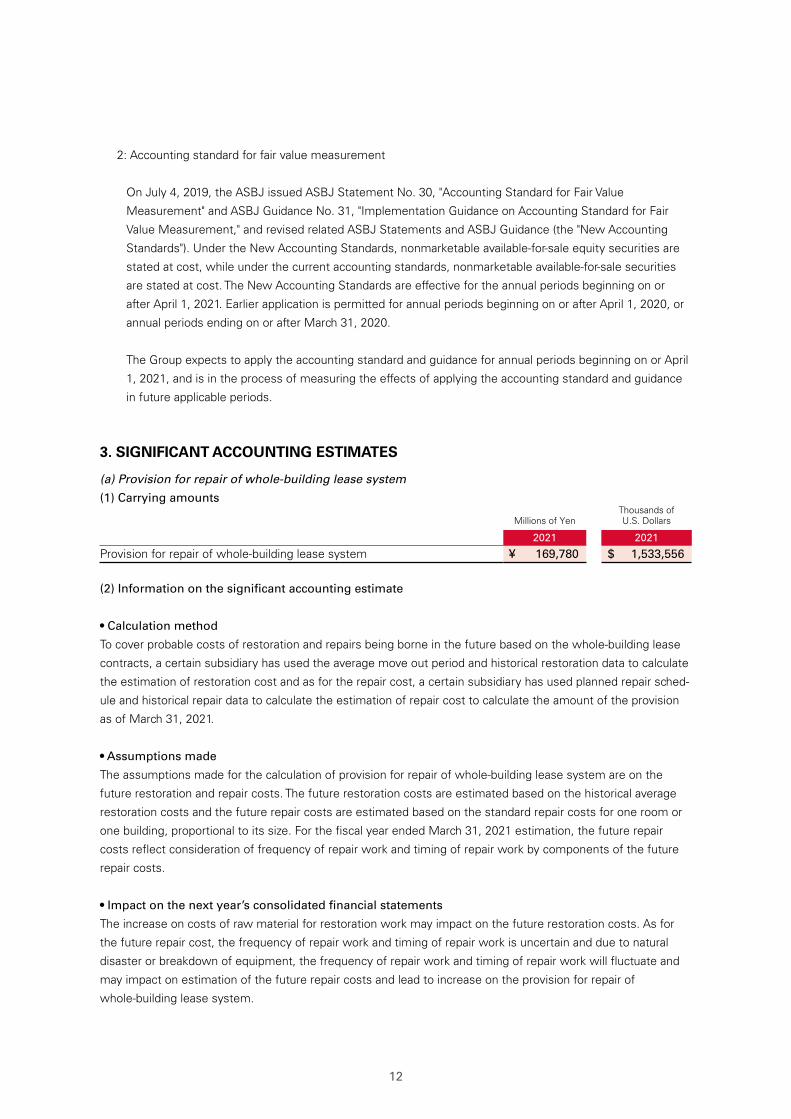
3. SIGNIFICANT ACCOUNTING ESTIMATES
(a) Provision for repair of whole-building lease system
(1) Carrying amounts
Millions of YenThousands ofU.S. Dollars
2021 2021
Provision for repair of whole-building lease system ¥ 169,780 $ 1,533,556
(2) Information on the significant accounting estimate
• Calculation method
To cover probable costs of restoration and repairs being borne in the future based on the whole-building lease
contracts, a certain subsidiary has used the average move out period and historical restoration data to calculate
the estimation of restoration cost and as for the repair cost, a certain subsidiary has used planned repair sched-
ule and historical repair data to calculate the estimation of repair cost to calculate the amount of the provision
as of March 31, 2021.
• Assumptions made
The assumptions made for the calculation of provision for repair of whole-building lease system are on the
future restoration and repair costs. The future restoration costs are estimated based on the historical average
restoration costs and the future repair costs are estimated based on the standard repair costs for one room or
one building, proportional to its size. For the fiscal year ended March 31, 2021 estimation, the future repair
costs reflect consideration of frequency of repair work and timing of repair work by components of the future
repair costs.
• Impact on the next year’s consolidated financial statements
The increase on costs of raw material for restoration work may impact on the future restoration costs. As for
the future repair cost, the frequency of repair work and timing of repair work is uncertain and due to natural
disaster or breakdown of equipment, the frequency of repair work and timing of repair work will fluctuate and
may impact on estimation of the future repair costs and lead to increase on the provision for repair of
whole-building lease system.
13
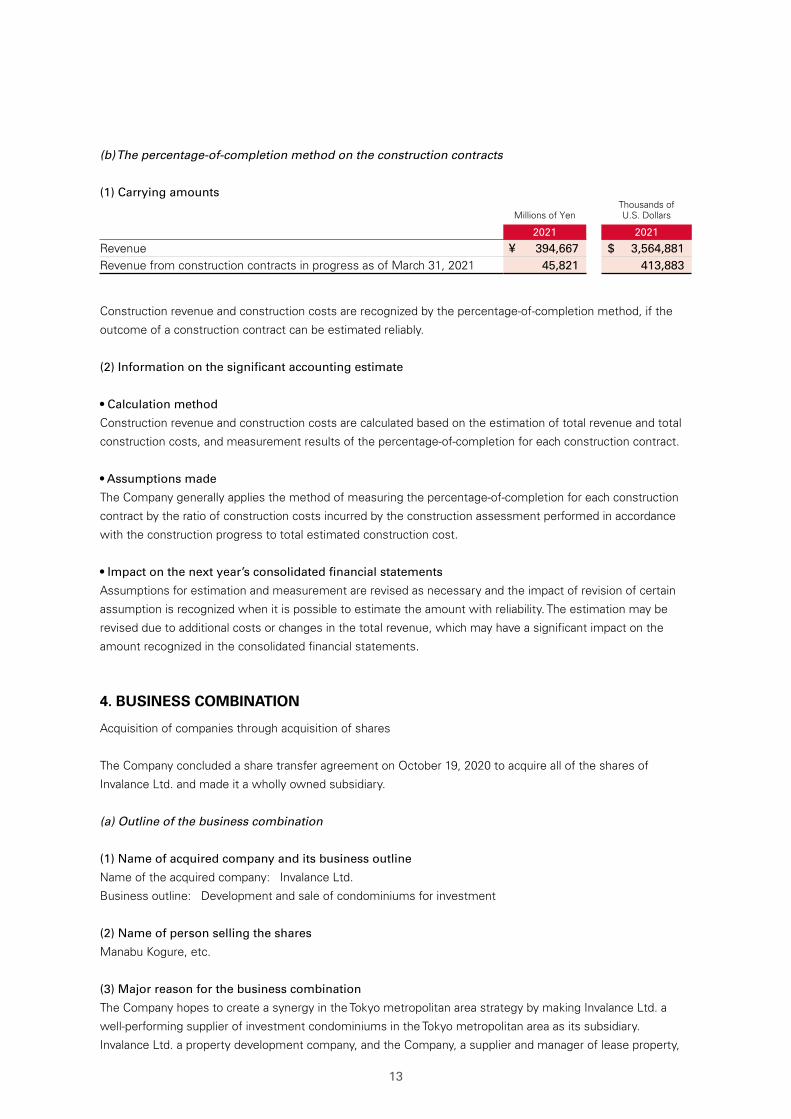
(b) The percentage-of-completion method on the construction contracts
(1) Carrying amounts
Millions of YenThousands ofU.S. Dollars
2021 2021
Revenue ¥ 394,667 $ 3,564,881Revenue from construction contracts in progress as of March 31, 2021 45,821 413,883
Construction revenue and construction costs are recognized by the percentage-of-completion method, if the
outcome of a construction contract can be estimated reliably.
(2) Information on the significant accounting estimate
• Calculation method
Construction revenue and construction costs are calculated based on the estimation of total revenue and total
construction costs, and measurement results of the percentage-of-completion for each construction contract.
• Assumptions made
The Company generally applies the method of measuring the percentage-of-completion for each construction
contract by the ratio of construction costs incurred by the construction assessment performed in accordance
with the construction progress to total estimated construction cost.
• Impact on the next year’s consolidated financial statements
Assumptions for estimation and measurement are revised as necessary and the impact of revision of certain
assumption is recognized when it is possible to estimate the amount with reliability. The estimation may be
revised due to additional costs or changes in the total revenue, which may have a significant impact on the
amount recognized in the consolidated financial statements.
4. BUSINESS COMBINATION
Acquisition of companies through acquisition of shares
The Company concluded a share transfer agreement on October 19, 2020 to acquire all of the shares of
Invalance Ltd. and made it a wholly owned subsidiary.
(a) Outline of the business combination
(1) Name of acquired company and its business outline
Name of the acquired company: Invalance Ltd.
Business outline: Development and sale of condominiums for investment
(2) Name of person selling the shares
Manabu Kogure, etc.
(3) Major reason for the business combination
The Company hopes to create a synergy in the Tokyo metropolitan area strategy by making Invalance Ltd. a
well-performing supplier of investment condominiums in the Tokyo metropolitan area as its subsidiary.
Invalance Ltd. a property development company, and the Company, a supplier and manager of lease property,

14
could reinforce each other’s businesses in the area of property supply chain, which could reinforce the core
business of each company and lead to new development and expansion of the business.
(4) Date of business combination
November 2, 2020 (Date of acquisition of shares)
October 1, 2020 (Date of deemed acquisition)
(5) Legal form of business combination
Share acquisition in consideration for cash
(6) Name of the company after the combination
Invalance Ltd.
(7) Ratio of voting rights acquired
100%
(8) Basis for determining the acquired
It is based on the fact the Company acquired 100% of voting rights by means of share acquisition in consider-
ation for cash
(b) The period for which the operations of the acquired company are included in the consolidated finan-
cial statements
October 1, 2020 – March 31, 2021
(c) Acquisition cost of the acquired company and related details of each class of consideration
Millions of YenThousands ofU.S. Dollars
Consideration for acquisition - Cash ¥ 16,612 $ 150,050Acquisition cost ¥ 16,612 $ 150,050
(d) Major acquisition – related costs
Advisory fee: ¥ 442 million ($ 3,992 thousand)
(e) Amount of goodwill incurred, reasons for the goodwill incurred, and the method and period of
amortization
(1) Amount of goodwill incurred
¥ 9,900 Million ($ 89,423 thousand)
(2) Reasons for the goodwill incurred
Goodwill is incurred from expected excess earnings power in the future arising from further business
development.
(3) Method and period of amortization
The goodwill is amortized on a straight-line basis over 20 years.

15
(f) The assets acquired and the liabilities assumed at the acquisition date are
Millions of YenThousands ofU.S. Dollars
Current assets ¥ 9,889 $ 89,323Non-current assets 2,722 24,587Total assets 12,611 113,910Current liabilities 4,102 37,052Non-current liabilities 1,798 16,240Total liabilities 5,900 53,292Net assets ¥ 6,711 $ 60,618
(g) Conditional consideration for acquisition stated in the business combination agreement and its
accounting
(1) Details of conditional acquisition consideration
The acquirer shall achieve the agreed Key Performance Indicator after the date of execution of the business
combination agreement and during the agreed business year.
(2) Accounting treatment for conditional acquisition consideration
If additional consideration for acquisition is paid, it shall be deemed to be paid at the time of acquisition, and
the initial acquisition amount shall be revised and the amount of goodwill and amortized amount shall be
revised.
(h) Goodwill and the allocation amount of intangible assets by classification and the average amortiza-
tion period thereof.
(1) Distributions of intangible assets and the details of its category
Customer related assets: ¥ 1,050 million ($ 9,484 thousand)
(2) Average depreciation duration by category
Customer related assets : 20 years
(i) Pro forma information (unaudited)
If this business combination had been completed as of April 1, 2020, the beginning of the current fiscal year,
the effects on the consolidated statement of income for the year ended March 31, 2021, would be as follows:
Millions of YenThousands ofU.S. Dollars
Sales ¥ 9,912 $ 89,531Operating income 2 18
(j) Net cash flows on acquisition of a subsidiary
Millions of YenThousands ofU.S. Dollars
Consideration paid for acquiring shares of Invalance Ltd. ¥ 16,612 $ 150,050Less: cash and cash equivalents of Invalance Ltd. (3,700) (33,421) Net cash outflows for the acquisition ¥ 12,912 $ 116,629
The business combination other than acquisition of Invalance Ltd. is immaterial, and therefore it is omitted.
16
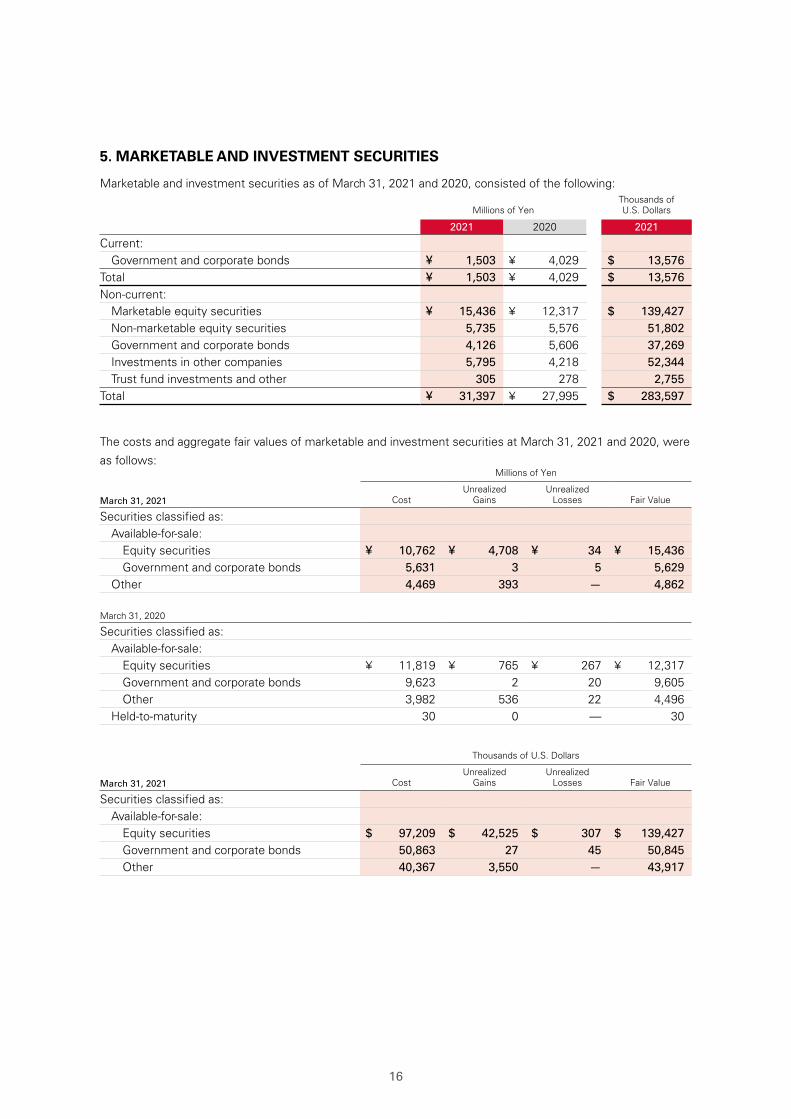
5. MARKETABLE AND INVESTMENT SECURITIES
Marketable and investment securities as of March 31, 2021 and 2020, consisted of the following:
Millions of YenThousands ofU.S. Dollars
2021 2020 2021
Current:Government and corporate bonds ¥ 1,503 ¥ 4,029 $ 13,576
Total ¥ 1,503 ¥ 4,029 $ 13,576Non-current:
Marketable equity securities ¥ 15,436 ¥ 12,317 $ 139,427 Non-marketable equity securities 5,735 5,576 51,802Government and corporate bonds 4,126 5,606 37,269Investments in other companies 5,795 4,218 52,344Trust fund investments and other 305 278 2,755
Total ¥ 31,397 ¥ 27,995 $ 283,597
The costs and aggregate fair values of marketable and investment securities at March 31, 2021 and 2020, were
as follows:Millions of Yen
March 31, 2021
CostUnrealized
GainsUnrealized
Losses Fair Value
Securities classified as: Available-for-sale:
Equity securities ¥ 10,762 ¥ 4,708 ¥ 34 ¥ 15,436Government and corporate bonds 5,631 3 5 5,629
Other 4,469 393 — 4,862
March 31, 2020
Securities classified as: Available-for-sale:
Equity securities ¥ 11,819 ¥ 765 ¥ 267 ¥ 12,317Government and corporate bonds 9,623 2 20 9,605Other 3,982 536 22 4,496
Held-to-maturity 30 0 — 30
Thousands of U.S. Dollars
March 31, 2021
CostUnrealized
GainsUnrealized
Losses Fair Value
Securities classified as: Available-for-sale:
Equity securities $ 97,209 $ 42,525 $ 307 $ 139,427Government and corporate bonds 50,863 27 45 50,845Other 40,367 3,550 — 43,917

17
The proceeds, realized gains and realized losses of the available-for-sale securities which were sold during the
years ended March 31, 2021 and 2020, were as follows:Millions of Yen
March 31, 2021 Proceeds Realized Gains Realized Losses
Available-for-sale:Equity securities ¥ 1,802 ¥ 745 ¥ —
Total ¥ 1,802 ¥ 745 ¥ —
March 31, 2020
Available-for-sale:Equity securities ¥ 1,620 ¥ 960 ¥ (7)
Total ¥ 1,620 ¥ 960 ¥ (7)
Thousands of U.S. Dollars
March 31, 2021 Proceeds Realized Gains Realized Losses
Available-for-sale:Equity securities $ 16,277 $ 6,729 $ —
Total $ 16,277 $ 6,729 $ —
6. SUBORDINATED BONDS AND SUBORDINATED TRUST BENEFICIARY RIGHT
The Company mediates the extension of apartment loans to customers who order construction of rental
housing.
As for these loans, financial institutions establish SPEs and the loans are securitized by the SPEs.
When the customers use these loans, the Company is required to buy the subordinated bonds or subordinated
trust beneficiary rights issued by the SPEs according to the agreement with certain financial institutions.
Details of the subordinated bonds and subordinated trust beneficiary rights are as follows:
Millions of YenThousands ofU.S. Dollars
2021 2020 2021
Subordinated bonds and subordinated trust beneficiary rights
¥ 9,384 ¥ 10,643 $ 84,762
Allowance for doubtful accounts ¥ (86) ¥ (121) $ (777)
Possession ratio of subordinated bonds and subordinated trust beneficiary rights
6.17% 6.17% 6.17%
Date of maturity November 2034—
February2043
November 2034—
February2043
November 2034—
February2043
Loan balance of SPEs ¥ 28,819 ¥ 34,404 $ 260,311 Outstanding bonds of SPEs ¥ 29,151 ¥ 34,512 $ 263,310Number of SPEs 9 10 9
The possession ratio of the subordinated bonds and subordinated trust beneficiary rights is the ratio of the sub-
ordinated bonds and subordinated trust beneficiary rights balance of the Company to the total amount of bonds
when issued.
18
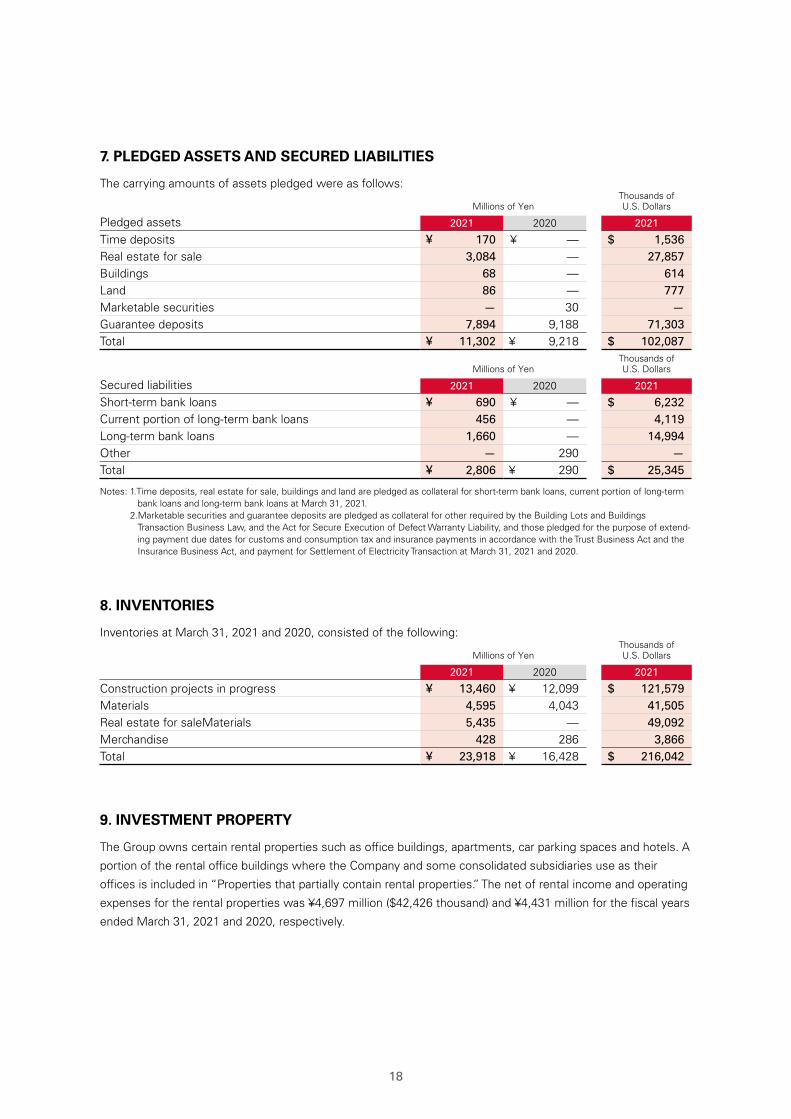
7. PLEDGED ASSETS AND SECURED LIABILITIES
The carrying amounts of assets pledged were as follows:
Millions of YenThousands ofU.S. Dollars
Pledged assets 2021 2020 2021
Time deposits ¥ 170 ¥ — $ 1,536Real estate for sale 3,084 — 27,857Buildings 68 — 614Land 86 — 777Marketable securities — 30 —Guarantee deposits 7,894 9,188 71,303Total ¥ 11,302 ¥ 9,218 $ 102,087
Millions of YenThousands ofU.S. Dollars
Secured liabilities 2021 2020 2021
Short-term bank loans ¥ 690 ¥ — $ 6,232Current portion of long-term bank loans 456 — 4,119Long-term bank loans 1,660 — 14,994Other — 290 —Total ¥ 2,806 ¥ 290 $ 25,345
Notes: 1.Time deposits, real estate for sale, buildings and land are pledged as collateral for short-term bank loans, current portion of long-term bank loans and long-term bank loans at March 31, 2021.
2.Marketable securities and guarantee deposits are pledged as collateral for other required by the Building Lots and Buildings Transaction Business Law, and the Act for Secure Execution of Defect Warranty Liability, and those pledged for the purpose of extend-ing payment due dates for customs and consumption tax and insurance payments in accordance with the Trust Business Act and the Insurance Business Act, and payment for Settlement of Electricity Transaction at March 31, 2021 and 2020.
8. INVENTORIES
Inventories at March 31, 2021 and 2020, consisted of the following:
Millions of YenThousands ofU.S. Dollars
2021 2020 2021
Construction projects in progress ¥ 13,460 ¥ 12,099 $ 121,579Materials 4,595 4,043 41,505Real estate for saleMaterials 5,435 — 49,092Merchandise 428 286 3,866Total ¥ 23,918 ¥ 16,428 $ 216,042
9. INVESTMENT PROPERTY
The Group owns certain rental properties such as office buildings, apartments, car parking spaces and hotels. A
portion of the rental office buildings where the Company and some consolidated subsidiaries use as their
offices is included in “Properties that partially contain rental properties.” The net of rental income and operating
expenses for the rental properties was ¥4,697 million ($42,426 thousand) and ¥4,431 million for the fiscal years
ended March 31, 2021 and 2020, respectively.

19
The carrying amounts, changes in such balances and market prices of such properties are as follows:
(1) Rental propertiesMillions of Yen
Carrying Amount Fair Value
April 1, 2020 Decrease March 31, 2021 March 31, 2021
¥ 26,463 ¥ (124) ¥ 26,339 ¥ 22,787
Millions of Yen
Carrying Amount Fair Value
April 1, 2019 Increase March 31, 2020 March 31, 2020
¥ 22,214 ¥ 4,249 ¥ 26,463 ¥ 24,162
Thousands of U.S. Dollars
Carrying Amount Fair Value
April 1, 2020 Decrease March 31, 2021 March 31, 2021
$ 239,030 $ (1,120) $ 237,910 $ 205,826
(2) Properties that partially contain rental propertiesMillions of Yen
Carrying Amount Fair Value
April 1, 2020 Decrease March 31, 2021 March 31, 2021
¥ 52,882 ¥ (449) ¥ 52,433 ¥ 136,599
Millions of Yen
Carrying Amount Fair Value
April 1, 2019 Decrease March 31, 2020 March 31, 2020
¥ 53,399 ¥ (517) ¥ 52,882 ¥ 133,624
Thousands of U.S. Dollars
Carrying Amount Fair Value
April 1, 2020 Decrease March 31, 2021 March 31, 2021
$ 477,662 $ (4,055) $ 473,607 $ 1,233,845
Notes: 1. Carrying amount recognized in the consolidated balance sheet is net of accumulated depreciation and accumulated impairment losses, if any.
2. Increase during the fiscal year ended March 31, 2021, primarily represents the acquisition of certain rental properties of ¥108 million ($976 thousand), and decrease primarily represents the recognition of depreciation of ¥232 million ($2,096 thousand).
3. Increase during the fiscal year ended March 31, 2020, primarily represents the acquisition of certain rental properties of ¥4,372 mil-lion, and decrease primarily represents the recognition of depreciation of ¥123 million.
4. Increase during the fiscal year ended March 31, 2021, primarily represents the acquisition of properties that partially contain rental properties of ¥247 million ($2,231 thousand), and decrease primarily represents the recognition of depreciation of ¥696 million ($6,287 thousand).
5. Increase during the fiscal year ended March 31, 2020, primarily represents the acquisition of properties that partially contain rental properties of ¥198 million, and decrease primarily represents the recognition of depreciation of ¥705 million.
6. Fair value of properties as of March 31, 2021 was measured by the Group in accordance with its Real-Estate Appraisal Standard.
10. SHORT-TERM BANK LOANS AND LONG-TERM BANK LOANS
Short-term bank loans at March 31, 2021, consisted of notes to banks and bank overdrafts. The annual interest
rates applicable to the short-term bank loans were 1.10% at March 31, 2021.

20
Long-term bank loans at March 31, 2021 and 2020, consisted of the following:
Millions of YenThousands ofU.S. Dollars
2021 2020 2021
Loans from banks due on various dates through 2021 with interest rates ranging from 0.17% to 1.40% (2021) and from 0.17% to 0.41% (2020)
¥ 95,789 ¥ 82,750 $ 865,225
Total 95,789 82,750 865,225Less current portion (12,444) (21,640) (112,402)Long-term bank loans, less current portion ¥ 83,345 ¥ 61,110 $ 752,823
Annual maturities of long-term bank loans, excluding finance leases (see Note 17), at March 31, 2021, were as follows:
Year Ending March 31 Millions of YenThousands ofU.S. Dollars
2022 ¥ 12,444 $ 112,4022023 13,543 122,3292024 10,347 93,4602025 10,350 93,4872026 49,073 443,2572027 and thereafter 32 290Total ¥ 95,789 $ 865,225
As is customary in Japan, the Company and a certain consolidated subsidiary maintain substantial deposit bal-
ances with banks with which it has borrowings. Such deposit balances are not legally or contractually restricted
as to withdrawal.
General agreements with respective banks provide, as is customary in Japan, that additional collateral must be
provided under certain circumstances if requested by such banks and that certain banks have the right to offset
cash deposited with them against any long-term or short-term debt or obligation that becomes due and, in case
of default and certain other specified events, against all other debt payable to the banks. The Company and a
certain consolidated subsidiary have never been requested to provide any additional collateral.
In addition, the Company entered into committed loan facility agreements totaling ¥119,021 million ($1,075,070
thousand) with 11 Japanese banks and a syndicated commitment line agreement totaling ¥70,000 million
($632,283 thousands) with 4 Japanese banks. There was no balance under the committed loan facility agree-
ments as of March 31, 2021.
11. RETIREMENT AND PENSION PLANS
The Company and certain consolidated subsidiaries have severance payment plans for employees. Under most
circumstances, employees terminating employment are entitled to retirement benefits determined based on
the rate of pay at the time of termination, years of service and certain other factors. Such retirement benefits
are made in the form of a lump-sum severance payment from the Company or from certain consolidated sub-
sidiaries and annuity payments from a trustee. Employees are entitled to larger payments if the termination is
involuntary, by retirement at the mandatory retirement age, by death, or by voluntary retirement at certain spe-
cific ages prior to the mandatory retirement age.
The Company and certain consolidated subsidiaries have contributory funded defined benefit pension plans and
unfunded retirement benefit plans for employees which cover approximately 70% and 30%, respectively, of
their benefits. Other consolidated subsidiaries have unfunded retirement benefit plans.
21
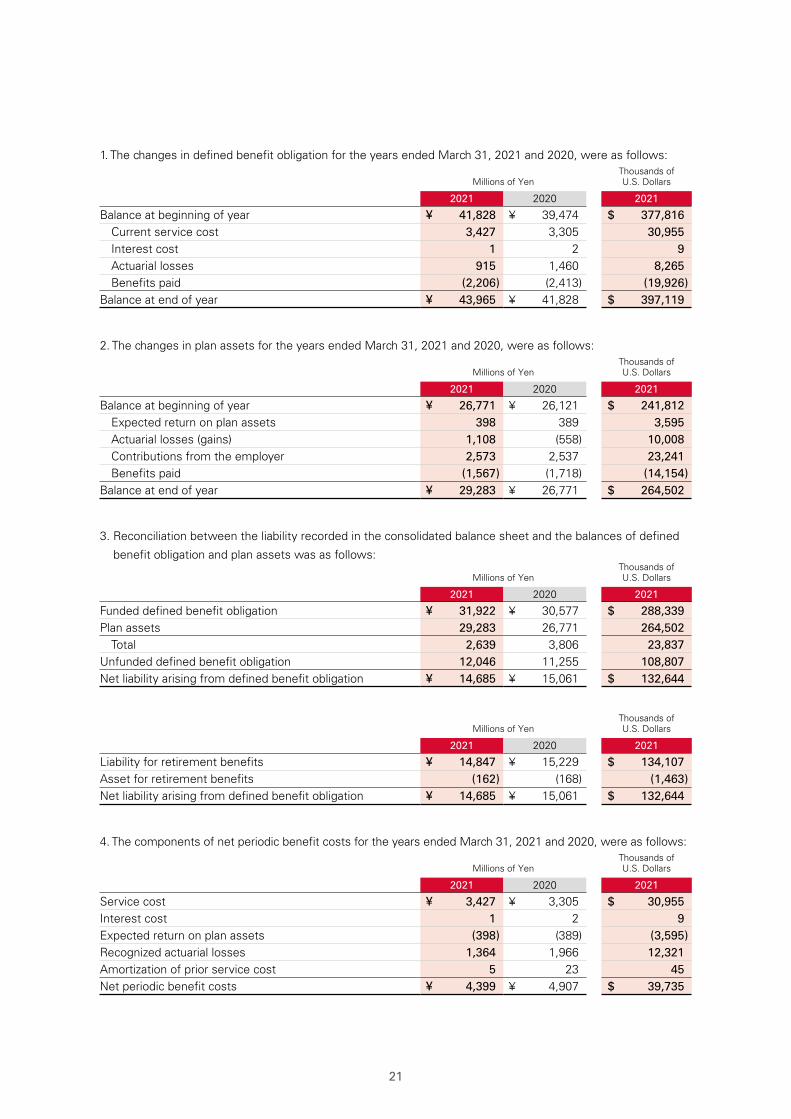
1. The changes in defined benefit obligation for the years ended March 31, 2021 and 2020, were as follows:
Millions of YenThousands ofU.S. Dollars
2021 2020 2021
Balance at beginning of year ¥ 41,828 ¥ 39,474 $ 377,816 Current service cost 3,427 3,305 30,955Interest cost 1 2 9 Actuarial losses 915 1,460 8,265Benefits paid (2,206) (2,413) (19,926)
Balance at end of year ¥ 43,965 ¥ 41,828 $ 397,119
2. The changes in plan assets for the years ended March 31, 2021 and 2020, were as follows:
Millions of YenThousands ofU.S. Dollars
2021 2020 2021
Balance at beginning of year ¥ 26,771 ¥ 26,121 $ 241,812Expected return on plan assets 398 389 3,595Actuarial losses (gains) 1,108 (558) 10,008Contributions from the employer 2,573 2,537 23,241Benefits paid (1,567) (1,718) (14,154)
Balance at end of year ¥ 29,283 ¥ 26,771 $ 264,502
3. Reconciliation between the liability recorded in the consolidated balance sheet and the balances of defined
benefit obligation and plan assets was as follows:
Millions of YenThousands ofU.S. Dollars
2021 2020 2021
Funded defined benefit obligation ¥ 31,922 ¥ 30,577 $ 288,339 Plan assets 29,283 26,771 264,502
Total 2,639 3,806 23,837Unfunded defined benefit obligation 12,046 11,255 108,807Net liability arising from defined benefit obligation ¥ 14,685 ¥ 15,061 $ 132,644
Millions of YenThousands ofU.S. Dollars
2021 2020 2021
Liability for retirement benefits ¥ 14,847 ¥ 15,229 $ 134,107 Asset for retirement benefits (162) (168) (1,463)Net liability arising from defined benefit obligation ¥ 14,685 ¥ 15,061 $ 132,644
4. The components of net periodic benefit costs for the years ended March 31, 2021 and 2020, were as follows:
Millions of YenThousands ofU.S. Dollars
2021 2020 2021
Service cost ¥ 3,427 ¥ 3,305 $ 30,955Interest cost 1 2 9Expected return on plan assets (398) (389) (3,595)Recognized actuarial losses 1,364 1,966 12,321Amortization of prior service cost 5 23 45Net periodic benefit costs ¥ 4,399 ¥ 4,907 $ 39,735

22
5. Amounts recognized in other comprehensive income (before income tax effect) in respect of defined retire-
ment benefit plans for the years ended March 31, 2021 and 2020, were as follows:
Millions of YenThousands ofU.S. Dollars
2021 2020 2021
Prior service cost ¥ 5 ¥ 23 $ 45Actuarial losses (gains) 1,557 (52) 14,064Total ¥ 1,562 ¥ (29) $ 14,109
6. Amounts recognized in accumulated other comprehensive income (before income tax effect) in respect of
defined retirement benefit plans as of March 31, 2021 and 2020, were as follows:
Millions of YenThousands ofU.S. Dollars
2021 2020 2021
Unrecognized prior service cost ¥ (4) ¥ (10) $ (36)Unrecognized actuarial gains (2,764) (4,329) (24,966)Total ¥ (2,768) ¥ (4,339) $ (25,002)
7. Plan assets
(1) Components of plan assets
Plan assets as of March 31, 2021 and 2020, consisted of the following:2021 2020
Debt investments 39.9% 42.4%Equity investments 18.1% 9.3%Cash and cash equivalents 2.2% 9.0%General accounts 35.1% 36.3%Others 4.7% 3.0%Total 100.0% 100.0%
(2) Method of determining the expected rate of return on plan assets
The expected rate of return on plan assets is determined considering the long-term rates of return which are
expected currently and in the future from the various components of the plan assets.
8. Assumptions used for the years ended March 31, 2021 and 2020, were set forth as follows:
2021 2020
Discount rate 0.0% 0.0%Expected rate of return on plan assets 1.5% 1.5%Expected rate of future salary increases 2.0% 1.9%
12. EQUITY
Japanese companies are subject to the Companies Act of Japan (the "Companies Act"). The significant provi-
sions in the Companies Act that affect financial and accounting matters are summarized below:
a. Dividends
Under the Companies Act, companies can pay dividends at any time during the fiscal year in addition to the
year-end dividend upon resolution at the shareholders’ meeting. Additionally, for companies that meet certain
criteria including (1) having a Board of Directors, (2) having independent auditors, (3) having an Audit &
Supervisory Board, and (4) the term of service of the directors being prescribed as one year rather than the

23
normal two-year term by its articles of incorporation, the Board of Directors may declare dividends (except for
dividends-in-kind) at any time during the fiscal year if the company has prescribed so in its articles of incorpora-
tion. However, the Company does not meet all the above criteria.
The Companies Act permits companies to distribute dividends-in-kind (noncash assets) to shareholders subject
to a certain limitation and additional requirements.
Semiannual interim dividends may also be paid once a year upon resolution by the Board of Directors if the arti-
cles of incorporation of the company so stipulate. The Companies Act provides certain limitations on the
amounts available for dividends or the purchase of treasury stock. The limitation is defined as the amount avail-
able for distribution to the shareholders, but the amount of net assets after dividends must be maintained at no
less than ¥3 million.
b. Increases/Decreases and Transfer of Common Stock, Reserve and Surplus
The Companies Act requires that an amount equal to 10% of dividends must be appropriated as a legal reserve
(a component of retained earnings) or as additional paid-in capital (a component of capital surplus), depending
on the equity account charged upon the payment of such dividends, until the aggregate amount of legal
reserve and additional paid-in capital equals 25% of the common stock. Under the Companies Act, the total
amount of additional paid-in capital and legal reserve may be reversed without limitation. The Companies Act
also provides that common stock, legal reserve, additional paid-in capital, other capital surplus and retained
earnings can be transferred among the accounts within equity under certain conditions upon resolution of the
shareholders.
c. Treasury Stock and Treasury Stock Acquisition Rights
The Companies Act also provides for companies to purchase treasury stock and dispose of such treasury stock
by resolution of the Board of Directors. The amount of treasury stock purchased cannot exceed the amount
available for distribution to the shareholders which is determined by a specific formula. Under the Companies
Act, stock acquisition rights are presented as a separate component of equity. The Companies Act also provides
that companies can purchase both treasury stock acquisition rights and treasury stock. Such treasury stock
acquisition rights are presented as a separate component of equity or deducted directly from stock acquisition
rights.
The Company and certain consolidated subsidiaries have set up a “Trust under Employee Stock Ownership
Plan”(the "ESOP trust") and a “Trust for employees receiving in-kind benefit by stock”(the "J-ESOP") to improve
the employees’ benefit program, increase corporate value by enhancing awareness of the Company’s results
and stock price, and enhance employees’ motivation and morale.
In addition, the Company has set up a “Board incentive plan”(the "BIP") to better interrelate the director’s remu-
neration plan, the Company’s performance, and shareholder’s value so that the directors will be motivated to
contribute to the Company’s performance and increase corporate value by holding ownership shares of the
Company. The Group believes that this will improve the mindset of the directors to share same value with the
shareholder in relation to the Group’s performance.

24
Trust Contracts Concluded Before April 1, 2014
J-ESOP
The implementation of a new employee incentive plan J-ESOP was resolved at the Board of Directors’ Meeting
held on July 4, 2011. Under the J-ESOP, employees are granted shares of the Company’s stock when they
become vested in accordance with the Share-based Benefits Regulations established by the Company and cer-
tain consolidated subsidiaries. The Company and certain consolidated subsidiaries grant points to selected
employees based on their performance and achievements. Employees who have met certain requirements will
receive the number of shares of the Company’ stock corresponding to their points obtained (one share to one
point). Shares to be granted to employees are acquired for both current and future benefits with the money
held in a trust and separately managed as trust assets. With the J-ESOP, the Company and certain consolidated
subsidiaries expect to enhance employees’ morale and motivation to dedicate themselves to improving busi-
ness performance and corporate value over the medium-term.
The Company’s stock held by the above trusts at March 31, 2021 and 2020, was as follows:
Millions of YenThousands ofU.S. Dollars
2021 2020 2021
J-ESOP ¥ 6,485 ¥ 4,009 $ 58,576
Thousands of Shares
2021 2020
J-ESOP 487 247
The Company’s stock held by the trusts is therefore presented as “Treasury Stock” and as a deduction to
shareholders’ equity in the consolidated balance sheet and consolidated shareholders’ equity (or statement of
changes in equity).
However, such stock is excluded from treasury stock in calculating EPS of common stock and fully diluted EPS
of common stock.
Trust Contracts Concluded On or After April 1, 2014
ESOP trust
The implementation of an employee incentive plan ESOP trust was resolved at the Board of Directors’ Meeting
held on November 24, 2015 and November 24, 2020, aiming to increase the Company’s corporate value over
the medium to long-term. The Company has set up a trust for employees that are members of the “Daito Trust
Construction Co., Ltd. Employee Stock Ownership Plan,” who are eligible under certain requirements to be ben-
eficiaries. During the designated acquisition period, the ESOP trust purchased from stock exchanges. The num-
ber of shares of the Company’s stock which is expected to be acquired by the Daito Trust Construction Co., Ltd.
Employee Stock Ownership Plan from the ESOP trust over five years after its establishment. Since the acquisi-
tion, the ESOP trust has sold shares of the Company’s stock to Daito Trust Construction Co., Ltd. Employee
Stock Ownership Plan on a certain day of every month. As for the termination of the ESOP trust, where an
increase in the stock price will have generated trust earnings on the sales of the shares of the Company’s
stock, money held in the trust will be distributed to the employees as beneficiaries based on their contribution
ratio. When a decrease in the stock price will have caused losses on the sales of the shares of the Company’s
stock, resulting in obligations related to trust assets, the employees will not be obligated to make additional
contributions because the Company will settle those obligations in a lump sum with the bank in accordance
with a guarantee clause in the loan agreement.
25
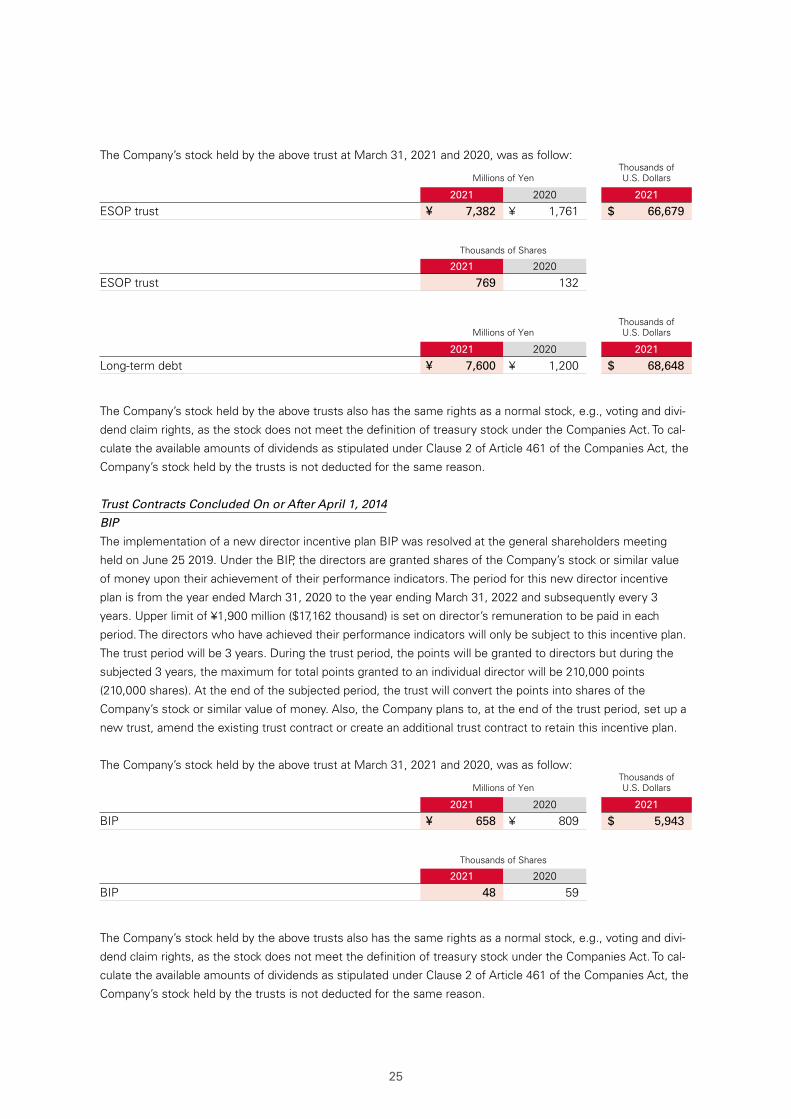
The Company’s stock held by the above trust at March 31, 2021 and 2020, was as follow:
Millions of YenThousands ofU.S. Dollars
2021 2020 2021
ESOP trust ¥ 7,382 ¥ 1,761 $ 66,679
Thousands of Shares
2021 2020
ESOP trust 769 132
Millions of YenThousands ofU.S. Dollars
2021 2020 2021
Long-term debt ¥ 7,600 ¥ 1,200 $ 68,648
The Company’s stock held by the above trusts also has the same rights as a normal stock, e.g., voting and divi-
dend claim rights, as the stock does not meet the definition of treasury stock under the Companies Act. To cal-
culate the available amounts of dividends as stipulated under Clause 2 of Article 461 of the Companies Act, the
Company’s stock held by the trusts is not deducted for the same reason.
Trust Contracts Concluded On or After April 1, 2014
BIP
The implementation of a new director incentive plan BIP was resolved at the general shareholders meeting
held on June 25 2019. Under the BIP, the directors are granted shares of the Company’s stock or similar value
of money upon their achievement of their performance indicators. The period for this new director incentive
plan is from the year ended March 31, 2020 to the year ending March 31, 2022 and subsequently every 3
years. Upper limit of ¥1,900 million ($17,162 thousand) is set on director’s remuneration to be paid in each
period. The directors who have achieved their performance indicators will only be subject to this incentive plan.
The trust period will be 3 years. During the trust period, the points will be granted to directors but during the
subjected 3 years, the maximum for total points granted to an individual director will be 210,000 points
(210,000 shares). At the end of the subjected period, the trust will convert the points into shares of the
Company’s stock or similar value of money. Also, the Company plans to, at the end of the trust period, set up a
new trust, amend the existing trust contract or create an additional trust contract to retain this incentive plan.
The Company’s stock held by the above trust at March 31, 2021 and 2020, was as follow:
Millions of YenThousands ofU.S. Dollars
2021 2020 2021
BIP ¥ 658 ¥ 809 $ 5,943
Thousands of Shares
2021 2020
BIP 48 59
The Company’s stock held by the above trusts also has the same rights as a normal stock, e.g., voting and divi-
dend claim rights, as the stock does not meet the definition of treasury stock under the Companies Act. To cal-
culate the available amounts of dividends as stipulated under Clause 2 of Article 461 of the Companies Act, the
Company’s stock held by the trusts is not deducted for the same reason.

26
13. STOCK OPTIONS
The Company
The stock options outstanding as of March 31, 2021, were as follows:
Stock Option Persons GrantedNumber of
Options Granted Date of Grant Exercise Price Exercise Period
2013 Stock Option (A) 11 directors 7,900 shares 2013.6.17 ¥ 1($ 0.01)
From June 18, 2013 to June 17, 2043
2014 Stock Option (A) 6 directors 5,200 shares 2014.6.17 ¥ 1($ 0.01)
From June 18, 2014 to June 17, 2044
2015 Stock Option (A) 7 directors 4,200 shares 2015.6.16 ¥ 1($ 0.01)
From June 17, 2015 to June 16, 2045
2015 Stock Option (B) 7 directors 8,200 shares 2015.6.16 ¥ 1($ 0.01)
From June 17, 2018 to June 16, 2023
2016 Stock Option (A) 9 directors 3,800 shares 2016.6.16 ¥ 1($ 0.01)
From June 17, 2016 to June 16, 2046
2016 Stock Option (B) 9 directors 7,000 shares 2016.6.16 ¥ 1($ 0.01)
From June 17, 2019 to June 16, 2024
2017 Stock Option (A) 10 directors 11,600 shares 2017.6.16 ¥ 1($ 0.01)
From June 17, 2017 to June 16, 2047
2017 Stock Option (B) 10 directors 7,000 shares 2017.6.16 ¥ 1($ 0.01)
From June 17, 2020 to June 16, 2025
2018 Stock Option (A) 8 directors 2,800 shares 2018.6.15 ¥ 1($ 0.01)
From June 16, 2018to June 15, 2048
2018 Stock Option (B) 8 directors 6,200 shares 2018.6.15 ¥ 1($ 0.01)
From June 16, 2021to June 15, 2026
2019 Stock Option (A) 9 directors 16,000 shares 2019.6.14 ¥ 1($ 0.01)
From June 15, 2019to June 14, 2049
2019 Stock Option (B) 9 directors 9,400 shares 2019. 6.14 ¥ 1($ 0.01)
From June 15, 2022to June 14, 2027
27
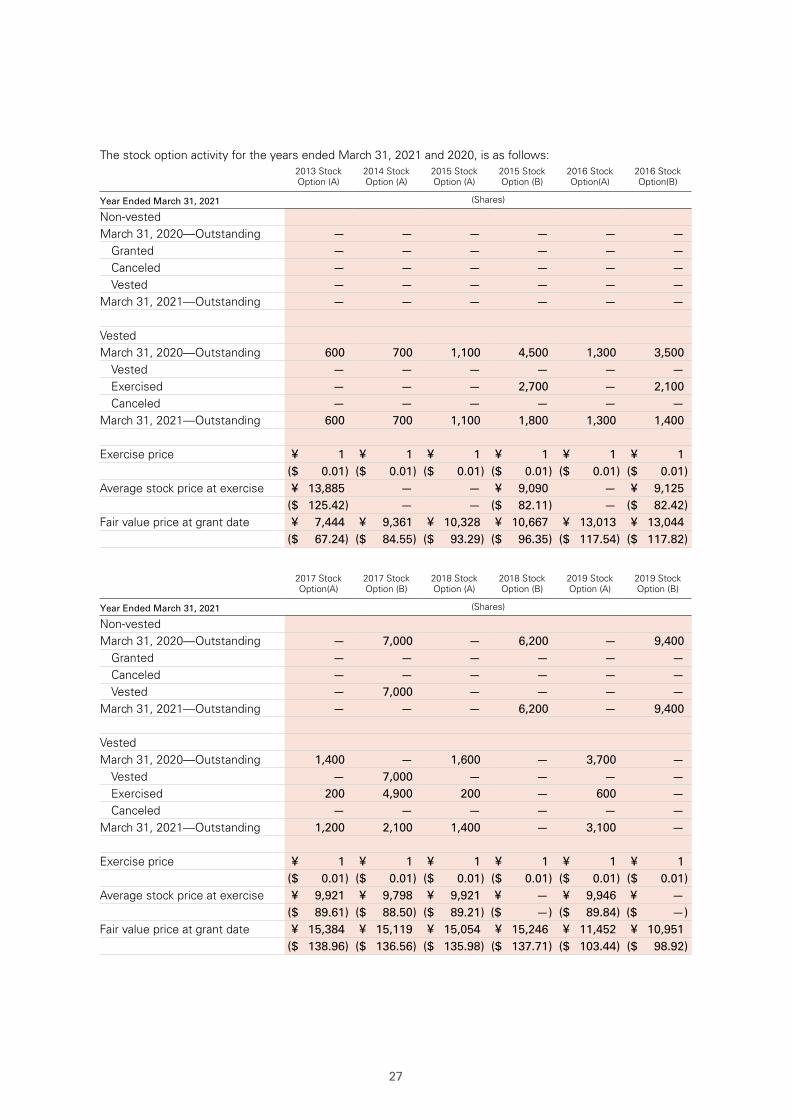
The stock option activity for the years ended March 31, 2021 and 2020, is as follows: 2013 Stock Option (A)
2014 Stock Option (A)
2015 StockOption (A)
2015 Stock Option (B)
2016 StockOption(A)
2016 StockOption(B)
Year Ended March 31, 2021 (Shares)
Non-vestedMarch 31, 2020—Outstanding — — — — — —
Granted — — — — — —Canceled — — — — — —Vested — — — — — —
March 31, 2021—Outstanding — — — — — —
VestedMarch 31, 2020—Outstanding 600 700 1,100 4,500 1,300 3,500
Vested — — — — — —Exercised — — — 2,700 — 2,100Canceled — — — — — —
March 31, 2021—Outstanding 600 700 1,100 1,800 1,300 1,400
Exercise price ¥ 1 ¥ 1 ¥ 1 ¥ 1 ¥ 1 ¥ 1($ 0.01) ($ 0.01) ($ 0.01) ($ 0.01) ($ 0.01) ($ 0.01)
Average stock price at exercise ¥ 13,885 — — ¥ 9,090 — ¥ 9,125($ 125.42) — — ($ 82.11) — ($ 82.42)
Fair value price at grant date ¥ 7,444 ¥ 9,361 ¥ 10,328 ¥ 10,667 ¥ 13,013 ¥ 13,044($ 67.24) ($ 84.55) ($ 93.29) ($ 96.35) ($ 117.54) ($ 117.82)
2017 StockOption(A)
2017 Stock Option (B)
2018 StockOption (A)
2018 Stock Option (B)
2019 Stock Option (A)
2019 Stock Option (B)
Year Ended March 31, 2021 (Shares)
Non-vestedMarch 31, 2020—Outstanding — 7,000 — 6,200 — 9,400
Granted — — — — — —Canceled — — — — — —Vested — 7,000 — — — —
March 31, 2021—Outstanding — — — 6,200 — 9,400
VestedMarch 31, 2020—Outstanding 1,400 — 1,600 — 3,700 —
Vested — 7,000 — — — —Exercised 200 4,900 200 — 600 —Canceled — — — — — —
March 31, 2021—Outstanding 1,200 2,100 1,400 — 3,100 —
Exercise price ¥ 1 ¥ 1 ¥ 1 ¥ 1 ¥ 1 ¥ 1($ 0.01) ($ 0.01) ($ 0.01) ($ 0.01) ($ 0.01) ($ 0.01)
Average stock price at exercise ¥ 9,921 ¥ 9,798 ¥ 9,921 ¥ — ¥ 9,946 ¥ —($ 89.61) ($ 88.50) ($ 89.21) ($ —) ($ 89.84) ($ —)
Fair value price at grant date ¥ 15,384 ¥ 15,119 ¥ 15,054 ¥ 15,246 ¥ 11,452 ¥ 10,951($ 138.96) ($ 136.56) ($ 135.98) ($ 137.71) ($ 103.44) ($ 98.92)

28
2012 Stock Option (A)
2012 Stock Option (B)
2013 Stock Option (A)
2013 Stock Option (B)
2014 Stock Option (A)
2014 Stock Option (B)
Year Ended March 31, 2020 (Shares)
Non-vestedApril 1, 2019—Outstanding — — — — — —
Granted — — — — — —Canceled — — — — — —Vested — — — — — —
March 31, 2020—Outstanding — — — — — —
VestedApril 1, 2019—Outstanding 1,000 1,300 1,600 700 2,500 1,600
Vested — — — — — —Exercised 1,000 1,300 1,000 700 1,800 1,600Canceled — — — — — —
March 31, 2020—Outstanding — — 600 — 700 —
2015 Stock Option (A)
2015 Stock Option (B)
2016 Stock Option (A)
2016 Stock Option (B)
2017 Stock Option (A)
2017 Stock Option (B)
Year Ended March 31, 2020 (Shares)
Non-vestedApril 1, 2019—Outstanding — — — 7,000 — 7,000
Granted — — — — — —Canceled — — — — — —Vested — — — 7,000 — —
March 31, 2020—Outstanding — — — — — 7,000
VestedApril 1, 2019—Outstanding 2,500 5,400 2,500 — 2,600 —
Vested — — — 7,000 — —Exercised 1,400 900 1,200 3,500 1,200 —Canceled — — — — — —
March 31, 2020—Outstanding 1,100 4,500 1,300 3,500 1,400 —
2018 Stock Option (A)
2018 Stock Option (B)
2019 Stock Option (A)
2019 Stock Option (B)
Year Ended March 31, 2020 (Shares)
Non-vestedApril 1, 2019—Outstanding — 6,200 — —
Granted — — 16,000 9,400Canceled — — — —Vested — — 16,000 —
March 31, 2020—Outstanding — 6,200 — 9,400
VestedApril 1, 2019—Outstanding 2,800 — — —
Vested — — 16,000 —Exercised 1,200 — 12,300 —Canceled — — — —
March 31, 2020—Outstanding 1,600 — 3,700 —

29
Consolidated subsidiary
The House com Corporation
Stock has been restated, as appropriate, to reflect two-for-one stock split effected April 1, 2018.
The stock options outstanding as of March 31, 2021, were as follows:
Stock Option Persons GrantedNumber of
Options Granted Date of Grant Exercise Price Exercise Period
2014 Stock Option 1 director 31,000 shares 2014.5.30 ¥ 1($ 0.01)
From May 31, 2014 to May 30, 2044
2015 Stock Option 2 directors 11,200 shares 2015.6.5 ¥ 1($ 0.01)
From June 6, 2015 to June 5, 2045
2016 Stock Option 2 directors 11,400 shares 2016.6.2 ¥ 1($ 0.01)
From June 4, 2016 to June 3, 2046
2017 Stock Option 2 directors 10,600 shares 2017.5.31 ¥ 1($ 0.01)
From June 2, 2017 to June 1, 2047
The stock option activity for the years ended March 31 2021 and 2020, is as follows:2014 Stock
Option 2015 Stock
Option 2016 Stock
Option 2017 Stock
Option
Year Ended March 31, 2021 (Shares)
Non-vestedMarch 31, 2020—Outstanding — — — —
Granted — — — —Canceled — — — —Vested — — — —
March 31, 2021—Outstanding — — — —
VestedMarch 31, 2020—Outstanding 31,000 11,200 11,400 10,600
Vested — — — —Exercised — — — —Canceled — — — —
March 31, 2021—Outstanding 31,000 11,200 11,400 10,600
Exercise price ¥ 1 ¥ 1 ¥ 1 ¥ 1($ 0.01) ($ 0.01) ($ 0.01) ($ 0.01)
Average stock price at exercise ¥ — ¥ — ¥ — ¥ —($ —) ($ —) ($ —) ($ —)
Fair value price at grant date ¥ 270 ¥ 656 ¥ 596 ¥ 827($ 2.44) ($ 5.93) ($ 5.38) ($ 7.47)

30
2014 StockOption
2015 StockOption
2016 StockOption
2017 StockOption
Year Ended March 31, 2020 (Shares)
Non—vestedApril 1, 2019—Outstanding — — — —
Granted — — — —Canceled — — — —Vested — — — —
March 31, 2020—Outstanding — — — —
VestedApril 1, 2019—Outstanding 31,000 11,200 11,400 10,600
Vested — — — —Exercised — — — —Canceled — — — —
March 31, 2020—Outstanding 31,000 11,200 11,400 10,600
14. INCOME TAXES
The Company and its domestic subsidiaries are subject to Japanese national and local income taxes which, in
the aggregate, resulted in normal effective statutory tax rates of approximately 30.6% and 30.6% for the years
ended March 31, 2021 and 2020, respectively.
The tax effects of significant temporary differences and tax loss carryforwards, which resulted in deferred tax
assets and liabilities at March 31, 2021 and 2020, were as follows:
Millions of YenThousands ofU.S. Dollars
2021 2020 2021
Deferred tax assets:Loss on devaluation of investment Securities ¥ 147 ¥ 311 $ 1,328Allowance for doubtful accounts 1,904 1,717 17,198Unrealized profit of assets 9,512 7,379 85,918Accrued expenses 2,385 1,985 21,543Accrued enterprise taxes 1,576 1,860 14,236Depreciation 1,379 1,389 12,456Accrued employees’ bonuses 6,222 4,332 56,201Provision for warranties for completed construction 184 251 1,662Retirement benefit for employees 4,536 4,662 40,972Provision for repair of whole-building lease system 51,987 46,500 469,578Deferred cleaning revenue 5,564 5,090 50,257Tax loss carryforwards 471 524 4,254Others 10,445 10,246 94,346
Total of tax loss carryforwards and temporary differences 96,312 86,246 869,949Less valuation allowance for tax loss carryforwards (347) (524) (3,134)Less valuation allowance for temporary differences (232) (404) (2,096)Total valuation allowance (579) (928) (5,230)
Deferred tax assets 95,733 85,318 864,719Deferred tax liabilities:
Reserve for special depreciation 788 1,737 7,118Unrealized gain on available-for-sale securities 1,434 102 12,953Others 435 553 3,929Deferred tax liabilities 2,657 2,392 24,000
Net deferred tax assets ¥ 93,076 ¥ 82,926 $ 840,719

31
As of March 31, 2021, the valuation allowance decreased by ¥ 348 million ($3,152 thousand). This was mainly
due to a decrease in the valuation allowance for tax loss carryforwards of consolidated subsidiaries.
The expiration of tax loss carryforwards, the related valuation allowances and the resulting net deferred tax
assets as of March 31, 2021 and 2020, were as follows:Millions of Yen
March 31, 20211 Year or
Less
After 1 Year
through 2 Years
After 2 Years through3 Years
After 3 Years through4 Years
After 4 Years through5 Years
After 5 Years Total
Deferred tax assets relating to tax loss carryforwards
¥ 7 ¥ 14 ¥ 25 ¥ 425 ¥ 471
Less valuation allowances for tax loss carryforwards
(7) (14) (25) (301) (347)
Net deferred tax assets relating to tax loss carryforwards
124 124
Millions of Yen
March 31, 20201 Year or
Less
After 1 Year
through 2 Years
After 2 Years through3 Years
After 3 Years through4 Years
After 4 Years through5 Years
After 5 Years Total
Deferred tax assets relating to tax loss carryforwards
¥ 8 ¥ 15 ¥ 501 ¥ 524
Less valuation allowances for tax loss carryforwards
(8) (15) (501) (524)
Net deferred tax assets relating to tax loss carryforwards
Thousands of U.S. Dollars
March 31, 20211 Year or
Less
After 1 Year
through 2 Years
After 2 Years through3 Years
After 3 Years through4 Years
After 4 Years through5 Years
After 5 Years Total
Deferred tax assets relating to tax loss carryforwards
$ 63 $ 126 $ 226 $ 3,839 $ 4,254
Less valuation allowances for tax loss carryforwards
(63) (126) (226) (2,719) (3,134)
Net deferred tax assets relating to tax loss carryforwards
1,120 1,120
As of March 31, 2021, deferred tax assets of ¥124 million ($1,120 thousand) have been recognized for tax loss
carryforwards of ¥471 million ($4,254 thousand). The net amount of deferred tax assets related to operating
loss carryforwards was determined to be recoverable due to expected future taxable income, and no valuation
allowance was provided.
Deferred tax assets and liabilities were included in the consolidated balance sheets as of March 31, 2021 and
2020 as follows:
Millions of YenThousands ofU.S. Dollars
2021 2020 2021
Non-current assets—Deferred tax assets ¥ 93,322 ¥ 83,234 $ 842,941 Non-current liabilities—Other (246) (308) (2,222)
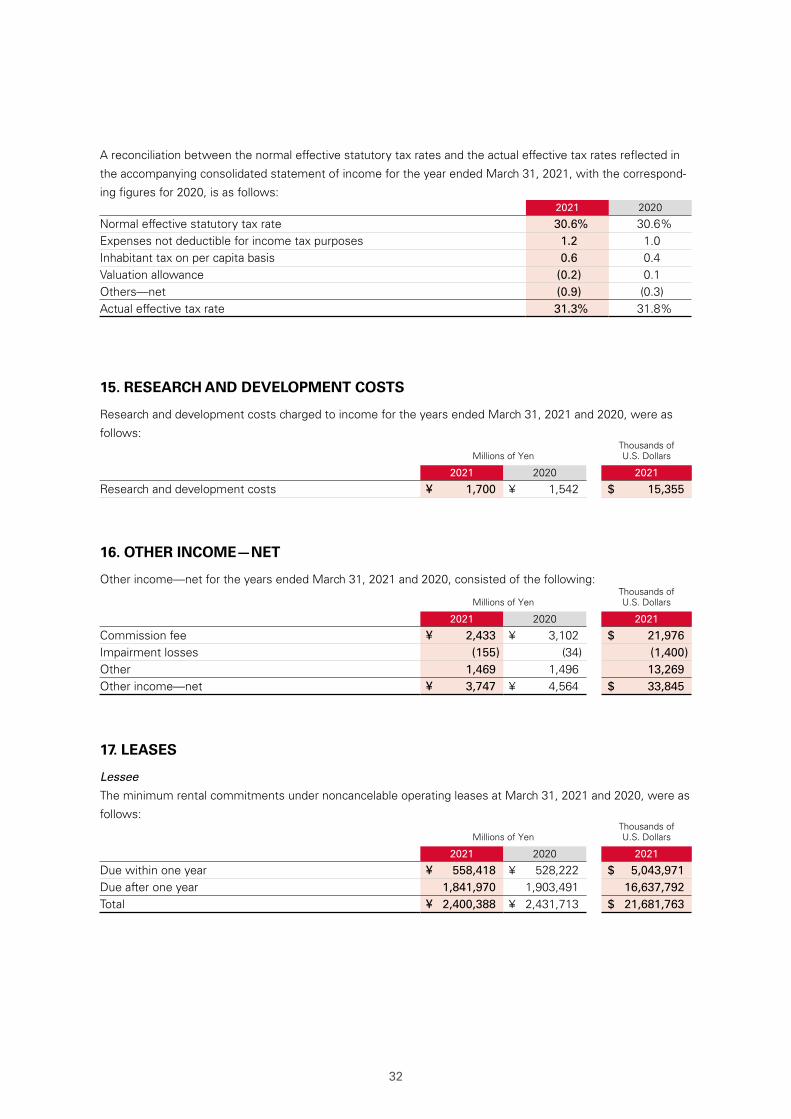
32
A reconciliation between the normal effective statutory tax rates and the actual effective tax rates reflected in
the accompanying consolidated statement of income for the year ended March 31, 2021, with the correspond-
ing figures for 2020, is as follows:2021 2020
Normal effective statutory tax rate 30.6% 30.6%Expenses not deductible for income tax purposes 1.2 1.0 Inhabitant tax on per capita basis 0.6 0.4 Valuation allowance (0.2) 0.1 Others—net (0.9) (0.3)Actual effective tax rate 31.3% 31.8%
15. RESEARCH AND DEVELOPMENT COSTS
Research and development costs charged to income for the years ended March 31, 2021 and 2020, were as
follows:
Millions of YenThousands ofU.S. Dollars
2021 2020 2021
Research and development costs ¥ 1,700 ¥ 1,542 $ 15,355
16. OTHER INCOME—NET
Other income—net for the years ended March 31, 2021 and 2020, consisted of the following:
Millions of YenThousands ofU.S. Dollars
2021 2020 2021
Commission fee ¥ 2,433 ¥ 3,102 $ 21,976Impairment losses (155) (34) (1,400)Other 1,469 1,496 13,269Other income—net ¥ 3,747 ¥ 4,564 $ 33,845
17. LEASES
Lessee
The minimum rental commitments under noncancelable operating leases at March 31, 2021 and 2020, were as
follows:
Millions of YenThousands ofU.S. Dollars
2021 2020 2021
Due within one year ¥ 558,418 ¥ 528,222 $ 5,043,971Due after one year 1,841,970 1,903,491 16,637,792Total ¥ 2,400,388 ¥ 2,431,713 $ 21,681,763

33
Lease payments fixed by contract with regard to the whole-building lease system are included in the
above-mentioned minimum rental commitments at March 31, 2021 and 2020, as follows:
Millions of YenThousands ofU.S. Dollars
2021 2020 2021
Due within one year ¥ 554,607 ¥ 525,470 $ 5,009,547Due after one year 1,837,442 1,896,624 16,596,893Total ¥ 2,392,049 ¥ 2,422,094 $ 21,606,440
Lessor
The minimum rental commitments under noncancelable operating leases at March 31, 2021 and 2020, were as
follows:
Millions of YenThousands ofU.S. Dollars
2021 2020 2021
Due within one year ¥ 1,319 ¥ 1,319 $ 11,914Due after one year 12,965 14,284 117,108Total ¥ 14,284 ¥ 15,603 $ 129,022
18. FINANCIAL INSTRUMENTS AND RELATED DISCLOSURES
(1) Group Policy for Financial Instruments
The Group uses financial instruments, mainly loans from banks, based on its capital financing plan for construc-
tion business. As a matter of policy, the Group only uses derivatives for actual operating requirements, not for
speculative purposes.
(2) Nature and Extent of Risks Arising from Financial Instruments and
Risk Management for Financial Instruments
Money held in trust has been set up to separately manage tenancy deposits. The Group manages such trust
assets as short-term deposits and low risk securities. These are exposed to variable risks, including issuers’
credit, interest rate, and market. However, the Group periodically monitors the financial condition of issuers and
the market value of debt securities.
Receivables such as trade notes and accounts receivable are exposed to customer credit risk. The Group
decreases the risk by starting construction after customer financing is fixed.
Marketable and investment securities, mainly held-to-maturity securities and equity instruments, are exposed
to variable risks, including issuers’ credit, interest rate, and market. The Group periodically monitors the financial
condition of the issuers of marketable investment securities. An ongoing review of securities held, other than
held-to-maturity securities, is performed by taking into consideration the market as well as the relationship with
the trading counterparties.
Short-term investments are time deposits that mature or become due after more than three months from the
date of acquisition.
Operating loans, mainly loans for customers’ construction financing (i.e., bridge loans until financial institutions
execute a long-term loan and secondary loan for long-term loan) are exposed to customer credit risk. The Group
thoroughly enforces credit risk management, which includes periodic monitoring of the financial condition of
customers to mitigate the risk of uncollectible loans.

34
Subordinated bonds and subordinated trust beneficiary rights are financial instruments issued by an SPE estab-
lished by a financial institution. The financial institution securitized the apartment loans of customers who order
the Company to construct an apartment building for rent using the SPE. Subordinated bonds and subordinated
trust beneficiary rights are exposed to the credit risk of the debtor of the apartment loan. The Group manages
the credit risk by monitoring repayments of the loan.
Payment terms of payables, such as accounts payable, income taxes payable, and deposits received, are gener-
ally less than one year.
Loans from banks are exposed to market risk from changes in interest rates. The Group performs continuous
monitoring of market fluctuations.
Long-term deposits received for guarantees are received from tenants in the real estate rental business by the
whole-building lease system.
Derivatives are forward foreign currency exchange contracts, which are used to manage exposure to market
risks from changes in foreign currency exchange rate payables.
(3) Fair Values of Financial Instruments
Fair values of financial instruments are based on quoted prices in active markets. If a quoted price is not avail-
able, another rational valuation technique is used instead.
(a) Fair value of financial instrumentsMillions of Yen
March 31, 2021Carrying Amount Fair Value
Unrealized Gain/Loss
Cash and cash equivalents ¥ 198,760 ¥ 198,760 ¥ —Money held in trust 13,500 13,500 —Short-term investments 233 233 —Notes and accounts receivable 51,881Allowance for doubtful accounts (69)
51,812 51,812 —Marketable and investment securities:
Investments in an associated company 14,807 45,418 30,611Available-for-sale securities 25,927 25,927 —
Operating loans 120,980Allowance for doubtful accounts (353)
120,627 120,719 92 Total ¥ 425,666 ¥ 456,369 ¥ 30,703
Accounts payable ¥ 27,580 ¥ 27,580 ¥ —Income taxes payable 22,494 22,494 —Deposit received 10,404 10,404 —Current portion of long-term bank loans and long-term bank loans 95,789 95,789 —Deposits received for guarantees 32,212 32,112 (100)Total ¥ 188,479 ¥ 188,379 ¥ (100)

35
Millions of Yen
March 31, 2020Carrying Amount Fair Value
Unrealized Gain/Loss
Cash and cash equivalents ¥ 159,902 ¥ 159,902 ¥ —Money held in trust 14,000 14,000 —Short-term investments 28 28 —Notes and accounts receivable 76,457Allowance for doubtful accounts (73)
76,384 76,384 —Marketable and investment securities:
Held-to-maturity securities 30 30 0 Investments in an associated company 14,935 31,932 16,997Available-for-sale securities 26,418 26,418 —
Operating loans 127,592Allowance for doubtful accounts (274)
127,318 127,496 178 Total ¥ 419,015 ¥ 436,190 ¥ 17,175
Accounts payable ¥ 54,760 ¥ 54,760 ¥ —Income taxes payable 30,082 30,082 —Deposit received 10,004 10,004 —Current portion of long-term bank loans and long-term bank loans 82,750 82,750 —Deposits received for guarantees 33,645 33,492 (153)Total ¥ 211,241 ¥ 211,088 ¥ (153)
Thousands of U.S. Dollars
March 31, 2021Carrying Amount Fair Value
Unrealized Gain/Loss
Cash and cash equivalents $ 1,795,321 $ 1,795,321 $ —Money held in trust 121,940 121,940 —Short-term investments 2,105 2,105 —Notes and accounts receivable 468,621Allowance for doubtful accounts (624)
467,997 467,997 —Marketable and investment securities:
Investments in an associated company 133,746 410,243 276,497Available-for-sale securities 234,189 234,189 —
Operating loans 1,092,765Allowance for doubtful accounts (3,189)
1,089,576 1,090,407 831Total $ 3,844,874 $ 4,122,202 $ 277,328
Accounts payable $ 249,119 $ 249,119 $ —Income taxes payable 203,179 203,179 —Deposit received 93,975 93,975 —Current portion of long-term bank loans and long-term bank loans 865,225 865,225 —Deposits received for guarantees 290,958 290,056 (902)Total $ 1,702,456 $ 1,701,554 $ (902)

36
Cash and Cash Equivalents, Notes and Accounts Receivable and Short-Term Investments
The carrying amounts of the accounts presented above approximate fair value because of their short
maturities.
Money Held in Trust
The fair value of money held in trust is measured based on the financial instruments which comprise the
money held in trust. At the end of the fiscal year ended March 31, 2021 and 2020, all of the financial instru-
ments that comprise money held in trust were deposits. As the carrying amount of this account approximates
fair value, the carrying amount is treated as its fair value.
Marketable and Investment Securities
The fair values of marketable and investment securities are measured at the quoted market price of the stock
exchange for the equity instruments, and at the quoted price obtained from the financial institution for certain
debt instruments. Fair value information for marketable and investment securities by classification is included in
Note 5.
Operating Loans
The fair value of operating loans with floating-rates approximates its carrying amount because the rate reflects
market interest rates within a short period of time except for significant changes in credit conditions of debtors.
Loans with fixed rates consist of short-term bridge loans and long-term loans. The fair value of operating loans
approximates its carrying amount because the rate reflects market interest rates. The fair value of long-term
loans is determined based on the present value calculated by using discount rates corresponding to the remain-
ing period of the loan and credit risk.
Accounts Payable, Income Taxes Payable, and Deposits Received
The carrying amount of the accounts mentioned above approximate fair value because of their short maturities.
Current Portion of Long-Term Loans and Long-Term Loans
For the current portion of long-term loans and for long-term loans that have floating interest rates, the fair val-
ues approximate the carrying amount because the rates reflect market interest rates within a short period of
time.
Deposits Received for Guarantees
The fair value of deposits received for guarantees is determined based on the present value calculated by using
discount rates corresponding to credit risk and the remaining period of deposits received for the guarantees.
(b) Carrying amount of financial instruments whose fair value cannot be reliably determined
Millions of YenThousands ofU.S. Dollars
2021 2020 2021
Subordinated bonds and subordinated trust beneficiary rights
¥ 9,384 ¥ 10,643 $ 84,762
Investments in equity instruments that do not have a quoted market price in an active market
¥ 5,898 ¥ 5,723 $ 53,274
Investments in other companies ¥ 3,609 ¥ 2,723 $ 32,599

37
(4) Maturity Analysis for Financial Assets and Securities with Contractual MaturitiesMillions of Yen
March 31, 2021
Due in 1 Year or
Less
Due after 1 Year
through 2 Years
Due after 2 Years through 3 Years
Due after 3 Years through 4 Years
Due after 4 Years through 5 Years
Due after 5 Years
Cash and cash equivalents ¥ 198,760 ¥ — ¥ — ¥ — ¥ — ¥ —Money held in trusts 13,500 — — — — —Short-term investments 233 — — — — —Notes and accounts receivable 51,881 — — — — —Investment securities:
Held-to-maturity securities — — — — — —
Available-for-sales securities with contractual maturities
1,500 3,100 1,000 — 18 —
Others — — — — — 300Operating loans 39,742 5,545 5,291 5,074 4,863 60,465
Subordinated bonds and subordinated trust beneficiary rights
— — — — — 9,563
Total ¥ 305,616 ¥ 8,645 ¥ 6,291 ¥ 5,074 ¥ 4,881 ¥ 70,328
Millions of Yen
March 31, 2020
Due in 1 Year or
Less
Due after 1 Year
through 2 Years
Due after 2 Years through 3 Years
Due after 3 Years through 4 Years
Due after 4 Years through 5 Years
Due after 5 Years
Cash and cash equivalents ¥ 159,902 ¥ — ¥ — ¥ — ¥ — ¥ —Money held in trusts 14,000 — — — — —Short-term investments 28 — — — — —Notes and accounts receivable 76,457 — — — — —Investment securities:
Held-to-maturity securities 30 — — — — —
Available-for-sales securities with contractual maturities
4,000 1,500 3,100 1,000 — 300
Operating loans 77,074 4,065 3,797 3,509 3,247 35,900
Subordinated bonds and subordinated trust beneficiary rights
— — — — — 10,821
Total ¥ 331,491 ¥ 5,565 ¥ 6,897 ¥ 4,509 ¥ 3,247 ¥ 47,021
Thousands of U.S. Dollars
March 31, 2021
Due in 1 Year or
Less
Due after 1 Year
through 2 Years
Due after 2 Years through 3 Years
Due after 3 Years through 4 Years
Due after 4 Years through 5 Years
Due after 5 Years
Cash and cash equivalents $1,795,321 $ — $ — $ — $ — $ —Money held in trusts 121,940 — — — — —Short-term investments 2,105 — — — — —Notes and accounts receivable 468,621 — — — — —Investment securities:
Held-to-maturity securities — — — — — —
Available-for-sale securities with contractual maturities
13,548 28,001 9,032 — 162 —
Others — — — — — 2,710Operating loans 358,974 50,086 47,792 45,831 43,926 546,156
Subordinated bonds and subordinated trust beneficiary rights
— — — — — 86,379
Total $2,760,509 $ 78,087 $ 56,824 $ 45,831 $ 44,088 $ 635,245

38
Please see Note 10 for annual maturities of long-term bank loans.
19. DERIVATIVES
Derivative Transactions to Which Hedge Accounting Is AppliedMillions of Yen
March 31, 2021 Hedged Item Contract AmountContract Amount Due after 1 Year Fair Value
Foreign currency forward contracts:
Buying U.S.$ Forecasted transactions
¥ 5,565 ¥ 1,025 ¥ 385
March 31, 2020
Foreign currency forward contracts:
Buying U.S.$ Forecasted transactions
¥ 11,532 ¥ 4,538 ¥ 372
Thousands of U.S. Dollars
March 31, 2021 Hedged Item Contract AmountContract Amount Due after 1 Year Fair Value
Foreign currency forward contracts:
Buying U.S.$ Forecasted transactions
$ 50,266 $ 9,258 $ 3,478
The fair value of derivative transactions is measured at the quoted price obtained from the financial institution.
The contract or notional amounts of derivatives which are shown in the above table do not represent the
amounts exchanged by the parties and do not measure the Group's exposure to credit or market risk.

39
20. OTHER COMPREHENSIVE INCOME (LOSS)
The components of other comprehensive income (loss) for the years ended March 31, 2021 and 2020, were as
follows:
Millions of YenThousands ofU.S. Dollars
2021 2020 2021
Unrealized gain (loss) on available-for-sale securities:Gains arising during the year ¥ 4,946 ¥ (7,647) $ 44,675Reclassification adjustments to profit or loss (745) (834) (6,729)Amount before income tax effect 4,201 (8,481) 37,946Income tax effect (1,332) 2,761 (12,031)Total ¥ 2,869 ¥ (5,720) $ 25,915
Deferred gain on derivatives under hedge accounting:
Gains arising during the year ¥ 13 ¥ 51 $ 117Reclassification adjustments to profit or loss — — —Amount before income tax effect 13 51 117Income tax effect (4) (15) (36)Total ¥ 9 ¥ 36 $ 81
Foreign currency translation adjustments:Adjustments arising during the year ¥ (1,965) ¥ (634) $ (17,749)Reclassification adjustments to profit or loss — — —Amount before income tax effect (1,965) (634) (17,749)Income tax effect — — —Total ¥ (1,965) ¥ (634) $ (17,749)
Defined retirement benefit plans:Adjustments arising during the year ¥ 193 ¥ (2,018) $ 1,743Reclassification adjustments to profit or loss 1,369 1,989 12,366Amount before income tax effect 1,562 (29) 14,109Income tax effect (480) 15 (4,336)Total ¥ 1,082 ¥ (14) $ 9,773
Total other comprehensive income (loss) ¥ 1,995 ¥ (6,332) $ 18,020

40
21. NET INCOME PER SHARE
Reconciliation of the differences between basic and diluted net income per share ("EPS") for the years ended
March 31, 2021 and 2020, is as follows:
Millions of YenThousands of Shares Yen U.S. Dollars
Year Ended March 31, 2021
Net IncomeAttributable to Owners of the
ParentWeighted-Average
Shares EPS
Basic EPS—Net income available to common shareholders
¥ 62,286 68,497 ¥ 909.31 $ 8.21
Effect of dilutive securitiesStock option 34Stock option of consolidated subsidiary ¥ (2)Diluted EPS—Net income for computation ¥ 62,284 68,531 ¥ 908.84 $ 8.21
Year Ended March 31, 2020
Basic EPS—Net income available to common shareholders
¥ 90,381 69,167 ¥ 1,306.71
Effect of dilutive securitiesStock option 47Stock option of consolidated subsidiary ¥ (4)Diluted EPS—Net income for computation ¥ 90,377 69,214 ¥ 1,305.77
22. SUBSEQUENT EVENTS
Appropriation of Retained Earnings
The following appropriation of retained earnings at March 31, 2021, was approved at the Company's sharehold-
ers' meeting held on June 25, 2021:
Millions of YenThousands ofU.S. Dollars
Year-end cash dividends, ¥251 ($2.27) per share ¥ 17,285 $ 156,129
23. SEGMENT INFORMATION
Under ASBJ statement No. 17, "Accounting Standard for Segment Information Disclosures," and ASBJ Guidance
No. 20, "Guidance on Accounting Standard for Segment Information Disclosures," an entity is required to report
financial and descriptive information about its reportable segments. Reportable segments are operating seg-
ments or aggregations of operating segments that meet specified criteria. Operating segments are compo-
nents of an entity about which separate financial information is available and such information is evaluated regu-
larly by the chief operating decision maker in deciding how to allocate resources and in assessing performance.
Generally, segment information is required to be reported on the same basis as is used internally for evaluating
operating segment performance and deciding how to allocate resources to operating segments.
(1) Description of Reportable Segments
The Group's reportable segments are those for which separate financial information is available and regular
evaluation by the Company's management is being performed in order to decide how resources are allocated
among the Group.
The Company is engaged in the construction of apartments to foster effective utilization by customers. Daito

41
Kentaku Partners Co., Ltd., a consolidated subsidiary, enters into whole-building leases as a “Lease manage-
ment trust system” whereby it rents all apartments from landowners and subleases them to tenants. Daito
Finance Corporation provides operating loans to landowners to fund construction projects. The Company cre-
ates management strategies and develops business activities for these operations.
Therefore, the Group consists of three reportable segments as follows:
Construction: civil engineering, construction, and other related business
Real estate: whole-building lease, rent, agency, guarantee of tenant and management business
Finance: construction finance business for landowners until financial institution executes long-term loans
(2) Methods of Measurement for the Amounts of Sales, Profit (Loss), Assets and Other Items for Each
Reportable Segment
The accounting policies of each reportable segment are consistent with those disclosed in Note 2, "Summary
of Significant Accounting Policies."
(3) Information about Sales, Profit (Loss), Assets and Other ItemsMillions of Yen
2021Reportable Segment
Construction Real Estate Finance Total Other Total Reconciliations Consolidated
Sales:
Sales to external customers
¥ 401,710 ¥1,014,262 ¥ 10,018 ¥1,425,990 ¥ 62,925 ¥1,488,915 ¥ — ¥1,488,915
Intersegment sales or transfers
1 4,225 14,972 19,198 545 19,743 (19,743) —
Total ¥ 401,711 ¥1,018,487 ¥ 24,990 ¥1,445,188 ¥ 63,470 ¥1,508,658 ¥ (19,743) ¥1,488,915
Segment profit (loss) ¥ 32,631 ¥ 63,273 ¥ 5,569 ¥ 101,473 ¥ 7,793 ¥ 109,266 ¥ (22,528) ¥ 86,738
Segment assets 100,508 339,588 136,820 576,916 141,290 718,206 201,249 919,455
Other:
Increase in property, plant and equipment and intangible assets
2,342 4,375 31 6,748 6,057 12,805 548 13,353
Depreciation 6,516 5,896 174 12,586 2,840 15,426 375 15,801
Amortization of goodwill
— 14 — 14 344 358 — 358
Impairment losses of assets
109 46 — 155 — 155 — 155
Goodwill at March 31, 2021
— 943 — 943 11,282 12,225 — 12,225

42
Millions of Yen
2020Reportable Segment
Construction Real Estate Finance Total Other Total Reconciliations Consolidated
Sales:
Sales to external customers
¥ 551,104 ¥ 973,694 ¥ 9,241 ¥1,534,039 ¥ 52,254 ¥1,586,293 ¥ — ¥1,586,293
Intersegment sales or transfers
81 4,479 1,024 5,584 909 6,493 (6,493) —
Total ¥ 551,185 ¥ 978,173 ¥ 10,265 ¥1,539,623 ¥ 53,163 ¥1,592,786 ¥ (6,493) ¥1,586,293
Segment profit (loss) ¥ 77,392 ¥ 56,515 ¥ 3,658 ¥ 137,565 ¥ 9,063 ¥ 146,628 ¥ (18,671) ¥ 127,957
Segment assets 131,487 327,979 139,854 599,320 116,696 716,016 164,273 880,289
Other:
Increase in property, plant and equipment and intangible assets
3,292 7,986 119 11,397 11,134 22,531 3,642 26,173
Depreciation 6,284 5,704 191 12,179 2,791 14,970 32 15,002
Amortization of goodwill
— 6 — 6 — 6 68 74
Impairment losses of assets
— 34 — 34 — 34 — 34
Goodwill at March 31, 2020
— 106 — 106 937 1,043 — 1,043
Thousands of U.S. Dollars
2021Reportable Segment
Construction Real Estate Finance Total Other Total Reconciliations Consolidated
Sales:
Sales to external customers
$ 3,628,489 $ 9,161,431 $ 90,488 $ 12,880,408 $ 568,377 $ 13,448,785 $ — $ 13,448,785
Intersegment sales or transfers
9 38,163 135,236 173,408 4,923 178,331 (178,331) —
Total $ 3,628,498 $ 9,199,594 $ 225,724 $ 13,053,816 $ 573,300 $ 13,627,116 $ (178,331) $ 13,448,785
Segment profit (loss) $ 294,743 $ 571,520 $ 50,303 $ 916,566 $ 70,391 $ 986,957 $ (203,487) $ 783,470
Segment assets 907,850 3,067,365 1,235,841 5,211,056 1,276,217 6,487,273 1,817,803 8,305,076
Other:
Increase in property, plant and equipment and intangible assets
21,154 39,518 280 60,952 54,710 115,662 4,950 120,612
Depreciation 58,856 53,256 1,572 113,684 25,653 139,337 3,387 142,724
Amortization of goodwill
— 126 — 126 3,108 3,234 — 3,234
Impairment losses of assets
985 415 — 1,400 — 1,400 — 1,400
Goodwill at March 31, 2021
— 8,518 — 8,518 101,906 110,424 — 110,424

43
Notes for the year ended March 31, 2021(1) The reconciliations in segment profit include elimination of intersegment trades of ¥-907 million ($-8,193 thousand) and corporate expenses
not allocated to a reportable segment of ¥-21,621 million ($-195,294 thousand). Corporate expenses are mainly the Company’s general administration expenses.
(2) The reconciliations in segment assets include elimination of intersegment trades of ¥-8,794million ($-79,433 thousand) and corporate assets not allocated to a reportable segment of ¥210,043 million ($1,897,236 thousand). Corporate assets are mainly short-term investments and investment securities held by the Company and other assets of administrative departments.
(3) Consolidated segment profit is equal to operating income in the consolidated statement of income. Consolidated segment assets are equal to total assets in the consolidated balance sheet.
Notes for the year ended March 31, 2020(4) The reconciliations in segment profit include elimination of intersegment trades of ¥-855 million and corporate expenses not allocated to a
reportable segment of ¥-17,816 million. Corporate expenses are mainly the Company’s general administration expenses.(5) The reconciliations in segment assets include elimination of intersegment trades of ¥8,562 million and corporate assets not allocated to a
reportable segment of ¥172,835 million. Corporate assets are mainly short-term investments and investment securities held by the Company and other assets of administrative departments.
(6) Consolidated segment profit is equal to operating income in the consolidated statement of income. Consolidated segment assets are equal to total assets in the consolidated balance sheet.

44
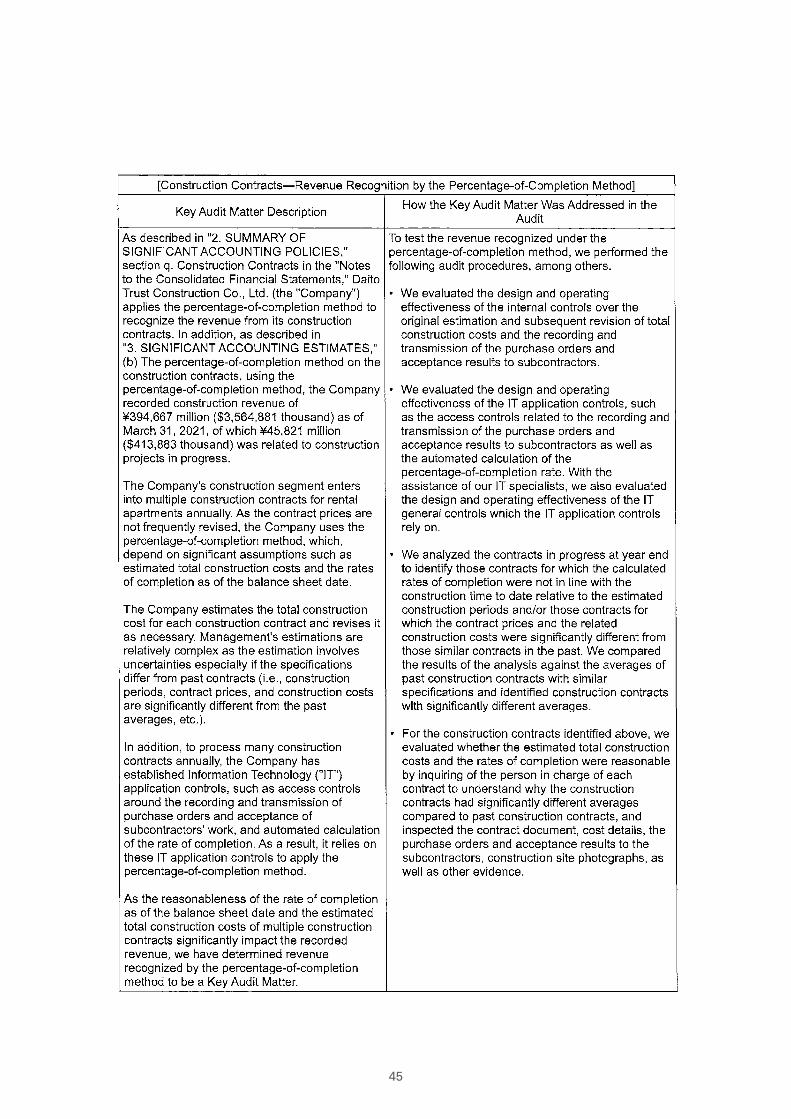
45
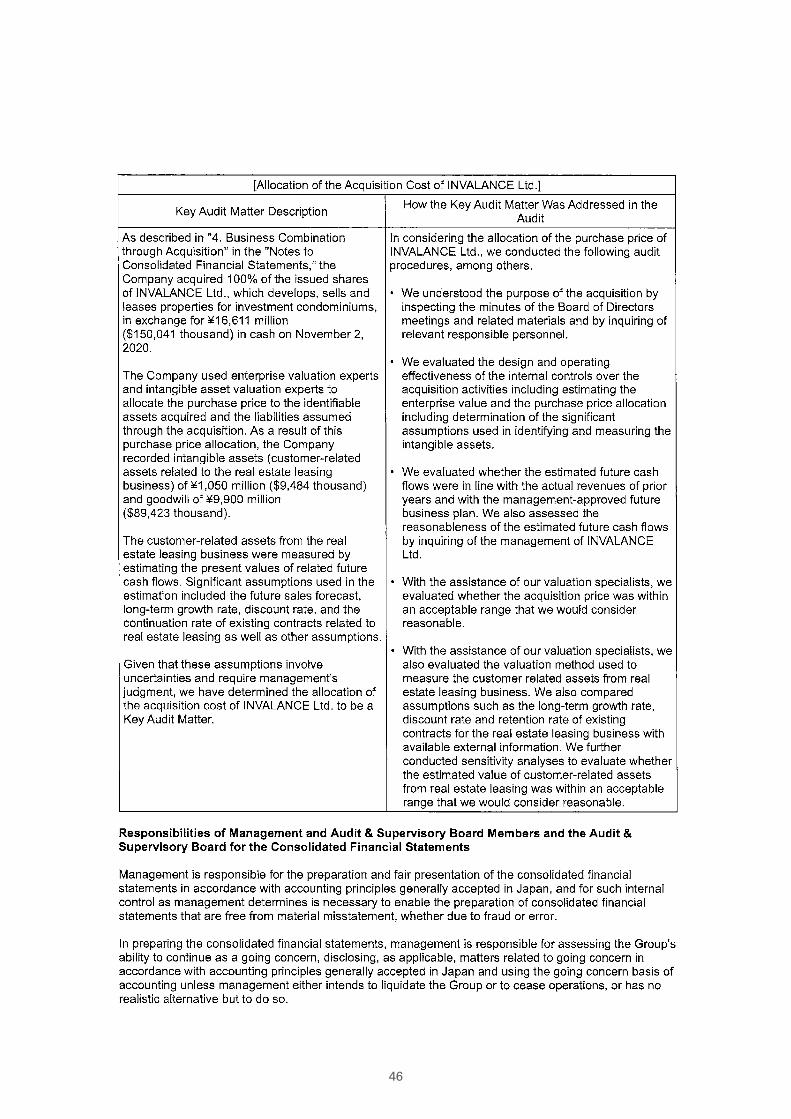
46

47

48