Embed Size (px)
Citation preview

Consolidated Financial Results
for the Six Months Ended June 30, 2018 [IFRS]
August 7, 2018
Company name : Sumitomo Rubber Industries, Ltd. Stock exchange listing : Tokyo Stock Exchange Code number : 5110 URL : http://www.srigroup.co.jp/ Representative : Ikuji Ikeda, President and CEO, Representative Director Contact : Takashi Kono, Executive Officer and General Manager, Financial Department Phone : +81-78-265-3000 Scheduled date of filing quarterly securities report : August 8, 2018 Scheduled date of commencing dividend payments : September 5, 2018 Supplementary documents for quarterly financial results : Yes Quarterly financial results briefing session : Yes (for institutional investors and analysts)
(Amounts of less than one million yen are rounded to the nearest unit.) 1. Consolidated Financial Results for the Six Months Ended June 30, 2018 (January 1, 2018 to June 30,
2018) (1) Consolidated Operating Results (% indicates changes from the previous corresponding period.)
Sales revenue Business profit Operating profit Profit attributable
to owners of parent
Comprehensive income
Six months ended Million yen % Million yen % Million yen % Million yen % Million yen % June 30, 2018 425,352 5.4 26,887 23.1 27,049 27.4 14,222 14.4 (12,750) - June 30, 2017 403,377 12.4 21,846 (28.0) 21,236 (27.1) 12,429 (31.0) 7,774 -
(Note) “Business profit” is “Sales revenue” subtracted by “Cost of sales” and “Selling, general and administrative expenses.”
Basic profit per share
Diluted profit per share
Business profit to sales revenue
ratio Six months ended Yen Yen % June 30, 2018 54.34 - 6.3 June 30, 2017 47.38 - 5.4
(2) Consolidated Financial Position
Total assets Total equity Total equity attributable to
owners of parent
Ratio of equity attributable to
owners of parent
Equity attributable to owners of
parent per share As of Million yen Million yen Million yen % Yen June 30, 2018 984,226 469,294 454,074 46.1 1,726.45 December 31, 2017 1,018,266 490,886 459,907 45.2 1,810.56
(3) Consolidated Cash Flows
Cash flows from operating activities
Cash flows from investing activities
Cash flows from financing activities
Cash and cash equivalents at end of period
Six months ended Million yen Million yen Million yen Million yen June 30, 2018 33,621 (35,042) 8,480 67,493 June 30, 2017 13,937 (67,458) 49,393 61,177

2. Dividends
Annual dividends
1st quarter-end
2nd quarter-end
3rd quarter-end Year-end Total
Fiscal year ended Yen Yen Yen Yen Yen December 31, 2017 - 25.00 - 30.00 55.00 December 31, 2018 - 30.00 Fiscal year ending December 31, 2018 (Forecast)
- 30.00 60.00
(Note) Revision to the dividends forecast announced most recently: None 3. Consolidated Financial Results Forecast for the Fiscal Year Ending December 31, 2018 (January 1, 2018
to December 31, 2018) (% indicates changes from the previous corresponding period.)
Sales revenue Business profit Operating profit Profit attributable
to owners of parent
Basic profit per share
Million yen % Million yen % Million yen % Million yen % Yen Full year 900,000 2.5 68,000 1.5 68,000 0.8 43,000 (8.5) 163.92
(Note) Revision to the financial results forecast announced most recently: Yes
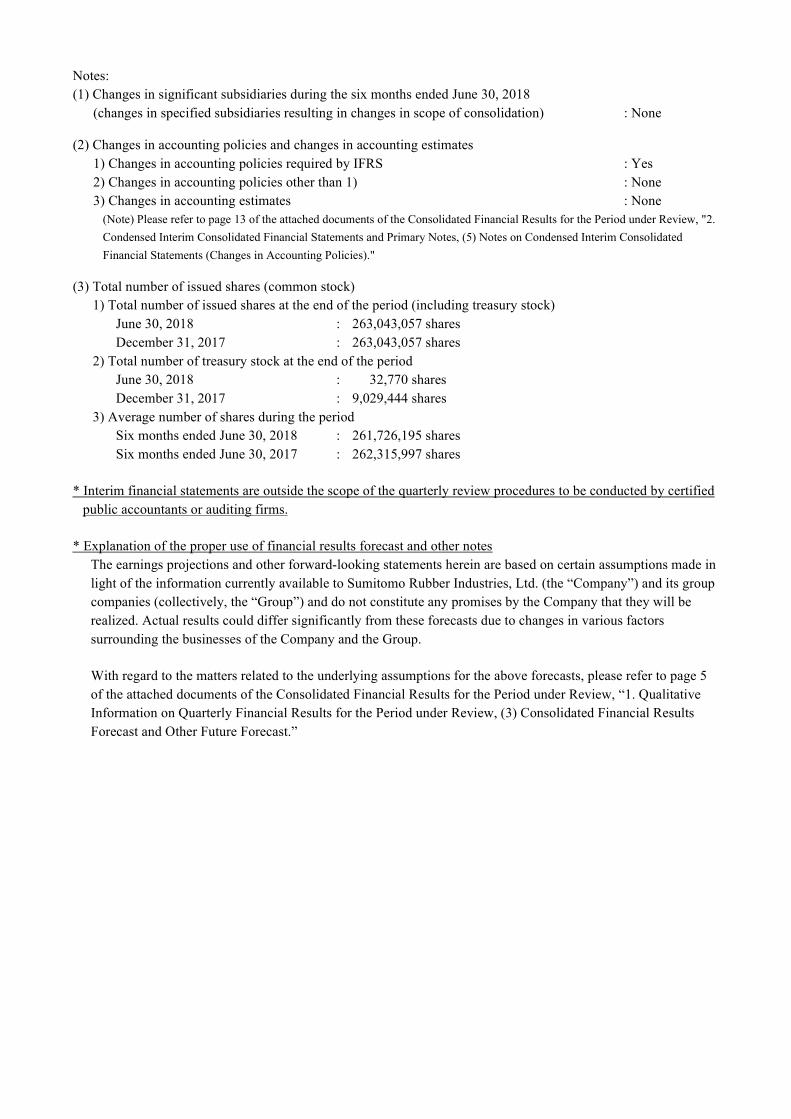
Notes: (1) Changes in significant subsidiaries during the six months ended June 30, 2018
(changes in specified subsidiaries resulting in changes in scope of consolidation) : None (2) Changes in accounting policies and changes in accounting estimates
1) Changes in accounting policies required by IFRS : Yes 2) Changes in accounting policies other than 1) : None 3) Changes in accounting estimates : None (Note) Please refer to page 13 of the attached documents of the Consolidated Financial Results for the Period under Review, "2. Condensed Interim Consolidated Financial Statements and Primary Notes, (5) Notes on Condensed Interim Consolidated Financial Statements (Changes in Accounting Policies)."
(3) Total number of issued shares (common stock)
1) Total number of issued shares at the end of the period (including treasury stock) June 30, 2018 : 263,043,057 shares December 31, 2017 : 263,043,057 shares
2) Total number of treasury stock at the end of the period June 30, 2018 : 32,770 shares December 31, 2017 : 9,029,444 shares
3) Average number of shares during the period Six months ended June 30, 2018 : 261,726,195 shares Six months ended June 30, 2017 : 262,315,997 shares
* Interim financial statements are outside the scope of the quarterly review procedures to be conducted by certified public accountants or auditing firms.
* Explanation of the proper use of financial results forecast and other notes
The earnings projections and other forward-looking statements herein are based on certain assumptions made in light of the information currently available to Sumitomo Rubber Industries, Ltd. (the “Company”) and its group companies (collectively, the “Group”) and do not constitute any promises by the Company that they will be realized. Actual results could differ significantly from these forecasts due to changes in various factors surrounding the businesses of the Company and the Group.
With regard to the matters related to the underlying assumptions for the above forecasts, please refer to page 5 of the attached documents of the Consolidated Financial Results for the Period under Review, “1. Qualitative Information on Quarterly Financial Results for the Period under Review, (3) Consolidated Financial Results Forecast and Other Future Forecast.”

Table of Contents
1. Qualitative Information on Quarterly Financial Results for the Period under Review .................................. 2
(1) Operating Results ........................................................................................................................................ 2
(2) Financial Position ....................................................................................................................................... 4
(3) Consolidated Financial Results Forecast and Other Future Forecast ......................................................... 5
2. Condensed Interim Consolidated Financial Statements and Primary Notes .................................................. 6
(1) Condensed Interim Consolidated Statement of Financial Position ............................................................. 6
(2) Condensed Interim Consolidated Statements of Income and Comprehensive Income .............................. 8
(3) Condensed Interim Consolidated Statements of Changes in Equity ......................................................... 10
(4) Condensed Interim Consolidated Statements of Cash Flows ................................................................... 12
(5) Notes on Condensed Interim Consolidated Financial Statements ............................................................ 13
(Notes on Going Concern Assumption) .................................................................................................... 13
(Changes in Accounting Policies) ............................................................................................................. 13
(Segment Information) .............................................................................................................................. 14
(Significant Subsequent Events) ............................................................................................................... 16
- 1 -
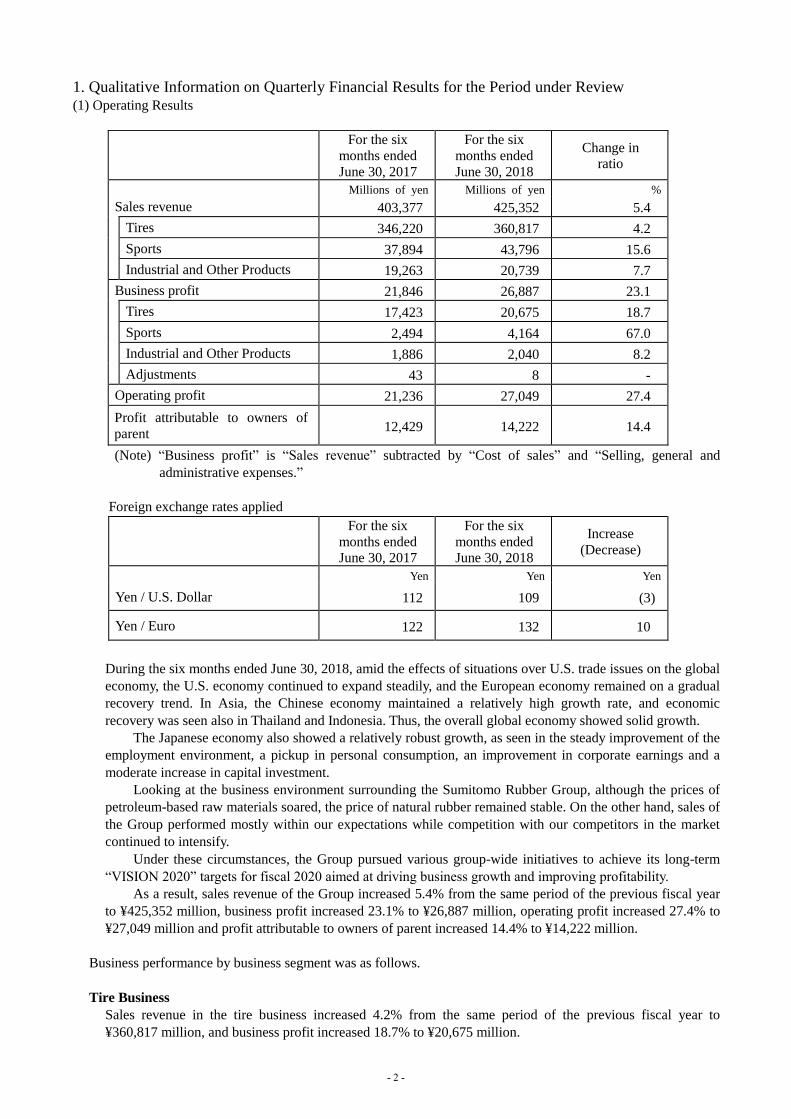
1. Qualitative Information on Quarterly Financial Results for the Period under Review (1) Operating Results
For the six
months ended
June 30, 2017
For the six
months ended
June 30, 2018
Change in
ratio
Millions of yen Millions of yen %
Sales revenue 403,377 425,352 5.4
Tires 346,220 360,817 4.2
Sports 37,894 43,796 15.6
Industrial and Other Products 19,263 20,739 7.7
Business profit 21,846 26,887 23.1
Tires 17,423 20,675 18.7
Sports 2,494 4,164 67.0
Industrial and Other Products 1,886 2,040 8.2
Adjustments 43 8 -
Operating profit 21,236 27,049 27.4
Profit attributable to owners of
parent 12,429 14,222 14.4
(Note) “Business profit” is “Sales revenue” subtracted by “Cost of sales” and “Selling, general and
administrative expenses.”
Foreign exchange rates applied
For the six
months ended
June 30, 2017
For the six
months ended
June 30, 2018
Increase
(Decrease)
Yen Yen Yen
Yen / U.S. Dollar 112 109 (3)
Yen / Euro 122 132 10
During the six months ended June 30, 2018, amid the effects of situations over U.S. trade issues on the global
economy, the U.S. economy continued to expand steadily, and the European economy remained on a gradual
recovery trend. In Asia, the Chinese economy maintained a relatively high growth rate, and economic
recovery was seen also in Thailand and Indonesia. Thus, the overall global economy showed solid growth.
The Japanese economy also showed a relatively robust growth, as seen in the steady improvement of the
employment environment, a pickup in personal consumption, an improvement in corporate earnings and a
moderate increase in capital investment.
Looking at the business environment surrounding the Sumitomo Rubber Group, although the prices of
petroleum-based raw materials soared, the price of natural rubber remained stable. On the other hand, sales of
the Group performed mostly within our expectations while competition with our competitors in the market
continued to intensify.
Under these circumstances, the Group pursued various group-wide initiatives to achieve its long-term
“VISION 2020” targets for fiscal 2020 aimed at driving business growth and improving profitability.
As a result, sales revenue of the Group increased 5.4% from the same period of the previous fiscal year
to ¥425,352 million, business profit increased 23.1% to ¥26,887 million, operating profit increased 27.4% to
¥27,049 million and profit attributable to owners of parent increased 14.4% to ¥14,222 million.
Business performance by business segment was as follows.
Tire Business
Sales revenue in the tire business increased 4.2% from the same period of the previous fiscal year to
¥360,817 million, and business profit increased 18.7% to ¥20,675 million.
- 2 -

In the domestic original equipment market, sales revenue exceeded the level of the same period of the
previous fiscal year, despite almost unchanged automobile production volume compared with the previous
quarterly period, due to an increase in sales volume by expanding sales of high-value-added tires, particularly
fuel-efficient tires.
In the domestic replacement market, sales revenue exceeded the level of the same period of the previous
fiscal year. Under the DUNLOP brand, we launched the “ENASAVE EC204,” fuel-efficient tires for
passenger cars providing “Long Life with Longer-lasting Performance” realized by the improved resistance
against wear and uneven abrasion, and expanded sales of high-value-added products including “LE MANS
V.” Under the FALKEN brand, we launched the “AZENIS FK510” series, new generation flagship tires for
passenger cars providing high steering stability at high-speeds and excellent wet performance, while making
efforts to enhance brand awareness, such as supporting Mr. Yoshihide Muroya, who will compete in the “Red
Bull Air Race World Championship 2018,” as “Team FALKEN.” In addition, snowfalls in the beginning of
the year led to favorable shipments of winter tires.
In the overseas original equipment market, sales revenue exceeded the level of the same period of the
previous fiscal year due to further increase of delivery mainly in Europe, North America and emerging
countries.
In the overseas replacement market, sales revenue exceeded the level of the same period of the previous
fiscal year. Despite sluggish consumption associated with political uncertainty in the Middle East, sales
volume increased mainly in Europe supported by the region’s continued economic expansion, as well as in
the U.K. market stemming from the acquisition of Micheldever Group Ltd., a British tire sales company, in
February 2017.
As a result, sales revenue and business profit in the tire business exceeded the level of the same period
of the previous fiscal year.
Sports Business
Sales revenue in the sports business increased 15.6% from the same period of the previous fiscal year to
¥43,796 million, and business profit increased 67.0% to ¥4,164 million.
In the golf goods market in Japan, “XXIO 10” golf clubs, which were launched in December 2017,
enjoyed favorable sales. Sales revenue exceeded the level of the same period of the previous fiscal year in the
golf goods market in Japan as a whole.
In overseas golf goods markets, “XXIO 10” golf clubs showed favorable sales, stronger than those of the
previous model. We also made aggressive efforts to expand sales of our brands “SRIXON,” “XXIO” and
“Cleveland Golf.” As a result, sales revenue exceeded the level of the same period of the previous fiscal year.
In the tennis business, revenue from the Japanese market fell below the level of the same period of the
previous fiscal year. However, sales in the overseas tennis business under the DUNLOP brand which was
acquired in the second quarter of the previous fiscal year contributed to an increase in revenue.
In the wellness business, due to a continued expansion in opening new compact gyms “Gym Style” as
well as a solid growth in membership of the existing gyms, sales revenue exceeded the level of the same
period of the previous fiscal year.
In addition, the licensing business also contributed to an increase in revenue. As a result, sales revenue
and business profit in the sports business exceeded the level of the same period of the previous fiscal year.
On January 1, 2018, the Group integrated its sports business by merging Company’s subsidiary Dunlop
Sports Co. Ltd., and Dunlop International Co. Ltd. into the Company through absorption-type mergers.
Industrial and Other Products Business
Sales revenue in the industrial and other products business increased 7.7% from the same period of the
previous fiscal year to ¥20,739 million, and business profit increased 8.2% to ¥2,040 million.
In the business of vibration control dampers, under the “MIRAIE” brand, a series of vibration control
units for housing, sales grew strongly. In the business of precision rubber parts for office machines, sales
revenue exceeded the level of the same period of the previous fiscal year due to an increase in production of
printers and photocopiers by major office machine manufacturers. In the business of infrastructure-based
products, sales revenue exceeded the level of the same period of the previous fiscal year due to a strong
increase in orders received relating to sports facilities in the private sector, as well as the acquisition of Sports
Surface Co., Ltd., a company engaging in the design and construction of domestic tennis courts, in January
2018.
As a result, sales revenue and business profit in the industrial and other products business exceeded the
- 3 -

level of the same period of the previous fiscal year.
(2) Financial Position
As of December
31, 2017
As of June
30, 2018
Increase
(Decrease)
Millions of yen Millions of yen Millions of yen
Total assets 1,018,266 984,226 (34,040)
Total equity 490,886 469,294 (21,592)
Total equity attributable to
owners of parent 459,907 454,074 (5,833)
Total equity attributable to
owners of parent ratio (%) 45.2 46.1 0.9
Equity attributable to owners of
parent per share 1,810.56 yen 1,726.45 yen (84.11) yen
The financial position of the Group at the end of the second quarter of the consolidated fiscal year under
review was as follows.
Total assets decreased ¥34,040 million from the end of the previous fiscal year to ¥984,226 million mainly as
a result of a decrease in trade and other receivables due to seasonal factors.
Total liabilities decreased ¥12,448 million from the end of the previous fiscal year to ¥514,932 million
mainly as a result of a decrease in trade and other payables.
Total equity as of June 30, 2018 decreased ¥21,592 million from the end of the previous fiscal year to
¥469,294 million, of which equity attributable to owners of parent accounted for ¥454,074 million, and non-
controlling interests accounted for ¥15,220 million. Treasury stocks and non-controlling interests decreased
due to merger with the Company’s subsidiary Dunlop Sports Co. Ltd. effective on January 1, 2018, in which
shares in the Company were allotted to the non-controlling shareholders of Dunlop Sports Co. Ltd. Also, due
to decrease in other components of equity, which was affected by foreign exchange rates, equity attributable
to owners of parents decreased ¥5,833 million, and non-controlling interests decreased ¥15,759 million
compared with the end of the previous fiscal year. As a result, equity attributable to owners of parent ratio
was 46.1%, and equity attributable to owners of parent per share was ¥1,726.45.
- 4 -

(3) Consolidated Financial Results Forecast and Other Future Forecast
Profit for the six months ended June 30, 2018 exceeded the initial plan. However, to reflect effects from the
recent fluctuations in raw material prices and other factors, revisions have been made as follows to the full
year financial results forecast in the Consolidated Financial Results for the Three Months Ended March 31,
2018, which we announced on May 8, 2018.
Consolidated Financial Results Forecast for the Fiscal Year Ending December 31, 2018 (January 1, 2018 to
December 31, 2018)
Revised
Forecast
Previous
forecast
Increase
(Decrease)
Change in
ratio
(Reference)
Results for the
same period of
the previous
year
Millions of yen Millions of yen Millions of yen % Millions of yen
Sales revenue 900,000 910,000 (10,000) (1.1) 877,866
Tires 775,000 785,000 (10,000) (1.3) 756,576
Sports 85,000 85,000 - - 81,734
Industrial and
Other Products 40,000 40,000 - - 39,556
Business profit 68,000 73,000 (5,000) (6.8) 66,975
Tires 59,000 65,000 (6,000) (9.2) 58,341
Sports 4,500 4,000 500 12.5 4,372
Industrial and
Other Products 4,500 4,000 500 12.5 4,229
Adjustments - - - - 33
Operating profit 68,000 73,000 (5,000) (6.8) 67,449
Profit attributable
to owners of parent 43,000 48,000 (5,000) (10.4) 46,979
Foreign exchange rates applied
Revised
forecast
Previous
forecast
Increase
(Decrease)
(Reference)
Rate applied for
the same period
of the previous
year
Yen Yen Yen Yen
Yen / U.S. Dollar 109 108 1 112
Yen / Euro 131 132 (1) 127
The results forecast and other forward-looking statements herein are based on certain assumptions made
in light of the information currently available to the Company and the Group as of the date of the release of
this document and include potential risks and uncertainty. Actual results could differ significantly from these
forecasts due to changes in various factors surrounding the businesses of the Company and the Group.
- 5 -

2. Condensed Interim Consolidated Financial Statements and Primary Notes
(1) Condensed Interim Consolidated Statement of Financial Position
(Millions of yen)
As of December 31, 2017 As of June 30, 2018
Assets
Current assets
Cash and cash equivalents 64,528 67,493
Trade and other receivables 209,308 173,706
Other financial assets 9,195 8,391
Inventories 159,010 181,593
Other current assets 23,932 23,236
Total current assets 465,973 454,419
Non-current assets
Property, plant and equipment 379,747 364,533
Goodwill 35,202 34,737
Intangible assets 49,989 46,962
Investments accounted for using equity method 4,171 4,249
Other financial assets 37,098 35,385
Net defined benefit asset 25,378 25,260
Deferred tax assets 15,172 13,392
Other non-current assets 5,536 5,289
Total non-current assets 552,293 529,807
Total assets 1,018,266 984,226
- 6 -

(Millions of yen)
As of December 31, 2017 As of June 30, 2018
Liabilities and equity
Liabilities
Current liabilities
Bonds and loans payable 116,477 145,652
Trade and other payables 136,100 115,860
Other financial liabilities 1,776 2,160
Income tax payable 5,602 7,708
Provisions 6,782 3,377
Other current liabilities 36,562 36,024
Total current liabilities 303,299 310,781
Non-current liabilities
Bonds and loans payable 152,424 136,349
Other financial liabilities 3,644 3,494
Net defined benefit liability 21,680 21,612
Provisions 1,199 1,212
Deferred tax liabilities 22,382 19,820
Other non-current liabilities 22,752 21,664
Total non-current liabilities 224,081 204,151
Total liabilities 527,380 514,932
Equity
Capital stock 42,658 42,658
Capital surplus 37,865 39,487
Retained earnings 428,799 430,235
Treasury stock (17,631) (65)
Other components of equity (31,784) (58,241)
Total equity attributable to owners of parent 459,907 454,074
Non-controlling interest 30,979 15,220
Total equity 490,886 469,294
Total liabilities and equity 1,018,266 984,226
- 7 -

(2) Condensed Interim Consolidated Statements of Income and Comprehensive Income
Condensed Interim Consolidated Statements of Income
(Millions of yen)
For the six months ended June 30, 2017
For the six months ended June 30, 2018
Sales revenue 403,377 425,352
Cost of sales (285,139) (297,861)
Gross profit 118,238 127,491
Selling, general and administrative expenses (96,392) (100,604)
Business profit 21,846 26,887
Other income 902 1,146
Other expenses (1,512) (984)
Operating profit 21,236 27,049
Financial income 1,727 1,456
Financial expenses (2,371) (5,129)
Equity in earnings of affiliates 28 79
Profit before tax 20,620 23,455
Income tax expenses (6,903) (8,475)
Profit 13,717 14,980
Profit attributable to:
Owners of parent 12,429 14,222
Non-controlling interests 1,288 758
Profit 13,717 14,980
Profit per share
Basic profit per share (Yen) 47.38 54.34
- 8 -

Condensed Interim Consolidated Statements of Comprehensive Income
(Millions of yen)
For the six months ended June 30, 2017
For the six months ended June 30, 2018
Profit 13,717 14,980
Other comprehensive income
Items that will not be reclassified to profit or loss
Financial assets measured at fair value through other comprehensive income
669 (760)
Items that may be reclassified subsequently to profit or loss
Cash flow hedges (556) 158
Currency translation differences of foreign operations
(6,056) (27,128)
Other comprehensive income, net of tax (5,943) (27,730)
Comprehensive income 7,774 (12,750)
Comprehensive income attributable to:
Owners of parent 6,941 (12,075)
Non-controlling interests 833 (675)
Comprehensive income 7,774 (12,750)
- 9 -

(3) Condensed Interim Consolidated Statements of Changes in Equity
For the six months ended June 30, 2017
(Millions of yen)
Equity attributable to owners of parent
Capital Stock
Capital surplus
Retained earnings
Treasury stock
Other components of equity Currency
translation differences of
foreign operations
Cash flow hedges
Balance as of January 1, 2017 42,658 37,937 389,970 (570) (49,657) (185)
Profit 12,429
Other comprehensive income (5,624) (557)
Total comprehensive income - - 12,429 - (5,624) (557)
Purchase of treasury stock (4)
Disposal of treasury stock 0 0
Dividends (6,558) Changes in ownership interests in subsidiaries that do not result in loss of control
Acquisition of non-controlling interests involving merger of consolidated subsidiaries
Transfer to retained earnings 83
Transfer to capital surplus
Other increase and decrease 280
Total transactions with owners - 0 (6,475) (4) - 280
Balance as of June 30, 2017 42,658 37,937 395,924 (574) (55,281) (462)
Equity attributable to owners of parent
Non- controlling
interests Total
Equity
Other components of equity
Total
Financial assets
measured at fair value
through other comprehensive
income
Remeasurements of defined
benefit plan Total
Balance as of January 1, 2017 9,163 - (40,679) 429,316 30,225 459,541
Profit - 12,429 1,288 13,717
Other comprehensive income 693 (5,488) (5,488) (455) (5,943)
Total comprehensive income 693 - (5,488) 6,941 833 7,774
Purchase of treasury stock - (4) (4)
Disposal of treasury stock - 0 0
Dividends - (6,558) (1,081) (7,639) Changes in ownership interests in subsidiaries that do not result in loss of control
- - 607 607
Acquisition of non-controlling interests involving merger of consolidated subsidiaries
- - -
Transfer to retained earnings (83) (83) - -
Transfer to capital surplus - - -
Other increase and decrease 280 280 280
Total transactions with owners (83) - 197 (6,282) (474) (6,756)
Balance as of June 30, 2017 9,773 - (45,970) 429,975 30,584 460,559
- 10 -
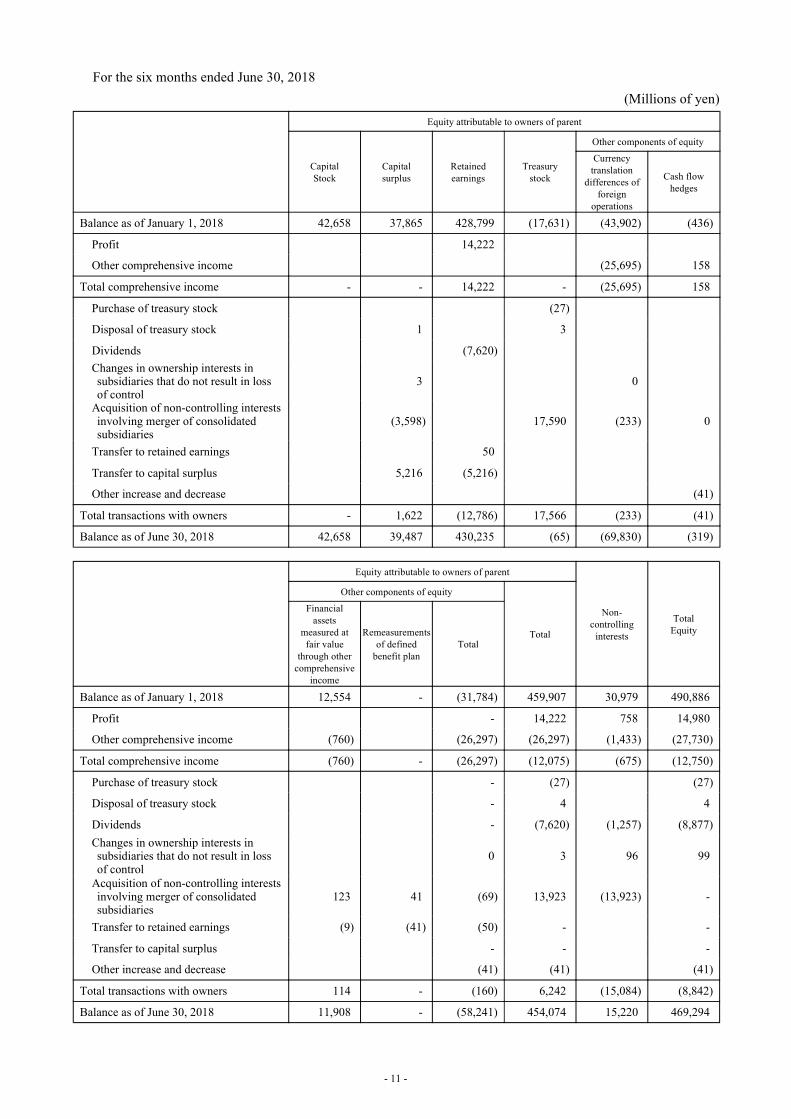
For the six months ended June 30, 2018
(Millions of yen)
Equity attributable to owners of parent
Capital Stock
Capital surplus
Retained earnings
Treasury stock
Other components of equity Currency
translation differences of
foreign operations
Cash flow hedges
Balance as of January 1, 2018 42,658 37,865 428,799 (17,631) (43,902) (436)
Profit 14,222
Other comprehensive income (25,695) 158
Total comprehensive income - - 14,222 - (25,695) 158
Purchase of treasury stock (27)
Disposal of treasury stock 1 3
Dividends (7,620) Changes in ownership interests in subsidiaries that do not result in loss of control
3 0
Acquisition of non-controlling interests involving merger of consolidated subsidiaries
(3,598) 17,590 (233) 0
Transfer to retained earnings 50
Transfer to capital surplus 5,216 (5,216)
Other increase and decrease (41)
Total transactions with owners - 1,622 (12,786) 17,566 (233) (41)
Balance as of June 30, 2018 42,658 39,487 430,235 (65) (69,830) (319)
Equity attributable to owners of parent
Non- controlling
interests Total
Equity
Other components of equity
Total
Financial assets
measured at fair value
through other comprehensive
income
Remeasurements of defined
benefit plan Total
Balance as of January 1, 2018 12,554 - (31,784) 459,907 30,979 490,886
Profit - 14,222 758 14,980
Other comprehensive income (760) (26,297) (26,297) (1,433) (27,730)
Total comprehensive income (760) - (26,297) (12,075) (675) (12,750)
Purchase of treasury stock - (27) (27)
Disposal of treasury stock - 4 4
Dividends - (7,620) (1,257) (8,877) Changes in ownership interests in subsidiaries that do not result in loss of control
0 3 96 99
Acquisition of non-controlling interests involving merger of consolidated subsidiaries
123 41 (69) 13,923 (13,923) -
Transfer to retained earnings (9) (41) (50) - -
Transfer to capital surplus - - -
Other increase and decrease (41) (41) (41)
Total transactions with owners 114 - (160) 6,242 (15,084) (8,842)
Balance as of June 30, 2018 11,908 - (58,241) 454,074 15,220 469,294
- 11 -

(4) Condensed Interim Consolidated Statements of Cash Flows
(Millions of yen)
For the six months ended June 30, 2017
For the six months ended June 30, 2018
Cash flows from operating activities Profit before tax 20,620 23,455 Depreciation and amortization 27,347 28,576 Interest and dividends income (1,324) (1,456) Interest expenses 2,151 2,219 Share of (profit) loss of entities accounted for using equity method
(28) (79)
Decrease (increase) in inventories (25,298) (29,586) Decrease (increase) in trade and other receivables 24,058 30,228 Increase (decrease) in trade and other payables (15,083) (14,102) Other, net (3,589) 1,114
Subtotal 28,854 40,369 Interest received 996 1,146 Dividend income received 321 301 Interest expenses paid (2,124) (2,004) Income taxes (paid) refund (14,110) (6,191) Net cash provided by (used in) operating activities 13,937 33,621
Cash flows from investing activities Purchase of property, plant and equipment (30,741) (32,306) Proceeds from sales of property, plants and equipment
440 164
Purchase of intangible assets (2,209) (1,381) Proceeds from sales of investment securities 253 - Purchase of shares of subsidiaries resulting in change in scope of consolidation
(34,827) (83)
Payment for transfer of business (348) (1,469) Other, net (26) 33 Net cash provided by (used in) investing activities (67,458) (35,042)
Cash flows from financing activities Net increase (decrease) in short-term loans payable 56,231 32,297 Proceeds from long-term debt and newly issued bonds
12,553 1,772
Repayments of long-term debt and redemption of bonds
(11,293) (15,945)
Proceeds from contributions of non-controlling interests
607 99
Cash dividends paid (6,558) (7,620) Cash dividends paid to non-controlling interests (1,081) (1,257) Other, net (1,066) (866) Net cash provided by (used in) financing activities 49,393 8,480
Effect of exchange rate change on cash and cash equivalents
(1,187) (4,094)
Net increase (decrease) in cash and cash equivalents (5,315) 2,965 Cash and cash equivalents at the beginning of current period
66,492 64,528
Cash and cash equivalents at the end of current period 61,177 67,493
- 12 -

(5) Notes on Condensed Interim Consolidated Financial Statements
(Notes on Going Concern Assumption)
None
(Changes in Accounting Policies)
Except for the policy listed below, significant accounting policies that the Group adopted in the condensed
interim consolidated financial statements under review are the same as those that were adopted in the
consolidated financial statements for the fiscal year ended December 31, 2017.
Income tax expenses for the six months ended June 30, 2018 were determined using the estimated average
annual effective income tax rate.
The Group has adopted the following standards from the three months ended March 31, 2018:
IFRS Description of new standards and revisions
IFRS 15 Revenue from Contracts
with Customers
Revision of accounting treatment for revenue
recognition
The Group has adopted IFRS 15 “Revenue from Contracts with Customers” (issued in May 2014) and
“Clarifications to IFRS 15” (issued in April 2016) (together referred to as “IFRS 15”) from the three months
ended March 31, 2018.
In applying IFRS 15, as permitted under transitional measures in this standard, the Group recognizes the
cumulative effect of applying this standard at the date of initial application.
In accordance with IFRS 15, except for revenue including interest and dividends income, etc. under IFRS
9 “Financial Instruments,” revenue is recognized by applying the following five-step approach:
Step 1: Identify the contract with a customer.
Step 2: Identify the performance obligation in the contract.
Step 3: Determine the transaction price.
Step 4: Allocate the transaction price to the performance obligation in the contract.
Step 5: Recognize revenue when (or as) the entity satisfies a performance obligation.
There are no material impacts resulting from the adoption of these standards and interpretations on the
Group’s consolidated financial results.
- 13 -

(Segment Information)
1. Information by reportable segment
Reportable segments of the Group are the units for which separate financial information is available and
periodically reviewed by the Board of Directors as the highest decision-making body for the purposes of
deciding the allocation of management resources and evaluating business performance.
The Group has three divisions based on operations in Tires, Sports and Industrial and Other Products.
Each division formulates comprehensive strategies for both domestic and overseas markets and develops
business activities.
Therefore, the Group identifies “Tires”, “Sports”, and “Industrial and Other Products” as reportable
segments.
Major products and services or details of business that belong to each reportable segment are as follows:
Reportable
segment Major products and services or details of business
Tires
Tires and tubes (for automobiles, construction vehicles, industrial vehicles, automotive
races and rallies, motorcycles, etc.)
Automotive system business (instant mobility systems, deflation warning systems, etc.)
Sports
Sporting goods (golf clubs, golf balls and other golf goods, tennis goods, etc.)
Operation of golf tournaments
Operation of golf and tennis schools
Fitness business, and others
Industrial
and Other
Products
High-performance rubber products (vibration control dampers, precision rubber parts for
office machines, precision rubber parts for medical use, etc.)
Daily life supplies (rubber gloves for cooking and other operations, ramps for wheelchair
use, etc.)
Products for infrastructure (marine dock fenders, flooring materials for factories and
sports facilities, etc.)
2. Reportable segment sales revenues and profit or loss
Inter-segment sales revenues are stated at wholesale prices based on current market values.
Figures for reportable segment are based on business profit.
Information for the reportable segments for the previous fiscal year and the current fiscal year is as
follows:
- 14 -

For the six months ended June 30, 2017 (January 1, 2017 to June 30, 2017)
(Millions of yen)
Reportable segment
Total Adjustments
(Note 2)
Amounts
recorded in
Condensed
Interim
Consolidated
Statements
of Income
Tires Sports
Industrial
and Other
Products
Sales revenue from
external customers 346,220 37,894 19,263 403,377 - 403,377
Inter-segment sales
revenue 12 113 355 480 (480) -
Total 346,232 38,007 19,618 403,857 (480) 403,377
Segment profit
(Business profit)
(Note 1) 17,423 2,494 1,886 21,803 43 21,846
Other income and
expenses (610)
Operating profit 21,236
(Notes)
1. “Segment profit (Business profit)” is “Sales revenue” subtracted by “Cost of sales” and “Selling, general and
administrative expenses.”
2. Segment profit included in “Adjustment” comprised elimination of inter-segment transactions.
For the six months ended June 30, 2018 (January 1, 2018 to June 30, 2018)
(Millions of yen)
Reportable segment
Total Adjustments
(Note 2)
Amounts
recorded in
Condensed
Interim
Consolidated
Statements
of Income
Tires Sports
Industrial
and Other
Products
Sales revenue from
external customers 360,817 43,796 20,739 425,352 - 425,352
Inter-segment sales
revenue 5 177 415 597 (597) -
Total 360,822 43,973 21,154 425,949 (597) 425,352
Segment profit
(Business profit)
(Note 1) 20,675 4,164 2,040 26,879 8 26,887
Other income and
expenses 162
Operating profit 27,049
(Notes)
1. “Segment profit (Business profit)” is “Sales revenue” subtracted by “Cost of sales” and “Selling, general and
administrative expenses.”
2. Segment profit included in “Adjustment” comprised elimination of inter-segment transactions.
- 15 -

(Significant Subsequent Events)
None
- 16 -