Embed Size (px)
Citation preview

Consolidated Draft Briefing Reports
Assessment and opinions on specific topics related to Aurora Energy’s June 2020 Customised Price Path application
Produced for the Commerce Commission
Draft for consultation
November 2020

Aurora CPP – review of forecast expenditure
2
Preface
Strata Energy Consulting Limited specialises in providing services relating to the energy industry and energy utilisation. The Company, which was established in 2003, provides advice to clients through its own resources and through a network of associate organisations. Strata Energy Consulting has completed work on a wide range of topics for clients in the energy sector in both New Zealand and overseas.
More information about Strata Energy Consulting can be found on www.strataenergy.co.nz
This report was prepared by:
William Heaps, Phillip Beardmore and Clive Bull, assisted by Strata’s associate consulting analyst Richard Heaps.
Strata Energy Consulting Limited
Level 2, 330, Lambton Quay
Wellington Central 6011
PO Box 25157
Wellington 6140
New Zealand
Phone: 04 471 0312
Mobile: 021 852 843
Email: [email protected]
While Strata Energy Consulting Ltd will use all reasonable endeavours in undertaking contract research and producing reports to ensure the information is as accurate as practicable, Strata Energy Consulting, its contributors, employees, and directors shall not be liable (whether in contract, tort (including negligence), equity or on any other basis) for any loss or damage sustained by any person relying on such work whatever the cause of such loss or damage.
Aurora CPP – review of forecast expenditure
3
Contents 1. INTRODUCTION, SCOPE AND APPROACH ................................................................................................5
2. BRIEFING REPORT 1 – CAPEX GROWTH AND SECURITY PROJECTS ..........................................................6
2.1. INTRODUCTION ........................................................................................................................................ 6 2.2. SCOPE OF WORK ....................................................................................................................................... 6 2.3. OUR APPROACH ....................................................................................................................................... 6 2.4. GENERAL QUESTIONS (G) FROM TABLE 1 ...................................................................................................... 7 2.5. PROJECT-SPECIFIC (P) QUESTIONS FROM TABLE 1 ......................................................................................... 14
3. BRIEFING REPORT 2 – CAPEX (ASSET RENEWALS) ................................................................................. 28
3.1. INTRODUCTION ...................................................................................................................................... 28 3.2. CAPEX – RENEWALS PROGRAMMES – CABLES AND TRANSFORMERS .................................................................. 28 3.3. ASSESSMENT OF POLICIES, STANDARDS AND PROCEDURES ............................................................................... 28 3.4. SUMMARY OF RECOMMENDED ADJUSTMENTS .............................................................................................. 32 3.5. SUB-TRANSMISSION CABLE RENEWALS PROGRAMME ..................................................................................... 34 3.6. DISTRIBUTION CABLE RENEWALS PROGRAMME ............................................................................................. 38 3.7. LOW VOLTAGE CABLE RENEWALS PROGRAMME ............................................................................................. 43 3.8. POLE MOUNTED DISTRIBUTION TRANSFORMER RENEWALS PROGRAMME............................................................ 47 3.9. GROUND MOUNTED DISTRIBUTION TRANSFORMER RENEWALS PROGRAMME ...................................................... 59
4. BRIEFING REPORT 3 – CAPEX (ASSET RENEWALS) ................................................................................. 62
4.1. INTRODUCTION ...................................................................................................................................... 62 4.2. CAPEX – RENEWALS PROGRAMMES – POLE MOUNTED FUSES, SWITCHES, ADSE, DC SYSTEMS, RTUS AND FACILITIES 62 4.3. ASSESSMENT OF THE REASONABLENESS OF THE EXPENDITURE PROGRAMME ....................................................... 64 4.4. ASSET FLEET SUMMARIES ......................................................................................................................... 66
5. OPEX BRIEFING REPORT 1 – EFFICIENCY OF RY19 MAINTENANCE OPEX ............................................... 76
5.1. INTRODUCTION ...................................................................................................................................... 76 5.2. OUR ASSESSMENT OF THE EFFICIENCY OF RY19 MAINTENANCE OPEX ................................................................ 77 5.3. ADVICE ON EFFICIENCY ADJUSTMENTS OVER THE 3-YEAR CPP PERIOD AND 5-YEAR REVIEW PERIOD ........................ 83
6. OPEX BRIEFING REPORT 2 – REASONABLENESS OF VEGETATION MANAGEMENT UNIT RATE ............... 84
6.1. INTRODUCTION ...................................................................................................................................... 84 6.2. IS AURORA’S ESTIMATION APPROACH LIKELY TO DELIVER AN EFFICIENT UNIT RATE? .............................................. 85 6.3. WHAT DOES BENCHMARKING REVEAL ABOUT THE UNIT RATE’S EFFICIENCY? ....................................................... 88 6.4. ADVICE ON EFFICIENCY ADJUSTMENTS OVER THE 3-YEAR CPP PERIOD AND 5-YEAR REVIEW PERIOD ........................ 94
7. OPEX BRIEFING REPORT 3 – USE OF NETWORK GROWTH FACTOR ........................................................ 95
7.1. INTRODUCTION ...................................................................................................................................... 95 7.2. ASSESSMENT OF USE OF NETWORK GROWTH FACTOR IN PROPOSED OPEX ........................................................... 96 7.3. ADVICE ON ADJUSTMENTS TO THE 3-YEAR CPP PERIOD AND 5-YEAR REVIEW PERIOD ........................................... 99
8. OPEX BRIEFING REPORT 4 – OPEX FOR DEFECTS, INSURANCE AND TRAINING .................................... 100
8.1. INTRODUCTION .................................................................................................................................... 100 8.2. ASSESSMENT OF REASONABLENESS OF PROPOSED INCREASE IN DEFECTS REQUIRING CORRECTIVE MAINTENANCE ...... 101 8.3. REASONABLENESS OF PROPOSED INCREASE IN INSURANCE PREMIA .................................................................. 106 8.4. ASSESSMENT OF REASONABLENESS OF PROPOSED INCREASE IN STAFF TRAINING EXPENDITURE .............................. 107
9. OPEX BRIEFING REPORT 5 – OPEX EFFICIENCY IMPROVEMENTS ......................................................... 109
9.1. INTRODUCTION .................................................................................................................................... 109 9.2. AURORA’S CONTRACTING AND ICT ARRANGEMENTS .................................................................................... 110 9.3. EFFICIENCY BENEFITS ARISING FROM AURORA’S ICT ARRANGEMENTS.............................................................. 110 9.4. EFFICIENCY BENEFITS ARISING FROM AURORA’S CONTRACTING ARRANGEMENTS................................................ 112 9.5. EFFICIENCY BENEFITS ARISING FROM AURORA’S PEOPLE AND PROCESS CHANGES ............................................... 113 9.6. AURORA’S TOP-DOWN EFFICIENCY ADJUSTMENTS APPEAR TO DELIVER INSUFFICIENT BENEFITS ............................. 114

Aurora CPP – review of forecast expenditure
4
9.7. WE HAVE REVISED UP AURORA’S EFFICIENCY BENEFITS RELATING TO ICT AND PEOPLE AND PROCESSES .................. 116 9.8. WE HAVE REVISED DOWN AURORA’S EFFICIENCY BENEFITS FOR VEGETATION MANAGEMENT ................................ 117 9.9. AURORA’S TREND EFFICIENCY ADJUSTMENTS .............................................................................................. 117 9.10. ADVICE ON EFFICIENCY ADJUSTMENTS OVER THE 3-YEAR CPP PERIOD AND 5-YEAR REVIEW PERIOD ...................... 119
10. OPEX BRIEFING REPORT 6 – SONS AND PEOPLE COSTS OPEX .............................................................. 122
10.1. INTRODUCTION .................................................................................................................................... 122 10.2. WHY THE EXPENDITURE UPLIFT? WHAT IS AURORA DOING THAT DELTA WAS NOT? ........................................... 125 10.3. HOW DOES AURORA MAKE DECISIONS ABOUT APPROPRIATE STAFFING LEVELS? ................................................. 130 10.4. BENCHMARKING AURORA’S SONS AND PEOPLE COSTS OPEX ........................................................................ 131 10.5. WE HAVE RESERVATIONS ABOUT USING A BASE-STEP-TREND APPROACH TO FORECAST SONS AND PEOPLE COSTS OPEX
139 10.6. AN EFFICIENT LEVEL OF STAFFING FOR A DISTRIBUTION NETWORK LIKE AURORA’S .............................................. 139 10.7. ADVICE ON ADJUSTMENTS TO THE 3-YEAR AND 5-YEAR CPP ......................................................................... 150
11. OPEX BRIEFING REPORT 7 – REVIEW OF MINOR OPEX ........................................................................ 156
11.1. INTRODUCTION .................................................................................................................................... 156 11.2. OUR ASSESSMENT OF THE REASONABLENESS OF THE NETWORK EVOLUTION PROGRAMME ................................... 157 11.3. OUR ASSESSMENT OF THE REASONABLENESS OF THE PREMISES AND PLANT PROGRAMME .................................... 159 11.4. OUR ASSESSMENT OF THE REASONABLENESS OF THE GOVERNANCE AND ADMINISTRATION PROGRAMME ................ 161
12. BRIEFING REPORT 11 – QUALITY RELIABILITY BENEFITS ...................................................................... 163
12.1. INTRODUCTION .................................................................................................................................... 163 12.2. SCOPE OF WORK ................................................................................................................................... 163 12.3. AURORA’S FORECASTING METHOD PROVIDES CONTEXT AND BACKGROUND ....................................................... 164 12.4. AURORA’S RELIABILITY PROJECTION AND HOW IT WAS DEVELOPED .................................................................. 165 12.5. AURORA’S RELIABILITY MODEL FOR UNPLANNED INTERRUPTIONS .................................................................... 165 12.6. OUR ASSESSMENT OF AURORA’S METHOD FOR SETTING RELIABILITY LEVELS ...................................................... 174 12.7. OUR OPINIONS RELATED TO THE COMMISSION’S QUESTIONS ON AURORA’S MODEL ........................................... 175 12.8. STRATA’S ALTERNATIVE INPUT ASSUMPTIONS APPLIED TO AURORA’S MODEL .................................................... 182 12.9. SUMMARY OF KEY POINTS FROM OUR ASSESSMENT ..................................................................................... 189 12.10. SUMMARY OF OPINIONS .................................................................................................................... 190
13. BRIEFING REPORT 12 - QUALITY PLANNED SAIDI AND SAIFI................................................................ 195
13.1. INTRODUCTION .................................................................................................................................... 195 13.2. SCOPE OF WORK ................................................................................................................................... 195 13.3. OUR VIEW OF AURORA’S APPROACH TO MODELLING SAIDI AND SAIFI FOR PLANNED OUTAGES ........................... 195 13.4. AURORA PROPOSES TO ADOPT THE PLANNED RELIABILITY STANDARDS THAT WERE SET FOR DPP3 ......................... 196 13.5. TABLE E.19 – THE VERIFIER’S POINTS ON PLANNED RELIABILITY MODELLING AND AURORA’S RESPONSES ................ 197 13.6. OUR CONCLUSIONS ON FORECAST PLANNED SAIDI AND SAIFI ...................................................................... 197 13.7. SUMMARY OF STRATA’S OPINIONS ........................................................................................................... 199 13.8. RESPONDING TO THE VERIFIER’S UNRESOLVED POINTS AND AURORA’S COMMENTS IN RESPONSE TO RFI Q018 ...... 200

Aurora CPP – review of forecast expenditure
5
1. Introduction, scope and approach The Commerce Commission (the Commission) engaged Strata Energy Consulting (Strata) to
assist the Commission in its consideration of the Aurora Energy (Aurora) Customised Price Path (CPP) application dated 12 June 2020. The Commission provided a list of questions on specific topics related to the CPP application, and these questions formed the basis for Strata’s work.
In September 2020, Strata supplied the Commission with initial briefing reports that provided Strata’s answers to the Commission’s specific questions. Subsequently, the Commission has asked Strata to provide its briefing reports in a publishable format.
This document provides a consolidation of the briefing reports in a form that is suitable for publication.
The Commission requires that Strata keeps confidential non-public material provided to Strata during our review. Whilst this document has been produced in a publishable form, it contains non-public material. Strata understands that the Commission will identify and manage confidentiality issues prior to any publication of this document.
Strata has applied reasonable endeavours in undertaking its review and producing this document to ensure the information contained within, and our opinions, are as accurate as practicable. The inputs to our review have been limited to the material supplied by the Commission and Aurora, supplemented by information and data sourced by Strata.
This document has been provided solely for the purpose agreed between the Commission and Strata. Strata, its contributors, employees, associates and directors shall not be liable (whether in contract, tort (including negligence), equity or on any other basis) for any loss or damage sustained by any person relying on this document whatever the cause of such loss or damage.
Aurora CPP – review of forecast expenditure
6
2. Briefing Report 1 – Capex growth and security projects
2.1. Introduction This briefing paper addresses questions from the Commission on expenditure relating to growth and security projects proposed in Aurora’s CPP application.
2.2. Scope of work For the following projects, the Commission asked Strata to carry out the review work specified in Table 1 below:
1. Arrowtown zone substation 33 kV indoor switchboard;
2. Omakau new zone substation;
3. Smith St to Willowbank intertie; and
4. Upper Clutha DER solution (opex solution).
2.3. Our approach We have taken each part of the review work and separated out what can be answered as a general question across all projects and what must be answered project-specifically. The ‘Approach’ column in Table 1 recasts each review point into general (G) and project-specific (P) parts.
We then answer each general question in the following section, followed by the project-specific aspects for each of the four major capex projects included within the scope.
Table 1 – Review work and Strata's approach
Review work
Approach – what questions need answers?
(G) is a general question, relevant to all projects, (P) is a project-specific question
Consider whether the demand forecast has been updated to reflect the expected impact of the COVID-19 pandemic once more information is known (i.e. closer to when the Commission makes its CPP determination).
(G) Is there evidence that Aurora has updated its demand forecast to reflect demand changes brought about from COVID-19?
(P) Are the proposed project-specific timing adjustments reasonable?
Consider if Aurora has made a reasonable attempt at investigating alternative options and used a CBA to determine the least cost solution and the optimum timing for the project.
(G) What constitutes a reasonable attempt?
(P) Is there evidence that Aurora has considered alternative options?
(P) Has Aurora used a CBA to determine the least cost solution and the optimum timing for the project?

Aurora CPP – review of forecast expenditure
7
Consider whether the proposed project is required to meet Aurora’s stated security standards (set out in its policy and AMP).
(G) What is the security standard set out in the policy and AMP?
(P) Has Aurora provided evidence that the proposed project is required to meet the security standard?
Consider what trigger or triggers should be used if the projects deferred due to COVID-19 related issues are treated as contingent projects (or some other uncertainty mechanism), noting that demand at a certain level is an obvious candidate.
(G) What determines whether a project should be treated as a contingent project?
(P) Should the project be treated as a contingent project? If so, what trigger is appropriate?
Consider what VoLL estimate should be used to determine the value (risk cost) of the reliability benefits from the projects claimed by Aurora, including whether it is more appropriate to use a value based on Aurora Energy’s consumers rather than New Zealand consumers more generally.
(G) What is the appropriate reference for determining VoLL?
(P) Has the appropriate VoLL been used in the project justification?
Consider whether, in addition to reliability, there are other benefits that come from the project that are not yet captured in Aurora’s economic evaluation.
(P) What other benefits might accrue to the growth or security project?
Consider whether the 6% discount rate is appropriate, and if not provide advice on an appropriate alternative.
(G) What determines the discount rate?
(G) Is there an appropriate benchmark rate in use by Aurora’s peers?
Provide an opinion on any 3-year and 5-year CPP forecast expenditure adjustments, if any, the Commission should consider making as a result of this analysis.
(P) What, if any, adjustments should be made to the 3-year and 5-year forecast expenditures?
2.4. General questions (G) from Table 1 Viewed broadly, the Commission’s questions relate to aspects of Aurora’s network development process. This process is set out in section 6.2.2 of Aurora’s 2020 AMP.
In summary, the main steps are:
Source: Aurora’s 2020 AMP
The AMP subsections following Figure 6.1 provide detail for each step. In brief:
• Step 1: system needs are driven by Aurora’s demand forecast model and an identification of possible constraints, security of supply guidelines, and power quality objectives.
Aurora CPP – review of forecast expenditure
8
• Step 2: long-list options are drawn from a combination of do-nothing, non-network (e.g. demand side management) and network solutions (e.g. network reconfiguration, new/upgraded equipment); short-list options result from applying a set of assessment criteria, including:
o safety;
o meets business need;
o likely to be cost effective;
o practical to carry out;
o in line with good electricity industry practice;
o fit with other planned work; and
o fit with applicable strategies;
• Step 3: options are compared by considering whole-of-life-costs, which are comprised of estimated capex, probabilistic reliability costs and any significant changes in opex. The cost of each option is compared against the cost of the do-nothing option. A templated approach is used to ensure assessment consistency.
• Step 4: in addition to the results of the economic evaluation, Aurora’s preferred solution takes into account a number of factors:
o the extent to which the option meets identified needs;
o option risk;
o whether intangible benefits might accrue;
o an assessment against the corporate risk matrix; and
o how the option fits within Aurora’s broader asset management objectives (e.g. asset renewal plans).
• Step 5: the project scope and costing of the preferred option is firmed up in more detail, with updated estimates of costs and benefits applied to the economic analysis.
We consider the steps described by Aurora are reasonable for an electricity distribution business with a reasonably mature network development capability. While the approach looks good, the Commission’s review questions relate to whether and how well a particular step is implemented. We return to this when considering each individual project in the later sections of this briefing paper.
General question about COVID-19 impact on Aurora’s demand forecast
Q1: Is there evidence that Aurora has updated its demand forecast to reflect demand changes brought about from COVID-19? In the context of Aurora’s CPP application, COVID-19 is a late-breaking external contingent event that has already impacted economies globally and is materially impacting forecast demand for Aurora’s services locally. We acknowledge this is a challenging environment in which to implement a regulatory process designed to be undertaken in “normal” conditions, for both the applicant and the Commission.
A word search of Aurora’s CPP Application and 2020 AMP reveals numerous references to COVID-19. In the 2020 AMP Executive Summary, Aurora summarises its views as follows (the highlighting is ours):

Aurora CPP – review of forecast expenditure
9
Impact of COVID-19
The planning and engineering analysis underpinning the AMP was largely undertaken prior to the emergence of COVID-19 as a significant social and economic ‘disruptor’. However, we have updated our investment plan to reflect our evolving views.
At this point, it is difficult to fully determine the impacts of COVID-19 on our work programmes in the short-term, or on our demand-driven investments over the medium term, but we have deferred growth investments in a number of areas to reflect the expected downturn in demand. Notwithstanding this uncertainty, we are currently operating on the basis that there may be a need for some refinement of our RY21 work plans as the impact of COVID-19 becomes clearer.
As a lifeline utility, we will continue to maintain essential operations if New Zealand has further COVID-19 related alerts. We will respond to emergency faults and carry out essential safety work.
Looking more specifically at growth project forecasts, Aurora considers that COVID-19 will impact:
• its new network connection numbers; and
• its peak demand forecasts.
Growth in the Central Otago economy (Queenstown, Wanaka and the Lakes district) is significantly driven by the tourism industry. While international tourism is currently non-existent, some local tourism has restarted following the move to level 1.1 These trends will significantly impact peak demands for the current winter peak demand, and likely 2021.
In Aurora’s 2020 AMP, and in each portfolio overview document (POD), each growth project includes a brief comment on Aurora’s view of the likely impact of COVID-19. In most cases, project deferrals are forecast using Aurora’s best estimate of the impact. Given the evolving nature of COVID-19, and the challenging timing with respect to the deadlines inherent in the Commission’s CPP assessment process, we consider Aurora’s assessment of the impacts are, by necessity, early broad brush estimates at best. Certainly, significant uncertainty exists.
The Verifier also provided comments on the impact of COVID-19, including mechanisms the Commission might develop to address the significant levels of forecasting uncertainty.
We will consider the impact of COVID-19 on the timing of individual projects later in this briefing paper.
General questions about network development Q2: What constitutes a reasonable attempt at investigating alternative options? For each project, we would expect to find documented evidence that a long list of options has been developed that contains several options covering both network and non-network alternatives.
There is necessarily a degree of judgement involved in answering the Commission’s question on a project by project basis, as Aurora has local knowledge about constraints that might not be obvious
1 See, for example, the MBIE published data for tourism spend by region and regional tourism operator, at: https://www.mbie.govt.nz/immigration-and-tourism/tourism-research-and-data/tourism-data-releases/monthly-regional-tourism-estimates/latest-update/. This shows that the Otago region, which incorporates both of Aurora’s non-contiguous network areas, saw a 13% decline in tourist spend in the year to May 2020 over the previous year and a 59% decline in the month of May 2020 over May 2019. Looking specifically at the Destination Queenstown regional tourism organisation (RTO), this saw a 13% decline in tourist spend in the year to May 2020 over the previous year and a 67% decline in May 2020 spend over May 2019. Enterprise Dunedin, approximately overlapping Aurora’s Dunedin network area, showed similar trends.

Aurora CPP – review of forecast expenditure
10
from a distance. That said, we have a degree of relevant knowledge and experience with the distribution network planning discipline in general, and some local knowledge gained from a past assignment for the Commission involving Aurora’s two network areas.
In developing the short lists of options, we would expect to find discussion of the process by which the short list has been developed and the criteria used to determine the most favoured options for more detailed assessment. Each project in the short list should be subject to a structured technical and economic assessment and Aurora should have included detail of this in its proposal documentation.
Q3: What is the security standard set out in the policy and AMP? Aurora’s security of supply guidelines are set out in Table 6.9 in the 2020 AMP.
The guidelines are internal security of supply guidelines based on a review of other industry-standard guidelines from other distributors. As the Verifier observed: “These guidelines are not considered binding but are used as a guide for decision making and options analysis for projects undertaken to meet an identified network need.”2
The guidelines appear to be similar to others we have encountered while undertaking assignments for regulators relating to New Zealand electricity distributors. Notably, they are deterministic standards. Each project is effectively assessed on its merits, as these are understood by the personnel undertaking the network planning function within Aurora.
We note here that the relatively much larger Australian distribution network service providers (DNSPs) commonly use probabilistic economic analysis to justify their major projects to Australian regulators.
We consider that, prudently applied, either of these two approaches can lead to efficient capex forecasting. In each case the planning standards and guidelines should be documented, and network issues clearly identified, defined and documented, with comprehensive reasons provided as to preferred solutions, with timings.
Non-network solutions, including opex options that provide relatively short-term project capex deferrals, should be equally presented and assessed alongside solutions that require investment in long-life network assets. Non-network options are not always an optimal solution longer-term but can have an advantage in terms of deferring capex that, once spent, is sunk for periods measured in decades. This may be a particular advantage in times of greater uncertainty (of load growth; of the path and pace of network transformation; of new loads such as electric vehicles; of new smaller-scale distributed generation such as solar photovoltaics (PV)).
General question about contingent projects Q4: What determines whether a project should be treated as a contingent project? The Verifier noted:3
We are required to assess any contingent projects proposed by Aurora Energy against the requirements in clause G10 of the IM (repeated below). As Aurora Energy is not proposing any contingent projects, we did not undertake any assessment against that clause.
However, as discussed in section 4.4 and Appendix C, Aurora Energy does recognise that the unique circumstances created by the COVID-19 pandemic means that
2 Verifier report, section C.13.3 3 Verifier report, section 6.3, page 118

Aurora CPP – review of forecast expenditure
11
some of its proposed expenditure is contingent on events outside of its control. For instance, Aurora Energy advised that:
• In the context of Covid, we consider that our growth-related projects/programmes have sufficient uncertainty to be considered contingent projects at this time. However, the majority of our capex programme is related to renewals and as such the proportion of growth-related capex is relatively small and would not meet the very high contingent project threshold specified in the IMs.
For this reason, Aurora Energy has adjusted some expenditure forecasts to reflect the likely dampening of demand and connection growth resulting from the pandemic by deferring major growth and connection projects and reducing forecast connection expenditure.
We agree that such expenditure is contingent at present. Specifically, we consider that the following components of Aurora Energy’s capex forecast that we have reviewed could be considered contingent projects:
• Arrowtown 33 kV ring upgrade project
• Riverbank zone substation upgrade project
• a major tourism operator’s connection upgrade project.
Although outside of our scope, we also agree with Aurora Energy that the unique circumstances may warrant an alternative approach to dealing with COVID-19 related expenditure contingency over the CPP and review periods – especially where the contingent project provisions in the IM are restricted to projects over a certain value. We recommend that the Commission and Aurora Energy consider this further.
With the passage of time since when these views were expressed, it is increasingly clear that uncertainty will exist well into the future, certainly into the CPP period—one only needs to look at the outbreaks of community transmission of COVID-19 that have occurred, along with the promising nature of some trials of a vaccine for COVID-19.
Aurora has supply areas in which demand growth (and contraction) is strongly linked to the tourism industry. As we have seen, and as we discuss in more detail below, there are two sources of demand within the tourism industry: international tourists (who cannot travel inbound) and local tourists (who cannot travel outbound, and instead choose to explore their own country). As our very preliminary analysis below shows, it is entirely possible that the Queenstown supply area experienced a record peak demand (considering all years on record) in the recent school holidays.
For now, we recommend the Commission accept Aurora’s voluntary project deferrals pending more reliable planning data.
We further consider Aurora’s preferred non-network distributed energy resources (DER) opex solution for the Upper Clutha capacity constraint (Wanaka and the Lakes district) appears to afford advantages if it can be implemented cost-effectively and sustainably. The proposed DER solution for the Upper Clutha could arguably be brought forward so as to make it available for consideration in other near-constrained subtransmission and distribution supply areas.
The sections below, which discuss in more detail the recent winter demand at the Frankton grid exit point (GXP) and the Upper Clutha DER solution, are relevant to the topic of peak demand uncertainty.

Aurora CPP – review of forecast expenditure
12
General questions about economic analysis The Verifier reviewed Aurora’s economic modelling and concluded:4
The core material and models which Aurora Energy has provided are of an appropriate standard. Aurora Energy responded to over 450 questions and requests for information and supporting models and uploaded over 800 documents and spreadsheets to its SharePoint site.
While we could not find an explicit reference to the Verifier’s generic review of Aurora’s capex growth and security economic modelling approach (as standardised in Aurora’s economic model template), we assume the Verifier undertook such a review. This is because the Verifier would have needed to do this to reach its conclusions about the appropriateness and timing of the focus projects it reviewed.
Our own reasonably high-level review of the growth and security model (which was not undertaken at the level of an audit) generally found it to be fit for purpose and reasonably easy to follow once we gained familiarity with its use.
Q5: What is the appropriate reference for determining VoLL? The value of lost load (VoLL) is used to convert the estimated energy not supplied to a consumer into a dollar value within an analysis of economic costs and benefits. It is suited to assessing network expenditure options in situations where the quality of network service cannot be easily differentiated between network users.
Historically, and for many years, transmission grid-level network planning adopted a single value of $20,000/MWh to approximate a blend of all consumer groups across all grid exit points GXPs. More recent VoLL studies have focused on increasing levels of granularity, e.g. disaggregating VoLL values for:
• distribution-level consumer groups (i.e. residential, commercial, industrial, agricultural etc);
• specific large industrial consumers, e.g. dairy factories, pulp and paper mills; and
• different outage durations (e.g. 10 minutes, 1 hour, 8 hours etc).
Sensitivity analysis undertaken by the Verifier demonstrated that selecting different values for VoLL can move the NPV of a project option around by a significant amount. In other words, the NPV is very sensitive to assumed VoLL.5
The Verifier accepted Aurora’s VoLL at $27,136/MWh for the Arrowtown 33 kV Ring upgrade focus project, based on Aurora’s reasons for selecting that VoLL.6
Selecting an appropriate value and range for VoLL challenges economic regulators and regulated businesses alike. Uncertainty for both parties can be addressed by adopting more standardised values for most consumers and, if relevant, using bespoke values for specific industrial consumers with particular supply security needs.7
4 Verifier report, page 17 5 Verifier report, section C.13.5.3: For the Arrowtown 33 kV Ring Upgrade project, selecting a lower VoLL changed the NPV from +$0.7m to -$1.6m). 6 Verifier report, section C.13.5.3 “VoLL”, pages 225-226 7 Compare, for example, the VoLL profile for a cheese production line, where even a very short supply interruption can spoil the product in the whole process, requiring a costly clean out and reset, with that for smelting aluminium, which can tolerate interruptions for up to a critical maximum duration at a relatively low cost but which faces extremely high costs beyond the critical duration.

Aurora CPP – review of forecast expenditure
13
We consider a reasonable (and practical) approach for distributor CBAs is to:
• determine a bespoke VoLL for each consumer group – this should be assessed and periodically updated on a national basis to provide consistency;8 and
• weight these by the energy at risk for each consumer group (in MWh) that would be affected by a supply interruption, to produce a weighted average composite VoLL for a specific project.
This aligns with the approach adopted by some Australian distributors in their equivalent regulatory reviews by the Australian Energy Regulator (AER). Sensitivities can be tested from the resultant weighted average value for VoLL (e.g. +/- 10%).
Table 1 provides an example of specific VoLLs determined for customer groups for zone substation-level growth capex projects.
Table 2 - Australian VoLL values for consumer groups
Year Consumer AUD$ / MWh
2019
Residential $ 26,800
Agricultural $ 51,600
Commercial $ 48,410
Industrial $ 47,700
Q6: What determines the discount rate? Is there an appropriate benchmark rate in use amongst Aurora’s peers? In general, we are not well qualified to provide advice on the discount rates to be used in analyses of costs and benefits in support of regulatory capex forecasts.
That said, we note that the Verifier considered the question of an appropriate discount rate in the context of the Arrowtown 33 kV ring upgrade project.9
The Verifier considered that use of a 6% discount rate was “not unreasonable”, as it is based on May 2018 NZ Treasury advice relevant to infrastructure projects in the context of regulatory proposals.10 However, Treasury’s most recent determination of discount rates is now more than 2 years old and market conditions are materially different.
The Verifier noted that increasing the discount rate from 6% to 7.5% leads to a negative NPV for the preferred option.
Following further discussion with the Commission about this draft briefing report, we could seek further economic advice on this topic.
8 For example, the VoLL analyses conducted by the Electricity Authority, PwC and Transpower 9 Verifier report, section C.13.5.3 10 See https://treasury.govt.nz/information-and-services/state-sector-leadership/guidance/financial-reporting-policies-and-guidance/discount-rates. Treasury’s stated intention was to update the discount rates on this webpage annually, but it has not done so since May 2018. The 6% figure is based on a number of input assumptions, some of which may have changed materially since May 2018. Such assumptions inherent in the currently published discount rate include the equity risk premium at 7%, the risk-free rate at 2.81% (21 May 2018) and the inflation rate at 2%.
Aurora CPP – review of forecast expenditure
14
2.5. Project-specific (P) questions from Table 1
Arrowtown zone substation 33 kV indoor switchboard High-level comments The Arrowtown 33 kV switchboard project ties in closely with the Arrowtown 33 kV ring upgrade project, a point noted by the Verifier.11 Both projects impact the security of supply to the Arrowtown, Dalefield, Coronet Peak and Remarkables zone substations.
In our view, both projects affect 33 kV assets that operate as interconnected parts of the Frankton – Arrowtown subtransmission loop, and should have been considered as two project stages to address interrelated issues with local growth and security.
Nevertheless, the Verifier chose the 33 kV ring upgrade as an identified project and concluded that the solution and forecast expenditure for that project satisfies the expenditure objective. Due to the current uncertainty about peak demands in the context of the COVID-19 pandemic, the Verifier recommended the project should be included as a contingent project with a demand growth trigger.
Project overview Aurora’s one-page summary follows, including the one-page summary of the related Arrowtown 33 kV ring upgrade project.
The Arrowtown 33 kV ring upgrade project overview is:
Source: Aurora 2020 AMP, page 425
11 Verifier report, sections C.13.1 and C.13.5.6

Aurora CPP – review of forecast expenditure
15
The Arrowtown 33 kV switchgear project overview is:
Source: Aurora 2020 AMP, page 426
Are the proposed project-specific timing adjustments reasonable? After considering the likely impact of COVID-19, Aurora proposed (for both Arrowtown projects):
• a 2-year delay to previously forecast demand growth; and
• a 1-year delay to the timing of the project.12
This assessment was carried out at an early stage of the COVID-19 pandemic, before the traditional winter peak demand period, which is driven by winter leisure activities and high tourist visit levels.
With respect to the Arrowtown 33 kV ring upgrade, the Verifier discussed demand forecasts and project timing with Aurora. The Verifier concluded: “… the timing for the project appears contingent on demand rebounding to the levels forecast by Aurora Energy before the pandemic took hold. Consistently, Aurora Energy recently advised us that it now considers all … growth-related projects/programmes have sufficient uncertainty to be considered contingent projects at this time.”
We consider Aurora’s assessment of the impact of COVID-19 on these projects to be reasonable, noting the assessment was undertaken at an early stage of evolving, highly uncertain circumstances. We support the Verifier’s recommendation that these projects be treated as contingent projects and made subject to an appropriate project trigger.
Is there evidence that Aurora has considered alternative options? Yes.13 Aurora long-listed six options, including retaining the status-quo (do nothing option), a demand-side option, providing local (fossil-fuelled) generation, energy storage, and two switchgear options—one using indoor switchgear and one using outside switchgear. We consider this represents a reasonable long-list of options.
Aurora short-listed three options—the two switchgear upgrade options and the do-nothing option, which Aurora used as a counterfactual. Aurora provided reasons for not considering further the discarded options.
12 Aurora regulatory proposal, Boxes 14 and 16 13 POD32 pages 5-7
Aurora CPP – review of forecast expenditure
16
Has Aurora used a CBA to determine the least cost solution and the optimum timing for the project? Yes, to decide between the short-listed options.14 The two switchgear options implement the same single-line diagram and would provide substantially the same performance. Aurora prefers the indoor switchgear option because an outdoor switchyard would require more land (costly) and more difficult planning consents.
Aurora has used its standard economic model template. Regarding optimal project timing, the economic model on its own, with Arrowtown demand forecast as provided (i.e. pre-COVID), indicates that earlier commissioning dates have a greater NPV. However, Aurora has proposed to defer project commencement to reflect the impact of COVID-19 on its demand forecasts and to better align with other capex work in the area.
Has Aurora provided evidence that the proposed project is required to meet the security standard? Yes.15 The relevant security standard is category Z1, which requires that consumers have no interruption for a single cable, line or transformer fault. The peak demand on the Franktown – Arrowtown 33 kV subtransmission loop was 16.7 MW in 2020 and this demand exceeds the 13 MVA N-1 capacity of the existing 33 kV lines.
What has been happening to peak demand in 2020 since Aurora and the Verifier finalised their reports? Actual winter 2020 peak demand in the Queenstown region may not have been as depressed as anticipated. Two views of demand follow in the next two figures, each is based on data available through the Electricity Authority’s EMI data portal.
The first is daily peak demand by date, for the months of May, June and July, 2020 vs 2019, measured at the Frankton GXP and supplied to the Aurora network at 33 kV. July 2020 is the latest dataset available at the time of writing.
The plots show that peak demands occurred around 16-17 July in both 2019 (30.3 MW) and 2020 (30.0 MW). We do not know the extent to which Aurora was controlling load at these peaks, if it was controlling at all. The plots are also not normalised to account for different weather conditions (colder temperatures generally drive higher peak demands).
14 MOD32 15 POD32, page 3

Aurora CPP – review of forecast expenditure
17
Figure 1 - Frankton 33 kV GXP daily peak demand (days of week not aligned)
Source: EMI data Note: Frankton GXP supplies the Queenstown district
The second is daily energy exported by date, for the 12 weeks to early August, 2020 vs 2019, measured at the Frankton GXP and supplied to Aurora at 33 kV. This dataset is more up to date as it is used for finalising market prices.
Figure 2 - Daily energy exported from Frankton GXP, mid-May to early August (days of week aligned)
Source: EMI data
While neither of these graphs leads to a firm conclusion relevant to the Arrowtown Ring growth and security projects (which uses just two of the feeders supplied off the Frankton 33 kV bus), they do indicate that earlier predictions regarding peak demand under COVID-19 conditions will require closer scrutiny as more data becomes available for the current winter period.
For example, for the 2020 school holiday period (4 – 19 July), media reported a very busy period in Queenstown, driven by domestic tourism. The associated peak daily energy consumption is clearly
0.0
5.0
10.0
15.0
20.0
25.0
30.0
35.0
1-May
3-May
5-May
7-May
9-May
11-M
ay
13-M
ay
15-M
ay
17-M
ay
19-M
ay
21-M
ay
23-M
ay
25-M
ay
27-M
ay
29-M
ay
31-M
ay2-Ju
n4-Ju
n6-Ju
n8-Ju
n
10-Ju
n
12-Ju
n
14-Ju
n
16-Ju
n
18-Ju
n
20-Ju
n
22-Ju
n
24-Ju
n
26-Ju
n
28-Ju
n
30-Ju
n2-Ju
l4-Ju
l6-Ju
l8-Ju
l
10-Ju
l
12-Ju
l
14-Ju
l
16-Ju
l
18-Ju
l
20-Ju
l
22-Ju
l
24-Ju
l
26-Ju
l
28-Ju
l
30-Ju
l
Day
pea
k d
eman
d(M
W)
Frankton 33 kV GXP peak demand2019 vs 2020
2019 2020
Aurora CPP – review of forecast expenditure
18
visible in Figure 2 (red line and yellow arrow) and represents a 6% increase over the 2019 peak energy day within the same winter-approximating 12-week window. The 2019 school holiday period occupied the same days as 2020, so the two plots are directly comparable.
Confirming this preliminary conclusion will require peak real time (or half hourly) power demand data for the two Arrowtown 33 kV feeders that supply the Arrowtown Ring.
Should the project be treated as a contingent project? If so, what trigger is appropriate? We note the Verifier’s view that the Arrowtown 33 kV ring upgrade (i.e. the new 33 kV circuit) is appropriate for inclusion in Aurora’s capex forecast, subject only to the forecast peak demand being met. We presume the Verifier anticipated this being done by reviewing winter peak demands starting from the current winter, some available data for which we have presented above.
At the time the Verifier reviewed the project, the initial view was that COVID-19 was almost certain to depress peak demand. If this is not the case, this would suggest that the first stage of the upgrade (i.e. the cable installation) would already meet the peak demand required to justify the project.
Having reviewed the Arrowtown 33 kV switchgear project, our view is that the two Arrowtown ring projects should be treated as two stages of the same project. This is because both stages are required to address the identified network need, which is to provide N-1 capacity for the supply area served by the Arrowtown ring. It makes little sense to complete one stage without the other.
Therefore, if the current winter peak demand has exceeded the previous peak (i.e. 16.7 MW in 2019), we consider both stages are justified and should be accepted with the project timings proposed by Aurora.
Has the appropriate VoLL been used in the project justification? Aurora’s economic model used the value of $27,137/MWh for this project.
As set out in the last section, we consider the Arrowtown 33 kV indoor switchboard project should be assessed on the same basis as the Arrowtown ring upgrade project – because the two projects address the same identified need in two stages.
The Verifier accepted Aurora’s VoLL at $27,137/MWh for the Arrowtown 33 kV Ring upgrade focus project, based on Aurora’s reasons for selecting that VoLL.16 Therefore, we consider it reasonable to assess the Arrowtown 33 kV switchgear project using a VoLL of $27,137/MWh.
What other benefits might accrue to the growth or security project? Other benefits that might accrue if this project is implemented include:
• enabling the full benefit of the associated Arrowtown 33 kV Ring Upgrade – note our earlier view regarding the two Arrowtown Ring projects being essentially two stages of the same project;
• replacement of the Arrowtown outdoor 33 kV structure and switchgear (condition unknown) with a modern, weather-proof indoor installation;
• reduced subtransmission losses within the ring;
• the introduction of remotely controllable circuit breakers at Arrowtown, providing more efficient switching by avoiding the need to dispatch an operator to the site to effect switching; and
• improved protection discrimination.
16 Verifier report, section C.13.5.3 “VoLL”, pages 225-226

Aurora CPP – review of forecast expenditure
19
What, if any, adjustments should be made to the 3-year and 5-year forecast expenditures? None. As stated earlier, we consider that this project is a key stage of the Arrowtown 33 kV Ring Upgrade project and is necessary to unlock the full security benefits of that (100% verified) project.
We recommend that the Commission accepts Aurora’s project scope and timing, but note the discussion about forecast peak demand growth that could occur earlier than under Aurora’s assessment of the impact of COVID-19 on demand. At the time of writing, this is an evolving question as winter 2020 unfolds. If the project timing reverted to Aurora’s original view (i.e. to be commissioned one year earlier than currently forecast), it would have the effect of bringing forward $1.6m from the 5-year forecast period into the 3-year forecast period.17
We express no opinion about Aurora’s estimated project costs.
Omakau new zone substation Project overview Aurora’s one-page summary follows.
Source: Aurora 2020 AMP, page 428
Are the proposed project-specific timing adjustments reasonable? After considering the likely impact of COVID-19 on peak demand, Aurora proposed a 2-year delay to the timing of the project.18 We note that Aurora carried out this assessment at an early stage of the COVID-19 pandemic, significantly before the 2020/21 summer peak demand period, which we understand is driven by irrigation pumping.
While it is not clear to us how COVID-19 would affect a summer peaking irrigation load (we don’t think it would to any material degree), and in the absence of any more detailed information about the factors that drive the summer peak demand, we accept Aurora’s assessment of the likely impact of COVID-19 on the project.
17 See Aurora response to Q014 and POD32, page 2 18 Aurora regulatory proposal, Box 18
Aurora CPP – review of forecast expenditure
20
Is there evidence that Aurora has considered alternative options? Yes.19 Aurora long-listed 10 options, including retaining the status-quo (do nothing option), a demand-side option, providing local (fossil-fuelled) generation, energy storage and a variety of substation and line upgrade options. We consider this represents a reasonable long-list of options.
Aurora short-listed four options—two options that would offload the existing Omakau substation, and two options that would build a new substation to overcome the constraints inherent in the existing substation. Aurora provided reasons for not considering further the six discarded options.
Has Aurora used a CBA to determine the least cost solution and the optimum timing for the project? Yes, to decide between the four short-listed options.20 There are two generic options with two variants for each. Aurora prefers the option to build a new zone substation on a new site, to avoid the limitations inherent in the existing zone substation. Aurora already owns a new site, so has effectively obtained this optionality in an earlier year. A replacement transformer (ex-Cromwell) is to be relocated to provide capacity for demand growth.
The existing Omakau transformer had previously reached its full summer capacity. Aurora has installed fans to keep the transformer cool while operating at capacity and has offloaded some demand to Lauder Flat. Limited additional load transfer is available. Unless a significant demand reduction is forecast for the coming summer, we consider this project should proceed to the timeframe indicated in POD33.
Has Aurora provided evidence that the proposed project is required to meet the security standard? Aurora’s security guidelines21 categorise Omakau (and Lauder Flat) zone substations as category Z3, requiring restoration within 4 hours for a line or transformer fault, including with the use of a mobile substation.
We consider this is a reasonable assessment and that Aurora has appropriately followed its planning process,22 as we described in the section “General questions (G) from Table 1”.
Should the project be treated as a contingent project? If so, what trigger is appropriate? Per the discussion about optimum project timing, we do not consider this project should be categorised as a contingent project.
Has the appropriate VoLL been used in the project justification? Aurora’s economic model used the value of $27,137/MWh for this project. See the earlier discussion of VoLL in the General Questions section.
In terms of the amount of energy at risk, the consumer base supplied from Omakau is largely agricultural and we note that Aurora has appropriately used the “predominantly agricultural” load profile in its economic analysis.23
What other benefits might accrue to the growth or security project? The existing transformer is 52 years old and due for replacement in RY29 (albeit on Aurora’s age criterion). Aurora makes no further comment as to the condition of the transformer. A range of other equipment at Omakau is also due for replacement. The preferred solution provides for efficient (designed-in) connection of a mobile substation, should this be required to respond to a planned or unplanned transformer outage.
19 POD33 pages 5-7 20 MOD33 21 AMP, Table 6.9 22 AMP, Figure 6.1 23 MOD33, Inputs tab, cell C17, which selects the appropriate load profile in tab “Other inputs”.

Aurora CPP – review of forecast expenditure
21
What, if any, adjustments should be made to the 3-year and 5-year forecast expenditures? None. We consider the forecast expenditure (including Aurora’s voluntary COVID-19 deferral) is justified.
Smith St to Willowbank intertie High-level comments The Smith St to Willowbank intertie project is the first step in a $35m+ broader programme of work involving the Dunedin CBD 33 kV subtransmission network.
Aurora has to replace aged and/or poor condition oil, gas and PILC 33 kV cables in the Dunedin CBD area over the next 10+ years.
Changing from a radial to a meshed architecture likely represents a better NPV than straight like-for-like replacement. In a cabled CBD area, a meshed subtransmission architecture can provide improved security, operational flexibility, and capacity sharing benefits.
In more detail The current Dunedin CBD radial subtransmission network is shown in the following single-line diagram.
Source: POD39, page 14

Aurora CPP – review of forecast expenditure
22
The end state of a fully implemented radial to meshed architecture transformation is shown in the following single-line diagram.
Source: POD39, page 15
Note that the meshed architecture does not require like-for-like replacement of all existing radial cables; for example, in the end state, both North City and South City zone substations are no longer directly connected to their respective GXPs, rather they are connected to adjacent zone substations.
Aurora’s clear preference is to move from the simplicity of a “transformer-ended feeder” (radial) architecture in the Dunedin CBD to a “meshed 33 kV with a full set of indoor 33 kV switchgear” (meshed) architecture.
This project is part of a $35m programme comprising primarily 33 kV cable replacement projects. Any justification in terms of (negligible) demand growth is peripheral to the cable replacement driver. Longer-term growth and security benefits come about through the better ability of the meshed architecture to move demand between Halfway Bush (HWB) and South Dunedin (SDN) GXPs and between adjacent zone substations in the CBD.
If one were to start a greenfield project in 2020, meshed has material advantages over radial for CBDs (i.e. all cabled) that did not exist 40-50 years ago. These advantages come about through the availability of cost-effective modern solid XLPE cables, indoor 33 kV switchgear, remote control, and protection systems.
Considered together, POD39 and POD06 underscore Aurora’s conclusion that the need to replace 50 to 70-year-old oil, gas and PILC 33 kV cables over the next 10+ years provides the opportunity to take a wider look at the longer-term options available.
Justification for the $35m cable replacement programme, including the CBD subtransmission architecture change is presented at a high-level only. The most relevant documents are the 2020 AMP, POD39 and POD06. A $35m+ investment needs a single issues/options/decisions report that looks at the big picture, long term, and ties the replacement drivers together with the growth and security drivers. That may exist but was not available for our review.
Aurora has already started to implement its 33 kV cable replacement programme. It laid replacement 33 kV cables between the HWB GXP and Smith St in RY20 and RY21, and these are

Aurora CPP – review of forecast expenditure
23
awaiting termination at HWB.24 The first step in the new architecture is the Smith St to Willowbank intertie (routed near the North City zone substation, which allows a future connection), the associated switchgear at Smith St, and a temporary tie point via a switch at Willowbank.
Once Aurora completes all the renewal/upgrade stages and connects the two, short, normally-open GXP interties shown in POD39 Figure 5 (i.e. Smith St to South City, and North City to Ward St), the architecture unlocks N–2 in the 33 kV cable network (but not in zone substation transformers).
Without having seen more comprehensive documentation, we consider, at a high level, that the approach appears sound. That said, a $35m cable replacement programme, implemented in stages over 10+ years, requires a lot more justification than Aurora has provided. In our view, this amount of investment requires a comprehensive CBA with full probabilistic energy-at-risk planning.
Project overview
Source: POD39, page 17
Are the proposed project-specific timing adjustments reasonable? Aurora has not proposed COVID-specific timing adjustments for this project. This is reasonable as the primary driver is the need to undertake 33 kV cable replacements. In time, with future stages implemented, the architecture change will eventually deliver a material security improvement to the six Dunedin CBD zone substations.
This project provides the ability to defer the replacement of the poor condition HWB – Willowbank cables by 6 years, by providing a backup 33 kV supply that can readily be connected if one of the Willowbank cables should fail.25
Is there evidence that Aurora has considered alternative options? Some. POD39 provides an overview of the options considered but there is a lot of detail sitting beneath this overview-level document that should be reviewed. As it stands, in keeping with Aurora’s approach in each of the growth/security capex forecasts we have reviewed, POD39 enumerates only the cost side of the economic assessment—the benefits side is not detailed. This is
24 POD06, page 2 25 POD06, Table 1

Aurora CPP – review of forecast expenditure
24
not good enough for a strategic programme of work with costs in the order of $35m+ and stages required over 10+ years.
Has Aurora used a CBA to determine the least cost solution and the optimum timing for the project? Per our response to the last question, Aurora’s CBA looks at costs only, so optimal timing is very difficult to synthesise. Aurora’s stated approach is to plan to undertake a major cable laying project at the rate of one every two years.26 The optimal timing of various stages of the programme should be driven by the failure risk and the need to replace existing end-of-life cables.
Has Aurora provided evidence that the proposed project is required to meet the security standard? Per our high-level comments above, Aurora’s security standard is not the main driver of the architecture upgrade. A beneficial outcome of the upgrade, once the future stages are completed, is that the security (and operational flexibility) of the 33 kV subtransmission network supplying the Dunedin CBD will be materially improved.
Should the project be treated as a contingent project? If so, what trigger is appropriate? This project is not dependent on a specific level of demand growth materialising. The timing of this first stage of the overall programme should be driven by asset health considerations regarding Aurora’s assessed end-of-life of the cables.
Has the appropriate VoLL been used in the project justification? Unknown. We have not seen a comprehensive economic assessment that justifies the overall subtransmission architecture programme. This may exist but we have not seen it.
What other benefits might accrue to the growth or security project? Refer to our high-level comments above.
What, if any, adjustments should be made to the 3-year and 5-year forecast expenditures? Aurora forecasts the Smith St to Willowbank intertie project will be completed within the 3-year forecast. The project is only justified if the overall subtransmission architecture programme is accepted as the best longer-term strategic asset management approach is adopted. As stated earlier, we consider at a high-level that a meshed network conversion looks to be the best option, but we have not seen a comprehensive programme justification for this.
Upper Clutha DER solution (opex solution) Project overview Aurora provided a single-line diagram that shows the circuits and locations relevant to the proposed growth and security project.
In brief, the aim is to provide sufficient firm (N-1) capacity to the two Cromwell – Riverbank 66 kV circuits to meet forecast demand growth.27 Aurora plans to install a total of 10 MVAr of static capacitors connected to the 11 kV busses at the Lindis Crossing, Cardrona and Wanaka zone substations. This project is planned for completion in the current year and will provide improved voltage support in the region, reduced losses and additional circuit transfer capacity under Cromwell – Riverbank – Wanaka circuit outage conditions. It thereby extends the effective capacity of the existing network assets.
26 POD06, page 10, see comments under Validation – Deliverable and under Deliverability 27 AMP Table 6.6 on page 107 details the actual and forecast peak demands for each zone substation supplied from the Cromwell GXP.

Aurora CPP – review of forecast expenditure
25
The Upper Clutha DER Solution project is the next project in sequence, aimed at meeting forecast ongoing demand growth in the Upper Clutha supply area.
Are the proposed project-specific timing adjustments reasonable? Aurora has applied a 2-year setback to peak demand growth, in a similar manner to its COVID-19 response for other major capex projects.28 At a high level, and with no further information and analysis available about the behaviour of summer peaking demands, this is a reasonable approach.
28 POD85 “Event Payment” section, page 13

Aurora CPP – review of forecast expenditure
26
The project “timing” should be dynamic and sufficiently flexible to meet year-by-year winter peak demands, if Aurora pursues its preferred option (i.e. Option 14—the third-party small-scale DER and battery solution), and:
• if sufficient demand management resources are made available by providers, including a reserve margin to meet exceptional peak demand growth in any year; and
• if the solution proves to function reliably over the trial period.
The two-part pricing structure appears to enable this flexibility, with an availability payment to incentivise participation and an event payment to reflect actual use of the resource.
The key will be attracting sufficient reliable resource and proving its availability through the trial period (e.g. by triggering the scheme in controlled conditions at a time close to a system peak).
Is there evidence that Aurora has considered alternative options? Yes.29 Aurora long-listed 14 options, including retaining the status-quo (do nothing option) and a range of network and non-network options. We consider this represents a reasonable long list of options.
Aurora short-listed seven options—including both network and non-network options, plus the do-nothing option for use as a counterfactual. Aurora provided reasons for not considering further the discarded options.
Has Aurora used a CBA to determine the least cost solution and the optimum timing for the project? Yes, to decide between the short-listed options.30
The selection is between sets of network and non-network options. The network options include a range of new and upgraded subtransmission lines, with a general theme of providing more capacity to the far ends of the radial Upper Clutha network.
The two non-network options are interesting, in that they represent non-traditional capacity upgrade options and require ongoing contracts with a generator (Option 13) and one or more third-party, small-scale DER aggregators (Option 14).
Two options showed positive net benefits when compared with the counterfactual (do-nothing) option: One is a traditional asset build solution (Option 3: New Upper Clutha 66 kV Line) and the other is Option 14.
Aurora’s preference is Option 14 as it has the highest net benefits and, if its longer-term effectiveness can be demonstrated, it has flexibility to meet ongoing demands. This option has the advantage of a relatively low cost “soft-start” (albeit opex as opposed to capex), through establishing a trial with an existing aggregator. While the trial is being set up, Aurora plans to upgrade voltage support in the supply area by implementing the Upper Clutha Voltage Support project. This will provide a degree of capacity headroom by improving the local power factor (which will decrease the current in the two circuits from Cromwell).
We consider this project should proceed in accordance with the timeframe indicated in POD85.
Has Aurora provided evidence that the proposed project is required to meet the security standard? Yes, subject to our earlier comment about the actual firm capacity of the radial Upper Clutha network. The relevant security standard is Category Z1, which requires no interruption (N-1) for any line or transformer fault. The uncertainty is around the timing of forecast peak demand growth.
29 POD85 pages 4-8 30 MOD85

Aurora CPP – review of forecast expenditure
27
Should the project be treated as a contingent project? If so, what trigger is appropriate? For a traditional network solution, we would advise a peak demand trigger for an uncertain, high capex project. However, the non-network solution proposed is the sort of solution distributors have been encouraged to seriously consider, to defer the need for, or avoid completely, an expensive capex investment in long-life network assets.
Aurora has completed an RFP and has evidently progressed discussions with one or more potential aggregators far enough as to consider it a viable, cost-effective option.
We consider that treatment as a contingent project is unnecessary (and undesirable) and that Aurora’s proposed project timing is appropriate.
Has the appropriate VoLL been used in the project justification? Aurora’s economic model used the value of $27,137/MWh for this project. See the earlier discussion of VoLL in the General Questions section.
What other benefits might accrue to the growth or security project? If the non-network solution meets Aurora’s expectations and proves to be viable and cost-effective, Aurora anticipates a number of additional benefits from non-traditional sources. For example, Aurora states:31
“It also involves demand management for maintenance work and a post contingency demand reduction in response to a control signal from our control centre.”
… and that the option:32
“Provides flexible non-network capacity support added in smaller increments and at a time closer to the need. Such flexibility is desirable at a time of uncertain demand from the Covid-19 pandemic.
If successful, this option may provide confidence to leverage the approach to other situations, including variants on Option 13 which would involve establishing capacity contracts with larger-scale distributed generators.
What, if any, adjustments should be made to the 3-year and 5-year forecast expenditures? None. See discussion and rationale in the preceding sections.
31 POD85, page 8 32 POD85, page 12

Aurora CPP – review of forecast expenditure
28
3. BRIEFING REPORT 2 – Capex (asset renewals)
3.1. Introduction This briefing paper addresses questions from the Commission on expenditure relating to the renewal of cables and transformers proposed in Aurora’s CPP application.
3.2. Capex – Renewals programmes – cables and transformers
Scope of work The Commission has asked Strata to review aspects of the following renewals programmes:
• Sub-transmission cable;
• Distribution cable;
• Low voltage cable;
• Pole mounted transformers; and
• Ground mounted transformers.
Specifically, the Commission has asked Strata to do the following (with Strata’s review to be consistent with the verification requirements of Schedule G of the Electricity Distribution Services Input Methodology Amendments Determination (No. 2) 2019, but not to a level of assurance required of a verification report):
• Assess whether the policies, standards and procedures that Aurora relied on in determining the capex forecast are generally of the nature and quality required to meet the expenditure objective;
• Provide an opinion on key assumptions by considering whether the key assumptions relied upon by Aurora in determining the capex forecast are generally of the nature and quality required for that capex forecast to meet the expenditure objective;
• Provide an opinion on the reasonableness of the key assumptions relevant to capex programmes relied upon by Aurora, including the method and information used to develop them, how they were applied, and their effect or impact on the capex forecast by comparison to their effect or impact on actual capex;
• Provide an opinion as to the reasonableness and adequacy of any asset replacement models used to prepare the capex forecast including an assessment of the inputs used within the model;
• Provide an opinion on the capital costing methodology used for each programme if this is available; and
• Provide an opinion on the necessity to make any 3-year and 5-year CPP forecast expenditure adjustments as a result of Strata’s analysis.
3.3. Assessment of policies, standards and procedures In this section we provide our assessment of the policies, standards and procedures that are common to each of the five asset classes to be reviewed. We also provide assessments of any documents that are specific to an asset category in the section related to that asset category.

Aurora CPP – review of forecast expenditure
29
Documents relied on for our assessment To assist Strata in addressing the Commission’s questions on Aurora’s policies, standards and procedures, the Commission submitted Request for information (RFI) 032 to Aurora. This RFI asked Aurora to provide (or identify in documents already supplied by Aurora) the policies, planning standards and procedures Aurora relied upon in determining its asset replacement capex forecast.
In its response, Aurora supplied a list of technical specifications and procedures. Aurora stated that these were the published policies, standards, and procedures that it relied upon when determining the asset replacement forecast for its renewal capex forecasts. In addition, Aurora provided several asset Portfolio Overview Documents (PODs). We consider Aurora did not provide any policies, planning standards, or key assumptions.
We have used the information Aurora provided in its response, together with relevant information from its CPP application, AMP and information disclosures.
Our assessment of policies underpinning the expenditure The primary references supplied by Aurora to its policies and strategies are found in section 4 of its 2020 AMP. The AMP provides a comprehensive description of Aurora’s asset management governance and its linkages to asset management policy, strategy and procedures.
Aurora considers that it has established linkages between its business plan’s corporate vision with its day-to-day investment and operational decisions. We found that currently the AMP is providing much of the connection between Aurora’s high-level strategic direction and policy. This is appropriate. How this is then applied in practice must be clear.
We found that the information supplied by Aurora to support its CPP application did not demonstrate sufficient linkages between the AMP and the proposed asset management practices and the asset replacement forecast for the CPP.
We consider that this is a transitional issue that Aurora has recognised and is preparing to address through:
1. the finalisation of its Strategic Asset Management Plan (SAMP), which is currently in development. This document intends to set out Aurora’s asset management objectives, provide strategic direction for the development of its fleet strategies and objectives, and detail Aurora’s network development planning guidelines; and
2. the development of fleet management and maintenance plans, which will align Aurora’s asset lifecycle model with asset management processes for individual asset fleets.
We note the 2020 AMP included information on the lifecycle management of Aurora’s assets. We found that this information provided some context for the asset fleets we reviewed.
Aurora confirmed33 that it had used PODs as part of its process to develop forecasts and then challenge them in review sessions with its management team and the Board.
Aurora explained that for non-identified programmes, due to time constraints, the full PODs had not been finalised to align with the 12 June submission forecast. Aurora noted that:
In developing these ‘long-form’ PODs we supplemented the material used in the short-form PODs (e.g. including further background information and links to supporting material) to ensure they were adequate for use by an external party.34
33 Q045 - Aurora Response - Project information to support asset replacement forecasts (supplement to Q032) 34 Ibid

Aurora CPP – review of forecast expenditure
30
Aurora has been updating the PODs as part of the RFI process, i.e. the full PODs were not relied on when the forecasted expenditure was formed and were created for an external reviewer rather than as guidance for asset managers.
The example short form POD supplied by Aurora contained two pages of information and did not contain any information that management and directors could have used to mount a credible challenge to the proposed expenditure. In our opinion, the information available in the challenge session should have included information on asset performance and reasons for historical failures, material safety incidents and options other than the proposed approach.
Notably, the example POD covered pole mounted transformers for which Aurora claimed the top- down challenge had deferred overdue but non-critical pole mounted transformer replacements to RY30. The POD did not provide any information on the cost/risk trade-off that would need to be made to make such a decision, nor did it identify any policy positions that would need to be revised or ignored.
On the information Aurora has supplied, including its responses to questions, we have formed the view that its policies, planning standards and procedures were insufficiently mature to provide a robust framework on which a credible expenditure forecast could be formed.
Our assessment of Aurora’s policies, standards and practices is that it continues to be work in progress. We have concerns that the work to be done on the asset governance framework was identified in 2018 when we conducted the most recent Quality Non-compliance Review of Aurora. There are indications in Aurora’s 2020 AMP that Aurora recognised its current strategy and planning needed to be developed:
strategy and planning: we plan to develop fleet strategy documents and plans for each of our asset fleets, to support optimisation of asset interventions across the asset lifecycle. This will be guided by a standalone asset management strategy.
Results from Aurora’s annual asset management maturity assessment tool (AMMAT) results reinforce the need for continuous improvement.
Source: Aurora 2020 AMP
On the basis of the documentation supplied by Aurora to support its CPP application, we consider that the AMMAT results are likely to be optimistic. This is especially the case for asset-related policies and strategies.
The implications of this for the proposed expenditure are that:

Aurora CPP – review of forecast expenditure
31
• it will be based on assumptions that may be unreliable;
• proposed individual asset fleet replacement programmes could be understated or overstated; and
• the aggregated portfolio of asset fleet expenditure is likely not to be prudent, efficient and deliverable.
To ensure that these implications have been fully addressed Aurora should have:
• ensured a rigorous top-down review and challenge was applied to its bottom-up forecasts;
• undertaken assessments and made adjustments at an asset portfolio level; and
• applied sensitivity analysis to test the reasonableness and deliverability of its combined programme.
The information we have reviewed indicates that these actions have not been taken and therefore we consider that the expenditure forecast is unlikely to meet a reasonable and prudent threshold.
Reasonableness and adequacy of replacement models The models supplied by Aurora for each asset fleet had been used to calculate a 10-year expenditure forecast. The modelled forecasts were used as building blocks for the CPP and 5-year expenditure forecast submitted by Aurora in its CPP application.
No post-model adjustments made by Aurora to the expenditure forecasts were apparent. This indicates that the modelled outputs were accepted without challenge or that the results were resilient to challenge, which would be very unusual for age-based replacement programmes.
We consider that the models are first generation, providing a basic asset age-based replacement programme. These models tend to overstate replacement volumes when compared to more advanced Condition Based Risk Assessment (CRRM)35, risk monetisation (sometimes called Risk Cost) and criticality asset management tools. This is particularly the case for electricity utility assets which have generally been regularly inspected, maintained and if necessary, repaired or replaced.
The above should not be taken as criticism of Aurora as few New Zealand EDBs have yet to adopt advanced asset management tools such as these.
Where basic modelling is used, it is important that the outputs are not taken at face value. Sensitivity testing of outputs to a range of input assumptions should be made. For Aurora’s models, we found that the critical assumptions included probability of failure based on age and assumptions of age-based failure rates. These assumptions must be tested against failure rates actually being experienced and engineering knowledge of the general condition of the fleet. We did not see any evidence that Aurora had done this. For example, Aurora used failure rates, derived from a standard distribution with a standard deviation formed from the square root of expected asset life, for all ranges of assets (e.g. across the broad range of distribution transformers).
We tested the sensitivity of the forecast pole mounted transformer replacements to changes in the assumed life expectance (which in the repex model determines the expected failure rate distribution). Our results showed that moving the expected life from 60 to 65 years reduced the 3-year CPP period forecast from $10.4m to $6.8m, and reduced the forecast cost of the 10-year programme by nearly $10m.
The chart below shows the difference in the assumed failure rate. Given the long-term price impact for consumers from these decisions, the sensitivity to the key input decisions should be tested.
35 EA Technology found up to 20% reductions when utilities apply its CBRM methodology as a replacement for age-based replacement asset management.

Aurora CPP – review of forecast expenditure
32
When aggregating the outputs from individual age-based volumetric models, there is a tendency to overstate the forecast at an aggregated portfolio level. It is good electricity industry practice to consider the forecast at the portfolio level and apply an adjustment for over-investment bias. Regulators sometimes apply this approach in price-setting determinations.
Consideration should also be given at the portfolio level to the deliverability of the total forecast replacement volumes as a whole. As Aurora’s forecast is formed by the combined outputs from the models, this suggests that a portfolio level review has not yet been completed.
Reasonableness for cost assumptions Aurora has applied its standard price book unit costs to its volumetric forecasts to produce the expenditure forecasts for each fleet. This is appropriate and normal practice.
Aurora also engaged Jacobs to provide a sense check,36 which generally found that Aurora’s unit costs were aligned with its derived benchmark. We also found that Aurora’s unit costs aligned with the information Strata gained in recent non-compliance reviews of New Zealand electricity distributors.
We consider that the more competitive environment that Aurora has introduced for contracting its work programme will produce additional savings in unit costs. The increased volume of work proposed should assist in negotiating reduced costs.
3.4. Summary of recommended adjustments
Aurora’s proposed asset replacement capex for each category The following tables set out Aurora’s proposed asset replacement capex for the 3-year CPP period and the 5-year review period.
Aurora's proposed capex RY22–RY2437 2022 2023 2024
sub-transmission cable $0 $1,995,840 $2,993,760
distribution cable $2,018,005 $2,079,218 $2,112,470
low voltage cable $444,966 $499,162 $560,369
ground mounted transformers $326,400 $326,400 $326,400
36 The word used by Jacobs to describe its scope for the benchmarking exercise. 37 “RY” means regulatory year.
0%
10%
20%
30%
40%
50%
60%
70%
1 5 9 13 17 21 25 29 33 37 41 45 49 53 57 61 65 69 73 77 81 85 89 93 97 101105109113117
FAILURE RATE PREDICTION FOR DISTRIBUTION TRANSFORMERS
60 year 65 Year
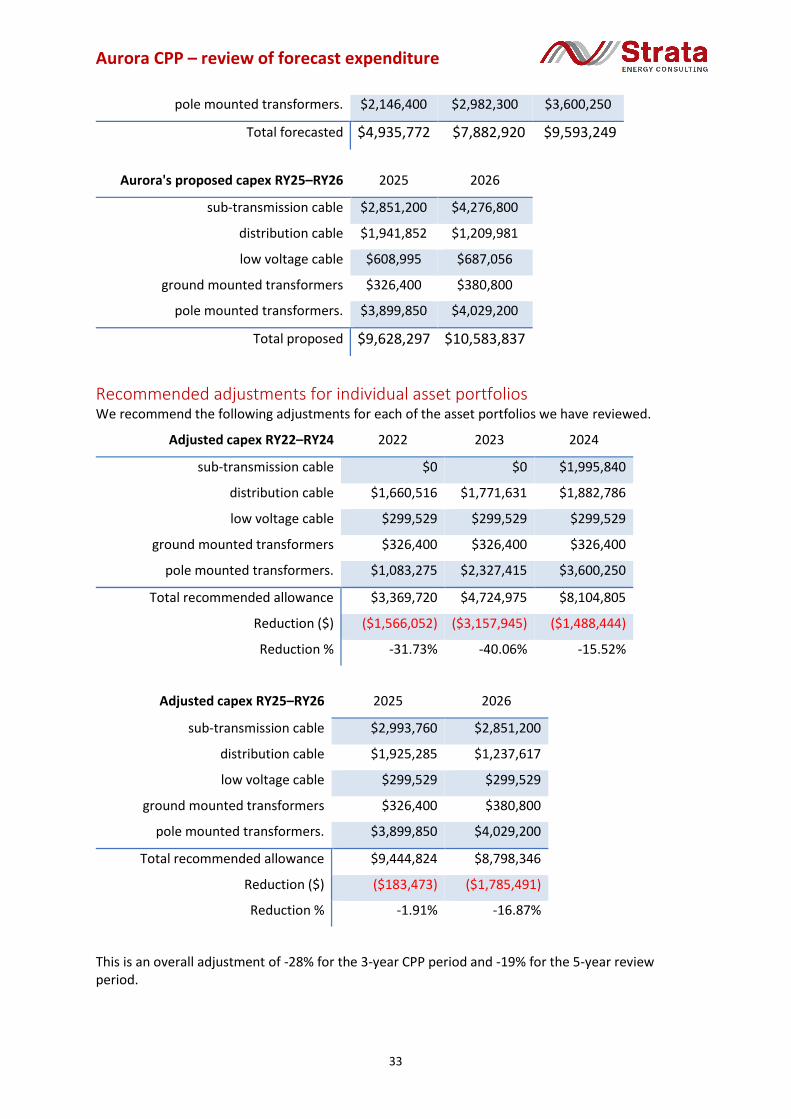
Aurora CPP – review of forecast expenditure
33
pole mounted transformers. $2,146,400 $2,982,300 $3,600,250
Total forecasted $4,935,772 $7,882,920 $9,593,249
Aurora's proposed capex RY25–RY26 2025 2026
sub-transmission cable $2,851,200 $4,276,800
distribution cable $1,941,852 $1,209,981
low voltage cable $608,995 $687,056
ground mounted transformers $326,400 $380,800
pole mounted transformers. $3,899,850 $4,029,200
Total proposed $9,628,297 $10,583,837
Recommended adjustments for individual asset portfolios We recommend the following adjustments for each of the asset portfolios we have reviewed.
Adjusted capex RY22–RY24 2022 2023 2024
sub-transmission cable $0 $0 $1,995,840
distribution cable $1,660,516 $1,771,631 $1,882,786
low voltage cable $299,529 $299,529 $299,529
ground mounted transformers $326,400 $326,400 $326,400
pole mounted transformers. $1,083,275 $2,327,415 $3,600,250
Total recommended allowance $3,369,720 $4,724,975 $8,104,805
Reduction ($) ($1,566,052) ($3,157,945) ($1,488,444)
Reduction % -31.73% -40.06% -15.52%
Adjusted capex RY25–RY26 2025 2026
sub-transmission cable $2,993,760 $2,851,200
distribution cable $1,925,285 $1,237,617
low voltage cable $299,529 $299,529
ground mounted transformers $326,400 $380,800
pole mounted transformers. $3,899,850 $4,029,200
Total recommended allowance $9,444,824 $8,798,346
Reduction ($) ($183,473) ($1,785,491)
Reduction % -1.91% -16.87%
This is an overall adjustment of -28% for the 3-year CPP period and -19% for the 5-year review period.

Aurora CPP – review of forecast expenditure
34
Recommendation for a portfolio level adjustment We recommend that the Commission applies a -5% efficiency adjustment to the total asset replacement capex forecast in each regulatory year, to reflect overestimation bias in the forecast, deliverability, and unit cost reductions.
The above adjustment is additional to the recommended adjustments we make for the individual fleets and should be applied to the aggregated adjusted individual portfolio forecasts.
Other topics are considered in our assessments of asset fleets We provide our requested opinion on the following matters in the sections on individual asset fleets:
• the reasonableness and adequacy of asset replacement models;
• the capital costing methodology; and
• 3-year and 5-year CPP forecast expenditure adjustments.
3.5. Sub-transmission cable renewals programme Aurora has approximately 93km of 33 kV and 66 kV subtransmission cables, located at generation connections, between GXPs and zone substations, and between zone substations. There are four main types of cable, Cross-Linked Polyethylene (XLPE), Oil-filled, Gas-filled and Paper Insulated Lead Covered (PILC). The gas and oil filled cables are becoming obsolete, having been replaced by the more modern XLPE cables.
Forecast expenditure during the 3-year CPP and 5-year review period is:
RY22 RY23 RY24 RY25 RY26
Capex
($m, Constant 2020) $0 $2 $3 $2.9 $4.3
The expenditure forecast is driven by three replacement projects:
• Willowbank Cable Replacement and Switchboard;
• Kaikorai Valley Cable Replacement; and
• Corstorphine Cable Replacement.
The expenditure is part of a wider strategy to reconfigure the Dunedin City cable network to improve resilience to major events. This initiative will increase interconnection, which Aurora considers will deliver significant benefits at a similar cost to a like-for-like replacement programme. We provide an assessment of this initiative in our briefing report on growth capex projects.
Specific policies, standards and procedures for subtransmission cables The documents supplied by Aurora setting out its relevant policies are its CPP application, 2020 AMP and POD06. These are the primary sources of information considered in this assessment. Whilst the AMP and POD06 gave information on the asset fleet and strategies Aurora applies to manage the assets, nothing in the documents supplied provided linkages to higher level policies and strategies.
Aurora provided references to specific technical standards and procedures. Where relevant, we have taken these into consideration.
The level of documentation supplied by Aurora is consistent with its statements and the Verifier’s finding that Aurora’s asset management documentation continues to be a work in progress.

Aurora CPP – review of forecast expenditure
35
Opinion on key assumptions for subtransmission cables renewals Aurora’s key input assumptions Aurora identified the following “major” benefits it expects to be realised from its subtransmission cable replacement programme:
1. improved reliability: replacement of the poor condition subtransmission cables to maintain and improve reliability performance above recent performance;
2. improved resilience: reconfiguring the Dunedin subtransmission network provides significant improvements in resilience to major adverse events;
3. improved offloading capability between GXPs: reconfiguring the Dunedin subtransmission network improves flexibility in load sharing between the two GXPs, reducing the need to invest at the GXPs; and
4. reducing environmental risk: replacing the poor condition cables will reduce potential environmental damage due to leaks in fluid-filled cables.
Aurora identifies the following key drivers of its proposed expenditure for subtransmission cable replacements:
1. age/condition: ageing oil and gas cables are in poor condition and have failed in service, mainly due to joint failures caused by oil or gas leaks;
2. obsolescence: the oil-filled and gas-filled pressurised cables have become obsolete, with spares and parts difficult to source. Also, there is an increasing constraint on the number of skilled people to repair and maintain these types of cables; and
3. asset performance: increasing failures, particularly in older cables, are requiring prolonged outages as faults are difficult to locate and can involve lengthy repair times.
Our opinion on Aurora’s key input assumptions We consider that Aurora has clearly identified and stated the expected benefits and key drivers for the proposed replacements. To support its descriptions and the proposed expenditure, it would have been valuable if Aurora had provided some quantification of the expected benefits.
Aurora’s AMPs over recent years have identified issues and increasing risks due to the ageing oil-filled and gas-filled cables. Addressing these issues is clearly a priority. Determining the optimal timing of the intervention and the cost of the programme is therefore the primary focus of our review of the forecasting method used by Aurora.
Opinion on the reasonableness and adequacy of asset replacement models Forecasting approaches and models Aurora applied to form its forecast Aurora has determined that it should replace 33km of subtransmission cables on its Dunedin network during the CPP period. The length of cables to be replaced is primarily determined by the specific cables to be replaced. Aurora says that it assesses cables for remaining life (current age vs expected life), condition, and performance (failure history).
Aurora provided data indicating that oil-filled cable faults rose between 2016 and 2018 but that the major issue was the greatly extended time taken to repair and restore the cables following the fault. In 2019, the faults on Aurora’s cables and the duration of repairs reduced significantly. However, Aurora provided no information of any assessment it had completed on this.
In our opinion, such a significant reduction in faults should have been investigated and assessed. For example, will it continue and should the proposed programme be delayed if the low failure rates continue?

Aurora CPP – review of forecast expenditure
36
Source: Aurora POD 06
For important subtransmission cables, we would expect that risk and criticality assessment are undertaken to determine the priority order and optimal replacement timing. For example, has the backlog of corrective work on Aurora’s subtransmission oil pressurised cables and the remedial actions to improve maintenance work and proactively fix identified defects38 been carried out?
Aurora did not provide a description or evidence that it had investigated the reasons for the significantly decreased subtransmission faults in 2019.
There is evidence that Aurora undertook options analysis, which reduced costs and increased the broader benefits achievable:
We undertake options analysis for each renewal need, comparing like for like versus potential security upgrades via the Dunedin architecture analysis……
We originally identified 5 cables needing replacement over the next 10 years. By implementing the ring architecture plan, several cable replacements were able to be deferred as an alternate supply was provided through the ring architecture projects. This effectively lowered the consequence of failure of the existing cables. In addition, one of the cable replacements was made redundant as it is not required in the new ring architecture.39
Model MOD 06 supplied by Aurora identifies the cables scheduled for replacement on remaining life. Some context is included in the model to explain differences between the age-based schedule and the revised schedule determined by Aurora’s engineering judgement.
The application of engineering judgement resulted in:
• The Corstorphine 33kV cable replacement being advanced from age replacement timing of 11 years (2032) to 2026 due to:
38 Aurora 2020 AMP, page 224 39 POD 06

Aurora CPP – review of forecast expenditure
37
o Reach[ing]its expected life in RY29 however the compound of the PILC cable is migrating down the hills. Repairs have been made using stop joints, creating dry points and causing more failures. Replacement brought forward due to condition.40
o current best estimate is 2027 however has been moved to 2026 for deliverability reasons41
• Kaikorai Valley 33kV cables replacement advanced from age replacement timing of 2029 to 2024 due to:
o Reach[ing]its expected life in RY29 however the compound of the PILC cable is migrating down the hills. Repairs have been made using stop joints, creating dry points and causing more failures. Replacement brought forward due to condition.
• Willowbank 33kV cables replacement being deferred from 2022 to 2026 because the installation of the Smith St to Willowbank cable reduces the consequence of a Willowbank cable failure.
The above demonstrates that Aurora is able to and is also implementing reprioritisation of its subtransmission cable replacement. The cables to be replaced during the CPP period have been prioritised over older cables. Accordingly, we conclude that the age-based replacement provides only a guide and Aurora developed the actual replacements based on information and engineering judgement.
We consider that the method used by Aurora is appropriate for subtransmission cables but note that improved information will better inform the engineering decisions.
Opinion on the capital costing methodology Capital forecasting method used by Aurora Aurora’s documents explain that for each cable identified for renewal (age and engineering process), it developed individual customised cost estimates involving:
• standard price book unit costs (historical replacement costs and engineering estimates); and
• unit costs selected to align with the probable cable route and additional equipment required (e.g. for connection).
In its sense check of Aurora’s unit costs, Jacobs compared Aurora’s price book unit costs with its derived equivalents for trenching and obtaining easements. In both cases, Aurora’s unit costs were lower than Jacobs’ but within 20%. For 33kV cables, Jacobs’ found that Aurora’s unit costs were lower than its benchmark.
For example, Aurora’s unit cost for the Kaikorai Valley ‘2CCT: 6 x 1c 630 AL 33kV cables (2x30MVA)’ cable replacement is $712,000/km.42 Jacobs’ benchmark for the same cable is $863,000/km. This 20% difference suggests Aurora may either be negotiating good price discounts or it has underestimated the likely costs.
Aurora noted that it had not included any contingency in its price forecasts for subtransmission cable replacements.
40 POD 06 41 MOD 06 42 MOD06 - 01 - Kaikorai Valley Cable Replacement

Aurora CPP – review of forecast expenditure
38
Our assessment of the Capital forecasting method used by Aurora We consider that the capital cost forecasting methodology is appropriate for relatively bespoke subtransmission cable replacements.
Whilst Aurora’s unit costs are lower than those indicated by Jacobs, the fact that Aurora did not revise them indicates that it has confidence it will realise the unit costs in its estimates.
Summary of material issues identified in our review and assessment We consider that the low failure rates for subtransmission cables have not been sufficiently explained and that if similar rates are seen in 2020 and 2021 on the Kaikorai Valley and Corstorphine 33kV cables, deferment of the cable replacements could be considered.
In the absence of information regarding the decline in faults in 2019, we consider that the timing of the Kaikorai Valley and Corstorphine cable replacements is not adequately supported.
Because of this, we recommend that the Kaikorai Valley and Corstorphine cable replacements be moved back by 1 year. In making this recommendation we are conscious that Aurora has brought the Corstorphine replacement forward due to deliverability reasons. However, if faults experienced have reduced, the replacement could also be deferred further for delivery reasons, especially given that the consequences of failure have been reduced.
Opinion on 3-year and 5-year CPP forecast expenditure adjustments We recommend the Commission adjusts Aurora’s 3-year expenditure forecast for this asset fleet. The resulting expenditure profile is in the table below.
3-year CPP volume adjustment 2022 2023 2024
Aurora Forecast ($m) $ $2 $3
Recommended Allowance $0 $0 $2
5-year CPP volume adjustment 2025 2026
Aurora Forecast ($m) $2.9 $4.3
Recommended Allowance $3 $2.9
3.6. Distribution cable renewals programme
Brief summary of the proposed expenditure Aurora is proposing to spend $6.2m on distribution cable replacements in the 3-year CPP and a further $3.1m in the following two years.
RY22 RY23 RY24 RY25 RY26
Capex
($m, Constant 2020) $2 $2.1 $2.1 $1.9 $1.2
Source: POD06 – Distribution cables
Aurora’s distribution cables operate at 6.6 kV and 11 kV made up of 426km of PILC and 650km of XLPE cables.43 The distribution cable fleet also includes cable joints, terminations, and other cable ancillary equipment. Aurora’s distribution cable assets are young relative to their expected lives.
43 Sourced from Aurora’s 2019 information disclosures

Aurora CPP – review of forecast expenditure
39
XLPE cables were introduced around 2000 so are well within operating age. The PILC cables are older and have issues with the cast iron pothead connections. The majority of PILC cables are on the Dunedin network.
The chart below shows the age distribution of PILC cables. We have included a comparison of Aurora’s PILC cables with Unison’s (serving Hastings and Napier) and WEL’s (serving Hamilton). This comparison indicates that Aurora has older cables than the other two electricity distributors.
Note that the age profile for later years is in decades and so those columns have to be divided by 10 when comparing them with earlier single years.
Policies, standards and procedures for distribution cables The documents supplied by Aurora setting out its relevant policies are its CPP application, 2020 AMP and POD07. These are the primary sources of information considered in this assessment. Whilst the AMP and POD07 gave information on the asset fleet and strategies Aurora applies to manage the assets, nothing in the documents supplied provided linkages to higher level policies and strategies.
Aurora provided references to specific technical standards and procedures. Where relevant, we have taken these into consideration.
The level of documentation supplied by Aurora is consistent with its statements and the Verifier’s finding that Aurora’s asset management documentation continues to be a work in progress.
Key planning assumptions for LV cable renewals Aurora’s key drivers44 for its proposed LV cable replacements are:
1. public safety: the legacy cast iron pothead population presents a safety risk to the public, due to a potential explosive failure spraying hot bitumen and parts of the cast iron housing, which can harm people who might be in close proximity at the time of failure;
2. type/age: Aurora proposes to replace PILC cables that have exceeded their expected life of 80 years and opportunistically replace cable lengths when replacing other assets, such as ground mounted distribution transformers, ground mounted switchgear and/or poles; and
3. reactive replacements: distribution cables are replaced reactively when failures or third-party damage occurs (mainly due to cable strikes).
Opinion on key assumptions for LV cable replacements Public safety: this issue is common to many distributors who have similar programmes to replace the troublesome cast iron potheads. We consider that this is an appropriate driver given that Aurora has these types of connection on its Dunedin network with areas of relatively dense population.
44 POD 07 Distribution cables
0
20
40
60
80
100
120
140
160
pre-1
9401940…
1950…
1960…
1970…
1980…
1990…
20002001
20022003
20042005
20062007
20082009
20102011
20122013
20142015
20162017
20182019
Nu
mb
er o
f as
sets
Asset age range for Distribution UG PILC based on data disclosed in 2019
Aurora Energy WEL Networks Unison Networks

Aurora CPP – review of forecast expenditure
40
Type and age: we agree that the type of cable can be an appropriate driver if sufficient information is held on the performance and location of the specific types of cable and the criticality of the asset. Given the underground location of the assets preventing regular condition inspections, age tends to be a common trigger for replacement.
Reactive replacements: generally, there is no other choice than to replace cables when they fail.
We consider that the key drivers that Aurora has identified are consistent with electricity distributor practices and are appropriate for the type and age of Aurora’s distribution cable fleet.
Opinion on the reasonableness and adequacy of asset replacement models Forecasting approaches Aurora applied to form its forecast Aurora describes the methodology it used to develop its distribution cable replacement volumes as an age-based repex approach:
We forecast distribution cable replacements based on expected remaining life, using the Repex calculation methodology. Distribution cables have an expected life of 45 / 80 years for XLPE / PILC cables respectively. The expected lives are modelled as a normal distribution where a replacement rate is then calculated representing a proportion of cables that will replacement by a particular age. We have a known population of cast iron potheads which are targeted for replacement.45
Aurora’s model describes its use of age and expected lives as a proxy for condition, with expected lives modelled using a normal distribution. The calculated replacement rate represents the proportion of cables to be replaced by a particular age.
Critical to this model are the assumptions on expected life and the shape of the normal distribution. The derived cumulative failure distribution for the XPLE and PILC cables is shown in the figure below.
Source: Strata analysis using Aurora’s MOD 07 distribution cables
Aurora has not explained how it determined the failure distribution used in the models, nor how these aligned with Aurora’s experience of cable failures. Aurora also assumed that required reactive work would be included in the modelled replacement rates.
Aurora did explain that it had smoothed the modelled work volumes to allow for delivery capability required for underground cable work. The chart below shows the effect that the smoothing adjustment has had on the forecast replacement profile.
45 POD 07 Distribution cables
0%
10%20%
30%40%
50%
60%70%
80%90%
100%
1 4 71
01
31
61
92
22
52
83
13
43
74
04
34
64
95
25
55
86
16
46
77
07
37
67
98
28
58
89
19
49
71
00
10
31
06
10
91
12
11
51
18
Re
pla
cem
en
t R
ate
Asset age
CUMULATIVE FAILURE DISTRIBUTION PREDICTION DISTRIBUTION CABLES
XLPE PILC

Aurora CPP – review of forecast expenditure
41
Source: Strata analysis using Aurora’s MOD 07 distribution cables
In our opinion Aurora’s smoothing adjustment more likely represents an under delivery of forecast quantities in 2020 and 2021 rather than a proactive adjustment to smooth future deliverability of the programme. In the absence of a logical reason for the smoothing, we consider that Aurora should replace against its modelled output.
The results of a simple age-based calculation we made using Aurora’s 2019 information disclosure are below:
426.673 Total assets
4.131 50% of post 1940 to 1949
8.4 Units currently above 70 years
12.6 Units above 70 years in 5 years’ time
2.0 Units installed since 2019
2.1 Annual replacement (km) to clear over 70-year units over a 5-year period
Aurora’s model indicates Aurora should replace an average of 2.1km of distribution cable each year over the 5-year review period. This is consistent with Aurora’s recent replacement rates plus an uplift to reflect cables moving towards their end-of-life zone. However, the ramping up of replacement volumes over the 5-year review period is driven by the assumed cumulative failure rates in the model. In the absence of a correlation with actual failure rates, we are not convinced that the modelled failure rates will be seen during this period.
In our opinion, Aurora’s proposed 3-year replacement rates should be based on its modelled volumes. Over the 5-year review period, we consider that Aurora’s proposed RY25 and RY26 replacements appear to be appropriate.
In addition, Aurora plans to replace cast iron potheads in a prioritised manner, targeting higher criticality areas.
We have over 400 of these remaining in the network and are prioritising their replacement based on criticality zone (where higher criticality areas include highly populated areas such as CBDs and schools) as well as opportunistically when they are deenergised to enable other work.46
46 POD 07 Distribution cables
0.00
0.50
1.00
1.50
2.00
2.50
3.00
3.50
0.0
0.5
1.0
1.5
2.0
2.5
3.0
3.5
2020 2021 2022 2023 2024 2025 2026
km/y
ear
km/y
ear
Effect of Aurora's smoothing
XLPE PILC Smoothed

Aurora CPP – review of forecast expenditure
42
Aurora proposes to replace all its cast iron potheads by 2025.
Given the risks posed by the ageing cast iron potheads, we do not consider that the replacement timeframe should be extended.
Opinion on the capital costing methodology Capital forecasting method used by Aurora
In its 2018 AMP Aurora states that it established replacement expenditure for its distribution cable assets on a volumetric / repex basis. It delivers the forecast replacements through what it calls hybrid, criticality-based bundling.47
The unit cost for distribution cables used in MOD 07 is $420,000. Jacobs’ ‘sense check’ of Aurora’s price book found that Aurora’s unit costs for distribution cables fell within 10% of the Jacobs estimate. This should provide some assurance to the Commission that Aurora’s replacement forecasts for distribution cables are reasonable.
Jacobs did not provide a comparison of the cast iron pothead replacement costs. Aurora’s unit cost for these replacements is $10,500, which appears to be reasonable.
We have seen no examples or indication of hybrid criticality-based bundling in the forecast, but expect that this is undertaken when programming work rather than when forecasting expenditure.
Summary of material issues identified in our review and assessment We have identified no material issues with the distribution cables replacement forecast other than reducing the RY20 to RY24 volumes to remove the unsupported ‘smoothing’ adjustment.
Opinion on 3-year and 5-year CPP forecast expenditure adjustments We recommend the Commission adjusts Aurora’s 3-year expenditure forecast for this asset fleet but does not make any adjustment to the final two years of the 5-year review period. The resulting expenditure profile is in the table below.
3-year CPP volume adjustment 2022 2023 2024
Aurora Forecast ($m) $2 $2.1 $2.1
Recommended Allowance $1.7 $1.8 $1.9
5-year CPP volume adjustment 2025 2026
Aurora Forecast ($m) $1.9 $1.2
Recommended Allowance $1.9 $1.2
47 Aurora 2020 AMP, page 87

Aurora CPP – review of forecast expenditure
43
3.7. Low voltage cable renewals programme
Brief summary of the proposed expenditure. Aurora is proposing to spend $1.5m on low voltage (LV) cable replacements over the 3-year CPP period and a further $1.3m over the following two years.
RY22 RY23 RY24 RY25 RY26
Capex
($m, Constant 2020) $0.4 $0.5 $0.6 $0.6 $0.7
Source: POD08 – LV cables
Aurora’s distribution cables operate at 230 V and 400 V. They are made up of Polyvinyl Chloride (PVC), PILC and XLPE. 48 Aurora’s expected life for LV cables in PVC is 60 years, in PILC is 100 years, and in XLPE is 60 years.
The chart below shows the age distribution of LV cables. We have included a comparison of Aurora’s LV cables with Unison’s (serving Hastings and Napier) and WEL’s (serving Hamilton). This comparison indicates that Aurora’s LV cable installations have a similar age profile to Unison’s and WEL’s.
Source: Strata analysis of Aurora’s 2019 information disclosures
Note that the age profile for later years is in decades and so those columns have to be divided by 10 when comparing them with earlier single years.
Policies, standards and procedures for LV cables The documents supplied by Aurora setting out its relevant policies are its CPP application, 2020 AMP and POD08. These are the primary sources of information considered in this assessment. Whilst the AMP and POD08 gave information on the asset fleet and strategies Aurora applies to manage the assets, nothing in the documents supplied provided linkages to higher level policies and strategies.
Aurora provided references to specific technical standards and procedures. Where relevant, we have taken these into consideration.
The level of documentation supplied by Aurora is consistent with its statements and the Verifier’s finding that Aurora’s asset management documentation continues to be a work in progress.
48 Sourced from Aurora’s 2019 information disclosures and POD 08
0
200
400
600
800
1000
1200
1400
1600
1800
pre-1
9401940…
1950…
1960…
1970…
1980…
1990…
20002001
20022003
20042005
20062007
20082009
20102011
20122013
20142015
20162017
20182019
Nu
mb
er o
f as
sets
Asset age range for LV UG Cable based on data disclosed in 2019
Aurora Energy WEL Networks Unison Networks

Aurora CPP – review of forecast expenditure
44
Key planning assumptions for LV cable renewals Key drivers of expenditure for LV cable renewal and refurbishment are:
1. type/age: Aurora proposes to replace PILC cables that have exceeded their expected life of 100 years and opportunistically replace cable lengths when replacing other assets, such as ground mounted distribution transformers, LV enclosures and/or poles; and
2. reactive replacements: distribution cables are replaced reactively when failures or third-party damage occurs (mainly due to cable strikes).
Aurora’s replacement strategy49 for its proposed LV cable replacements is to reactively replace:
• on failure; or
• when damaged by third-party action (e.g. from construction-related ground movement).
Aurora has identified some crystallisation issues with the lead sheaths in its PILC cables, but has concluded that these are rare and do not require proactive action.
Also, Aurora has identified that it is not experiencing similar mode type failures of early XLPE cable installations as other distributors.
Opinion on key assumptions for LV cable renewals Given the age profile of the LV cable fleet and the relatively low failure rates, we consider that Aurora is correct in applying a replace on fault/failure strategy. Accordingly, we expect that forecast replacements will be consistent with historical volumes with a downwards adjustment to reflect any proactive management initiatives that Aurora has taken to reduce third party damage incidents.
We consider that the key drivers Aurora has identified are consistent with electricity distributor practices and are appropriate for the type and age of Aurora’s LV cable fleet.
Opinion on the reasonableness and adequacy of asset replacement models Forecasting approaches Aurora applied to form its forecast Aurora describes the methodology it used to develop its distribution cable replacement volumes as an age-based repex approach:
We forecast distribution cable replacements based on expected remaining life, using the Repex calculation methodology. Distribution cables have an expected life of 45 / 80 years for XLPE / PILC cables respectively. The expected lives are modelled as a normal distribution where a replacement rate is then calculated representing a proportion of cables that will replacement by a particular age. We have a known population of cast iron potheads which are targeted for replacement.50
Aurora supplied its LV cable model in its responses to the Commission’s RFI Q032.
The model provides a basic age-based determination of required replacements using the fleet’s asset age profile as a primary input.
The assumed failure rate curve represents the probability of failure (PoF) of assets at specific ages. The curve applied by Aurora indicates that the onset of end-of-life-related failures for its PILC LV cables begins at 70 years old. The need for reactive replacements would be expected to occur between 70 and 90 years old. Beyond 90 years, the curve indicates that proactive replacements should have been completed unless the cables are considered to be low criticality.
49 POD20- -Ground Mounted Distribution Transformers 50 POD20 - Ground Mounted Distribution Transformers

Aurora CPP – review of forecast expenditure
45
Source: Strata analysis of data from MOD08
The above failure distribution prediction drives assumed asset replacements in Aurora’s forecast.
Source: MOD08 - Low Voltage Cables Forecast Model
0%
10%
20%
30%
40%
50%
60%
70%
80%
90%
100%
1 4 71
01
31
61
92
22
52
83
13
43
74
04
34
64
95
25
55
86
16
46
77
07
37
67
98
28
58
89
19
49
71
00
10
31
06
10
91
12
11
51
18
Failu
re R
ate
Asset age
CUMULATIVE FAILURE DISTRIBUTION PREDICTION PILC LV CABLES
0%
10%
20%
30%
40%
50%
60%
70%
80%
90%
100%
1 4 71
01
31
61
92
22
52
83
13
43
74
04
34
64
95
25
55
86
16
46
77
07
37
67
98
28
58
89
19
49
71
00
10
31
06
10
91
12
11
51
18
Failu
re R
ate
Asset age
CUMULATIVE FAILURE DISTRIBUTION PREDICTION XLPE LV CABLES
0%
10%
20%
30%
40%
50%
60%
70%
80%
90%
100%
1 4 71
01
31
61
92
22
52
83
13
43
74
04
34
64
95
25
55
86
16
46
77
07
37
67
98
28
58
89
19
49
71
00
10
31
06
10
91
12
11
51
18
Failu
re R
ate
Asset age
CUMULATIVE FAILURE DISTRIBUTION PREDICTION PVC LV CABLES

Aurora CPP – review of forecast expenditure
46
The modelled results, including the components that are driving the expenditure forecasts, are inconsistent with the key expenditure drivers identified in POD08, which were for PILC cable faults and third party accident repairs.
The modelled outputs show that the replacement forecast is based on a prediction of age-related faults for XPLE and PVC LV cables.
In our opinion, Aurora has not demonstrated that the forecast increases in expenditure above historical replacements is warranted because:
• the modelled forecast for its PILC cables is very low;
• costs of third party damage should at least in part be recoverable from the third party; and
• Aurora is not experiencing issues related to its XLPE cables.
The average actual and forecast RY16 and RY20 replacements have been $0.3m.51 We consider this to be a more reasonable basis on which to forecast LV cable replacements over the next five years.
Opinion on the capital costing methodology Capital forecasting method used by Aurora
In its 2018 AMP52 Aurora states that it established replacement expenditure for its distribution cable assets on a volumetric / repex basis. It delivers the forecast replacements through what it calls hybrid, criticality-based bundling.
In developing its unit rates, Aurora states that it has taken into account the following inputs and assumptions:
• the unit rate is an average cost and variations on a site-to-site basis will have minimal overall impact; and
• no contingency has been included.
MOD08 applies a single unit cost of $420,000/km for LV cable replacements. The model does not include a derivation of this unit cost.
In its unit cost sense check, Jacobs determined that Aurora’s unit cost for LV cable replacement was 6% lower than its benchmark. This should provide some assurance to the Commission that Aurora’s replacement forecasts for distribution cables are reasonable.
Summary of material issues identified in our review and assessment There are inconsistencies between Aurora’s modelled replacement forecast and the description of its assets, and the need for the expenditure. We have concluded that a more reasonable basis for the replacement forecast is to apply the most recent actual expenditure, because this will be more reflective of the actual performance of the LV cables than the failure rates projected in the model.
Opinion on 3-year and 5-year CPP forecast expenditure adjustments We recommend the Commission adjusts Aurora’s proposed LV cable replacement expenditure. The resulting expenditure profile is in the table below:
3-year CPP volume adjustment 2022 2023 2024
Forecast ($m) $0.4 $0.5 $0.6
Recommended Allowance $0.3 $0.3 $0.3
51 01 - Forecast Tracker - Post IV Review Post Eff Adjustment tab, Average F14 to J14 = $299,529 52 Aurora 2020 AMP, page 87

Aurora CPP – review of forecast expenditure
47
5-year CPP volume adjustment 2025 2026
Forecast ($m) $0.6 $0.7
Recommended Allowance $0.3 $0.3
3.8. Pole mounted distribution transformer renewals programme
For pole mounted transformers Aurora’s strategy and forecast asset replacement comprises maintenance of the overall fleet health at current levels. The primary benefit from the proposed programme is explained by Aurora as a reduction in safety risks attributed to low pole mounted transformers, which are currently in breach of modern safety clearances.
Aurora predicts that without the proposed increased expenditure, asset heath levels will deteriorate over the 3-year CPP period causing renewal of a backlog and intolerable levels of reliability and safety risk.
Brief summary of the proposed expenditure. Aurora is proposing to spend $8.7m on pole mounted transformer replacements over the 3-year CPP period and a further $7.9m over the following two years.
RY22 RY23 RY24 RY25 RY26
Capex
($m, Constant 2020) $2.1 $3.0 $3.6 $3.9 $4.0
The forecast expenditure attributed to pole mounted transformer replacement shows a significant increase on historical actual levels. It is important to note that the forecast expenditure does not include pole mounted transformers that will be replaced under the pole replacement programme, since this expenditure is included under the expenditure for the pole replacement programme.
The ramping up of pole mounted transformer replacements was forecast in Aurora’s 2018 AMP and the proposed expenditure for the CPP period is less than that forecast in the 2018 AMP.
Aurora says that the profile for standalone replacement (orange bars) reflects the reducing volume of pole replacements (grey bars) and has been adjusted to gradually ramp up to ensure the work can be effectively delivered by service providers.
Source: POD21 - Pole Mounted Distribution Transformers
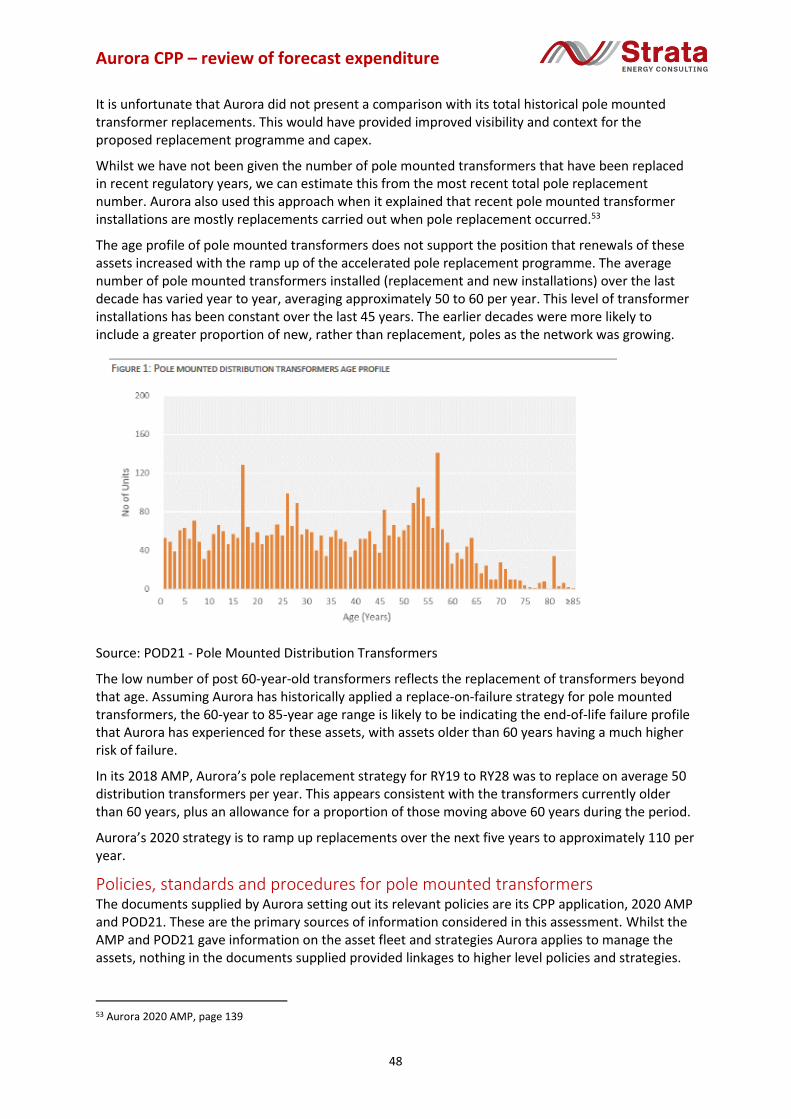
Aurora CPP – review of forecast expenditure
48
It is unfortunate that Aurora did not present a comparison with its total historical pole mounted transformer replacements. This would have provided improved visibility and context for the proposed replacement programme and capex.
Whilst we have not been given the number of pole mounted transformers that have been replaced in recent regulatory years, we can estimate this from the most recent total pole replacement number. Aurora also used this approach when it explained that recent pole mounted transformer installations are mostly replacements carried out when pole replacement occurred.53
The age profile of pole mounted transformers does not support the position that renewals of these assets increased with the ramp up of the accelerated pole replacement programme. The average number of pole mounted transformers installed (replacement and new installations) over the last decade has varied year to year, averaging approximately 50 to 60 per year. This level of transformer installations has been constant over the last 45 years. The earlier decades were more likely to include a greater proportion of new, rather than replacement, poles as the network was growing.
Source: POD21 - Pole Mounted Distribution Transformers
The low number of post 60-year-old transformers reflects the replacement of transformers beyond that age. Assuming Aurora has historically applied a replace-on-failure strategy for pole mounted transformers, the 60-year to 85-year age range is likely to be indicating the end-of-life failure profile that Aurora has experienced for these assets, with assets older than 60 years having a much higher risk of failure.
In its 2018 AMP, Aurora’s pole replacement strategy for RY19 to RY28 was to replace on average 50 distribution transformers per year. This appears consistent with the transformers currently older than 60 years, plus an allowance for a proportion of those moving above 60 years during the period.
Aurora’s 2020 strategy is to ramp up replacements over the next five years to approximately 110 per year.
Policies, standards and procedures for pole mounted transformers The documents supplied by Aurora setting out its relevant policies are its CPP application, 2020 AMP and POD21. These are the primary sources of information considered in this assessment. Whilst the AMP and POD21 gave information on the asset fleet and strategies Aurora applies to manage the assets, nothing in the documents supplied provided linkages to higher level policies and strategies.
53 Aurora 2020 AMP, page 139

Aurora CPP – review of forecast expenditure
49
Aurora provided references to specific technical standards and procedures. Where relevant, we have taken these into consideration.
The level of documentation supplied by Aurora is consistent with its statements and the Verifier’s finding that Aurora’s asset management documentation continues to be a work in progress.
Key assumptions for pole mounted transformer renewals The following key assumptions have been taken from various documents supplied by Aurora, including its CPP application, 2020 AMP and POD21.
a) Safety risk: specifically, replacing low pole mounted transformers which are in breach of modern safety clearances will reduce the risk of exposure to workers and the public. Aurora has units that are mounted unacceptably low to the ground and are in breach of modern safety clearances;54
b) Asset age: Aurora anticipates material levels of renewal over the medium-term as approximately 10% of the fleet has already exceeded the 60-year expected life;
c) Reactive replacement for smaller pole mounted transformers for certain fleets: these can be run to failure because they generally have a low consequence and achieving maximum useful life from the existing asset is the best strategy; 55
d) Asset condition deterioration: approximately 5% of the fleet has already reached the end of its useful life (H1).56 Without investment, at the end of RY24 H1 levels will increase to ~16%, leading to a renewal backlog likely to introduce intolerable levels of reliability and safety risk;57 and
e) Achieving compliance with modern seismic standards: some transformers require pole-to-ground mount conversions due to seismic risk. Older and larger pole mounted units are often not compliant with modern seismic standards, presenting a public safety risk.58
Opinion on key assumptions for pole mounted transformer renewals Assumptions on replacement drivers are appropriate but not supported Public safety and condition are appropriate drivers, but Aurora has not supported using these drivers as the basis for a material increase in the replacement of pole mounted transformers.
Both Aurora and WSP recognise that transformers can present hazards and public safety risks particularly in high public density areas. Yet injuries from pole transformer failures are relatively rare and Aurora must have undertaken regular inspections and have good knowledge of any safety-related issues for transformers in high risk locations. Also, many of the higher risk transformers would have been replaced in the accelerated pole replacement programme because this was a risk prioritised programme.
WSP determined that 25 transformers had a high safety risk and 160 a medium safety risk. It is reasonable to assume that, between 2018 and 2020, Aurora will have acted to identify and address these issues either through replacement, refurbishment or maintenance.
WSP did not identify the safety clearance issue that Aurora is claiming as the primary benefit from its proposed replacement programme. Also, Aurora’s 2018 AMP did not specifically identify safety clearance compliance risk. Aurora has not provided the number of pole mounted transformers that are in this situation.
54 POD21 - Pole Mounted Distribution Transformers, page 7 55 Aurora 2020 AMP, page 80 56 HI means that the asset has reached the end of its useful life and should be replaced within one year. 57 POD21 - Pole Mounted Distribution Transformers, page 4 58 POD21 - Pole Mounted Distribution Transformers, page 4
Aurora CPP – review of forecast expenditure
50
Whilst we are not challenging the need for appropriate safety clearances, in our opinion, Aurora has not provided sufficient evidence to support a material increase in replacements to address this issue.
Aurora’s age-based assumption is not supported by other data Low asset failure rates do not support moving to a proactive asset replacement strategy. In its 2018 report, WSP identified 69 equipment failures that resulted in supply outages during the 10-year period between 2009 and 2018 (59 equipment failures, 9 imminent equipment failures, and 1 due to manufacture defect), an average of 6.9 equipment failures per year.
Looking at the asset age profile of its pole mounted transformers, Aurora has not provided credible grounds to support its transition from the previous replace-on-failure strategy to a proactive approach. However, the age profile shows an approaching period where a higher number of pole mounted transformers will move beyond 60 years, which indicates that failures will increase. A moderate increase in volumetric replacement forecasts is required to cover this.
Reactive replacement for smaller pole mounted transformers We agree with Aurora that a managed run-to-failure strategy is appropriate for its </= 100 kVA pole mounted distribution transformers. As noted above, as the assets age further the annual number of these failing could increase, so an incremental age-based increase in replacements is warranted.
Increasing numbers of smaller transformer replacements will have the effect of bringing the average replacement unit cost down. This is discussed further when we review models and costs.
Condition based assumptions are supported Aurora’s strategy in 2018 was to replace 500 pole mounted transformers (one-eighth of the total) during the 10-year planning period, including converting 20 pole mounted units to ground mounted units. Aurora had determined that, by the end of the 10-year period, less than 1% of total distribution transformers would have a H1 condition rating.
As indicated by the age profile of the pole mounted and ground mounted transformers, Aurora has been achieving its 2018 forecast replacement rate of approximately 50 per year. In addition, further transformers would have been replaced in conjunction with the pole replacement programme. The 2018 AMP59 indicates that at the time, 10% of pole mounted transformers were at HI=1. POD2160 indicates that, two years later, this has been reduced to 5%. This suggests that Aurora’s 2018 strategy was reducing the average age of the pole mounted transformer fleet and, by proxy, HI.
In the absence of clear evidence of more rapid than expected deterioration in the pole mounted transformer fleet, there is no case for changing the 2018 replacement strategy.
Given the above assessment, we agree that Aurora should continue its strategy to replace on average 50 distribution transformers per year plus an increase to account for the higher numbers currently approaching 60 years.
We provide further analysis on Aurora’s volumetric-based replacement forecast in our assessment of the modelling and forecasting approaches used by Aurora to form its cost forecast for pole mounted transformers.
Achieving compliance with modern seismic standards Aurora had identified this issue in its 2018 AMP and had introduced a detailed strategy to address this issue across its asset fleets. We expect that this programme of work would span several years and be ongoing through the CPP period.
59 Aurora 2018 AMP, page 139 60 POD21 - Pole Mounted Distribution Transformers, page 4
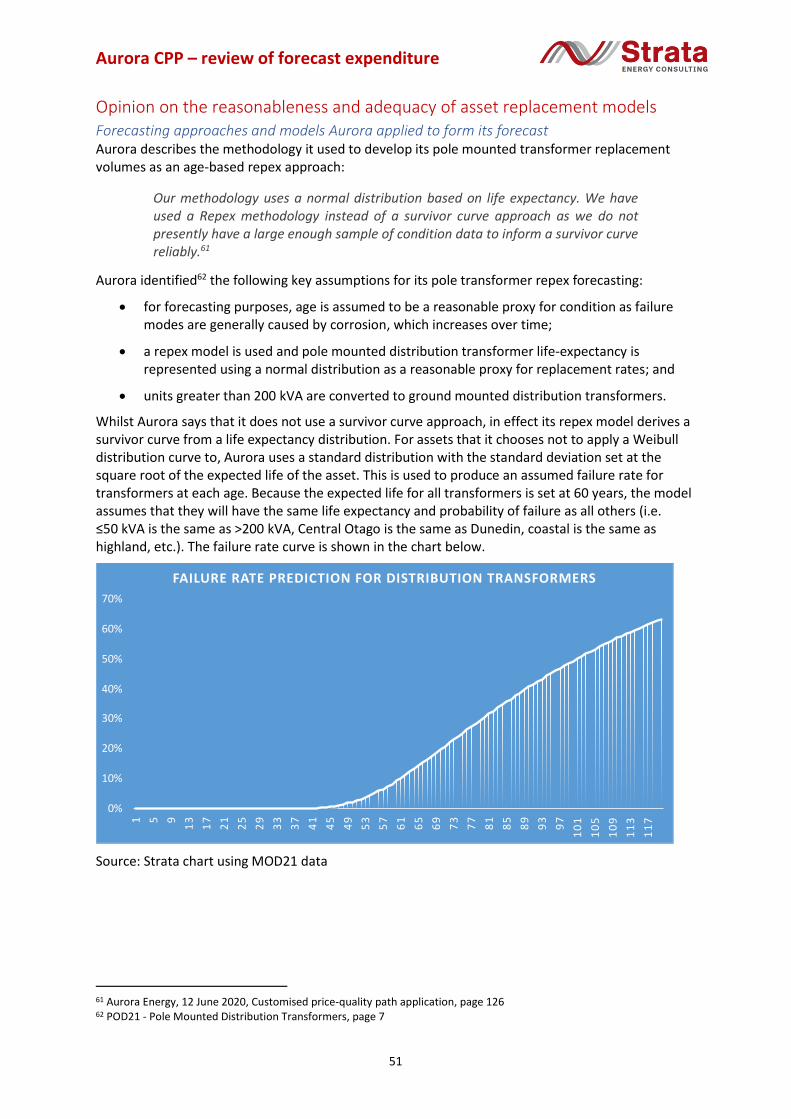
Aurora CPP – review of forecast expenditure
51
Opinion on the reasonableness and adequacy of asset replacement models Forecasting approaches and models Aurora applied to form its forecast Aurora describes the methodology it used to develop its pole mounted transformer replacement volumes as an age-based repex approach:
Our methodology uses a normal distribution based on life expectancy. We have used a Repex methodology instead of a survivor curve approach as we do not presently have a large enough sample of condition data to inform a survivor curve reliably.61
Aurora identified62 the following key assumptions for its pole transformer repex forecasting:
• for forecasting purposes, age is assumed to be a reasonable proxy for condition as failure modes are generally caused by corrosion, which increases over time;
• a repex model is used and pole mounted distribution transformer life-expectancy is represented using a normal distribution as a reasonable proxy for replacement rates; and
• units greater than 200 kVA are converted to ground mounted distribution transformers.
Whilst Aurora says that it does not use a survivor curve approach, in effect its repex model derives a survivor curve from a life expectancy distribution. For assets that it chooses not to apply a Weibull distribution curve to, Aurora uses a standard distribution with the standard deviation set at the square root of the expected life of the asset. This is used to produce an assumed failure rate for transformers at each age. Because the expected life for all transformers is set at 60 years, the model assumes that they will have the same life expectancy and probability of failure as all others (i.e. ≤50 kVA is the same as >200 kVA, Central Otago is the same as Dunedin, coastal is the same as highland, etc.). The failure rate curve is shown in the chart below.
Source: Strata chart using MOD21 data
61 Aurora Energy, 12 June 2020, Customised price-quality path application, page 126 62 POD21 - Pole Mounted Distribution Transformers, page 7
0%
10%
20%
30%
40%
50%
60%
70%
1 5 9
13
17
21
25
29
33
37
41
45
49
53
57
61
65
69
73
77
81
85
89
93
97
10
1
10
5
10
9
11
3
11
7
FAILURE RATE PREDICTION FOR DISTRIBUTION TRANSFORMERS

Aurora CPP – review of forecast expenditure
52
The resulting 10-year replacement programme derived from the model is shown in the chart below.
Source: Strata chart using MOD21 data
The replacement programme derived by the model generally aligns with the asset population, as revealed by the table below, which shows Aurora’s distribution transformer population by number, capacity and network.
Central - ≤15kVA 1001
Central - 15 to 30 kVA 738
Central - 30 to 120 kVA 538
Central - 120 to 200 kVA 8
Central - Greater than 200 kVA 30
Dunedin - ≤15kVA 588
Dunedin - 15 to 30 kVA 415
Dunedin - 30 to 120 kVA 331
Dunedin - 120 to 200 kVA 20
Dunedin - Greater than 200 kVA 331
Source: Strata table using MOD21 data
We have then considered the expenditure forecast that Aurora’s volumetric model produced. The chart below indicates how Aurora will spend its 10-year capital investment in distribution transformer replacements.
0 50 100 150 200 250 300
≤15kVA
15 to 30 kVA
30 to 120 kVA
120 to 200 kVA
Greater than 200 kVA
≤15kVA
15 to 30 kVA
30 to 120 kVA
120 to 200 kVA
Greater than 200 kVA
Number of replacements
Ten-year replacement programme for distribution transformers
2020 2021 2022 2023 2024 2025 2026 2027 2028 2029 2030
Cen
tral
Du
ned
in

Aurora CPP – review of forecast expenditure
53
Source: Strata chart using MOD21 data
This analysis reveals that the primary driver of expenditure is a major $21.4m pole-to-ground conversion programme, which will take place on the Dunedin network over 10 years for >200 kVA transformers. The unit cost used in the model for the >200 kVA pole to ground conversion is $141,750, which is three times greater than the next highest unit cost for a transformer replacement.
The information in POD21 supplied to Aurora management and directors for the top-down challenge only noted that:
Our approach of replacing larger pole mounted units (of which many are relatively old) with ground mounted equivalents also drives an increase in expenditure, as ground mounted units are considerably more costly.
In its 2018 asset review, WSP did identify an issue with pole mounted transformers on the Dunedin network:
57 distribution transformers in the Dunedin network considered to have a high safety risk due to their age (as a proxy for condition), capacity and proximity to the public..63
Aurora’s 2020 AMP notes the following:
• large transformer substations mounted on two-pole structures are generally replaced with ground mounted units to mitigate seismic risk; and
63 WSP-Final-Report-PS109832-ADV-REP-003-RevD, page 94
$- $5,000,000 $10,000,000 $15,000,000 $20,000,000 $25,000,000
≤15kVA
15 to 30 kVA
30 to 120 kVA
120 to 200 kVA
Greater than 200 kVA
≤15kVA
15 to 30 kVA
30 to 120 kVA
120 to 200 kVA
Greater than 200 kVA
Ten-year replacement expenditure forecast for distribution transformers
2021 2022 2023 2024 2025 2026 2027 2028 2029 2030
Cen
tral
Du
ned
in

Aurora CPP – review of forecast expenditure
54
• we will replace transformers that are installed unacceptably low to the ground to help reduce public safety risk. The replacement will be a seismic resilient solution, whether a pole or ground mounted transformer; and
• in RY21 we will be commencing detailed inspections of our larger pole mounted transformers, specifically, with the objective of collecting condition and other asset data.64
The magnitude of the pole-to-ground conversion programme is not apparent in any of the documents we have reviewed. In our opinion, a $21.4m plus project should have warranted a fully developed business case, including options analysis, prior to inclusion in the CPP application. The final comment from the 2020 AMP above indicates that the detailed inspections to support a detailed business case have not yet commenced.
Given this situation, it is difficult to conclude that a volumetric age-based model was appropriate to use to forecast these relatively low volume high cost replacements.
In our opinion, the major pole-to-ground conversion programme should have been treated as a separate major project and forecast separately to the business-as-usual pole replacements.
Aurora also applied smoothing of a 10-year expenditure profile As with distribution cables, Aurora has applied a delivery ‘smoothing’ adjustment to the replacement volumes forecast by its model. The effect of this smoothing is shown in the chart below. It is important to note that the replacements in this chart include those pole mounted transformers that are expected to be replaced as part of pole replacements.
Source: Strata chart using MOD21 data
Aurora’s smoothing adjustment applied to its pole mounted transformers is due to deferral of 60 ≤15 kVA transformer replacements primarily in Central Otago and 24 >200 kVA transformer replacements on the Dunedin network. The deferred ≤15 kVA replacements are likely to be recovery from an under delivery of forecast quantities in 2020 and 2021, rather than a proactive adjustment to smooth future deliverability of the programme. The >200 kVA deferrals may reflect the early stage of the development of the major pole-to-ground conversion programme.
Aurora has not explained why it is able to take on the increased level of failure risk implicit in its deferral of modelled replacements. There is no discussion on this included in its AMP or POD21 documents. We assume that this means its management and directors were unaware of it when reviewing and challenging the forecast expenditure.
We have no information to conclude whether the deferral is efficient and prudent, but on the assumption that Aurora management has evaluated and accepted the increased risk, we have no reason to challenge its legitimacy. However, the absence of detailed consideration of the risk undermines confidence in the reliability of the proposed volumes for the CPP period.
64 Aurora 2020 AMP, page 317

Aurora CPP – review of forecast expenditure
55
Opinion on the capital costing methodology Capital forecasting method used by Aurora Aurora describes the methodology it used to develop its pole mounted transformer renewal capex forecast as a volumetric approach to forecasting—multiplying a unit rate and the forecast replacement quantity:
We use a volumetric approach for forecasting pole mounted distribution transformer renewal Capex. The volumetric approach (i.e. a unit rate multiplied by the forecast replacement quantities) is used for high volume renewals where asset-specific details are not known at the time of forecasting. 65
Volumetric forecasting is appropriate where asset information is thin Aurora has made the correct decision in not applying more sophisticated approaches to volumetric planning until it holds sufficient and reliable condition and other data on its pole mounted transformers.
Taking age as a proxy for condition is appropriate so long as other known factors are used as moderators. These factors include the application of known failure rates, inspection results and criticality. Whilst Aurora says that moderators have been applied, and that the forecast will only address critical assets, we are unable to confirm how Aurora has applied these moderators. We are not convinced by the evidence provided that Aurora’s ramp up of pole mounted transformer replacements to approximately double previous replacement levels is targeted at only critical assets.
The modelling appears to not have accounted for the historically low failure rates for distribution transformers when determining the normal distribution curve for failure rates. Given the relatively low failure rates and absence of information on how the health index value is derived and supported, the escalation in critical assets is not explained by the factual evidence supplied by Aurora.
There is no evidence of the programme being optimised on a criticality basis.
We do not accept the need for any deliverability smoothing. Aurora’s application of this has no foundation and there is no evidence that it has considered the increased risk of failure arising from its proposed replacement deferrals.
The critical issue with Aurora’s use of a volumetric model is that 68% of the proposed expenditure relates to low volume, high cost items and is not consistent with its criteria for using a volumetric method.
There is no evidence of a top-down review Aurora states that it includes a top-down review as part of its expenditure forecasting process. Aurora identifies that the top-down approach has removed the replacement of “non-critical pole mounted transformer replacements”:
Review and moderation: our forecasts have been reviewed by executive management and the Board, and the forecasts have been moderated to reflect this top down challenge. We have deferred overdue but non-critical pole mounted transformer replacements to be addressed by RY30.66
We have searched the available documents for information on the process followed for the top- down review, specifically to gain an understanding of how the criticality assessment was made. No information was provided. The model-derived outputs that do not allow for any prioritisation on
65 Aurora Energy, 12 June 2020, Customised price-quality path application, page 126 66 Aurora Energy, 12 June 2020, Customised price-quality path application, page 126

Aurora CPP – review of forecast expenditure
56
criticality are used to derive the expenditure forecasts. There is no sign of any deferral other than an apparent backlog of under-delivered replacements.
The short form POD21 containing two pages of high-level information supplied to management and directors was, in our opinion, insufficient to inform a challenge for the proposed $33m 10-year investment plan.
Unit costs appear to be appropriate Aurora has applied market-based rates from Delta and UCSL to its volumetric replacement programme to create the expenditure forecast. Aurora supplied a copy of a price book benchmarking report67 that it had engaged Jacobs to undertake. The benchmarking compared transformer manufacturers’ unit costs elevated to include likely installation and other costs with Aurora’s price book values. This provides limited assurance that Aurora’s unit costs are competitive and aligned with its peers. It does not consider potential efficiency opportunities from higher volume purchasing and the new contractor competition that Aurora has introduced for the replacement work.
We have calculated average unit costs for pole mounted transformers. These are discussed below.
Whilst Aurora has introduced an element of competition in its use of contractors, the unit costs applied to its volumetric prices for pole mounted transformers are considerably different from its previous average unit costs for this asset fleet.
The chart below shows a comparison of unit costs for distribution transformers forecast for the CPP period in Aurora’s 2018 AMP and in its CPP application.
2022 2023 2024
2018 AMP
Forecast ($m) $3.8 $4.1 $4.5
Units 50 50 50
Average 0.0752 0.0816 0.0908
$75,200 $81,600 $90,800
3 year average $82,533
CPP application
Forecast ($m) $2.1 $3.0 $3.6
Units 60 80 95
Average 0.035 0.0375 0.037894737
$35,000 $37,500 $37,895
3 year average $36,798
Note that the 2018 AMP values are constant 2018 dollars and the CPP are constant 2020 dollars.
Aurora’s 2018 AMP forecasts a 10-year average unit cost of $60,000 (500 replacements over 10 years costing $30m).
The difference in unit costs suggests that the replacement programme proposed in the CPP is markedly different from that which Aurora was forecasting for the same period in its 2018 AMP. One explanation for the difference is likely to be that the replacement programme has shifted towards increased replacement of smaller transformers i.e. </= 50 kVA. However, this is not identified or discussed in documents we have reviewed.
Aurora recently supplied its pole mounted distribution transformers model MOD21. The unit costs applied in the model are:
67 RFI D293 - Aurora Pricebook Review Final 21 Jan 2020
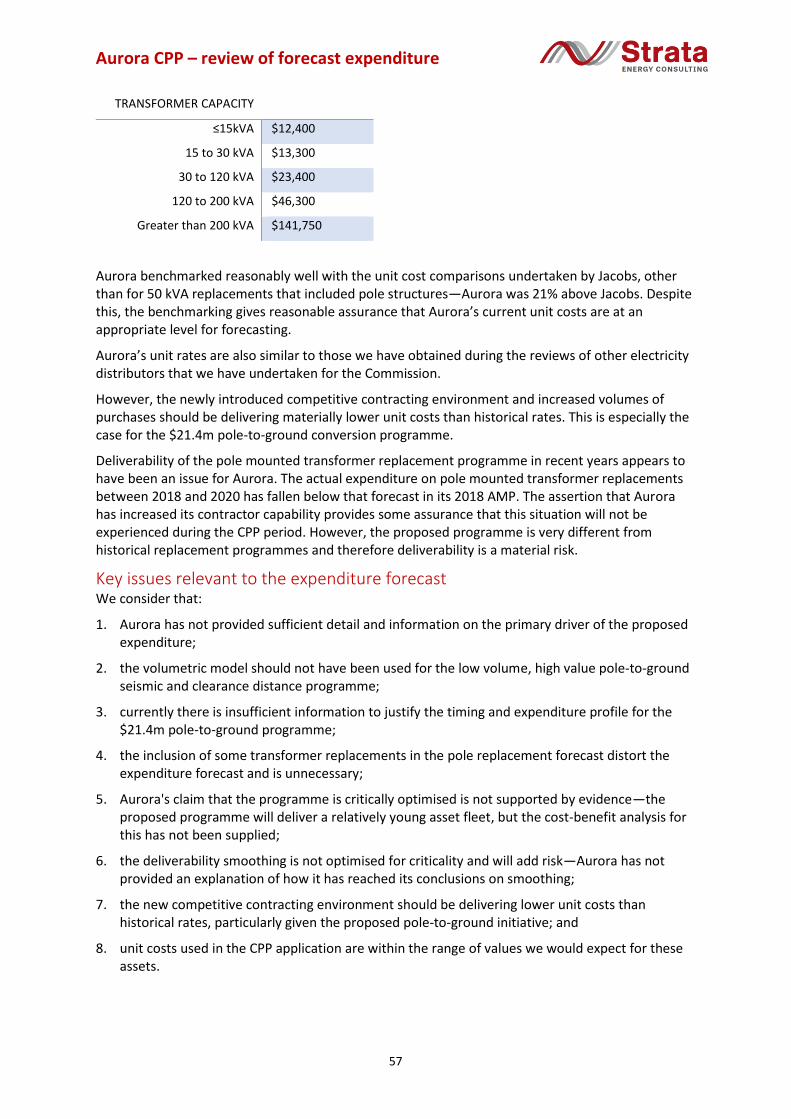
Aurora CPP – review of forecast expenditure
57
TTRANSFORMER CAPACITY Unit Rate
≤15kVA $12,400
15 to 30 kVA $13,300
30 to 120 kVA $23,400
120 to 200 kVA $46,300
Greater than 200 kVA $141,750
Aurora benchmarked reasonably well with the unit cost comparisons undertaken by Jacobs, other than for 50 kVA replacements that included pole structures—Aurora was 21% above Jacobs. Despite this, the benchmarking gives reasonable assurance that Aurora’s current unit costs are at an appropriate level for forecasting.
Aurora’s unit rates are also similar to those we have obtained during the reviews of other electricity distributors that we have undertaken for the Commission.
However, the newly introduced competitive contracting environment and increased volumes of purchases should be delivering materially lower unit costs than historical rates. This is especially the case for the $21.4m pole-to-ground conversion programme.
Deliverability of the pole mounted transformer replacement programme in recent years appears to have been an issue for Aurora. The actual expenditure on pole mounted transformer replacements between 2018 and 2020 has fallen below that forecast in its 2018 AMP. The assertion that Aurora has increased its contractor capability provides some assurance that this situation will not be experienced during the CPP period. However, the proposed programme is very different from historical replacement programmes and therefore deliverability is a material risk.
Key issues relevant to the expenditure forecast We consider that:
1. Aurora has not provided sufficient detail and information on the primary driver of the proposed expenditure;
2. the volumetric model should not have been used for the low volume, high value pole-to-ground seismic and clearance distance programme;
3. currently there is insufficient information to justify the timing and expenditure profile for the $21.4m pole-to-ground programme;
4. the inclusion of some transformer replacements in the pole replacement forecast distort the expenditure forecast and is unnecessary;
5. Aurora's claim that the programme is critically optimised is not supported by evidence—the proposed programme will deliver a relatively young asset fleet, but the cost-benefit analysis for this has not been supplied;
6. the deliverability smoothing is not optimised for criticality and will add risk—Aurora has not provided an explanation of how it has reached its conclusions on smoothing;
7. the new competitive contracting environment should be delivering lower unit costs than historical rates, particularly given the proposed pole-to-ground initiative; and
8. unit costs used in the CPP application are within the range of values we would expect for these assets.
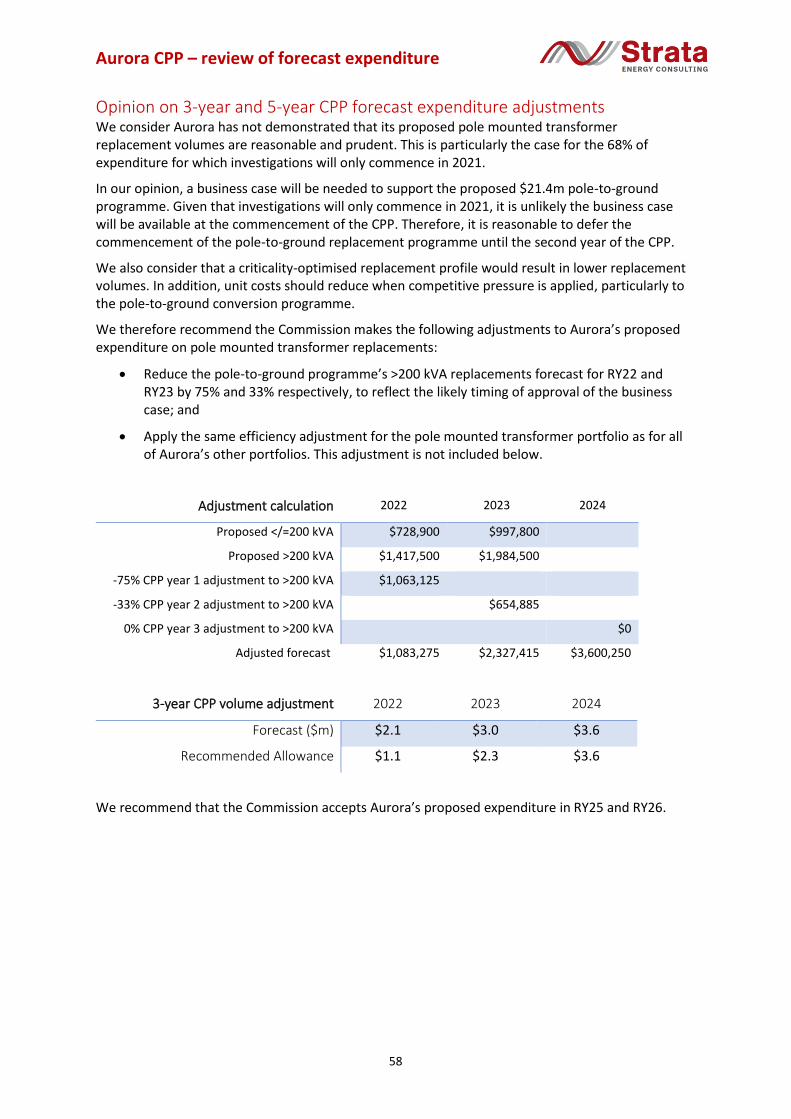
Aurora CPP – review of forecast expenditure
58
Opinion on 3-year and 5-year CPP forecast expenditure adjustments We consider Aurora has not demonstrated that its proposed pole mounted transformer replacement volumes are reasonable and prudent. This is particularly the case for the 68% of expenditure for which investigations will only commence in 2021.
In our opinion, a business case will be needed to support the proposed $21.4m pole-to-ground programme. Given that investigations will only commence in 2021, it is unlikely the business case will be available at the commencement of the CPP. Therefore, it is reasonable to defer the commencement of the pole-to-ground replacement programme until the second year of the CPP.
We also consider that a criticality-optimised replacement profile would result in lower replacement volumes. In addition, unit costs should reduce when competitive pressure is applied, particularly to the pole-to-ground conversion programme.
We therefore recommend the Commission makes the following adjustments to Aurora’s proposed expenditure on pole mounted transformer replacements:
• Reduce the pole-to-ground programme’s >200 kVA replacements forecast for RY22 and RY23 by 75% and 33% respectively, to reflect the likely timing of approval of the business case; and
• Apply the same efficiency adjustment for the pole mounted transformer portfolio as for all of Aurora’s other portfolios. This adjustment is not included below.
Adjustment calculation 2022 2023 2024
Proposed </=200 kVA $728,900 $997,800
Proposed >200 kVA $1,417,500 $1,984,500
-75% CPP year 1 adjustment to >200 kVA $1,063,125
-33% CPP year 2 adjustment to >200 kVA $654,885
0% CPP year 3 adjustment to >200 kVA $0
Adjusted forecast $1,083,275 $2,327,415 $3,600,250
3-year CPP volume adjustment 2022 2023 2024
Forecast ($m) $2.1 $3.0 $3.6
Recommended Allowance $1.1 $2.3 $3.6
We recommend that the Commission accepts Aurora’s proposed expenditure in RY25 and RY26.
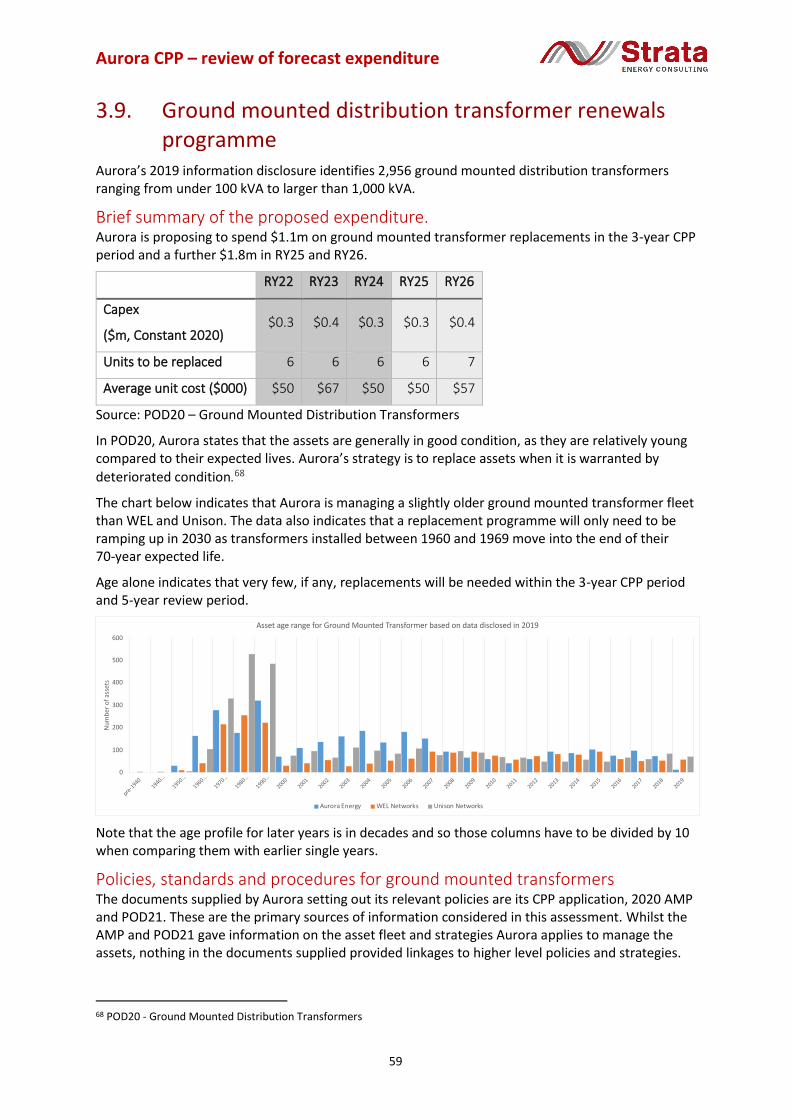
Aurora CPP – review of forecast expenditure
59
3.9. Ground mounted distribution transformer renewals programme
Aurora’s 2019 information disclosure identifies 2,956 ground mounted distribution transformers ranging from under 100 kVA to larger than 1,000 kVA.
Brief summary of the proposed expenditure. Aurora is proposing to spend $1.1m on ground mounted transformer replacements in the 3-year CPP period and a further $1.8m in RY25 and RY26.
RY22 RY23 RY24 RY25 RY26
Capex
($m, Constant 2020) $0.3 $0.4 $0.3 $0.3 $0.4
Units to be replaced 6 6 6 6 7
Average unit cost ($000) $50 $67 $50 $50 $57
Source: POD20 – Ground Mounted Distribution Transformers
In POD20, Aurora states that the assets are generally in good condition, as they are relatively young compared to their expected lives. Aurora’s strategy is to replace assets when it is warranted by
deteriorated condition.68
The chart below indicates that Aurora is managing a slightly older ground mounted transformer fleet than WEL and Unison. The data also indicates that a replacement programme will only need to be ramping up in 2030 as transformers installed between 1960 and 1969 move into the end of their 70-year expected life.
Age alone indicates that very few, if any, replacements will be needed within the 3-year CPP period and 5-year review period.
Note that the age profile for later years is in decades and so those columns have to be divided by 10 when comparing them with earlier single years.
Policies, standards and procedures for ground mounted transformers The documents supplied by Aurora setting out its relevant policies are its CPP application, 2020 AMP and POD21. These are the primary sources of information considered in this assessment. Whilst the AMP and POD21 gave information on the asset fleet and strategies Aurora applies to manage the assets, nothing in the documents supplied provided linkages to higher level policies and strategies.
68 POD20 - Ground Mounted Distribution Transformers
0
100
200
300
400
500
600
pre-1
9401940…
1950…
1960…
1970…
1980…
1990…
20002001
20022003
20042005
20062007
20082009
20102011
20122013
20142015
20162017
20182019
Nu
mb
er o
f as
sets
Asset age range for Ground Mounted Transformer based on data disclosed in 2019
Aurora Energy WEL Networks Unison Networks

Aurora CPP – review of forecast expenditure
60
Aurora provided references to specific technical standards and procedures. Where relevant, we have taken these into consideration.
The level of documentation supplied by Aurora is consistent with its statements and the Verifier’s finding that Aurora’s asset management documentation continues to be a work in progress.
Key planning assumptions for ground mounted transformer renewals Aurora’s key drivers69 for its proposed ground mounted distribution transformer replacements are:
1. condition: proactive replacements are based on condition inspection information and the results of DGA/oil testing on larger units;
2. power quality breaches: areas identified where power quality breaches have occurred and replace affected units; and
3. 0.2% H1: a strategic objective to maintain current fleet condition at 0.2% at end of useful life (H1).
Opinion on key assumptions for ground mounted transformer renewals Aurora’s assumptions are clear. If appropriate asset inspections are regularly undertaken, Aurora’s replace-on-condition strategy should ensure safe and reliable service from the older units.
The strategy to target areas that have experienced poorer reliability performance is appropriate if Aurora has not already addressed the issues in these areas.
Maintaining 0.2% assets at HI=1 is acceptable and should ensure that current performance levels are maintained in the future.
Opinion on the reasonableness and adequacy of asset replacement models Forecasting approaches Aurora applied to form its forecast Aurora describes the methodology it used to develop its ground mounted transformer replacement volumes as an age-based repex approach:
We forecast volume of standalone proactive replacements on the basis of expected remaining life. This uses the Repex calculation methodology based on a life expectancy of 70 years characterised as a normal distribution. This approach reflects our condition-based replacement strategy and is more robust than assuming the equipment fails or is in poor condition at a particular age. A replacement rate is calculated from the distribution representing proportion of transformers that will likely require replacement by a particular age.70
Using Aurora’s 2019 information disclosures, we determined that by the end of 2024, approximately 111 ground mounted transformers will be at or beyond 60 years old. On a straight age-based replacement, this produces an average replacement rate of 22 per year. Aurora has reduced this to 6 annual replacements—this reflects its understanding of the condition of the assets and the low failure rates being experienced.
The results of our age-based calculation using Aurora’s 2019 information disclosure are below:
2,956 Total assets
15 50% of post 1940 to 1949
0 Units currently above 70 years
15 Units above 70 years in 5 years’ time
69 POD20- -Ground Mounted Distribution Transformers 70 POD20 - Ground Mounted Distribution Transformers

Aurora CPP – review of forecast expenditure
61
2 Units installed since 2019
2.6 Annual replacement volumes to clear over 60-year units over a 5-year period
Our age-alone analysis suggests lower replacements than Aurora’s proposed 6 per year. However, given that there are 30 units that have been in service since the 1950s, in our opinion, Aurora’s proposed replacement rates should not be reduced further.
Opinion on the capital costing methodology Capital forecasting method used by Aurora Aurora describes the methodology it used to develop its ground mounted transformer replacement forecast as a volumetric approach to forecasting—multiplying a unit rate and the forecast replacement quantity:
We apply a single unit rate to forecast work volumes. This unit rate is based on historical costs and has been reviewed by an external party. 71
The unit cost we have derived from the forecast volumes and total cost is $50,000. However, in 2023 and 2025 the unit cost rises to $67,000 and $53,000 respectively. This indicates either an error in the forecast expenditure or a more bespoke approach to unit costs than Aurora says it has applied in its POD20.
Given the low materiality of the values, Strata recommends no adjustment for this inconsistency, but suggests that Aurora is asked to provide an explanation.
Summary of material issues identified in our review and assessment We have identified no material issues with the ground mounted transformers forecast.
Opinion on 3-year and 5-year CPP forecast expenditure adjustments We recommend that the Commission accepts Aurora’s expenditure forecast for this asset fleet.
71 POD20 - Ground Mounted Distribution Transformers

Aurora CPP – review of forecast expenditure
62
4. BRIEFING REPORT 3 – Capex (asset renewals)
4.1. Introduction This briefing paper addresses questions from the Commission on expenditure relating to several programmes of asset renewals proposed in Aurora’s CPP application.
4.2. Capex – Renewals programmes – Pole mounted fuses, switches, ADSE, DC systems, RTUs and facilities
Scope of work The Commission has asked Strata to review aspects of the following asset renewal programmes:
• Pole mounted fuses;
• Pole mounted switches;
• Ancillary distribution substation equipment;
• DC systems;
• Remote terminal units; and
• Facilities.
Specifically, for each expenditure programme, the Commission has asked Strata to carry out the following review work at a ‘proportionate’ level of scrutiny:
• an assessment of the reasonableness of the expenditure programme;
o the policies that underpin it;
o whether these have been applied appropriately;
o any models used to generate the forecasts and justify the expenditure programme; and
o whether any prioritisation has been applied or should be applied.
• an opinion on the capital costing methodology used for each programme if this is available; and
• an opinion on any 3-year and 5-year CPP forecast expenditure adjustments the Commission should make as a result of our analysis.
Aurora’s proposed replacement expenditure for the asset fleets The following tables set out the proposed replacement expenditure for the six asset fleets. The values have been taken from the relevant models supplied by Aurora and these are consistent with the values in the 2020 AMP and in the Excel workbook ‘01 - Forecast Tracker - Post IV Review’ supplied to Strata by the Commission.
Aurora's proposed capex RY22–RY24 2022 2023 2024
Pole mounted fuses $245,000 $260,000 $275,000
Pole mounted switches $588,000 $588,000 $588,000
Ancillary distribution substation equipment $772,227 $1,287,777 $1,087,777

Aurora CPP – review of forecast expenditure
63
DC systems $678,828 $757,817 $757,817
Remote terminal units $84,000 $84,000 $231,000
Facilities $589,306 $589,306 $589,306
Total proposed $2,957,361 $3,566,899 $3,528,899
Aurora's proposed capex RY25–RY26 2025 2026
Pole mounted fuses $285,000 $285,000
Pole mounted switches $529,200 $470,400
Ancillary distribution substation equipment $1,087,777 $1,087,777
DC systems $823,277 $823,277
Remote terminal units $294,000 $315,000
Facilities $589,306 $589,306
Total proposed $3,608,559 $3,570,759
The total proposed expenditure for the 3-year CPP period for these fleets is $10,053,158.
The total proposed expenditure for the additional 2 years of the 5-year review period for these fleets is $7,179,318.
The total proposed expenditure for the 5-year review period for these fleets is $17,232,477.
Strata’s recommended adjustments to Aurora’s proposed replacement expenditure The following tables set out Strata’s proposed adjustments to the replacement expenditure for the six asset fleets. The explanations for the proposed adjustments are provided in the relevant sections of the evaluation table.
Adjusted capex RY22–RY24 2022 2023 2024
Pole mounted fuses $180,000 $205,000 $220,000
Pole mounted switches $541,000 $541,000 $541,000
Ancillary distribution substation equipment
$772,227 $1,287,777 $1,087,777
DC systems $678,828 $757,817 $757,817
Remote terminal units $84,000 $84,000 $231,000
Facilities $589,306 $589,306 $589,306
Total recommended allowance $2,845,361 $3,464,899 $3,426,899
Reduction ($) ($112,000) ($102,000) ($102,000)
Reduction % -3.79% -2.86% -2.89%

Aurora CPP – review of forecast expenditure
64
Adjusted capex RY25–RY26 2025 2026
Pole mounted fuses $235,000 $245,000
Pole mounted switches $541,000 $541,000
Ancillary distribution substation equipment
$1,087,777 $1,087,777
DC systems $823,277 $823,277
Remote terminal units $147,000 $231,000
Facilities $589,306 $589,306
Total recommended allowance $3,423,359 $3,517,359
Reduction ($) ($185,200) ($53,400)
Reduction % -5.13% -1.50%
Our proposed adjustments result in a rounded average adjustment of -3.1% for the 3-year CPP period and -3.2% for the 5-year review period.
Recommendation for a portfolio level adjustment In addition to the above, we recommend that the Commission applies a -5% efficiency adjustment to the total asset replacement capex forecast in each regulatory year, to reflect overestimation bias in the forecast, deliverability, and unit cost reductions.
The above adjustment is additional to the recommended adjustments we make for the individual fleets and should be applied to the aggregated adjusted individual portfolio forecasts.
4.3. Assessment of the reasonableness of the expenditure programme
Assessment of policies that are underpinning the expenditure In this section we provide our assessment of the policies, standards and procedures that are common to each of the five asset classes to be reviewed. We also provide assessments of any documents that are specific to an asset category in the section related to that asset category.
Documents relied on for our assessment To assist Strata in addressing the Commission’s questions on Aurora’s policies, standards and procedures, the Commission submitted Request for information (RFI) 032 to Aurora. This RFI asked Aurora to provide (or identify in documents already supplied by Aurora) the policies, planning standards and procedures Aurora relied upon in determining its asset replacement capex forecast.
In its response, Aurora supplied a list of technical specifications and procedures. Aurora stated that these were the published policies, standards, and procedures that it relied upon when determining the asset replacement forecast for its renewal capex forecasts. In addition, Aurora provided several asset Portfolio Overview Documents (PODs). We consider Aurora did not provide any policies, planning standards, or key assumptions.
We have used the information Aurora provided in its response, together with relevant information from its CPP application, AMP and information disclosures.

Aurora CPP – review of forecast expenditure
65
Our assessment of policies underpinning the expenditure The information and documents supplied by Aurora for the asset fleets within the scope of this assessment are identical to those provided for the asset fleets covered by our review detailed in the briefing report BR03 (Repex Part 1). Accordingly, that assessment also applies to the fleets covered in this briefing report. The implications of this for the proposed expenditure are:
• it will be based on assumptions that may be unreliable;
• proposed individual asset fleet replacement programmes are more likely to be understated or overstated; and
• the aggregated portfolio of asset fleet expenditure is likely not to be prudent, efficient and deliverable.
To ensure that these implications have been fully addressed Aurora should have:
• ensured a rigorous top-down review and challenge was applied to its bottom-up forecasts;
• undertaken assessments and made adjustments at an asset portfolio level; and
• applied sensitivity analysis to test the reasonableness and deliverability of its combined programme.
The information we have reviewed indicates that these actions have not been taken and therefore we consider that the expenditure forecast is unlikely to meet a reasonable and prudent threshold.
Assessment of models used to generate the forecasts and justify the expenditure programme For the asset fleets reviewed, Aurora used two types of models:
1. an age-based volumetric model; and
2. a cost forecast-only model.
The models applied to the fleets reviewed are:
Pole mounted fuses Age-based probability of failure volumetric model
Volume x unit cost = forecast expenditure
Pole mounted switches Age-based volumetric model
Volume x unit cost = forecast expenditure
Ancillary distribution substation equipment
Cost forecast-only model
Volume x unit cost = forecast expenditure
DC systems Age-based volumetric model
Volume x unit cost = forecast expenditure
Remote terminal units Age-based probability of failure volumetric model
Volume x unit cost = forecast expenditure
Facilities Adjusted historical average
Assessment of the age-based volumetric model The models supplied by Aurora for each asset fleet have been used to calculate a 10-year expenditure forecast. The modelled forecasts were used as building blocks for the 3-year CPP period and 5-year review period expenditure forecasts submitted by Aurora in its CPP application.

Aurora CPP – review of forecast expenditure
66
No post-model adjustments made by Aurora to the expenditure forecasts were apparent. This indicates that the modelled outputs were accepted without challenge or that the results were resilient to challenge, which would be very unusual for age-based replacement programmes.
We consider that the models are first generation, providing a basic asset age-based replacement programme. These models tend to overstate replacement volumes when compared to more advanced Condition Based Risk Assessment (CRRM)72, risk monetisation (sometimes called Risk Cost) and criticality asset management tools. This is particularly the case for electricity utility assets which have generally been regularly inspected, maintained and if necessary repaired or replaced.
Where volumetric basic modelling is used, it is important that the outputs are not taken at face value. Sensitivity testing of outputs to a range of input assumptions should be made. For Aurora’s models, we found that the critical assumptions included probability of failure based on age and assumptions of age-based failure rates. These assumptions must be tested against failure rates actually being experienced and engineering knowledge of the general condition of the fleet. We did not see any evidence that Aurora had done this. For example, Aurora used failure rates, derived from a standard distribution with a standard deviation formed from the square root of expected asset life, for all ranges of assets, (e.g. across the broad range of distribution transformers).
4.4. Asset fleet summaries Our assessment summaries for the asset fleets identified by the Commission are provided in the following table.
72 EA Technology found up to 20% reductions when utilities apply its CBRM methodology as a replacement for age-based replacement asset management.

Aurora CPP – review of forecast expenditure
67
Fleet Fleet strategy and proposed work Assessment
Pole mounted fuses
There are 5,700 pole mounted fuses installed on the overhead network. These are relatively young, with an expected life of 55 years.
Aurora’s strategy is to gradually increase replacements to a steady state of around 50 replacements a year over the CPP period.
Aurora’s strategy is to replace pole mounted fuses based on condition (e.g. if visual inspections identify type issues, cracked insulators or extensive corrosion).
Aurora’s model identifies a gradual increase in pole mounted fuse replacements when pole coincident replacements are removed, but that is not the full picture. Note that pole coincident fuse replacement costs are included in the pole replacement expenditure.
Aurora’s model is forecasting failure probability on a standard distribution where the standard deviation is the square of the expected asset life.
$-
$50,000
$100,000
$150,000
$200,000
$250,000
$300,000
$350,000
0
10
20
30
40
50
60
70
2020 2021 2022 2023 2024 2025 2026 2027 2028 2029 2030
Nu
mb
er
of
rep
lace
men
ts
Pole mounted fuse replacementsExcluding poles coincident
Central Dunedin Expenditure
0
10
20
30
40
50
60
70
80
2020 2021 2022 2023 2024 2025 2026 2027 2028 2029 2030N
um
be
r o
f re
pla
cem
ents
Pole mounted fuse replacementsIncluding pole coincident replacements
Central Dunedin Pole coincident replacements

Aurora CPP – review of forecast expenditure
68
Fleet Fleet strategy and proposed work Assessment
Aurora did not identify that it had undertaken sensitivity testing of the modelled outputs to its input assumptions. We undertook limited sensitivity testing and found that the expenditure forecast was extremely sensitive to changes in the expected life assumptions.
Changing the expected life from 55 to 60 years reduced the 3-year CPP forecast expenditure by 51% and the 5-year review period forecast expenditure by 46%.
Changing the expected life from 55 to 57 years reduced the 3-year CPP forecast expenditure by 22% and the 5-year review period forecast expenditure by 20%.
The sensitivity of the model to small changes in expected age indicates that the model’s determination of the probability of failure should be sense checked against actual failure rates and experience. Note that the historical expenditure in 2020 is likely to be indicating low levels of faults.
We recommend reducing this expenditure by 20% to reflect the potential bias towards over forecasting in the model.
The resulting expenditure profile is:
2022 2023 2024 2025 2026
$180,000 $205,000 $220,000 $235,000 $245,000
Pole mounted switches
Aurora has 926 pole mounted switches at an average age of 34 years, with 28% above the 50-year life expectancy.
Aurora’s strategy is to replace 40 each year to maintain the health of the fleet. Note that health is based on age. Aurora has deferred 72 replacements from 2020 and 2021 and allocated these to later years. No reason is given for the deferral or how any increased risks are being managed. However, it appears that the
Aurora’s model indicates that Aurora’s stated strategy of 40 switch replacements per year will only happen in the 3-year CPP period when pole coincident replacements are excluded, and in the first four years of the 5-year review period.

Aurora CPP – review of forecast expenditure
69
Fleet Fleet strategy and proposed work Assessment
deferral seems to have been minimised by the replacements occurring coincidentally with pole replacements.
We found that changing the expected life assumption from 50 years to 52 years reduced the 3-year CPP forecast expenditure by $88,200 and the 5-year review period forecast expenditure by $58,800. The chart below indicates that the effect of reducing the expected life defers some earlier replacements to the end of the 5-year review period.
$-
$100,000
$200,000
$300,000
$400,000
$500,000
$600,000
$700,000
0
5
10
15
20
25
30
35
40
45
2021 2022 2023 2024 2025 2026 2027 2028 2029 2030
Nu
mb
er
of
rep
lace
men
ts
Pole mounted switchesExluding pole coincident replacements
Central Dunedin Expenditure
0
10
20
30
40
50
60
2021 2022 2023 2024 2025 2026 2027 2028 2029 2030
Nu
mb
er
of
rep
lace
men
ts
Pole mounted switchesInluding pole coincident replacements
Central Dunedin Pole coincident replacements
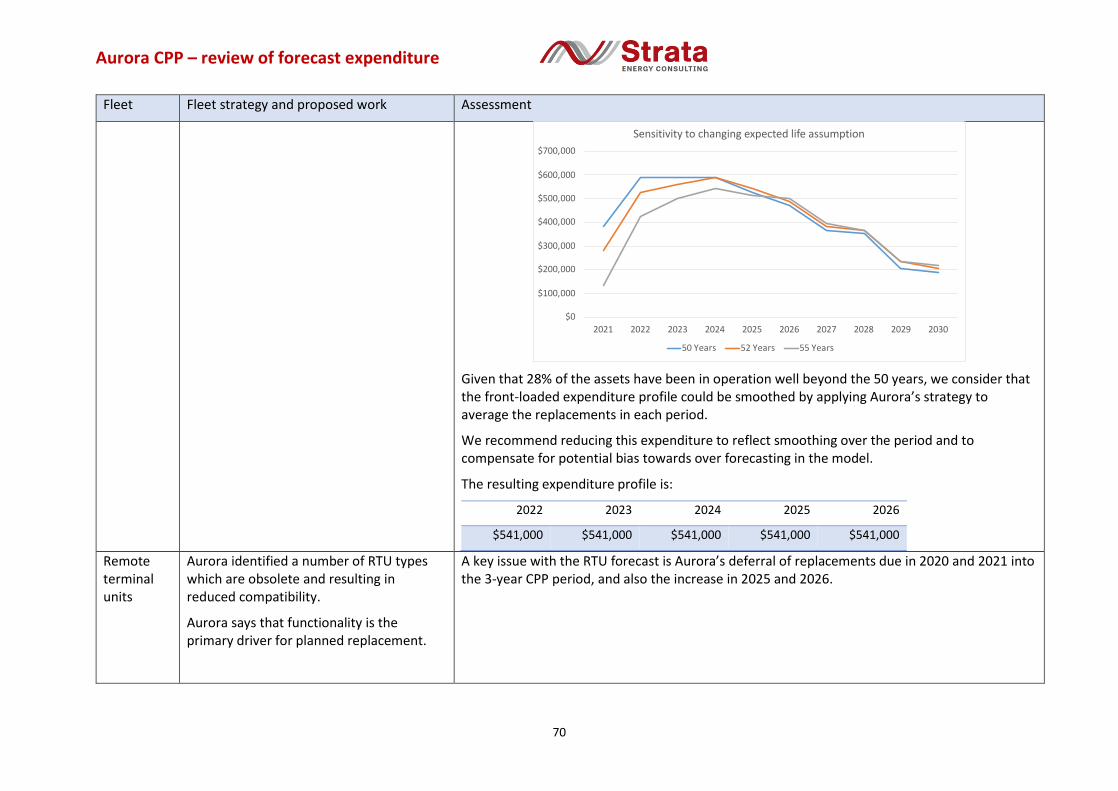
Aurora CPP – review of forecast expenditure
70
Fleet Fleet strategy and proposed work Assessment
Given that 28% of the assets have been in operation well beyond the 50 years, we consider that the front-loaded expenditure profile could be smoothed by applying Aurora’s strategy to average the replacements in each period.
We recommend reducing this expenditure to reflect smoothing over the period and to compensate for potential bias towards over forecasting in the model.
The resulting expenditure profile is:
2022 2023 2024 2025 2026
$541,000 $541,000 $541,000 $541,000 $541,000
Remote terminal units
Aurora identified a number of RTU types which are obsolete and resulting in reduced compatibility.
Aurora says that functionality is the primary driver for planned replacement.
A key issue with the RTU forecast is Aurora’s deferral of replacements due in 2020 and 2021 into the 3-year CPP period, and also the increase in 2025 and 2026.
$0
$100,000
$200,000
$300,000
$400,000
$500,000
$600,000
$700,000
2021 2022 2023 2024 2025 2026 2027 2028 2029 2030
Sensitivity to changing expected life assumption
50 Years 52 Years 55 Years
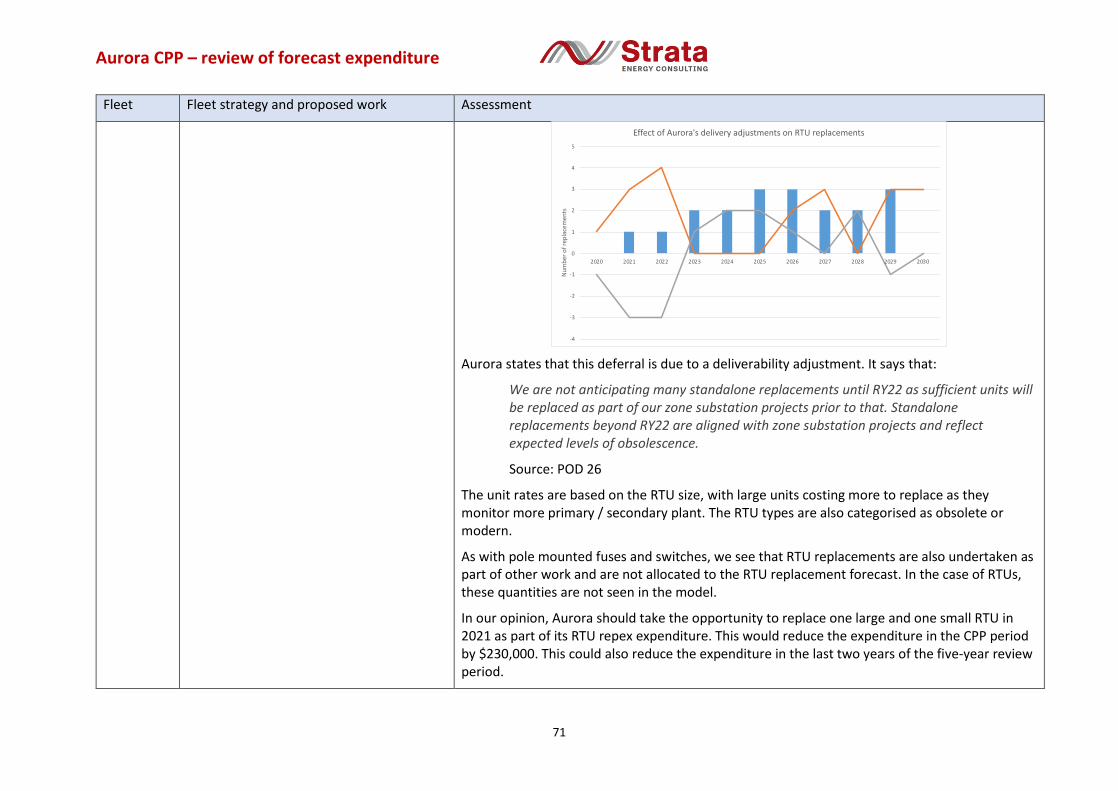
Aurora CPP – review of forecast expenditure
71
Fleet Fleet strategy and proposed work Assessment
Aurora states that this deferral is due to a deliverability adjustment. It says that:
We are not anticipating many standalone replacements until RY22 as sufficient units will be replaced as part of our zone substation projects prior to that. Standalone replacements beyond RY22 are aligned with zone substation projects and reflect expected levels of obsolescence.
Source: POD 26
The unit rates are based on the RTU size, with large units costing more to replace as they monitor more primary / secondary plant. The RTU types are also categorised as obsolete or modern.
As with pole mounted fuses and switches, we see that RTU replacements are also undertaken as part of other work and are not allocated to the RTU replacement forecast. In the case of RTUs, these quantities are not seen in the model.
In our opinion, Aurora should take the opportunity to replace one large and one small RTU in 2021 as part of its RTU repex expenditure. This would reduce the expenditure in the CPP period by $230,000. This could also reduce the expenditure in the last two years of the five-year review period.
-4
-3
-2
-1
0
1
2
3
4
5
2020 2021 2022 2023 2024 2025 2026 2027 2028 2029 2030
Nu
mb
er
of
rep
lace
men
ts
Effect of Aurora's delivery adjustments on RTU replacements

Aurora CPP – review of forecast expenditure
72
Fleet Fleet strategy and proposed work Assessment
We recommend that the proposed expenditure for the 3-year CPP period is accepted but that the expenditure for the last two years of the 5-year review period be reduced by $230,000.
This results in the following expenditure profile:
2022 2023 2024 2025 2026
$84,000 $84,000 $231,000 $147,000 $231,000
Ancillary distribution substation equipment
Replacement of underground substations around Dunedin, and 11 kV and 33 kV surge arrestors across the network. A portion of the underground substations will be relocated above ground, while the rest remain underground following replacement of equipment and required structural improvements.
During the 3-year CPP period Aurora plans to:
• relocate 3 underground substations above ground;
• for 2 underground substations, replace electrical equipment, make structural repairs, and perform other recommended safety work;
• spend $600k to replace 33 kV surge arrestors; and
• spend $100k to replace 11 V surge arrestors.
Substations constructed in the 1960s, and an investigation undertaken in 2018, revealed several
issues with assets beyond expected life. Some surge arrestors are unvented porcelain types which can explode. The replacement strategy is sound.
Aurora explained that replacement volumes have been phased to ensure sufficient resource is available to carry out the works and complete consenting processes. The chart below shows that above ground replacements are at the same level across 10 years and it is the in-situ replacements that are driving the profile.
Because costs are materially different for replacing a substation at its current location (in-situ) or relocating above ground, these are itemised separately.
$-
$200,000
$400,000
$600,000
$800,000
$1,000,000
$1,200,000
$1,400,000
2021 2022 2023 2024 2025 2026 2027 2028 2029 2030
Ancillary distribution substation equipment
Above ground In situ 33kV Surge Arresters 11kV Surge Arresters

Aurora CPP – review of forecast expenditure
73
Fleet Fleet strategy and proposed work Assessment
During the final 2 years of 5-year review period Aurora plans to:
• relocate 2 underground substations above ground; and
• for 2 underground substations, replace electrical equipment, make structural repairs, and perform other recommended safety work
• continue replacing 11 kV surge arrestors.
The replacement drivers for this fleet are safety, condition, and reliability.
In RY20, Aurora began proactive replacing 33 kV surge arrestors and developing detailed designs for underground substation replacement.
The replacement volumes are conservative given the age and associated risks for the assets.
Aurora states that its unit costs have been estimated and reviewed by external consultants. For a 10-year programme, Aurora could probably secure discounts on standard rates.
We recommend that the proposed expenditure is accepted.
DC systems
Standalone replacements of DC systems as part of larger zone substation projects, including batteries and chargers.
Most batteries do not have redundancy, so single cell failure can result in loss of substation control and protection. WSP identified this as a safety and reliability risk.
Aurora currently has a backlog of overdue battery renewals and plans to address this over the next 10 years.
The strategy is to:
• replace redundant batteries with N-1 security at 8 years of age; and
There is the following confusing comment in POD25:
The expenditure is included in the related zone substation portfolio.
This suggests that the expenditure may be double counted, or triple counted if it is also an opex item. We have been unable at this stage to determine if the expenditure is included in the zone substation capex category.
Expected life is 8 years; Aurora replaces at 5 years due to having no redundancy. This appears to be quite conservative. No other options (e.g. relocatable backup) are discussed in POD25.
The POD records only one failure example—in RY20 one 10-year plus battery bank failed discharge testing at a Dunedin zone substation. However, this was a test failure and not a battery failure event. Also, given Aurora replaces at 5 years, why was this battery above 10-years old?
The backlog of replacements is not insignificant:
1. 11 in 2021 for N redundancy 110 V DC systems; and

Aurora CPP – review of forecast expenditure
74
Fleet Fleet strategy and proposed work Assessment
• replace redundant batteries with N security at 6 years and upgrade to N-1.
Other DC system components, (e.g. battery chargers and DC distribution panels) are replaced with batteries (as required due to age).
2. 10 in 2021 for N redundancy 24 / 48 V DC systems.
There are no backlogs for the N-1 DC systems.
Given the risks identified by WSP and Aurora for the N redundancy DC systems, it is surprising that such a backlog has occurred.
Aurora constrains its replacements to 4 per year. This means that the backlog will not be cleared immediately.
We accept that the risks associated with the N security DC systems must be managed and reduced. There is insufficient evidence to conclude that the current replacement is efficient, prudent and at an optimal risk/cost point.
In other words, we consider that the expenditure will be required but probably against a more appropriate strategy.
Facilities
Facilities expenditure covers non-network assets other than ICT investments. The category includes office equipment and fit-outs expenditure.
Aurora explains a short-term increase during the CPP period as being due to investment in assets needed to accommodate greater staff numbers.
To calculate a base year expenditure, Aurora applied the average expenditure it incurred over the period RY18 to RY20, which was $592,816/regulatory year. To this average Aurora added an adjustment of -$3,511 to form a consistent forecast of $589,306. Aurora used this value as the
The expenditure forecast for the CPP period and the review period is to replace and upgrade equipment on a steady state basis.
Aurora’s explanation of the expenditure profile is consistent with its modelled output.
$0
$200,000
$400,000
$600,000
$800,000
$1,000,000
$1,200,000
2018 2019 2020 2021 2022 2023 2024 2025 2026 2027 2028 2029 2030
Facilities replacement forecast

Aurora CPP – review of forecast expenditure
75
Fleet Fleet strategy and proposed work Assessment
forecast expenditure for each regulatory year from 2022.
The increase in expenditure in RY21 and RY22 is driven by increasing staff numbers, so is not strictly repex. However, the expenditure proposed for the 3-year CPP period and the 5-year review period is at the adjusted base level of the average of the three most recent regulatory years.
Aurora explained that the decline in RY19 expenditure was due to the deferral of a number of fit-out projects as alternative options were considered. Presumably, these contributed to the increase above the historical average in RY20 and RY21.
Aurora did not provide any detail to support its use of the historical average nor why it had applied an adjustment.
We would have expected that a forecast of facility equipment could be achieved by comparing the historical expenditure with the asset values and projected depreciation. If the aggregated depreciation on facility assets is level across future regulatory years, the forecast would be supported; if not, the use of average historical values would be questionable.
In the absence of information to support the proposed facilities expenditure, we are unable to conclude that the forecast is reasonable and prudent. However, given the relatively low value of the forecast, we do not recommend an adjustment at the asset fleet level.

Aurora CPP – review of forecast expenditure
76
5. OPEX BRIEFING REPORT 1 – Efficiency of RY19 maintenance opex
5.1. Introduction The Commerce Commission (the Commission) has engaged Strata to review specific topics related to Aurora Energy’s (Aurora’s) CPP application and the Verifier’s report.
This briefing report considers the efficiency of Aurora’s network maintenance operational expenditure (opex) in the 2019 regulatory year (RY19).
In its CPP proposal Aurora used a ‘base-step-trend’ approach to estimate proposed opex relating to preventive maintenance, corrective maintenance, and reactive maintenance. Aurora’s rationale for using this approach was that its maintenance opex comprises controllable, recurrent costs, where Aurora’s broad approach is not being changed. For example, Aurora expects to maintain the same balance between internally provided resource and outsourced support during the CPP period.73
Aurora considers actual RY19 expenditure for preventive, corrective and reactive maintenance is efficient and therefore provides an appropriate base cost for forecasting expenditure over the CPP and review periods. However, the Verifier was unable to confirm that this expenditure, in aggregate across the three maintenance programmes, was efficient.74
The Verifier benchmarked Aurora’s RY19 maintenance expenditure against a group of 12 electricity distributors the Verifier considered were comparable to Aurora.75 The Verifier found Aurora’s expenditure was not statistically different from the 12 distributors’ expenditure. However, the Verifier considered the following factors indicate Aurora’s RY19 maintenance expenditure may include some inefficiency, or at least some potential for efficiency gains to be realised:
• Aurora’s combined preventive, corrective and reactive maintenance expenditure in RY19 appeared higher than that of other distributors, although this was not statistically significant;
• Delta was the sole provider of maintenance services to Aurora in RY19 and the contract in place at that time, and the rates charged under it, were not market tested;
• Delta is a related party to Aurora, so the Verifier could not presume that Delta’s rates to Aurora reflect the outcomes of arms’ length negotiations; and
• Aurora informed the Verifier that, in RY19, Aurora undertook too few inspections and did not complete planned routine maintenance. Given this, the Verifier concluded RY19 appeared to not reflect business-as-usual activities. The Verifier believed if Aurora’s RY19 preventive maintenance opex appeared low compared to other distributors, this could be due to Aurora undertaking fewer preventive maintenance activities than these distributors.76
The Verifier concluded that, to inform whether the base year should be adjusted or not, it would be appropriate to review Aurora’s actual RY20 maintenance expenditure. This review could be used to determine what, if any, efficiencies may have been achieved by:
• The introduction of the new field services agreement (FSA) arrangement;
73 Aurora Energy, 7 August 2020 (received 26 August 2020), Response to RFI No. Q036 and RFI No. Q040, p. 3. 74 Farrier Swier, 8 June 2020, Verification report – Aurora Energy CPP application, p. 271. 75 Alpine Energy, Counties Power, Electra, Electricity Invercargill, MainPower NZ, Northpower, Orion NZ, Powerco, Unison Networks, Vector Lines, WEL Networks, Wellington Electricity. 76 Farrier Swier, 8 June 2020, Verification report – Aurora Energy CPP application, p. 271.

Aurora CPP – review of forecast expenditure
77
• The introduction of asset management improvements; and
• Ongoing productivity improvements (e.g. in system operations and network support (SONS), in people costs, and from investing in information and communications technology (ICT)).77
Scope of work The Commission has asked Strata to consider whether Aurora’s maintenance opex base year (RY19) should be adjusted or not, by reviewing Aurora’s actual RY20 maintenance expenditure.
5.2. Our assessment of the efficiency of RY19 maintenance opex
Like the Verifier and Aurora, we have assessed the efficiency of RY19 network maintenance opex using top-down benchmarking. We agree with Aurora over the difficulties associated with attempting to use bottom-up benchmarking in deciding an efficient base year for network maintenance opex.78
However, in addition to benchmarking the RY19 maintenance opex against Aurora’s industry peers, we have also looked at Aurora’s network maintenance opex over time.
RY19 maintenance opex appears consistent with Aurora’s maintenance opex over time Before benchmarking Aurora’s RY19 maintenance opex against that of other distributors, we have considered whether it is consistent with previous years.
We note Aurora has not done this comparison, because it considers the comparison to not be feasible or appropriate due to Aurora only recently becoming a standalone business. Aurora states:
While some functions were undertaken by Delta on behalf of Aurora, these were often shared with the wider contracting business. Others (sic) functions and activities e.g. contract management and procurement would have operated under very different commercial arrangements. Taking these together, it is our view that Opex pre-RY19 is generally incomparable to our current requirements.79
While this concern may be valid in relation to the SONS and People costs (Business support) opex categories, we think it does not apply to network maintenance. We do not see how the separation of Aurora from Delta should have led to any material change to the way in which Delta provides network management services.
Figure 1 shows the results of our comparison of RY19 network maintenance opex against earlier years. The RY19 opex is very close to the average opex over the five-year period RY15–RY19. This provides us with some comfort that RY19 network maintenance opex does not contain a series of one-off expenditures that are unlikely to be applicable over the CPP and review periods.
77 Ibid, pp. 80-81. 78 Aurora Energy, 7 August 2020 (received 26 August 2020), Response to RFI No. Q036 and RFI No. Q040, p. 4. 79 Ibid, p. 3.

Aurora CPP – review of forecast expenditure
78
Figure 1: Aurora network maintenance opex over the period RY15–RY19 (constant RY20 dollars)80
Source: Aurora, Forecast Tracker – 12 June Submission, ‘Submission w eff’ tab.
Our benchmarking results appear consistent with the Verifier’s and Aurora’s We have then compared Aurora’s network maintenance opex against that of a cohort of five distributors81 with a similar customer density to Aurora and with similarly sized networks to Aurora in respect of one or more of the following:
• Length of overhead lines;
• Length of urban overhead lines;
• Length of rural overhead lines;
• Length of underground cables.
Customer density is a useful initial filter for identifying distributors suitable for our benchmarking. We have then sought to reduce the range of factors that might cause differences between Aurora’s network maintenance opex and those of the distributors in our benchmarking, by looking at network length. As a result, our cohort is smaller than those used by the Verifier and Aurora in their respective benchmarking analyses.
The results of our benchmarking are shown in Figure 2 and Figure 3. The purpose of Figure 3 is to enable a comparison of our benchmarking against the Verifier’s benchmarking, given that our cohort is materially smaller than the Verifier’s. Figure 3 shows our benchmarking results to be consistent with the results of the Verifier’s benchmarking (see Figure 4)—i.e. Aurora’s RY19 maintenance opex is above the average of its peers, but not in a statistically significant manner. However, the standard errors in our benchmarking are much larger than in the Verifier’s benchmarking, because of our small sample size. Therefore, a more pertinent observation is that Aurora’s RY19 maintenance opex is above the average of its peers, but not in an overly material way.
80 Aurora has inflated historical numbers into RY20 dollars using the specification for the CPP inflation rate outlined in clause 5.3.4(9) of the CPP input methodology. 81 Counties Power, Orion NZ, Powerco, Unison Networks, and WEL Networks.

Aurora CPP – review of forecast expenditure
79
Figure 2: Network maintenance opex of distributor cohort over RY13 to RY19 (constant $RY20)82
82 The reference to “km of line” refers to “circuit length for supply” in distributors’ information disclosures.

Aurora CPP – review of forecast expenditure
80
Figure 3: Strata’s benchmarking of RY19 network maintenance opex per circuit km vs ICP density
Figure 4: Verifier’s benchmarking of RY19 network maintenance opex per circuit km vs ICP density
We have reviewed Aurora’s benchmarking83 and consider that our results are consistent with Aurora’s. Aurora has assessed the efficiency of the RY19 base year maintenance opex by benchmarking against 9 distributors84 the following:
• RY19 maintenance opex—broken down into scheduled maintenance (preventive and corrective maintenance combined) and reactive maintenance;85 and
83 Refer to Aurora Energy’s document ‘Industry benchmarking–Maintenance Opex’ in its response to RFI No. D028, RFI No. D060 and RFI No. D098. 84 Alpine Energy, Counties Power, MainPower NZ, Northpower, Orion NZ, Powerco, Vector Lines, WEL Networks, Wellington Electricity. 85 Aurora’s preventive and corrective maintenance categories align with the combined Information Disclosure categories of ‘Routine and Corrective maintenance and Inspection’ (RCI) and ‘Asset Replacement and Renewal’ (ARR), while Aurora’s

Aurora CPP – review of forecast expenditure
81
• Forecast RY22–RY24 maintenance opex—broken down as for RY19 maintenance opex.86
Aurora’s benchmarking indicates Aurora is around the average of the distributor cohort in relation to preventive and corrective maintenance, but above average in relation to reactive maintenance opex.
This appears consistent with our results and those of the Verifier—i.e. when all maintenance opex is combined, Aurora is above average but generally not materially so.
It is reasonable to expect RY19 maintenance expenditure would be above average It is reasonable to expect Aurora’s RY19 network maintenance expenditure would be above the average of its peers by the amount shown in the benchmarking. This is because Aurora had, over several years, pulled back on its replacement and renewal capital expenditure (capex), despite the advanced age of large parts of its networks—particularly the Dunedin network. Figure 5 shows this.
Figure 5: Replacement & renewal capex of distributor cohort over RY13 to RY19 (constant $RY20)
corrective maintenance category aligns with the Information Disclosure category ‘Service Interruptions and Emergencies’ (SIE). Refer to Aurora Energy’s document ‘Industry benchmarking–Maintenance Opex’ (p. 2) in its response to RFI No. D028, RFI No. D060 and RFI No. D098. 86 Ibid.
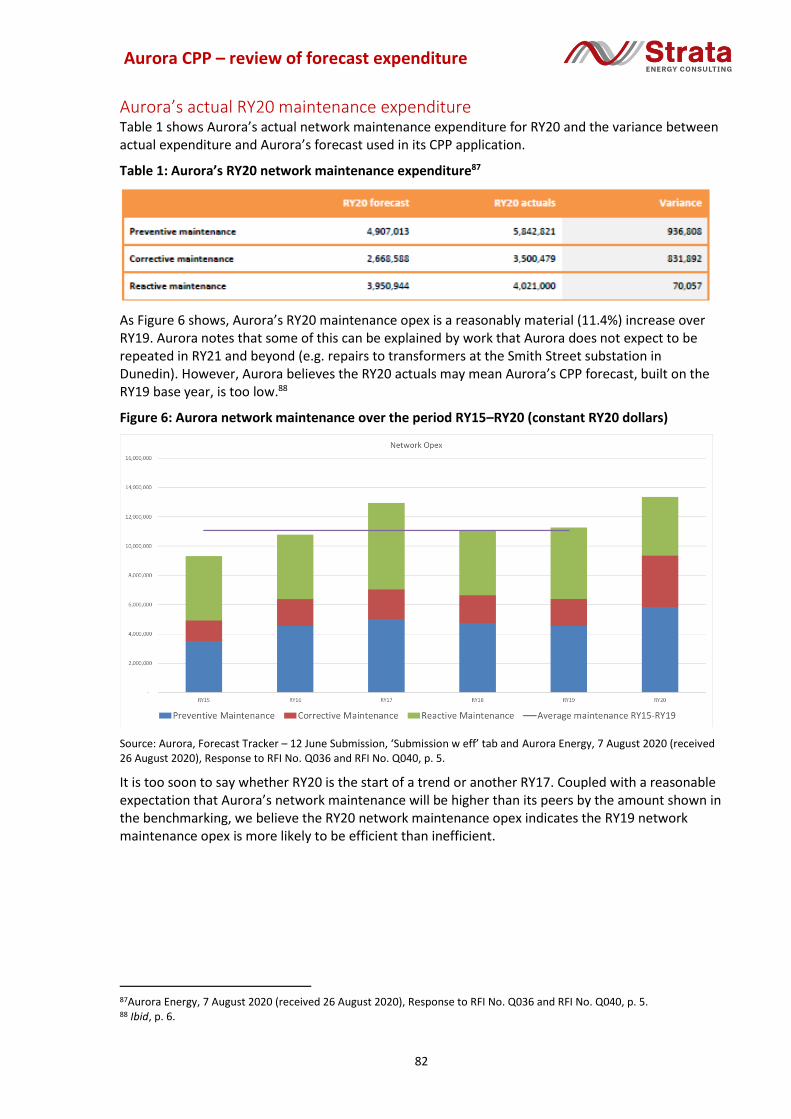
Aurora CPP – review of forecast expenditure
82
Aurora’s actual RY20 maintenance expenditure Table 1 shows Aurora’s actual network maintenance expenditure for RY20 and the variance between actual expenditure and Aurora’s forecast used in its CPP application.
Table 1: Aurora’s RY20 network maintenance expenditure87
As Figure 6 shows, Aurora’s RY20 maintenance opex is a reasonably material (11.4%) increase over RY19. Aurora notes that some of this can be explained by work that Aurora does not expect to be repeated in RY21 and beyond (e.g. repairs to transformers at the Smith Street substation in Dunedin). However, Aurora believes the RY20 actuals may mean Aurora’s CPP forecast, built on the RY19 base year, is too low.88
Figure 6: Aurora network maintenance over the period RY15–RY20 (constant RY20 dollars)
Source: Aurora, Forecast Tracker – 12 June Submission, ‘Submission w eff’ tab and Aurora Energy, 7 August 2020 (received 26 August 2020), Response to RFI No. Q036 and RFI No. Q040, p. 5.
It is too soon to say whether RY20 is the start of a trend or another RY17. Coupled with a reasonable expectation that Aurora’s network maintenance will be higher than its peers by the amount shown in the benchmarking, we believe the RY20 network maintenance opex indicates the RY19 network maintenance opex is more likely to be efficient than inefficient.
87Aurora Energy, 7 August 2020 (received 26 August 2020), Response to RFI No. Q036 and RFI No. Q040, p. 5. 88 Ibid, p. 6.

Aurora CPP – review of forecast expenditure
83
5.3. Advice on efficiency adjustments over the 3-year CPP period and 5-year review period
Opinion We consider that, on balance, RY19 opex for preventive, corrective and reactive maintenance is more likely to be efficient than inefficient, and therefore provides an appropriate base cost for forecasting expenditure over the CPP and review periods.
Recommendation We recommend the RY19 opex for preventive, corrective and reactive maintenance remain unchanged from that proposed by Aurora in its CPP proposal.
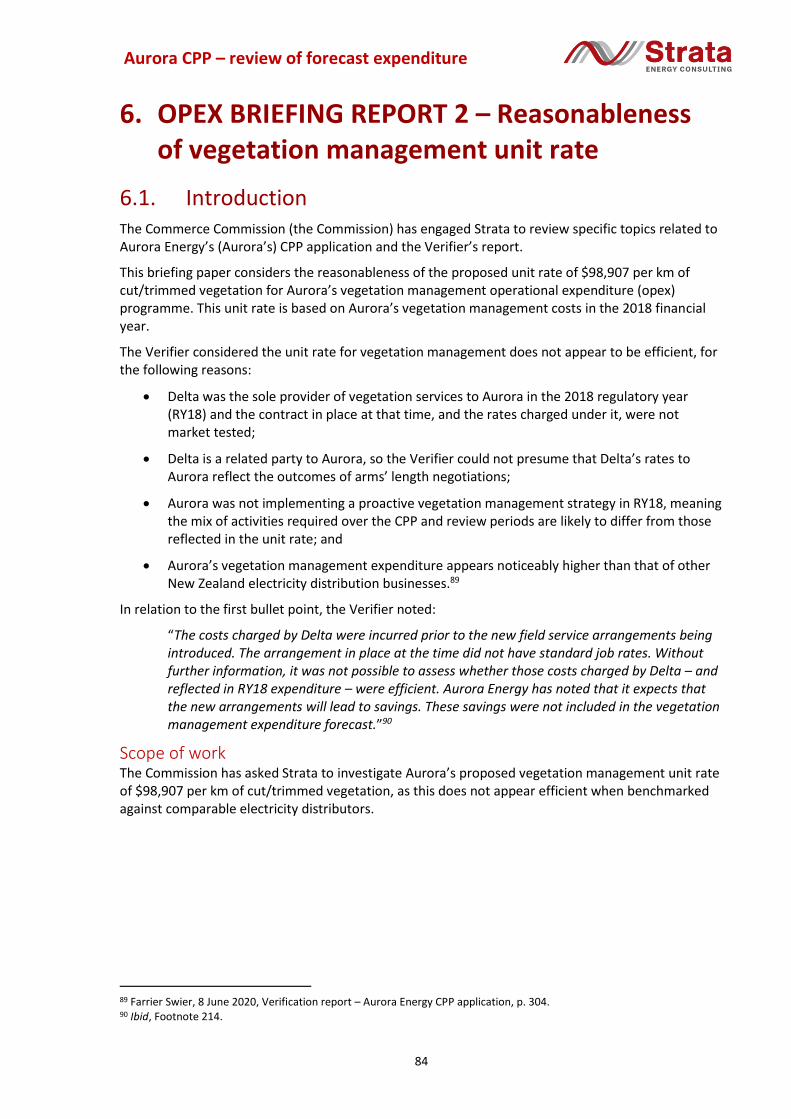
Aurora CPP – review of forecast expenditure
84
6. OPEX BRIEFING REPORT 2 – Reasonableness of vegetation management unit rate
6.1. Introduction The Commerce Commission (the Commission) has engaged Strata to review specific topics related to Aurora Energy’s (Aurora’s) CPP application and the Verifier’s report.
This briefing paper considers the reasonableness of the proposed unit rate of $98,907 per km of cut/trimmed vegetation for Aurora’s vegetation management operational expenditure (opex) programme. This unit rate is based on Aurora’s vegetation management costs in the 2018 financial year.
The Verifier considered the unit rate for vegetation management does not appear to be efficient, for the following reasons:
• Delta was the sole provider of vegetation services to Aurora in the 2018 regulatory year (RY18) and the contract in place at that time, and the rates charged under it, were not market tested;
• Delta is a related party to Aurora, so the Verifier could not presume that Delta’s rates to Aurora reflect the outcomes of arms’ length negotiations;
• Aurora was not implementing a proactive vegetation management strategy in RY18, meaning the mix of activities required over the CPP and review periods are likely to differ from those reflected in the unit rate; and
• Aurora’s vegetation management expenditure appears noticeably higher than that of other New Zealand electricity distribution businesses.89
In relation to the first bullet point, the Verifier noted:
“The costs charged by Delta were incurred prior to the new field service arrangements being introduced. The arrangement in place at the time did not have standard job rates. Without further information, it was not possible to assess whether those costs charged by Delta – and reflected in RY18 expenditure – were efficient. Aurora Energy has noted that it expects that the new arrangements will lead to savings. These savings were not included in the vegetation management expenditure forecast.”90
Scope of work The Commission has asked Strata to investigate Aurora’s proposed vegetation management unit rate of $98,907 per km of cut/trimmed vegetation, as this does not appear efficient when benchmarked against comparable electricity distributors.
89 Farrier Swier, 8 June 2020, Verification report – Aurora Energy CPP application, p. 304. 90 Ibid, Footnote 214.

Aurora CPP – review of forecast expenditure
85
6.2. Is Aurora’s estimation approach likely to deliver an efficient unit rate?
Aurora’s approach to estimating the unit rate of $98,907 per km Aurora’s vegetation management expenditure forecasts for the CPP and review periods are based on a volumetric approach. Aurora estimates the length of exposed vegetation across its network feeders and then applies a unit rate (cost per kilometre of exposed vegetation).91
To estimate the vegetation management unit rate, Aurora looked at its vegetation management costs for 2017 and 2018. These are shown in Table 1.92 Aurora selected the 2018 cost figure.
Table 1: Aurora 2017 and 2018 vegetation management costs93
Aurora notes the $98,907 per km includes all costs incurred through first cut vegetation activities including liaison, administration, traffic management, etc. It also includes a small amount of routine trimming work that Aurora could not separate from the total cost.94 Therefore, we call the $98,907 a unit rate per km of cut/trimmed vegetation for the purposes of our analysis.
Aurora considers its vegetation management costs are efficient.95 Aurora says:
Based on staff experience while working for other NZ distributors, our internal review concludes that the Vegetation labour and plant rates included in the 2020 FSA are consistent with those seen in other like sized electricity distribution businesses.96
Aurora also points to KPMG’s review of Aurora’s vegetation management costs as part of KPMG’s audit of Aurora’s third-party transactions for 2019. KPMG reached the following conclusion in relation to the cost of Aurora’s vegetation management:
We compared Aurora with the most comparable networks being those in the South, or only the lower South Island. Both these comparisons show that Aurora’s ratio of expenditure is below the average, therefore we can conclude that vegetation management services were at a value no greater than arms length.97
Given that Aurora points to KPMG’s benchmarking as evidence that Aurora’s vegetation management costs are efficient, it is interesting that Aurora decided against benchmarking its vegetation management costs with other New Zealand electricity distributors. Aurora believed it would be “impossible without further investigation and enquiry to draw any conclusions about the
91 Aurora Energy, 12 June 2020, Customised price-quality path application, p. 172. 92 Aurora Energy, 6 March 2020, Vegetation management portfolio overview document, p. 9. Aurora Energy, 19 May 2020, Vegetation management memo, p. 2. 93 Although, we have been unable to see an explicit reference in Aurora’s Vegetation management portfolio overview document (p. 9), we deduce that these costs are RY20 constant dollars, because Aurora has used $98,907 as its RY20 dollars unit rate. 94 Aurora Energy, 6 March 2020, Vegetation management portfolio overview document, p. 10. 95 Aurora Energy, 19 May 2020, Vegetation management memo, p. 1. 96 Ibid 97 Ibid
Financial year
Exposed vegetation
(km)
Exposed vegetation
trimmed
(km)Liaison cost
($)Liaison cost
($/km)Trim cost
($)Trim cost
($/km)Liaison & Trim cost
($/km)
2017 47 41.14 591,809 12,584 3,592,641 87,331 99,915
2018 57.1 45.44 536,510 9,393 4,067,897 89,515 98,907

Aurora CPP – review of forecast expenditure
86
relative efficiency of distribution vegetation management across New Zealand.”98 Aurora reached this view based on:
• Data uncertainty;
• Variations in vegetation density across locations—in particular, urban and rural;
• The different vegetation management strategies across distributors—in particular, the severity of the cut and who pays; and
• The variance in vegetation status across New Zealand’s distribution networks (first cut or routine cyclical cuts)—in particular, Aurora believes many distributors have completed their network-wide ‘first cut’ and that it is therefore not appropriate to compare Aurora’s first cut costs with the routine cyclical cut costs of these distributors.99
We consider Aurora’s approach is unlikely to estimate an efficient unit rate We consider Aurora’s approach is unlikely to estimate an efficient unit rate for vegetation management, for the same reasons identified by the Verifier and set out in this paper’s introduction.
Aurora has not tested the market Aurora has not sought to tender any of its vegetation management work to someone other than Delta. Aurora gives a couple of reasons for this:
• Scaling up contractor resources “would potentially be a short term, high cost bubble.”100
• Currently, Delta is the contractor on Aurora’s networks that is best placed to perform vegetation management.101
Aurora notes that, in the future, it may prove beneficial to engage further vegetation management contractors across Aurora’s networks if doing so might improve performance and reduce overall expenditure.102
By not testing the market for vegetation management services, Aurora does not know how efficient Delta is in delivering these services on Aurora’s networks. A recent independent review of Aurora’s vegetation management practices appears to indicate Delta’s productivity can be improved.103 Aurora notes that Delta’s productivity is improving, but Aurora cannot, in the absence of tendering work to other utility arborists, know Delta’s relative productivity in the provision of vegetation management.
Aurora notes the per-km cost of vegetation management in RY19 and RY20 was 32% and 15% higher (respectively) than the FY18 cost. Aurora has concluded that upward cost pressures exist as vegetation management transitions from mainly rural cutting to urban cutting, which includes additional liaison, greater traffic management, etc. There is also an additional volume to be cut per km in the move to a 5-year cutting cycle.104
Aurora appears to believe this indicates that the proposed unit rate is efficient. It does not. In the absence of comparing Delta’s vegetation management charges and productivity with those of competitors, Aurora cannot have a high degree of confidence about the efficiency of the proposed unit rate. For example, the increase in the per-km vegetation management cost in RY19 and RY20 over RY18 could indicate the proposed unit cost is too low for first cut activities, for the reasons set out in the preceding paragraph.
98 Ibid 99 Ibid, pp. 1-2. 100 Aurora Energy file titled ‘P05 – Vegetation Management v0.8’, p. 10. 101 Aurora Energy, Information Disclosure, For the year ended 31 March 2019, p. 67. 102 Aurora Energy, AE-AS18-S Vegetation Management Strategy version 1.0, p. 9. 103 Ibid, pp. 9-10. 104 Ibid, p. 2.

Aurora CPP – review of forecast expenditure
87
This brings us to our second point.
Aurora’s proposed unit rate cannot accurately reflect first cut and cyclical cut activities The vegetation management work undertaken in 2018 was a combination of first cut and cyclical cut activities, spread across rural and urban circuits. This means that, at a minimum, Aurora’s proposed unit rate is unlikely to accurately reflect vegetation management costs when Aurora is undertaking only cyclical cut activities from RY24 onwards.
Despite this, Aurora has made the conscious decision to retain the $98,907 per km unit rate over the period RY24 to RY26, when Aurora will be undertaking cyclical cut activities.105 Aurora holds the view that the historically-based unit rate is a reasonable estimate of achievable unit rates over the entire RY22 to RY26 period. Aurora comments as follows:
“The wider vegetation management context is important. If we assume a rate that is too low (unachievable) and we lower the forecast, we will be non-compliant for a longer period. If we choose a rate that is too high, we will not be exerting enough pressure on the contractor to deliver efficiently. It is our view that the proposed rate is slightly on the low side and we will need to work hard to achieve our first cut and routine cycle objectives in the 3-year CPP period. Our contractor knows that we will be closely monitoring performance and that we are considering introducing a new contractor so the efficiency pressure will apply.”106
This view appears to be based on Delta’s vegetation management charges and productivity being efficient. Again, in the absence of competitive tendering we fail to see how this view is supported. We believe there should be a step down in the unit rate when Aurora completes its first cut vegetation management programme. The size of this step down would be usefully informed by competitive tendering.107
Aurora has not benchmarked the unit rate Aurora did not benchmark the unit rate, for the reasons set out earlier. We agree there are limitations with benchmarking, making it a second-best alternative to Aurora competitively tendering the provision of vegetation management services on its networks.
However, in the absence of this tendering, we believe benchmarking can provide some useful information indicating whether Aurora’s proposed vegetation management unit rate falls within a range that might be considered efficient.
We are unclear how KPMG arrived at its benchmarking results KPMG concluded Aurora’s 2019 vegetation management cost per km was lower than both the South Island average and the New Zealand average, as shown in Table 7.
Table 7: Results of KPMG analysis of Aurora’s vegetation management cost per km (RY19 dollars)108
Distributor Comparative cost per km
Aurora - Vegetation management expense per km $1,309 NZ average - Vegetation management expense per km $1,394 South Island average - Vegetation management expense per km $1,843
We are unclear how KPMG arrived at its figures. Our benchmarking analysis reaches a different conclusion to KPMG’s. We set out our analysis in the next section.
105 Aurora Energy, 6 March 2020, Vegetation management portfolio overview document, p. 11. 106 Aurora Energy file titled ‘P05 – Vegetation Management v0.8’, p. 13. 107 Competitive tendering may also enable a more accurate picture of the difference in cost between rural and urban vegetation management activities. 108 Aurora Energy, 19 May 2020, Vegetation management memo, p. 4.

Aurora CPP – review of forecast expenditure
88
6.3. What does benchmarking reveal about the unit rate’s efficiency?
It is not possible to directly benchmark Aurora’s proposed unit rate against other distributors’ unit rates using the annual information disclosures, as distributors are not required to report the length of vegetation cut each year. Therefore, we have compared Aurora against a cohort of distributors in respect of the following metrics:
• The cost of vegetation management per km of overhead circuit;
• The percentage of overhead lines with trimmed vegetation using Aurora's proposed unit rate; and
• The number of trees cut.
Our cohort of comparable distributors Table 2 shows the cohort of distributors we have used in our benchmarking. We have chosen distributors that have to manage vegetation on networks similarly sized to Aurora in respect of one or more of the following:
• Length of overhead lines;
• Length of urban overhead lines; and
• Length of rural overhead lines.
This is to reduce the range of factors that might cause absolute differences between Aurora’s vegetation management costs and those of the distributors in our benchmarking.
Table 2: Distributors used in benchmarking of Aurora’s vegetation management unit rate
The results of our benchmarking Table 3 compares, using dollars per km of overhead lines, the vegetation management costs of our cohort over the period RY13 to RY29. Actual costs apply for RY13 to RY19, while forecast costs apply for RY20 to RY29.
As can be seen, Aurora is significantly above the average across the past 7 years and is forecast to remain so for the coming decade.
Total circuit length (km)
Overhead (km)
Urban Overhead
Lines (km)
Rural Overhead
Lines (km)
Remote Overhead
Lines (km)
Rugged Overhead
Lines (km)Underground (km)
Aurora Energy 6,575 4,407 1,637 2,692 - 79 2,168
Alpine Energy 4,317 3,522 309 3,117 - 96 795
Counties Power 3,251 2,326 95 2,146 - 85 926
MainPower NZ 5,021 4,031 51 2,411 1,440 128 991
Network Tasman 3,614 2,673 183 2,294 70 118 941
Orion NZ 11,452 5,438 1,703 3,170 144 184 6,015
OtagoNet 4,606 4,429 327 879 587 1,824 176
The Lines Company 4,385 4,065 489 2,974 300 83 320
Unison Networks 9,290 5,572 1,394 1,269 249 2,661 3,718
Wellington Electricity 4,746 1,726 1,335 392 - - 3,019
Key: Simi lar to Aurora Energy
Dis imi lar to Aurora Energy

Aurora CPP – review of forecast expenditure
89
Table 3: Vegetation management costs ($/km of overhead lines in constant RY20 dollars, for years ending 31 March)
Table 4 compares the percentage of overhead lines that our cohort of distributors would be able to trim vegetation along if they each had the same unit cost Aurora is proposing over the CPP and review periods. For simplicity, we have applied the RY19 line length for each distributor across all the years. We consider this simplifying assumption to have little effect on the comparison across the cohort, because we expect the materiality of differing growth rates in overhead lines across the distributors to be relatively small.
Wellington Electricity is the only distributor that would be able to trim a similar percentage of overhead lines as Aurora. We do not know the distance of overhead lines that each distributor wants to trim over the next 5 to 6 years. However, we believe several of the distributors with relatively low percentages in Table 4 would in fact be budgeting to achieve higher percentages with their vegetation management opex. For example, in their 2019 and/or 2020 asset management plans, distributors such as Alpine Energy, Counties Power and The Lines Company have highlighted the need for increased levels of trimming on their respective networks. We imply from this that these distributors would be wanting to trim a percentage of their overhead lines that is similar to Aurora’s percentage. To achieve this, these distributors would need to have materially lower unit rates than Aurora’s proposed rate.
2013 2014 2015 2016 2017 2018 2019 2020 2021 2022 2023 2024 2025 2026 2027 2028 2029
Aurora Energy 350 637 990 1,431 987 1,296 1,306 1,203 1,232 1,184 881 878 870 861 821 852 850
Alpine Energy 30 34 52 207 216 126 162 232 236 236 236 236 236 236 236 236 236
Counties Power 376 408 475 453 423 422 439 580 645 657 670 684 697 711 724 739 753
MainPower NZ 180 185 236 208 226 111 127 177 229 248 248 248 248 248 248 248 248
Network Tasman 445 411 340 347 362 366 410 430 452 458 464 470 476 483 489 495 502
Orion NZ - 464 555 581 623 575 712 726 736 794 736 736 736 736 736 736 736
OtagoNet 177 192 280 292 285 293 363 269 252 252 252 252 252 252 252 252 252
The Lines Company 175 196 218 230 232 198 272 300 349 300 300 300 301 301 301 301 302
Unison Networks - 192 220 205 241 307 345 322 400 400 400 400 400 400 400 400 400
Wellington Electricity - 723 683 880 811 1,118 911 918 1,043 1,043 1,043 1,043 1,043 1,043 1,043 1,043 1,043
Average 247 344 405 483 441 481 505 516 557 557 523 525 526 527 525 530 532
Av. excl. Aurora 154 312 340 378 380 391 416 439 482 488 483 486 488 490 492 495 497
Av. excl. Aurora & WE 230 260 297 315 326 300 354 380 412 418 413 416 418 421 423 426 429
Aurora cf. av. excl. Aurora 228% 204% 291% 378% 260% 332% 314% 274% 255% 243% 182% 181% 178% 176% 167% 172% 171%
Key: Actual costs
Forecast costs

Aurora CPP – review of forecast expenditure
90
Table 4: Percentage of overhead lines with trimmed vegetation using Aurora's proposed unit rate
Lastly, Table 5 provides an indication of the possible difference in per-tree unit cost across Aurora, The Lines Company and Unison. Caution needs to be exercised when considering this table. The figures for Aurora across 2019 and 2020 are actual costs.109 The figure for The Lines Company is an estimated cost based on The Lines Company’s stated intention to cut or trim approximately 14,500 trees each year on a budget of $1.4 million (constant RY20 dollars).110 The 2015 and 2019 figures for Unison are estimated costs, based on Unison’s stated intention in August 2014 to trim 18,000 trees annually.111 For the 2019 Unison estimate, we have assumed Unison still wants to be trimming 18,000 trees annually and then applied Unison’s actual vegetation management cost for 2019.
On the basis that vegetation management in rural areas is lower cost than urban areas, we would expect The Lines Company’s unit rate to be lower than Aurora’s and Unison’s. However, we would have expected Unison’s and Aurora’s to be relatively similar. Aurora has approximately 250 km more urban lines that Unison, but Unison has significantly more overhead lines classified as ‘rugged’.
Table 5: Per tree vegetation management unit cost (constant RY20 dollars)
Our benchmarking indicates Aurora’s unit rate is high Although we have been unable to directly benchmark Aurora’s proposed unit rate for vegetation management, we consider it is valid to conclude that Aurora’s proposed unit rate is high, based on the benchmarking we have been able to do.
Measured on a ‘$/km of overhead lines’ basis, there are four other New Zealand distributors with a vegetation management cost similar to that proposed by Aurora—these are shown in Table 6. Of these, Nelson Electricity, Wellington Electricity and Vector have a high proportion of their overhead lines located in urban areas. As Aurora has noted, this is likely to increase costs associated with tree owner liaison and traffic management. However, we have insufficient information to determine whether the urban nature of these networks is sufficient to justify the uplift in vegetation management costs relative to the overwhelming majority of New Zealand’s distributors.
109 Aurora Energy, 19 May 2020, Vegetation management memo, p. 2. 110 The Lines Company, Asset Management Plan 2020, p. 132. 111 Claudette Whitehouse, 21 August 2014, Presentation to the ENA/EEA Vegetation Management Forum titled ‘EEA Urban/Rural Panel’.
2013 2014 2015 2016 2017 2018 2019 2020 2021
Aurora Energy - - - - - - 1,778 1,464 -
The Lines Company - - - - - - - - 98
Unison Networks - - 70 - - - 107 - -
Note: Unison's 2019 unit cost assumes Unison wants to trim the same number of trees as in 2015.

Aurora CPP – review of forecast expenditure
91
Table 6: Distributors with comparable vegetation management costs when measured by $/km of overhead lines (constant RY20 dollars)
We acknowledge the benchmarking is imperfect. It does not, for example, specifically account for matters such as different vegetation densities across distributors, different climatic conditions, distributors’ different vegetation management plans, and consumers’ differing propensities to declare ‘no interest’ in trees on distributors’ networks. Having said this, we believe the mix of distributors in our cohort means our benchmarking should not be too adversely affected by a failure to specifically account for these matters.
In relation to vegetation densities, our cohort includes distributors with overhead lines running through:
• Areas with significant bush or forest (eg, Counties Power, Network Tasman, The Lines Company, Unison);
• Areas with significant shelter belts protecting orchards and/or lifestyle blocks (eg, Unison, Orion, Network Tasman); and
• Areas with significant urban development (eg, Orion, Unison, Wellington Electricity).
Our cohort includes the distributors either side of Aurora’s networks (Alpine Energy and OtagoNet), thereby enabling our benchmarking to indirectly factor in climatic conditions.
The most recent asset management plans of the distributors used in our benchmarking indicate perhaps half of the distributors are, like Aurora, currently in a period of heighted vegetation management activities. Others, such as MainPower, Network Tasman and OtagoNet appear to be operating on a basis that indicates their vegetation management is relatively ‘steady state’. This mix offers some consistency with the mix of first cut and cyclical cut activities Aurora was undertaking over the period from which Aurora has drawn its unit rate.
Variances in the number of people declaring ‘no interest’ in vegetation across different distributors’ networks would be expected to mean there is no 1:1 relationship between unit rate and vegetation management opex. Having said this, we would be surprised if the percentage of people on Aurora’s networks declaring ‘no interest’ in aggregate differed materially from the percentage of people doing so across the other distributors’ networks. We see no particular reason why the probability of people in Dunedin and Central Otago combined declaring no interest in trees growing on their properties should be significantly higher than across all the other regions supplied by the cohort of distributors.
2013 2014 2015 2016 2017 2018 2019 2020 2021 2022 2023 2024 2025 2026 2027 2028 2029
Aurora Energy 350 637 990 1,431 987 1,296 1,306 1,203 1,232 1,184 881 878 870 861 821 852 850
Electra 653 808 685 893 1,057 1,112 1,234 1,009 1,055 1,055 1,055 1,055 1,055 976 976 976 976
Nelson Electricity 840 1,276 1,949 1,212 1,294 895 1,125 1,500 1,321 1,321 1,321 1,321 1,321 1,321 1,321 1,321 1,321
Vector Lines - 497 467 505 655 866 926 1,260 1,225 1,079 1,036 1,048 1,061 928 890 901 912
Wellington Electricity - 723 683 880 811 1,118 911 918 1,043 1,043 1,043 1,043 1,043 1,043 1,043 1,043 1,043
Average 614 788 955 984 961 1,058 1,101 1,178 1,175 1,136 1,067 1,069 1,070 1,026 1,010 1,019 1,021
Aurora cf. average 57% 81% 104% 145% 103% 123% 119% 102% 105% 104% 83% 82% 81% 84% 81% 84% 83%
Key: Actual costs
Forecast costs

Aurora CPP – review of forecast expenditure
92
Other information we have reviewed indicates Aurora’s unit rate is high Aurora’s vegetation management opex is currently based on the following resourcing requirement:
• 8 vegetation crews—4 in Dunedin and 4 in Central Otago;
• 6 liaison officers—3 in Dunedin and 3 in Central Otago; and
• An allowance for administration.112
To get an indication of the relative cost of this resourcing requirement, we compared it with MainPower’s vegetation management resourcing requirement. MainPower has two fulltime arborist crews carrying out most of MainPower’s vegetation maintenance and providing supervision to third-party contractors working in the vicinity of MainPower’s lines. Supporting the two arborist crews are a Vegetation Inspector and a Vegetation Control Supervisor, who work as required with tree owners and local authorities to support the maintenance programme.113
MainPower’s estimated vegetation management cost for RY20 is $713,000. However, MainPower forecasts this cost to rise significantly in RY21, to $921,000, and then rise further to $1 million in RY22.114 We take from this that MainPower is planning to increase its resourcing for the coming year. Based on the size of the forecast increase in vegetation management opex, MainPower may be considering employing another arborist crew.115
We assume for the purposes of this comparative analysis that $713,000 is the RY20 cost for MainPower to employ the two fulltime arborist crews and the Vegetation Inspector and Vegetation Control Supervisor. It is likely to include some other costs, such as administration costs. However, to be conservative, we assume the $713,000 is solely the cost of the above-mentioned staff. This resourcing represents approximately one quarter of Aurora’s resourcing, assuming Aurora’s and MainPower’s arborist crews are similar in size. So, multiplying MainPower’s vegetation management cost by four should give us a ballpark estimate of the human resourcing cost Delta is facing, excluding administration and other overheads associated with being a contracting business. Conservatively, we estimate these additional costs to be in the range of approximately 10–15% of Delta’s human resourcing cost for vegetation management services. This gives an estimated cost to Delta of $3.1–$3.25 million, before adding a margin. Allowing for Delta to have larger arborist crews of between approximately 0.5 roles and 1 role per crew116 would lift Delta’s cost to $3.5–$4 million. Accounting for a 10–15% margin for Delta on top of this would give an estimated cost of $3.85–$4.6 million. Aurora’s actual vegetation management cost for RY20 was $5.59 million for 8 crews. This represents a 22–45% uplift in Aurora's RY20 vegetation management opex from a level that is approximately equivalent to MainPower's forecast RY20 vegetation management opex.
We note this analysis is simplistic and must be caveated—in particular, we do not know the size of the arborist crews working for Delta and MainPower. However, even after conservatively accounting for Delta’s arborist crews to be larger than MainPower’s, the conclusion one draws from the analysis is consistent with the conclusion drawn from the benchmarking analysis—Aurora’s proposed vegetation management opex appears to not be consistent with the expenditure objective.
112 Aurora Energy, AE-AS18-S Vegetation Management Strategy version 1.0, p. 8. 113 MainPower, Asset management plan 2020, p. 132. 114 Ibid, p. 163. 115 MainPower’s proposed increase in vegetation management opex is comparable to Electra’s when it added a second arborist team. Electra reported in its 2020 asset management plan (p. 180) that its vegetation management opex increased from $1.64 million in FY18 to $1.85 million in FY19 due to the addition of a second tree-trimming team. This was part of Electra moving from a reactive approach to vegetation management to a proactive, risk-based approach. 116 At an assumed annual labour cost of $80,000 per person.

Aurora CPP – review of forecast expenditure
93
We conclude Aurora’s unit rate is high Having undertaken the analysis above, we conclude Aurora’s vegetation management unit rate is inefficiently high. Set out below are the key inputs to our estimate of how much lower the unit rate should be to better meet the expenditure objective.
Input 1 Compared with distributors that are similar to Aurora in one or more of overhead line length / urban overhead line length / rural overhead line length:
• Over the period RY13 to RY19, Aurora’s vegetation management cost, on a $/km of overhead line basis (constant RY20 dollars), has ranged from double to almost 3.8 times the average cost across the other distributors
• Over the period RY20 to RY29, Aurora’s vegetation management cost, on a $/km of overhead line basis (constant RY20 dollars), is forecast to range from 1.67 times to approximately 2.75 times the average cost across the other distributors.
Based on this comparison, we conservatively estimate a multiplier of between 1.67 and 3.8 in vegetation management cost equates to a multiplier of between 1 and 2 in unit cost.
Therefore, we consider it is reasonable to infer that Aurora’s unit rate might be 1–2 times as high as the average unit rate for the cohort of comparable117 distributors. This translates to Aurora’s unit rate being 0–100% higher than the cohort of distributors.
Input 2 As noted earlier, Alpine Energy, Counties Power and The Lines Company have highlighted the need for increased levels of trimming on their respective networks, like Aurora. Based on this, we assume they wish to trim vegetation along 1–1.2% of their overhead lines—being a similar percentage to Aurora. Under Aurora’s proposed unit rate, Alpine Energy, Counties Power and The Lines Company would be able to afford perhaps 20–60% of their intended vegetation cut/trim over the period RY19 to RY21. This translates to Aurora’s unit rate being 167%–500% higher than the unit rates of these three distributors.
Furthermore, we believe that under Aurora’s proposed unit rate, half the distributors in the cohort would be unable to trim the necessary amount of vegetation during a ‘steady state’ period of vegetation management. This is on the assumption that distributors’ vegetation management is in a steady state from 2023 and the steady state percentage of overhead lines with trimmed vegetation falls within +/-50% of Aurora’s 0.9% (ie, 0.45–1.35%).
Against a lower bound of 0.45%, half the cohort of distributors would be able to achieve 55–90% of their planned vegetation trims. This translates to Aurora’s unit rate being 110–180% higher than the unit rates of half the cohort of distributors. For the other half of the cohort, we assume Aurora’s unit rate is no higher than the other distributors’ unit rates. Therefore, Aurora’s unit rate may on average be 55–90% higher than the cohort’s average unit rate during ‘steady state’ vegetation management.
Input 3 Comparing the cost of Aurora’s vegetation management human resourcing against the equivalent cost of another South Island distributor (MainPower) indicates Aurora’s vegetation management cost may be 20–45% higher than MainPower’s.118 This translates to Aurora’s unit rate being 20–45% higher than MainPower’s if we assume the productivity of the Delta and MainPower arborist crews is approximately the same. We consider MainPower’s crews should be at least as productive as Delta’s,
117 Comparable in respect of the three overhead line length metrics referred to above. 118 This assumes Delta has larger arborist crews than MainPower, resulting in Delta’s vegetation management resourcing cost being $3.5–$4 million, with Delta then applying a 10–15% margin on this amount.

Aurora CPP – review of forecast expenditure
94
based on the very limited productivity benchmarking we have been able to do (the per-tree vegetation management unit cost for Aurora, Unison Networks and The Lines Company).
We suggest a reduction of approximately 25% in Aurora’s proposed unit rate Considering the key inputs set out above, we believe a unit rate that is approximately 75% of the $98,907 proposed by Aurora would better meet the expenditure objective.
In making this assessment, we have given approximately equal weighting to each of the three inputs. This means the suggested unit rate can be applied across Aurora’s first cut and routine cyclical cut vegetation management, because the rate is a blend of expected efficiency improvements across both cuts. Having said this, the resulting rate may, in absolute terms, still be relatively high once Aurora completes its first cut, because of the lower costs associated with the routine cyclical cut.
6.4. Advice on efficiency adjustments over the 3-year CPP period and 5-year review period
Opinion We consider the proposed unit rate of $98,907 per km for Aurora’s vegetation management opex does not meet the expenditure objective.
Recommendation We recommend the unit rate for Aurora’s vegetation management opex should be approximately 75% of the $98,907 proposed by Aurora—we suggest $75,000.
In making this recommendation, we recognise Aurora is in an existing contractual relationship with Delta for vegetation management until RY22 and that the Commission may want to account for this when setting Aurora’s vegetation management opex allowance.

Aurora CPP – review of forecast expenditure
95
7. OPEX BRIEFING REPORT 3 – Use of network growth factor
7.1. Introduction The Commerce Commission (the Commission) has engaged Strata to review specific topics related to Aurora Energy’s (Aurora’s) CPP application and the Verifier’s report.
This briefing report considers the extent to which a general network growth factor should be applied to the following operational expenditure (opex) categories in Aurora’s CPP proposal:
• Corrective maintenance;
• Reactive maintenance;
• System operations and network support (SONS); and
• People costs.
The Verifier considered that applying a general network growth factor to these opex categories does not appear appropriate, for the following reasons:
• Corrective maintenance expenditure is driven by defects in predominantly older assets, not new growth-driven assets being added to the fleet;119
• Reactive maintenance expenditure is driven by faults that are affected primarily by asset age and condition, not new growth-driven assets being added to the fleet;120
• Although the size of the network may drive SONS expenditure in the future, this is unlikely to be the case over the CPP and review periods where the key driver of SONS expenditure is ramping up Aurora’s asset management capability to support delivery of significant renewal, maintenance and other programmes, which largely factors in network growth already;121 and
• Although the size of the network may drive people costs expenditure indirectly in the future, this is unlikely to be the case over the CPP and review periods where the key driver of people costs expenditure is ramping up Aurora’s business support capability to indirectly support delivery of significant renewal, maintenance and other programmes, which largely factors in network growth already.122
The Verifier recommended the Commission consider whether applying a network growth factor to these categories is appropriate.
Scope of work The Commission has asked Strata to provide an opinion on any 3-year and 5-year CPP forecast expenditure adjustments the Commission should make.
119 Farrier Swier, 8 June 2020, Verification report – Aurora Energy CPP application, p. 289. 120 Ibid, p. 298. 121 Ibid, p. 325. 122 Ibid, p. 337.

Aurora CPP – review of forecast expenditure
96
7.2. Assessment of use of network growth factor in proposed opex
In its CPP proposal Aurora uses a ‘base-step-trend’ approach to estimate proposed opex relating to:
• Corrective maintenance;
• Reactive maintenance;
• SONS; and
• People costs.
Aurora assumes that growth in opex across these four portfolios over the CPP and review periods will be proportional to growth in the scale of Aurora’s networks.
Aurora uses growth in network length and growth in the number of network connections (combined) as a proxy for growth in network scale. This is consistent with the Commission’s approach in its decision on default price-quality paths (DPPs) for non-exempt electricity distribution businesses for the period 1 April 2020 to 31 March 2025 (DPP3 decision).123
For its forecast opex relating to the four portfolios above, Aurora assumes opex will grow as follows:
• For corrective and reactive maintenance, at 1.18% per annum until the 2023 regulatory year (RY23), then at 1.03% per annum from RY24.124
• For SONS and people costs, at 1.06% per annum until RY23, then at 0.83% per annum from RY24.125
Use of network growth factor in corrective and reactive maintenance Defective network assets are the key driver of corrective maintenance. Defects are typically related to the age and/or condition of an asset. Assets installed to cater for network growth (whether new or used) should be defect-free and in good condition when installed and for a reasonable period subsequently—certainly for the duration of the CPP and review periods. Also, warranties are likely to cover any early defects at or during commissioning. Therefore, we consider no network growth factor should be applied to corrective maintenance.
We note Aurora’s view that an appropriate growth factor should be allowed for reactive maintenance, since more network assets are likely to result in more faults caused by external impacts such as vegetation, animals, third parties and storms.126 We agree with Aurora. The question is what the appropriate growth factor should be.
The Commission’s calculated growth factor for Aurora factors in reactive maintenance opex undertaken in response to defects related to the age and/or condition of an asset. Therefore, we consider the growth factor applied to reactive maintenance should be less than the Commission’s growth factor, as the age and condition defects are not related to growth.
Figures 1 and 2 show Aurora is experiencing an increase in unplanned interruptions across its networks due to deteriorating equipment. Over the past three years, defective equipment has caused 36% of Aurora’s number of unplanned outages (24% of SAIDI and 32% of SAIFI).
123 Commerce Commission, 2019-11-27, Electricity Distribution Business Price-Quality Regulation 1 April 2020 DPP Reset, Opex projections model, Final determination. See https://comcom.govt.nz/__data/assets/excel_doc/0024/191472/Opex-projections-model-EDB-DPP3-final-determination-27-November-2019.xlsx. 124 Taken from the Commission’s network opex projection calculations in its DPP3 reset opex projections model. 125 Taken from the Commission’s non-network opex projection calculations in its DPP3 reset opex projections model. 126 Aurora Energy, Excel file named ‘Draft Verification Report Responses – Maintenance’.

Aurora CPP – review of forecast expenditure
97
Figure 1: Contributors to Aurora’s outages 2009–2020
Source: Strata analysis of Aurora interruptions data for the period 2009–2020
Figure 2: Aurora unplanned outages due to equipment deterioration
Source: Strata analysis of Aurora interruptions data
Aurora’s expenditure programmes will arrest this trend and then subsequently reverse it. However, this will take time. We estimate that at the start of the CPP and review periods (i.e. RY22), 35% of unplanned outages will be caused by equipment deterioration, with this percentage falling to 25% by RY26. This is based on:
• The 2018-20 average contribution of defective equipment to Aurora’s unplanned interruptions; and
• Our understanding of Aurora’s expenditure programmes.
0
200
400
600
800
1,000
1,200
2009 2010 2011 2012 2013 2014 2015 2016 2017 2018 2019 2020
Number of outages - Unplanned Interruptions
LIGHTNING VEGETATION CAUSE UNKNOWN
WILDLIFE DEFECTIVE EQUIPMENT THIRD PARTY INTERFERENCE
HUMAN ERROR ADVERSE WEATHER ADVERSE ENVIRONMENT
0
50
100
150
200
250
300
350
400
20092010
20112012
20132014
20152016
20172018
20192020
Nu
mb
er o
f o
uta
ges
Unplanned interruptions due to Defective Equipment

Aurora CPP – review of forecast expenditure
98
Based on an average of 30% for this estimate over the RY22–RY26 period, we would apply to Aurora’s proposed reactive maintenance over the CPP and review periods a network growth factor that is 70% of the Commission’s growth factor.
We also note some existing network assets will face higher loadings from network growth—for example, transformer life is related to the loading experienced by the unit throughout its lifecycle. An argument could be made that this might lead to more corrective or reactive maintenance on such assets. We consider any such increase is likely to be relatively minor. Higher loading on existing assets is an asset capacity issue rather than an asset degradation issue.
Aurora points to the Commission applying a growth factor to all opex in its DPP3 decision. In response, we agree with the Verifier that the Commission’s approach was tailored to the DPP process. It does not mean the same approach should be applied to the CPP process.127
The purpose of default/customised price-quality regulation is to provide a relatively low-cost way of setting price-quality paths for suppliers of regulated goods or services, while allowing the opportunity for individual regulated suppliers to have alternative price-quality paths that better meet their particular circumstances.128 Consistent with DPP regulation being relatively low cost, the Commission’s approach to setting distributors’ allowable revenues under the DPP process is simpler than its approach under the CPP process. This includes a less detailed assessment of a distributor’s costs and cost drivers, and the averaging of costs over different business areas.
SONS and people costs A growing network will, over time, require more opex relating to system operations, network support and business support. This is simply the result of more asset management and business support activities (as noted by the Verifier129).
The overwhelming majority of opex in the SONS and people costs portfolios relates to human resourcing. This has increased significantly since 1 July 2017. In its CPP application, Aurora says it expects to have its long-term efficient staffing levels recruited for the SONS and people costs portfolios prior to the start of the CPP period.130 This indicates to us that Aurora’s targeted staff numbers at the beginning of the CPP period (158 positions) represent Aurora’s expected level of staffing for at least the duration of the CPP and review periods.
Therefore, implicit in Aurora’s long-term efficient staffing levels for the SONS and people costs portfolios will be the resourcing required to accommodate network growth over the CPP and review periods. We consider this unsurprising. Any additional resourcing to accommodate network growth over the CPP and review periods will represent a small increment to the resourcing needed to deliver Aurora’s plans around:
• Network investment;
• Asset management capability; and
• To a lesser extent, preparing for the impact of distributed energy resources on Aurora’s networks.
We consider it reasonable to expect that resources applied across these areas over the CPP and review periods would be able to absorb incremental activities associated with network growth.
Aurora anticipates COVID-19 will generally slow network growth over the next two years.131 Given the uncertainty associated with the resumption of international tourism in New Zealand, this effect
127 Farrier Swier, 8 June 2020, Verification report – Aurora Energy CPP application, p. 287 – Footnote 206. 128 See section 53K of the Commerce Act 1986. 129 Farrier Swier, 8 June 2020, Verification report – Aurora Energy CPP application, p. 322 and p. 334. 130 Aurora Energy, 12 June 2020, Customised price-quality path application, pp. 177-179 and pp. 183-184. 131 Aurora Energy, 12 June 2020, Asset Management Plan April 2020 – March 2030, p. 91.

Aurora CPP – review of forecast expenditure
99
may persist for longer, depending on domestic tourism patterns.132 This strengthens our view that the network scale effect should be removed from the SONS and people costs portfolios.
7.3. Advice on adjustments to the 3-year CPP period and 5-year review period
Opinion For three of the four portfolios above we do not share Aurora’s view that it is reasonable to assume opex in the portfolio will grow over the CPP and review periods in proportion to growth in the scale of Aurora’s networks.
Recommendation We recommend:
• The network scale effect be removed from Aurora’s proposed corrective maintenance opex, resulting in a downward adjustment to this opex of $195,491 over the 3-year CPP period and $426,703 over the 5-year review period.133
• The network scale effect be 70% of the Commission’s growth factor for Aurora’s proposed reactive maintenance opex, resulting in a downward adjustment to this opex of $156,438 over the 3-year CPP period and $343,050 over the 5-year review period.134
• The network scale effect be removed from Aurora’s proposed SONS opex, resulting in a downward adjustment to this opex of $1,085,856 over the 3-year CPP period and $2,325,741 over the 5-year review period.135
• The network scale effect be removed from Aurora’s proposed people costs opex, resulting in a downward adjustment to this opex of $653,920 over the 3-year CPP period and $1,400,599 over the 5-year review period.136
Table 1: Downward adjustments to Aurora opex from revised application of network scale effect
3-year CPP period 5-year review period
Corrective maintenance opex $195,491 $426,703
Reactive maintenance opex $156,438 $343,050
SONS opex $1,085,856 $2,325,741
People costs opex $653,920 $1,400,599
Total $2,117,662 $4,552,881
132 Aurora’s network growth has occurred in the Central Otago region of Aurora’s networks. 133 Aurora Energy file ‘MOD71 – Corrective maintenance forecast model – Post IV review’ (‘Calc’ tab). 134 Aurora Energy file ‘MOD72 – Reactive maintenance forecast model – Post IV review’ (‘Calc’ tab). 135 2020-04-21, Memo from Aurora Energy to Farrier Swier, titled Aurora Energy CPP Application – Revised SONS and PEOPLE Forecasting Models and Step Change support, Attachment 1 – Revised SONS BST forecasting model (‘Calc’ tab). 136 2020-04-21, Memo from Aurora Energy to Farrier Swier, titled Aurora Energy CPP Application – Revised SONS and PEOPLE Forecasting Models and Step Change support, Attachment 2 – Revised PEOPLE BST forecasting model (‘Calc’ tab).

Aurora CPP – review of forecast expenditure
100
8. OPEX BRIEFING REPORT 4 – Opex for defects, insurance and training
8.1. Introduction The Commerce Commission (the Commission) has engaged Strata to review specific topics related to Aurora Energy’s (Aurora’s) CPP application and the Verifier’s report.
This briefing report considers the reasonableness of some step changes in operational expenditure (opex) contained in Aurora’s CPP application. The opex step changes relate to:
• Corrective maintenance – fixing more defects identified through the proposed increase in preventive maintenance expenditure;
• System operations and network support (SONS) – insurance premiums; and
• People costs – staff training costs.
The Verifier considered that Aurora provided insufficient information to justify the step changes against the expenditure objective.
The Verifier recommended:
• The Commission further assess the efficiency of the proposed step change in corrective maintenance expenditure relating to more defects arising from more preventive maintenance;137
• The Commission consider how the COVID-19 pandemic may affect insurance premia over the CPP and review periods and how best to reflect this in the expenditure forecasts;138 and
• The Commission consider whether the proposed step changes relating to staff training costs are efficient.139
Scope of work The Commission has asked Strata to provide an opinion on any 3-year and 5-year CPP forecast expenditure adjustments the Commission should make.
137 Farrier Swier, 8 June 2020, Verification report – Aurora Energy CPP application, p. 279. 138 Ibid, p. 326. 139 Ibid, p. 338.
Aurora CPP – review of forecast expenditure
101
8.2. Assessment of reasonableness of proposed increase in defects requiring corrective maintenance
In its CPP proposal Aurora expects annual expenditure on defects requiring corrective maintenance over the period from the 2022 regulatory year (RY22) to RY26 to be 10% higher than in RY19. This increase equates to an additional $0.6 million over the CPP period and $0.9 million over the 5-year review period. The increase is expected because of a greater focus by Aurora on preventive maintenance, leading to more defects on Aurora’s network being identified.140
However, the Verifier has not been able to verify the 10% uplift. The Verifier’s report says Aurora has provided no support for the 10%—Aurora noted only that the 10% allowance corresponded to a proposed 24% uplift in preventive maintenance. The Verifier noted:
“Even if the 24% uplift in preventative maintenance were to occur, it does not necessarily follow that there would be a 10% uplift in defects needing corrective maintenance. Enhanced inspections might simply identify more assets that do not have defects.
Moreover, opportunities to prioritise defects, deferring those that are considered less of a priority, could offset the uplift in new defects. Aurora Energy advised that at present there is no formal backlog of defects maintained, and, other than for poles, defects are not graded.”141
We note Aurora undertook a top-down assessment of the increase in corrective maintenance opex generated by more preventive maintenance identifying more defects on Aurora’s networks. We also note that, prior to the Verifier’s review, Aurora’s top-down assessment appeared to be as simple as saying there would be an almost 1:1 relationship, in percentage terms, between increased preventive maintenance expenditure (24%) and increased corrective maintenance expenditure (20%).142 Therefore, we share the Verifier’s concern that Aurora has not provided any justification for the 10% uplift.
On a network with a relatively high proportion of older assets, it is logical that an increase in preventive maintenance can result in an increase in corrective maintenance. The size of this increase will depend, in particular, on:
• The strategy underpinning the additional preventive maintenance. If the focus is on assets near the end of their life cycle, the discovery of defects may result in a relatively high percentage of assets being replaced rather than maintained;
• The maintenance practices that have been applied in the past (e.g. if good electricity industry practice had been applied);
• The type of assets requiring corrective maintenance; and
• The condition/health of the assets (including the location and environment—e.g. indoor/outdoor, corrosion zone, etc.).
Because modern assets can have much lower maintenance requirements, increasing preventive maintenance on these assets would not lead to an increase in corrective maintenance.
The size of the increase will also depend on Aurora’s capability in relation to monitoring assets, recording defects, identifying the most cost-effective solutions to address them, and managing their resolution.
140 Farrier Swier, 8 June 2020, Verification report – Aurora Energy CPP application, p. 284. 141 Ibid, p. 285. 142 Aurora Energy files ‘D068 – Corrective Maintenance Step Changes’ Excel file (“All - calc” tab) and ‘MOD71 – CM Step Changes – Post IV Review’ Excel file (“All – calc” tab).

Aurora CPP – review of forecast expenditure
102
Table 1 shows Aurora’s proposed additional preventive maintenance activities under the CPP proposal. Note the dollar amounts in this table are for the 5-year review period, whereas the dollar amounts in the equivalent table (Table 34) in Aurora’s CPP application are for the 3-year CPP period.
Table 1: Preventive maintenance step-change activities proposed by Aurora143
Step Change Description
Need Start Finish CPP total (RY22-26)
Pole top / cross arm inspections
Pole tops and crossarms are currently inspected from the ground. Higher quality condition information is available when crossarms are viewed from above, so inspections via camera on a ‘hot stick’ will be introduced to 5 yearly pole testing.
RY20 RY26 $2.3m
Lidar survey Currently we do not have much visibility on vegetation and lines clearances. Two yearly lidar on the network will be undertaken to provide quality data, primarily for vegetation management.
RY21 RY30 $1.5m
Restart maintenance of pole mounted air break switches
Historically routine maintenance has not been undertaken on pole mounted switches. It is prudent to restart inspections and servicing to ensure these assets continue to operate as intended.
RY21 RY30 $1.4m
Support consumer owned pole strategy
Inspections need to be undertaken on all consumer poles installed prior to 1984 to ensure they are in a “reasonable standard of maintenance or repair” prior to handover to the consumer. These inspections support consumer pole corrective work.
RY21 RY26 $1.1m
Survey of distribution conductor condition, fittings and joints
Routine survey of distribution conductor condition, with a focus on fittings and joints condition and type issues following a recent increase in failures.
RY21 RY30 $0.8m
Low voltage enclosure inspections
Historical base level of inspections was inadequate, we have had incidents reported of electric shock to dogs, and a serious incident with a worker suffering a burnt hand when attempting to open an LV enclosure.
RY20 RY30 $0.5m
Helicopter inspections of subtransmission lines
Due to the high criticality of subtransmission lines a five yearly helicopter inspection programme will be undertaken to obtain high quality condition information.
RY21 RY30 $0.5m
143 Refer to Aurora’s preventive maintenance portfolio overview document, dated 27 February 2020, pp. 8-9.

Aurora CPP – review of forecast expenditure
103
Distribution surge arrestor inspections
As neutral earthing resistors have been installed on the network, many surge arrestors on the network have become under rated (voltage) and an increase in failures is being experienced. Many surge arrestors are unventilated porcelain which are an explosion hazard in public areas. These inspections are to ensure that no flash overs have occurred, unventilated types are identified, and that the surge arrestor installed is of adequate rating.
RY20 RY30 $0.2m
Other step changes - Improvement in indoor switchgear servicing following faults.
- Sulphur hexafluoride (SF6) management improvements.
- Poles that have been unable to be tested due to access or traffic management issues – extra work is required to have them tested.
- Increased maintenance on electromechanical relays.
- Routine inspections for pole-mounted distribution transformers.
RY20 RY30 $0.4m
Remove ‘Lidar survey’ and ‘Support consumer owned pole strategy’ defects-related uplift We consider there should be no ‘defects’-related uplift in corrective maintenance opex resulting from the ‘Lidar survey’ and ‘Support consumer owned pole strategy’ preventive maintenance activities.
According to Table 1, the primary purpose of the lidar surveys is to provide quality data to prioritise vegetation management work packages. Therefore, any ‘defects’-related uplift in corrective maintenance resulting from lidar surveys would double up on proposed vegetation management opex ($14.1m for the CPP period and $21.2m for the review period).
Aurora’s proposed uplift in corrective maintenance opex relating to the consumer owned pole strategy ($3.3m for the CPP period and $5.6m for the review period) is based on some key assumptions. These include an estimated population of 4,000 consumer-owned poles installed prior to 1984 and a need to remediate 30% of these over a six-year period.
According to Table 1, Aurora plans to inspect all consumer poles installed prior to 1984. This preventive maintenance will determine the amount of work, and therefore the cost, associated with this corrective maintenance activity. Therefore, this preventive maintenance expense should be linked directly to the consumer-owned poles corrective opex.
Remove some of the defects-related uplift linked to crossarms and distribution conductors In its CPP proposal, Aurora states that its focus during the CPP period will include the following areas:
• Reducing to zero by RY24 the backlog of poles requiring renewal, with all poles identified as being in poor condition replaced within regulated timeframes;

Aurora CPP – review of forecast expenditure
104
• Commencing a standalone crossarm replacement programme. Aurora has assessed and replaced a significant number of crossarms on wooden poles as part of the pole renewal programme. However, many crossarms, on both concrete and wood poles, are yet to be inspected. Aurora expects a large number to be in a condition that warrants replacement, as many have exceeded their expected life;
• Initiating the replacement of the Waipori subtransmission overhead lines. These lines carry the oldest conductors in Aurora’s networks. They are made from copper, which becomes brittle with age, meaning they now present an unacceptable safety and reliability risk; and
• Continuing with Aurora’s distribution conductor renewal programme, with a focus on addressing low clearance spans, and commencing an LV conductor renewal programme. Aurora’s distribution and LV conductor fleets have aged copper and No 8 wire types, which are in poor condition and are performing poorly.144
These areas of focus translate into significant programmes of renewals capex (repex) in relation to crossarms, subtransmission lines and distribution conductors.
Given these repex programmes, we query how much corrective maintenance opex Aurora will incur in relation to crossarms and distribution conductors during the CPP period.
We note Aurora’s view that the proposed step changes in preventive maintenance will find new defects in conductors because:
• Routine, detailed and systematic inspections of distribution conductors have not occurred in the past; and
• Anecdotal evidence and rising failure statistics point to a large number of conductor and joint/fitting defects being found through the new inspections programme.145
Aurora expects most of the defects will be resolved by corrective maintenance. But as Aurora notes, these defects will drive capex work as well as opex work.146
There is a repex / opex / reliability trade-off here that should be informed by an asset fleet strategy with a supporting cost-benefit analysis. In the apparent absence of this, we are concerned about the double-counting of costs across repex / opex / reliability.
We are aware that repex may be substituted for opex for reasons of practicality and efficiency. Crossarms and conductors requiring maintenance are probably going to be geographically close to crossarms and conductors requiring replacement, because of similar environmental conditions and, typically, similar type. Therefore, it may be more efficient for Aurora to expend more on repex and less on corrective maintenance.
Our assessment is that ‘defects’-related corrective maintenance opex pertaining to crossarms and distribution conductors may be anywhere between 25% to 50% lower than Aurora has forecast, because the renewals programme will be targeted at the older, poorer condition and worst performing assets.
We do not believe this same assessment applies to corrective maintenance resulting from greater monitoring of subtransmission lines. This is because Aurora’s repex programme relating to subtransmission lines appears to be focussed on the Waipori subtransmission lines, rather than being targeted at subtransmission assets across Aurora’s networks. Therefore, we believe it is unlikely that Aurora will substitute repex for ‘defects’-related corrective maintenance opex on subtransmission lines other than the Waipori lines.
144 Aurora Energy, 12 June 2020, Customised Price-Quality Path Application, pp. 79-82. 145 Aurora Energy, file named ‘Draft verification report responses – maintenance’. 146 Ibid
Aurora CPP – review of forecast expenditure
105
This then leaves the potential for increased corrective maintenance expenditure from increased inspections of:
• Pole-mounted air break switches;
• Low voltage enclosures;
• Distribution surge arrestors;
• Indoor switchgear;
• Management of SF6;
• Electromechanical relays; and
• Pole-mounted distribution transformers.
In our experience, these asset categories are more likely to incur corrective maintenance expenditure as defects are discovered through routine inspections and testing, rather than being replaced via repex programmes (perhaps apart from indoor switchgear).
A reduced corrective maintenance step change will better meet the expenditure objective We consider a ‘defects’-related corrective maintenance step change that is approximately 50-67% of that proposed by Aurora would better meet the expenditure objective. Our estimate is based on:
• The considerations discussed above; and
• The relative maintenance costs of the network assets listed in Table 1—the cost of corrective maintenance is on average higher for the network assets that we believe Aurora has—
o incorrectly included in this corrective maintenance step change (consumer owned poles and vegetation management); and
o included too many of (cross arms and distribution conductors).
Lastly, we note that an increase in corrective maintenance should be associated with a fall in reactive maintenance. Typically, this will be a lagged effect over several years or more. In relation to Aurora’s CPP proposal, we observe that Aurora has not proposed a reduction in reactive maintenance opex linked to the ‘defects’-related step change in corrective management opex. We expect this is most likely because Aurora considers that reductions in reactive maintenance from increased corrective maintenance will fall outside the 5-year review period, as anything less than 5 years does not constitute “the longer term”.147 Given our suggested reduction to the ‘defects’-related step change for corrective maintenance opex, we consider any fall in reactive maintenance opex linked to this step change will be relatively minor.
Advice on adjustments to the 3-year CPP period and 5-year review period Opinion We consider Aurora’s proposed step change in corrective maintenance opex generated by additional defects identified by increased preventive maintenance does not meet the expenditure objective.
Recommendation We recommend the step change in corrective maintenance opex generated by additional defects identified by increased preventive maintenance be 60% of Aurora’s proposed step change over the CPP and review periods. However, we recommend the final percentage be determined based on the Commission’s final decisions on Aurora’s repex and quality standards. This is because of the inherent trade-off between Aurora’s opex, repex and quality standards.
147 Aurora Energy, 27 February 2020, Reactive maintenance portfolio overview document, p. 5.

Aurora CPP – review of forecast expenditure
106
8.3. Reasonableness of proposed increase in insurance premia
Aurora’s CPP proposal contains a step change in insurance costs—from $412,000 (excluding fire service and EQC levies) in RY20 to $500,000 in RY22 and then $635,000 per annum from RY25 onwards.148
In preparing its insurance cost estimate for the CPP application, Aurora requested from its insurance broker a 3-5 year forecast of movements in insurance premia. The broker, Crombie Lockwood, advised Aurora as follows:
Insurance type Premium movement
Material damage and Business interruption 5-10% (real) increase per annum
Contract works 5-15% (real) increase per annum
Liability 10-20% (real) increase per annum
Motor vehicle 5-15% (real) increase per annum
Aurora applied, respectively, per annum (real) premium increases of 10%, 10%, 15% and 10%. Aurora also applied an annual (real) increase in travel insurance premiums of 10%.
We are not experts in insurance. Therefore, we are not able to comment on the estimated increases in premia made by Crombie Lockwood, how the COVID-19 pandemic may affect these insurance premia over the CPP and review periods, and if so how best to reflect this effect in Aurora’s expenditure forecasts.
However, we can comment on how Aurora has applied Crombie Lockwood’s advice in Aurora’s CPP proposal. Specifically, we note that Aurora has taken the mid-point of Crombie Lockwood’s ranges for three of the four types of insurance contained in Crombie Lockwood’s advice. However, for material damage and business interruption, Aurora has taken the upper end of Crombie Lockwood’s range. This insurance comprises 60% of the cost of Aurora’s insurance premia.
We have not seen a justification for Aurora choosing the upper limit instead of the mid-point for this type of insurance. In its advice to Aurora, Crombie Lockwood said:
“We have seen the Material Damage and Business Interruption market begin to plateau. It is our expectation that premiums may still rise between 5-10% on a year-on-year like-for-like basis. However, the market fluctuations will also be determined by any major natural disasters or weather related events over the coming years.”149 (Our emphasis added.)
Given this advice—specifically, the plateauing of the Material damage and Business interruption market—we consider an annual increase of 5% would be more likely to meet the expenditure objective than an annual increase of 10%.
Lastly, we suggest the Commission may wish to seek further advice on rate hardening in the insurance market. The premium increases predicted by Crombie Lockwood over the next three years may be material in the context of electricity distributors’ default price paths.
148 Refer to 2020-04-21, Memo from Aurora Energy to Farrier Swier, titled Aurora Energy CPP Application – Revised SONS and PEOPLE Forecasting Models and Step Change support, Attachment 9 – Insurance Forecast spreadsheet (“BS vs SONS” tab). 149 Crombie Lockwood advice to Aurora, dated 17 January 2020, p. 2.
Aurora CPP – review of forecast expenditure
107
Advice on adjustments to the 3-year CPP period and 5-year review period Opinion We consider Aurora’s proposed step change in SONS opex because of higher insurance premiums does not meet the expenditure objective.
The advice Aurora received from its insurance broker in January 2020 said the market for Material Damage and Business interruption insurance is plateauing. Therefore, in our opinion Aurora should use an expected annual increase in insurance premiums of 2.5–5.0% to meet the expenditure objective. Our suggestion to the Commission is to use the insurance broker’s lower point of 5%.
Recommendation We recommend Aurora’s proposed step change in SONS opex due to higher insurance premiums be reduced by $121,317 over the 3-year CPP period and $247,026 over the 5-year review period.
8.4. Assessment of reasonableness of proposed increase in staff training expenditure
In its CPP proposal Aurora makes the following statement:
“Staff training and safety costs are forecasted at circa $285k for RY20. Consistent with the company’s core values of Safety First and Learning & Development, we are planning to make further significant investments in staff training and safety as we continue to educate and build internal capabilities over the next 3-5 years.”150
Aurora proposes to increase its average annual spend on staff training and safety by $1,500 per staff member (from $1,235 in RY19 to $2,735 in RY22).151 Assuming Aurora’s average staffing over the CPP and review periods is 158, per Aurora’s CPP application,152 then this proposed increase equates to an additional $711,000 over the CPP period / additional $1,185,000 over the review period.
We agree with the importance of investing in staff training and safety. However, we consider increasing the average allowance per staff member to almost $3,000 per annum would not meet the expenditure objective. Key reasons for our view are as follows:
• Aurora has faced staff turnover since 1 July 2017, losing a number of experienced team members. Experience cannot be trained. It must be employed. Aurora has sought to do this.
• Based on our experience, we expect the majority of training in Aurora to be on-the-job training. We note our experience is consistent with Aurora’s formal learning and development policy.153 While there is a cost associated with on-the-job training, in terms of reduced productivity, this is a separate cost to that included in the proposed step change.
150 2020-04-21, Memo from Aurora Energy to Farrier Swier, titled Aurora Energy CPP Application – Revised SONS and PEOPLE Forecasting Models and Step Change support, Appendix 1 - Major SONS and PEOPLE Step Changes and Guide to Supporting Information, p. 9. 151 2020-04-21, Memo from Aurora Energy to Farrier Swier, titled Aurora Energy CPP Application – Revised SONS and PEOPLE Forecasting Models and Step Change support, Appendix 5 (‘App 5 PEOPLE ScreenShots’). Aurora plans to spend:
- An additional $750, on average, per staff member in RY20; and - An additional $1,000, on average, per staff member in RY21.
152 We note the organisational structure in Appendix P of Aurora’s CPP application has 158 staff, whereas Aurora uses a targeted headcount from RY22 to RY24 of 156 for the purposes of forecasting its training and safety costs. Refer to 2020-04-21, Memo from Aurora Energy to Farrier Swier, titled Aurora Energy CPP Application – Revised SONS and PEOPLE Forecasting Models and Step Change support, Appendix 1 - Major SONS and PEOPLE Step Changes and Guide to Supporting Information, p. 8. 153 AE-SH09-S Learning & Development Standard, Standard Version 1.0, p. 6.

Aurora CPP – review of forecast expenditure
108
• Aurora proposes to invest in new systems and processes throughout its business—from asset management to consumer connections to payroll. Undoubtedly training will be needed in these areas. However, we expect the cost of this to be in the cost of these investments.
• Aurora should be able to achieve economies of scale through onsite training of groups of staff (e.g. project management, network coordination, users of Microsoft Office applications).
• Surveys of private, public and not-for-profit organisations undertaken by Strategic Pay154 over the past three years showed the organisations’ annual average training spend was $1,212 per employee.155
Advice on adjustments to the 3-year CPP period and 5-year review period Opinion We consider Aurora’s proposed step change in People costs opex because of higher staff training and safety costs does not meet the expenditure objective.
Recommendation We recommend the allowance for Aurora’s staff training and safety costs be $2,000 per staff member per annum.
This would result in the opex for Aurora’s staff training and safety being $948,000 for the 3-year CPP period and $1,580,000 for the 5-year review period, assuming an average of 158 staff.
154 Strategic Pay is the company Aurora has used to benchmark base salary and total remuneration levels of Aurora staff. Refer to 2020-04-21, Memo from Aurora Energy to Farrier Swier, titled Aurora Energy CPP Application – Revised SONS and PEOPLE Forecasting Models and Step Change support, Appendix 1 - Major SONS and PEOPLE Step Changes and Guide to Supporting Information, pp. 3-4. 155 Strategic Pay, 2017, 2018, 2019, New Zealand HR Metrics Report, Key HR measurements and metrics.

Aurora CPP – review of forecast expenditure
109
9. OPEX BRIEFING REPORT 5 – Opex efficiency improvements
9.1. Introduction The Commerce Commission (the Commission) has engaged Strata to review specific topics related to Aurora Energy’s (Aurora’s) CPP application and the Verifier’s report.
This briefing report considers the reasonableness of Aurora’s proposed reductions in operating expenditure (opex) to recognise efficiency benefits arising from:
• Aurora’s decision to introduce more contestability into its network contractor arrangements; and
• Aurora’s proposed expenditure on information and communications technology (ICT).
In its CPP proposal Aurora has adjusted down its proposed opex relating to network maintenance, system operations and network support (SONS) and people costs, to incorporate expected improvements in Aurora’s operational efficiency during the CPP and review periods.
Aurora says the efficiency adjustments reflect the following:
• Contractor arrangements: reflecting increased competitive tension and efficiencies that could be realised by the uplift in work associated with the CPP proposal;
• Works coordination: possible improvements as Aurora moves from addressing spot risks to fleet-wide risks;
• Improved decision-making: driven by asset management improvements including expanded network analytics using better data, investment optimisation and condition-based risk management; and
• Improving capability: improvements as Aurora’s systems and processes mature, aligned with Aurora’s move to ISO 55001 certification. IT investments (e.g. an enterprise asset management system (EAMS)) will enhance renewals through improved information and simplify the as-building process, leading to some SONS efficiencies.156
Aurora has applied these efficiency adjustments using a top-down process, rather than applying them via the trend factor in the relevant opex portfolios. The adjustments sum to $0.93 million over the CPP period and $2.96 million over the review period.
The Verifier considered these adjustments to be modest in aggregate. Based on its experience, the Verifier considered the benefits from Aurora’s new contracting arrangements and improved systems and processes can be significant and realised relatively soon after they are in place.157
The Verifier recommended the Commission work with Aurora to better understand what efficiency improvements could be expected over the CPP and review periods from the proposed expenditure.
Scope of work The Commission has asked Strata to review Aurora’s efficiency improvements given the proposed uplift in Aurora’s expenditure, based on the Powerco and Orion CPPs and Australian experience.
156 Aurora Energy, 1 May 2020, Notes regarding the Forecast Tracker and Forecast Efficiency Calculator. 157 Farrier Swier, 8 June 2020, Verification report – Aurora Energy CPP application, p. 82.
Aurora CPP – review of forecast expenditure
110
9.2. Aurora’s contracting and ICT arrangements
Aurora’s contracting arrangements Aurora has entered into field services agreements (FSAs) with three contractors (Unison Contracting in the Dunedin region, Connetics in the Central Otago region, and Delta in both regions). These FSAs took effect on 1 April 2019 and continue until March 2022. Aurora has also entered into ‘relationship contracts’ with an additional three contractors to participate in open tenders for larger projects.158
Aurora’s ICT arrangements Aurora’s ICT portfolio covers capital and operating costs of supporting and enhancing infrastructure, information services and applications supporting Aurora’s business. The ICT portfolio excludes opex relating to real-time systems (the SONS portfolio) and staff (the People costs portfolio). Work on the following ICT priorities will largely be completed by the start of the CPP period:
• Improving the way Aurora manages and uses information across the company; and
• Establishing an EAMS capability.
During the CPP period, Aurora proposes expenditure on, in particular:
• Updating those elements of Aurora’s ICT infrastructure and applications that have aged beyond vendor support windows and pose an unmanaged risk to continuity of service; and
• Transitioning to standardised and cloud-provisioned ICT services that enable the removal of local customisations, so managing the cost and complexity of maintaining ICT service components.
A key focus of the ICT portfolio in the CPP period is delivering the information and process automation required for Aurora to:
• Implement its asset management strategy (including ISO 55001 certification by 2023); and
• Be prepared for the transformational impact of distributed energy resources on its networks.159
9.3. Efficiency benefits arising from Aurora’s ICT arrangements
Aurora has quantified the estimated benefits of its non-recurrent ICT expenditure Table 1 sets out Aurora’s estimate of the quantitative benefits over the CPP and review periods from non-recurrent ICT expenditure that delivers new capability for Aurora. Non-recurrent ICT expenditure includes upgrades or replacements of systems on a longer cycle than five years, or the acquisition of new or expanded ICT functionality or capability.160
Non-recurrent IT expenditure represents 36% of Aurora’s total proposed ICT expenditure over the period of the investments.161 The Verifier notes that, although low, this percentage is not unreasonable, given:
158 Farrier Swier, 8 June 2020, Verification report – Aurora Energy CPP application, p. 71. 159 Aurora Energy, 29 April 2020, Information & Communications Technology portfolio overview document, p. 2. 160 Farrier Swier, 8 June 2020, Verification report – Aurora Energy CPP application, p. 257. 161 This percentage comprises 51% of the forecast ICT capex and 25% of the forecast ICT opex over the period of the investments.

Aurora CPP – review of forecast expenditure
111
• Aurora plans to increasingly adopt ‘software-as-a-service’ solutions, which are ICT opex; and
• Aurora plans to incur some non-recurrent ICT expenditure to address obsolete and unsupported applications that need replacing for Aurora to function in line with good electricity industry practice (GEIP).162
Aurora has identified two broad categories of benefit from its non-recurrent ICT expenditure—'asset management’ and ‘customer’. These are shown in Table 1 below.
‘Asset management’ benefits are generated as a proportion of:
• Planned maintenance (preventive maintenance and vegetation management);
• Renewals deferral; and
• Avoided costs enabled by a small productivity improvement in the asset management team (in the broader business sense).
Quantified ‘customer’ benefits relate to the avoided cost of one fulltime equivalent (FTE) in the customer team.163
Table 1: Savings generated over CPP and review periods by non-recurrent ICT expenditure164
Using a discount rate of 6%, the present value of the benefits in Table 1 is $5.6m (RY20 dollars), with $3.8m of this coming from the deferral of renewals.
In this briefing report we are looking only at the efficiency benefits that Aurora has included in its opex portfolios, which means we exclude from our analysis the $3.8m of network deferral benefits. Consequently, Aurora’s CPP proposal should contain at least $1.8m of efficiency benefits across Aurora’s opex portfolios if Aurora’s CPP proposal is to reflect the benefits resulting from non-recurrent ICT expenditure set out in Table 1.
Aurora has not quantified the estimated benefits of its recurrent ICT expenditure We would expect efficiency benefits from recurrent ICT expenditure—which relates to maintaining existing ICT services, functionalities, capability and/or market benefits, and is incurred at least once every five years.165
162 Farrier Swier, 8 June 2020, Verification report – Aurora Energy CPP application, p. 260. 163 Aurora Energy, 2 May 2020, ICT business benefits model—refer to the ‘Inputs’ tab. 164 Aurora Energy, 2 May 2020, ICT business benefits model—refer to the ‘Model’ tab. 165 Farrier Swier, 8 June 2020, Verification report – Aurora Energy CPP application, p. 257.
Asset Management Related Systems
2021 2022 2023 2024 2025 2026Preventive Maintenance Savings -$ -$ -$ 32,954$ 87,567$ 159,632$
Vegetation Management Savings -$ 13,571$ 26,082$ 29,125$ 38,708$ 47,911$
Renewals Deferral -$ -$ -$ -$ 2,000,000$ 3,000,000$
Asset Management System Resources -$ -$ 300,000$ 300,000$ 300,000$ 300,000$
Total Benefits -$ 13,571$ 326,082$ 362,079$ 2,426,274$ 3,507,544$
Customer Systems
2021 2022 2023 2024 2025 2026Consumer related benefits -$ 100,000$ 100,000$ 100,000$ 100,000$ 100,000$
Total Benefits -$ 100,000$ 100,000$ 100,000$ 100,000$ 100,000$

Aurora CPP – review of forecast expenditure
112
However, we have not seen evidence of Aurora quantifying these efficiency benefits in the information we have reviewed (e.g. in Aurora’s Information & Communications Technology portfolio overview document).
Aurora’s CPP proposal contains most of the estimated benefits of Aurora’s non-recurrent ICT expenditure Using a top-down assessment, Aurora has included in its CPP proposal $1,584,590 of efficiency benefits (RY20 dollars)166 from non-recurrent ICT investment reducing opex across four portfolios over RY22 to RY26.
This amount is approximately $200,000 less than the estimated benefit in the above cost-benefit analysis for non-recurrent ICT expenditure that delivers new capability for Aurora during the CPP and review periods. Table 2 gives the breakdown of the $1,584,590 of benefits.
Table 2: Top-down assessment of efficiency benefits from ICT investment
Estimated benefit Opex portfolio Benefit driver
$560,306167 Preventive maintenance
Improved works coordination following implementation of new outage planning systems and better asset management tools.
Aurora being able to improve its decision-making once better data becomes available and better asset management systems are in place.168
$310,794169 Vegetation management
Improved works coordination following implementation of better asset management tools.170
$474,691171 SONS Benefits from IT investments (e.g. EAMS) and from maturation of systems and processes.172
$238,798173 People costs Benefits from IT investments (e.g. EAMS) and from maturation of
systems and processes.174
$1,584,590 Total
9.4. Efficiency benefits arising from Aurora’s contracting arrangements
The new FSA delivers a step change efficiency benefit to reactive maintenance Aurora considers its new contracting arrangements have resulted in improved performance by field crews operating on Aurora’s networks.
166 Aurora Energy, 01a Forecast efficiency calculator and Forecast tracker – 12 June submission. 167 Ibid 168 Aurora Energy, 12 June 2002, Customised price-quality path application, p. 164. 169 Aurora Energy, 01a Forecast efficiency calculator and Forecast tracker – 12 June submission. 170 Aurora Energy, 12 June 2002, Customised price-quality path application, p. 173. 171 Aurora Energy, 01a Forecast efficiency calculator and Forecast tracker – 12 June submission. 172 Aurora Energy, 12 June 2002, Customised price-quality path application, p. 179. 173 Aurora Energy, 01a Forecast efficiency calculator and Forecast tracker – 12 June submission. 174 Aurora Energy, 12 June 2002, Customised price-quality path application, p. 185.
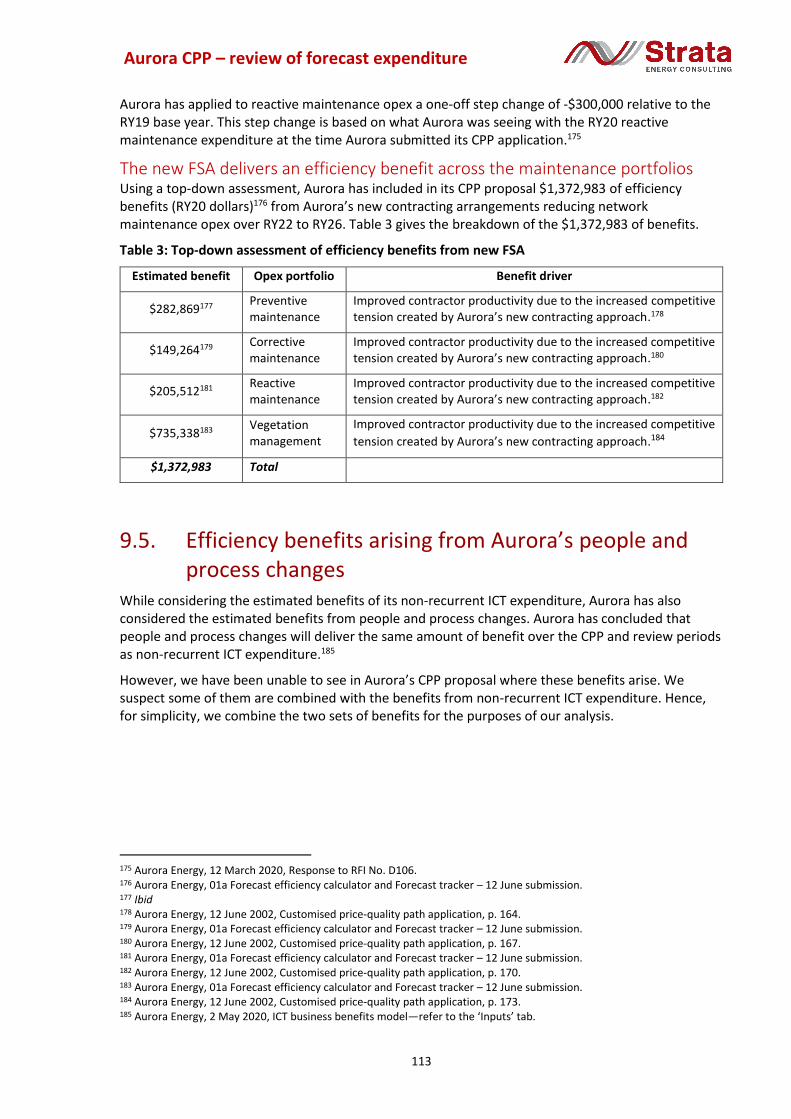
Aurora CPP – review of forecast expenditure
113
Aurora has applied to reactive maintenance opex a one-off step change of -$300,000 relative to the RY19 base year. This step change is based on what Aurora was seeing with the RY20 reactive maintenance expenditure at the time Aurora submitted its CPP application.175
The new FSA delivers an efficiency benefit across the maintenance portfolios Using a top-down assessment, Aurora has included in its CPP proposal $1,372,983 of efficiency benefits (RY20 dollars)176 from Aurora’s new contracting arrangements reducing network maintenance opex over RY22 to RY26. Table 3 gives the breakdown of the $1,372,983 of benefits.
Table 3: Top-down assessment of efficiency benefits from new FSA
Estimated benefit Opex portfolio Benefit driver
$282,869177 Preventive maintenance
Improved contractor productivity due to the increased competitive tension created by Aurora’s new contracting approach.178
$149,264179 Corrective maintenance
Improved contractor productivity due to the increased competitive tension created by Aurora’s new contracting approach.180
$205,512181 Reactive maintenance
Improved contractor productivity due to the increased competitive tension created by Aurora’s new contracting approach.182
$735,338183 Vegetation management
Improved contractor productivity due to the increased competitive
tension created by Aurora’s new contracting approach.184
$1,372,983 Total
9.5. Efficiency benefits arising from Aurora’s people and process changes
While considering the estimated benefits of its non-recurrent ICT expenditure, Aurora has also considered the estimated benefits from people and process changes. Aurora has concluded that people and process changes will deliver the same amount of benefit over the CPP and review periods as non-recurrent ICT expenditure.185
However, we have been unable to see in Aurora’s CPP proposal where these benefits arise. We suspect some of them are combined with the benefits from non-recurrent ICT expenditure. Hence, for simplicity, we combine the two sets of benefits for the purposes of our analysis.
175 Aurora Energy, 12 March 2020, Response to RFI No. D106. 176 Aurora Energy, 01a Forecast efficiency calculator and Forecast tracker – 12 June submission. 177 Ibid 178 Aurora Energy, 12 June 2002, Customised price-quality path application, p. 164. 179 Aurora Energy, 01a Forecast efficiency calculator and Forecast tracker – 12 June submission. 180 Aurora Energy, 12 June 2002, Customised price-quality path application, p. 167. 181 Aurora Energy, 01a Forecast efficiency calculator and Forecast tracker – 12 June submission. 182 Aurora Energy, 12 June 2002, Customised price-quality path application, p. 170. 183 Aurora Energy, 01a Forecast efficiency calculator and Forecast tracker – 12 June submission. 184 Aurora Energy, 12 June 2002, Customised price-quality path application, p. 173. 185 Aurora Energy, 2 May 2020, ICT business benefits model—refer to the ‘Inputs’ tab.

Aurora CPP – review of forecast expenditure
114
9.6. Aurora’s top-down efficiency adjustments appear to deliver insufficient benefits
Summary of top-down efficiency adjustments across the opex portfolios In summary, Aurora considers its new contracting arrangements and its investment in non-recurrent ICT and in people and processes will deliver approximately $3 million in efficiency benefits over the five-year review period. This appears to understate potential efficiency gains, for the reasons set out in this section.
Aurora’s approach to making efficiency adjustments across opex portfolios appears reasonable Aurora considers at least one of the four key efficiency drivers listed on page 1 of this report apply to maintenance, SONS, and people costs opex. For each efficiency driver, Aurora has formed a view on the driver’s expected strength (low, medium, high, vegetation) in relation to each opex portfolio.
Aurora has then assigned an annual (non-cumulative) expected percentage reduction in a portfolio’s opex based on Aurora’s view of the strength of the expected efficiency benefit—see Table 4.
Table 4: Detailed breakdown of Aurora’s efficiency adjustments across its opex portfolios186
These percentage adjustments are then aggregated (in an additive manner) to the portfolio level, as shown in Table 5.
Table 5: Opex efficiency percentage adjustments by portfolio187
Aurora’s top-down efficiency adjustments for new contracting arrangements appear low Aurora has applied to its reactive maintenance opex a top-down efficiency adjustment in recognition of increased competitive tension under Aurora’s new contractor arrangements, and a downward
186 Aurora Energy, 01a Forecast efficiency calculator. 187 Aurora Energy, Forecast tracker – 12 June submission.
Portfolio Type RY22 RY23 RY24 RY25 RY26 Eff strength
Preventive Maintenance Contractor 0.5% 0.5% 1.0% 1.0% 1.5% Low
Preventive Maintenance Works Co-ordination 1.0% 2.0% 3.0% High
Preventive Maintenance Decision making 1.0% 2.0% High
Corrective Maintenance Contractor 0.5% 0.5% 1.0% 1.0% 1.5% Low
Reactive Maintenance Contractor 0.5% 0.5% 1.0% 1.0% 1.5% Low
Vegetation Contractor 0.0% 3.0% 4.0% 5.0% 6.0% Vegetation
Vegetation Works Co-ordination 0.5% 1.0% 1.5% 2.0% 2.5% Medium
SONS Improved Capability 0.5% 1.0% 1.5% Medium
People Costs Improved Capability 0.5% 1.0% 1.5% Medium
$ RY20 constant RY22 RY23 RY24 RY25 RY26
OpexNetwork opex
Preventive Maintenance 0.5% 0.5% 2.0% 4.0% 6.5%
Corrective Maintenance 0.5% 0.5% 1.0% 1.0% 1.5%
Reactive Maintenance 0.5% 0.5% 1.0% 1.0% 1.5%
Vegetation 0.5% 4.0% 5.5% 7.0% 8.5%
Non-network opex
SONS 0.0% 0.0% 0.5% 1.0% 1.5%
People costs 0.0% 0.0% 0.5% 1.0% 1.5%
IT Opex 0.0% 0.0% 0.0% 0.0% 0.0%
Premises, Plant and Insurance 0.0% 0.0% 0.0% 0.0% 0.0%
Governance and Administration 0.0% 0.0% 0.0% 0.0% 0.0%
Upper Clutha DER solution

Aurora CPP – review of forecast expenditure
115
step change adjustment of $300,000 a year in recognition of improved reactive maintenance practices by Delta’s field crews.188
We consider that Aurora’s new contractor arrangements should be delivering further productivity improvement in relation to vegetation management during the CPP and review periods. The increased competitive tension on Delta should result in it reviewing its work practices and looking for productivity improvements that make it relatively more attractive to Aurora. Delta has publicly stated the importance of Aurora’s business, which represented almost 50% of Delta’s revenue base in 2019.189
To this end, we expect Aurora should be able to make a downward step change adjustment of 25% to its vegetation management opex—i.e. $5.3m. Our ‘Opex briefing report 2’ sets out the basis for this recommended reduction.
Aurora’s top-down efficiency adjustments for new ICT appear low Based on Aurora’s own cost-benefit analysis, the CPP proposal understates the benefits from Aurora’s non-recurrent ICT investment and Aurora’s investment in people and processes by approximately $2,000,000.190
We also believe that Aurora’s planned ICT and business process improvements to its asset management, works delivery and data management capabilities should be delivering some opex efficiency benefits by RY22. This is because in RY21 Aurora is planning to:
• Finish updating its asset management tools that have fallen out of vendor support;191
• Commission the core EAMS;192
• Commission new business-to-business integration technology to integrate with Aurora’s service providers;193 and
• Finish upgrading Aurora’s core SCADA and distribution management system to a current version and finish retiring local customisations to minimise the costs and risks of supporting it.194
Aurora should then be able to realise further opex efficiency benefits in RY23, as Aurora integrates its EAMS with the wider Aurora application environment195 and largely completes the establishment of its capability to “manage data, works delivery, manage risk or plan the network consistently in a way that would meet the requirements of ISO 55001”.196 We believe these productivity gains would be additional to those achieved from Aurora’s ever-improving knowledge and management of its assets.
We also believe there are likely to be productivity improvements from Aurora’s recurrent ICT investment—for example, updates to desktop applications and upgrades to the computer processing power that enable staff to work more efficiently and produce more output for the same effort. These benefits were not included in Aurora’s cost-benefit analysis, because the analysis did not look at recurrent ICT investment. We see no evidence pointing to the inclusion of these benefits in the CPP proposal.
188 Delta is currently Aurora’s preferred contractor for faults. Refer to Farrier Swier, 8 June 2020, Verification report – Aurora Energy CPP application, p. 98. 189 Delta, Annual Report 2019, p. 3. 190 Being $200,000 of ‘missing’ benefit related to non-recurrent ICT expenditure and $1.8m of ‘missing’ benefit related to people and process changes. We assume Aurora’s investment in people and processes delivers the same ratio of capex-related and opex-related benefits as Aurora’s non-recurrent ICT investment. 191 Aurora Energy, 29 April 2020, Information & Communications Technology portfolio overview document, p. 6. 192 Ibid 193 Ibid, p. 9. 194 Ibid, p. 10. 195 Ibid, p. 6. 196 Ibid, p. 15.

Aurora CPP – review of forecast expenditure
116
9.7. We have revised up Aurora’s efficiency benefits relating to ICT and People and processes
In light of our comments above, we consider that Aurora’s CPP proposal would better meet the expenditure objective if at least the level of opex percentage efficiency adjustments shown in Table 6 were adopted for the CPP and review periods.
Table 6: Opex efficiency percentage adjustments by portfolio
We have set a minimum of a 1.0% opex efficiency improvement for each of Aurora’s maintenance expenditure programmes over the CPP period. This is to account for Aurora’s planned ICT and business process improvements to its asset management, works delivery and data management capabilities beginning to deliver opex efficiency benefits by RY22.
We have also increased by 0.5% year on year the efficiency adjustment for Aurora’s corrective maintenance and reactive maintenance expenditure programmes over the period RY24–RY26. This reflects our view that Aurora’s improvements to its ICT and business processes will deliver increasing efficiency benefits over time, as they are bedded into the business.
To account for efficiency gains arising from Aurora’s recurrent ICT investment, we have increased by 0.5% the SONS and people costs opex efficiency adjustments over the CPP and review periods.
In arriving at the estimates in Table 6, we have drawn on the efficiency adjustments made under the Orion and Powerco CPPs and the efficiency adjustments made by the Australian Energy Regulator (AER) over the past couple of years. Specifically:
• The Commission incorporated 5% efficiency gains across Orion’s opex programmes in the Commission’s ’s decision on Orion’s 2013 CPP proposal. The key difference between the Orion CPP proposal and the Aurora CPP proposal is that Orion had not applied an enterprise-wide top-down assessment of its bottom-up estimated opex. Aurora has done this.197
• The Commission’s decision on Powerco’s 2017 CPP proposal incorporated 2% and 3.5% efficiency gains across Powerco’s opex in year four and year five (respectively) of the CPP period.198 We note a key difference between Powerco’s situation and Aurora’s is that Aurora will have already invested significantly in its network and organisational capability by the start of the CPP period. Therefore, we consider that Aurora should be able to start realising some opex efficiency benefits 2–3 years earlier than Powerco.
197 Commerce Commission, 29 November 2013, Setting the customised price-quality path for Orion New Zealand Limited Final reasons paper, p. 172. 198 Commerce Commission, 28 March 2018, Powerco's customised price-quality path Final decision, p. 96.
$ RY20 constant RY22 RY23 RY24 RY25 RY26
Opex70 Preventive Maintenance 1.0% 1.0% 2.0% 4.0% 6.5%
71 Corrective Maintenance 1.0% 1.0% 1.5% 2.0% 3.0%
72 Reactive Maintenance 1.0% 1.0% 1.5% 2.0% 3.0%
73 Vegetation 1.0% 1.0% 1.5% 2.0% 2.5%
Network opex
80 SONS 0.5% 0.5% 1.0% 1.5% 2.0%
81 People costs 0.5% 0.5% 1.0% 1.5% 2.0%
82 IT Opex 0.0% 0.0% 0.0% 0.0% 0.0%
83 Premises, Plant and Insurance 0.0% 0.0% 0.0% 0.0% 0.0%
84 Governance and Administration 0.0% 0.0% 0.0% 0.0% 0.0%
85 Upper Clutha DER solution
Non-network opex

Aurora CPP – review of forecast expenditure
117
• In Australia, the AER has, over the past couple of years, applied opex productivity growth factors in the range of 0.5% to 2.6% per annum in its electricity distribution determinations.199
The AER has determined that prudent electricity distributors, acting efficiently, can achieve opex productivity growth of 0.5% each year.200 This percentage is intended to capture improvements in good electricity industry practice that efficient distributors should implement as part of their business-as-usual operations. These improvements come from adopting new technologies, changed management practices and other factors contributing to improved productivity within the Australian electricity industry over time.201
Since making its determination in March 2019, the AER has treated 0.5% per annum as the minimum overall opex productivity growth target it expects from Australian electricity distributors when considering opex efficiencies in their regulatory reset proposals. Distributors can and do propose further opex reductions that come from specific strategic initiatives, such as investing in new ICT, streamlining their operations and processes, and improving how they manage their assets.202
9.8. We have revised down Aurora’s efficiency benefits for vegetation management
As noted above, we have recommended in a separate opex briefing report a 25% step change in Aurora’s vegetation management opex. This reduction accounts for the effect of contestability in the provision of Aurora’s vegetation management.
Therefore, to avoid double counting, we have removed the $735,338 efficiency benefit Aurora included in its CPP proposal to reflect improved contractor productivity created by increased competitive tension under Aurora’s new contracting approach (refer to Table 3 above).
9.9. Aurora’s trend efficiency adjustments To round out the analysis of opex efficiency benefits, we have considered Aurora’s trend efficiency adjustments to corrective maintenance opex and reactive maintenance opex.
199 This range applies across the following electricity distribution determinations:
• Ausgrid – 2019-24 (1% p.a. for the period 2020-21 to 2023-24);
• Endeavour Energy – 2019-2024 (0.5% p.a. for the 5-year period);
• Essential Energy – 2019-2024 (1.47% p.a. for the 5-year period);
• Evoenergy – 2019-2024 (0.5% p.a. for the 5-year period);
• TasNetworks – 2019-2024 (estimated by the AER to be 1.6% p.a. for the 5-year period);
• Ergon Energy – 2020-2025 (2.6% p.a. for the 5-year period);
• Energex Energy – 2020-2025 (1.7% p.a. for the 5-year period); and
• SA Power Networks – 2020-2025 (0.5% p.a. for the 5-year period). These determinations are available at https://www.aer.gov.au/networks-pipelines/determinations-access-arrangements?f%5B0%5D=field_accc_aer_segment%3A10&f%5B1%5D=field_accc_aer_sector%3A4. 200 Australian Energy Regulator, 8 March 2019, Final decision paper – Forecasting productivity growth for electricity distributors. 201 Australian Energy Regulator, April 2019, Final Decision – Ausgrid Distribution Determination 2019 to 2024, p. 34. 202 See for example, Essential Energy’s April 2018 2019-2024 regulatory proposal, p. 13, and the AER’s final determinations for Ergon Energy and Energex Energy (all available at https://www.aer.gov.au/networks-pipelines/determinations-access-arrangements/energex-determination-2020-25).
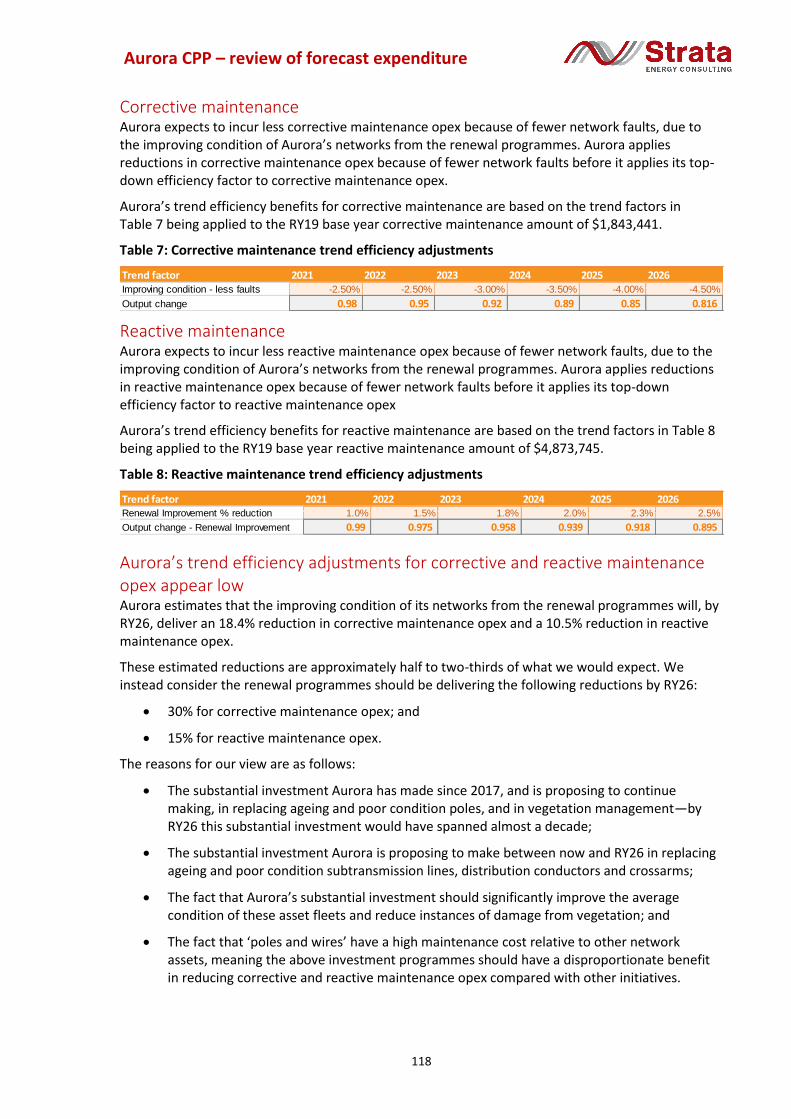
Aurora CPP – review of forecast expenditure
118
Corrective maintenance Aurora expects to incur less corrective maintenance opex because of fewer network faults, due to the improving condition of Aurora’s networks from the renewal programmes. Aurora applies reductions in corrective maintenance opex because of fewer network faults before it applies its top-down efficiency factor to corrective maintenance opex.
Aurora’s trend efficiency benefits for corrective maintenance are based on the trend factors in Table 7 being applied to the RY19 base year corrective maintenance amount of $1,843,441.
Table 7: Corrective maintenance trend efficiency adjustments
Reactive maintenance Aurora expects to incur less reactive maintenance opex because of fewer network faults, due to the improving condition of Aurora’s networks from the renewal programmes. Aurora applies reductions in reactive maintenance opex because of fewer network faults before it applies its top-down efficiency factor to reactive maintenance opex
Aurora’s trend efficiency benefits for reactive maintenance are based on the trend factors in Table 8 being applied to the RY19 base year reactive maintenance amount of $4,873,745.
Table 8: Reactive maintenance trend efficiency adjustments
Aurora’s trend efficiency adjustments for corrective and reactive maintenance opex appear low Aurora estimates that the improving condition of its networks from the renewal programmes will, by RY26, deliver an 18.4% reduction in corrective maintenance opex and a 10.5% reduction in reactive maintenance opex.
These estimated reductions are approximately half to two-thirds of what we would expect. We instead consider the renewal programmes should be delivering the following reductions by RY26:
• 30% for corrective maintenance opex; and
• 15% for reactive maintenance opex.
The reasons for our view are as follows:
• The substantial investment Aurora has made since 2017, and is proposing to continue making, in replacing ageing and poor condition poles, and in vegetation management—by RY26 this substantial investment would have spanned almost a decade;
• The substantial investment Aurora is proposing to make between now and RY26 in replacing ageing and poor condition subtransmission lines, distribution conductors and crossarms;
• The fact that Aurora’s substantial investment should significantly improve the average condition of these asset fleets and reduce instances of damage from vegetation; and
• The fact that ‘poles and wires’ have a high maintenance cost relative to other network assets, meaning the above investment programmes should have a disproportionate benefit in reducing corrective and reactive maintenance opex compared with other initiatives.
Trend factor 2021 2022 2023 2024 2025 2026Improving condition - less faults -2.50% -2.50% -3.00% -3.50% -4.00% -4.50%
Output change 0.98 0.95 0.92 0.89 0.85 0.816
Trend factor 2021 2022 2023 2024 2025 2026Renewal Improvement % reduction 1.0% 1.5% 1.8% 2.0% 2.3% 2.5%
Output change - Renewal Improvement 0.99 0.975 0.958 0.939 0.918 0.895

Aurora CPP – review of forecast expenditure
119
This last reason is also why we consider our estimated fall in reactive maintenance opex of 15% is consistent with the percentage of unplanned outages caused by equipment deterioration falling from 35% to 25% over the period RY22–RY26.203 The fall in the percentage of unplanned outages due to equipment defects over the period ending RY26 is being driven by Aurora’s substantial investment in ageing and poor condition ‘poles and wires’. Since these network assets have a high maintenance cost relative to other network assets, the 10% fall in outages due to defects should translate into a proportionally greater percentage fall in defects-related reactive maintenance opex.
Having said this, we note our view is based on the substantial network investment referred to above only reducing unplanned outages caused by defective equipment and, to a lesser extent, vegetation. Our recommended 15% reduction in reactive maintenance opex may be too low, to the extent that Aurora’s investment in network assets reduces unplanned outages caused by other factors (e.g. adverse weather, adverse environment).
9.10. Advice on efficiency adjustments over the 3-year CPP period and 5-year review period
Opinion We consider Aurora’s top-down efficiency adjustments to its proposed opex during the CPP and review periods understate expected efficiencies from Aurora’s expenditure. Therefore, we consider they do not meet the expenditure objective.
Recommendation We recommend the approximately $4.6m (RY20 dollars) in opex efficiency benefits shown in Table 9 for the CPP and review periods.
It is important to note the recommended top-down efficiency adjustments in Table 9 assume the recommended trend efficiency adjustments in Table 9 are made. This has the effect of lowering the absolute dollar amount of the top-down efficiency adjustments applied to corrective maintenance and reactive maintenance.
The top-down efficiency adjustments are a little over $260,000 more than proposed by Aurora,204 but with almost $710,000 excluded relative to Aurora’s proposal, to avoid double-counting efficiency benefits in vegetation management. The additional $970,000 in top-down efficiency adjustments (prior to removing the $710,000) stem from increased operational efficiencies in relation to ICT and people and processes. This means efficiencies relating to ICT and people and processes sum to approximately $4m once we add the $1.4m benefit from a lower level of staffing uplift over the review period due to Aurora’s non-recurrent ICT investment.205 We consider this to be consistent with Aurora’s assumed benefits from non-recurrent ICT investment and people and processes.
Adding the $1.4m benefit from a lower level of staffing uplift to the $4.6m in Table 9 gives an amount that equals approximately 2.4% of Aurora’s total proposed operating expenditure over the 5-year review period of $247.61m (RY20 dollars).
203 Please see our ‘Opex briefing report 3’. 204 After adjusting the amount Aurora proposes in its CPP application to account for corrective maintenance and reactive maintenance being reduced by the amount of the trend efficiency adjustment we recommend. 205 The approximately $4m comprises:
• $1,584,590 from Aurora’s top-down assessment of efficiency benefits from non-recurrent ICT investment;
• $1.4m from Aurora’s estimate of a lower level of staffing uplift over the five-year review period due to Aurora’s non-recurrent ICT investment; and
• $971,260 in additional efficiency benefits after Strata’s review.

Aurora CPP – review of forecast expenditure
120
Table 9: Recommended trend and top-down opex efficiency adjustments for Aurora (constant RY20 dollars)
RY22 RY23 RY24 RY25 RY26 Total by portfolio
Trend efficiency adjustments
Corrective Maintenance
53,921 103,258 147,542 186,424 219,685 710,829
Reactive Maintenance
48,250 94,450 138,311 179,576 218,022 678,609
Sub-total by regulatory year
102,171 197,708 285,852 366,000 437,707 1,389,438
Top-down efficiency adjustments
Preventive Maintenance
65,324 60,283 131,815 233,512 415,044 905,979
Corrective Maintenance
37,253 36,457 48,815 62,565 82,325 267,415
Reactive Maintenance
46,201 45,496 66,965 87,453 128,263 374,378
Vegetation 54,285 52,165 58,250 77,415 95,822 337,936
SONS 79,717 85,858 161,128 240,166 312,023 878,891
People costs 38,656 44,102 81,468 118,292 158,937 441,454
Sub-total by regulatory year
321,435 324,361 548,441 819,402 1,192,414 3,206,054
Table 10 shows the difference between the top-down efficiency adjustments proposed by Aurora and Strata, assuming the recommended trend efficiency adjustments in Table 9 are not made.
Table 10: Difference between Aurora and Strata top-down opex efficiency adjustments assuming no trend adjustments (constant RY20 dollars)
3-year CPP period 5-year review period
Aurora’s proposed
adjustment
Strata’s proposed
adjustment
Difference (Strata less
Aurora)
Aurora’s proposed
adjustment
Strata’s proposed
adjustment
Difference (Strata less
Aurora)
Top-down efficiency adjustments
Preventive Maintenance
194,619 257,423 62,804 843,175 905,979 62,804
Corrective Maintenance
71,660 126,310 54,650 149,264 281,519 132,255
Reactive Maintenance
92,588 162,163 69,575 205,512 388,012 182,499206
Vegetation 449,383 164,699 (284,684) 1,046,132 337,936 (708,196)
SONS 80,564 326,703 246,139 474,691 878,891 404,200
206 $1 rounding difference.

Aurora CPP – review of forecast expenditure
121
People costs 40,734 164,226 123,492 238,798 441,454 202,657207
Sub-total by regulatory year
929,548 1,201,524 271,976 2,957,572 3,233,791 276,219
Table 11 shows the difference between the trend and top-down efficiency adjustments proposed by Aurora and Strata, assuming the recommended trend efficiency adjustments in Table 9 are made.
Table 11: Difference between Aurora and Strata trend and top-down opex efficiency adjustments (constant RY20 dollars)
3-year CPP period 5-year review period
Aurora’s proposed
adjustment
Strata’s proposed
adjustment
Difference (Strata less
Aurora)
Aurora’s proposed
adjustment
Strata’s proposed
adjustment
Difference (Strata less
Aurora)
Trend efficiency adjustments
Corrective Maintenance
437,700 742,420 304,720 1,045,966 1,756,795 710,829
Reactive Maintenance
623,069 904,079 281,010 1,536,166 2,214,775 678,609
Sub-total by regulatory year
1,060,769 1,646,499 585,730 2,582,132 3,971,570 1,389,438
Top-down efficiency adjustments
Preventive Maintenance
194,619 257,423 62,804 843,175 905,979 62,804
Corrective Maintenance
69,398 122,525 53,127 141,843 267,415 125,571208
Reactive Maintenance
90,492 158,662 68,170 198,350 374,378 176,028
Vegetation 449,383 164,699 (284,684) 1,046,132 337,936 (708,196)
SONS 80,564 326,703 246,139 474,691 878,891 404,200
People costs 40,734 164,226 123,492 238,798 441,454 202,657209
Sub-total by regulatory year
925,190 1,194,238 269,048 2,942,989 3,206,053 263,064
207 $1 rounding difference. 208 $1 rounding difference. 209 $1 rounding difference.
Aurora CPP – review of forecast expenditure
122
10. OPEX BRIEFING REPORT 6 – SONS and People costs opex
10.1. Introduction The Commerce Commission (the Commission) has engaged Strata to review specific topics related to Aurora Energy’s (Aurora’s) CPP application and the Verifier’s report.
This briefing report considers the reasonableness of Aurora’s proposed expenditure in the following operational expenditure (opex) categories, as Aurora continues to fully set itself up as a standalone business and detach from the previous arrangement with Delta:
• System operations and network support (SONS); and
• Business support—more specifically, the opex portfolio within Business support that Aurora calls ‘People costs’.
The SONS portfolio covers the costs relating to managing and operating Aurora’s electricity network. It excludes expenditure on capital projects, network equipment, field services and corporate costs.210
The People costs portfolio covers the cost of employing business support staff and external service providers. It contains people costs for several corporate functions—accounting and finance and risk assurance, communications, human resources, information technology (IT), regulatory and commercial.211
The People costs portfolio excludes expenditure on capital projects, costs and staff directly relating to the management and operation of Aurora’s network, premises and plant costs, operational technology, and governance and administration costs that are not employment related.212
As Figures 1 and 2 show, for the period 2020–2030:
• SONS opex is forecast to increase from $4 million per annum in the years leading up to 2018 to approximately $16 million per annum from 2020; and
• People costs opex is forecast to increase from a few hundreds of thousands of dollars per annum prior to 2018 to approximately $8 million per annum from 2018.
210 Aurora Energy, 29 April 2020, SONS portfolio overview document, p. 1. 211 Aurora Energy, 29 April 2020, People costs portfolio overview document, p. 1. 212 Ibid

Aurora CPP – review of forecast expenditure
123
Figure 1: SONS opex 2015–2030213
Figure 2: People costs opex 2015–2030214
213 Farrier Swier, 8 June 2020, Verification report – Aurora Energy CPP application, p. 315. 214 Farrier Swier, 8 June 2020, Verification report – Aurora Energy CPP application, p. 330.

Aurora CPP – review of forecast expenditure
124
Figure 3 shows that over the period 2019–2030 People costs make up approximately 55% of forecast Business support opex, after comprising less than 10% prior to 2018.
Figure 3: Comparison of People costs opex and Business support opex
Aurora has used a ‘base-step-trend’ approach to estimate proposed opex relating to SONS and People costs. Aurora has selected 2019 as the efficient base year for its estimations.
The Commission wishes to review whether using a base-step-trend approach to forecast SONS and People costs opex is appropriate given that Aurora is effectively setting up a new team, where historical costs are less relevant.
The Commission also wants to consider whether Aurora’s proposed level of staffing is efficient, and to review how Aurora makes decisions about appropriate staffing levels.
Scope of work The Commission has asked Strata to do the following:
• Explain the reason for the expenditure uplift in the SONS and People costs opex categories being significant when compared with the historical opex in these categories. The Commission is interested to understand what activities Delta was not undertaking in the SONS and People costs opex categories that Aurora is now doing or proposing to do;
• Review how Aurora makes decisions about appropriate staffing levels;
• Benchmark Aurora’s historical SONS and People costs opex against its New Zealand peers;
• Review whether the use of a base-step-trend approach to forecast SONS and People costs opex is appropriate given that Aurora is effectively setting up a new team, and if so, to consider whether the base year should be updated to RY20 values; and
• Consider what level of staffing is efficient for a distribution network like Aurora’s (referencing New Zealand or Australian examples).

Aurora CPP – review of forecast expenditure
125
10.2. Why the expenditure uplift? What is Aurora doing that Delta was not?
There appear to be three main reasons for the expenditure uplift across the SONS and People costs opex categories being significant when compared with the historical opex in these categories:
• Additional resourcing—the primary reason;
• People costs opex now includes opex previously—
o allocated to other divisions within Delta;
o coded under a different portfolio in Business support—i.e. under the ‘Governance and administration’ portfolio; and
• Wage inflation—the least influential factor.
Wage inflation Aurora has supplied the Commission with the total annualised remuneration cost as of 1 July 2017 and 1 July 2020 for the staff fulfilling 71 business roles transferred to Aurora from Delta.215 The compound annual wage inflation for these roles from 1 July 2017 to 1 July 2020 was 2.54%. This compares with a compound annual growth rate of 1.9% in Statistic NZ’s labour cost indices for ‘Electricity, gas and water’ and ‘Professional and technical’, for the 10 years to 30 September 2019.216
If the wage inflation across this sample of Aurora staff is representative of the wage inflation across all Aurora staff, then as of 30 June 2019,217 Aurora’s total employee remuneration and benefits would have been $157,000 higher than if Aurora’s wage inflation had been in line with the above labour cost indices.
We have considered whether Aurora’s salary levels are high relative to Aurora’s electricity distributor peers, and concluded they are not. Aurora’s policy is to set individual salaries generally between 85% and 115% of the market median, depending on competency and performance.218 We understand that, within the past 12 months, Aurora has benchmarked the salaries of 70% of its positions against market benchmark data for equivalent-sized roles.219 This benchmarking showed Aurora’s base salary and total remuneration levels to be approximately 96% and 94% of the benchmark median salary and benchmark median total remuneration, respectively.220
Reallocation of opex Figure 4 shows the breakdown of Aurora’s Non-network opex over the period 2015–2030, by regulatory year. Only governance and administration opex has fallen since Aurora became a standalone entity from Delta—from an average of $5.5m over the period 2015–2017 to $3.5m over the period 2018–2020 (constant RY20 dollars).
This $2m reduction appears to be due to Aurora coding some governance and administration opex to other opex portfolios.
215 Aurora Energy, 18 August 2020, Response to RFI Q047, p. 4. 216 Sapere, 27 February 2020, Price escalation indices for Aurora, p. 14. 217 The most recent information we have on Aurora’s total wages cost is from Aurora’s 2019 annual report, p. 56. 218 Aurora Energy, 31/3/2020, AE-SH07-S Remuneration Standard, version 1.0, p. 5. 219 Aurora Energy, 2020-04-21, Memo from Aurora Energy to Farrier Swier, titled Aurora Energy CPP Application – Revised SONS and PEOPLE Forecasting Models and Step Change support, Appendix 1, p. 3. 220 Aurora Energy, 2020-04-21, Memo from Aurora Energy to Farrier Swier, titled Aurora Energy CPP Application – Revised SONS and PEOPLE Forecasting Models and Step Change support, Attachment 7.

Aurora CPP – review of forecast expenditure
126
Figure 4: Breakdown of Aurora’s Non-network opex 2015–2030 (constant $RY20)
Aurora’s additional resourcing Table 1 provides a breakdown of the 158221 staff roles that Aurora is proposing, showing the roles that transferred to Aurora from Delta and the roles that are additional to these transferred roles.
In summary, Aurora is proposing a 52% increase in resourcing compared to the 108 roles that used to exist in Delta.
221 In its CPP application (Appendix P), Aurora’s organisation chart has 158 roles. However, we note Aurora has used 156 roles in some calculations underpinning its CPP application (e.g. staff training and safety).

Aurora CPP – review of forecast expenditure
127
Table 1: Breakdown of Aurora staff roles
Network Performance
Network Operation
and RiskNetwork Commercial
Corporate (including Accounting & Finance,
Technology, External
Relations and HR)
Former Delta roles
materially
unchanged
Former Delta roles
materially
changed
Delta roles 'insourced'
since
1/07/2017
Aurora roles undertaking
significant
new activities Totals
49 12 7 36 104Roles transferred from Delta on 1/07/2017
17 1 1 14 33
Roles transferred from Delta that were
disestablished (8) or
materially changed (25)
32 11 6 22 71Roles transferred from Delta that remained
largely unchanged
Asset Management and Planning 19 19 9 13 41
Work Programming and Delivery 8 1 9 9 8 26
Operations and Network Performance 9 9 4 12 25
Regulatory and Commercial 4 4 1 3 8
Customer and Engagement 2 2 3 7 1 11 19
Technology and Information 5 6 11 2 6 19
Accounting, Finance and Risk Assurance 11 11 2 3 16
Corporate 1 1 1 2 4
71 25 4 58 158
Delta divisions
Au
ro
ra
d
iv
is
io
ns
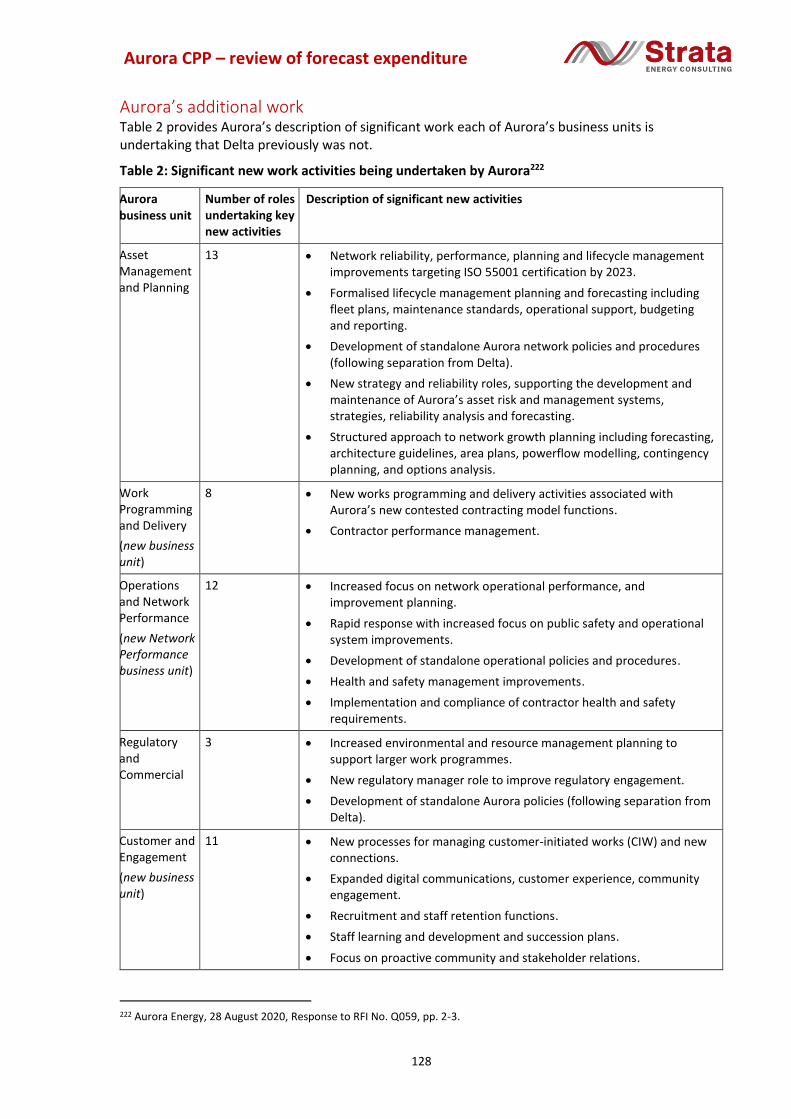
Aurora CPP – review of forecast expenditure
128
Aurora’s additional work Table 2 provides Aurora’s description of significant work each of Aurora’s business units is undertaking that Delta previously was not.
Table 2: Significant new work activities being undertaken by Aurora222
Aurora business unit
Number of roles undertaking key new activities
Description of significant new activities
Asset Management and Planning
13 • Network reliability, performance, planning and lifecycle management improvements targeting ISO 55001 certification by 2023.
• Formalised lifecycle management planning and forecasting including fleet plans, maintenance standards, operational support, budgeting and reporting.
• Development of standalone Aurora network policies and procedures (following separation from Delta).
• New strategy and reliability roles, supporting the development and maintenance of Aurora’s asset risk and management systems, strategies, reliability analysis and forecasting.
• Structured approach to network growth planning including forecasting, architecture guidelines, area plans, powerflow modelling, contingency planning, and options analysis.
Work Programming and Delivery
(new business unit)
8 • New works programming and delivery activities associated with Aurora’s new contested contracting model functions.
• Contractor performance management.
Operations and Network Performance
(new Network Performance business unit)
12 • Increased focus on network operational performance, and improvement planning.
• Rapid response with increased focus on public safety and operational system improvements.
• Development of standalone operational policies and procedures.
• Health and safety management improvements.
• Implementation and compliance of contractor health and safety requirements.
Regulatory and Commercial
3 • Increased environmental and resource management planning to support larger work programmes.
• New regulatory manager role to improve regulatory engagement.
• Development of standalone Aurora policies (following separation from Delta).
Customer and Engagement
(new business unit)
11 • New processes for managing customer-initiated works (CIW) and new connections.
• Expanded digital communications, customer experience, community engagement.
• Recruitment and staff retention functions.
• Staff learning and development and succession plans.
• Focus on proactive community and stakeholder relations.
222 Aurora Energy, 28 August 2020, Response to RFI No. Q059, pp. 2-3.

Aurora CPP – review of forecast expenditure
129
Technology and Information
6 • Strategic planning, maintenance and integration of new core enterprise systems including advanced distribution management system (ADMS), asset management system (AMS), geographic information system (GIS), and finance.
• Implementation of enhanced business intelligence and analytical tools.
• Establishment of new processes for data, communications and information management, maintenance of information and communication technology (ICT) and operational technology (OT) infrastructures, and cyber security.
Accounting and Finance and Risk Assurance
3 • New risk management framework and business assurance programmes.
• Expanded performance reporting.
• Financial system upgrades and process improvement.
Corporate 2 • Increased administrative support for larger teams and new business units.
• Support for strategic and cross functional project initiatives.
Total 58
We are not convinced all the listed activities are new activities We are not convinced all the activities described by Aurora in Table 2 are activities that Delta was not undertaking prior to 1 July 2017.
Reviews of Aurora’s historical documentation and disclosures indicate many of the tasks in Table 2 were being undertaken in the past, mostly through Delta. An example is this extract from Aurora’s 2017 asset management plan (AMP), which indicates that Delta was undertaking, and had systems to manage, several of the tasks in Table 2:
Our core systems, from an asset management perspective, are our:
1) Network management system;
a) Advanced Distribution Management System (ADMS);
b) network monitoring system, Supervisory Control and Data Acquisition (SCADA);
c) Outage Management System (OMS);
2) Geographic information system (GIS);
3) works management;
4) mobile solutions;
5) financial management information system;
6) business management system;
7) network connections management; and
8) vehicle tracking.223
Given Aurora’s previous descriptions of its management, strategies and systems, justifying an uplift of 52% in Aurora’s workforce requires a strong business case that identifies and quantifies the expected benefits. We have not seen any detailed justification to support the proposed magnitude of increase in staffing.
223 Aurora Energy, Asset Management Plan Update, April 2017 – March 2027, p. 28.

Aurora CPP – review of forecast expenditure
130
We also note that several of the tasks associated with the additional roles are transitional—for example, the preparation of standalone policies for Aurora. As a result, we would expect to see a forecast reduction in SONS and People costs opex over time. This reduction is not apparent from the opex forecasts we have seen for the CPP and review periods, or beyond for that matter. The reduction seen across the period RY23 to RY26 is the completion of Aurora’s second CPP application and Aurora’s initial work on network evolution.
10.3. How does Aurora make decisions about appropriate staffing levels?
Based on the material we have reviewed,224 it appears Aurora’s executive leadership team (ELT) champions the conceptualisation of roles. Aurora’s ELT is responsible for assessing the business cases supporting proposed roles, before making a recommendation to the Board.
The Aurora Board appears to by-and-large accept ELT recommendations on proposed new roles. The Board’s challenge process for the draft budget for the year ended 30 June 2019 resulted in a reduction of 2-3 positions—equating to an annual saving of $380,000.225 Aurora’s ELT had recommended a staffing level of 153 positions, which we expect would have been a significant increase over the number of positions at the time—noting there were around 130 staff at Aurora in April 2018.226 The Board’s financial year 2020 budget challenge process resulted in no change to the number of roles (five to six) recommended by the ELT.227
Our initial reflections on Aurora’s decision-making around staffing levels include:
• The absence of an independent expert assisting Aurora to assess an appropriate level of staffing is surprising;
• There appears to be little focus placed on looking for efficiency and productivity gains across roles;228
• Aurora has provided no evidence, either to the Verifier or to the Commission, of the business cases supporting the uplift in staffing levels;
• There appears to be limited focus on Aurora’s resourcing profile over time;
• The approach to benchmarking needs to be carefully evaluated; and
• How did Aurora’s Board gain sufficient comfort to commit Aurora to tens of millions of dollars of expenditure in staffing over the space of just a few years?
224 In particular:
• Aurora Energy, 27 February 2020, SONS Portfolio overview document, p. 13;
• Aurora Energy, 2020-04-21, Memo from Aurora Energy to Farrier Swier, titled Aurora Energy CPP Application – Revised SONS and PEOPLE Forecasting Models and Step Change support, Attachment 5 – Non-network Opex – SONS and People costs, slides 3-16; and
• Aurora Energy, 31 July 2020, Response to RFI No. Q028, pp. 2-4. 225 Aurora Energy, 2020-04-21, Memo from Aurora Energy to Farrier Swier, titled Aurora Energy CPP Application – Revised SONS and PEOPLE Forecasting Models and Step Change support, Attachment 5 – Non-network Opex – SONS and People costs, slide 11. We note this information appears to contradict the information in slide 8, which says a new general manager role was deferred in addition to the 2-3 roles identified in slide 11. 226 Aurora Energy, 2020-04-21, Memo from Aurora Energy to Farrier Swier, titled Aurora Energy CPP Application – Revised SONS and PEOPLE Forecasting Models and Step Change support, Attachment 5 – Non-network Opex – SONS and People costs, slide 8. 227 Ibid 228 Refer, for instance, to Aurora Energy, 2020-04-21, Memo from Aurora Energy to Farrier Swier, titled Aurora Energy CPP Application – Revised SONS and PEOPLE Forecasting Models and Step Change support, Attachment 5 – Non-network Opex – SONS and People costs, slide 14: “We do expect to achieve efficiency improvements in the future. However risk management and public safety are the current priorities ahead of cost reduction.”

Aurora CPP – review of forecast expenditure
131
10.4. Benchmarking Aurora’s SONS and People costs opex We have compared Aurora’s SONS and Business support opex against that of a cohort of five distributors229 with a similar customer density to Aurora and with similarly sized networks to Aurora in respect of one or more of the following:
• Length of overhead lines;
• Length of urban overhead lines;
• Length of rural overhead lines; and
• Length of underground cables.
In selecting our cohort, we have sought to reduce the range of factors that might cause differences between Aurora’s SONS and Business support opex and that of the distributors in our benchmarking.
It is impossible to compare Aurora’s People costs opex against peer distributors using information disclosed by distributors under the information disclosure requirements, because distributors are not required to break down the key opex portfolios within the Business support opex category.
We have benchmarked Aurora’s Business support opex to get an indication of how the trend in Aurora’s People costs opex may compare with the trend in other distributors’ People costs opex over time. At best, People costs may constitute a relatively stable percentage of Business support opex for other distributors, as it does for Aurora going forward.230 However, we place little weight on this analysis because we cannot see either the relative or absolute level of People costs opex in other distributors’ Business support opex.
The Verifier compares Aurora’s people costs in RY19 with 9 comparable New Zealand distributors231 on a cost per total expenditure (totex) basis and a cost per total Non-network opex basis.232 We assume the Verifier obtained from each distributor their RY19 opex that was equivalent to Aurora’s People costs opex. However, the Commission may wish to clarify this with the Verifier.
Figures 5–13 show the results of our benchmarking. Figure 5 shows that the significant increase in Aurora’s SONS opex has taken Aurora from being, on average, 93% / 94%233 of the cohort average over the period 2013–2017, to being, on average, 182% of the cohort average over the period 2018–2030. If Aurora is excluded from the calculation of the cohort average, while the 93% remains unchanged, the 182% increases to 218%. We note the cohort average includes the increase in Powerco’s opex due to its CPP over the period 1 April 2018 to 31 March 2023. Powerco’s increase is material, as shown in Table 3.
Table 3: Increase in Powerco’s opex under Powerco’s CPP
Increase / per ICP Increase / per km of total line length
SONS opex 49% 54%
Business support opex 11% 15%
Total Non-network opex 22% 26%
229 Counties Power, Orion NZ, Powerco, Unison Networks, and WEL Networks. 230 We note this appears to be the case for Orion NZ, for example. Refer to Orion NZ’s Asset Management Plan Update 2020, Table 9.2.3, p. 36. The ratio of each individual opex portfolio within Orion NZ’s Business support opex category is relatively stable over the period 2021–2030. 231 Alpine Energy, Counties Power, Electra, Electricity Invercargill, Mainpower NZ, Northpower, Orion NZ, Powerco, Unison Networks, Vector Lines, WEL Networks, and Wellington Electricity. 232 Farrier Swier, 8 June 2020, Verification report – Aurora Energy CPP application, p. 334. 233 93% based on SONS opex/ICP numbers; 94% based on SONS opex/line length.

Aurora CPP – review of forecast expenditure
132
Figure 5: Comparison of Aurora’s SONS opex with peer distributors
A similar pattern occurs in relation to Aurora’s Business support opex, as shown in Figure 6. Over the period 2013–2017, Aurora is, on average, 66% / 70%234 of the cohort average, with this increasing to 126% / 132%235 of the cohort average over the period 2018–2030. Excluding Aurora from the calculation of the cohort average changes the percentages to 62% / 66%236 and 133% / 141%237 respectively.
In contrast to SONS opex, Aurora’s Business support opex is not an outlier—although it is still at or near the top of the cohort.
234 66% based on SONS opex/ICP numbers; 70% based on SONS opex/line length. 235 126% based on SONS opex/ICP numbers; 132% based on SONS opex/line length. 236 62% based on SONS opex/ICP numbers; 66% based on SONS opex/line length. 237 133% based on SONS opex/ICP numbers; 141% based on SONS opex/line length.

Aurora CPP – review of forecast expenditure
133
Figure 6: Comparison of Aurora’s Business support opex with peer distributors
Aurora considers there is variability in how distributors interpret the SONS and Business support opex definitions in the Commission’s information disclosure requirements.238 Therefore, Aurora benchmarked its total Non-network opex against a cohort of distributors and did not undertake any benchmarking of SONS and Business support opex.
We have included a comparison of Aurora’s Non-network opex against our cohort of distributors, to look at trends in overall opex across the cohort—refer to Figure 7. As can be seen, Aurora’s very high SONS opex dominates overall opex. This is despite Business support opex comprising approximately 60% of Non-network opex, on average.
238 Aurora Energy, Response to RFI Q036 and RFI Q040, Industry benchmarking Non-network operational expenditure, p. 4.
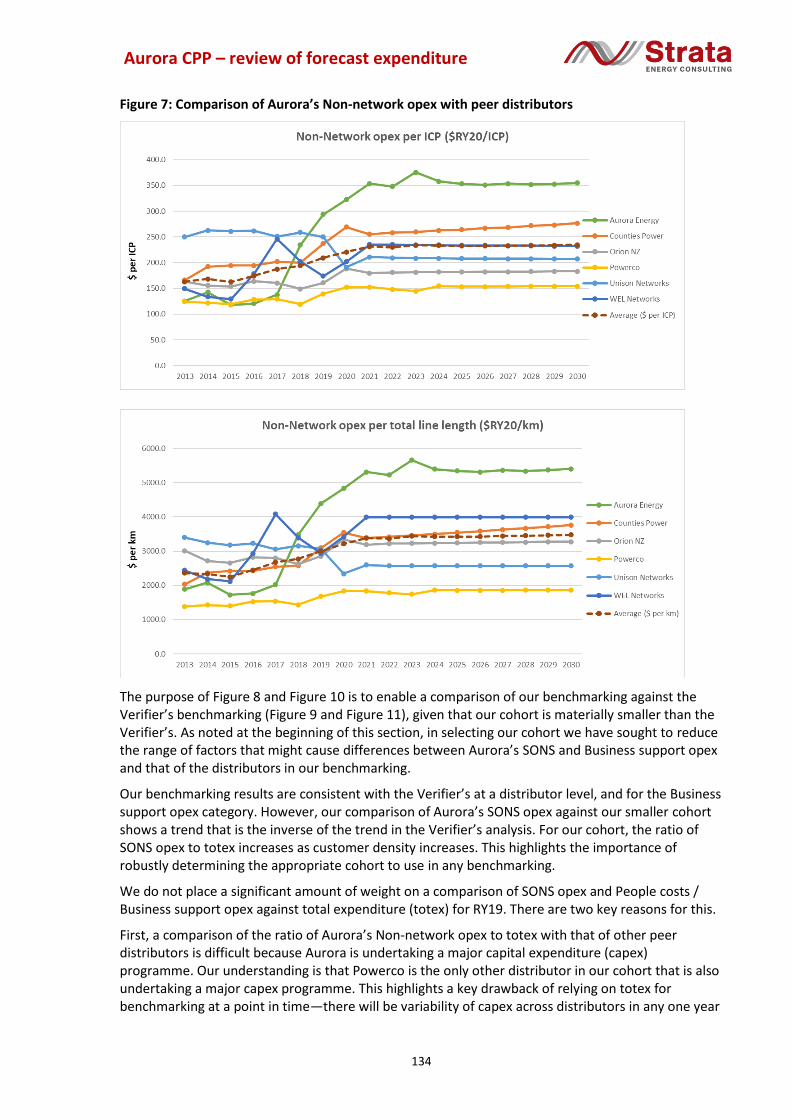
Aurora CPP – review of forecast expenditure
134
Figure 7: Comparison of Aurora’s Non-network opex with peer distributors
The purpose of Figure 8 and Figure 10 is to enable a comparison of our benchmarking against the Verifier’s benchmarking (Figure 9 and Figure 11), given that our cohort is materially smaller than the Verifier’s. As noted at the beginning of this section, in selecting our cohort we have sought to reduce the range of factors that might cause differences between Aurora’s SONS and Business support opex and that of the distributors in our benchmarking.
Our benchmarking results are consistent with the Verifier’s at a distributor level, and for the Business support opex category. However, our comparison of Aurora’s SONS opex against our smaller cohort shows a trend that is the inverse of the trend in the Verifier’s analysis. For our cohort, the ratio of SONS opex to totex increases as customer density increases. This highlights the importance of robustly determining the appropriate cohort to use in any benchmarking.
We do not place a significant amount of weight on a comparison of SONS opex and People costs / Business support opex against total expenditure (totex) for RY19. There are two key reasons for this.
First, a comparison of the ratio of Aurora’s Non-network opex to totex with that of other peer distributors is difficult because Aurora is undertaking a major capital expenditure (capex) programme. Our understanding is that Powerco is the only other distributor in our cohort that is also undertaking a major capex programme. This highlights a key drawback of relying on totex for benchmarking at a point in time—there will be variability of capex across distributors in any one year
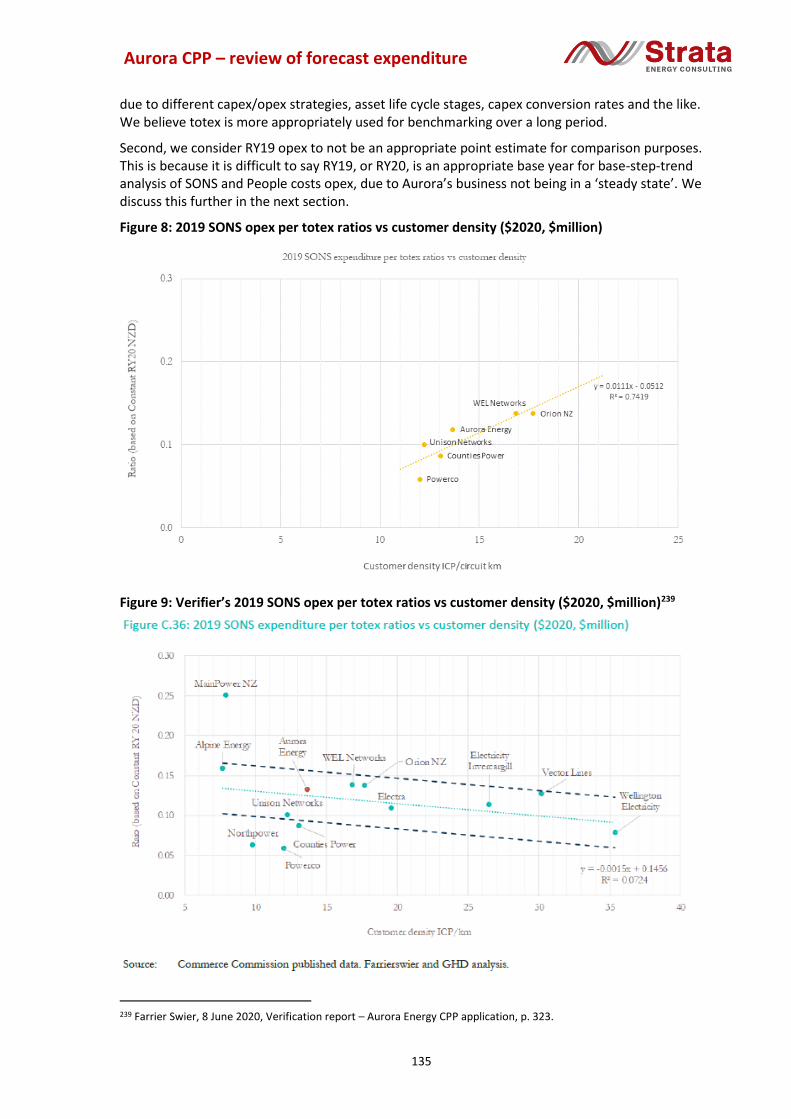
Aurora CPP – review of forecast expenditure
135
due to different capex/opex strategies, asset life cycle stages, capex conversion rates and the like. We believe totex is more appropriately used for benchmarking over a long period.
Second, we consider RY19 opex to not be an appropriate point estimate for comparison purposes. This is because it is difficult to say RY19, or RY20, is an appropriate base year for base-step-trend analysis of SONS and People costs opex, due to Aurora’s business not being in a ‘steady state’. We discuss this further in the next section.
Figure 8: 2019 SONS opex per totex ratios vs customer density ($2020, $million)
Figure 9: Verifier’s 2019 SONS opex per totex ratios vs customer density ($2020, $million)239
239 Farrier Swier, 8 June 2020, Verification report – Aurora Energy CPP application, p. 323.

Aurora CPP – review of forecast expenditure
136
Figure 10: 2019 Business support opex per totex ratios vs customer density ($2020, $million)
Figure 11: Verifier’s 2019 Business support opex per totex ratios vs customer density ($2020, $million)240
Figure 12 shows the same results as Figure 5—Aurora’s SONS opex exhibits an increasing trend that is high relative to its peer distributors. Only Orion NZ’s ratio of SONS opex to totex is comparable to Aurora’s.
240 Farrier Swier, 8 June 2020, Verification report – Aurora Energy CPP application, p. 335.
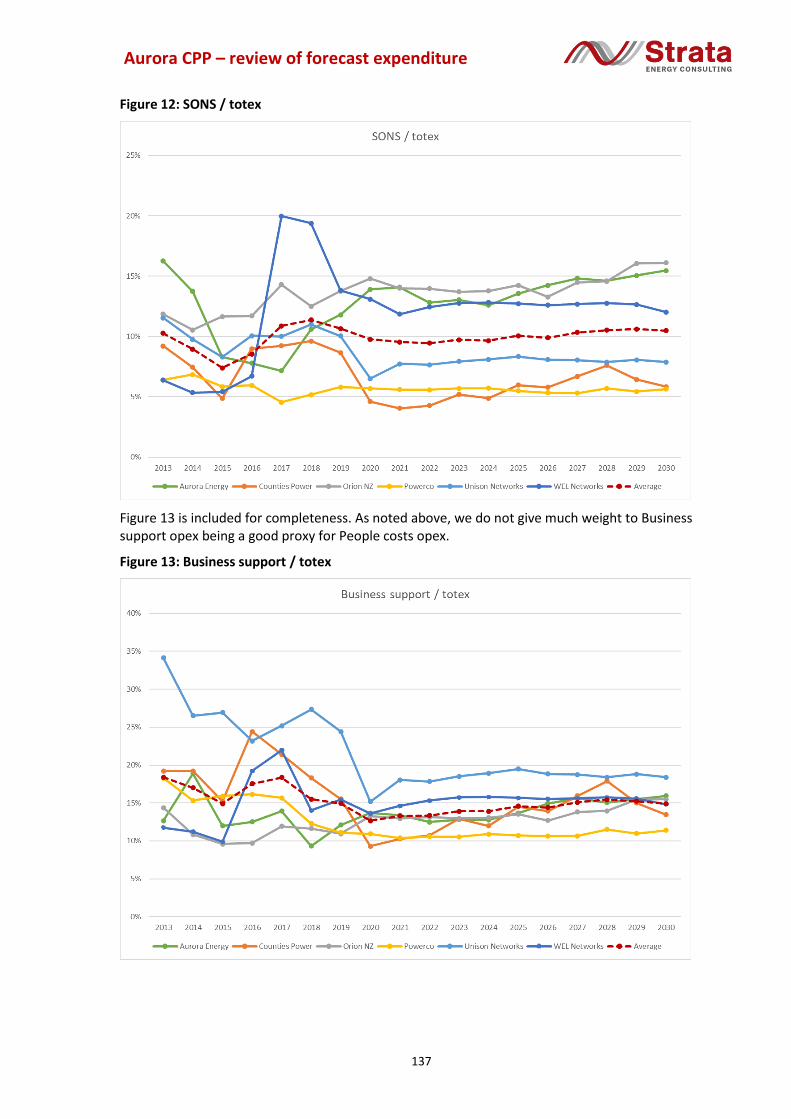
Aurora CPP – review of forecast expenditure
137
Figure 12: SONS / totex
Figure 13 is included for completeness. As noted above, we do not give much weight to Business support opex being a good proxy for People costs opex.
Figure 13: Business support / totex

Aurora CPP – review of forecast expenditure
138
Our conclusion from the benchmarking analysis The conclusion we reach from our benchmarking analysis is that Aurora’s SONS opex over the CPP and review periods is high relative Aurora’s peers. This conclusion differs from that of the Verifier and Aurora.241
Historically, Aurora’s Non-network opex was below the average of the cohort of peers we compared Aurora against. However, Aurora’s proposed uplift in Non-network opex, driven primarily by SONS and People costs opex puts Aurora significantly above the cohort average throughout the RY21–RY30 forecasting period.
The fact that Aurora is still significantly above the cohort average in RY30 reinforces our conclusion. Aurora’s 2020 AMP points to Aurora being in a ‘steady state’ by RY30, certainly regarding capex—see Figure 14. Therefore, we would expect to see Non-network opex (in real terms) lower in RY30 than over the CPP and review periods. However, this is not the case.
Figure 14: Summary of Aurora’s asset fleet investment outcomes242
We consider the approach of benchmarking only one year does not enable a meaningful assessment of the efficiency of Aurora’s SONS and People costs opex. Our benchmarking shows that RY19 happens to be the one time across an 18-year period when Aurora’s SONS and Business support costs are similar to the average across its peers. Picking a base year that is one or two years either side of RY19 would deliver quite different benchmarking results. This is not surprising given the extent of change that Aurora is undergoing at present. The business cannot be said to be in a steady state. This brings us to the appropriateness of using a base-step-trend approach to forecast SONS and People costs opex.
241 See, for example:
• Farrier Swier, 8 June 2020, Verification report – Aurora Energy CPP application, p. 323 and p. 334; and
• Aurora Energy, Response to RFI Q036 and RFI Q040, Industry benchmarking Non-network operational expenditure, pp. 7-9.
242 Aurora Energy, Asset Management Plan April 2020 – March 2030, p. vii.
* This is total zone substation expenditure which covers power transformers, indoor switchgear and outdoor switchgear fleets.

Aurora CPP – review of forecast expenditure
139
10.5. We have reservations about using a base-step-trend approach to forecast SONS and People costs opex
As noted earlier, Aurora has used the base-step-trend approach to forecast SONS and People costs opex. Aurora’s reason for this is the recurring nature of the work.243
The Verifier noted Aurora’s use of the base-step-trend method to prepare most of its opex forecasts, and said:
…this is a valid and reasonable method for forecasting opex, recognising that the underlying premise for it is that the revealed base year includes all efficient costs that a prudent operator would incur. Some of the maintenance, systems operation and network support (SONS) and people costs step changes (above Aurora Energy’s RY19 opex) proposed by Aurora Energy we characterise as base year expenditure that a prudent operator would likely incur.244
In contrast to the Verifier, we have reservations about using the base-step-trend approach to forecast SONS and People costs opex.
Since separating from Delta on 1 July 2017, Aurora has undergone significant change. While many of the activities undertaken in the SONS and People costs portfolios are recurring, a number are not. These activities are relatively short-term in nature and are associated with:
• Developing policies and procedures;
• Putting in place new or improved ways of operating and other business practices, including leveraging new or improved ICT and OT; and
• Overseeing an intensive period of capital investment in Aurora’s network.
Once these activities are complete, Aurora’s SONS and People costs opex should fall. Given that Aurora will have been a standalone entity for almost five years when the CPP period begins, we expect these reductions to be occurring during the CPP and review periods. Under Aurora’s base-step-trend approach we see no allowance for these forthcoming downward step changes in opex.
For the purposes of forecasting SONS and People costs opex, we consider Aurora to not be in a ‘steady state’ over the CPP and review periods. We believe Aurora cannot point to its last year of operation and say that the coming few years will be similar apart from a slight trend in opex, either up or down.
10.6. An efficient level of staffing for a distribution network like Aurora’s
We have been asked to consider what level of staffing is efficient for a distribution network like Aurora’s (referencing New Zealand or Australian examples). We have considered this matter via three approaches:
• A ‘senior management’ staffing challenge;
243 Aurora Energy, 2020-04-21, Memo from Aurora Energy to Farrier Swier, titled Aurora Energy CPP Application – Revised SONS and PEOPLE Forecasting Models and Step Change support, Attachment 5 – Non-network Opex – SONS and People costs, slide 17. 244 Farrier Swier, 8 June 2020, Verification report – Aurora Energy CPP application, p. 18.

Aurora CPP – review of forecast expenditure
140
• Benchmarking Aurora’s SONS opex, People costs opex and Non-network opex against that of the five distributors above, and then estimating the level of resourcing associated with this opex; and
• Comparing Aurora’s proposed SONS opex with Powerco’s SONS opex under Powerco’s CPP.
We have done a ‘senior management’ challenge
Drawing on our collective management experience in the electricity sector over many years, Strata undertook a top-down challenge of Aurora’s proposed increase in roles. We concluded that Aurora’s uplift in roles could be reduced by some 30–50%. Table 4 summarises our findings.
There is an information asymmetry between Strata and Aurora’s ELT and Board, meaning we are not as informed. However, this is the sort of challenge we would expect to see from these parties.
The number of roles we have estimated following the challenge session are for the start of the CPP period. Over the course of the CPP and review periods, we expect that several roles will no longer be needed as a result of transitional activities ending (e.g. development of standalone Aurora policies following Aurora’s separation from Delta; establishing new processes for data, communications and information management). We expect the cessation of these roles to occur over years 3–5 of the CPP period, although some roles could cease earlier in year 2 of the CPP period. As noted above, Aurora will have been a standalone entity for almost five years when the CPP begins. To simplify Table 4, we have said the roles associated with these transitional activities end in year 3 of the CPP period.
Table 4: Strata review of proposed number of roles undertaking significant new work activities
Aurora business unit
Number of roles forecast to undertake key new
activities245
Number of roles following challenge session
Challenge session comments
CPP year 1 CPP year 3
Asset Management and Planning
13 5–8 5-6 • Targeting ISO 55001 certification by 2023 requires significant resourcing and risks distracting from key activities associated with gaining an accurate picture of the health of the network’s assets—this risk is compounded by the strong probability of Aurora missing its target date for certification.246
• Aligning with ISO 55001 rather than seeking certification can realise many of the benefits with less of the cost.
• Important to hire a very good asset lifecycle management manager.
• Support with two or three junior engineers, who can learn much from the experienced manager.
• Two or three additional roles justified because of the increase in network assets.
• Development of standalone Aurora policies following separation from Delta should be a relatively short fixed-term role.
245 Aurora Energy, 28 August 2020, Response to RFI No. Q059, pp. 2-3. 246 In its CPP application (pp. 67-68), Powerco’s goal was to be fully compliant with ISO55000 by 2020. The latest update on Powerco’s website says Powerco is currently on track to be ISO55001 certified by the end of 2021.

Aurora CPP – review of forecast expenditure
141
Work Programming and Delivery
(new business unit)
8 3–5 3-4 • Important to hire a very good experienced manager.
• Support with two or three junior staff, who can learn much from the experienced manager.
• Must ensure Aurora is not doubling up on project management roles and responsibilities in its network contractors.
Operations and Network Performance
(new Network Performance business unit)
12 10-12 7-9 • Opportunity exists to rationalise the senior leadership roles from four to two or three.
• What is the justification for 10 network coordinators, when Delta had six?
• Employ an experienced engineer to monitor contractors’ compliance with health and safety requirements, and remove the proposed $300,000 per annum spend on an external consultant to do this job.247
• Employ an analyst and engineer to undertake the work contained in the network evolution expenditure programme—an opportunity to build internal knowledge and capability around the implications of distributed energy resources (DER) for Aurora’s networks. In RY24 and RY25 these staff would be available to assist elsewhere in Aurora’s business, enabling Aurora to deliver better service outcomes for its customers without any extra cost to customers.
Regulatory and Commercial
3 1–2 1-2 • Combine this team with the Accounting and Finance and Risk Assurance team and reduce ELT by one.
• Employ a legal advisor to reduce the proposed $0.5m annual spend on external legal advice.
• New regulatory manager role to improve regulatory engagement.
• Development of standalone Aurora policies following separation from Delta should be a relatively short fixed-term role.
Customer and Engagement
(new business unit)
11 5–7 5-6 • Accept need to improve management of customer-initiated works (CIW) and new connections, however number should be revisited in light of the economic downturn.
• Aurora must ensure it is listening to customer feedback—80% of Aurora’s customers do not want to receive information from Aurora.248
247 Refer to 21 April 2020 memo from Aurora Energy to Farrier Swier, titled Aurora Energy CPP Application – Revised SONS and PEOPLE Forecasting Models and Step Change support, Appendix 1 - Major SONS and PEOPLE Step Changes and Guide to Supporting Information, p. 7. 248 Refer to Aurora’s 2020 AMP, p. 18.

Aurora CPP – review of forecast expenditure
142
Technology and Information
6 2–4 2-3 • Can see the need for at least two or three architects.
Accounting and Finance and Risk Assurance
3 1–2 1-2 • Important for Aurora to employ a good, experienced risk and assurance manager.
• Per comment above, rationalise the ‘Regulatory and commercial’ team with this team.
Corporate 2 0 0 • With today’s modern working environment, an EA should be able to support two ELT members.
Subtotal 58 27–40 24–32
Total roles 158 127–140 124-132
We have looked at Aurora’s resourcing if Aurora’s average opex was aligned with its peers
The conclusion we reached from our benchmarking analysis above is that Aurora’s SONS opex over the CPP and review periods is high relative Aurora’s peers. Given this, and as a counterpoint to our ‘senior management’ challenge, we have considered what Aurora’s staffing levels would look like if Aurora’s SONS opex, Business support opex and Non-network opex were comparable to Aurora’s five peers, factoring in Aurora’s proposed CPP. This analysis involved two steps:
• Step 1: We estimated the level of resourcing that would place Aurora approximately at the 2021–2030 average opex across the five distributors against which we benchmarked Aurora’s SONS and Business support opex; and
• Step 2: Then we increased this long-term average over the CPP and review periods to account for the additional effort that will occur over this time—we have used Powerco’s uplift under its current CPP as the basis for our estimate of Aurora’s uplift.
Step 1: Aligning Aurora’s opex over the long term with the average of its peers
Under Step 1, we have taken our benchmarking cohort of five distributors and calculated the average opex (on a $/ICP and $/km basis)249 for each of the SONS, Business support and Non-network opex categories over the period RY21–RY30.
These opex categories are consistent with the opex categories used in our benchmarking and the benchmarking undertaken by the Verifier (SONS and Business support opex)250 and Aurora (Non-network opex).
Aligning (approximately) Aurora’s SONS opex and People costs opex (on a $/ICP and $/km basis) with the average (on a $/ICP and $/km basis) of the five benchmarked distributors over the period 2021–2030 gives the adjusted SONS opex and People costs opex in Table 5.
249 Specifically, we take the average of:
• the average opex, on a $/ICP basis, across the five distributors for the period RY21–RY30; and
• the average opex on a $/km basis, across the five distributors for the period RY21–RY30. 250 Noting we believe the Verifier benchmarked Business support opex rather than People costs opex.

Aurora CPP – review of forecast expenditure
143
Table 5: Aurora’s adjusted SONS and People costs opex over 2021–2030, excluding allowance for effect of CPP (constant RY20 dollars)
Adjusted average SONS opex
Adjusted average People costs opex
SONS opex is 45% of Aurora’s forecast and Business support opex is 70% of Aurora’s forecast
7,165,433 3,208,293
Non-network opex is 60% of Aurora’s forecast251 7,396,362 3,746,721
First key methodological point under Step 1
An important methodological point under Step 1 is that we only scale SONS opex and People costs opex. All other Non-network opex is held constant. That is, we assume the Commission approves Aurora’s proposed opex for:
• IT
• Premises, Plant and Insurance
• Governance and Administration
• Upper Clutha DER Solution.
To the extent that this assumption is incorrect—i.e. the Commission approves a lesser amount of opex for these other portfolios—then Aurora will need more staff in order to be at an efficient level of staffing based on our benchmarking.
We consider this assumption to be reasonable. We are not aware of any material proposed reductions in Aurora’s Non-network opex other than in the SONS and People costs categories.
Second key methodological point under Step 1
When estimating the efficient level of resourcing, we have removed the following step changes from SONS opex in each of the regulatory years (as applicable) over the period RY21–RY30, on the basis they are non-staff costs:
• CPP application costs ($1,054,167 in RY23 and $320,833 in RY24);
• External consultancy ($180,000 in RY21);
• Technology ($325,000 p.a. from RY21 to RY30);
• Stores and logistics rent ($29,450 p.a. from RY21 to RY30);
• Network easements and legal ($36,000 p.a. from RY21 to RY30);
• Network evolution ($977,877 in RY21, $931,615 in RY22 and RY23, $452,100 in RY24, $557,200 in RY25, and $46,500 p.a. from RY21 to RY30); and
• Insurance ($72,554 in RY21, $116,683 in RY22, $165,894 in RY23, $220,795 in RY23, and $234,886 p.a. from RY21 to RY30).
For the same reason, we have removed the following step changes from People costs opex over the same period:
• CPP application costs ($1,054,167 in RY23 and $320,833 in RY24);
• External consultancy ($185,000 in RY21 and $40,000 in RY22); and
251 Keeping the (2:1) ratio of SONS and People costs opex over the 5-year review period under Aurora’s CPP proposal.

Aurora CPP – review of forecast expenditure
144
• Other staff costs including travel ($24,000 p.a. from RY21 to RY30).
We expect there will be some non-staff costs in the SONS and People costs base year amounts. However, we cannot see these in the information available to us.
To be conservative in our analysis, we assume all the SONS and People costs base year amounts are staffing costs. This assumption is conservative insofar as it results in our analysis tending to overestimate, rather than underestimate, the number of staff needed for Aurora to be at an efficient level of staffing. This is because any non-staff costs in the base year SONS opex will have the effect of reducing the staff headcount needed for Aurora to be around the 2021–2030 average opex for SONS across the cohort of five distributors in our benchmarking analysis.
Third key methodological point under Step 1
We have divided the SONS opex and People costs opex, net of non-staff costs, by the average annualised remuneration for ex-Delta roles, as of 1 July 2020.252 This is to estimate the level of resourcing that would place Aurora approximately at the 2021–2030 average opex for the cohort of five distributors in our benchmarking analysis. We believe the average annualised remuneration for ex-Delta roles, as of 1 July 2020, should be representative of the remuneration across Aurora. This is because it represents a broad cross-section of the roles within Aurora. However, the Commission may wish to obtain the necessary data from Aurora to enable the calculation of the average annualised remuneration for all Aurora staff.
Estimated number of staff that places Aurora approximately at the 2021–2030 average opex of its five peers
Table 6 shows the estimated resourcing that places Aurora approximately at the 2021–2030 average opex across the five distributors in our benchmarking. The table shows this resourcing level to be around 85 to 90 staff. Please note, this is calculated on the basis that all non-staff costs within the SONS and People costs opex categories are as proposed by Aurora in its CPP application, except for ‘Field Audit costs’. Per our ‘senior management’ challenge, we believe the proposed field audit costs should be in-housed, and so we have included the annual amount of $300,000 as a staff cost under SONS opex.
Table 6: Adjusted SONS and People costs headcount over 2021–2030, excluding allowance for CPP
Adjusted staff headcount (SONS)
Adjusted staff headcount (People costs)
Adjusted staff headcount (total)
SONS opex is 45% of Aurora’s forecast and Business support opex is 70% of Aurora’s forecast
55 27.5 82.5
Non-network opex is 60% of Aurora’s forecast253 57.5 32.5 90
Step 2: Lifting Aurora’s headcount over the CPP and review periods to reflect additional work
Aurora’s resourcing requirements will be higher during the CPP and review periods than before and after the CPP. To account for this, we have taken the average opex over the period 2021–2030, and then increased this over the CPP and review periods by the percentage increase in Powerco’s SONS and Business support opex under Powerco’s CPP—refer to Table 3. The resulting increase in opex is shown in Table 7.
252 We obtained this average from information provided by Aurora in its response to RFI Q047. 253 The ratio of SONS and People costs opex over the 5-year review period is 1.76 : 1.0 after our adjustments.
Aurora CPP – review of forecast expenditure
145
Table 7: Adjusted SONS and People costs opex over 2022–2026, with allowance for CPP (constant RY20 dollars)
Adjusted average SONS opex Adjusted average People costs opex
SONS opex is 45% of Aurora’s forecast and Business support opex is 70% of Aurora’s forecast
9,513,924 3,305,348
Non-network opex is 60% of Aurora’s forecast
9,125,204 4,992,091
It should be noted the average of the increase in Powerco’s SONS and People costs opex over the 5-year CPP includes a fall in opex over the last couple of years, as efficiencies begin to be realised and some work on transitional activities comes to an end.
Unfortunately, we could not include a comparison with the change in Orion NZ’s SONS and Business support opex under Orion NZ’s CPP, due to a lack of data.254
We readily acknowledge there are shortcomings in this approach. First and foremost, the activities that Powerco is currently doing under its CPP differ from those Aurora proposes. However, at a high level, Powerco’s CPP and Aurora’s proposed CPP are both about significant network investment and improving asset management capability and practices.255
A further shortcoming is that, to enable a comparison to be made, we use the percentage uplift in Powerco’s SONS / Business support / Non-network opex, measured in terms of $/ICP and $/km of line length. However, Powerco’s percentage uplift in terms of $/ICP and $/km of line length is from lower starting values than for Aurora. On this basis, using Powerco’s percentage uplift would be expected to overstate Aurora’s uplift. That is, applying Powerco’s percentage uplift to Aurora’s higher starting dollar amount will result in Aurora’s $/ICP and $/km of line length ratios rising by more than Powerco’s in absolute dollar terms.
Another shortcoming is that the long-term average opex on which we are overlaying Powerco’s CPP uplift includes Powerco’s uplift. This means we are in effect counting Powerco’s CPP uplift twice—once in the long-term, business-as-usual levels of SONS / Business support / Non-network opex, and then again via the CPP uplift factor.
Lastly, Aurora may need a larger percentage uplift than Powerco did, because Aurora is starting from a lower base than Powerco did in terms of asset management maturity. Aurora’s most recent asset management maturity (AMMAT) assessment score was 2.13,256 while Powerco’s was 2.4 at the time it submitted its CPP proposal.257 But offsetting this is Powerco’s larger capex programme under its CPP.
We consider the above shortcomings are acceptable for the purpose of our top-down assessment of Aurora’s staffing over the CPP and review periods. This is because:
• The assessment is one of three approaches we have used to consider an efficient level of staffing for a distributor like Aurora; and
254 For the financial year ending 31 March 2008, Orion NZ reported all its opex as ‘Routine and Preventative Maintenance’. For the financial year ending 31 March 2009, Orion NZ reported all its opex as ‘Other’. For the financial year ending 31 March 2011, the Commerce Commission exempted Orion NZ from all provisions in the Electricity Distribution (Information Disclosure) Requirements 2008 except for Clause 14(5), which related to disclosure of line charges. 255 See, for example, Powerco, 12 June 2017, Customised price-quality path (CPP) Main Proposal, p. i. 256 Aurora Energy, Asset Management Plan April 2020 – March 2030, p. x. 257 Powerco, 12 June 2017, Customised price-quality path (CPP) Main Proposal, p. 67.

Aurora CPP – review of forecast expenditure
146
• We believe these shortcomings are likely to balance each other out.
Consistent with this view, we have increased Aurora’s business-as-usual opex estimated under the first step by the mid-point of the percentage increases in S/ICP and S/km of line length shown in Table 3—ie:
• SONS opex – 51.5%;
• Business support opex – 13%; and
• Total Non-network opex – 24%.
Table 8 presents the results from dividing the figures in Table 7 by the average annualised remuneration for ex-Delta roles, as of 1 July 2020. Table 8 gives our estimate of Aurora’s staffing level across the 5-year review period under Aurora’s CPP proposal, from benchmarking Aurora’s SONS / Business support / Non-network opex against the cohort of five peer distributors.
Table 8: Adjusted SONS and People costs headcount over 2022–2026, with allowance for CPP
Adjusted staff headcount (SONS)
Adjusted staff headcount (People costs)
Adjusted staff headcount (total)
SONS opex is 45% of Aurora’s forecast and Business support opex is 70% of Aurora’s forecast
88.5 30.5 119
Non-network opex is 60% of Aurora’s forecast258 84.5 46.5 131
Combining the ‘senior management’ challenge and benchmarking analysis to give an estimated level of staffing that is efficient
Table 9 compares the different Aurora headcounts estimated using the ‘senior management’ challenge and benchmarking. We include the following divisions of Aurora under SONS for the purposes of our ‘senior management’ challenge:
• Asset Management and Planning (41 roles);
• Work Programming and Delivery (26 roles);
• Operations and Network Performance (25 roles); and
• The ‘Customer Initiated Works’ and ‘Customer Experience’ teams within the Customer and Engagement division (11 roles).259
The reason for including the two teams from the Customer and Engagement division in SONS is to align with Aurora’s inclusion of these teams in its SONS opex category.260
258 The ratio of SONS and People costs opex over the 5-year review period is 1.83 : 1.00 after our adjustments 259 This results in 8 roles moving from the ‘Adjusted staff headcount (People costs)’ column in Table 9 to the ‘Adjusted staff headcount (SONS)’ column in Table 9. 260 Aurora Energy, 29 April 2020, SONS portfolio overview document, p. 7.

Aurora CPP – review of forecast expenditure
147
Table 9: Adjusted SONS and People costs headcount over 2022–2026, with allowance for CPP
Adjusted staff headcount (SONS)
Adjusted staff headcount (People costs)
Adjusted staff headcount (total)
Strata ‘senior management’ challenge – lower bound
CPP year 1 (from start of) 85 42 127
CPP year 3 (from middle of) 82 42 124
Strata ‘senior management’ challenge – upper bound
CPP year 1 (from start of) 92 48 140
CPP year 3 (from middle of) 86 46 132
SONS opex is 45% of Aurora’s forecast and Business support opex is 70% of Aurora’s forecast—only SONS opex and People costs opex are subject to scaling
88.5 30.5 119
Non-network opex is 60% of Aurora’s forecast—only SONS opex and People costs opex are subject to scaling
84.5 46.5 131
Based on the numbers in Table 9:
• The average headcount over years 1–2 of the CPP period is 129 (SONS: 87; People costs: 42);
• The average headcount in year 3 of the CPP period is 127.5 (SONS: 86; People costs: 41.5)—this is also the average headcount over the 5-year review period; and
• The average headcount over years 4–5 of the review period is 126 (SONS: 85; People costs: 41).
These numbers represent, respectively, 81.65%, 81% and 79.75% of Aurora’s proposed headcount of 158.
We need to include non-staff costs in the opex associated with these staff numbers Simply multiplying these staff numbers by the average annualised remuneration for ex-Delta roles, as of 1 July 2020, will understate the opex associated with an efficient level of resourcing for a distributor like Aurora. We need to add back to SONS and People costs opex the step changes we removed above, ie:
• CPP application costs;
• External consultancy;
• Technology;
• Stores and logistics rent;
• Network easements and legal;
• Network evolution;
• Insurance; and
• Other staff costs including travel.
This gives the SONS opex and People costs opex in Table 10.

Aurora CPP – review of forecast expenditure
148
Table 10: SONS and People costs opex over the CPP and review periods—central estimate of SONS and People costs opex associated with an efficient staffing level (constant RY20 dollars)
CPP Year 1 CPP Year 2 CPP Year 3 CPP Year 4 CPP Year 5 Total
SONS 11,068,770 12,273,841 11,070,457 10,821,954 10,391,245 55,626,267
People costs 4,659,337 5,722,031 4,999,190 4,688,704 4,727,414 24,796,675
Total 15,728,107 17,995,872 16,069,647 15,510,658 15,118,659 80,422,942
Table 11 shows the SONS opex and People costs opex associated with a lower bound estimate of 119 Aurora staff over the CPP and review periods—refer to Table 9. This number comes from the benchmarking approach to estimating an efficient level of staffing for a distributor like Aurora.
Table 11: SONS and People costs opex over the CPP and review periods—lower bound estimate of SONS and People costs opex associated with an efficient staffing level (constant RY20 dollars)
CPP Year 1 CPP Year 2 CPP Year 3 CPP Year 4 CPP Year 5 Total
SONS 11,154,667 12,360,645 11,284,174 11,164,685 10,736,820 56,700,989
People costs 3,439,526 4,489,338 3,784,311 3,492,020 3,520,798 18,725,993
Total 14,594,193 16,849,983 15,068,485 14,656,705 14,257,618 75,426,982
Table 12 shows the SONS opex and People costs opex associated with an upper bound estimate of 140 Aurora staff over the first two and a half years of the review period and then 132 Aurora staff over the second two and a half years of the review period—refer again to Table 9.
Table 12: SONS and People costs opex over the CPP and review periods—upper bound estimate of SONS and People costs opex associated with an efficient staffing level (constant RY20 dollars)
CPP Year 1 CPP Year 2 CPP Year 3 CPP Year 4 CPP Year 5 Total
SONS 11,566,662 12,776,990 11,367,459 10,909,354 10,479,370 57,099,834
People costs 5,348,129 6,418,096 5,616,903 5,226,716 5,269,890 27,879,734
Total 16,914,791 19,195,086 16,984,362 16,136,070 15,749,260 84,979,568
A sanity check using Powerco’s CPP proposal
Lastly, as a sanity check on the analysis above, we have compared Aurora’s proposed increase in SONS opex against the proposed increase in SONS opex under Powerco’s CPP proposal. The SONS opex category contains most of the staffing costs associated with two of the most important drivers behind Aurora’s and Powerco’s respective CPP proposals—delivering a major capex programme and improving the organisation’s asset management practices.
To compare the two SONS opex amounts, we have made the following adjustments:
• Remove from Aurora’s proposed SONS opex $1.4 million in CPP preparation costs and $1 million in insurance costs over the CPP and review periods. Neither of these step changes were in Powerco’s proposed SONS opex uplift.
• Add the estimated cost of one health and safety team member to Powerco’s proposed increase in SONS opex, since health and safety is included in Aurora’s SONS opex, but was included in Business support opex under Powerco’s CPP proposal. We use an estimate of $100,000 (RY20 dollars) to be conservative. Powerco’s additional staff member was to be added to an existing team of five, “to meet the health and safety obligations of the increased

Aurora CPP – review of forecast expenditure
149
company-wide staff numbers and higher levels of network activity”.261 This implies the additional staff member was not intended to be a senior staff member, so we consider $100,000 to be a reasonable estimate.
After making these adjustments, we are left with Powerco’s proposed SONS uplift being $29.5 million (constant RY20 dollars) 262 and Aurora’s proposed SONS uplift being $31.6 million (constant RY20 dollars)—a difference of $2.1 million.
To add context to the comparison of SONS opex, we have also compared capex and Business support opex under Aurora’s and Powerco’s CPP proposals. For the Business support opex comparison, we have made the reverse adjustments to those made in the SONS opex comparison. We do not have the information available to remove one-off costs from Aurora’s Business support opex over the period RY16–RY20. Therefore, in relation to Powerco’s Business support opex, we have used Powerco’s Corporate opex amount inclusive of one-off adjustments for the period RY14–RY18, as referred to in the Commission’s decision on Powerco’s CPP proposal.263
Table 13 summarises our comparison.
Table 13: Comparison of proposed increase in SONS opex, capex and Business support opex over 5 years under the Aurora and Powerco CPP proposals (constant RY20 dollars)
Increase over preceding 5 years Aurora Powerco Difference (Aurora less Powerco)
SONS opex with adjustments 31.6m 29.5m 2.1m
Capex 267m 306.5m264 (39.5m)
Business support opex with adjustments 31.2m265 17.7m266 13.5m
Notes: 1. For the Powerco CPP proposal, the preceding 5 years are RY14 to RY18.
2. For the Aurora CPP proposal, the preceding 5 years are RY16 to RY20.267
3. Aurora’s Business support opex increase contains $20.2m of People costs, with the remaining amount consisting of ‘IT opex’, ‘Premises, Plant and Insurance’, ‘Governance and administration’, and the ‘Upper Clutha DER solution’.
4. Powerco’s Business support opex increase consisted of $19.9m of ‘Corporate’ opex and $10.5m of ‘ICT’ opex (constant RY20 dollars).
In its CPP proposal Powerco forecast SONS opex over the 5-year CPP period to be $87.1 million (constant RY20 dollars).268 Meanwhile, in its CPP application, Aurora is proposing SONS opex of $80.84 million (constant RY20 dollars) over five years. Factoring in the adjustments made above, Powerco’s proposed SONS opex was $87.2 million, while Aurora’s is $78.5 million.
261 Powerco, 12 June 2017, Customised price-quality path (CPP), Main Proposal, p. 202. 262 Using the specification for the CPP inflation rate outlined in clause 5.3.4(9) of the CPP input methodology. 263 Refer to Commerce Commission, 28 March 2018, Powerco’s customised price-quality path, Final decision, p. 100. 264 $292 million in RY17 dollars. Refer to Commerce Commission, 28 March 2018, Powerco’s customised price-quality path, Final decision, p. 46. 265 Refer to Aurora Energy file called ‘Forecast tracker – 12 June submission’, and using RY20 actual People costs opex provided by Aurora in its response to RFI No. Q036 and RFI No. Q040. 266 $29 million in RY17 dollars. Refer to Commerce Commission, 28 March 2018, Powerco’s customised price-quality path, Final decision, p. 100 and p. 102. 267 The five years leading up to Powerco’s CPP period included three years of actual expenditure (2014-2016) and two years of forecast expenditure (2017-2018). Refer to Commerce Commission, 28 March 2018, Powerco’s customised price-quality path, Final decision, p. 75, footnote 92. 268 $83 million in RY17 dollars. Refer to Commerce Commission, 28 March 2018, Powerco’s customised price-quality path, Final decision, p. 98.

Aurora CPP – review of forecast expenditure
150
We note the Commission did not approve $9.4 million (constant RY20 dollars)269 of Powerco’s proposed SONS opex, relating to additional SONS roles intended to improve Powerco’s internal skills and asset management capability.270 Therefore, on a comparable basis by factoring in the adjustments made above:
• In relative terms, Aurora is proposing an uplift in SONS opex that is $11.5 million higher than the uplift in SONS opex that Powerco received under its CPP proposal; and
• In absolute terms, Aurora is proposing to spend $700,000 more than what Powerco received in the SONS opex category.
As we note above, Aurora is starting from a lower base than Powerco did in terms of asset management maturity. Therefore, we would expect Aurora’s staffing needs in this regard to be higher than Powerco’s. However, the reverse will apply in relation to each organisation’s capex programme.
We expect that, overall, Powerco’s staffing needs under SONS should be greater than Aurora’s—Powerco’s network is almost four and a half times as long as Aurora’s and Powerco has over three and a half times as many ICPs as Aurora.271 That Aurora proposes to outspend Powerco in SONS opex under the CPP reinforces our view that Aurora’s staffing level does not meet the expenditure objective.
10.7. Advice on adjustments to the 3-year and 5-year CPP
Opinion We conclude Aurora has not demonstrated that its proposed uplift in SONS and People costs opex is prudent and efficient. This is based on the opex benchmarking and consideration of an efficient level of staffing set out in this briefing report. Our opinion is further reinforced by the fact that we have not seen evidence of a business case-based approach to Aurora’s staffing uplift, with estimates of the benefits attached to the substantial uplift in resourcing. Therefore, we cannot conclude that Aurora’s proposed SONS and People costs opex is consistent with the expenditure objective.
We believe the average headcount from our two approaches to estimating an uplift in Aurora’s SONS and People costs opex represents a level of opex that is more consistent with the expenditure objective. This is based on the analysis set out above.
Recommendation We recommend Aurora’s proposed SONS opex and People costs opex be revised for the 3-year CPP period and the 5-year review period as shown in Table 14.
Table 14: Recommended SONS and People costs opex over the CPP and review periods (constant RY20 dollars)
CPP Year 1 CPP Year 2 CPP Year 3 CPP Year 4 CPP Year 5 Total
SONS 11,068,770 12,273,841 11,070,457 10,828,706 10,391,245 55,626,267
People costs 4,659,337 5,722,031 4,999,190 4,688,704 4,727,414 24,796,675
Total 15,728,107 17,995,872 16,080,165 15,510,658 15,118,659 80,422,942
269 $9 million in RY17 dollars. 270 Powerco, 12 June 2017, Customised price-quality path (CPP) Main Proposal, p. 56. 271 For RY19, Powerco had 28,322 km of lines and 331,001 ICPs, while Aurora had 6,575 km of lines and 90,456 ICPs. Line lengths are taken from Powerco’s and Aurora’s RY19 information disclosures. ICP numbers are taken from the Electricity Authority’s EMI database, as of 31 March 2019.
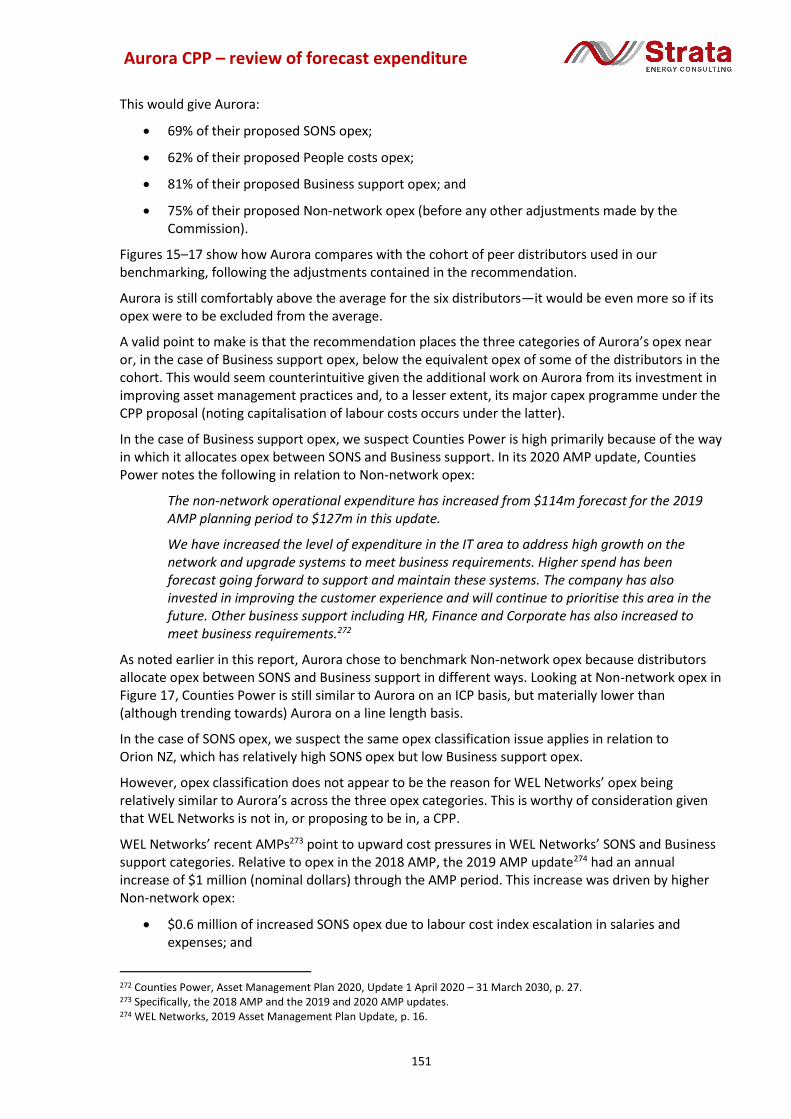
Aurora CPP – review of forecast expenditure
151
This would give Aurora:
• 69% of their proposed SONS opex;
• 62% of their proposed People costs opex;
• 81% of their proposed Business support opex; and
• 75% of their proposed Non-network opex (before any other adjustments made by the Commission).
Figures 15–17 show how Aurora compares with the cohort of peer distributors used in our benchmarking, following the adjustments contained in the recommendation.
Aurora is still comfortably above the average for the six distributors—it would be even more so if its opex were to be excluded from the average.
A valid point to make is that the recommendation places the three categories of Aurora’s opex near or, in the case of Business support opex, below the equivalent opex of some of the distributors in the cohort. This would seem counterintuitive given the additional work on Aurora from its investment in improving asset management practices and, to a lesser extent, its major capex programme under the CPP proposal (noting capitalisation of labour costs occurs under the latter).
In the case of Business support opex, we suspect Counties Power is high primarily because of the way in which it allocates opex between SONS and Business support. In its 2020 AMP update, Counties Power notes the following in relation to Non-network opex:
The non-network operational expenditure has increased from $114m forecast for the 2019 AMP planning period to $127m in this update.
We have increased the level of expenditure in the IT area to address high growth on the network and upgrade systems to meet business requirements. Higher spend has been forecast going forward to support and maintain these systems. The company has also invested in improving the customer experience and will continue to prioritise this area in the future. Other business support including HR, Finance and Corporate has also increased to meet business requirements.272
As noted earlier in this report, Aurora chose to benchmark Non-network opex because distributors allocate opex between SONS and Business support in different ways. Looking at Non-network opex in Figure 17, Counties Power is still similar to Aurora on an ICP basis, but materially lower than (although trending towards) Aurora on a line length basis.
In the case of SONS opex, we suspect the same opex classification issue applies in relation to Orion NZ, which has relatively high SONS opex but low Business support opex.
However, opex classification does not appear to be the reason for WEL Networks’ opex being relatively similar to Aurora’s across the three opex categories. This is worthy of consideration given that WEL Networks is not in, or proposing to be in, a CPP.
WEL Networks’ recent AMPs273 point to upward cost pressures in WEL Networks’ SONS and Business support categories. Relative to opex in the 2018 AMP, the 2019 AMP update274 had an annual increase of $1 million (nominal dollars) through the AMP period. This increase was driven by higher Non-network opex:
• $0.6 million of increased SONS opex due to labour cost index escalation in salaries and expenses; and
272 Counties Power, Asset Management Plan 2020, Update 1 April 2020 – 31 March 2030, p. 27. 273 Specifically, the 2018 AMP and the 2019 and 2020 AMP updates. 274 WEL Networks, 2019 Asset Management Plan Update, p. 16.

Aurora CPP – review of forecast expenditure
152
• $0.4 million of increased Business support opex, due to increased compliance audit and legal costs.
Relative to opex in the 2019 AMP update, the 2020 AMP update had an annual increase in opex of $6.3 million (nominal dollars) through the AMP period. The major contributor to this uplift was again higher Non-network opex. WEL Networks’ explanation for the opex increase was as follows:
Our non-network operational expenditure will rise to facilitate the move to a more data driven business. This results in an annual nominal increase of $6.3M which is primarily comprised of the six initiatives:
1. Labour rate increases – $360k p.a.
2. Fault budget increase – $480k p.a.
3. New cable testing / maintenance - $185k p.a.
4. Business Support - $4M p.a.
5. System operations and network support - $750k p.a.
6. Vegetation management - $240k p.a.275
It appears WEL Networks is undertaking relatively material transformational activities at present that require a material uplift in Non-network opex.
As a closing remark, we note the two distributors in the cohort that have either been through, or are going through, a CPP have a materially lower Non-network opex ratio276 than Aurora. (We consider it appropriate to refer to Orion NZ in this regard, even though its CPP has come to an end, because its Non-network opex is now higher than during the CPP.) While economies of scale will explain some of this, we note that Aurora should have the same economies of scale benefit relative to Counties Power and WEL Networks.
275 WEL Networks, 2020 Asset Management Plan Update, p. 14. 276 We use Non-network opex to avoid the apparent opex classification issue with Orion NZ.

Aurora CPP – review of forecast expenditure
153
Figure 15: Comparison of Aurora’s SONS opex with peer distributors following recommendation

Aurora CPP – review of forecast expenditure
154
Figure 16: Comparison of Aurora’s Business support opex with peer distributors following recommendation

Aurora CPP – review of forecast expenditure
155
Figure 17: Comparison of Aurora’s Non-network opex with peer distributors following recommendation

Aurora CPP – review of forecast expenditure
156
11. OPEX BRIEFING REPORT 7 – Review of minor opex
11.1. Introduction The Commerce Commission (the Commission) has engaged Strata to review specific topics related to Aurora Energy’s (Aurora’s) CPP application and the Verifier’s report.
This briefing report considers the reasonableness of expenditure for the following operational expenditure (opex) programmes contained in Aurora’s CPP proposal:
• Network evolution;
• Premises and plant;277 and
• Governance and administration.
The Verifier considered the reasonableness of network evolution278 opex as part of its assessment of Aurora’s proposed opex in the system operations and network support (SONS) portfolio.279
The Verifier did not consider the reasonableness of the second and third opex programmes listed above.
Scope of work The Commission has asked Strata to carry out the following high-level test of reasonableness for each of the three programmes listed above:
1. The reasonableness of the expenditure programme;
2. The reasonableness of the policies that underpin the expenditure programme;
3. Whether the policies underpinning the expenditure programme have been applied appropriately;
4. The reasonableness of any models used to generate the forecasts and justify the expenditure programme; and
5. Whether any prioritisation has been applied or should be applied.
277 Aurora includes insurance expenditure allocated to its business support function alongside its premises and plant expenditure. However, the Verifier and Strata have each considered insurance under the SONS portfolio, as this is where the majority of Aurora’s insurance expenditure is allocated. 278 On p. 154 (Table B.2) of Farrier Swier’s 8 June 2020 verification report on Aurora’s CPP application, the reference to “network transformation” is in fact a reference to “network evolution”. 279 Farrier Swier, 8 June 2020, Verification report – Aurora Energy CPP application, p. 319. There is an error in Table B.2 of the verification report. The Verifier did select and assess “network transformation” opex, as part of the Verifier’s assessment of SONS opex, under the label “network evolution”.

Aurora CPP – review of forecast expenditure
157
11.2. Our assessment of the reasonableness of the network evolution programme
We consider the expenditure programme is reasonable We consider Aurora’s network evolution expenditure programme to be reasonable.
The penetration of distributed energy resources (DER) such as solar photovoltaics (solar PV), electric vehicles and battery energy storage systems is predicted to materially increase over the coming decade.
It is prudent for Aurora to be investigating the potential implications of DER on the operation of, and investment in, its networks, and to be proposing arrangements that facilitate the economically efficient uptake of DER.280 We note that, as part of its CPP proposal, Aurora has a preferred non-network DER opex solution for the Upper Clutha capacity constraint (Wanaka and the Lakes district).
However, one query we have is whether Aurora should be focussing just as much, if not more so, on smart grid initiatives that build greater intelligence into Aurora’s networks through:
• Increased monitoring (e.g. distribution transformer condition);
• Operational flexibility (e.g. switching capability); and
• Visibility (i.e. localised real-time low voltage network conditions).
We consider the policy underpinning the expenditure programme is reasonable and has been applied appropriately The policy underpinning this expenditure programme is Aurora’s ‘Network Evolution Plan’.281 This plan is intended to enable Aurora to respond prudently and efficiently to the projected increase in DER on its networks.282
We consider this policy to be reasonable—it clearly describes potential benefits and drawbacks of DER for distribution networks, and the need for Aurora to prepare for and manage network-related issues associated with the uptake of DER on its networks.
Key work activities under Aurora’s network evolution expenditure programme include:
• Understanding the potential uptake of DER across Aurora’s networks and the networks’ ability to host the predicted DER;
• Putting in place connection standards that maximise network hosting capacity; and
• Alongside other industry participants (eg, retailers, Transpower) developing and trialling different pricing methodologies to coordinate DER use.283
We consider these activities are consistent with the policy underpinning the expenditure programme.
280 I.e. distributors’ pricing arrangements appropriately consider the costs and benefits for distribution network users arising from DER, including matters such as network price-quality trade-offs and potential/actual cross-subsidies between network users with and without DER. 281 Aurora Energy, January 2020, Evolving Our Network: Preparing for a future of efficient network service delivery to support climate change mitigation, distributed energy resources and consumers’ choices. 282 Aurora Energy, 27 February 2020, SONS portfolio overview document, p. 16. 283 Refer to 2020-04-21, Memo from Aurora Energy to Farrier Swier, titled Aurora Energy CPP Application – Revised SONS and PEOPLE Forecasting Models and Step Change support, Attachment 8 – Network Evolution Model spreadsheet (“Inputs” tab).

Aurora CPP – review of forecast expenditure
158
We consider the model used to generate and justify the proposed opex is reasonable We consider the bottom-up estimation model used to generate and justify the proposed opex is reasonable. The model clearly sets out work activities, timeframes, effort, and unit costs. We consider Aurora’s estimates for these to be reasonable.
We consider Aurora could realise benefits by using staff rather than external contractors All costs in the model pertain to external resources—contractors and consultants, and software and cloud storage providers. Aurora has clarified that it considered two approaches to resourcing the network evolution initiative—using a combination of internal and external labour or using only external labour.284 Aurora forecasts both approaches will cost substantially the same. For the purposes of the CPP proposal Aurora has put forward the fully externally resourced approach, although Aurora notes it has not yet decided which resourcing approach to adopt.285
We consider Aurora should be able to realise several benefits by bringing in-house the ‘analyst’ and ‘engineer’ work contained in the expenditure programme.
Table 1 shows Aurora’s proposed external human resourcing for the network evolution expenditure programme. Over the period RY21 to RY23 the external analyst role is more than fulltime (1.25 fulltime equivalent (FTE) human resources), while the external engineer role is reasonably near to fulltime (0.83 FTEs).
Table 1: Breakdown of external fulltime equivalent (FTE) human resources for Aurora’s network evolution expenditure programme286
RY21 RY22 RY23 RY24 RY25 RY26287 Average FTEs RY21 to RY25
Total cost RY21 to RY25
Equivalent p.a. salary
External 1: Analyst
1.43 1.16 1.16 0.58 0.93 – 1.05 $531,600 $100,936
External 2: Engineer
0.95 0.78 0.78 0.39 0.62 – 0.70 $775,250 $221,148
External 3: Specialist consultant
0.65 0.53 0.53 0.26 0.43 – 0.48 $1,107,500 $460,000
Total FTEs per annum
3.03 2.47 2.47 1.23 1.98 – 2.24 $2,414,350
We believe Aurora has the opportunity to build its internal knowledge and capability around the implications of DER for its networks by bringing the analyst and engineer roles in-house.288 Using external resources for these roles is not only just as expensive, if not more expensive, than using internal resources, it means the capability and knowledge associated with these roles resides outside Aurora. While there would no doubt be knowledge transfer from these roles to Aurora’s staff if the roles were filled externally, in our experience a reasonable amount of knowledge and capability will not be transferred.
284 Aurora Energy, 23 August 2020, Response to RFI No. Q056, p. 2. 285 Ibid 286 Aurora Energy, 2020-04-21, Memo from Aurora Energy to Farrier Swier, titled Aurora Energy CPP Application – Revised SONS and PEOPLE Forecasting Models and Step Change support, Attachment 8 – Network Evolution Model spreadsheet (“Inputs” tab). 287 We have included RY26 for completeness since this is the final year of the CPP review period. 288 Noting Aurora would need to supplement an internal analyst with an external analyst during RY21 and possibly RY22 and RY23.

Aurora CPP – review of forecast expenditure
159
Given that DER will have an increasingly material effect on Aurora’s networks, we see the building of internal capability and knowledge as being an important human resources strategy for Aurora. We consider it should be no more difficult for Aurora to recruit the expertise and experience needed for these roles than is the case for many of the roles that Aurora has been recruiting for since 2017.
Should Aurora hire the analyst and engineer as staff, then in RY24 and RY25 these staff would be available to assist elsewhere in Aurora’s business, thereby enabling Aurora to deliver better service outcomes for its customers without any additional cost to its customers.
Aurora has applied some prioritisation to this expenditure programme We note that, following customer consultation, Aurora removed $1.4m from the network evolution expenditure programme. The $1.4m was for:
• More research and experimentation; and
• Use of network technology to assist with asset condition assessment.
Aurora plans to revisit this proposed expenditure at a future date.289
We agree with this prioritisation of expenditure.
Recommendation Based on our review of Aurora’s proposed network evolution expenditure programme, we recommend the Commission approve the proposed expenditure.
We consider Aurora should be able to realise several benefits by bringing in-house the ‘analyst’ and ‘engineer’ work contained in the expenditure programme. In our ‘Opex briefing report 6’, we factor into our analysis Aurora doing most of the network evolution work in-house. The building of Aurora’s capability in this area would complement Aurora’s DER activities elsewhere.
11.3. Our assessment of the reasonableness of the premises and plant programme
We consider the expenditure programme is reasonable We consider Aurora’s premises and plant expenditure programme to be reasonable. It covers the running costs of Aurora’s offices and the running and leasing costs of plant, motor vehicles and equipment utilised within Aurora’s business support function.290 These expenditure items are necessary for Aurora’s business operation.
We consider the policies underpinning the expenditure programme are reasonable, but we cannot say whether they have been applied appropriately Aurora has said purchases under this expenditure programme are made in compliance with Aurora’s procurement and purchasing standards, including:
• Procurement standard (IPC-964); and
• Purchase to pay standard (IPC-975).291
We have reviewed what we understand to be these policies.292 We consider these policies to be reasonable. However, there is insufficient information in Aurora’s CPP application and its Premises,
289 Aurora Energy, 27 February 2020, SONS portfolio overview document, p. 18. 290 Aurora Energy, 12 June 2020, Customised Price-Quality Path Application, p. 185. 291 Aurora Energy, 10 August 2020, Response to RFI No. Q046, p. 2. 292 We refer to the Aurora Energy files ‘AE-SA14-S – Procurement’ and ‘AE-SA08-S – Purchase To Pay’.

Aurora CPP – review of forecast expenditure
160
Plant and Insurance portfolio overview document, to enable us to form a view on whether the policies have been applied appropriately.
We consider the model used to generate and justify the proposed opex is reasonable Aurora has adopted a base-step-trend approach to estimating the proposed opex under the premises and plant expenditure programme. Aurora has selected RY19 as the base year. Aurora considers $1.02m (RY20 dollars) to be an efficient level of expenditure for RY19, rather than the actual RY19 expenditure of $0.75m.293 So, this adds $270,000 per annum to this expenditure programme.
Of the additional $270,000 per annum, $250,000 relates to additional office space and associated costs294 to accommodate additional staff in Dunedin and Central Otago.295
We understand Aurora is planning to employ an additional 28 staff between RY19 and RY22 (increasing Aurora’s staff numbers from 130 to 158).296 This means Aurora is planning to spend almost $9,000 ($8,929) per additional staff member on office occupancy costs. This is almost equivalent to the occupancy cost297 of prime office space in Auckland metro, which a 2018 survey put at $9,213.298 The same survey put the equivalent cost across the Hamilton, Tauranga/Mount Maunganui and Dunedin CBDs at approximately $5,400.299
Aurora has clarified that it plans to move all of its workforce into two more functional offices in Dunedin and Cromwell and that, as part of this process, Aurora will be moving from lower grade office space into higher grade office space. Aurora also believes it would be prudent to make a modest provision for further growth in staff numbers above the 158 Aurora proposes in its CPP application.300
Following this clarification from Aurora, we consider the model used to generate the proposed opex for the premises and plant expenditure programme is reasonable.
Aurora has not applied any prioritisation to this expenditure programme It appears Aurora has not applied any prioritisation to this expenditure programme. If this is the case, we query whether Aurora could have undertaken some minor prioritisation—for instance, is the $50,000 per annum increase in plant and vehicle running costs301 necessary? Could smart working approaches enable this cost to be reduced or avoided?
Recommendation Based on our review of Aurora’s proposed base year opex in the premises and plant expenditure programme, we recommend the Commission approve the proposed expenditure.
293 Aurora Energy, 12 June 2020, Premises, plant and insurance portfolio overview document, p. 6. 294 Increased electricity usage, cleaning and rubbish collections associated with the additional office space. 295 Aurora Energy, 12 June 2020, Premises, plant and insurance portfolio overview document, p. 7. 296 We note the organisational structure in Appendix P of Aurora’s CPP application has 158 staff, whereas Aurora uses a targeted headcount from RY22 to RY24 of 156 for the purposes of forecasting its training and safety costs. Refer to 2020-04-21, Memo from Aurora Energy to Farrier Swier, titled Aurora Energy CPP Application – Revised SONS and PEOPLE Forecasting Models and Step Change support, Appendix 1 - Major SONS and PEOPLE Step Changes and Guide to Supporting Information, p. 8. 297 Defined as the property cost of leasing net lettable space excluding GST—including rental, operating expenses, and car parking costs. 298 Colliers International: Office workspace and trends – 2018 New Zealand fixed-term and flexible workspace report, p. 4. 299 Ibid, p. 5. 300 Aurora Energy, 23 August 2020, Response to RFI No. Q056, p. 2. Although Aurora’s refers to 156 staff in its response to the RFI, we believe Aurora may have intended to say 158 staff, per its CPP application. 301 The $50,000 is to reflect an increase in vehicle leases based on proposed additional staff—five new vehicles are proposed, at $850 per month. Refer to Aurora Energy, 12 June 2020, Premises, plant and insurance portfolio overview document, p. 7.
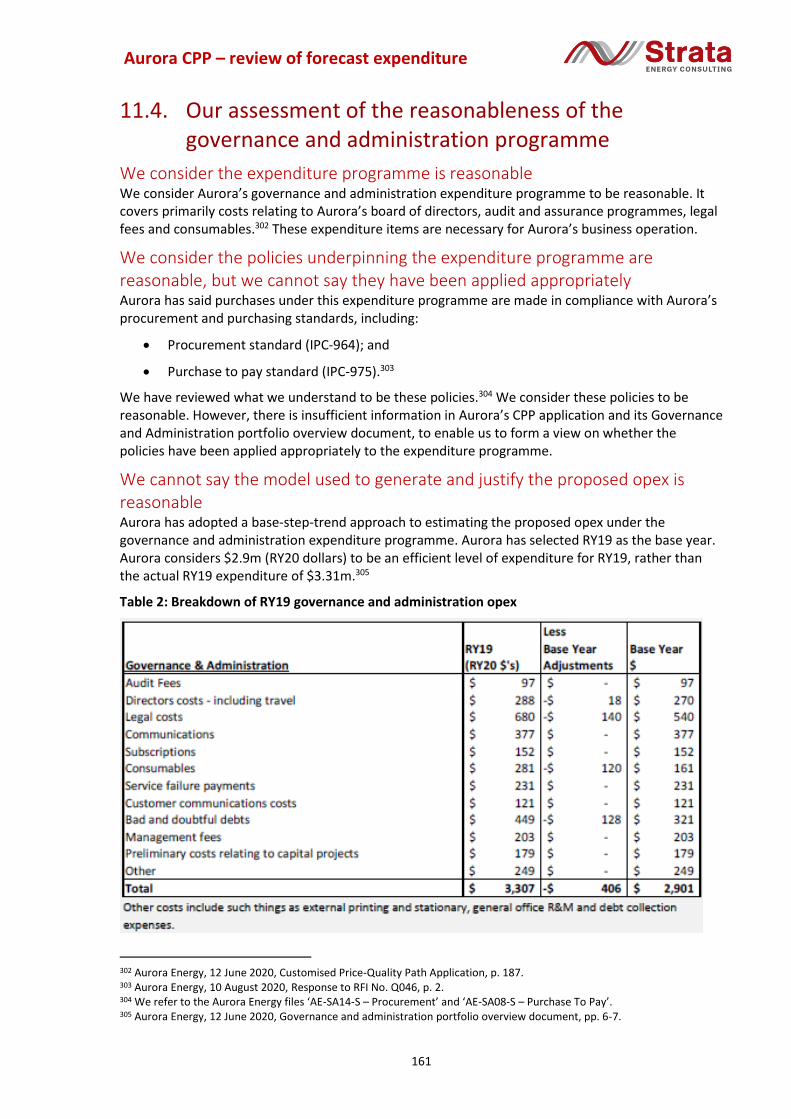
Aurora CPP – review of forecast expenditure
161
11.4. Our assessment of the reasonableness of the governance and administration programme
We consider the expenditure programme is reasonable We consider Aurora’s governance and administration expenditure programme to be reasonable. It covers primarily costs relating to Aurora’s board of directors, audit and assurance programmes, legal fees and consumables.302 These expenditure items are necessary for Aurora’s business operation.
We consider the policies underpinning the expenditure programme are reasonable, but we cannot say they have been applied appropriately Aurora has said purchases under this expenditure programme are made in compliance with Aurora’s procurement and purchasing standards, including:
• Procurement standard (IPC-964); and
• Purchase to pay standard (IPC-975).303
We have reviewed what we understand to be these policies.304 We consider these policies to be reasonable. However, there is insufficient information in Aurora’s CPP application and its Governance and Administration portfolio overview document, to enable us to form a view on whether the policies have been applied appropriately to the expenditure programme.
We cannot say the model used to generate and justify the proposed opex is reasonable Aurora has adopted a base-step-trend approach to estimating the proposed opex under the governance and administration expenditure programme. Aurora has selected RY19 as the base year. Aurora considers $2.9m (RY20 dollars) to be an efficient level of expenditure for RY19, rather than the actual RY19 expenditure of $3.31m.305
Table 2: Breakdown of RY19 governance and administration opex
302 Aurora Energy, 12 June 2020, Customised Price-Quality Path Application, p. 187. 303 Aurora Energy, 10 August 2020, Response to RFI No. Q046, p. 2. 304 We refer to the Aurora Energy files ‘AE-SA14-S – Procurement’ and ‘AE-SA08-S – Purchase To Pay’. 305 Aurora Energy, 12 June 2020, Governance and administration portfolio overview document, pp. 6-7.

Aurora CPP – review of forecast expenditure
162
Table 2 shows the breakdown of governance and administration opex for RY19.306 It should be noted the governance and administration expenditure programme does not include any costs associated with employing staff. 307
Further downward step changes should be made to legal costs and service failure payments Having reviewed this expenditure, we believe the amount of governance and administration opex proposed by Aurora for the CPP and review periods could be adjusted down to better meet the expenditure objective.
We consider Aurora should further reduce the amount of legal costs in its base year, to reflect efficiency benefits from bringing in-house a material amount of its legal work. Currently, Aurora has no legal advisor or corporate lawyer on its staff. Aurora is a regulated business with legal and compliance obligations that typically do not materially change from year to year, and which are not highly specialised. Aurora should be planning to achieve a material reduction in its annual legal costs by employing a legal staff member to undertake work that currently is outsourced.
We do not agree that Aurora should be charging consumers for service failure payments. Aside from the incentive effects associated with this, we consider that a business operating in a workably competitive market would be unable to recover from its customers the cost of such payments.
Lastly, Aurora has proposed an annual allowance of $0.5m in communications costs for RY19. We are unclear whether the RY19 communication costs that form the basis of this proposed allowance include some one-off costs associated with Aurora’s CPP application. For example, Aurora undertook customer research in 2018 that, amongst other things, appears to have helped inform Aurora’s engagement approach around its CPP application.308
Aurora has not applied any prioritisation to this expenditure programme It appears Aurora has not applied any prioritisation to this expenditure programme. We consider it is unlikely to be reasonable to prioritise any of the expenditure items listed in Table 2 in their entirety. However, it may be possible to prioritise a subset of expenditure within some of the items (eg, subscriptions, consumables, and other general expenses).
Recommendation Based on our review of Aurora’s proposed base year opex in the governance and administration expenditure programme, we recommend the base year amount of $2.9m be reduced by 15%.
The basis for the 15% is as follows:
• Remove $231,000 of service failure payments
• Remove $200,000 of legal fees—assume a corporate counsel could be employed for $160,000 who would be able to do approximately two thirds of the work currently outsourced by Aurora.
To the extent that an in-house corporate counsel cannot generate these savings, we consider there should be opportunity to realise savings in the $500,000 forecast for customer communications costs, to achieve the 15% saving.
306 Aurora Energy, 23 August 2020, Response to RFI No. Q056, p. 3. 307 Aurora Energy, 12 June 2020, Governance and administration portfolio overview document, p. 2. 308 Aurora Energy, 12 June 2020, Customised Price-Quality Path Consultation Report, p. 16.

Aurora CPP – review of forecast expenditure
163
12. BRIEFING REPORT 11 – Quality Reliability benefits
12.1. Introduction This briefing paper addresses questions from the Commission on the forecasts of unplanned SAIDI and SAIFI in Aurora’s CPP application.
12.2. Scope of work Aurora is not projecting an improvement in network unplanned reliability, even with the proposed increased expenditure on network asset upgrades. The Verifier noted the key reason for this is that, whilst the current high-risk assets are being targeted for replacement over the CPP and review periods, other assets will continue to reach their end of life.
Aurora has determined that its unplanned reliability would deteriorate under the ‘business as usual’ counterfactual and that increased network expenditure will hold the performance at recent levels rather than improve it.
The Commission wants to understand the validity of this position and test the sensitivity to the past and proposed investments in assets.
Scope of work This briefing report covers aspects of Aurora’s forecast reliability performance for unplanned SAIDI and SAIFI.
This briefing paper addresses the following requests from the Commission:
1. Examining the reliability benefits from Aurora’s recent and proposed expenditure provide an initial opinion on the extent to which expected asset reliability improvements from Aurora’s recent and proposed programmes and expenditure have been adequately reflected in Aurora’s unplanned SAIDI and SAIFI forecasts. This includes the following:
• recent and proposed network renewals, including pole replacements (e.g., as part of its fast track pole programme) and other network renewals such as crossarms and overhead conductors;
• proposed maintenance approach, shifting to focus on corrective and preventive maintenance;
• proposed replacement of zone substation equipment;
• proposed expenditure to improve the response and repair time to return supply to customers (e.g., 24/7 fault response dispatch service) and the step-up in people and system operations and network support (SONS) expenditure; and
• proposed vegetation management approach.
2. If Strata’s initial opinion identifies that future network reliability performance is likely to be different to that modelled by Aurora and the Verifier, establish:
• a counterfactual reliability forecast resulting from applying the DPP; and
• an alternative to Aurora’s forecast based on Strata’s opinions.

Aurora CPP – review of forecast expenditure
164
3. an opinion on the extent to which unplanned SAIDI and SAIFI can be expected to deteriorate further if Aurora were to reduce its expenditure significantly to levels more consistent with the DPP3 allowances:
• identify and explain how reliability (i.e., more frequent and/or longer outages) may deteriorate and compound over time.
4. consider if it is appropriate for Aurora's unplanned reliability model to be weighted to RY18 to RY20 performance rather than a longer period (e.g. RY14 to RY20, or the RY16 to RY20 DPP2 period), including:
• whether the choice of the RY18 - RY20 time period effects the relationship between the "pre-normalised" reliability forecasts and the normalised reliability forecasts in a way that materially differs to the relationship that would result from a longer historical period; and
• review the technique and process Aurora used to normalise its unplanned interruptions and provide a view on if this approach is reasonable and consistent with DPP3 methodology.
5. Review and provide advice on why recent, and proposed renewal programmes and operational expenditure will not begin to arrest Aurora's forecast worsening reliability performance until after the five-year CPP period.
6. Based on a review of Aurora's models, the Verification report and Strata’s findings on the above tasks, consider if Aurora's worsening reliability can be expected to improve (taking account of forecasting uncertainty and uncertainty regarding Aurora's future spending and its consumer preferences), describe the assumptions made to arrive at this view.
12.3. Aurora’s forecasting method provides context and background
The Commission’s requests require us to consider the reasonableness of Aurora’s proposed reliability levels against:
• past, current and forecast performance of Aurora’s network assets;
• changing expenditure levels (network capex and opex); and
• past, current and proposed network performance improvement initiatives.
To address the questions, we had to gain an understanding of how Aurora established its reliability performance projections including:
• the models used and how they turn input data and assumptions into outputs;
• how the input assumptions were formed, and the reliability of the input data and information used; and
• the sensitivity of the models to variations in input assumptions and if this sensitivity has been appropriately tested.
Accordingly, we have structured this briefing paper as follows:
• firstly, describe how Aurora has determined its forecast reliability levels;
• secondly, provide our assessment of Aurora’s approach; and
• thirdly, respond to the Commission’s questions.

Aurora CPP – review of forecast expenditure
165
12.4. Aurora’s reliability projection and how it was developed
Aurora has proposed the following reliability performance levels for the CPP period.
Unplanned Interruption Quality Standard SAIDI SAIFI
Unplanned limit 146.29 2.5067
Unplanned boundary value 5.69 0.0737
Unplanned interruption target 113.34 1.9948
Forecast average 110.33 1.9195
Scaled standard deviation 16.48 0.2560
In proposing the above Aurora noted that it accepted the SAIDI and customer minutes extreme event limits set out by the Commission in Schedule 3.3 of the DPP3 determination.
In support of its proposal Aurora states that:
While there is inherent uncertainty in forecasting future reliability performance, our analysis has concluded that the Commission’s DPP3 reliability standards for planned SAIDI and SAIFI are suitable for the CPP period RY22 - RY24. However, unplanned SAIDI and SAIFI require reliability standards that better reflect our circumstances and the price quality preferences of customers.309
Aurora also supported its proposal to not include investments directly targeting reliability improvement by stating that its customers had said that they accepted the current levels of service. Whilst recognising that the proposed investments would impact on reliability, this would be limited to stabilising performance rather than improving reliability.
Aurora considers that its proposed reliability standards for unplanned SAIDI and SAIFI minimise the cost impact on consumers whilst still ensuring a safe network that achieves the level of reliability identified during its consultation process.310
In setting the limits and targets for SAIDI and SAIFI Aurora’s objective is to address the historical trend of deteriorating performance and to maintain current levels of reliability. Aurora states311 that its assessment of appropriate limits and targets was informed by its reliability modelling.
12.5. Aurora’s reliability model for unplanned interruptions To form a forecast of future reliability performance (SAIDI and SAIFI), Aurora applied a composite of three different methods, these are:
1. Generalised Linear Model (GLM), which is a statistical model combining asset age and asset volume, supply interruption and ICP data to estimate a linear relationship between asset health and unplanned SAIFI;
2. three-year average, which is calculated and adjusted to fit a determined target; Aurora uses this approach to adjust average unplanned SAIFI and SAIDI attributed to vegetation from the RY18 – RY20 average to Aurora’s SAIFI target of 0.2 by RY24; and
3. three-year average which projects the average Unplanned SAIFI and SAIDI from RY18 – RY20 into future years.
309 Aurora Energy, 12 June 2020, Customised price-quality path application, page 23 310 Ibid, page 228 311 Ibid, page 226
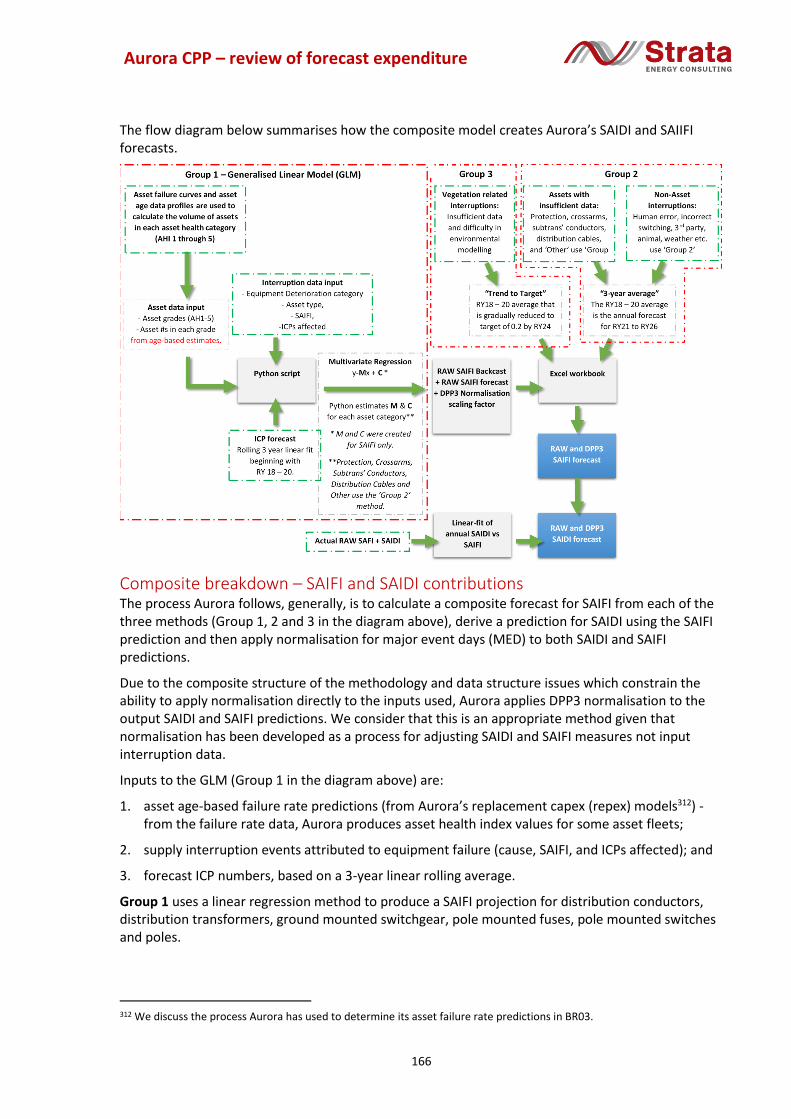
Aurora CPP – review of forecast expenditure
166
The flow diagram below summarises how the composite model creates Aurora’s SAIDI and SAIIFI forecasts.
Composite breakdown – SAIFI and SAIDI contributions The process Aurora follows, generally, is to calculate a composite forecast for SAIFI from each of the three methods (Group 1, 2 and 3 in the diagram above), derive a prediction for SAIDI using the SAIFI prediction and then apply normalisation for major event days (MED) to both SAIDI and SAIFI predictions.
Due to the composite structure of the methodology and data structure issues which constrain the ability to apply normalisation directly to the inputs used, Aurora applies DPP3 normalisation to the output SAIDI and SAIFI predictions. We consider that this is an appropriate method given that normalisation has been developed as a process for adjusting SAIDI and SAIFI measures not input interruption data.
Inputs to the GLM (Group 1 in the diagram above) are:
1. asset age-based failure rate predictions (from Aurora’s replacement capex (repex) models312) - from the failure rate data, Aurora produces asset health index values for some asset fleets;
2. supply interruption events attributed to equipment failure (cause, SAIFI, and ICPs affected); and
3. forecast ICP numbers, based on a 3-year linear rolling average.
Group 1 uses a linear regression method to produce a SAIFI projection for distribution conductors, distribution transformers, ground mounted switchgear, pole mounted fuses, pole mounted switches and poles.
312 We discuss the process Aurora has used to determine its asset failure rate predictions in BR03.

Aurora CPP – review of forecast expenditure
167
Group 2 covers vegetation related interruptions and uses a 3-year average to derive a SAIFI projection for vegetation. From RY 2024 the SAIFI values are reduced to 0.2 to reflect the expected effectiveness of Aurora’s current vegetation management strategy and the removal of legacy issues.
Group 3 uses a 3-year average to derive a SAIFI projection for a selection of assets and for non-asset interruptions, (e.g. third party damage, car vs pole accidents, possum on line etc.). The selection of assets in Group 3 is defined by Aurora as crossarms, distribution cables, protection systems, subtransmission conductors and other assets. For these assets, Aurora had insufficient information/data to apply the Group 1 GLM method.
Using an Excel workbook, Aurora combines the outputs from Group 1, Group 2 and Group 3 to produce a composite SAIFI projection. This projection is considered to be ‘raw’ SAIFI because it has been calculated from all interruption data and has not, at this point been normalised to reduce the effects of MED.
The modelled outputs are three SAIFI forecasts According to Aurora’s results, between 9% and 15% of its forecast SAIDI and SAIFI was predicted using the statistical GLM (Group 1) and between 85% and 91% was forecast based on the projected RY18 – RY20 average (Groups 2 and 3).
Where the 3-year average method was applied:
• between 13% and 22% of the predicted SAIFI can be attributed to asset failure; and
• between 55% and 61% of predicted SAIFI is attributable to non-asset categories, such as weather, third party interference, animals, wind, human error etc.
Aurora states that it has little control over contributors to these categories, which are therefore very difficult to model accurately. Due to this difficulty, Aurora believes that the most recent three years (RY18 – RY20) provide the best estimate for near future unplanned SAIDI and SAIFI.
Vegetation related predicted SAIFI comprises 9% to 16% of Aurora’s forecast. Aurora states that the results of the models it attempted to use for this were unreliable, but that its vegetation management strategy validated the proposed unplanned SAIFI and SAIDI levels.
The diagrams below provide a breakdown of Aurora’s forecast unplanned SAIDI and SAIFI into each of its composite model forecast methods, Groups 1, 2 and 3 (split for assets and non-assets). In summary, our analysis indicates that the proportions of SAIFI (and by implication SAIDI) determined by the three methods are:
1. 9% to 15% - GLM
2. 70% to 81% - average of the RY18 – RY20 SAIFI
a. 55% to 62% - Non-asset related interruptions
b. 13% to 21% - Asset related interruptions
3. 10% to 16% - average of the RY18 – RY20 plus targeted reduction in vegetation related interruptions from RY 2024.
Despite the relative complexity of the GLM modelled derivation of the projection, around 90% of the output is based on use of the 3-year average.

Aurora CPP – review of forecast expenditure
168
How Aurora converted the SAIFI projection to a SAIDI projection SAIDI was not modelled using the GLM or the 3-year average methods. To produce its prediction of future SAIDI, Aurora applied a linear regression to its composite SAIFI prediction. The chart below shows the relationship between Aurora’s disclosed raw SAIDI and SAIFI from 2011 to 2020. The individual values in the chart can be considered to have a linear relationship (e.g. higher/lower SAIFI coincides with higher/lower SAIDI).

Aurora CPP – review of forecast expenditure
169
Aurora states that SAIDI depends on additional parameters, (e.g. outage duration and restoration speed are affected by local network conditions, travel distance and topology), which were not recorded or extractable from the interruptions data. Accordingly, it was not possible to produce a sufficiently large sample size for use in a statistical model.
Aurora’s method assumes that the parameters (local network, location and topology) are implicit in the SAIFI prediction and that the recent (10-year) SAIDI:SAIFI ratios provide a stable indicator of the short term relationship between SAIDI and SAIFI, because the asset replacement volume is forecast to be a small percentage of the network.
Put simply, Aurora applied normalisation for MED to the outputs of its model rather than the inputs. Were Aurora to apply normalisation to the inputs, a choice would need to be made on which unplanned interruptions should be capped and the scale of the cap on each MED. However, this would only be used to produce normalised results from the GLM component of the composite model. For Group 2 and Group 3 model components, Aurora could have used the average of normalised historical data.
To normalise the outputs of its model, Aurora calculated the ratio of raw SAIFI and SAIDI to what the normalised SAIFI and SAIDI would have been under the DPP3 settings for 2011 through to 2020. Aurora then calculated the 10-year average, which it then used to create a scaling factor.
The scaling factor (0.72 for SAIDI and 0.83 for SAIFI) was applied as a multiplier to the relevant composite model outputs to produce a normalised prediction of future reliability.
The diagrams below show:
• Aurora's scaling factor (ratio of 'raw' SAIDI and SAIFI to normalised SAIDI and SAIFI under the DPP3 settings) for each regulatory year;
• the average of all scaling factors; and
• the standard Excel-generated linear trendline of all scaling factors.

Aurora CPP – review of forecast expenditure
170
The R2 value313 in the above charts indicates the amount of variance in the data output from the composite linear model. A higher R2 indicates that the linear output is a better fits to the input data. The basic Excel linear regression applied by Aurora has a low R2 value, this makes sense as the number and size of MED would vary significantly year-on-year.
Whilst it does not eliminate the credibility of the application of the linear regression, it shows caution should be taken when applying the result. Because of this we would have expected that Aurora would have undertaken sensitivity checks of its modelled outputs to a range of input assumptions, including its scaling factor.
Our answers to the Commission’s questions on Aurora’s modelling The Commission asked us to consider if it is appropriate for Aurora's unplanned reliability model to be weighted to RY18 to RY20 performance rather than a longer period (e.g. RY14 to RY20, or the RY16 to RY20 DPP2 period), including:
313 R: is the correlation between the input values and the predicted values. R2 is the coefficient of determination or the coefficient of multiple determinations for multiple regression.

Aurora CPP – review of forecast expenditure
171
• whether the choice of the RY18 - RY20 time period affects the relationship between the "pre-normalised" reliability forecasts and the normalised reliability forecasts in a way that materially differs from the relationship that would result from a longer historical period; and
• to review the technique and process Aurora used to normalise its unplanned interruptions and provide a view on the reasonableness of this approach and its consistency with DPP3 methodology.
We initially applied some sensitivity testing to Aurora’s proposed SAIDI and SAIFI levels by using alternative averaging and Aurora’s actual SAIDI and SAIFI normalised for MED in accordance with the DPP3 settings. The results are provided in the charts below.
The results indicate that Aurora’s composite model produces a prediction that is higher than the 3-year DPP3 normalised average and the 5 and 10-year DPP3 normalised averages. This is likely to be reflecting the GLM component of Aurora’s composite model indicating end of life issues due to the age-based asset health input, i.e. the model is forecasting increasing failure due to asset deterioration.
The profile of Aurora’s historical performance for SAIDI and SAIFI (see charts below) suggests a repeating four year pattern of deteriorating performance followed by a sharp improvement, followed by another three years of deterioration before another sharp correction. Whilst we could speculate on the reasons for this, it is beyond our scope to undertake detailed analysis. However, the fact that this pattern is present suggests that taking the three highest SAIDI and SAIFI years, as Aurora has done, as the basis for setting the limit would not reflect the historical trend and be likely to overstate future SAIDI and SAIFI.
0
20
40
60
80
100
120
2021 2022 2023 2024 2025 2026
Fore
cast
SA
IDI
SAIDI Forecast Scenarios
Aurora Composite Model 3 year DPP3 Normalised Average
5 year DPP3 Normalised Average 10 year DPP3 Normalised Average
0
0.5
1
1.5
2
2021 2022 2023 2024 2025 2026
Fore
cast
SA
IFI
SAIFI Forecast Scenarios
Aurora Composite Model 3 year DPP3 Normalised Average
5 year DPP3 Normalised Average 10 year DPP3 Normalised Average

Aurora CPP – review of forecast expenditure
172
In our opinion, Aurora’s choice of the average of the last three years is not appropriate. Taking a 4-year average would have captured both the most recent reliability of the network and historical trends in reliability performance.
We undertook additional sensitivity testing to better understand the impact of the use of 3 versus 4-year averages on the SAIDI and SAIFI projections. The following charts compare the results for Aurora’s 3-year average with the average for each of the 4-year periods aligned with the apparent upward ramping profile of unplanned interruptions.
0
50
100
150
200
250
2009 2010 2011 2012 2013 2014 2015 2016 2017 2018 2019 2020
SAIDI value - Unplanned Interruptions
LIGHTNING VEGETATION CAUSE UNKNOWN
WILDLIFE DEFECTIVE EQUIPMENT THIRD PARTY INTERFERENCE
HUMAN ERROR ADVERSE WEATHER ADVERSE ENVIRONMENT
0
1
1
2
2
3
3
2009 2010 2011 2012 2013 2014 2015 2016 2017 2018 2019 2020
SAIFI value - Unplanned Interruptions
LIGHTNING VEGETATION CAUSE UNKNOWN
WILDLIFE DEFECTIVE EQUIPMENT THIRD PARTY INTERFERENCE
HUMAN ERROR ADVERSE WEATHER ADVERSE ENVIRONMENT

Aurora CPP – review of forecast expenditure
173
The above charts indicate that in all cases the 4-year average returns a lower prediction to that of Aurora’s 3-year average.
We have concluded that it is not appropriate for Aurora's unplanned reliability model to be to use the RY18 to RY20 3-year unplanned interruption performance because:
• it has a bias towards over estimating the output prediction; and
• it is not aligned with the historical profiles observed for both SAIDI and SAIFI.
We consider that a 4-year average is more appropriate as it is better aligned with the SAIDI and SAIFI long term profiles.
The Commission also asked that we review the technique and process Aurora used to normalise its unplanned interruptions and provide a view on whether this approach is reasonable and consistent with the DPP3 methodology.
As we described previously, Aurora applied DPP3 normalisation to its historical raw SAIFI and SAIDI. Aurora then determined a scaling factor to be the 10-year average of the annual ratio between the raw data and the normalised data for both SAIDI and SAIFI. This resulted in scaling factors of 0.72 for SAIDI and 0.83 for SAIFI. The scaling factor was then applied to the predictions from the composite model to determine a DPP3 normalised prediction for SAIDI and SAIFI.
In our opinion, the need to determine and apply a scaling factor adds a further degree of uncertainty to the outputs of Aurora’s composite model. As we have seen, the yearly ratios, especially for SAIDI, can be quite variable. This is understandable due to the variability in MED occurrences.
0
20
40
60
80
100
120
2021 2022 2023 2024 2025 2026
Fore
cast
SA
IDI
SAIDI Forecast Scenarios
Aurora Composite Model 4 year (RY17 - 20) DPP3 Normalised Average
4 year (RY14 - 17) DPP3 Normalised Average 4 year (RY11 - 14) DPP3 Normalised Average
0
0.5
1
1.5
2
2021 2022 2023 2024 2025 2026
Fore
cast
SA
IFI
SAIFI Forecast Scenarios
Aurora Composite Model 4 year (RY17 - 20) DPP3 Normalised Average
4 year (RY14 - 17) DPP3 Normalised Average 4 year (RY11 - 14) DPP3 Normalised Average

Aurora CPP – review of forecast expenditure
174
However, by taking the modelling approach that it did, Aurora had to produce a DPP3 normalised output. Combining this with a 10-year average ratio will have eliminated some of the variability in the outputs of Aurora’s composite model. Accordingly we consider that:
1 Aurora’s technique and process used to normalise its unplanned interruptions was reasonable given the structure of its composite model; and
2 the scaling approach that Aurora has applied is consistent with the DPP3 methodology.
12.6. Our assessment of Aurora’s method for setting reliability levels
Aurora used a basic linear projection to form its SAIFI and SAIDI projections. The relatively minor proportion of the forecast derived from the more complex GLM had negligible effect on the final prediction.
Aurora’s derivation of SAIDI from SAIFI implies that there is a reasonably consistent link between the two performance measures. Aurora’s interruption data indicates that this relationship is not consistent. This is because the causes of the frequency of outages can be quite different from those that cause the duration of outages. For example, a single transformer fault can cause a long duration for a single event, yet a high wind event can cause several short duration interruptions.
The use of a 10-year average can to some extent reduce the implications of relationship variability. However, given that around 90% of the SAIFI projection is based on a simple 3-year average, it is not clear why Aurora did not calculate a simple 3-year average for its SAIDI projection, rather than using a SAIFI/SAIDI ratio.
Aurora described its modelling as a bespoke approach reflecting many important parameters of its network performance and assets:
we have developed a model that reflects our unique situation. The model uses detailed analysis of historical performance data and better reflects the current condition and performance of the network. It also accounts for the capital and operational plans proposed for the CPP period.314
Aurora’s description of its modelling suggests detailed and complex analysis of good quality data, utilising sensitivity and scenario analysis to test the outputs for varying levels of capital expenditure.
In our opinion, Aurora’s modelling falls significantly short of the description provided in its CPP application. Its outputs are predominantly derived from basic linear trend analysis of historical performance. There is no explicit consideration of proposed capital investments, changes in management actions and practices, and changes in maintenance practices.
We observed only one adjustment to account for more recent measures taken by Aurora to improve its reliability performance - this is the adjustment to vegetation related SAIFI (and by derivation SAIDI) from 2024.
There is no evidence that Aurora’s models and method took into account changes in its expenditure (both capex and opex) or changes in asset management practices:
• that had occurred over the 3-year and 10-year averaging periods; and
• changes planned between 2020 and 2026.
314 Aurora Energy, 12 June 2020, Customised price-quality path application, p. 231.

Aurora CPP – review of forecast expenditure
175
There is no evidence that Aurora undertook sensitivity testing of its method and models to variations in input assumptions.
During our discussion with Aurora on the 17 August 2020, we asked what sensitivity analysis had been undertaken. Aurora’s response was that it had not undertaken sensitivity analysis and that developing a counterfactual or other scenario would have necessitated too much work and too many resources. We agree that this might have been the case for the GLM component but not for the 90% of the forecast that was based on simple averages.
Because Aurora has not benchmarked its reliability projections against a counterfactual, it cannot use its SAIFI/SAIDI prediction method to support a claim that expenditure lower than that which it has proposed would result in worse performance. Whilst such a claim may seem intuitively correct, Aurora has not used its models to produce a quantified forecast of what this is likely to be.
In our opinion, developing a supported counterfactual based on the DPP3 capex and opex allowances would have been valuable in demonstrating the impact of the proposed uplift in capex, opex and management actions on reliability performance. Similarly, Aurora’s modelled prediction should have, but did not, include an adjustment to account for increased or decreased capex, opex and management actions prior to and during the prediction timeframe.
12.7. Our opinions related to the Commission’s questions on Aurora’s model
The Commission asked us to provide an initial opinion on the extent to which expected asset reliability improvements from Aurora’s recent and proposed programmes and network expenditure have been adequately reflected in Aurora’s unplanned SAIDI and SAIFI forecasts. Our opinions are stated below.
1. The GLM Group 1 component will implicitly include some benefits attributable to asset replacements made prior to and during 2020 and also through the prediction timeframe. This is because the age, and therefore assumed health index, will reflect the replacement programmes.
2. The GLM Group 1 component does not account for any improvements in opex, including for preventive and corrective maintenance.
3. The Group 2 3-year averaging for vegetation related SAIFI (and the derived SAIDI) will include realised benefits from improvements in vegetation management opex and capex prior to and during the 3-year period. However, these will be understated in the prediction as the full benefits of investment occur in the later part of the 3-year period and will not have been fully seen in the actual SAIFI and SAIDI results.
4. Aurora’s adjustment of SAIFI and SAIDI from 2024 to reflect its new vegetation management is appropriate but the adjustments should have been ramped downwards from 2020 to reflect the recent past improvements and the gradual application of the new vegetation management strategy.
5. The Group 3 basic 3-year averaging will implicitly include some benefits of investments made prior to and during the 3-year averaging period - including capex, opex and management actions.
6. Aurora’s Group 3 basic 3-year averaging does not include benefits of increased capex, opex and management actions made after 2020.

Aurora CPP – review of forecast expenditure
176
Our opinions on the extent to which expected asset reliability improvements have been adequately reflected in Aurora’s unplanned SAIDI and SAIFI forecasts. We have considered the recent and proposed network renewals, including pole replacements, (e.g. as part of Aurora’s fast track pole programme) and other network renewals such as crossarms and overhead conductors. We have also considered reliability investments that may be attributable to the proposed replacement of zone substation equipment.
In addition, we have considered the potential reliability benefits of proposed maintenance with increased focus and investment in corrective and preventive maintenance; the initiative to improve the response and repair time to return supply to customers; and the increase in people and SONS expenditure.
We have also considered proposed improvements in vegetation management undertaken by Aurora since 2018 and the likely impact of the proposed next tranche of vegetation management improvements.
The chart below provides a perspective on Aurora’s changing and increasing investment in its existing network assets, vegetation management and total network opex.
Since RY2017, there has been an increase in network capex expenditure of more than 200%; this is due primarily to the replacement of assets in poor health, (i.e. older age and/or identified deteriorated condition). It will also include the targeted replacements of assets with identified safety issues.
A material increase in vegetation management expenditure has also occurred and will continue to be held at elevated levels until 2023. This indicates that a strategy to address vegetation issues commenced in at least 2017. The strategy is now at a mid-point and will continue into the commencement of the CPP period. Whilst Aurora has signalled changes will be made to the existing strategy, the level of investment will continue to be maintained at current levels. Aurora considers that the gains from the increased expenditure reduced the contribution to SAIDI and SAIDI, but this has now plateaued.
When proposing its SAIDI and SAIFI levels, Aurora set its vegetation SAIFI target to 0.2 from RY24. Aurora adjusts its current actual SAIFI and SAIDI for vegetation related interruptions in its composite model.
Aurora’s unplanned SAIFI indicates that the lower levels of historical investment could have been a contributing factor to the apparent increase in SAIFI since RY2016. The chart below shows that the
-
1,000,000
2,000,000
3,000,000
4,000,000
5,000,000
6,000,000
7,000,000
-
10,000,000
20,000,000
30,000,000
40,000,000
50,000,000
60,000,000
70,000,000
RY15 RY16 RY17 RY18 RY19 RY20 RY21 RY22 RY23 RY24 RY25 RY26 RY27 RY28 RY29 RY30
Network capex and network opex
Renewals Network opex Vegetation
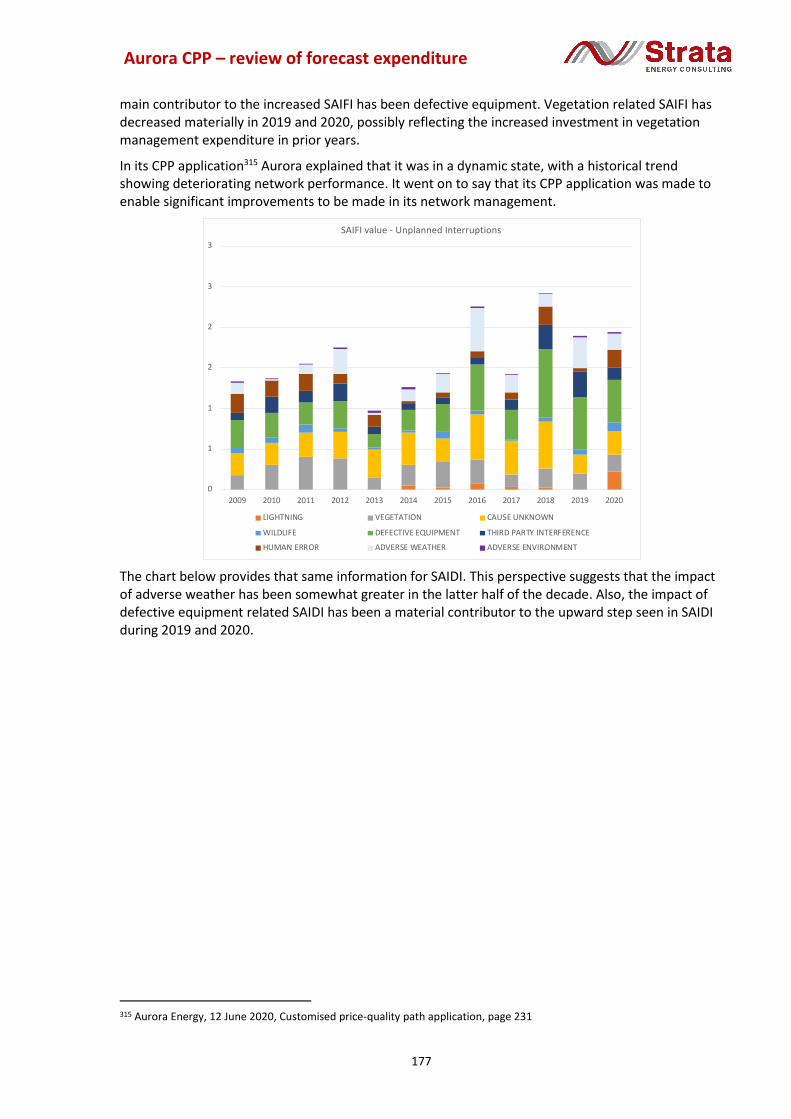
Aurora CPP – review of forecast expenditure
177
main contributor to the increased SAIFI has been defective equipment. Vegetation related SAIFI has decreased materially in 2019 and 2020, possibly reflecting the increased investment in vegetation management expenditure in prior years.
In its CPP application315 Aurora explained that it was in a dynamic state, with a historical trend showing deteriorating network performance. It went on to say that its CPP application was made to enable significant improvements to be made in its network management.
The chart below provides that same information for SAIDI. This perspective suggests that the impact of adverse weather has been somewhat greater in the latter half of the decade. Also, the impact of defective equipment related SAIDI has been a material contributor to the upward step seen in SAIDI during 2019 and 2020.
315 Aurora Energy, 12 June 2020, Customised price-quality path application, page 231
0
1
1
2
2
3
3
2009 2010 2011 2012 2013 2014 2015 2016 2017 2018 2019 2020
SAIFI value - Unplanned Interruptions
LIGHTNING VEGETATION CAUSE UNKNOWN
WILDLIFE DEFECTIVE EQUIPMENT THIRD PARTY INTERFERENCE
HUMAN ERROR ADVERSE WEATHER ADVERSE ENVIRONMENT

Aurora CPP – review of forecast expenditure
178
The following chart could be interpreted as suggesting that increasing asset replacement expenditure leads to increasing unplanned interruptions. However, we know that there is a lag between the replacement of assets and the impact on reliability. This is because most programmes are rolled out over time and are not able to specifically target individual assets that will fail. However, over time the replacement programme will improve the level of network performance so that it is higher than that it would have been.
The chart above shows the significant increase in network replacement expenditure from the 2015 level. In our opinion, it would be reasonable to conclude that the recent and proposed network expenditure will improve the reliability performance of the network. The impact apparently made by the increased repex seen between 2018 and 2020 suggests that the increased expenditure did reduce equipment failure incidents. However, we have no way of knowing this for sure.
We note that Aurora’s proposed change in preventive and corrective maintenance and vegetation management is targeted at improving reliability without a material uplift in network opex. We imply from this that Aurora considers an increase in opex is not necessary to maintain reliability.
Assuming that the proposed expenditure is applied appropriately, the continuing high level of network repex over the coming decade will have a major impact on improving reliability. Establishing
0
50
100
150
200
250
2009 2010 2011 2012 2013 2014 2015 2016 2017 2018 2019 2020
SAIDI value - Unplanned Interruptions
LIGHTNING VEGETATION CAUSE UNKNOWN
WILDLIFE DEFECTIVE EQUIPMENT THIRD PARTY INTERFERENCE
HUMAN ERROR ADVERSE WEATHER ADVERSE ENVIRONMENT
$0
$10,000,000
$20,000,000
$30,000,000
$40,000,000
$50,000,000
$60,000,000
$70,000,000
0
0.1
0.2
0.3
0.4
0.5
0.6
0.7
0.8
0.9
2009 2010 2011 2012 2013 2014 2015 2016 2017 2018 2019 2020 2021 2022 2023 2024 2025 2026 2027 2028 2029 2030
SAIF
I
Network repex vs defective equipment interruptions
Outages due to Defective Equipment Nework Repex Network opex

Aurora CPP – review of forecast expenditure
179
views on the speed at which this will have an effect, and the changes in the underlying reliability of the network (e.g. due to deteriorating asset health) are critical to determining if Aurora’s modelling of SAIDI and SAIFI has sufficiently accounted for the increased levels of investment.
Aurora’s view is that unplanned reliability will stabilise rather than improve further:
Under our proposed plan, we forecast unplanned reliability to stabilise as a result of our replacing ageing poles and overhead lines, our modelling of non-asset related outages and the impact of our proposed expenditure in relation to vegetation management.
Aurora’s repex modelling has supported its view by indicating that the ageing assets will begin to experience increasing failures related to end of asset life. The impact of this is passed onto the SAIDI and SAIFI modelling through the age-based asset health index derived from the repex models.
However, the only component of the SAIDI and SAIFI composite model relying on inputs from the repex models is the Group 1 GLM, which contributes between 9% and 15% of the reliability predictions. Therefore, between 85% and 91% of the modelled prediction does not consider the impact that recent and future network investment and management actions will have on performance.
In our opinion, Aurora’s unplanned SAIDI and SAIFI forecasts have not adequately reflected expected asset reliability improvements because:
1 as we have advised the Commission in Briefing Paper BR03 Repex Part 1, the age-based asset health index is likely to be overstating the increasing deterioration and failure rates of the assets; these values are used as inputs to Group 1 calculations, so the outputs from the GLM are also likely to be overstated;
2 the considerable network repex proposed for 2021 to 2026 must have a positive impact on network performance; yet the 3-year historical back cast approach to SAIDI and SAIFI forecasting makes no adjustment for this;
3 Aurora’s assumption that vegetation interruptions have stabilised is not reflected in the three-year average back cast because any stabilisation is only likely to have occurred within the last two years, and there is no basis on which to assume that future activities will not make further gains until 2024; and
4 the recent strengthening of Aurora’s overhead network will have increased its resilience to adverse weather events; however, the modelling contains no adjustment to reflect this.
If network performance will improve The Commission asked us to consider if, based on our review of Aurora's models and the Verifier’s report, Aurora's worsening reliability can be expected to improve (taking account of forecasting uncertainty and uncertainty regarding Aurora's future spending and its consumer preferences).
In the previous subsection we discussed the linkages between network expenditure and performance. We also concluded Aurora’s view that the proposed expenditure would only stabilise, rather than improve network reliability, was likely to be incorrect. In our judgement, the material increases in asset replacement capex and the proposed improvements in network management and operations (particularly SONS) will lift network performance above historical levels.
We do however agree with Aurora that the primary effect will be to address the declining trend in network performance apparent since 2013.
Aurora maintains its view that its proposed investment is targeted at addressing safety rather than reliability. We accept this, however, deterioration in reliability often occurs before safety issues emerge, and so addressing safety also improves reliability. This will be the case with Aurora’s
Aurora CPP – review of forecast expenditure
180
proposed asset replacements because Aurora has formed replacement programmes for several asset fleets on the basis of its repex models, which prioritise a replacement programme based on asset age/health.
Aurora uses asset health indicators to determine a ‘before and after’ health index for each of its asset fleets. The health index values are predominantly age-based with an assumed rate of decline in asset condition as an asset moves towards and beyond its end of life. In our briefing reports BR03 and BR04 we provide assessments of the models for several asset fleets. We formed a view that Aurora’s age-based models are likely to be overstating the deterioration rate of Aurora’s network assets, meaning the health of assets would be expected to be better than in Aurora’s health index charts.
The link between increased expenditure and improved network reliability is unlikely to be coincident. For several reasons increased asset replacements may not result in immediate improvements in performance. An example is when the asset replacement programme is not optimal, with poor performing assets remaining in service. Another example is when expenditure on one part of a network does not remove the performance risks associated with all assets on that part of the network—assets that have not received expenditure can fail and impact on that part of the network.
Also, when expenditure is made on an asset that is essential to maintain supply (i.e. there is no alternative route to supply consumers), the replacement will result in an immediate improvement whereas replacement of an asset which is not essential will not result in an immediate performance improvement but will reduce the risks to performance over the longer term.
Aurora’s proposed expenditure for several asset fleets is age-based. If Aurora applies good electricity industry practice asset management when carrying out the replacement programmes, it will prioritise replacements on the condition actually observed as the programme is rolled out. In other words, Aurora will not replace assets that are in reasonable health. This will lift the post investment asset health to a higher/better overall condition than indicated by Aurora’s age-based health index.
Accordingly, our opinion is that:
• we agree with Aurora and the Verifier that the investment proposed in the CPPO application should stabilise the declining trend in network performance;
• the substantial increased investment proposed in the CPP application is likely to continue to improve the network performance seen between 2018 to 2020; and
• prioritising the expenditure during the replacement roll-out will result in a better asset health outcome than is predicted by Aurora’s age-based asset health indexes.
If network performance would deteriorate further if Aurora were to reduce its expenditure significantly The Commission asked us to provide an opinion on the extent to which unplanned SAIDI and SAIFI can be expected to deteriorate further if Aurora’s expenditure were to be at a level more consistent with the DPP3 allowance.
Our briefing reports BR03 and BR04 provide our opinions on Aurora’s proposed repex for some network asset fleets. Whilst we concluded that Aurora’s proposed asset replacement expenditure was higher than necessary, we did not recommend significant reductions.
The primary reasons why we accepted the need for the proposed uplift in asset replacements were that:
• the proposed expenditure targeted assets that were at the end of expected life and be likely to experience increasing failures in future years;
• some assets had legacy issues, including safety hazards, that were appropriate to prioritise;

Aurora CPP – review of forecast expenditure
181
• the historical backlog in replacements for some asset fleets needs addressing.
The Verifier also accepted the need for the proposed expenditure on other asset fleets for similar reasons.
Therefore, significantly reducing expenditure would be expected to have a material impact on future network performance. For an older network such as Aurora’s, significantly reducing expenditure would result in an increasing level of age-based deterioration. For assets at and beyond expected life, the asset failure rate tends to increase exponentially. Therefore, declining network performance would be expected to follow a path of reduced expenditure, with network deterioration accelerating over time.
In summary, in our opinion the proposed significant increase in expenditure and the introduction of improved network, systems and vegetation management will stabilise the decline in reliability performance and, if applied on a prioritised basis, will lead to the network’s recent performance improvement continuing.
If future network reliability performance is likely to be different to that modelled by Aurora and the Verifier In our opinion future network reliability performance is likely to differ from that modelled by Aurora and the Verifier, because modelling very rarely perfectly represents the future. The usual method of managing variability between a model’s predictions of the future and reality is to test the sensitivity of the model to changes in primary inputs and assumptions. Sensitivity analysis will produce a range of possible future outcomes. The most likely outcome can be determined by sophisticated statistical analysis or using experience, knowledge, and common sense.
During the 17 August 2020 meeting, Aurora confirmed our conclusion that it had not applied sensitivity testing to its modelled outputs. Specifically, Aurora said it had used the predictions from its model as its reliability forecast without considering further predictions that used different primary inputs or assumptions. Because of the lack of evidence of a rigorous review and challenge of the modelled outputs, we consider that there is a higher probability that the actual network performance could be materially different to that modelled.
As we have discussed in previous sections of this paper, our opinion is that Aurora’s model has a bias towards a conservative view of the network reliability improvement likely to occur under the CPP application. The reasons for our opinion include:
• the age-based derived asset health index is likely to overstate asset deterioration;
• the condition and risk based prioritisation during implementation will lead to performance improvements additional to those considered in Aurora’s modelling; and
• Aurora and the Verifier did not included adjustments to the modelled outputs to specifically recognise the introduction of improved operational management.
The Verifier identified issues with Aurora’s modelling In its report,316 the Verifier concluded that Aurora’s proposed unplanned SAIDI and SAIFI was overstated and that the DPP3 targets for unplanned reliability were too low. In addition, the Verifier identified several issues that it recommended the Commission consider. These issues included:
• that the net effect of the proposed capex and opex will lead to arresting the past increases in unplanned pre-normalised SAIDI and SAIFI;
• whilst acknowledging other factors such as ageing assets, reliability benefits following completion of the work should be realised as work programmes are rolled out;
316 Farrierswier and GHD - Final Aurora CPP Verification Report, page 39 and Appendix E

Aurora CPP – review of forecast expenditure
182
• Aurora’s increased focus on corrective and preventive maintenance that should result in reliability benefits;
• a 24/7 fault response dispatch service should reduce fault restoration times after hours. This expenditure should therefore lead to improved reliability relative to current levels;
• Aurora’s proposed vegetation management approach should reduce the number of unplanned outages due to vegetation, noting that unplanned SAIFI has not resulted in decreasing SAIDI for vegetation related events;
• Aurora’s modelling appears to overstate target unplanned SAIDI and more so unplanned SAIFI, when compared to the Verifier’s alternative forecasts; and
• Aurora's modelling uses regression analysis, which places significant weight on data from the last three years (RY18 to RY20).
The Verifier concluded that the predicted normalised unplanned reliability should be:
• 106.1 minutes per year for normalised unplanned SAIDI over the CPP period – compared to 110.7 proposed by Aurora; and
• 1.70 interruptions for normalised unplanned SAIFI outages – compared to 1.94 proposed by Aurora.
The above values are the normalised SAIDI and SAIFI forecasts. The Verifier did not provide its views on the targets and limits that are derived from these values.
The issues identified by the Verifier align with the issues that we have identified, considered and addressed through our detailed reviewed of Aurora’s modelling.
We have considered the Verifier’s alternative forecasting model at a high level and concluded that it provides an alternative reference point. However, we think that the value of the alternative model is lower than it could be, for two reasons. Firstly, it draws from the same asset end-of-life failure rate data curve that Aurora uses to develop asset health index values as inputs to its GLM. As we discuss frequently in this paper, the GLM is used for a relatively small proportion of the forecast. Secondly, for the majority of the forecast, the Verifier adopts the same 3-year averaging approach as Aurora.
We have taken a different approach to the Verifier, by not constructing an alternative model. Our approach has been to use Aurora’s model and apply sensitivity testing for a reasonable range of input assumptions. We have also applied a top-down review, which compensated for assumptions that are not easily adjustable as inputs to the model.
12.8. Strata’s alternative input assumptions applied to Aurora’s model
The Commission asked that if our initial opinion was that future network reliability performance is likely to be different to that modelled by Aurora and the Verifier, we should establish:
• a counterfactual reliability forecast resulting from applying the DPP3 settings; and
• an alternative to Aurora’s forecast based on Strata’s opinions.
As we have concluded that future network reliability performance is likely to be different to that modelled by Aurora and the Verifier, we have developed alternative forecasts.
In our opinion, Aurora’s model provides the better basis for constructing an alternative forecast because it is more detailed, has some connection with its expenditure forecast, and has input assumptions that can be revised. It also makes comparison of our adjustments with Aurora’s modelling easier.

Aurora CPP – review of forecast expenditure
183
Based on our assessment of Aurora’s model and its input assumptions we have concluded that the forecast would be more likely to reflect the future position if:
• a 4-year average of historical SAIFI was applied in the Group 2 and Group 3 models rather than a 3-year average;
• an adjustment was made to reflect the bias due to use of age-based asset health index in the GLM Group 1 model;
• an adjustment was made to reflect the reductions in interruption duration due to improved fault response and operational management; and
• an adjustment was made to reflect the increased focus on preventive and corrective maintenance.
Bottom-up adjustments to input assumptions We have applied the following adjustment to the input assumptions used by Aurora’s in its model.
Group 2 and Group 3 adjustment: Previously, we presented the results of our sensitivity testing of the Group 2 and Group 3 models to the historical averaging period. We concluded that using the most recent 4-years would better reflect the historical profile of both SAIFI and SAIDI.
Top-down adjustments to Aurora’s modelling We have applied the following top-down adjustments to the reliability performance output from Aurora’s modelling.
Group 1 model asset age-based health index bias: We consider that the age-based health index values that are inputs to the GLS model should be adjusted for a bias towards overestimating asset condition deterioration. We believe an appropriate adjustment could be as much as minus 20%, based on knowledge of how other distributors in New Zealand and Australia have applied condition-based risk management (CBRM) practices. Given Aurora’s asset management maturity, we consider that a more modest minus 5% adjustment is appropriate. This adjustment relates only to the 9% - 15% of the SAIFI (and derived SAIDI) predictions based on the GLC output. Because of this, our suggested adjustment makes only a minor adjustment to the SAIDI and SAIFI projections.
Improved fault response and operational management; We consider that Aurora can reduce its unplanned SAIDI through the proposed improvements in its fault response and network operational management. Over time, the impact of these initiatives will be material. Based on the information Aurora has provided, we consider that the benefits from these initiatives will begin to emerge at the commencement of the CPP and grow as the CPP progresses.
It is difficult to establish a fully supported value for an adjustment, so we recommend that the adjustment be conservative. Taking into consideration the reliability benefits that Aurora attributes to the increased people and SONS opex, the refocussed operations strategy, and initiatives in vegetation management, we have concluded that an adjustment to the predicted SAIDI only of minus 1% in 2022 rising to minus 5% in 2026 is appropriate.
Increased focus on preventive and corrective maintenance: We consider that Aurora’s strategy to increase corrective and preventive maintenance will reduce the requirement for reactive maintenance and asset replacement resulting from failure. It will also reduce SAIFI.
Establishing a fully supported value for an adjustment is difficult for this reliability benefit because the linkages between maintenance activity and reliability are not directly measured and reported. Therefore, any adjustment should be conservative. Given the benefits identified by Aurora when supporting its proposed maintenance opex, in its asset management plan (AMP) and the experience of other EDBs (recorded in their AMPs and other documents), we consider that an adjustment to the predicted SAIFI only of minus 1% in 2022 rising to minus 5% in 2026 is appropriate.
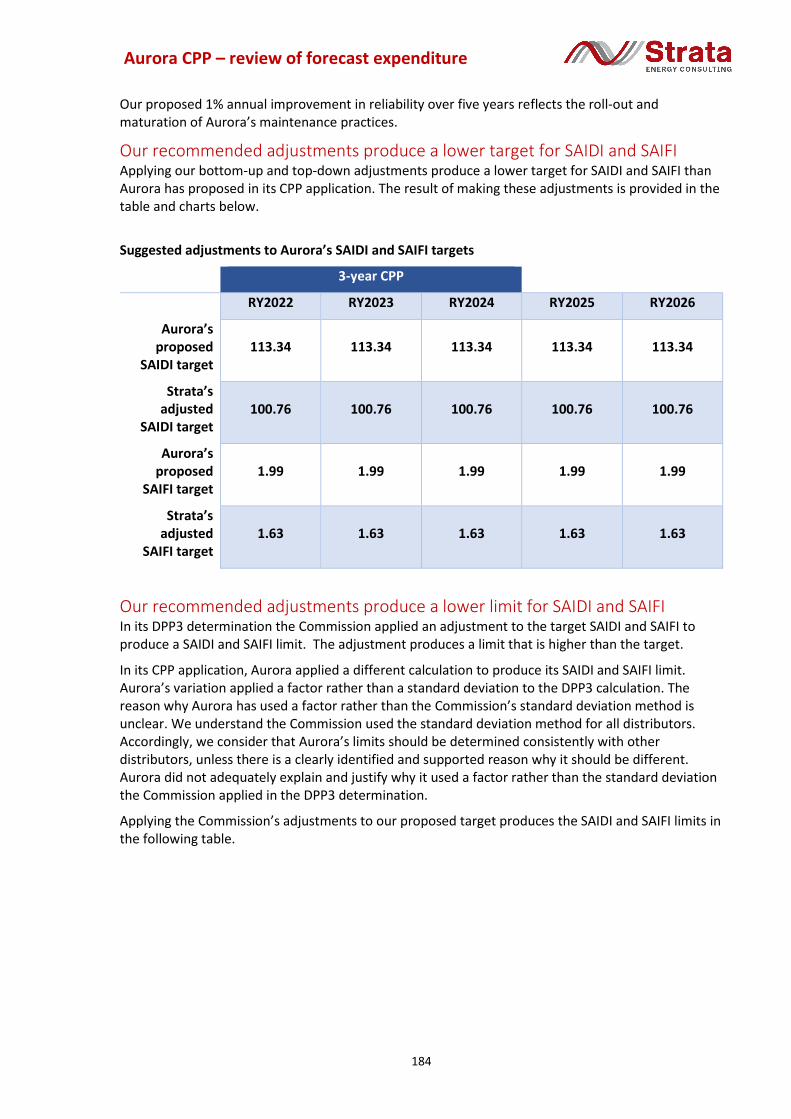
Aurora CPP – review of forecast expenditure
184
Our proposed 1% annual improvement in reliability over five years reflects the roll-out and maturation of Aurora’s maintenance practices.
Our recommended adjustments produce a lower target for SAIDI and SAIFI Applying our bottom-up and top-down adjustments produce a lower target for SAIDI and SAIFI than Aurora has proposed in its CPP application. The result of making these adjustments is provided in the table and charts below.
Suggested adjustments to Aurora’s SAIDI and SAIFI targets
3-year CPP
RY2022 RY2023 RY2024 RY2025 RY2026
Aurora’s proposed
SAIDI target 113.34 113.34 113.34 113.34 113.34
Strata’s adjusted
SAIDI target 100.76 100.76 100.76 100.76 100.76
Aurora’s proposed
SAIFI target 1.99 1.99 1.99 1.99 1.99
Strata’s adjusted
SAIFI target 1.63 1.63 1.63 1.63 1.63
Our recommended adjustments produce a lower limit for SAIDI and SAIFI In its DPP3 determination the Commission applied an adjustment to the target SAIDI and SAIFI to produce a SAIDI and SAIFI limit. The adjustment produces a limit that is higher than the target.
In its CPP application, Aurora applied a different calculation to produce its SAIDI and SAIFI limit. Aurora’s variation applied a factor rather than a standard deviation to the DPP3 calculation. The reason why Aurora has used a factor rather than the Commission’s standard deviation method is unclear. We understand the Commission used the standard deviation method for all distributors. Accordingly, we consider that Aurora’s limits should be determined consistently with other distributors, unless there is a clearly identified and supported reason why it should be different. Aurora did not adequately explain and justify why it used a factor rather than the standard deviation the Commission applied in the DPP3 determination.
Applying the Commission’s adjustments to our proposed target produces the SAIDI and SAIFI limits in the following table.

Aurora CPP – review of forecast expenditure
185
Suggested adjustments to Aurora’s SAIDI and SAIFI limits
3-year CPP
RY2022 RY2023 RY2024 RY2025 RY2026
Aurora’s proposed
SAIDI limit 143.37 143.37 143.37 143.37 143.37
Strata’s adjusted
SAIDI limit 119.21 119.21 119.21 119.21 119.21
Aurora’s proposed
SAIFI limit 2.26 2.26 2.26 2.26 2.26
Strata’s adjusted
SAIFI limit 1.93 1.93 1.93 1.93 1.93
The charts below compare our suggested adjustments against Aurora’s proposed targets and limits for SAIDI and SAIFI.
0
20
40
60
80
100
120
140
160
2021 2022 2023 2024 2025 2026
Fore
cast
SA
IDI
SAIDI Forecast Scenarios
Aurora's Composite Model Aurora's proposed Target Aurora's proposed Limit
Strata's adjusted composite model Strata's Proposed Target Strata's Proposed Limit

Aurora CPP – review of forecast expenditure
186
The Commission may consider a lower level of adjustment Taking an overarching view of Aurora’s CPP application, the Commission may conclude that a lower level of adjustment to Aurora’s reliability limits is appropriate. For example, a decision to reduce network repex and/or network capex below that proposed by Aurora may be viewed as offsetting some or all of the top-down adjustments Strata has proposed.
We consider it would not be appropriate to reduce our suggested bottom-up adjustment (a 4-year historical averaging period) to account for a reduction in network capex and/or network opex. This is because our bottom-up adjustment relates to an input assumption that, in turn, is not directly related to expenditure.
In the following charts, we have removed our bottom-up adjustment to demonstrate the impact this would have. The change in the SAIDA and SAIFI limits by removing this adjustment is minimal.
0
0.5
1
1.5
2
2.5
2021 2022 2023 2024 2025 2026
Fore
cast
SA
IFI
SAIFI Forecast Scenarios
Aurora's Composite Model Strata's adjusted composite model Aurora's proposed Target
Aurora's proposed Limit Strata's Proposed Target Strata's Proposed Limit
0
20
40
60
80
100
120
140
160
2021 2022 2023 2024 2025 2026
Fore
cast
SA
IDI
SAIDI Forecast Scenarios
Aurora's Composite Model Aurora's proposed Target Aurora's proposed Limit
Strata's adjusted composite model Strata's Proposed Target Strata's Proposed Limit

Aurora CPP – review of forecast expenditure
187
The Commission may consider changing the normalising factor We have considered whether the normalising factor Aurora applied to the outputs of its composite model should have been calculated using a 3-year average instead of a 10-year average. This is because Aurora assumed a 3-year average in its Group 1 and Group 2 input assumptions.
We have concluded that the use of a 10-year average was more likely to represent the expected impact of MEDs than would the use of a shorter averaging period. However, it could be argued that the averaging periods for the Group 2 and Group 3 historical interruptions input assumptions should have used 10-year averaging.
We conclude that the differences can be accepted, because the averaging of interruption data over three years should better reflect the effects of the backlog of network investment and the increasing interruptions attributable to age-based deterioration. However, we note a 10-year average may better reflect the probable non-network asset performance.
In the following charts, we have used 4-year averaging to set the normalisation factor, to demonstrate the difference that this makes to Strata’s adjusted target and limit positions.
0
0.5
1
1.5
2
2.5
2021 2022 2023 2024 2025 2026
Fore
cast
SA
IFI
SAIFI Forecast Scenarios
Aurora's Composite Model Strata's adjusted composite model Aurora's proposed Target
Aurora's proposed Limit Strata's Proposed Target Strata's Proposed Limit

Aurora CPP – review of forecast expenditure
188
0
20
40
60
80
100
120
140
160
2021 2022 2023 2024 2025 2026
Fore
cast
SA
IDI
SAIDI Forecast Scenarios
Aurora's Composite Model Aurora's proposed Target Aurora's proposed Limit
Strata's adjusted composite model Strata's Proposed Target Strata's Proposed Limit
0
0.5
1
1.5
2
2.5
2021 2022 2023 2024 2025 2026
Fore
cast
SA
IFI
SAIFI Forecast Scenarios
Aurora's Composite Model Strata's adjusted composite model Aurora's proposed Target
Aurora's proposed Limit Strata's Proposed Target Strata's Proposed Limit

Aurora CPP – review of forecast expenditure
189
12.9. Summary of key points from our assessment The following is a summary of the key points from our assessment of Aurora’s reliability modelling and Aurora’s proposed CPP period targets and limits for SAIDI and SAIFI.
1. We consider that how Aurora determined its proposed reliability targets and limits is inconsistent with its explanation that its proposed SAIDI and SAIFI;
a. included detailed analysis of historical performance data;
b. better reflected the current condition and performance of the network; and
c. accounted for the capital and operational plans proposed for the CPP period.
2. We have reached this view because:317
a. Aurora’s composite model uses a basic 3-year historical averaging for 88% of its forecasting;
b. only 12% of the modelled output is determined by the GLM, for which asset health is an input;
c. Aurora’s asset health index values are primarily age-based; and
d. while the model implicitly includes the early benefits of recent investment, it does not include an adjustment to reflect the increasing benefits from recent investments and the proposed future investments (only the GLM includes consideration of this);
• we found no evidence that 88% of the modelled output takes into account Aurora’s proposed opex;
• we found no evidence that 88% of the modelled output takes into account Aurora’s proposed capex.
3. In our opinion, Aurora’s composite model is likely to overstate SAIDI and SAIFI because:
a. the historical profile of SAIDI and SAIFI indicates that 3-year averaging is not appropriate and that 4-year averaging better reflects the historical trend seen across 12 years; and
b. using a composite of three models to form the SAIFI projection is likely to double count across events (e.g. distribution conductor and pole failures in GLM are also included under weather events);
We found that Aurora’s modelled reliability predictions, and therefore its proposed SAIDI and SAIFI targets and limits, are highly sensitive to the choice of averaging periods for several input assumptions. We also found that Aurora’s choice of averaging periods resulted in higher targets and limits than for other averaging periods.
We have recommended adjustments to Aurora’s proposed SAIDI and SAIFI targets and limits to better reflect historical performance data, the current condition and performance of the network and also account for Aurora’s capital and operational plans.
317 Aurora Energy, 12 June 2020, Customised price-quality path application, p. 235.

Aurora CPP – review of forecast expenditure
190
12.10. Summary of opinions The Commission’s request for an opinion Strata’s opinion
The extent to which expected asset reliability improvements from Aurora’s recent and proposed programmes and expenditure have been adequately reflected in Aurora’s unplanned SAIDI and SAIFI forecasts.
Why recent, and proposed renewal programmes and operational expenditure will not begin to arrest Aurora's forecast worsening reliability performance until after the five-year CPP period.
Aurora’s modelling falls short of the description provided in its CPP application. The outputs from Aurora’s modelling are derived from basic linear trend analysis of historical performance. There is no explicit consideration of proposed capital investments, changes in management actions and practices, and changes in maintenance practices. Our key observations are:
1. The GLM Group 1 component will implicitly include some benefits attributable to asset replacements made prior to and during 2020 and also through the prediction timeframe. This is because the age, and therefore assumed health index, will reflect the replacement programmes.
2. The GLM Group 1 component does not account for any improvements in opex, including more preventive and corrective maintenance.
3. The Group 2 basic 3-year averaging for vegetation-related SAIFI (and the derived SAIDI) will include realised benefits from improvements in vegetation management opex and capex prior to, and during, the 3-year period. However, these will be understated in the prediction of the full benefits of investment in the later part of the 3-year period , and will not have been fully seen in the actual SAIFI and SAIDI results.
4. Aurora's adjustment of SAIFI and SAIDI from 2024 to reflect its new vegetation management strategy is appropriate. However, the adjustment for each of SAIDI and SAIFI should have been ramped down from 2020 to reflect recent past improvements and the gradual application of the new strategy.
5. The Group 3 basic 3-year averaging will implicitly include some benefits of investments made prior to and during the 3-year averaging period. This will include capex, opex and management actions.
6. Aurora's Group 3 basic 3-year averaging does not include benefits of increased capex, opex and management actions made after 2020.
Aurora CPP – review of forecast expenditure
191
The Commission’s request for an opinion Strata’s opinion
In addition, there is no evidence that Aurora undertook sensitivity testing of its method and models to variations in input assumptions.
Developing a supported counterfactual based on the DPP3 capex and opex allowance would have been valuable in demonstrating the impact of the proposed uplift in capex, opex and management actions on reliability performance. Similarly, Aurora’s modelled prediction should have, but did not, include an adjustment to account for increased or decreased capex, opex and management actions prior to and during the prediction timeframe.
If Strata’s initial opinion identifies that future network reliability performance is likely to be different to that modelled by Aurora and the Verifier, establish:
• a counterfactual reliability forecast resulting from applying the DPP; and
• an alternative to Aurora’s forecast based on Strata’s opinions.
Aurora’s model has a bias towards a conservative view of the reliability improvement likely to occur. The reasons we have formed this opinion include that:
• the age-based derived asset health index is likely to overstate asset deterioration;
• the condition and risk based prioritisation during implementation will lead to performance improvements above those considered in Aurora’s models; and
• Aurora and the Verifier had not included adjustments to the modelled outputs to specifically recognise the introduction of improved operational management.
Aurora’s unplanned SAIDI and SAIFI forecasts have not adequately reflected expected asset reliability improvements, because:
1 as we have advised the Commission in Briefing Paper BR03 (Repex Part 1), the age-based asset health index is likely to be overstating the increasing deterioration and failure rates of the assets; these values are used as inputs to Group 1 calculations so the outputs from the GLM are also likely to be overstated;
2 the considerable network repex proposed for 2021 to 2026 must have a positive impact on network performance; yet the three-year historical back cast approach to SAIDI and SAIFI forecasting makes no adjustment for this;
3 Aurora’s assumption that vegetation interruptions have stabilised is not reflected in the 3-year average back cast, because any stabilisation is only likely to have occurred within the last two years, and there is no basis on which to assume that future activities will not make further gains until 2024; and
Aurora CPP – review of forecast expenditure
192
The Commission’s request for an opinion Strata’s opinion
4 the recent strengthening of Aurora’s overhead network will have increased its resilience to adverse weather events; however, the modelling applies no adjustment to reflect this.
We produced alternative reliability forecasts using sensitivity testing of Aurora’s composite model. These are included in the body of this briefing paper.
Applying our adjustments produced a lower target for SAIDI and SAIFI than Aurora has proposed.
The extent to which unplanned SAIDI and SAIFI can be expected to deteriorate further if Aurora were to reduce its expenditure significantly to levels more consistent with the DPP3 allowances.
Significantly reducing expenditure would be expected to have a material impact on future network performance. For a relatively old network such as Aurora’s, significantly reducing expenditure would result in an increasing level of age-based deterioration. Failure rate tends to increase exponentially for assets at or beyond their expected life. Therefore, declining network performance would be expected to follow a path of reduced expenditure, with network deterioration accelerating over time.
The proposed significant increase in expenditure and the introduction of improved network, systems and vegetation management will stabilise the decline in reliability performance and, if applied on a prioritised basis, will lead to the continuation of recent network performance improvement.
If it is appropriate for Aurora's unplanned reliability model to be weighted to RY18 to RY20 performance rather than a longer period.
Aurora’s choice of the average of the last three years is not appropriate. Taking a 4-year average would have better reflected historical trends whilst being aligned with the years in which the assets had been performing worse than in the earlier years.
In addition, we found that the need to determine and apply a scaling factor adds a further degree of uncertainty to the reliability of the composite model outputs. The yearly ratios, especially for SAIDI, are quite variable which is understandable given the variability in MED occurrences. However, in taking the pathway that it did, Aurora had to produce a DPP3 normalised output, and taking a 10-year average ratio will have eliminated some of the variability. Accordingly we consider that:
1. Aurora’s technique and process used to normalise its unplanned interruptions was reasonable given the structure of its composite model; and
2. the scaling approach applied by Aurora is consistent with the DPP3 methodology.
If Aurora's worsening reliability can be expected to improve (taking account of forecasting uncertainty
We agree with Aurora that the primary effect of its proposed network capex and opex investment will be to address the declining trend in network performance apparent since 2013.
Aurora CPP – review of forecast expenditure
193
The Commission’s request for an opinion Strata’s opinion
and uncertainty regarding Aurora's future spending and its consumer preferences).
For several reasons, increased asset replacements may not result in immediate improvement in network performance. However, Aurora’s proposed expenditure for several asset fleets is age-based. If Aurora applies good electricity industry practice asset management when carrying out the replacement programmes, it will prioritise replacements on the condition actually observed as the programme is rolled out. In our opinion, this will lift the post-investment asset health to a higher/better overall condition than indicated by Aurora’s age-based health index.
In addition, the increased network opex and improved focus on preventive maintenance and improved operational management will have an immediate impact on reducing both the frequency and duration of supply interruptions.
Accordingly, we consider that the proposed expenditure and improvement initiatives are more likely than not to lift network reliability performance beyond that forecast by Aurora.
Subsequently, that Commission has asked that we provide an opinion on whether maintaining the composite model approach with adjustments (i.e. the 4 year (raw) average to groups 2 and 3 with scaling adjustments to normalise values, and some adjustments to GLM), is preferable to taking the average of the normalised values of the last four years.
Whilst we have identified some issues with Aurora’s use of the composite model and the selection of the averaging periods for the Group 2 and Group 3 inputs and derivation of the scaling factor, we consider that Aurora’s approach is fundamentally sound. The primary issue is the current level of reliability and maturity of the inputs (e.g. resulting in limited ability to utilise the GLM).
Accordingly, we consider that Aurora’s adoption of the modelled approach should be supported.
Our key criticisms are that:
• Aurora’s selection of averaging periods has supported higher than necessary limits for SAIDI and SAIFI; and
• Aurora has not applied sensitivity testing to reflect reasonable impacts on performance from its recent and proposed network improvements and investments.
In our opinion, using a simple averaging of historical performance should only be used as a sensitivity test of the composite model. For example, it should be used to highlight and understand the scale of the difference between the two approaches.
If an historical averaging approach was taken:
• the averaging period chosen would need to be that which best reflect the expected future conditions; and

Aurora CPP – review of forecast expenditure
194
The Commission’s request for an opinion Strata’s opinion
• adjustments would need to be made to reflect the potential impact of improvements and increased investments.
Essentially, some form of adjustments would need to be applied to produce a reasonable forecast. These adjustments would need to be formed along similar lines to that used in the composite model (e.g. improved asset health and operational performance).
We prefer the use of Aurora’s composite model with bottom-up adjustment of inputs and top-down adjustments to reflect improvements and increased expenditure. We prefer this approach because the use of a simple historical averaging would not reflect probable future performance.
We also consider that the averaging periods for the Group 2 and 3 inputs and that used for the scaling factor can be different because they are used to determine different aspects of performance:
• the Group 2 and 3 inputs should be over a relatively recent period to reflect recent changes in performance; and
• he scaling factor should be over a longer period to better reflect and smooth the variability of events that impact on normalisation.

Aurora CPP – review of forecast expenditure
195
13. BRIEFING REPORT 12 - Quality planned SAIDI and SAIFI
13.1. Introduction This briefing paper addresses questions from the Commission on the forecasts of planned SAIDI and SAIFI in Aurora’s CPP application.
13.2. Scope of work The Verifier concluded that Aurora’s planned reliability forecasts may be understated (particularly SAIFI). The Verifier acknowledged that Aurora addressed some of the Verifier’s concerns and questions, by providing an updated planned outage model (v5.05). However, the Verifier had some further issues that remained unresolved. These are noted in the Verifier report at Table E.19: Clarification from Aurora Energy on planned reliability forecasts.
The Commission requires us to review Aurora’s planned outage model (v5.05) and the Verifier’s comments, particularly its outstanding comments in Table E.19. Based on this review, we are to provide a critique of Aurora’s forecast planned outage numbers and durations in its updated model (v5.05), given the proposed investment and opex in Aurora’s CPP application.
13.3. Our view of Aurora’s approach to modelling SAIDI and SAIFI for planned outages
The Verifier report provides an overview of Aurora’s modelling approach in section 3 and more detailed discussion of the modelling and findings in Appendix E.5.
In brief, Aurora adopted a composite approach under which it developed two models representing two ways of forecasting planned reliability, before then averaging the results to derive the planned SAIDI and SAIFI forecasts:318
• the first method forecasts planned SAIFI and SAIDI for each fleet category by linearly regressing the relationship between forecast replacement volumes and contributions to the number of outages, the number of customers interrupted and the duration, aggregating the respective modelled contributions
• the second method forecasts planned SAIFI and SAIDI by linearly regressing renewal expenditure against actual data from RY14 to RY20, and then applied to forecast expenditures for each asset category over the review period.
The outcomes from both methods were averaged to derive the pre-weighted planned SAIDI and SAIFI forecasts.
An adjusted forecast was applied to planned SAIDI that reflects improving notification compliance over the review period (starting at a 10% reduction in reported SAIDI in RY21 and increasing to 40% by RY26).39 Planned SAIFI was also adjusted down to incorporate forecast
318 Verifier report, page 35

Aurora CPP – review of forecast expenditure
196
efficiency gains from planned outage coordination (starting at 0% in RY21 and increasing to 15% in RY26).
The Verifier noted:319
Reliability forecasting is complex. Different statistical approaches can reasonably be used, which may lead to a range of plausible forecasts.
and:320
Aurora Energy’s reliability performance over recent years is not in a steady state –and so simplified modelling based on that history may not accurately predict future outcomes.
The above points from the Verifier report provide relevant context to how Aurora approached forecasting planned reliability. We consider:
• forecasting quality metrics (planned SAIDI and SAIFI) using statistical methods (regression models) provides a generally sound approach – and Aurora has adopted two modelling approaches that should lead to plausible forecasts;
• however, as with all statistical model-based approaches, the quality of the model outputs relies on:
o good, relevant input data (the ‘garbage in, garbage out’ principle); and
o reasonably steady-state operating conditions projecting from recent actual performance (from which relevant data is sourced to provide the inputs) to the CPP and review periods (that is, the forecast of planned SAIDI and SAIFI)
• operating conditions in the recent past exhibit significant non-steady state asset replacement expenditure, with some fleet renewals being under-invested and others receiving significant catch up replacement expenditure (i.e. the fast-tracked pole replacement programme).
As with even the best modelling approaches, the outputs represent a simplified “all other things being equal” forecast based on the view looking back and the assumption that the observed relationships in the modelled factors will hold.
Good practice includes the testing of outputs to a range of input assumptions. This approach provides insight into the sensitivity of the outputs to input assumptions.
In summary, we stress the need to proceed with caution and carefully interpret the model-based outputs based on the non-steady state operating conditions of the recent past. Of course, Aurora’s actual performance in planning and carrying out planned work on the network over the CPP and review periods is in Aurora’s hands.
13.4. Aurora proposes to adopt the planned reliability standards that were set for DPP3
In its CPP proposal, Aurora proposes to adopt the DPP3 reliability standards: 321
Our analysis has concluded that the Commission’s DPP3 reliability standards for planned SAIDI and SAIFI are appropriate for the CPP period RY22 - RY24.
319 Verifier report, Footnote 38, page 32 320 Verifier report, page 33 321 Aurora CPP proposal, paragraph 882

Aurora CPP – review of forecast expenditure
197
And:322
Aurora accepts the planned accumulated SAIDI and SAIFI limits set out by the Commission in Table 3.1.1 of the DPP3 determination for the five-year DPP period RY21 to RY25. However, we propose to adjust the limits on a pro-rata basis to reflect a three-year CPP period commencing in April 2021, as set out in Table 49 below.
In the course of reviewing Aurora’s forecast modelling techniques, including the modelling issues raised by the Verifier, we have sought to keep in mind the DPP3 limits previously set by the Commission for planned SAIDI and SAIFI.
13.5. Table E.19 – the Verifier’s points on planned reliability modelling and Aurora’s responses
The Verifier’s Table E.19, reproduced and augmented in Appendix A, summarises the Verifier’s interaction with Aurora regarding its planned reliability modelling. Left to right, the columns in Table E.19 contain:
1. the Verifier’s initial comments on model version v5.01;
2. Aurora’s feedback and responses to the Verifier’s comments;
3. the Verifier’s further comments on the updated model version v5.05;
4. Aurora’s responses to RFI Q018; and
5. our observations and comments.
In summary, having considered the four topics discussed by the Verifier and Aurora, our view is that none of the unresolved detailed modelling topics provide a material barrier to the Commission setting appropriate planned SAIDI and SAIFI limits for the review period.
13.6. Our conclusions on forecast planned SAIDI and SAIFI Planned SAIDI and SAIFI metrics are driven by work on network equipment fleets that require circuit and/or substation outages, which in turn cause supply interruptions to consumers. Planned SAIDI and SAIFI metrics have a direct relationship with the proposed work in Aurora’s replacement and renewals expenditure forecast. Planned reliability forecast analysis seeks to model this relationship using historic data, and to project SAIDI and SAIFI outcomes forward into the review period.
Comparing Aurora’s modelled outputs with the DPP3 limits The following table tracks the annualised forecasts for SAIDI and SAIFI produced by the four development stages of Aurora’s modelling, the Verifier’s alternative model, and the DPP3 limit.
322 Aurora CPP proposal, paragraph 885
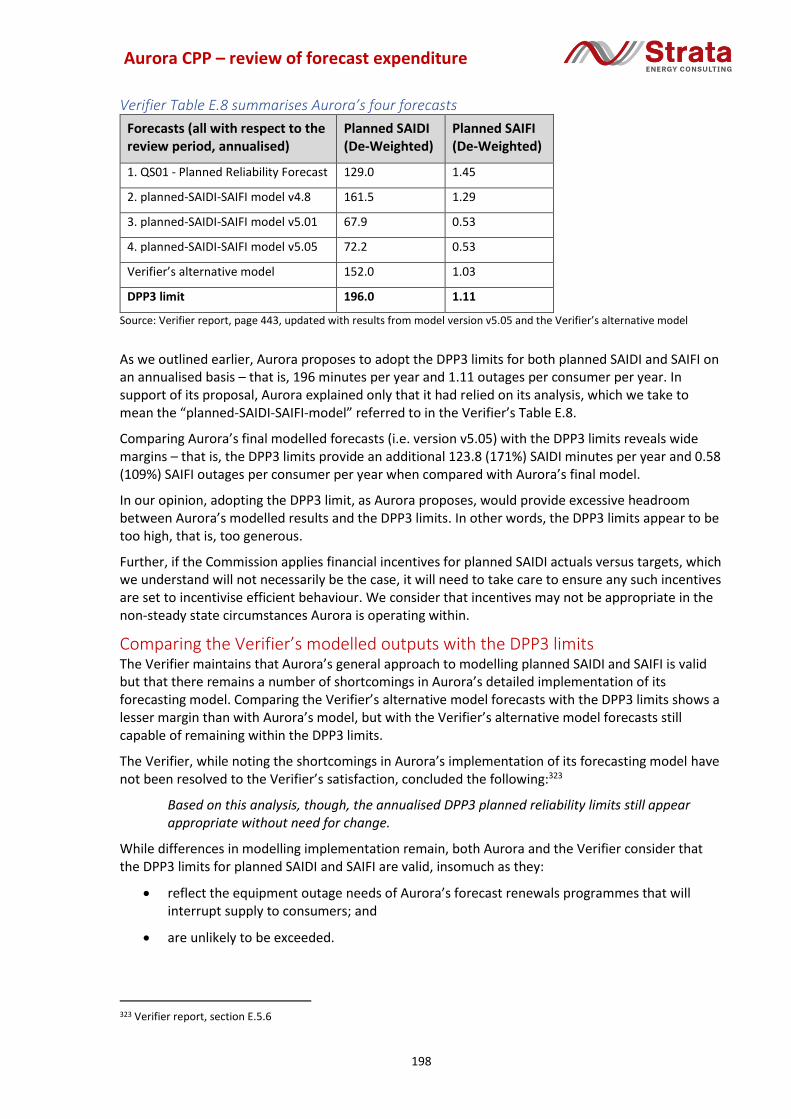
Aurora CPP – review of forecast expenditure
198
Verifier Table E.8 summarises Aurora’s four forecasts
Forecasts (all with respect to the review period, annualised)
Planned SAIDI (De-Weighted)
Planned SAIFI (De-Weighted)
1. QS01 - Planned Reliability Forecast 129.0 1.45
2. planned-SAIDI-SAIFI model v4.8 161.5 1.29
3. planned-SAIDI-SAIFI model v5.01 67.9 0.53
4. planned-SAIDI-SAIFI model v5.05 72.2 0.53
Verifier’s alternative model 152.0 1.03
DPP3 limit 196.0 1.11
Source: Verifier report, page 443, updated with results from model version v5.05 and the Verifier’s alternative model
As we outlined earlier, Aurora proposes to adopt the DPP3 limits for both planned SAIDI and SAIFI on an annualised basis – that is, 196 minutes per year and 1.11 outages per consumer per year. In support of its proposal, Aurora explained only that it had relied on its analysis, which we take to mean the “planned-SAIDI-SAIFI-model” referred to in the Verifier’s Table E.8.
Comparing Aurora’s final modelled forecasts (i.e. version v5.05) with the DPP3 limits reveals wide margins – that is, the DPP3 limits provide an additional 123.8 (171%) SAIDI minutes per year and 0.58 (109%) SAIFI outages per consumer per year when compared with Aurora’s final model.
In our opinion, adopting the DPP3 limit, as Aurora proposes, would provide excessive headroom between Aurora’s modelled results and the DPP3 limits. In other words, the DPP3 limits appear to be too high, that is, too generous.
Further, if the Commission applies financial incentives for planned SAIDI actuals versus targets, which we understand will not necessarily be the case, it will need to take care to ensure any such incentives are set to incentivise efficient behaviour. We consider that incentives may not be appropriate in the non-steady state circumstances Aurora is operating within.
Comparing the Verifier’s modelled outputs with the DPP3 limits The Verifier maintains that Aurora’s general approach to modelling planned SAIDI and SAIFI is valid but that there remains a number of shortcomings in Aurora’s detailed implementation of its forecasting model. Comparing the Verifier’s alternative model forecasts with the DPP3 limits shows a lesser margin than with Aurora’s model, but with the Verifier’s alternative model forecasts still capable of remaining within the DPP3 limits.
The Verifier, while noting the shortcomings in Aurora’s implementation of its forecasting model have not been resolved to the Verifier’s satisfaction, concluded the following:323
Based on this analysis, though, the annualised DPP3 planned reliability limits still appear appropriate without need for change.
While differences in modelling implementation remain, both Aurora and the Verifier consider that the DPP3 limits for planned SAIDI and SAIFI are valid, insomuch as they:
• reflect the equipment outage needs of Aurora’s forecast renewals programmes that will interrupt supply to consumers; and
• are unlikely to be exceeded.
323 Verifier report, section E.5.6

Aurora CPP – review of forecast expenditure
199
Our conclusions We consider the way forward with setting planned reliability limits is not to grind the modelling finer but to broadly view Aurora’s and the Verifier’s models as providing a “meta-ensemble” view, recognising that Aurora and the Verifier have developed the forecasts with imperfect but useful input data, derived from recent past operations that reflect non-steady state conditions. Modelling is always going to be indicative at best and subject to non-trivial caveats.
Observing that Aurora’s final modelled SAIDI and SAIFI are in the order of 50% of the Verifier’s limits, and an even smaller percentage of the DPP3 limits, we consider there is a case for the Commission to set lower limits than the DPP3 limits.
Practical approaches could include adopting annualised planned SAIDI and SAIFI limits from:
• Aurora’s final model (version v5.05) and applying a percentage margin to provide for uncertainty in both the modelling and the expected performance over the review period, for example a 50% margin would set annualised SAIDI at 108 minutes and SAIFI at 0.80 interruptions per customer. The rationale for this approach is that Aurora has reviewed and defended its modelling in two rounds of questions and answers with the Verifier and remains of the view that its modelling is sound.
• the Verifier’s alternative model. The rationale for this approach is that, while the Verifier did not set out to develop a recommended model that improved on Aurora’s model, it represents a significantly more conservative (i.e. higher levels of planned SAIDI and SAIFI) outcome than Aurora’s model, yet remains reasonably comfortably within the DPP3 limits.
• a meta-ensemble model comprising two parts (0.67) Aurora’s composite model and one part (0.33) the Verifier’s alternative model (so as to treat each of the three underlying models with equal weight). This would set an annualised SAIDI limit at 124 minutes and annualised SAIFI at 0.85 interruptions per customer. The rationale for this approach is that Aurora and the Verifier did not reach agreement on all outstanding points regarding the modelling and that a valid ensemble approach would be to bring all views to bear so as to better reflect the inherent uncertainties.
We favour the first option above, as it is based on Aurora’s own modelling.
13.7. Summary of Strata’s opinions We consider that modelled approaches for setting planned quality limits for SAIDI and SAIFI are appropriate, provided that sensitivity testing and top-down validation is applied. In proposing to retain the DPP3 limits, Aurora applied no adjustment based on its modelled output or on a reasoned top-down validation.
We consider the DPP3 limits, including the financial incentive in respect of planned SAIDI, do not provide valid quality measures or incentives when the recent and forecast review period asset replacement programmes are taken into account. In our view, financial incentives are appropriate under more steady-state operating conditions. Under current conditions, Aurora should focus on efficiently completing its forecast expenditure programmes through the review period and beyond.
Aurora’s and the Verifier’s modelled outputs agree only inasmuch as they both indicate that Aurora can live within the DPP3 limits.
Accordingly, we consider that a planned SAIDI limit of 108 and a planned SAIFI limit of 0.80 are appropriate.

Aurora CPP – review of forecast expenditure
200
13.8. Responding to the Verifier’s unresolved points and Aurora’s comments in response to RFI Q018
Verifier’s observation (on v5.01) Aurora comment Verifier’s further comments (on
v5.05)
Aurora’s response to Q018 Strata comments
The modelling approaches used for each of planned SAIDI and SAIFI look reasonable, however, we would expect the forecasts for each to be closer together – the fact that they are not suggests that there may be some issue with the inputs to the modelling
We could not establish a discrepancy/separation of SAIDI and SAIFI pre normalisation. The relationship between SAIDI and SAIFI is strong. There is a business notification efficiency factor applied to the SAIDI forecast and a work bundling factor applied for SAIFI. Planned SAIFI is no longer subject to normalisation under the DPP3 regime, i.e. the new notification factor does not apply to SAIFI and hence to post normalisation values diverge.
Our concern was related to the different forecasts produced by the expenditure method and the renewal volumes method and not with respect to the planned SAIDI and SAIFI relationships.
This concerns remains with the latest v5.05 model.
As discussed above, given the deficiencies in the historic data to support an accurate model output we wanted to test the sensitivity of two different modelling approaches. As expected this has led to two plausible outputs. We have not been able to determine which model is more accurate and we do not consider it appropriate to pick a modelling technique, so we combined the modelling results to get a hybrid approach.
There is a clear misunderstanding here between the Verifier’s initial observation regarding the differences Aurora’s two models were producing (column 1) and Aurora’s evident assumption that the observation related to the difference in the relationship between SAIDI and SAIFI (column 2). Therefore, the Verifier retained its concern (column 3).
In terms of critiquing this situation, we have focused on why the Verifier’s observation/view matters. In other words, what difference is it likely to make to the Commission’s determination?
Looking at Aurora’s forecast model outputs in the above graphs, the Verifier expected the blue and red plots would be closer together (the green plot is the average of the two, which makes up the ensemble).
Both parties acknowledge that planned outage forecasting models are difficult to put together – this is one reason why Aurora adopted an ensemble approach in the first place—an ensemble approach can help to reduce any overt bias or modelling inaccuracy inherent in a single model approach. Both parties agree that the model formulations have shortcomings for a variety of reasons.
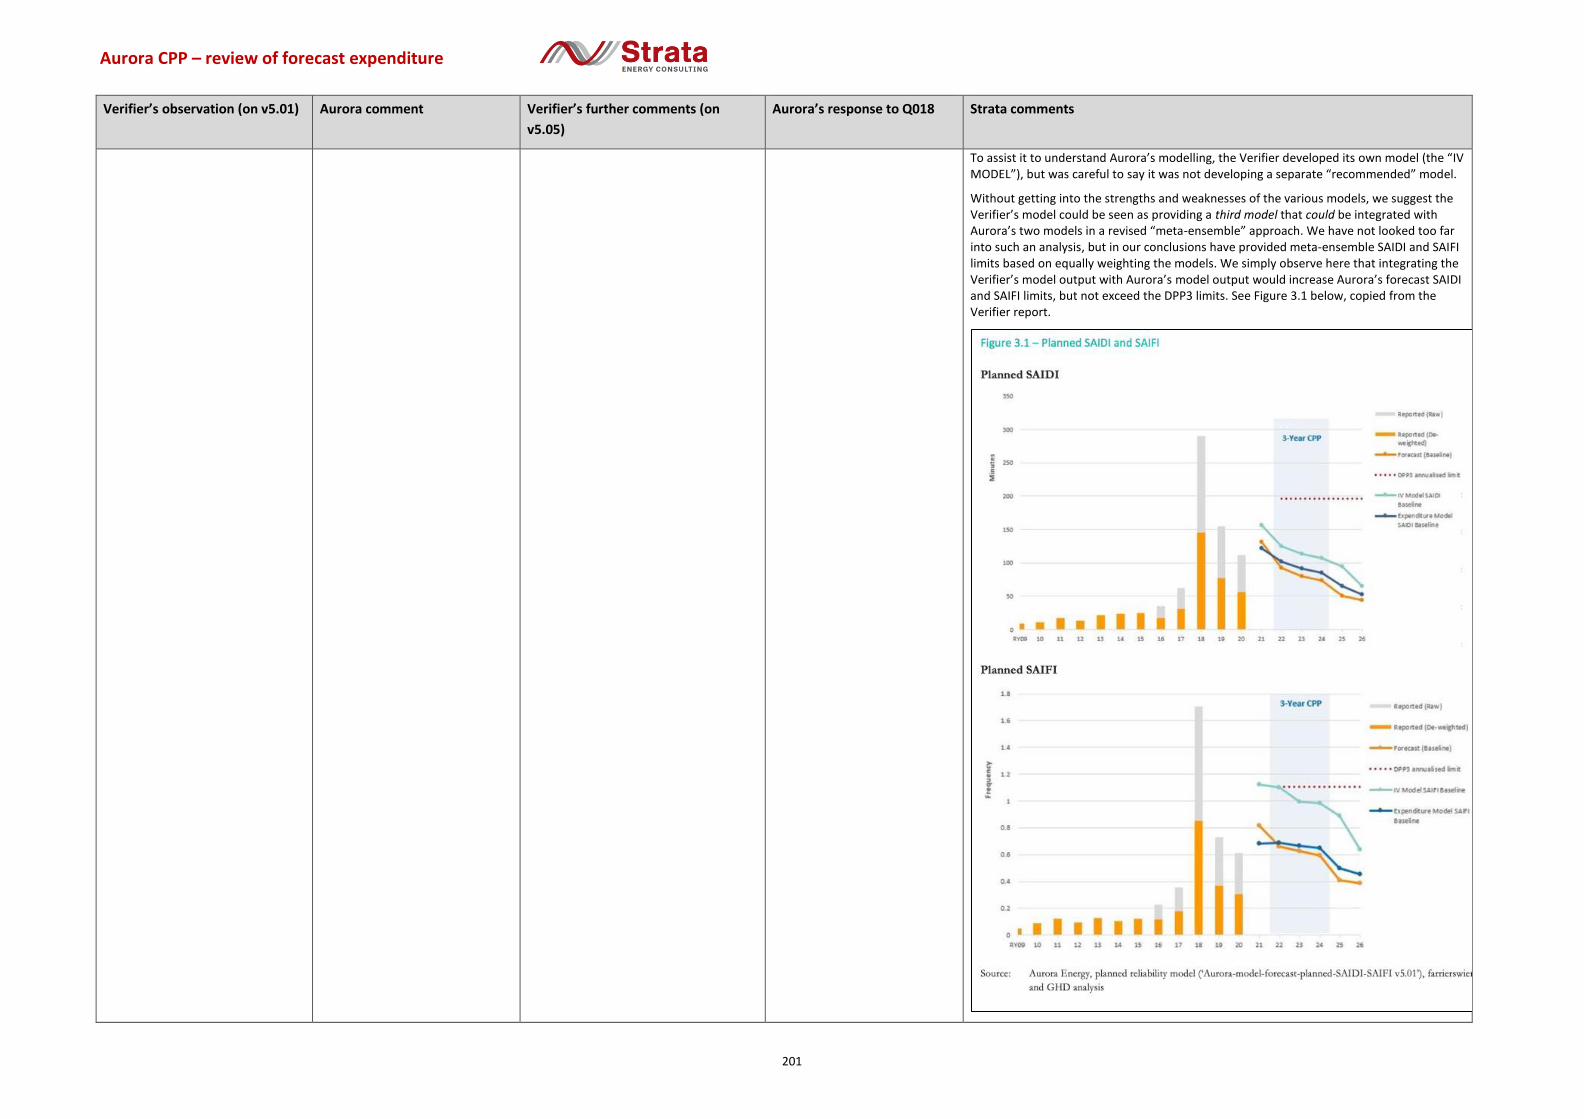
Aurora CPP – review of forecast expenditure
201
Verifier’s observation (on v5.01) Aurora comment Verifier’s further comments (on
v5.05)
Aurora’s response to Q018 Strata comments
To assist it to understand Aurora’s modelling, the Verifier developed its own model (the “IV MODEL”), but was careful to say it was not developing a separate “recommended” model.
Without getting into the strengths and weaknesses of the various models, we suggest the Verifier’s model could be seen as providing a third model that could be integrated with Aurora’s two models in a revised “meta-ensemble” approach. We have not looked too far into such an analysis, but in our conclusions have provided meta-ensemble SAIDI and SAIFI limits based on equally weighting the models. We simply observe here that integrating the Verifier’s model output with Aurora’s model output would increase Aurora’s forecast SAIDI and SAIFI limits, but not exceed the DPP3 limits. See Figure 3.1 below, copied from the Verifier report.

Aurora CPP – review of forecast expenditure
202
Verifier’s observation (on v5.01) Aurora comment Verifier’s further comments (on
v5.05)
Aurora’s response to Q018 Strata comments
Figure 3.1 indicates that, when compared against the DPP3 limits, Aurora’s modelling appears to be very conservative in its forecasting of the number (SAIFI) and duration (SAIDI) of planned outages needed to implement Aurora’s renewals programmes. Aurora has said that it is happy to run with the annualised DPP3 limit for the CPP period. Based on Aurora’s own modelling, this looks to provide an overly conservative (overly high) forecast.
Verifier Table E.8 summarises Aurora’s four forecasts
Forecasts Planned SAIDI (De-Weighted)
Planned SAIFI (De-Weighted)
1. QS01 - Planned Reliability Forecast 129.0 1.45
2. planned-SAIDI-SAIFI model v4.8 161.5 1.29
3. planned-SAIDI-SAIFI model v5.01 67.9 0.53
4. planned-SAIDI-SAIFI model v5.05 72.2 0.53
DPP3 annualised limit 196.0 1.11
Source: Verifier report, page 443, updated with results from model version v5.05
Further, the ratio of the forecasted SAIFI and CAIDI contributions to expenditure and to renewal volumes should be relatively constant over each year in the forecasted period representing the mean values for each variable involved – however, this is not the case and is more pronounced with the renewal volumes method.
We have looked into the ratio between the SAIDI and expenditure per fleet and found it is stable for all asset portfolios over the period. Please clarify your concern.
Our report does suggest that the ratio for expenditure and SAIDI was reasonably consistent as Aurora has noted.
However, this is different with the renewal model. Planned SAIDI over the RY21 to RY26 forecast data showed an [sic] standard deviation of 76% to the average when it should be 0%. Hence, the lessor [sic] confidence in the forecasts produced by the renewal volume methods.
We have not been able to concur with the Verifiers statement and therefore our decision to continue with a hybrid approach remains. However, it is worth noting that some of the assumptions in the renewal/volume forecast model, capture future state planned outage coordination that would not be captured in the expenditure model.
The debate here is about the fleet renewal quantities model. The parties have not reached an agreement on this detailed modelling point and we are unable to identify an obvious flaw in the model logic.
At a high level, we consider that Aurora’s ensemble approach remains valid.
We understand that expenditure on reinforced poles typically do not require an outage. Our analysis suggests that the volume of poles renewed historically included the number of reinforced poles (Modelling_Assumptions_Planned_v4). Recognising this corrects the mismatch between actual outage and the number of poles renewed in the data sets. If so, this is likely to be the biggest contributor to underestimating planned outages in the future, given that Aurora Energy is not continuing the reinforcement program. If our understanding is correct, then the volumes and expenditure for reinforced poles should be removed from the historical data to improve forecast
We agree with this observation and appreciate the information.
After further analysis we managed to extract the expenditure on pole reinforcement from the inputs into the planned model.
The updated forecast (a slight increase) is presented in the latest version -Planned v5.05, which does not change our proposed DDP3 level quality standard for planned SAIDI and SAIFI.
The expenditure for reinforced poles is needed to be removed from historical expenditure for both planned SAIFI and SAIDI forecasts. The data on expenditure remaining in v5.05 still shows the same expenditure and the calculation for planned SAIDI is based on the original expenditure.
We could not confirm if the Python model removed the expenditure. Although the updates lead to an increase in the forecast planned SAIFI, [sic] there does not appear to be an increased contribution to the historical planned SAIFI contribution – which we would expect.
Our view is that outages related to the pole program will represent 70% to 90% of the contribution to planned SAIFI whereas Aurora’s revised model v5.05 is
Pole reinforcement expenditure was removed from the historical dataset in version 5.05 of the model. Pole reinforcements are not included in our pole data as pole replacements and therefore they do not need to be removed from the pole replacement dataset. We are of the view that pole reinforcements have been treated correctly in the model. Given the significant quantity of crossarm and conductor renewals required we do not concur with the Verifier view that pole replacements will constitute 70-90% of planned SAIFI.
The difference over the treatment of reinforced poles remains after two rounds of Q&A. The remaining difference of opinion relates to how Aurora treats reinforced poles in its historical database. Aurora states that it has removed the expenditure it has previously spent to reinforce poles from its historical pole replacement expenditure data. Aurora remains of the view that it has treated pole reinforcements correctly in its model.
The final point relates to the nature of the activities included in the pole replacement programme and what contribution those activities will contribute to forecast planned SAIFI. Aurora states that the significant amount of crossarm and conductor replacements in its renewals expenditure forecast reflects its modelling assumption that pole replacement outages will constitute 40–50% of SAIFI. We have no superior knowledge or information to suggest that such treatment might result in inappropriate modelled results.
Again, at a high level, we consider that Aurora’s ensemble approach remains valid.

Aurora CPP – review of forecast expenditure
203
Verifier’s observation (on v5.01) Aurora comment Verifier’s further comments (on
v5.05)
Aurora’s response to Q018 Strata comments
accuracy, which will likely lift the forecasts.
still only showing 40% to 50% over RY21 to RY24.
Volumes for reinforced poles also need to be subtracted from historical data. Historical planned SAIFI contributions in both models appear to depend on the regression of historical replacement volumes – hence, this will affect forecasts for both methods.
Crossarm replacements historically have not been part of a separate program and were part of pole and conductor replacements – hence, using regression analysis based on historical expenditure and renewal volumes is potentially not reliable. The crossarm renewal program volumes occurs from RY21 onwards as part of a dedicated crossarm replacement program. A different outage duration for crossarms replacements will change the SAIFI and SAIDI outcomes compared to the past where poles were responsible for the majority of the expenditure and outage requirements. The actual effect, however, will depend significantly on the number of crossarms planned and renewed per planned outage event. The future number of planned outages (hence SAIFI) is very sensitive to this factor. It is not clear to us what assumption is included in the planned reliability model as to how many crossarms can be replaced per outage (on average). If 10 is the answer, then that appears appropriate. If not, then that may be creating a data input issue, potentially contributing to lower forecasts.
We recognise that the expenditure model for crossarms has limitations due to the sparsity of historical data (i.e. only RY20 data). In order to strengthen the crossarm forecast, we revisited Model 2, and we have incorporated an assumed ratio of 5:1 for units per outage for crossarms to poles. This is supported by the assumption of replacing three poles per day, at 1.7 crossarms per pole. The impact on Model 2 was a slight increase in both SAIDI and SAIFI over the CPP period, but still less in magnitude compared to Model 1. Given the output of model 1 has a linkage to recent crossarm replacement work, we consider the output from Model 1 has value as a forecast methodology and therefore we continue to average with Model 2 in the resultant forecast.
Implementing this change provides us with greater confidence that the expected impact from increased crossarm replacements is appropriate, and we are satisfied that performance will remain beneath the DPP3 quality standard during the forecast period.
A further review of our alterative model indicates an average ratio of 5:1 for units per outage for crossarms will have a minimal impact on the contribution to SAIFI, whereas a ratio below this will increase planned SAIFI significantly.
Our alternative model was based on a ratio of 8.5:1 and making a minimal impact to overall planned SAIFI.
The Verifier is making an observation rather than suggesting or seeking a change to our forecast. We remain of the view that an outage impact ratio of 5 crossarms to 1 pole is reasonable.
Based on both the Verifier’s and Aurora’s final comments (columns 3 and 4), the crossarm modelling issue appears to be resolved. Both parties agree on a modelling ratio of “5 crossarms to 1 pole”.
Source: First 3 columns: Verifier report, pages 456-458. Column 4 Aurora’s response to Q018

Aurora CPP – review of forecast expenditure
204