Embed Size (px)
Citation preview
FOR THE YEAR ENDED AUGUST 31, 2013
FOR
TH
EY
EA
RE
ND
ED
AU
GU
ST
31,2014
FOR THE YEAR ENDED AUGUST 31, 2016
FOR
TH
E Y
EA
R E
ND
ED
AU
GU
ST
31, 2013
CONSOLIDATED ANNUAL FINANCIAL
REPORTCO
NSO
LIDA
TED A
NN
UA
L FINA
NC
IAL R
EPOR
T

CONSOLIDATED ANNUAL FINANCIAL REPORT
of the
UNIVERSITY OF NORTH TEXAS SYSTEM
DALLAS, TEXAS
Lee Jackson, Chancellor
For the Year Ended August 31, 2016

2

TABLE OF CONTENTS
Letter of Transmittal ..................................................................................................................................... 5 Organizational Data ...................................................................................................................................... 7
Management’s Discussion and Analysis .................................................................................................. 9‐18
Statements Consolidated Statement of Net Position ....................................................................................... 20‐21
Statement of Financial Position ‐ UNT Foundation, Inc. ................................................................... 23 Consolidated Statement of Revenues, Expenses and Changes in Net Position ................................. 24
Consolidated Matrix of Operating Expenses Reported by Function.................................................. 25 Statement of Activities ‐ UNT Foundation, Inc. ................................................................................ 27 Consolidated Statement of Cash Flows ......................................................................................... 28‐29
Notes to the Consolidated Financial Statements .................................................................................. 31‐63 Required Supplementary Information ........................................................................................................ 64 Notes to the Financial Statements ‐ UNT Foundation, Inc. .................................................................. 65‐70
Schedules 2A Consolidated Miscellaneous Bond Information ..................................................................... 72 2B Consolidated Changes in Bonded Indebtedness .................................................................... 73 2C Consolidated Debt Service Requirements ......................................................................... 74‐76 2D Consolidated Analysis of Funds Available for Debt Service .................................................... 77 2E Consolidated Defeased Bonds Outstanding ........................................................................... 78
2F Consolidated Early Extinguishment and Refunding ................................................................ 79 3 Consolidated Reconciliation of Cash in State Treasury ........................................................... 81
3

4

5
6

UNIVERSITY OF NORTH TEXAS SYSTEM ADMINISTRATION
ORGANIZATIONAL DATA
August 31, 2016
BOARD OF REGENTS
Donald Potts ............................................ (Term expires 5‐22‐17) ........................................................ Dallas Al Silva ...................................................... (Term expires 5‐22‐17) .............................................. San Antonio Milton B. Lee ............................................ (Term expires 5‐22‐17) .............................................. San Antonio
Rusty Reid ................................................ (Term expires 5‐22‐19) .................................................. Ft. Worth Gwyn Shea ............................................... (Term expires 5‐22‐19) ........................................................ Irving B. Glen Whitley ........................................ (Term expires 5‐22‐19) ......................................................... Hurst
Brint Ryan ................................................ (Term expires 5‐22‐21) ........................................................ Dallas A.K. Mago ................................................. (Term expires 5‐22‐21) ........................................................ Dallas Laura Wright ............................................ (Term expires 5‐22‐21) ........................................................ Dallas
STUDENT REGENT
Christopher Lee........................................ (Term expires 5‐31‐17) .................................................... Houston
OFFICERS OF THE BOARD
Brint Ryan ........................................................................................................................................ Chairman Donald Potts ………….. .............................................................................................................. Vice Chairman Rosemary R. Haggett ....................................................................................................................... Secretary
ADMINISTRATIVE OFFICERS
Lee F. Jackson ................................................................................................................................ Chancellor Janet Waldron ......................................................................................................Vice Chancellor for Finance
7

THIS PAGE INTENTIONALLY LEFT BLANK
8
UNIVERSITY OF NORTH TEXAS SYSTEM
Management’s Discussion and Analysis (Unaudited) For the Year Ended August 31, 2016
Introduction
The University of North Texas System (the “System”) was established by the 76th Legislature and legislative funding was provided for the fiscal year beginning September 1, 1999. The System is an agency of the State of Texas and is currently comprised of the University of North Texas System Administration (“System Administration”), established 1999, and three academic institutions funded by the Legislature: the University of North Texas (“UNT”), established 1890; the University of North Texas Health Science Center at Fort Worth (“HSC”), established 1970; and the University of North Texas at Dallas (“UNTD”), established 1999. The System serves the North Texas area and boosts economic activity in the region by over $5.2 billion annually. Approximately 43,000 students are enrolled in undergraduate, graduate and professional programs. The System awarded more than 9,200 degrees in 2015, including the largest number of Master's and Doctoral degrees in the region. The System has a network of over 360,000 alumni with more than 237,000 alumni living in the Dallas‐Fort Worth region. The System is governed by a nine‐member Board of Regents appointed by the Governor of Texas and confirmed by the Texas State Senate. Three members are appointed every odd‐numbered year for six‐year terms. In addition, the Governor appoints a non‐voting Student Regent for a one‐year term.
Financial Highlights and Overview of the Financial Statements The objective of Management’s Discussion and Analysis (the “MD&A”) is to provide an overview of the financial position and activities of the System for the year ended August 31, 2016, with selected comparative information for the year ended August 31, 2015. As discussed in the Notes to the Consolidated Financial Statements (Note 14, Adjustments to Net Position), the beginning net position for 2016 was restated. The MD&A was prepared by management and should be read in conjunction with the accompanying financial statements and notes. The emphasis of discussion about these financial statements will focus on current year data. Unless otherwise indicated, years in this MD&A refer to fiscal years ended August 31. The System consolidated financial report includes three primary financial statements: the Statement of Net Position; the Statement of Revenues, Expenses and Changes in Net Position; and the Statement of Cash Flows. The financial statements of the System have been prepared in accordance with Generally Accepted Accounting Principles (“GAAP”) as prescribed by the Governmental Accounting Standards Board (“GASB”). In addition, the System consolidated financial report contains the Statement of Financial Position and the Statement of Activities for the University of North Texas Foundation, Inc. (the “Foundation”), a discretely presented component unit. The Foundation is a separate nonprofit organization which is an essential component of the University of North Texas program for university advancement and for the development of private sources of funding for capital acquisition, operations, endowments, and other purposes relating to the mission of the University of North Texas. The financial statements of the Foundation have been prepared in accordance with GAAP as prescribed by the Financial Accounting Standards Board (“FASB”).
Financial Highlights
Total assets and deferred outflows of resources of the System exceeded its total liabilities and deferred inflows of resources in 2016, resulting in a net position of $742.9 million. Unrestricted net position, which may be used to meet the System’s future obligations, was $173.4 million, or 23.3% of total net position at year end.
9

UNIVERSITY OF NORTH TEXAS SYSTEM
Management’s Discussion and Analysis (Unaudited) For the Year Ended August 31, 2016
In 2016, the System concluded the fiscal year with a positive change in net position of $47.4 million, compared to a $22.7 million change in 2015. Major contributing factors related to this $18.4 million increase include a $19.5 million increase in legislative, additional and capital appropriations from general revenue and the Higher Education Assistance Fund (“HEAF”) along with the phase out of the Texas B‐On‐Time Loan program, which resulted in a reduction in transfers to other state agencies of $6.2 million. Additionally, the System had $10.7 million in revenue for the fair value of the System’s investments in 2016 that compares favorably to a $21.0 million loss reported in the prior year. These increases were offset by a $6.3 million restatement to accumulated depreciation resulting from improved historical data identified during the implementation of a new capital assets software system in 2016.
The System continues to make significant investments, $88.4 million in 2016 alone, in numerous capital projects across all institutions to strategically benefit students, faculty, and staff. The System has also committed $457.0 million to fund, with assistance from State supported debt financing and HEAF capital appropriations, future capital asset additions and improvements over the next several years. These projects are currently in various stages of completion. The “Capital Asset and Debt Administration” section of the MD&A provides more details pertaining to these strategic investments.
Overview of the Financial Statements These statements are prepared applying the following principles and standards:
Reporting is on the full accrual basis of accounting. All current year revenues and expenses are recognized when earned or incurred, regardless of when the cash is received or disbursed.
Depreciation and amortization expense on capital assets is reported as an operating expense on the Statement of Revenues, Expenses and Changes in Net Position. The historical cost of capital assets, net of accumulated depreciation and amortization, is reported on the Statement of Net Position.
Revenues and expenses are categorized as operating or nonoperating. Revenues from state appropriations, gifts, and investment income are reported as nonoperating revenue in accordance with GASB Statement No. 35, Basic Financial Statements—and Management’s Discussion and Analysis—for Public Colleges and Universities, as amended.
Statement of Net Position The Statement of Net Position presents the financial position of the System at fiscal year‐end. From the data presented, readers of this statement are able to determine the assets available to continue the operations of the System. They are also able to determine what the System owes to vendors, investors and lending institutions. Finally, the Statement of Net Position provides a picture of the net position and the availability of resources to cover the expenses of the System. The change in net position is one indicator of whether the financial condition has improved or worsened during the fiscal year when considered with nonfinancial facts, such as enrollment levels and the condition of facilities. The Statement of Net Position presents the assets, deferred outflows, liabilities, deferred inflows and net position of the System as of the end of the year. The net position section of the statement is reported by three major categories: 1) Net Investment in Capital Assets, 2) Restricted, and 3) Unrestricted. The Net Investment in Capital Assets section represents the System’s equity in property, plant, and equipment, net of accumulated depreciation and amortization, capital asset related bonds and other debt items. Restricted Net Position is reported for amounts subject to constraints that are either externally imposed or imposed by law. Amounts that are permanently held for investment are divided into two categories: 1) Non‐Expendable and 2) Expendable. Unrestricted Net Position is available for any lawful purpose of the System.
10

UNIVERSITY OF NORTH TEXAS SYSTEM
Management’s Discussion and Analysis (Unaudited) For the Year Ended August 31, 2016
The following table reflects the Condensed Comparative Statement of Net Position for the System as of August 31, 2016 and 2015:
The section below includes explanations and management’s analysis of significant changes within the Statement of Net Position: Total Assets and Deferred Outflows Current Assets The System’s current assets increased $46.1 million, or 9.2%, in 2016 primarily as a result of a $26.8 million increase in legislative appropriation receivables, a $6.5 million increase in general accounts receivables, and a $ 9.1 million increase in prepaid assets for certain multi‐year contract expenses and fall term scholarships awarded for recognition in 2017. Non‐Current Assets: Net Capital Assets Net capital assets increased $14.4 million, or 1.4%, in 2016 as a result of an increase in capital and intangible assets. This increase was primarily attributable to approximately $88.4 million of capital improvements offset by depreciation and amortization expense of $65.9 million. Major capital additions included $16.0 million in renovation to the UNT Student Union, $10.4 million in renovation to the UNT Science Research Building, $6.2 million for the purchase of land and a building by HSC in Fort Worth, $5.2 million for the HSC Interdisciplinary Research and Education Building, $3.1 million in additional costs for UNT Rawlins Hall, $18.5 million in equipment, vehicle and library purchases, $5.8 million for capitalized software costs, and other additions to depreciable capital assets.
2016 2015
% Increase
(Decrease)
Assets and Deferred Outflows of Resources
Current Assets 544,986$ 498,910$ 9.2%
Non‐Current Assets:
Capital Assets, Net 1,025,004 1,010,589 1.4%
Other Non‐Current Assets 233,584 223,978 4.3%
Deferred Outflows of Resources 25,854 22,298 15.9%
Total Assets and Deferred Outflows of Resources 1,829,428$ 1,755,775$ 4.2%
Liabilities and Deferred Inflows of Resources
Current Liabilities 407,949$ 376,985$ 8.2%
Non‐Current Liabil ities:
Bonded Indebtedness 514,046 362,782 41.7%
Other Non‐Current Liabilities 142,376 282,172 (49.5%)
Deferred Inflows of Resources 22,123 32,034 (30.9%)
Total Liabilities and Deferred Inflows of Resources 1,086,494$ 1,053,973$ 3.1%
Net Position
Net Investment in Capital Assets 465,252$ 463,615$ 0.4%
Restricted:
Funds Held as Permanent Investments:
Non‐Expendable 46,960 45,881 2.4%
Expendable 18,161 23,133 (21.5%)
Other Restricted 39,135 31,357 24.8%
Total Restricted 104,256 100,371 3.9%
Unrestricted 173,426 137,816 25.8%
Total Net Position 742,934$ 701,802$ 5.9%
Total Liabilities and Net Position 1,829,428$ 1,755,775$ 4.2%
Condensed Comparative Statement of Net Position
As of August 31, 2016 and 2015
(in thousands of dollars)
11

UNIVERSITY OF NORTH TEXAS SYSTEM Management’s Discussion and Analysis (Unaudited)
For the Year Ended August 31, 2016
Other Non‐Current Assets The System’s other non‐current assets increased by $9.6 million, or 4.3%, primarily due to a $10.7 million increase in the fair market value of investments resulting from a significant improvement in the equity and bond markets.
Deferred Outflows Deferred outflows increased $3.6 million, or 15.9%, in 2016 primarily due to the recognition of $4.1 million of deferred outflows of resources related to pension obligations required under GASB Statement No. 68, Accounting and Financial Reporting for Pensions, as amended.
Total Liabilities and Deferred Inflows Current Liabilities The System’s current liabilities increased $31.0 million, or 8.2%, in 2016 primarily due to an increase of $14.9 million in short‐term commercial paper reported under notes and loans payable and a $7.2 million increase in current revenue bonds payable. Unearned revenue increased $19.3 million, or 9.1%, primarily related to increased prepayments of tuition and fees associated with the rise in student enrollment and increases in tuition and fee rates. Funds held for others decreased by $12.6 million, or 83.6%, primarily due to the transfer by HSC at the beginning of 2016 of $13 million of restricted investments to HSC’s T‐COM Foundation. These investments were historically reported by HSC as current liabilities.
Non‐Current Liabilities Non‐current liabilities consist primarily of non‐current portions of notes and loans payable; revenue bonds payable; net pension liability; employees’ compensable leave payable; and capital lease obligations. In total, non‐current liabilities increased $11.5 million, or 1.8%, primarily due to an increase of $15.0 million to net pension liability related to adjustments under GASB Statement No. 68, which was implemented in 2015. This $15.0 million net pension liability increase is attributable to a material underperformance of actual investment returns as compared to the expected return for the TRS Plan measurement period ending August 31, 2015. The overall increase in non‐current liabilities was also impacted by a $1.6 million decrease in employees’ compensable leave and a $1.1 million decrease in capital lease obligations. In addition, the $151.3 million increase in revenue bonds payable was offset by a correlated $152.3 million decrease in notes and loans payable.
Deferred Inflows Deferred inflows decreased $9.9 million, or 30.9%, in 2016 primarily due to the reduction of $10.9 million of deferred inflows of resources related to pension obligations required under GASB Statement No. 68, Accounting and Financial Reporting for Pensions, as amended.
Total Net Position Total net position represents the residual interest in the System’s total assets and deferred outflows of resources after liabilities and deferred inflows of resources are deducted. Net position increased by $41.1 million, or 5.9%, in 2016.
Net Investment in Capital Assets Net investment in capital assets represents the System’s capital and intangible assets, net of accumulated depreciation and amortization and outstanding debt obligations attributable to the acquisition, construction or improvement of those assets. The net $1.6 million, or 0.04%, increase in net investment in capital assets in 2016 primarily resulted from an increase of $88.4 million of capital additions, reduced by $65.9 million of depreciation and amortization. The net increase was offset by an $18.5 million net increase in notes and bonds payable, capital lease obligations, and deferred outflows and inflows of resources related to unamortized gains and losses on refunded bonds.
12

UNIVERSITY OF NORTH TEXAS SYSTEM Management’s Discussion and Analysis (Unaudited)
For the Year Ended August 31, 2016
Restricted Net Position Restricted net position primarily includes the System’s permanent investments subject to externally imposed restrictions governing their use. In total, restricted net position increased by $3.9 million, or 3.9%, in 2016 primarily due to increased fair market value of restricted investments and positive fundraising efforts resulting in an increase in restricted contributions across the System.
Unrestricted Net Position Unrestricted net position increased by $35.6 million, or 25.8%, primarily due to a $19.5 million increase in legislative, additional and capital appropriations from general revenue and HEAF.
Statement of Revenues, Expenses and Changes in Net Position The Statement of Revenues, Expenses and Changes in Net Position presents the System’s revenues earned and the expenses incurred during 2016, regardless of when cash is received or paid. Activities are reported as either operating or nonoperating. Generally, operating revenues are earned in exchange for providing goods and services. Operating expenses are incurred in the normal operation of the System, including a provision for depreciation and amortization on capital assets. Certain revenue sources the System relies on for operations include state appropriations, gifts, grants and investment income, which are required by GASB Statement No. 35, Basic Financial Statements—and Management’s Discussion and Analysis—for Public Colleges and Universities, as amended, to be classified as nonoperating revenues. Revenues are reported by major source, and expenses are reported on the face of the statement by functional (programmatic) categories as defined by the National Association of College and University Business Officers (“NACUBO”).
The following table reflects the System’s Condensed Comparative Statement of Revenues, Expenses and Changes in Net Position for the years ended August 31, 2016 and 2015:
2016 2015
% Increase
(Decrease)
Operating Revenues 631,994$ 587,503$ 7.6%
Operating Expenses 934,303 881,079 6.0%
Operating Income (Loss) (302,309)$ (293,576)$ 3.0%
Nonoperating Revenues (Expenses) 308,123 281,917 9.3%
Income (Loss) Before Other Revenues, Expenses and Transfers 5,814$ (11,659)$ (149.9%)
Other Revenues, Expenses and Transfers 41,604 34,333 21.2%
Change in Net Position 47,418$ 22,674$ 109.1%
Net Position, Beginning of Year 701,802$ 796,263$ (11.9%)
Restatement (6,285) (117,135) (94.6%)
Restated Net Position, Beginning of Year 695,517 679,128 2.4%
Net Position, End of Year 742,935$ 701,802$ 5.9%
Condensed Comparative Statement of Revenues, Expenses and Changes in Net Position
For the Years Ended August 31, 2016 and 2015
(in thousands of dollars)
13
UNIVERSITY OF NORTH TEXAS SYSTEM Management’s Discussion and Analysis (Unaudited)
For the Year Ended August 31, 2016
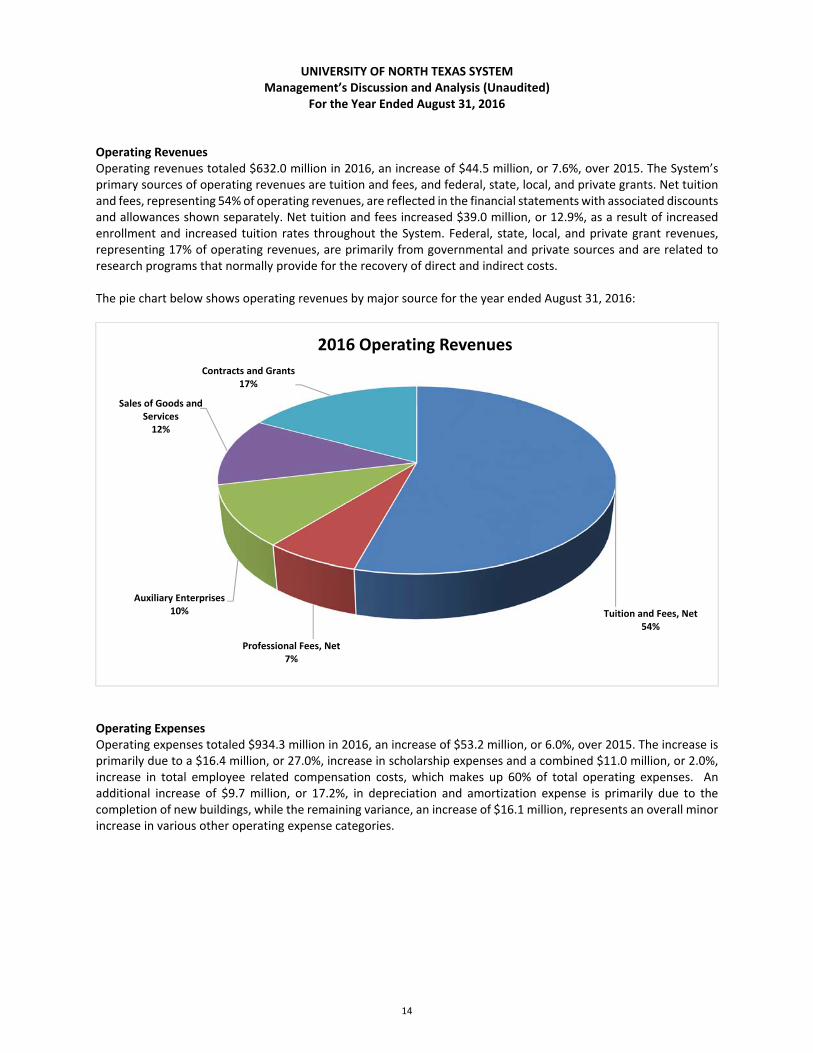
Operating Revenues Operating revenues totaled $632.0 million in 2016, an increase of $44.5 million, or 7.6%, over 2015. The System’s primary sources of operating revenues are tuition and fees, and federal, state, local, and private grants. Net tuition and fees, representing 54% of operating revenues, are reflected in the financial statements with associated discounts and allowances shown separately. Net tuition and fees increased $39.0 million, or 12.9%, as a result of increased enrollment and increased tuition rates throughout the System. Federal, state, local, and private grant revenues, representing 17% of operating revenues, are primarily from governmental and private sources and are related to research programs that normally provide for the recovery of direct and indirect costs.
The pie chart below shows operating revenues by major source for the year ended August 31, 2016:
Operating Expenses Operating expenses totaled $934.3 million in 2016, an increase of $53.2 million, or 6.0%, over 2015. The increase is primarily due to a $16.4 million, or 27.0%, increase in scholarship expenses and a combined $11.0 million, or 2.0%, increase in total employee related compensation costs, which makes up 60% of total operating expenses. An additional increase of $9.7 million, or 17.2%, in depreciation and amortization expense is primarily due to the completion of new buildings, while the remaining variance, an increase of $16.1 million, represents an overall minor increase in various other operating expense categories.
Tuition and Fees, Net54%
Professional Fees, Net7%
Auxiliary Enterprises10%
Sales of Goods and Services12%
Contracts and Grants17%
2016 Operating Revenues
14

UNIVERSITY OF NORTH TEXAS SYSTEM
Management’s Discussion and Analysis (Unaudited) For the Year Ended August 31, 2016
The table below shows the amount and percentage change of operating expenses based on natural classification for the year ended August 31, 2016:
The pie chart below shows the percentage of total operating expenses pertaining to each type of operating expense based on natural classification for the year ended August 31, 2016:
2016 2015
% Increase
(Decrease)
Operating Expenses
Cost of Goods Sold 3,813$ 5,994$ (36.4%)
Salaries and Wages 453,084 429,971 5.4%
Payroll Related Costs 109,045 121,118 (10.0%)
Professional Fees and Services 63,196 68,698 (8.0%)
Federal Pass‐Through Expenses 824 487 69.1%
State Pass‐Through Expenses 206 99 108.4%
Travel 12,395 11,193 10.7%
Materials and Supplies 44,466 39,037 13.9%
Communications and Utilities 19,761 19,234 2.7%
Repairs and Maintenance 33,393 27,564 21.1%
Rentals and Leases 14,573 11,082 31.5%
Printing and Reproduction 5,556 4,307 29.0%
Depreciation and Amortization 65,900 56,223 17.2%
Scholarships 77,452 61,004 27.0%
Claims and Losses 842 3,346 (74.8%)
Other Operating Expenses 29,797 21,722 37.2%
Total Operating Expenses 934,303$ 881,079$ 6.0%
Operating Expenses ‐ Natural Classification
For the Years Ended August 31, 2016 and 2015
(in thousands of dollars)
Salaries and Wages48%
Payroll Related Costs12%
Professional Fees and Services
7%
Materials and Supplies
5%
Depreciation and Amortization
7%
Scholarships8%
Other Operating Expenses13%
2016 Operating Expenses ‐ Natural Classification
15
UNIVERSITY OF NORTH TEXAS SYSTEM
Management’s Discussion and Analysis (Unaudited) For the Year Ended August 31, 2016
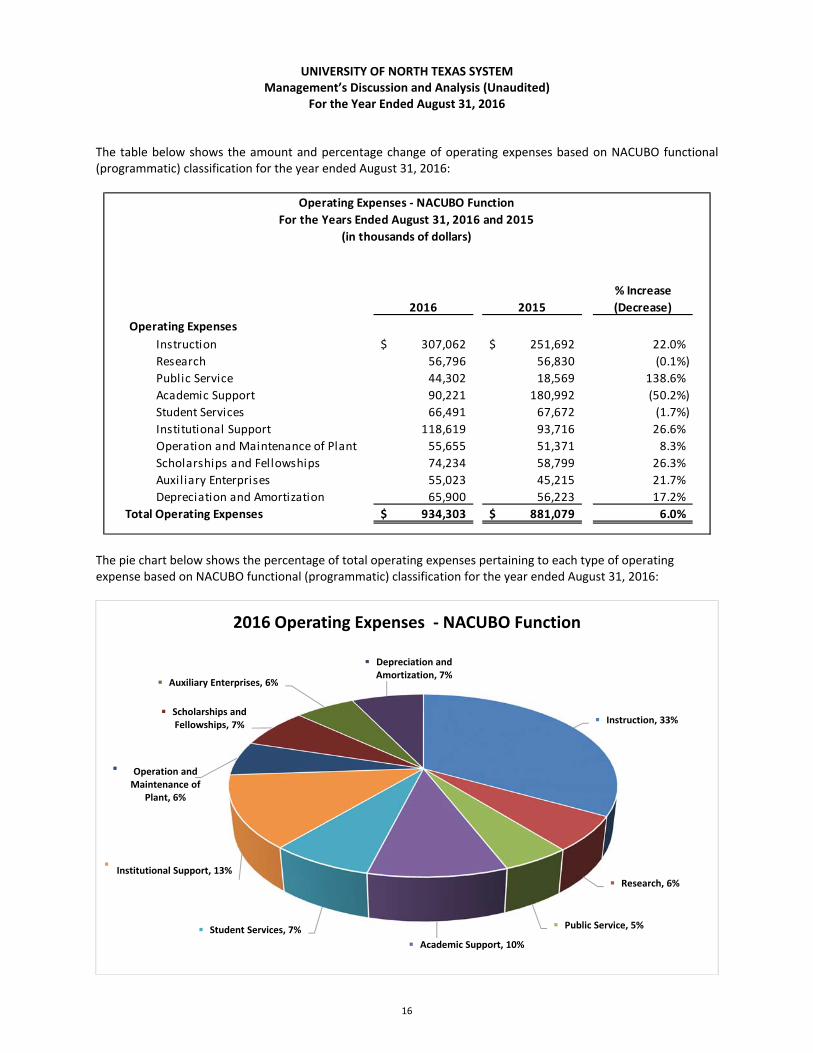
The table below shows the amount and percentage change of operating expenses based on NACUBO functional (programmatic) classification for the year ended August 31, 2016:
The pie chart below shows the percentage of total operating expenses pertaining to each type of operating expense based on NACUBO functional (programmatic) classification for the year ended August 31, 2016:
2016 2015
% Increase
(Decrease)
Operating Expenses
Instruction 307,062$ 251,692$ 22.0%
Research 56,796 56,830 (0.1%)
Public Service 44,302 18,569 138.6%
Academic Support 90,221 180,992 (50.2%)
Student Services 66,491 67,672 (1.7%)
Institutional Support 118,619 93,716 26.6%
Operation and Maintenance of Plant 55,655 51,371 8.3%
Scholarships and Fellowships 74,234 58,799 26.3%
Auxiliary Enterprises 55,023 45,215 21.7%
Depreciation and Amortization 65,900 56,223 17.2%
Total Operating Expenses 934,303$ 881,079$ 6.0%
Operating Expenses ‐ NACUBO Function
For the Years Ended August 31, 2016 and 2015
(in thousands of dollars)
Instruction, 33%
Research, 6%
Public Service, 5%
Academic Support, 10%
Student Services, 7%
Institutional Support, 13%
Operation and Maintenance of
Plant, 6%
Scholarships and Fellowships, 7%
Auxiliary Enterprises, 6%
Depreciation and Amortization, 7%
2016 Operating Expenses ‐ NACUBO Function
16

UNIVERSITY OF NORTH TEXAS SYSTEM
Management’s Discussion and Analysis (Unaudited) For the Year Ended August 31, 2016
Nonoperating Revenues and Expenses Certain significant recurring revenues and expenses are considered nonoperating. The System’s primary nonoperating revenues come from state appropriations, federal Pell grant revenue, gifts, investment income, and in 2016, gain on sales of capital assets, and net increase in fair market value of investments. The System’s primary nonoperating expenses are interest expense and fiscal charges and other nonoperating expenses. Legislative and additional appropriations increased $18.3 million, or 7.7%, between 2015 and 2016 due mainly to formula funding changes that positively benefitted HSC and other healthcare‐related educational institutions across the State. The fair value of the System’s investments increased by $10.7 million primarily due to favorable market conditions for the long‐term investment pool and endowments professionally managed by the Foundation. Interest expense and fiscal charges on capital asset financings increased by $4.6 million from $16.1 million in 2015 to $20.7 million in 2016 due to additional bond interest payments from the 2015 issuances. Other Revenues, Expenses and Transfers Other revenues, expenses and transfers is comprised of capital and endowment related additions and transfers, which increased $7.3 million, or 21.2%, in 2016. HEAF comprises the majority of the balance. Annual HEAF‐related revenue totaling $37.8 million, increased $1.2 million over prior year. HEAF is reported as capital appropriations rather than operating or nonoperating revenue. The Texas B‐On‐Time Loan program has been phased out, which resulted in a decrease in transfers to other state agencies of $6.2 million. This funding remained within the System to offset operations. Capital Asset and Debt Administration Investments in capital asset additions were $88.4 million in 2016. Major capital project activity included:
Land and Building Acquisitions (HSC) – 975 Haskell Street
Building Improvements (UNT) – Student Union, Science Research Building, Rawlins Hall, Bruce Hall, and the College of Visual Arts and Design Building
Building Improvements (HSC) – Interdisciplinary Research Building
Building Improvements (UNTD) – Dallas Student Learning and Success Center and Residence Hall
Building Improvements (System Administration) – Dallas Municipal Building The System has committed $457.0 million to capital asset additions and improvements which are currently in various stages of completion. These additions and improvements primarily consist of new buildings or renovations to existing buildings, including the Interdisciplinary Research Building at HSC, the College of Visual Arts and Design at UNT, the Dallas Municipal Building for the future use by UNT Dallas College of Law, and the Student Learning and Success Center at UNT Dallas. More detailed information regarding the System’s capital additions and commitments is provided in Note 2, Capital Assets, and Note 15, Contingencies and Commitments, in the Notes to the Consolidated Financial Statements. Revenue bonds payable represents the largest portion of the System’s liabilities. Current and non‐current revenue bonds payable increased $158.5 million to $547.9 million in 2016. All bonds related to financing of current and prior years’ construction needs reflect “Aa2” and “AA” credit ratings from two major bond rating agencies, Moody’s and Fitch, respectively. More detailed information regarding the System’s bonded indebtedness is provided in Note 5, Long‐Term Liabilities, and Note 6, Bonded Indebtedness, in the accompanying Notes to the Consolidated Financial Statements.
Economic Outlook The System’s primary sources of revenue are tuition and fees and legislative appropriations. Strong enrollment growth, program expansion, and a successful 84th legislative session contributed to a positive outlook for the System.
17

UNIVERSITY OF NORTH TEXAS SYSTEM Management’s Discussion and Analysis (Unaudited)
For the Year Ended August 31, 2016
For 2017, net tuition and fees revenues are budgeted at an increase of $52.2 million, or 17.0%, over 2016. This revenue increase is the result of modest tuition rate increases and full‐time student equivalent enrollment growth. Between fall 2015 and fall 2016, enrollment increased 3% system‐wide.
During the 84th Texas Legislative Session, the State renewed its commitment to higher education with $1.35 billion in new funding for 2016 and 2017. Significant investments in institutions included maintaining and enhancing formula rates, funding capital projects, and raising the amount of the constitutional capital appropriation (HEAF). This resulted in a two‐year appropriations increase to System institutions of over $80.0 million.
Fiscal year 2017 budgeted legislative appropriation revenues for the System are $6.9 million, or 2.7%, higher than 2016. Budgeted amounts include new funding for specialized initiatives and unique programs recognized by the 84th Legislature as deserving state support. These areas of excellence include HSC’s Institute for Patient Safety and Preventable Harm, HSC’s Texas Missing Persons and Human Identification Program, and UNT’s Texas Academy of Mathematics and Science. The merger between UNTD and the College of Law was also supported with operations funding to support the incoming second‐ and third‐year law classes.
State appropriation increases in 2017 include an influx of funding to support construction and renovation of facilities for each System institution and other capital expenditures. State‐supported construction projects were selected to allow for continued growth, increased research capacity and excellent programs. Construction of a student success and learning center at UNTD, an interdisciplinary research building at HSC, a new College of Visual Arts and Design facility at UNT, and renovations of facilities for the College of Law in downtown Dallas, will begin by January 2017. The System anticipates sufficient market access due to Fitch and Moody’s maintaining ‘stable’ outlooks on System debt.
UNT has established four Research Institutes of Excellence that are a pipeline for bringing UNT’s research to industry and marketplace. It is one of the nation’s 115 top‐tier research universities, according to latest Carnegie Classification. Strategic initiatives for growth and revenue include expanding off‐site educational opportunities for working professionals—delivering UNT degrees in new locations and modalities. From UNT’s new College at Frisco to the Collin Higher Education Center in McKinney to the Universities Center in the heart of downtown Dallas to North Central Texas College’s Gainesville campus, UNT has carefully identified these locations to deliver site‐directed workforce‐informed degrees and continuing professional education to local industry including Fortune 500, and 1,000 corporations in the region.
UNTD had record enrollment in fall 2016. Construction on the first residence hall is underway and is anticipated to open in July 2017. The Dallas Area Rapid Transit (“DART”) station adjacent to campus, which links the university directly to the downtown corridor and to the rest of the metro area, opened in October 2016. College of Law facilities are under renovation, and $72 million investments form a strong financial commitment to the College of Law. Fall 2016 enrollment is at an all‐time high of 387, and the College is working through the accreditation process.
HSC continues to expand some of its most recent innovative initiatives including enrolling the UNT System College of Pharmacy’s fourth cohort of students; furthering the Fort Worth M.D. School’s accreditation, a partnership with Texas Christian University (“TCU”) whose first class of 60 students will begin in fall 2019; and advancing the Institute for Patient Safety & Preventable Harm’s mission by creating patient safety projects, providing community education programs and offering grant funding opportunities. To strengthen HSC’s position for long‐term viability, the institution has incorporated continuous improvement as part of the planning and management initiatives. New positions will be created to further this effort. Additionally, HSC is making strides in philanthropy, by reaching donors who have expressed increased interest.
18

CONSOLIDATED
FINANCIAL STATEMENTS
of the
UNIVERSITY OF NORTH TEXAS SYSTEM
DENTON, TEXAS
For the Year Ended August 31, 2016
19

UNAUDITED
UNIVERSITY OF NORTH TEXAS SYSTEM ‐ CONSOLIDATED (794)Statement of Net Position
August 31,2016
ASSETS Current Assets
Cash and Cash Equivalents:Cash on Hand 109,654.47$ Cash in Bank 20,298,226.21Cash in Transit/Reimburse from Treasury 1,683,945.79Cash in State Treasury 16,864,464.85Cash Equivalents 144,480,766.19
Restricted Cash and Cash Equivalents:Cash on Hand 20,857.00 Cash in Bank 13,802,862.92Cash Equivalents 6,393,567.00
Short Term Investments (Note 3) 45,062,449.50Legislative Appropriations 103,099,493.83 Receivables From:
Accounts Receivable 79,443,094.57Federal 32,991,666.12Other Intergovernmental 1,525,425.95Clinical Practice 13,263,049.94Gifts, Pledges and Donations 2,236,416.55Interest and Dividends 2,162,505.12Other Receivables 1,500,986.56
Due From Other Agencies 8,287,943.59Consumable Inventories 429,677.17 Merchandise Inventories 2,757,360.14Pre‐Paid Items 45,789,314.81Loans and Contracts 2,782,039.62
Total Current Assets 544,985,767.90$
Non‐Current Assets Restricted Investments (Note 3) 60,370,688.17$ Loans and Contracts 5,058,657.66Investments (Note 3) 166,504,720.08 Gifts, Pledges and Donations 1,650,332.21Capital Assets (Note 2):
Non‐Depreciable or Non‐Amortizable 141,421,390.85 Depreciable or Amortizable, Net 883,583,026.30
Total Non‐Current Assets 1,258,588,815.27$ Total Assets 1,803,574,583.17$
DEFERRED OUTFLOWS OF RESOURCESDeferred Outflows of Resources 25,854,103.09$
Total Deferred Outflows of Resources 25,854,103.09$
TOTAL ASSETS AND DEFERRED OUTFLOWS OF RESOURCES 1,829,428,686.26$
Continued on Next Page
As of August 31, 2016
See Accompanying Notes to the Consolidated Financial Statements
20

UNAUDITED
August 31,2016
LIABILITIES Current Liabilities
Payables From:Accounts Payable 52,443,948.51$ Payroll Payable 48,435,301.88Other Payables 4,901,710.50Interest 8,910,082.34
Due To Other Agencies 335,004.82 Unearned Revenue 230,019,449.35 Notes and Loans Payable (Note 4, 5) 20,150,000.00Revenue Bonds Payable (Note 5, 6) 33,843,393.95Claims and Judgments (Note 5) 890,607.00 Employees' Compensable Leave (Note 5) 4,303,112.53Capital Lease Obligations (Note 5, 8) 1,249,546.84Funds Held for Others 2,467,341.88
Total Current Liabilities 407,949,499.60$
Non‐Current LiabilitiesRevenue Bonds Payable (Note 5, 6) 514,046,365.19$ Claims and Judgments (Note 5) 960,317.00 Employees' Compensable Leave (Note 5) 20,378,603.94Capital Lease Obligations (Note 5, 8) 2,662,979.88Net Pension Liability (Note 5, 9) 118,374,598.00
Total Non‐Current Liabilities 656,422,864.01$ Total Liabilities 1,064,372,363.61$
DEFERRED INFLOWS OF RESOURCESDeferred Inflows of Resources 22,122,704.99$
Total Deferred Inflows of Resources 22,122,704.99$
TOTAL LIABILITIES AND DEFERRED INFLOWS OF RESOURCES 1,086,495,068.60$
NET POSITIONNet Investment in Capital Assets 465,252,019.93$ Restricted For:
Funds Held as Permanent InvestmentsNon‐Expendable 46,959,890.17Expendable 18,160,583.05
Other Restricted 39,135,417.96Unrestricted 173,425,706.55
Total Net Position 742,933,617.66$
Concluded
See Accompanying Notes to the Consolidated Financial Statements
21

THIS PAGE INTENTIONALLY LEFT BLANK
22

UNAUDITED
August 31, 2016
Audited
August 31, 2015ASSETS:Cash 11,097,919$ 13,074,006$ Investments 280,449,492 258,792,772 Trust Investments 5,145,602 5,050,677Annuity Investments 1,307,661 1,320,105Accounts Receivable 2,800 2,855Contributions Receivable, Net 4,390,291 17,256,072Prepaid Expenses 103 1,094Real Estate 42,808 112,183Trust Property 461,271 157,177Inventory 7,500 7,500Cash Value of Life Insurance Policies 513,979 512,137
Total ASSETS 303,419,426$ 296,286,578$
LIABILITIES:Accounts Payable 2,044,372$ 1,495,345$Agency Funds 366,057 149,050Trust and Annuity Obligations 2,174,900 2,152,161Assets Held for Others 180,356,786 167,796,746
Total LIABILITIES 184,942,115$ 171,593,302$
NET ASSETS:Unrestricted‐Undesignated 794,640$ 2,875,193$Unrestricted‐Market Loss Over Historical Cost 1,577,403 1,272,517Unrestricted Board‐Designated (1,878,274) (1,088,028) Temporarily Restricted 25,982,410 34,796,568Permanently Restricted 92,001,132 86,837,026
Total NET ASSETS 118,477,311$ 124,693,276$ Total LIABILITIES & NET ASSETS 303,419,426$ 296,286,578$
UNIVERSITY OF NORTH TEXAS FOUNDATION, INC.Statement of Financial PositionAs of August 31, 2016
See Accompanying Notes to the Financial Statements
23

UNAUDITED
UNIVERSITY OF NORTH TEXAS SYSTEM ‐ CONSOLIDATED (794)Statement of Revenues, Expenses and Changes in Net PositionFor the Year Ended August 31, 2016
August 31,2016
OPERATING REVENUESTuition and Fees 434,876,879.48$ Discounts and Allowances (93,362,918.33)
Professional Fees 110,947,043.17 Discounts and Allowances (69,633,398.30)
Auxiliary Enterprises 65,894,140.84 Discounts and Allowances (147,746.07)
Sales of Goods and Services 73,905,043.15 Federal Grant Revenue 46,175,539.02 Federal Pass‐Through Revenue 1,810,748.61 State Grant Revenue 3,040,114.82 State Grant Pass‐Through Revenue 31,326,811.17 Other Contracts and Grants 24,988,733.90 Other Operating Revenues 2,172,587.63
Total Operating Revenues 631,993,579.09$
OPERATING EXPENSES (1)
Instruction 307,061,961.54$ Research 56,796,046.42 Public Service 44,302,218.73 Academic Support 90,220,550.05 Student Services 66,490,677.74 Institutional Support 118,618,719.72 Operation and Maintenance of Plant 55,655,357.05 Scholarships and Fellowships 74,233,990.42 Auxiliary Enterprises 55,023,485.67 Depreciation and Amortization 65,900,269.08
Total Operating Expenses 934,303,276.42$
Operating Loss (302,309,697.33)$
NONOPERATING REVENUES (EXPENSES)Legislative Appropriations (GR) 212,034,099.00$ Additional Appropriations (GR) 44,497,362.49 Federal Revenue 51,030,542.41 Gifts 11,584,783.49 Investment Income 5,345,979.45 Interest Expense and Fiscal Charges (20,645,678.68) Gain on Sale of Capital Assets 1,043,427.82 Net Increase in Fair Value of Investments 10,734,926.66 Other Nonoperating Revenues 397,319.66 Other Nonoperating Expenses (7,900,122.39)
Total Nonoperating Revenues (Expenses) 308,122,639.91$
Income Before Other Revenues, Expenses and Transfers 5,812,942.58$
OTHER REVENUES, EXPENSES AND TRANSFERSCapital Contributions 1,717,692.26$ Capital Appropriations (HEAF) 37,844,609.00 Contributions To Permanent and Term Endowments 258,291.70 Transfers To Other State Agencies (93,045.34) Transfers From Other State Agencies 810,178.00 Legislative Transfers In 1,066,757.00
Total Other Revenues, Expenses and Transfers 41,604,482.62$
CHANGE IN NET POSITION 47,417,425.20$
Beginning Net Position 701,801,561.69$ Restatement (6,285,369.23) Beginning Net Position, as Restated 695,516,192.46$
ENDING NET POSITION 742,933,617.66$
(1) See Matrix of Operating Expenses Reported by Function.
See Accompanying Notes to the Consolidated Financial Statements24

UNAUDITED
UNIVERSITY OF NORTH TEXAS SYSTEM ‐ CONSOLIDATED (794)Matrix of Operating Expenses Reported by FunctionFor the Year Ended August 31, 2016
Operation and DepreciationPublic Academic Student Institutional Maintenance of Scholarships Auxiliary and Total
Operating Expenses Instruction Research Service Support Services Support Plant and Fellowships Enterprises Amortization Expenditures
Cost of Goods Sold 222,399.83$ 5,625.00$ ‐$ 171,055.59$ 561,150.65$ 220,794.95$ 84,740.01$ ‐$ 2,547,439.41$ ‐$ 3,813,205.44$
Salaries and Wages 228,045,985.20 27,258,519.60 14,315,974.35 51,184,513.01 34,459,494.07 62,269,145.67 15,690,358.07 11,276.04 19,848,678.34 ‐ 453,083,944.35
Payroll Related Costs 47,548,068.59 6,249,062.96 3,826,547.31 13,746,084.10 10,193,612.83 17,274,433.46 4,033,455.29 2,223.52 6,171,944.47 ‐ 109,045,432.53
Professional Fees and Services 5,703,682.47 10,259,291.75 22,231,085.06 3,843,327.17 3,919,215.34 13,297,469.56 1,129,371.95 34,901.22 2,777,558.78 ‐ 63,195,903.30
Federal Pass‐Through Expenses 3,726.29 749,843.50 70,325.19 ‐ ‐ ‐ ‐ ‐ ‐ ‐ 823,894.98
State Pass‐Through Expenses ‐ 206,368.58 (351.62) ‐ ‐ ‐ ‐ ‐ ‐ ‐ 206,016.96
Travel 3,266,499.10 1,668,279.81 387,464.58 2,287,665.02 3,600,154.53 1,030,535.37 98,669.51 ‐ 55,462.21 ‐ 12,394,730.13
Materials and Supplies 7,369,068.62 6,357,563.51 1,367,832.28 10,349,354.08 3,580,163.12 3,640,100.43 6,533,575.12 1,732.09 5,266,460.45 ‐ 44,465,849.70
Communications and Utilities 685,308.28 40,311.28 45,282.38 755,028.84 1,492,435.10 2,596,158.16 10,009,327.11 750.00 4,136,874.30 ‐ 19,761,475.45
Repairs and Maintenance 1,230,102.77 669,781.76 168,168.04 2,002,095.32 1,291,754.82 6,467,467.64 14,719,342.31 2,324.29 6,842,004.63 ‐ 33,393,041.58
Rentals and Leases 2,901,384.87 910,907.60 441,156.76 1,929,803.04 1,240,665.47 3,111,309.59 2,727,853.24 ‐ 1,309,591.09 ‐ 14,572,671.66
Printing and Reproduction 743,879.80 278,692.52 184,841.42 715,162.20 1,037,077.98 2,150,489.58 99,123.19 399.95 346,171.17 ‐ 5,555,837.81
Depreciation and Amortization ‐ ‐ ‐ ‐ ‐ ‐ ‐ ‐ ‐ 65,900,269.08 65,900,269.08
Scholarships 1,796,095.41 841,144.59 219,509.93 106,562.54 129,064.23 195,139.21 7,271.27 74,156,340.66 849.06 ‐ 77,451,976.90
Claims and Losses 758,405.15 ‐ ‐ ‐ ‐ 83,500.00 ‐ ‐ ‐ ‐ 841,905.15
Other Operating Expenses 6,787,355.16 1,300,653.96 1,044,383.05 3,129,899.14 4,985,889.60 6,282,176.10 522,269.98 24,042.65 5,720,451.76 ‐ 29,797,121.40
Total Operating Expenses 307,061,961.54$ 56,796,046.42$ 44,302,218.73$ 90,220,550.05$ 66,490,677.74$ 118,618,719.72$ 55,655,357.05$ 74,233,990.42$ 55,023,485.67$ 65,900,269.08$ 934,303,276.42$
25

THIS PAGE INTENTIONALLY LEFT BLANK
26

UNAUDITED
UNRESTRICTED
TEMPORARILY
RESTRICTED
PERMANENTLY
RESTRICTED TOTALREVENUES, GAINS AND OTHER SUPPORT:Gifts 34,691$ (11,970,411)$ 6,202,771$ (5,732,949)$ Gifts in Kind ‐ 546,051 41,740 587,791 Investment Income/(Loss) 14,820 6,895,223 ‐ 6,910,043 Royalty Income ‐ 2,124 ‐ 2,124FMV of Goods Received and Other ‐ 96,541 ‐ 96,541 Actuarial Gain/(Loss) on Annuity/Trust Agreements ‐ ‐ 52,681 52,681 Revenue from Life Insurance Policies ‐ ‐ 17,387 17,387 Internal Management Fee Income 1,089,349 ‐ ‐ 1,089,349 External Management Fee Income 424,069 ‐ ‐ 424,069
Total REVENUES, GAINS AND OTHER SUPPORT 1,562,929$ (4,430,472)$ 6,314,579$ 3,447,036$
Interfund Transfers (2,542,451)$ 3,514,526$ (972,075)$ ‐$Release of Donor Restrictions 8,076,610 (7,898,212) (178,398) ‐
PROGRAM SERVICES:Scholarships and Awards 2,138,048$ 2,138,048$ Distributions to UNT 2,820,224 2,820,224 Distributions to Other Institutions 25,500 25,500 Services Purchased 1,970,356 1,970,356 Expense Reimbursements 4,356 4,356Internal Management Fee 1,089,349 1,089,349 Life Insurance Premiums 28,777 28,777 Board Designated Grant to University 220,000 220,000
Total PROGRAM SERVICES 8,296,610$ 8,296,610$
MANAGEMENT and GENERAL EXPENSES:Payroll and Benefits 1,171,182$ 1,171,182$ Administrative Expense 13,764 13,764 Travel, Telephone and Internet 16,886 16,886 Professional Development 17,559 17,559 Consulting Services 61,633 61,633 Annual Audit and Tax Preparation 27,000 27,000 Attorney Fees 1,827 1,827Office and Computer Equipment and Software 16,989 16,989 Bank Charges and Credit Card Discount 4,646 4,646Insurance ‐ Property and Liability 26,938 26,938 Uses of Operating Reserves 7,967 7,967
Total MANAGEMENT and GENERAL EXPENSES 1,366,391$ 1,366,391$
Total SERVICES and EXPENSES 9,663,001$ 9,663,001$
NET CHANGE IN ASSETS (2,565,913)$ (8,814,158)$ 5,164,106$ (6,215,965)$
NET ASSETS BEGINNING OF YEAR 3,059,682$ 34,796,568$ 86,837,026$ 124,693,276$
NET ASSETS END OF YEAR 493,769$ 25,982,410$ 92,001,132$ 118,477,311$
UNIVERSITY OF NORTH TEXAS FOUNDATION, INC.Statement Of ActivitiesFor the Twelve Months Ended August 31, 2016
See Accompanying Notes to the Financial Statements
27

UNAUDITED
UNIVERSITY OF NORTH TEXAS SYSTEM ‐ CONSOLIDATED (794)Statement of Cash FlowsFor the Year Ended August 31, 2016
August 31,2016
CASH FLOWS FROM OPERATING ACTIVITIESProceeds from Customers 112,898,298.11$ Proceeds from Tuition and Fees 358,486,870.29 Proceeds from Research Grants and Contracts 105,346,690.42 Proceeds from Loan Programs 250,564.16Proceeds from Auxiliaries 65,712,501.87 Proceeds from Other Revenues 2,122,532.56 Payments to Suppliers for Goods and Services (264,288,460.69) Payments to Employees (531,416,452.78) Payments for Loans Provided (625,731.73) Payments for Other Expenses (88,261,905.53) Net Cash Provided (Used) by Operating Activities (239,775,093.32)$
CASH FLOWS FROM NONCAPITAL FINANCING ACTIVITIESProceeds from State Appropriations 200,541,280.85$ Proceeds from Gifts 12,367,350.92 Proceeds from Endowments 258,291.70Proceeds from Transfers from Other Agencies 810,178.00Proceeds from Legislative Transfers 1,066,757.00 Proceeds from Grant Receipts 51,030,542.41 Proceeds from Other Revenues 2,467,814.50 Payments for Transfers to Other Agencies (93,045.34)Payments for Other Uses (3,905.00)Net Cash Provided (Used) by Noncapital Financing Activities 268,445,265.04$
CASH FLOWS FROM CAPITAL AND RELATED FINANCING ACTIVITIESProceeds from Sale of Capital Assets 2,707,991.07$ Proceeds from State Appropriations 37,844,609.00 Proceeds from Debt Issuance 261,586,428.55 Proceeds from Captial Contributions 451,685.81Payments for Additions to Capital Assets (75,001,732.13) Payments for Capital Leases (1,179,705.74) Payments of Principal on Debt Issuance (235,340,000.00) Payments of Other Costs of Debt Issuance (1,251,099.64) Payments of Interest on Debt Issuance (21,848,920.21) Net Cash Provided (Used) by Capital and Related Financing Activities $ (32,030,743.29)
CASH FLOWS FROM INVESTING ACTIVITIESProceeds from Sale of Investments 30,648,284.73$ Proceeds from Interest and Investment Income 4,740,094.59 Payments to Acquire Investments (75,714,226.25) Net Cash Provided (Used) by Investing Activities (40,325,846.93)$
Net Increase (Decrease) in Cash and Cash Equivalents (43,686,418.50)$
Cash and Cash Equivalents, September 1, 2015 247,340,762.93$ Cash and Cash Equivalents, August 31, 2016 203,654,344.43$
See Accompanying Notes to the Consolidated Financial Statements
28

UNAUDITED
UNIVERSITY OF NORTH TEXAS SYSTEM ‐ CONSOLIDATED (794)Statement of Cash FlowsFor the Year Ended August 31, 2016
August 31,2016
RECONCILIATION OF OPERATING LOSS TO NET CASH PROVIDED (USED)BY OPERATING ACTIVITIES
Operating Loss (302,309,697.33)$ Adjustments to Reconcile Operating Loss to Net Cash Provided (Used)by Operating Activities:Depreciation and Amortization 65,900,269.08$ Pension Expense (55,742.71) Employee Benefits Paid by State 29,163,359.49 Changes in Assets and Liabilities:
(Increase) Decrease in Receivables (6,700,085.13) (Increase) Decrease in Inventories (514,019.34) (Increase) Decrease in Loans and Contracts (375,167.57) (Increase) Decrease in Prepaid Expenses (9,123,041.11) Increase (Decrease) in Payables (19,250,805.47) Increase (Decrease) in Unearned Revenue 19,269,003.72 Increase (Decrease) in Other Liabilities (15,779,166.95) Total Adjustments 62,534,604.01$
Net Cash Provided (Used) by Operating Activities (239,775,093.32)$
NON‐CASH TRANSACTIONSNet Change in Fair Value of Investments 10,734,926.66$ Donation of Capital Assets 1,266,006.46 Borrowing Under Capital Lease Purchase 186,326.30 Gain (Loss) on Sales/Disposals of Capital Assets 1,043,427.82 Amortization of Bond Premiums (Discounts) 4,129,746.33 Amortization of Deferred Inflows/Outflows from Refunding Bonds (133,444.13) Capital Assets Acquired with Payables 11,765,119.68 Nonoperating Expenses with Payables 8,715,612.59
See Accompanying Notes to the Consolidated Financial Statements
29

THIS PAGE INTENTIONALLY LEFT BLANK
30

NOTES TO THE
CONSOLIDATED FINANCIAL STATEMENTS
of the
UNIVERSITY OF NORTH TEXAS SYSTEM
DENTON, TEXAS
For the Year Ended August 31, 2016
31

UNAUDITED
UNIVERSITY OF NORTH TEXAS SYSTEM Notes to the Consolidated Financial Statements
For the Year Ended August 31, 2016
Note 1: Summary of Significant Accounting Policies
Introduction The University of North Texas System (the “System”) is an agency of the State of Texas (the “State”) and its financial records comply with state statutes and regulations. This includes compliance with the Texas Comptroller of Public Accounts’ Reporting Requirements for Annual Financial Reports of State Agencies and Universities and with Generally Accepted Accounting Principles (“GAAP”).
The consolidated financial statements include the University of North Texas System Administration (“System Administration”) and all institutions of the System. Amounts due between and among institutions, amounts held for institutions by the System Administration and other duplications in reporting are eliminated in consolidating the financial statements.
The System is composed of the System Administration and three academic institutions as follows: the University of North Texas (“UNT”), the University of North Texas Health Science Center at Fort Worth (“HSC”), and the University of North Texas at Dallas (“UNTD”). The System is governed by a nine‐member Board of Regents appointed by the Governor of Texas and confirmed by the Texas State Senate. Three members are appointed every odd‐numbered year for six‐year terms. In addition, the Governor appoints a nonvoting student Regent for a one‐year term.
Basis of Accounting The financial statements of the System have been prepared using the economic resources measurement focus and the full accrual basis of accounting. The System reports as a business‐type activity, as defined by the Governmental Accounting Standards Board (“GASB”). Business‐type activities are those that are financed in whole or in part by fees charged to external parties for goods or services.
Under the full accrual basis of accounting, revenues, expenses, gains, losses, assets and liabilities resulting from exchange and exchange‐like transactions are recognized when the exchange takes place. Revenues, expenses, gains, losses, assets and liabilities resulting from nonexchange transactions are recognized in accordance with GASB Statement No. 33, Accounting and Financial Reporting for Nonexchange Transactions, as amended. The Statement of Revenues, Expenses and Changes in Net Position is segregated into operating and nonoperating sections. Operating activities consist of transactions that are the direct result of providing goods and services to customers or directly related to the System’s principal ongoing operations.
Assets, Liabilities, Deferred Outflows and Inflows of Resources, and Net Position Assets Cash and Cash Equivalents Short‐term highly liquid investments that are both readily convertible to known amounts of cash and having an original maturity of three months or less are considered cash equivalents.
It is the System’s policy to exclude items that meet this definition if they are part of an investment pool, which has an investment horizon of one year or greater. Therefore, highly liquid investments that are part of the Foundation‐managed long‐term investment pool are not considered cash and cash equivalents. Additionally, endowments invested in money market accounts are also excluded from cash and cash equivalents as the intent is to invest these funds for more than one year. Cash held in the State Treasury is considered cash and cash equivalents. Restricted cash and cash equivalents include restricted sources of funds used for construction of capital assets as well as funds held for debt service. The System holds bond proceeds in restricted investment accounts to be disbursed to its institutions to support capital projects.
32

UNAUDITED
UNIVERSITY OF NORTH TEXAS SYSTEM Notes to the Consolidated Financial Statements
For the Year Ended August 31, 2016
Legislative Appropriations The appropriation of revenues by the Texas Legislature (the “Legislature”) is in the form of general revenue. The Legislature meets every odd‐numbered year and approves a two‐year budget (biennial) for all State agencies. The general revenue appropriation to the System supports the instruction, research and operation of the System. Appropriations also include payments made by the State on behalf of the System for benefits related to salaries funded by state appropriations. There is no assurance that the Legislature will continue its state appropriations to the System in future years; however, the System expects that the Legislature will continue to do so. Higher Education Assistance Funds (“HEAF funds”) are general revenue appropriations received from the State designated for the acquisition of certain capital assets and capital projects. As of August 31, 2016, the unexpended amount was $74,757,006.31.
Accounts and Other Receivables Accounts receivable mainly consists of tuition and fee charges to students. Accounts receivable is shown net of an allowance for doubtful accounts, which is approximately $27.8 million of the outstanding accounts receivable balance at August 31, 2016. The System has adopted a policy of reserving for account receivables based on collections history over the previous five years. Any amount outstanding after five years is reserved at 100% per state requirements.
Federal receivables include federal grants and education scholarships.
Intergovernmental receivables include amounts due from state government or private sources in connection with reimbursement of allowable expenditures made pursuant to the System’s grants and contracts.
Clinical Practice receivables are presented net of allowances for contractual discounts and bad debts. The bad debt allowance on clinical receivables was approximately $10.7 million as of August 31, 2016. Clinical accounts receivable are subject to concentrations of patient accounts receivable credit risk. The mix of receivables (gross) from patients and third parties as of August 31, 2016 was as follows:
August 31, 2016(Gross)
County Hospital 15%Medicaid 29%Medicare 17%Commercial 19%Self‐Pay 8%Other 12%
Total 100%
Gift receivables include amounts pledged to the university by donors, net of allowances. The allowance for gift pledges is approximately $2.2 million at August 31, 2016. Multiyear gift pledges are reported at the discounted present value. At the beginning of each fiscal year, the System re‐establishes the scale of discount rates applicable for present valuing multi‐year gift pledges that are received during the new fiscal year.
Pre‐paid Items Pre‐paid items include prepaid scholarship expenses that pertain to the fall term of the following fiscal year and other various prepaid expenses.
Loans and ContractsCurrent and noncurrent loans and contracts receivables, related to student loans, are shown net of allowances. The net allowance on loans and contracts at August 31, 2016 is approximately $4.1 million.
33

UNAUDITED
UNIVERSITY OF NORTH TEXAS SYSTEM Notes to the Consolidated Financial Statements
For the Year Ended August 31, 2016
Investments The System accounts for its investments at fair value in accordance with GASB Statement No. 31, Accounting and Financial Reporting for Certain Investments and for External Investment Pools, as amended. Changes in realized gain (loss) on the carrying value of investments are reported as a component of investment income. Restricted investments include investments restricted by legal or contractual requirements, including those related to donors and constitutional restrictions.
Capital and Intangible Assets The System follows the State’s capitalization policy, which requires capitalization of assets with an initial individual cost of more than $5,000 for equipment items, $100,000 for buildings, building improvements and improvements other than buildings, and $500,000 for infrastructure items, and an estimated useful life of greater than one year. These assets are capitalized at cost or, if not purchased, at fair value as of the date of acquisition.
Purchases of library books are capitalized. Routine repairs and maintenance are charged to operating expense in the year in which the expense is incurred. Outlays for construction in progress are capitalized as incurred. Interest expense related to construction is capitalized in accordance with the requirements of GASB Statement No. 62, Codification of Accounting and Financial Reporting Guidance Contained in Pre‐November 30, 1989 FASB and AICPA Pronouncements, as amended.
Depreciation is reported on all exhaustible assets. Inexhaustible assets such as land, works of art and historical treasures are not depreciated. Depreciation is computed using the straight‐line method over the estimated useful lives of the assets, generally, 10 to 30 years for buildings and improvements, 10 to 45 years for infrastructure, 4 to 15 years for equipment, and 15 years for library books.
GASB Statement No. 51, Accounting and Financial Reporting for Intangible Assets, as amended, requires all intangible assets not specifically excluded by scope provisions to be classified as capital assets. The System has computer software that meets the criteria. Accordingly, existing authoritative guidance related to the accounting and financial reporting for capital assets is applied to computer software, as applicable.
Deferred Outflows of Resources Deferred outflows of resources relate to unamortized losses on refunding of debt and pensions.
Deferred Outflows of Resources Related to Debt Refunding For debt refunding, the difference between the reacquisition price and the net carrying amount of the old debt is deferred and reported as deferred outflows or deferred inflows. The gain or loss is amortized using the straight‐line method over the remaining life of the old debt or the life of the new debt, whichever is shorter, in the Statement of Revenues, Expenses and Changes in Net Position as a component of interest expense.
Deferred Outflows of Resources Related to Pensions Certain changes in the collective net pension liability of the Teacher Retirement System of Texas Plan (the “TRS Plan”) are reported as deferred outflows of resources related to pensions or as deferred inflows of resources related to pensions, depending on the type of change. The types of deferred outflows of resources related to pensions and their respective accounting treatments are discussed below.
• System contributions subsequent to the measurement date of the collective net pension liability arerecognized as a reduction in the net pension liability in the following year.
• The effect on the System’s proportionate share of the total pension liability of changes of economic anddemographic assumptions or of other inputs that increase the total pension liability is amortized as acomponent of pension expense using the straight‐line method over the expected average remaining servicelives of active and inactive employees.
34

UNAUDITED
UNIVERSITY OF NORTH TEXAS SYSTEM Notes to the Consolidated Financial Statements
For the Year Ended August 31, 2016
• The effect on the System’s proportionate share of the total pension liability of differences betweenexpected and actual experience that increase the total pension liability is amortized as a component ofpension expense using the straight‐line method over the expected average remaining service lives of activeand inactive employees.
• The effect on the System’s proportionate share of the collective net pension liability of less actual earningson pension plan investments than projected is amortized as a component of pension expense using thestraight‐line method over a period of five years.
Liabilities Accounts and Other Payables Accounts and other payables represent the liability for the value of assets or services received at the Statement of Net Position date for which payment is pending.
Unearned Revenue Unearned revenue represents assets received in advance of an exchange taking place in an exchange transaction or assets received prior to eligibility requirements (other than time requirements) being met in a nonexchange transaction. Unearned revenue includes $222.5 million of tuition revenue related to the semesters that have not been completed as of August 31, 2016. Tuition revenue is recognized based on the number of class days as a percentage of total class days that fall within the fiscal year.
Revenue Bonds Payable Revenue bonds payable are reported at par value. Bond discounts and premiums are amortized over the life of the bonds using the interest method. Revenue bonds payable is reported separately as either current or non‐current in the Statement of Net Position.
Claims and Judgments Claims and judgments are reported when it is probable a loss has occurred and the amount of the loss can be reasonably estimated. These liabilities include an amount for claims that were incurred but not reported. See Note 15, Contingencies and Commitments, and Note 17, Risk Management, for information on risk management, claims and judgments.
Employees’ Compensable Leave Employees’ compensable leave represents the liability that becomes due upon the occurrence of relevant events such as resignations, retirements and uses of leave balances by covered employees, in conformance with state policy and practice. Liabilities are reported separately as either current or non‐current in the Statement of Net Position. These obligations generally are paid from the same funding source from which each employee’s salary or wage compensation is paid.
Capital Lease Obligations Capital lease obligations represent the liability for future lease payments under capital lease contracts. Liabilities are reported separately as either current or non‐current in the Statement of Net Position.
Funds Held for Others Funds held for others represent funds held by the System as custodial or fiscal agent for students, faculty members, foundations and others.
Net Pension Liability The fiduciary net position of the TRS Plan has been determined using the flow of economic resources measurement focus and full accrual basis of accounting. For purposes of measuring the net pension liability, deferred outflows of resources and deferred inflows of resources related to pensions and pension expense, information about the fiduciary net position of the TRS Plan, and additions to/deductions from the TRS Plan’s fiduciary net position have
35
UNAUDITED
UNIVERSITY OF NORTH TEXAS SYSTEM Notes to the Consolidated Financial Statements
For the Year Ended August 31, 2016
been determined on the same basis as they are reported by TRS. Benefit payments (including refunds of employee contributions) are recognized when due and payable in accordance with the benefit terms. Investments are reported at fair value. The framework for measuring fair value is based on a hierarchy that gives the highest priority to the use of observable inputs in an active market and lowest priority to the use of unobservable inputs.
Deferred Inflows of Resources Deferred inflows of resources relate to unamortized gains on refunding of debt and pensions.
Deferred Inflows of Resources Related to Debt Refunding For debt refunding, the difference between the reacquisition price and the net carrying amount of the old debt is deferred and reported as deferred outflows or deferred inflows. The gain or loss is amortized using the straight‐line method over the remaining life of the old debt or the life of the new debt, whichever is shorter, in the Statement of Revenues, Expenses and Changes in Net Position as a component of interest expense.
Deferred Inflows of Resources Related to Pensions Certain changes in the collective net pension liability of the TRS Plan are reported as deferred outflows of resources related to pensions or as deferred inflows of resources related to pensions, depending on the type of change. The types of deferred inflows of resources related to pensions and their respective accounting treatments are discussed below.
• The effect on the System’s proportionate share of the total pension liability of changes of economic anddemographic assumptions or of other inputs that decrease the total pension liability is amortized as acomponent of pension expense using the straight‐line method over the expected average remaining servicelives of active and inactive employees.
• The effect on the System’s proportionate share of the total pension liability of differences betweenexpected and actual experience that decrease the total pension liability is amortized as a component ofpension expense using the straight‐line method over the expected average remaining service lives of activeand inactive employees.
• Decreases in the System’s proportion of the collective net pension liability are amortized as a componentof pension expense using the straight‐line method over the expected average remaining service lives ofactive and inactive employees.
• System contributions during the measurement period that are less than its proportionate share of total ofcontributions are amortized as a component of pension expense using the straight‐line method over theexpected average remaining service lives of active and inactive employees.
• The effect on the System’s proportionate share of the collective net pension liability of more actual earningson pension plan investments than projected is amortized as a component of pension expense using thestraight‐line method over a period of five years.
Net Position Net Investment in Capital Assets Net investment in capital assets consists of capital assets, net of accumulated depreciation, and unspent bond proceeds reduced by outstanding balances for bonds, notes and other debt that are attributed to the acquisition, construction or improvement of those assets.
Restricted Net Position Restricted net position primarily consists of permanent investments subject to restrictions externally imposed by creditors, grantors, contributors, and the like, or imposed by law through constitutional provisions or enabling legislation.
Restricted nonexpendable net position is subject to externally imposed stipulations that require the amounts be maintained in perpetuity by the System. Such assets include the System’s permanent endowment funds.
36

UNAUDITED
UNIVERSITY OF NORTH TEXAS SYSTEM Notes to the Consolidated Financial Statements
For the Year Ended August 31, 2016
Restricted expendable net position is subject to externally imposed stipulations that can be fulfilled by actions of the System pursuant to those stipulations or that expire with the passage of time. Unrestricted Net Position Unrestricted net position consists of net position that does not meet the definition of the two preceding categories. Unrestricted net position often has constraints on resources that are imposed by management, but can be removed or modified. Because the System is an agency of the State, constraints on the use of resources imposed by the State are not considered external restrictions.
When an expense is incurred that can be paid using either restricted or unrestricted resources, the System addresses each situation on a case‐by‐case basis prior to determining the resources to be used to satisfy the obligation. Generally, the System’s policy is to first apply the expense toward restricted resources and then toward unrestricted resources.
Revenues and Expenses Operating Revenues and Expenses Operating revenues include activities such as net student tuition and fees; net professional fees for hospital clinical services; net sales and services by auxiliary enterprises; and most federal, state and local grants and contracts. Operating expenses include salaries and wages, payroll related costs, professional fees and services, materials and supplies, depreciation and amortization, and scholarships and fellowships. In addition, all changes to incurred but not reported liabilities related to insurance programs are reflected as operating. Professional Fees Revenue HSC has agreements with third parties that provide for reimbursement to HSC at amounts different from its established rates. Contractual adjustments under third party reimbursement programs represent the difference between HSC’s established rates for services and the amounts reimbursed by third parties. HSC’s more significant third parties are the Medicare and Medicaid programs. Medicare outpatient services are reimbursed on a prospective basis through ambulatory payment classifications, which are based on clinical resources used in performing the procedure. Medicaid outpatient services are paid based on a fee schedule or blended rates. Scholarship Allowances and Student Aid Financial aid to students is reported in the financial statements as prescribed by the National Association of College and University Business Officers (“NACUBO”). Certain aid (student loans, funds provided to students as awarded by third parties and Federal Direct Lending) is accounted for as third party payments (credited to the student’s account and reported as revenue as if the student made the payment). All other aid is reflected in the financial statements either as operating expense or as scholarship allowances, which reduce revenues. The amount reported as operating expense represents the portion of aid that was provided to the student in the form of cash. Scholarship allowances represent the portion of aid provided to the student in the form of reduced tuition. The allowance is computed on an institution‐wide basis by allocating cash payments to students, excluding payments for services, using the ratio of total aid to the aid not considered to be third party aid. Nonoperating Revenues and Expenses Nonoperating revenues include activities such as gifts and contributions, insurance recoveries received in years subsequent to the associated loss, state appropriations, investment income and other revenue sources that are defined as nonoperating revenues by GASB. The System’s institutions are the named beneficiaries in certain lawsuits, wills, trusts, and insurance policies; however, the System does not recognize these potential refunds, gifts, and contributions until realized. Nonoperating expenses include activities such as interest expense on capital asset financings and other expenses that are defined as nonoperating expenses by GASB.
37
UNAUDITED
UNIVERSITY OF NORTH TEXAS SYSTEM Notes to the Consolidated Financial Statements
For the Year Ended August 31, 2016
Use of Estimates The preparation of financial statements in conformity with accounting principles generally accepted in the United States of America requires management to make estimates and assumptions that affect the reported amounts of assets and liabilities and disclosure of contingent assets and liabilities at the date of the financial statements. Estimates also affect the reported amounts of revenues and expenses during the reporting period. Actual results could differ from those estimates.
Upcoming Accounting Pronouncements GASB Statement No. 73, Accounting and Financial Reporting for Pensions and Related Assets That Are Not within the Scope of GASB Statement 68, and Amendments to Certain Provisions of GASB Statements 67 and 68, is intended to aid in decision making by improving the usefulness of information about pensions included in financial statements of state and local governments. The standard is the result of a review of all existing standards related to postemployment benefits with a focus on the effectiveness of providing useful decision‐making information, supporting accountability, and improving transparency. This statement will be implemented in 2017. System management expects minimal impact to the financial statements.
GASB Statement No. 74, Financial Reporting for Postemployment Benefit Plans Other Than Pension Plans, has the same objective as GASB Statement No. 73, but as it relates to other postemployment benefit plans (“OPEB plans”). This statement, if applicable, should be implemented in 2017. Since the System is not an administrator of any such plans, this statement will have no impact to the financial statements.
GASB Statement No. 75, Accounting and Financial Reporting for Postemployment Benefits Other Than Pensions, also has the same objective as Statement No’s. 73 and 74; however, this statement specifically replaces the requirements of Statements No. 45, Accounting and Financial Reporting by Employers for Postemployment Benefits Other Than Pensions, as amended, and Statement No. 57, OPEB Measurements by Agent Employers and Agent Multiple‐Employer Plans, for OPEB. Because this statement addresses the employer’s portion of OPEB, System management does anticipate a significant impact to the financial statements. The statement will be implemented in 2018. System management will await guidance from the State Comptroller’s Office as to how to implement and at what agency level this will be reported.
GASB Statement No. 80, Blending Requirements for Certain Component Units—an amendment of GASB Statement No. 14, amends the blending requirements for component units that are not‐for‐profit corporations, where the primary government is the sole corporate member. The statement will be implemented in 2017. The System is still evaluating whether this will apply to any component and therefore impact the financial statements.
GASB Statement No. 81, Irrevocable Split‐Interest Agreements, provides recognition and measurement guidance for governments which are a beneficiary of such agreements. This statement will be implemented in 2018. The System has not yet evaluated the impact this will have to the financial statements.
GASB Statement No. 82, Pension Issues—an amendment of GASB Statements No. 67, No. 68, and No. 73, addresses issues regarding (1) the presentation of payroll‐related measures in required supplementary information, (2) the selection of assumptions and the treatment of deviations from the guidance in an Actuarial Standard of Practice for financial reporting purposes, and (3) the classification of payments made by employers to satisfy employee (plan member) contribution requirements. This statement will be implemented in 2018. The System will await guidance and reporting requirements provided by the state, but minimal to no impact to the financial statements is expected.
38

UNAUDITED
UNIVERSITY OF NORTH TEXAS SYSTEM Notes to the Consolidated Financial Statements
For the Year Ended August 31, 2016
Note 2: Capital Assets
A summary of changes in capital assets for the year ended August 31, 2016 is presented below:
Reclassification
of Completed Increase Decrease
Balance Construction Interagency Interagency Balance
September 1, 2015 Adjustments In Progress Transfers Transfers Additions Deletions August 31, 2016
Non‐Depreciable or Non‐Amortizable
Assets:
Land and Land Improvements 77,823,424.89$ ‐$ ‐$ ‐$ ‐$ 1,230,000.00$ ‐$ 79,053,424.89$
Infrastructure ‐ ‐ ‐ ‐ ‐ ‐ ‐ ‐
Construction in Progress 123,688,911.53 ‐ (149,400,229.17) 666,036.10 (666,036.10) 62,671,857.99 ‐ 36,960,540.35
Other Tangible Capital Assets 25,071,765.61 ‐ ‐ ‐ ‐ 634,090.00 (298,430.00) 25,407,425.61
Land Use Rights ‐ ‐ ‐ ‐ ‐ ‐ ‐ ‐
Other Intangible Capital Assets ‐ ‐ ‐ ‐ ‐ ‐ ‐ ‐
Total Non‐Depreciable or Non‐
Amortizable Assets:226,584,102.03$ ‐$ (149,400,229.17)$ 666,036.10$ (666,036.10)$ 64,535,947.99$ (298,430.00)$ 141,421,390.85$
Depreciable Assets:
Buildings and Building Improvements 968,414,303.79$ ‐$ 136,727,966.75$ ‐$ ‐$ 5,344,739.02$ (6,103,480.96)$ 1,104,383,528.60$
Infrastructure 65,219,516.61 ‐ ‐ ‐ ‐ ‐ ‐ 65,219,516.61
Facil ities and Other Improvements 125,805,188.42 ‐ 374,751.84 ‐ ‐ ‐ (1,189,160.45) 124,990,779.81
Furniture and Equipment 144,229,026.54 ‐ ‐ 202,065.36 (202,065.36) 12,251,855.30 (4,405,200.56) 152,075,681.28
Vehicles, Boats and Aircraft 12,601,801.35 ‐ ‐ 22,978.75 (22,978.75) 1,467,199.09 (636,319.60) 13,432,680.84
Other Capital Assets 93,109,521.04 ‐ ‐ 742,868.54 (742,868.54) 4,830,688.89 (41,693.37) 97,898,516.56
Total Depreciable Assets: 1,409,379,357.75$ ‐$ 137,102,718.59$ 967,912.65$ (967,912.65)$ 23,894,482.30$ (12,375,854.94)$ 1,558,000,703.70$
Less Accumulated Depreciation for:
Buildings and Building Improvements (423,692,459.10)$ (6,285,369.23)$ ‐$ ‐$ ‐$ (40,789,584.62)$ 5,267,976.79$ (465,499,436.16)$
Infrastructure (16,101,120.16) ‐ ‐ ‐ ‐ (2,290,389.30) ‐ (18,391,509.46)
Facil ities and Other Improvements (24,323,340.15) ‐ ‐ ‐ ‐ (3,746,700.56) 957,853.28 (27,112,187.43)
Furniture and Equipment (100,103,425.42) ‐ ‐ (51,206.67) 51,206.67 (12,081,932.20) 4,013,562.07 (108,171,795.55)
Vehicles, Boats and Aircraft (7,773,790.33) ‐ ‐ ‐ ‐ (1,065,192.72) 568,298.33 (8,270,684.72)
Other Capital Assets (54,330,268.84) ‐ ‐ (71,726.82) 71,726.82 (4,322,339.35) 37,595.92 (58,615,012.27)
Total Accumulated Depreciation (626,324,404.00)$ (6,285,369.23)$ ‐$ (122,933.49)$ 122,933.49$ (64,296,138.75)$ 10,845,286.39$ (686,060,625.59)$
Depreciable Assets, Net 783,054,953.75$ (6,285,369.23)$ 137,102,718.59$ 844,979.16$ (844,979.16)$ (40,401,656.45)$ (1,530,568.55)$ 871,940,078.11$
Amortizable Assets ‐ Intangible:
Land Use Rights ‐$ ‐$ ‐$ ‐$ ‐$ ‐$ ‐$ ‐$
Computer Software 20,566,880.76 ‐ 12,297,510.58 3,361,538.75 (3,361,538.75) ‐ (2,930,071.71) 29,934,319.63
Other Intangible Capital Assets ‐ ‐ ‐ ‐ ‐ ‐ ‐ ‐
Total Amortizable Assets ‐ Intangibles 20,566,880.76$ ‐$ 12,297,510.58$ 3,361,538.75$ (3,361,538.75)$ ‐$ (2,930,071.71)$ 29,934,319.63$
Less Accumulated Amortization for:
Land Use Rights ‐$ ‐$ ‐$ ‐$ ‐$ ‐$ ‐$ ‐$
Computer Software (19,617,312.82) ‐ ‐ (3,361,538.75) 3,361,538.75 (1,604,130.33) 2,930,071.71 (18,291,371.44)
Other Intangible Capital Assets ‐ ‐ ‐ ‐ ‐ ‐ ‐ ‐
Total Accumulated Amortization (19,617,312.82)$ ‐$ ‐$ (3,361,538.75)$ 3,361,538.75$ (1,604,130.33)$ 2,930,071.71$ (18,291,371.44)$
Amortizable Assets ‐ Intangibles, Net 949,567.94$ ‐$ 12,297,510.58$ ‐$ ‐$ (1,604,130.33)$ ‐$ 11,642,948.19$
Total 1,010,588,623.72$ (6,285,369.23)$ ‐$ 1,511,015.26$ (1,511,015.26)$ 22,530,161.21$ (1,828,998.55)$ 1,025,004,417.15$
39

UNAUDITED
UNIVERSITY OF NORTH TEXAS SYSTEM Notes to the Consolidated Financial Statements
For the Year Ended August 31, 2016
Note 3: Cash, Cash Equivalents and Investments
Deposits of Cash in Bank As of August 31, 2016, the carrying amount of deposits was $34,101,089.13 as presented below.
Cash In Bank‐ Carrying Value $ 34,101,089.13
Cash in Bank per Statement of Net Position $ 34,101,089.13
Proprietary Funds Current Assets Cash in Bank $ 20,298,226.21
Proprietary Funds Current Assets Restricted Cash in Bank 13,802,862.92
Cash in Bank per Statement of Net Position $ 34,101,089.13
The carrying amount consists of all cash in local banks and is included on the Statement of Net Position as a portion of cash and cash equivalents. Assets classified as cash and cash equivalents include $150,874,333.20 that is invested in cash equivalents. The remainder of the cash and cash equivalent balance of $18,678,922.11 is comprised of cash on hand, cash in transit or reimbursement from the Treasury, and cash in the State Treasury.
As of August 31, 2016, the total bank balance was $39,272,436.96.
Custodial Credit Risk ‐ Deposits Custodial credit risk for deposits is the risk that, in the event of the failure of a depository financial institution, the agency will not be able to recover deposits or will not be able to recover collateral securities that are in the possession of an outside party. The System’s policy is that all deposits are governed by a bank depository agreement between the System and the respective banking institution. This agreement provides that the System’s deposits, to the extent such deposits exceed the maximum insured limit under deposit insurance provided by the Federal Deposit Insurance Corporation (the “FDIC”), shall at all times be collateralized with government securities.
As of August 31, 2016, the System had no bank balances that were exposed to custodial credit risk.
Investments Each institution of the System adopts an endowment investment policy that must be reviewed and approved by the System Board of Regents annually. The policy authorizes the following types of investments: U.S. Government obligations, U.S. Government Agency obligations, other government obligations, corporate obligations, corporate asset‐backed and mortgage‐backed securities, equity, international obligations, international equity, certificates of deposit, banker’s acceptances, money market mutual funds, mutual funds, repurchase agreements, private equity, hedge funds, Real Estate Investment Trusts (“REITs”), derivatives, energy and real estate.
The System’s cash management objective is to retain appropriate liquidity to meet daily operating demands while seeking higher yield on cash reserves through an appropriately diversified long‐term investment portfolio. The System obtained permission from the Attorney General’s office for the Board of Regents of the System to invest funds under its control that are held and managed by the System’s institutions under section 51.0031(c) of the Texas Education Code. Section 51.0031 of the Texas Education Code authorizes the System Board of Regents, subject to procedures and restrictions it establishes, to invest System funds in any kind of investment and in amounts it considers appropriate, provided that it adheres to the prudent person standard described in Article VII, Section 11b, of the Texas Constitution. This standard provides that the System Board of Regents, in making investments, may acquire, exchange, sell, supervise, manage or retain, through procedures and subject to restrictions it establishes and in amounts it considers appropriate, any kind of investment that prudent investors, exercising reasonable care, skill and caution, would acquire or retain in light of the purposes, terms, distribution requirements and other circumstances of the fund then prevailing, taking into consideration the investment of all of the assets of the fund rather than a single investment. All System funds subject to Board of Regents control, System endowment funds,
40
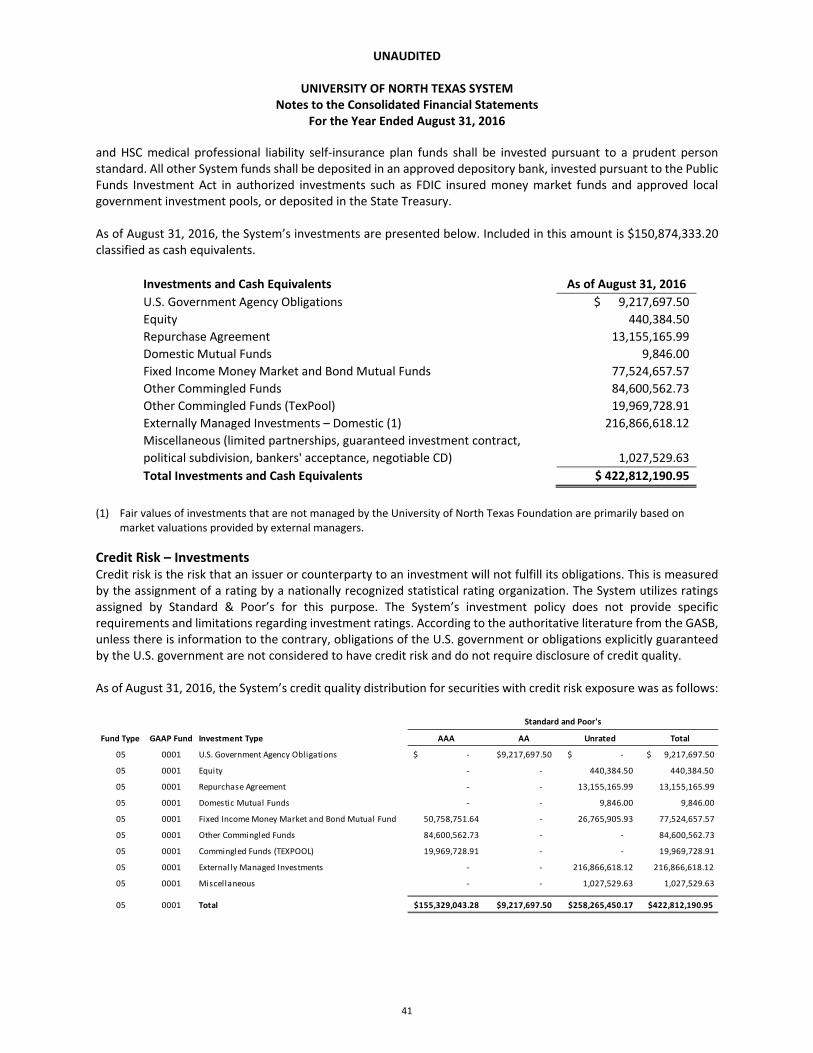
UNAUDITED
UNIVERSITY OF NORTH TEXAS SYSTEM Notes to the Consolidated Financial Statements
For the Year Ended August 31, 2016
and HSC medical professional liability self‐insurance plan funds shall be invested pursuant to a prudent person standard. All other System funds shall be deposited in an approved depository bank, invested pursuant to the Public Funds Investment Act in authorized investments such as FDIC insured money market funds and approved local government investment pools, or deposited in the State Treasury.
As of August 31, 2016, the System’s investments are presented below. Included in this amount is $150,874,333.20 classified as cash equivalents.
Investments and Cash Equivalents As of August 31, 2016
U.S. Government Agency Obligations $ 9,217,697.50
Equity 440,384.50
Repurchase Agreement 13,155,165.99
Domestic Mutual Funds 9,846.00
Fixed Income Money Market and Bond Mutual Funds 77,524,657.57
Other Commingled Funds 84,600,562.73
Other Commingled Funds (TexPool) 19,969,728.91
Externally Managed Investments – Domestic (1) 216,866,618.12
Miscellaneous (limited partnerships, guaranteed investment contract,
political subdivision, bankers' acceptance, negotiable CD) 1,027,529.63
Total Investments and Cash Equivalents $ 422,812,190.95
(1) Fair values of investments that are not managed by the University of North Texas Foundation are primarily based on market valuations provided by external managers.
Credit Risk – Investments Credit risk is the risk that an issuer or counterparty to an investment will not fulfill its obligations. This is measured by the assignment of a rating by a nationally recognized statistical rating organization. The System utilizes ratings assigned by Standard & Poor’s for this purpose. The System’s investment policy does not provide specific requirements and limitations regarding investment ratings. According to the authoritative literature from the GASB, unless there is information to the contrary, obligations of the U.S. government or obligations explicitly guaranteed by the U.S. government are not considered to have credit risk and do not require disclosure of credit quality.
As of August 31, 2016, the System’s credit quality distribution for securities with credit risk exposure was as follows:
Fund Type GAAP Fund Investment Type AAA AA Unrated Total
05 0001 U.S. Government Agency Obligations ‐$ 9,217,697.50$ ‐$ $ 9,217,697.50
05 0001 Equity ‐ ‐ 440,384.50 440,384.50
05 0001 Repurchase Agreement ‐ ‐ 13,155,165.99 13,155,165.99
05 0001 Domestic Mutual Funds ‐ ‐ 9,846.00 9,846.00
05 0001 Fixed Income Money Market and Bond Mutual Fund 50,758,751.64 ‐ 26,765,905.93 77,524,657.57
05 0001 Other Commingled Funds 84,600,562.73 ‐ ‐ 84,600,562.73
05 0001 Commingled Funds (TEXPOOL) 19,969,728.91 ‐ ‐ 19,969,728.91
05 0001 Externally Managed Investments ‐ ‐ 216,866,618.12 216,866,618.12
05 0001 Miscellaneous ‐ ‐ 1,027,529.63 1,027,529.63
05 0001 Total 155,329,043.28$ 9,217,697.50$ 258,265,450.17$ 422,812,190.95$
Standard and Poor's
41
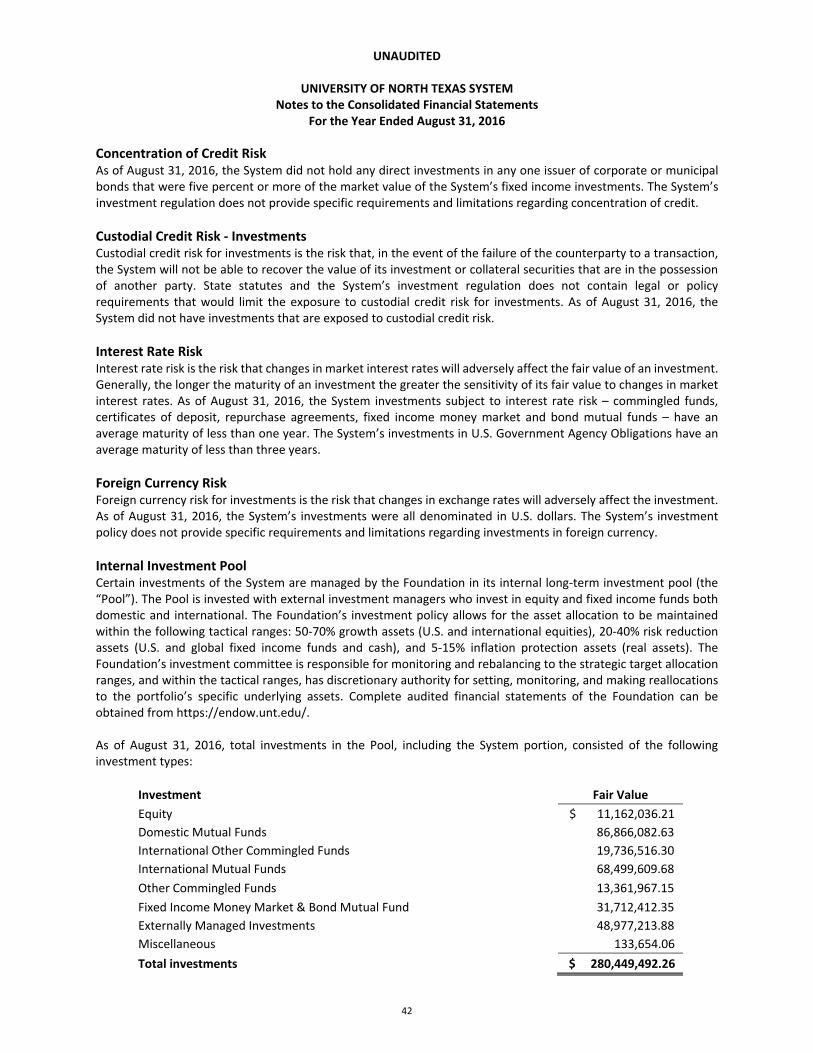
UNAUDITED
UNIVERSITY OF NORTH TEXAS SYSTEM Notes to the Consolidated Financial Statements
For the Year Ended August 31, 2016
Concentration of Credit Risk As of August 31, 2016, the System did not hold any direct investments in any one issuer of corporate or municipal bonds that were five percent or more of the market value of the System’s fixed income investments. The System’s investment regulation does not provide specific requirements and limitations regarding concentration of credit.
Custodial Credit Risk ‐ Investments Custodial credit risk for investments is the risk that, in the event of the failure of the counterparty to a transaction, the System will not be able to recover the value of its investment or collateral securities that are in the possession of another party. State statutes and the System’s investment regulation does not contain legal or policy requirements that would limit the exposure to custodial credit risk for investments. As of August 31, 2016, the System did not have investments that are exposed to custodial credit risk.
Interest Rate Risk Interest rate risk is the risk that changes in market interest rates will adversely affect the fair value of an investment. Generally, the longer the maturity of an investment the greater the sensitivity of its fair value to changes in market interest rates. As of August 31, 2016, the System investments subject to interest rate risk – commingled funds, certificates of deposit, repurchase agreements, fixed income money market and bond mutual funds – have an average maturity of less than one year. The System’s investments in U.S. Government Agency Obligations have an average maturity of less than three years.
Foreign Currency Risk Foreign currency risk for investments is the risk that changes in exchange rates will adversely affect the investment. As of August 31, 2016, the System’s investments were all denominated in U.S. dollars. The System’s investment policy does not provide specific requirements and limitations regarding investments in foreign currency.
Internal Investment Pool Certain investments of the System are managed by the Foundation in its internal long‐term investment pool (the “Pool”). The Pool is invested with external investment managers who invest in equity and fixed income funds both domestic and international. The Foundation’s investment policy allows for the asset allocation to be maintained within the following tactical ranges: 50‐70% growth assets (U.S. and international equities), 20‐40% risk reduction assets (U.S. and global fixed income funds and cash), and 5‐15% inflation protection assets (real assets). The Foundation’s investment committee is responsible for monitoring and rebalancing to the strategic target allocation ranges, and within the tactical ranges, has discretionary authority for setting, monitoring, and making reallocations to the portfolio’s specific underlying assets. Complete audited financial statements of the Foundation can be obtained from https://endow.unt.edu/.
As of August 31, 2016, total investments in the Pool, including the System portion, consisted of the following investment types:
Investment Fair Value
Equity $ 11,162,036.21
Domestic Mutual Funds 86,866,082.63
International Other Commingled Funds 19,736,516.30
International Mutual Funds 68,499,609.68
Other Commingled Funds 13,361,967.15
Fixed Income Money Market & Bond Mutual Fund 31,712,412.35
Externally Managed Investments 48,977,213.88
Miscellaneous 133,654.06
Total investments $ 280,449,492.26
42
UNAUDITED
UNIVERSITY OF NORTH TEXAS SYSTEM Notes to the Consolidated Financial Statements
For the Year Ended August 31, 2016
The System’s unitized portion of the Pool’s investments as of August 31, 2016 is $177,704,787.68.
The Pool’s investments are not rated by Standard & Poor’s. As of August 31, 2016, the Pool did not hold any direct investments in any one issuer of corporate or municipal bonds that were five percent or more of the market value of the Pool’s investments. The Pool did not have investments exposed to custodial credit risk. The Pool’s investments subject to interest rate risk – fixed income money market and bond mutual funds – have an average maturity of less than one year.
As of August 31, 2016, the System’s investments in the Pool consisted of the following investment types:
Common Stock Common stocks are units of ownership in publicly‐held corporations. Shareholders typically have rights to vote and to receive dividends. Claims of common stock holders are subordinate to claims of creditors, bond holders, and preferred stock holders.
Equity Equity and stock mutual funds are mutual funds that invest primarily in stocks, although at times they might hold some fixed‐income and money market securities.
Alternative Investments Alternative investments consist of hedge funds, real estate, private equity, and other pooled funds that are not registered with the Securities and Exchange Commission (the “SEC”).
Fixed Income and Bond Mutual Funds Fixed income and bond mutual funds are mutual funds that, by policy, invest in the fixed‐income sector.
Fixed Income Money Market Mutual Funds Money market mutual funds are open‐end mutual funds registered with the SEC that must comply with the SEC's "Rule 2a‐7," which imposes certain restrictions, such as a requirement that the fund's board must attempt to maintain a stable net asset value per share or stable price per share, limits on the maximum maturity of any individual security in the fund's portfolio, and limits on the maximum weighted‐average portfolio maturity and life. Money market funds typically attempt to maintain a net asset value or price of $1.00 per share.
Fair Value Measurements The System records investments at fair value as of August 31, 2016. Fair value is defined as the price that would be received to sell an asset or paid to transfer a liability in an orderly transaction between market participants at the measurement date. The System categorizes its fair value measurements within the fair value hierarchy established by generally accepted accounting principles. The hierarchy is based on the valuation inputs used to measure fair value of the assets. An investment’s level within the fair value hierarchy is based on the lowest level of any input that is significant to the fair value measurement. The following describes the hierarchy of inputs used to measure fair value on a recurring basis:
Level 1 Quoted prices (unadjusted) for identical assets or liabilities in active markets that a government can access at the measurement date
Level 2 Inputs other than quoted prices included within Level 1 that are observable for an asset or liability, either directly (quoted market prices for similar assets or liabilities) or indirectly (corroborated from observable market information)
Level 3 Unobservable inputs for an asset or liability
43
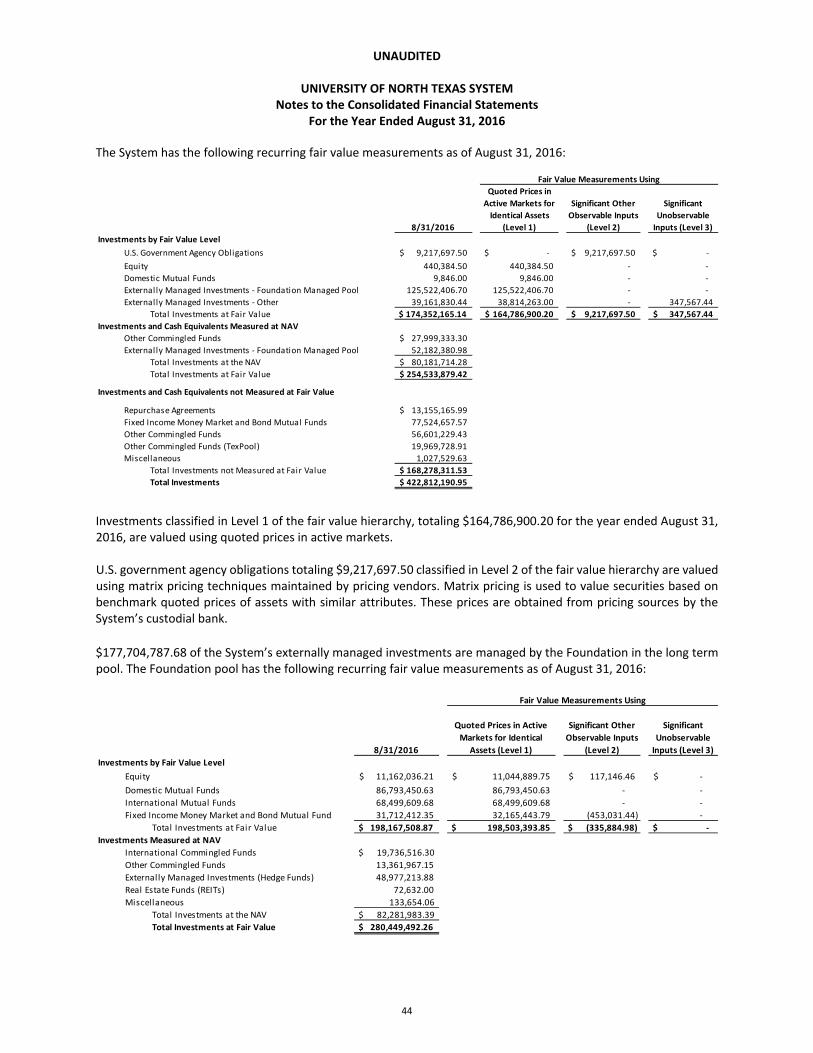
UNAUDITED
UNIVERSITY OF NORTH TEXAS SYSTEM Notes to the Consolidated Financial Statements
For the Year Ended August 31, 2016
The System has the following recurring fair value measurements as of August 31, 2016:
Investments classified in Level 1 of the fair value hierarchy, totaling $164,786,900.20 for the year ended August 31, 2016, are valued using quoted prices in active markets. U.S. government agency obligations totaling $9,217,697.50 classified in Level 2 of the fair value hierarchy are valued using matrix pricing techniques maintained by pricing vendors. Matrix pricing is used to value securities based on benchmark quoted prices of assets with similar attributes. These prices are obtained from pricing sources by the System’s custodial bank.
$177,704,787.68 of the System’s externally managed investments are managed by the Foundation in the long term pool. The Foundation pool has the following recurring fair value measurements as of August 31, 2016:
8/31/2016
Quoted Prices in
Active Markets for
Identical Assets
(Level 1)
Significant Other
Observable Inputs
(Level 2)
Significant
Unobservable
Inputs (Level 3)
U.S. Government Agency Obligations 9,217,697.50$ $ ‐ 9,217,697.50$ $ ‐
Equity 440,384.50 440,384.50 ‐ ‐
Domestic Mutual Funds 9,846.00 9,846.00 ‐ ‐
Externally Managed Investments ‐ Foundation Managed Pool 125,522,406.70 125,522,406.70 ‐ ‐
Externally Managed Investments ‐ Other 39,161,830.44 38,814,263.00 ‐ 347,567.44
Total Investments at Fair Value $ 174,352,165.14 164,786,900.20$ 9,217,697.50$ 347,567.44$
Investments and Cash Equivalents Measured at NAV
Other Commingled Funds 27,999,333.30$
Externally Managed Investments ‐ Foundation Managed Pool 52,182,380.98
Total Investments at the NAV 80,181,714.28$
Total Investments at Fair Value 254,533,879.42$
Repurchase Agreements 13,155,165.99$
Fixed Income Money Market and Bond Mutual Funds 77,524,657.57
Other Commingled Funds 56,601,229.43
Other Commingled Funds (TexPool) 19,969,728.91
Miscellaneous 1,027,529.63
Total Investments not Measured at Fair Value 168,278,311.53$
Total Investments 422,812,190.95$
Fair Value Measurements Using
Investments by Fair Value Level
Investments and Cash Equivalents not Measured at Fair Value
8/31/2016
Quoted Prices in Active
Markets for Identical
Assets (Level 1)
Significant Other
Observable Inputs
(Level 2)
Significant
Unobservable
Inputs (Level 3)
Equity 11,162,036.21$ 11,044,889.75$ 117,146.46$ ‐$
Domestic Mutual Funds 86,793,450.63 86,793,450.63 ‐ ‐
International Mutual Funds 68,499,609.68 68,499,609.68 ‐ ‐
Fixed Income Money Market and Bond Mutual Fund 31,712,412.35 32,165,443.79 (453,031.44) ‐
Total Investments at Fair Value $ 198,167,508.87 $ 198,503,393.85 $ (335,884.98) $ ‐
Investments Measured at NAV
International Commingled Funds $ 19,736,516.30
Other Commingled Funds 13,361,967.15
Externally Managed Investments (Hedge Funds) 48,977,213.88
Real Estate Funds (REITs) 72,632.00
Miscellaneous 133,654.06
Total Investments at the NAV $ 82,281,983.39
Total Investments at Fair Value $ 280,449,492.26
Fair Value Measurements Using
Investments by Fair Value Level
44
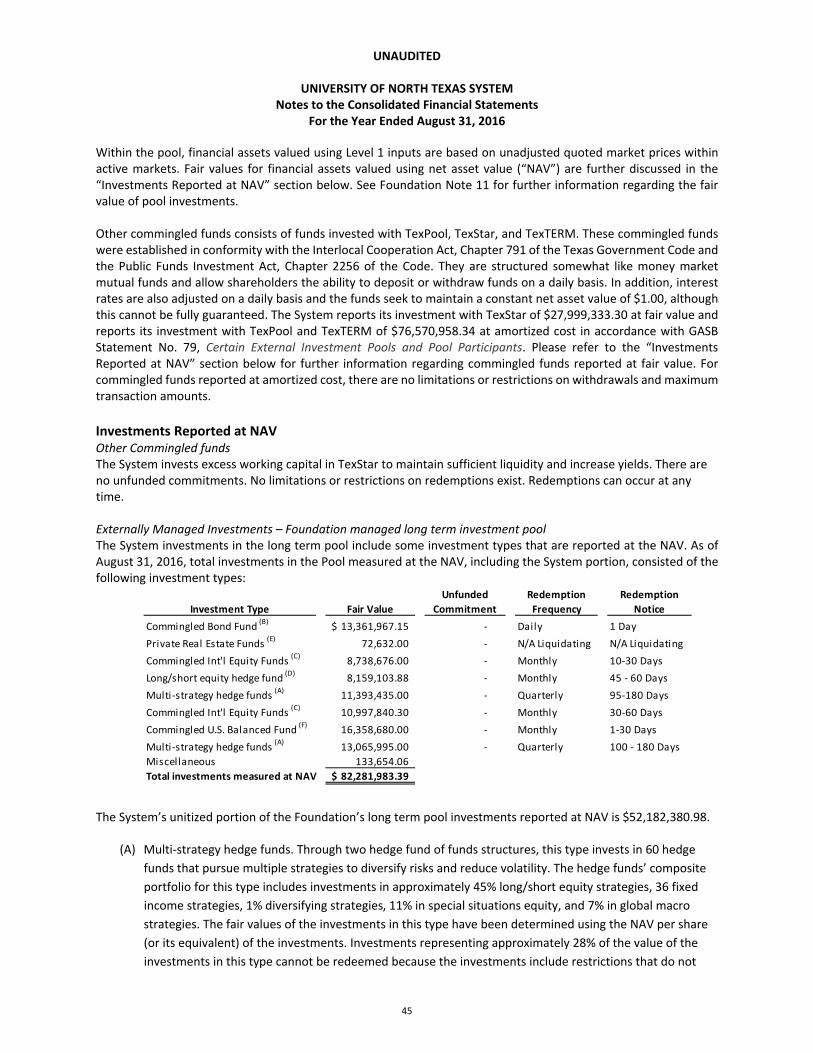
UNAUDITED
UNIVERSITY OF NORTH TEXAS SYSTEM Notes to the Consolidated Financial Statements
For the Year Ended August 31, 2016
Within the pool, financial assets valued using Level 1 inputs are based on unadjusted quoted market prices within active markets. Fair values for financial assets valued using net asset value (“NAV”) are further discussed in the “Investments Reported at NAV” section below. See Foundation Note 11 for further information regarding the fair value of pool investments.
Other commingled funds consists of funds invested with TexPool, TexStar, and TexTERM. These commingled funds were established in conformity with the Interlocal Cooperation Act, Chapter 791 of the Texas Government Code and the Public Funds Investment Act, Chapter 2256 of the Code. They are structured somewhat like money market mutual funds and allow shareholders the ability to deposit or withdraw funds on a daily basis. In addition, interest rates are also adjusted on a daily basis and the funds seek to maintain a constant net asset value of $1.00, although this cannot be fully guaranteed. The System reports its investment with TexStar of $27,999,333.30 at fair value and reports its investment with TexPool and TexTERM of $76,570,958.34 at amortized cost in accordance with GASB Statement No. 79, Certain External Investment Pools and Pool Participants. Please refer to the “Investments Reported at NAV” section below for further information regarding commingled funds reported at fair value. For commingled funds reported at amortized cost, there are no limitations or restrictions on withdrawals and maximum transaction amounts.
Investments Reported at NAV Other Commingled funds The System invests excess working capital in TexStar to maintain sufficient liquidity and increase yields. There are no unfunded commitments. No limitations or restrictions on redemptions exist. Redemptions can occur at any time.
Externally Managed Investments – Foundation managed long term investment pool The System investments in the long term pool include some investment types that are reported at the NAV. As of August 31, 2016, total investments in the Pool measured at the NAV, including the System portion, consisted of the following investment types:
The System’s unitized portion of the Foundation’s long term pool investments reported at NAV is $52,182,380.98.
(A) Multi‐strategy hedge funds. Through two hedge fund of funds structures, this type invests in 60 hedge
funds that pursue multiple strategies to diversify risks and reduce volatility. The hedge funds’ composite
portfolio for this type includes investments in approximately 45% long/short equity strategies, 36 fixed
income strategies, 1% diversifying strategies, 11% in special situations equity, and 7% in global macro
strategies. The fair values of the investments in this type have been determined using the NAV per share
(or its equivalent) of the investments. Investments representing approximately 28% of the value of the
investments in this type cannot be redeemed because the investments include restrictions that do not
Investment Type Fair Value
Unfunded
Commitment
Redemption
Frequency
Redemption
Notice
Commingled Bond Fund (B)
13,361,967.15$ ‐ Daily 1 Day
Private Real Estate Funds (E)
72,632.00 ‐ N/A Liquidating N/A Liquidating
Commingled Int'l Equity Funds (C)
8,738,676.00 ‐ Monthly 10‐30 Days
Long/short equity hedge fund (D)
8,159,103.88 ‐ Monthly 45 ‐ 60 Days
Multi‐strategy hedge funds (A)
11,393,435.00 ‐ Quarterly 95‐180 Days
Commingled Int'l Equity Funds (C)
10,997,840.30 ‐ Monthly 30‐60 Days
Commingled U.S. Balanced Fund (F)
16,358,680.00 ‐ Monthly 1‐30 Days
Multi‐strategy hedge funds (A)
13,065,995.00 ‐ Quarterly 100 ‐ 180 Days
Miscellaneous 133,654.06
Total investments measured at NAV 82,281,983.39$
45
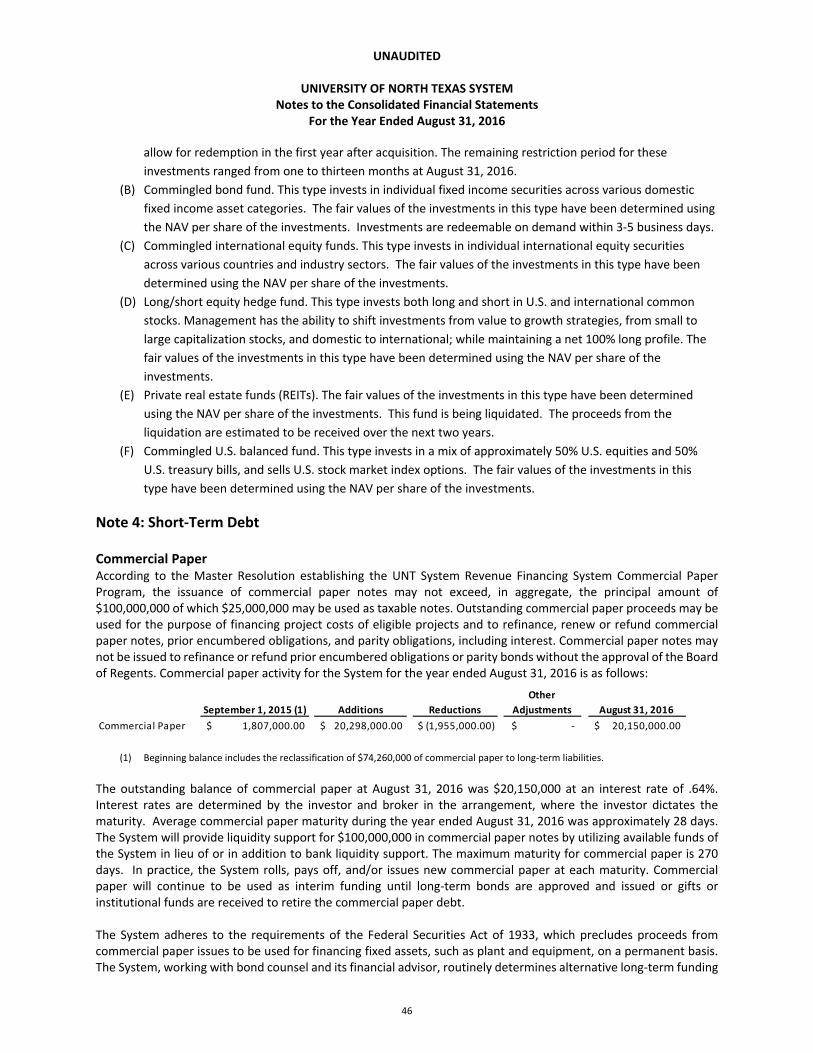
UNAUDITED
UNIVERSITY OF NORTH TEXAS SYSTEM Notes to the Consolidated Financial Statements
For the Year Ended August 31, 2016
allow for redemption in the first year after acquisition. The remaining restriction period for these
investments ranged from one to thirteen months at August 31, 2016.
(B) Commingled bond fund. This type invests in individual fixed income securities across various domestic
fixed income asset categories. The fair values of the investments in this type have been determined using
the NAV per share of the investments. Investments are redeemable on demand within 3‐5 business days.
(C) Commingled international equity funds. This type invests in individual international equity securities
across various countries and industry sectors. The fair values of the investments in this type have been
determined using the NAV per share of the investments.
(D) Long/short equity hedge fund. This type invests both long and short in U.S. and international common
stocks. Management has the ability to shift investments from value to growth strategies, from small to
large capitalization stocks, and domestic to international; while maintaining a net 100% long profile. The
fair values of the investments in this type have been determined using the NAV per share of the
investments.
(E) Private real estate funds (REITs). The fair values of the investments in this type have been determined
using the NAV per share of the investments. This fund is being liquidated. The proceeds from the
liquidation are estimated to be received over the next two years.
(F) Commingled U.S. balanced fund. This type invests in a mix of approximately 50% U.S. equities and 50%
U.S. treasury bills, and sells U.S. stock market index options. The fair values of the investments in this
type have been determined using the NAV per share of the investments.
Note 4: Short‐Term Debt
Commercial Paper According to the Master Resolution establishing the UNT System Revenue Financing System Commercial Paper Program, the issuance of commercial paper notes may not exceed, in aggregate, the principal amount of $100,000,000 of which $25,000,000 may be used as taxable notes. Outstanding commercial paper proceeds may be used for the purpose of financing project costs of eligible projects and to refinance, renew or refund commercial paper notes, prior encumbered obligations, and parity obligations, including interest. Commercial paper notes may not be issued to refinance or refund prior encumbered obligations or parity bonds without the approval of the Board of Regents. Commercial paper activity for the System for the year ended August 31, 2016 is as follows:
(1) Beginning balance includes the reclassification of $74,260,000 of commercial paper to long‐term liabilities.
The outstanding balance of commercial paper at August 31, 2016 was $20,150,000 at an interest rate of .64%. Interest rates are determined by the investor and broker in the arrangement, where the investor dictates the maturity. Average commercial paper maturity during the year ended August 31, 2016 was approximately 28 days. The System will provide liquidity support for $100,000,000 in commercial paper notes by utilizing available funds of the System in lieu of or in addition to bank liquidity support. The maximum maturity for commercial paper is 270 days. In practice, the System rolls, pays off, and/or issues new commercial paper at each maturity. Commercial paper will continue to be used as interim funding until long‐term bonds are approved and issued or gifts or institutional funds are received to retire the commercial paper debt.
The System adheres to the requirements of the Federal Securities Act of 1933, which precludes proceeds from commercial paper issues to be used for financing fixed assets, such as plant and equipment, on a permanent basis. The System, working with bond counsel and its financial advisor, routinely determines alternative long‐term funding
September 1, 2015 (1) Additions Reductions
Other
Adjustments August 31, 2016
Commercial Paper $ 1,807,000.00 $ 20,298,000.00 $ (1,955,000.00) $ ‐ $ 20,150,000.00
46

UNAUDITED
UNIVERSITY OF NORTH TEXAS SYSTEM Notes to the Consolidated Financial Statements
For the Year Ended August 31, 2016
to ensure that commercial paper is used as interim financing only and will be paid off after completion of construction or equipment acquisition.
Note 5: Long‐Term Liabilities
Changes in Long‐Term Liabilities The following changes occurred in long‐term liabilities during the year ended August 31, 2016:
Revenue Bonds Payable Scheduled principal and interest payments for revenue bonds issued and outstanding as of August 31, 2016 are as follows:
Total interest and fiscal charges incurred for the year ended August 31, 2016 was $20,655,646.82. Of this total, the System capitalized $729,544.22 associated with financing capital projects during the construction phase. In addition, the System recorded $2,599,147.29 as a reduction to this balance relating to the amortization of premiums and deferred outflows of resources resulting from losses on bond refundings. The remaining amount of $17,326,955.31 was reported as interest expense and fiscal charges for the year ended August 31, 2016.
Capital Lease Obligations See Note 8, Leases, for more information on capital lease obligations.
September 1, 2015 Additions Reductions August 31, 2016Amounts Due
Within One Year
Amounts Due
Thereafter
Bonds Payable:
Revenue Bonds Payable 368,900,000.00$ 224,030,000.00$ 77,625,000.00$ 515,305,000.00$ 30,540,000.00$ 484,765,000.00$
Unamortized Net Premiums 20,491,949.43 17,258,428.55 5,165,618.84 32,584,759.14 3,303,393.95 29,281,365.19$
Total Bonds Payable 389,391,949.43$ 241,288,428.55$ 82,790,618.84$ 547,889,759.14$ 33,843,393.95$ 514,046,365.19$
Loans Payable 155,760,000.00$ ‐$ 155,760,000.00$ ‐$ ‐$ ‐$
Capital Lease Obligations 4,901,199.22 186,326.30 1,174,998.80 3,912,526.72 1,249,546.84 2,662,979.88
Claims and Judgments 3,578,232.00 423,960.00 2,151,268.00 1,850,924.00 890,607.00 960,317.00
Net Pension Liabil ity 103,405,818.19 49,108,503.00 34,139,723.19 118,374,598.00 118,374,598.00
Compensable Leave 26,141,036.81 2,148,766.11 3,608,086.45 24,681,716.47 4,303,112.53 20,378,603.94
Total Long‐Term Liabilities 683,178,235.65$ 293,155,983.96$ 279,624,695.28$ 696,709,524.33$ 40,286,660.32$ 656,422,864.01$
Year(s) Principal Interest Total
2017 $ 30,540,000.00 $ 22,290,002.23 $ 52,830,002.23
2018 29,400,000.00 21,163,094.46 50,563,094.46
2019 29,840,000.00 20,136,256.81 49,976,256.81
2020 28,530,000.00 19,093,919.91 47,623,919.91
2021 29,610,000.00 18,015,812.32 47,625,812.32
2022‐2026 126,205,000.00 72,668,868.75 198,873,868.75
2027‐2031 100,590,000.00 52,544,812.50 153,134,812.50
2032‐2036 66,665,000.00 27,587,685.00 94,252,685.00
2037‐2041 51,675,000.00 12,566,215.70 64,241,215.70
2042‐2045 22,250,000.00 2,743,567.00 24,993,567.00
Total $ 515,305,000.00 $ 268,810,234.68 $ 784,115,234.68
47

UNAUDITED
UNIVERSITY OF NORTH TEXAS SYSTEM Notes to the Consolidated Financial Statements
For the Year Ended August 31, 2016
Claims and Judgments As of August 31, 2016, there was one outstanding claim for which a liability accrual has been recognized. According to authoritative GASB guidance, liabilities should be recognized when the possibility of loss is probable and the amount of loss is reasonably estimable. See Note 15, Contingencies and Commitments, for more information on the claims and judgments against the System.
Net Pension Liability See Note 1, Summary of Significant Accounting Policies, and Note 9, Pensions, for more information on the Net Pension Liability.
Employees’ Compensable Leave According to the Texas Human Resources Management Statutes Inventory provided by the State Auditor’s Office, state agency employees who have accrued six months of continuous state employment are entitled to be paid for the accrued balance of the employee’s vacation leave as of the date of separation if the employee is not reemployed by a state agency or institution of higher education in a position which accrues vacation leave during the 30‐day period immediately following the date of separation from state employment. Substantially all full‐time System employees earn between eight and twenty‐one hours of annual leave per month depending upon the respective employee’s years of state employment. State law permits employees to carry accrued leave forward from one fiscal year to another, up to a maximum of 532 hours for those employees with 35 or more years of state service. Eligible part‐time employees’ annual leave accrual rate and maximum carryover are proportional to the number of hours appointed to work. Employees with at least six months of continuous State service who terminate their employment are entitled to payment for all accumulated annual leave. Sick leave, the accumulation of which is unlimited, is earned at the rate of eight hours per month and is paid only when an employee is off due to personal or family illness or to the estate of an employee in the event of his/her death. The maximum sick leave that may be paid to an employee’s estate is one‐half of the employee’s accumulated sick leave or 336 hours, whichever is less. Eligible part‐time employees’ sick leave accrual rate is proportional to the number of hours they are appointed to work. This obligation is generally paid from the same funding source as the employee’s salary or wage compensation is paid. An expense and a liability are recorded as the benefits accrue to employees, and the liability is reduced as the accrued leave is taken. No liability is recorded for non‐vesting accumulating rights to receive sick pay benefits.
Note 6: Bonded Indebtedness At August 31, 2016, the System had principal outstanding related to revenue bonds of $515,305,000. Revenue Financing System (“RFS”) debt is secured by and payable from pledged revenues as defined in the Master Resolution establishing the RFS. Pledged revenues consist of all lawfully available revenues, funds and balances, with certain exceptions, pledged to secure revenue‐supported indebtedness issued under the Master Resolution as set forth by the State.
48

UNAUDITED
UNIVERSITY OF NORTH TEXAS SYSTEM Notes to the Consolidated Financial Statements
For the Year Ended August 31, 2016
General information related to revenue bonds outstanding as of August 31, 2016, is summarized in the following table:
Early Extinguishments in 2016 A portion of RFS Refunding Bonds, Series 2012A, were defeased during 2016, reducing principal by $4,535,000.00 and unamortized premiums of $517,995.43.
• Unrestricted funds in the amount of $5,321,345.18 were used to pay related expenses of $30,057 and deposit $5,290,538.18 into an irrevocable trust with an escrow agent to provide for all future debt service payments on the defeased bonds.
• An accounting loss of $237,542.75 resulted from the transaction which was recorded as interest expense.
Bond Purpose Issue Date Interest Rates Amount Issued
Total Principal
Outstanding as of
8/31/16
RFS Bonds, Series
2009
To provide funds for the purposes of refunding commercial paper
notes, constructing and equipping buildings, and paying certain
costs of issuing the bonds
2/19/2009 3.0000% ‐ 5.2500% 38,650,000.00$ 25,495,000.00$
RFS Bonds, Series
2009A
To provide funds for the purposes of constructing and equipping
buildings, and for paying certain costs of issuing the bonds12/2/2009 3.0000% ‐ 5.0000% 159,310,000.00 130,050,000.00
RFS Refunding
Bonds, Series
2009B
To provide funds for the purposes of refunding outstanding
Consolidated University Revenue Bonds Series 1994, Revenue
Financing System Bonds Series 1999A, and Revenue Financing
System Bonds Series 2001 and for paying costs of issuing the bonds
12/2/2009 3.0000% ‐ 4.7500% 15,800,000.00 6,790,000.00
RFS Refunding
Bonds, Series
2010
To provide funds for the purposes of refunding Revenue Financing
System Bonds Series 2001, Revenue Financing System Bonds Series
2002, Revenue Financing System Bonds Series 2002A, and paying
certain costs of issuing the bonds
7/23/2010 3.0000% ‐ 5.0000% 57,625,000.00 39,335,000.00
RFS Refunding and
Improvement
Bonds, Series
2012A
To provide funds for the purposes of refunding Revenue Financing
System Bonds Series 2003; a portion of the Board’s outstanding
commercial paper notes; for purchasing, constructing, improving,
renovating, enlarging, and equipping property and infrastructure;
and paying certain costs of issuing the bonds
6/1/2012 2.0000% ‐ 5.0000% 75,890,000.00 57,420,000.00
RFS Refunding
Bonds, Taxable
Series 2012B
To provide funds for the purposes of refunding Revenue Financing
System Bonds Series 2003B and paying certain costs of issuing the
bonds
6/1/2012 0.5500% ‐ 3.2000% 4,820,000.00 4,235,000.00
RFS Refunding
Bonds, Series
2015
To provide funds for the purposes of refunding Revenue Financing
System Bonds Series 2003A and 2005 Bonds and paying certain
costs of issuing the bonds
4/30/2015 1.9500% ‐ 1.9500% 38,265,000.00 31,425,000.00
RFS Refunding
Bonds, Series
2015A
To provide funds for the purposes of refunding Revenue Financing
System Bonds Series 2014 Private Placement Arrangement, for
refunding a portion of the Board's commericial paper notes and
provide funding for constructing and equipping buildings, and
paying certain costs of issuing the bonds
10/21/2015 2.0000%‐5.0000% 105,130,000.00 104,105,000.00
RFS Refunding
Bonds, Series
2015B
To provide funds for the purposes of refunding Revenue Financing
System Bonds Series 2014 Private Placement Arrangement, for
refunding a portion of the Board's commericial paper notes, provide
10/21/2015 0.3000%‐4.8380% 73,035,000.00 70,585,000.00
RFS Refunding
Bonds, Series
2015C
To provide funds for the purposes of refunding Revenue Financing
System Bonds Series 2007 Bonds and and paying certain costs of
issuing the bonds
3/1/2016 2.4460%‐10.0000% 45,865,000.00 45,865,000.00
Total 614,390,000.00$ 515,305,000.00$
49

UNAUDITED
UNIVERSITY OF NORTH TEXAS SYSTEM Notes to the Consolidated Financial Statements
For the Year Ended August 31, 2016
RFS Refunding Bonds, Series 2015C, were issued on March 1, 2016 to refund the RFS Refunding Bonds, Series 2007 principal amount. The Series 2015C Bonds were issued at par with a face value of $45,865,000. The proceeds were used to pay the costs of issuance of $235,454.75 and to provide for debt service on the refunded bonds which were called on April 15, 2016 and are no longer outstanding. The liability for these bonds has been removed from the consolidated statement of net position.
• An economic gain from the transaction resulted in a net present value savings of $4,469,507.99 between the old and new debt service payments.
• An accounting gain of $1,035,872.52 resulted from the transaction, as the net carrying amount of $46,640,872.52 exceeded the reacquisition price of $45,865,000.00 on the refunded bonds. The carrying value of $46,640,872.52 on the refunded debt consisted of $45,605,000.00 par value, and $1,035,872.52 unamortized premiums.
Funds Available for Debt Service GASB Statement No. 48, Sales and Pledges of Receivables and Future Revenues and Intra‐Entity Transfers of Assets and Future Revenues, as amended, makes a basic distinction between sales of receivables and future revenues, on the one hand, and the pledging of receivables or future revenues to repay a borrowing (a collateralized borrowing) on the other. Total pledged revenues consist of available pledged revenues, which include the gross revenues of the RFS, the Student Union Fee, pledged general tuition (which includes general use fees), investment income, and funds on deposit in the Interest and Sinking Fund and the Reserve Fund. In addition to current year pledged revenues, any unappropriated or reserve fund balances remaining at year‐end are available for payment of the subsequent year debt service. System HEAF reserves and Health and Loan Reserves at HSC cannot be included in total pledged revenues. The following table provides the pledged revenue information for the System’s revenue bonds: Pledged Revenue Required for Future Principal and Interest on Existing Revenue Bonds
$ 784,115,234.68
Term of Commitment Year Ending 8/31 2045Percentage of Pledged Revenue 100%Current Year Pledged Revenue $ 773,097,217.62Current Year Principal and Interest Paid $ 47,906,159.96
Note 8: Leases
Operating Leases The System has entered into various operating leases for buildings, equipment, vehicles and land. Rental expenses for operating leases were $3,581,367.01 in 2016. The lease terms typically range from 12 to 60 months, where some lease terms contain optional renewals. Future minimum lease payments under non‐cancelable operating leases having an initial term in excess of one year as of August 31, 2016 were as follows:
Fiscal Year Lease Payments
2017 $ 3,039,163.13
2018 2,463,894.09
2019 1,778,811.50
2020 1,453,074.38
2021 996,830.64
2022 ‐ 2026 312,499.80
2027 ‐ 2031 312,499.80
2032 ‐ 2036 312,499.80
2037 ‐ 2041 312,499.80
2042 ‐ 2046 312,499.80
2047 and beyond 124,999.92
Total Future Minimum Operating
Lease Payments $ 11,419,272.66
50
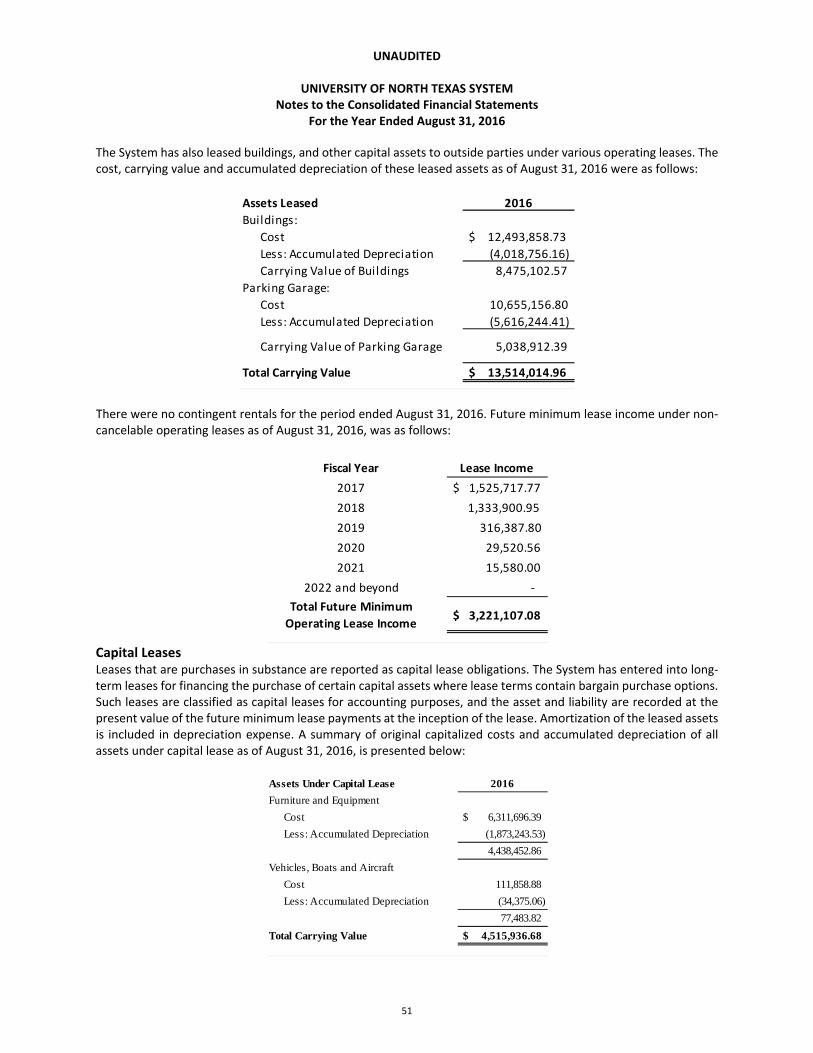
UNAUDITED
UNIVERSITY OF NORTH TEXAS SYSTEM Notes to the Consolidated Financial Statements
For the Year Ended August 31, 2016
The System has also leased buildings, and other capital assets to outside parties under various operating leases. The cost, carrying value and accumulated depreciation of these leased assets as of August 31, 2016 were as follows:
There were no contingent rentals for the period ended August 31, 2016. Future minimum lease income under non‐cancelable operating leases as of August 31, 2016, was as follows:
Capital Leases Leases that are purchases in substance are reported as capital lease obligations. The System has entered into long‐term leases for financing the purchase of certain capital assets where lease terms contain bargain purchase options. Such leases are classified as capital leases for accounting purposes, and the asset and liability are recorded at the present value of the future minimum lease payments at the inception of the lease. Amortization of the leased assets is included in depreciation expense. A summary of original capitalized costs and accumulated depreciation of all assets under capital lease as of August 31, 2016, is presented below:
Assets Leased 2016
Buildings:
Cost $ 12,493,858.73
Less: Accumulated Depreciation (4,018,756.16)
Carrying Value of Buildings 8,475,102.57
Parking Garage:
Cost 10,655,156.80
Less: Accumulated Depreciation (5,616,244.41)
Carrying Value of Parking Garage 5,038,912.39
Total Carrying Value $ 13,514,014.96
Fiscal Year Lease Income
2017 $ 1,525,717.77
2018 1,333,900.95
2019 316,387.80
2020 29,520.56
2021 15,580.00
2022 and beyond ‐
Total Future Minimum
Operating Lease Income $ 3,221,107.08
Assets Under Capital Lease 2016
Furniture and Equipment
Cost $ 6,311,696.39
Less: Accumulated Depreciation (1,873,243.53)
4,438,452.86
Vehicles, Boats and Aircraft
Cost 111,858.88
Less: Accumulated Depreciation (34,375.06)
77,483.82
Total Carrying Value $ 4,515,936.68
51

UNAUDITED
UNIVERSITY OF NORTH TEXAS SYSTEM Notes to the Consolidated Financial Statements
For the Year Ended August 31, 2016
Capital lease obligations are due in monthly, quarterly or annual installments through 2020. Future minimum lease
payments for assets under capital lease at August 31, 2016 were as follows:
Note 9: Pension Plans
Teacher Retirement System Plan Description The State has joint contributory retirement plans for the majority of its employees. One of the primary plans in which the System participates is the Teacher Retirement System of Texas (“TRS”) Plan (the “TRS Plan”). The TRS Plan is a cost‐sharing, multiple‐employer defined benefit pension plan with a special funding situation administered by TRS. The TRS Plan is established and administered in accordance with the Texas Constitution, Article 16, Section 67 and Texas Government Code, Title 8, Subtitle C. The TRS Plan is a qualified pension trust under Section 401(a) of the Internal Revenue Code. The Legislature has the authority to establish and amend benefits and contribution rates within the guidelines of the Texas Constitution. The TRS Plan’s Board of Trustees does not have the authority to establish or amend benefit terms.
The employers in the TRS Plan include the state of Texas, TRS, the state’s public schools, education service centers, charter schools, and community and junior colleges. Employees of TRS and state of Texas colleges, universities and medical schools are members of the TRS Plan.
Detailed information about the TRS Plan’s fiduciary net position is available in a separately issued Comprehensive Annual Financial Report that includes financial statements and required supplementary information. That report may be obtained by writing to TRS at 1000 Red River Street, Austin, TX, 78701‐2698.
Benefits Provided The TRS Plan provides retirement, disability annuities and death and survivor benefits. The pension benefit formulas are based on members’ average annual compensation and years of service credit. The standard annuity is 2.3% of the average of the five highest annual salaries multiplied by years of service credit. For grandfathered members who were hired on or before August 31, 2005 and meet certain criteria, the standard annuity is based on the average of the three highest annual salaries. The plan does not provide automatic post‐employment benefit changes, including automatic cost of living adjustments (“COLAs”). Ad hoc post‐employment benefit changes, including ad hoc COLAs, can be granted by the Legislature.
All System personnel employed in a TRS‐eligible position on a half time or greater basis that is projected to last for 4½ months or more are eligible for membership in the TRS Plan. However, students employed in positions that require student status as a condition of employment do not participate. Members with at least five years of service have a vested right to unreduced retirement benefits at age 65 or provided they have a combination of age plus years of service totaling 80 or more. However, members who began participation in the TRS Plan on or after September 1, 2007 must be age 60 to retire and members who were not vested in the TRS Plan on August 31, 2014, must be age 62 to retire under the second option. Members are fully vested after five years of service and are
Fiscal Year Principal Interest
2017 1,249,546.84$ 193,781.84$
2018 1,312,299.31 131,022.89
2019 1,336,986.67 65,611.83
2020 13,693.90 220.34
2021 - -
Total Future Minimum Capital Lease Payments
$ 3,912,526.72 $ 390,636.90
52
UNAUDITED
UNIVERSITY OF NORTH TEXAS SYSTEM Notes to the Consolidated Financial Statements
For the Year Ended August 31, 2016
entitled to any reduced benefits for which the eligibility requirements have been met prior to meeting the eligibility requirements for unreduced benefits. Early retirement is at age 55 with 5 years of service credit or earlier than 55 with 30 years of service credit. There are additional provisions for early retirement if the sum of the member’s age and years of service credit total at least 80, but the member is less than age 60 or 62 depending on date of employment, or if the member was grandfathered in under a previous rule.
Contributions Contribution requirements are established or amended pursuant to Article 16, Section 67 of the Texas Constitution, which requires the Legislature to establish a member contribution rate of not less than 6.0% of the member’s annual compensation and a state contribution rate of not less than 6.0% and not more than 10.0% of the aggregate annual compensation paid to members of the System during the year. Texas Government Code Section 821.006 prohibits benefit improvements, if as a result of the particular action, the time required to amortize TRS’ unfunded actuarial liabilities would be increased to a period that exceeds 31 years, or, if the amortization period already exceeds 31 years, the period would be increased by such action.
During the measurement period of 2015 for fiscal 2016 reporting, the amount of the System’s contributions recognized by the plan was $9,916,773. The contribution rates are based on a percentage of the monthly gross compensation for each member. Contributions by employees were 6.7% of gross earnings during the measurement period of 2015. Depending upon the source of funding for the employee’s compensation, the State or the System contributes a percentage of participant salaries totaling 6.8% of annual compensation for during the measurement period of 2015.
Pension Liabilities, Pension Expense and Deferred Outflows and Inflows of Resources Related to Pensions The pension plan’s fiduciary net position is determined using economic resources measurement focus and the accrual basis of accounting, which is the same basis used by Teacher Retirement System. Benefits and refunds of contributions are recognized when due and payable in accordance with the terms of the plan. Investments are reported at fair value. The framework for measuring fair value is based on a hierarchy that gives the highest priority to the use of observable inputs in an active market and lowest priority to the use of unobservable inputs. More detailed information on the plan’s investment policy, assets, and fiduciary net position, may be obtained from TRS’ fiscal 2015 Comprehensive Annual Financial Report.
At August 31, 2016, the System reported a liability of $118,374,598 for its proportionate share of the collective net pension liability of the TRS Plan. The collective net pension liability was measured as of August 31, 2015 (the “measurement date”), and the total pension liability used to calculate the net pension liability was determined by an actuarial valuation as of that date. The System’s proportion of the collective net pension liability at the measurement date was 0.3348771%, which was a decrease of 0.0521666% from the 0.3870437% measured at the prior measurement date. The System’s proportionate share was based on its contributions to the pension plan, excluding State on‐behalf contributions, relative to the contributions of all employers and non‐employer contributing entities to the TRS Plan for the period September 1, 2014 through August 31, 2015 (the “measurement period”). During the measurement period, the amount of the System’s contributions recognized by the TRS Plan, including State on‐behalf contributions, was $12,757,958.96. The State recognized $33,917,826.43 for its proportionate share of the net pension liability related to its contributions to TRS on behalf of the System. The State’s proportionate share for those contributions was 0.0959522%.
53

UNAUDITED
UNIVERSITY OF NORTH TEXAS SYSTEM Notes to the Consolidated Financial Statements
For the Year Ended August 31, 2016
For the year ended August 31, 2016, the System recognized pension expense of $9,948,627. At August 31, 2016, the System reported deferred outflows of resources and deferred inflows of resources related to pensions from the following sources:
Deferred Outflows
of Resources
Deferred Inflows of
Resources
Contributions subsequent to the measurement date $ 10,041,557.00 $ ‐
Changes of assumptions 5,588,903.00 4,223,087.00
Difference between expected and actual experience 1,329,734.00 4,549,241.00
Change in proportion and contribution difference ‐ 11,931,009.00
Net difference between projected and actual investment
return 5,454,081.00 ‐
Total $ 22,414,275.00 $ 20,703,337.00
The $10,041,557.00 reported as deferred outflows of resources resulting from contributions subsequent to the measurement date will be recognized as a reduction in the net pension liability for 2017. Other amounts reported as deferred outflows of resources and deferred inflows of resources related to pensions will be recognized in pension expense as follows:
Year Expense
2017 $ (2,718,592.00)
2018 (2,718,592.00)
2019 (2,718,594.00)
2020 5,181,055.00
2021 (2,190,286.00)
Thereafter (3,165,610.00)
Actuarial Assumptions The total pension liability is determined by an annual actuarial valuation. The table below presents the actuarial methods and assumptions used to measure the total pension liability as of the August 31, 2015 measurement date:
Actuarial Methods and Assumptions TRS Plan
Actuarial Valuation Date August 31, 2015
Actuarial Cost Method Individual Entry Age Normal
Amortization Method Level Percent, Open
Actuarial Assumptions:
Discount Rate 8.0%
Investment Rate of Return 8.0%
Inflation 2.50%
Salary Increase 3.50% to 9.50% including inflation
Mortality: Active 90% of the RP 2014 Employee Mortality Tables for
males and females
Post‐Retirement 2015 TRS Healthy Pensioner Mortality Tables
Ad Hoc Post‐Employment Benefit Changes None
54

UNAUDITED
UNIVERSITY OF NORTH TEXAS SYSTEM Notes to the Consolidated Financial Statements
For the Year Ended August 31, 2016
The actuarial assumptions used in valuation were primarily based on the result of an actuarial experience study for the four‐year period ending August 31, 2014 and adopted September 2015. There have been changes in inflation, salary increase and mortality assumptions since the prior measurement date. The inflation assumption changed from 3.00% to 2.50%. The salary increase assumption changed from a range of 4.25% to 7.25% to a range of 3.50% to 9.50% including inflation. The mortality assumption changed from the one based on 1994 Group Annuity Mortality Table to the one based on the RP 2014 employee Mortality Tables for the active members. For the retired members, the new 2015 TRS Healthy Pensioner Mortality Tables were used for the mortality assumption.
The long‐term expected rate of return on plan investments was developed using a building‐block method with assumptions including asset class of investment portfolio, target allocation, real rate of return on investments, and inflation factor. Under this method, best estimate ranges of expected future real rates of return (net of investment expense and inflation) are developed for each major asset class. These ranges are combined to produce the long‐term expected rate of return by weighing the expected future real rates of return by the target asset allocation percentage and by adding expected inflation.
The target allocation and best estimates of geometric real rates of return for each major asset class for the TRS Plan’s investment portfolio are presented below:
Asset Class Target Allocation
Long‐Term Expected
Geometric Real Rate of Return
Global Equity
U.S. 18.0% 4.6%
Non‐U.S. Developed 13.0% 5.1%
Emerging Markets 9.0% 5.9%
Directional Hedge Funds 4.0% 3.2%
Private Equity 13.0% 7.0%
Stable Value
U.S. Treasury 11.0% 0.7%
Absolute Return 0.0% 1.8%
Stable Value Hedge Funds 4.0% 3.0%
Cash 1.0% ‐0.2%
Real Return
Global Inflation Linked Bonds 3.0% 0.9%
Real Assets 16.0% 5.1%
Energy and Natural Resources 3.0% 6.6%
Commodities 0.0% 1.2%
Risk Parity
Risk Parity 5.0% 6.7%
Total 100.0%
There have been no changes to the benefit provisions of the TRS Plan since the prior measurement date. The discount rate used to measure the total net pension liability was 8.0%. There has been no change in the discount rate since the measurement period. The projected cash flows into and out of the TRS Plan assumed that members, employers, and non‐employer contributing entities make their contributions at the statutorily required rates. Under this assumption, the TRS Plan’s fiduciary net position is projected to be sufficient to make all future pension benefit payments of current active and inactive plan members. Therefore, the 8.0% long‐term expected rate of return on pension plan investments was applied to all periods of projected benefit payments to determine the total pension liability.
55

UNAUDITED
UNIVERSITY OF NORTH TEXAS SYSTEM Notes to the Consolidated Financial Statements
For the Year Ended August 31, 2016
The following presents the System’s proportionate share of the net pension liability calculated using the discount rate of 8.0%, as well as what the System’s proportionate share of the net pension liability would be if it were calculated using a
discount rate that is 1 percentage point lower (7.0%) or 1 percentage point higher (9.0%) than the current rate:
1.0% Decrease Current Discount Rate 1.0% Increase
(7.0%) (8.0%) (9.0%)
$ 185,470,683 $ 118,374,598 $ 62,487,728
Optional Retirement Program The State has also established the Optional Retirement Program (the “ORP”), a defined contribution plan, for institutions of higher education. Participation in the ORP is in lieu of participation in the TRS Plan and is available to certain eligible employees who hold faculty positions and other professional positions including but not limited to director‐level and above, librarians and coaches. The ORP provides for the purchase of annuity contracts and mutual funds and is administered by a variety of investment firms. Employees are immediately vested in their own contributions and earnings on those contributions and become vested in the employer contributions after one year and one day of service.
The employee and employer contribution rates are established by the Legislature each biennium. Depending upon the source of funding for the employee’s compensation, the System may be required to make the employer contributions in lieu of the State. Since these are individual annuity contracts, the State and the System have no additional or unfunded liability for this program. The State provides an option for a local supplement in addition to the state base rate. Each institution within the System can decide to adopt and fund a local supplement each year to provide each ORP employee the maximum employer rate. The chancellor then approves the employer rates each fiscal year. The contributions made by participants (6.65% of annual compensation) and the employer (6.60% state base rate for 2016 plus any local supplement for a maximum 8.50% of annual compensation) for the year ended August 31, 2016, is provided in the following table:
Note 12: Interagency Activity and Transactions
The System experienced routine transfers with other state agencies, which were consistent with the activities of the fund making the transfer. Repayment of interagency balances will occur within one year from the date of the financial statement. There were no balances in interagency receivable and payable at August 31, 2016.
Note 14: Adjustments to Net Position
A restatement of $6.3 million was recorded to adjust accumulated depreciation. This was due to improved historical data identified during the implementation of a new capital assets software system in fiscal year 2016. The restatement of beginning net position for fiscal year 2016 is as follows:
Total
Net Position at August 31, 2015 as Previously Reported $ 701,801,561.69 Adjustment due to componentization (useful life) corrections (6,285,369.23)Total Restatement (6,285,369.23)
Net Position at August 31, 2015 as Restated $ 695,516,192.46
ORP Participation
Member Contributions $ 9,402,553.64
Employer Contributions 10,093,701.00
Total $ 19,496,254.64
56

UNAUDITED
UNIVERSITY OF NORTH TEXAS SYSTEM Notes to the Consolidated Financial Statements
For the Year Ended August 31, 2016
Note, the Net Position at August 31, 2015 as Previously Reported per USAS was $701,742,360.05. After the adjustment due to componentization corrections of ($6,285,369.23), the Net Position at August 31, 2015 as restated is $695,456,990.82. The variance between UNT System’s hard copy AFR and USAS Net Position at August 31, 2015 of $59,201.64 is due to the pension contributions subsequent to the measurement date as recorded in fiscal 2015. Due to the late arrival of the pension information in fiscal 2015, UNT System was directed to make an estimate for the FY15 contributions amount, which ended up differing from the Texas Comptroller of Public Accounts’ (CPA) estimate by $59,201.64. UNT System elected to adjust for this difference between UNTS’ and CPA’s fiscal 2015 estimate through current year other operating expense, to ensure ending net position would be in balance between the published AFR and USAS for fiscal 2016.
Note 15: Contingencies and Commitments
The System is involved in several pending and threatened legal actions. Unless otherwise disclosed in this note, the range of potential loss from all such claims and actions, as estimated by the System’s legal counsel and management, should not materially affect the System’s financial position.
Amounts received or receivable from grantor agencies are subject to audit and adjustments by such agencies, principally the U.S. government. Any disallowed claims may constitute a liability of the System. The amount, if any, of expenditures that may be disallowed by the grantor cannot be determined at this time, although the System expects any such amounts to be immaterial.
Contingencies Design and Construction Contract Dispute In February 2012, the System entered into a Professional Services Agreement with Perkins + Will, under which Perkins + Will was to perform architectural and engineering services for the UNT University Union renovation and expansion project. In March 2013, the System entered into a Construction Manager‐at‐Risk Agreement with Beck Warrior, under which Beck Warrior was to perform pre‐construction and construction management services for the Union renovation and expansion project. Beck Warrior was to achieve substantial completion of the Union by August 20, 2015; however, substantial completion was not achieved until November 5, 2015. Beck Warrior has submitted, to date, twelve claim letters against UNT System pursuant to Chapter 2260, Texas Government Code, claiming errors and omissions by Perkins + Will and interference by UNT System. Perkins + Will has submitted invoices for additional work required due to Beck Warrior’s failure to perform. Incurrence of a loss is reasonably possible. The amount of loss for UNT System is within a range of $0 to $12,193,000, plus interest, and no best estimate of loss within this range can be determined at this time.
Gabrielle Dorais v. University of North Texas Health Science Center Case No. 048‐281181‐15, Tarrant County District Court. Sexual harassment and retaliation claims brought pursuant to the Texas Commission on Human Rights Act in which the Plaintiff claims damages in an amount exceeding $100,000 and less than $1,000,000. Incurrence of a loss is probable. The amount of loss for UNTHSC is within a range of $80,000 to $150,000, plus attorney’s fees, and no best estimate of loss within this range can be determined at this time.
Dale A. Wilkerson v. University of North Texas, Neal Smatresk, Finley Graves, Warren Burggren, Arthur Goven, and Patricia Glazebrook Case No. 4:15‐cv‐00540‐ALM, US District Court, Eastern District of Texas. Due process, equal protection and retaliation claims; limited discovery underway during pendency of Defendants’ motion to dismiss. Plaintiff seeks an unspecified amount of actual and exemplary damages, plus attorney’s fees and costs. Loss is reasonably possible.
57

UNAUDITED
UNIVERSITY OF NORTH TEXAS SYSTEM Notes to the Consolidated Financial Statements
For the Year Ended August 31, 2016
Jessica Jimenez, Jennifer Galo, Catherine Frank, in Their Individual Capacities, and William Tyler, II, As Independent Administrator of the Estate of Pamela J. Knight, Deceased v. University of North Texas Health Science Center Case No. 02‐16‐00368‐CV, Fort Worth Court of Appeals. Health care liability claim; on appeal following the denial of UNTHSC’s plea to the jurisdiction. Plaintiff seeks monetary relief over $1,000,000. UNTHSC’s damages are statutorily capped at $250,000. Loss is reasonably possible. Vera L. Moore, Individually and as Representative of the Estate of Clarence Lee Moore, Jr., Deceased v. University of North Texas Health Science Center Case No. 348‐287318‐16, Tarrant County District Court. Health care liability claim; case is pending. Plaintiff seeks monetary relief over $200,000, but not more than $1,000,000. UNTHSC’s damages are statutorily capped at $250,000. Loss is reasonably possible. Sherry B. Skinner and Robert W. Skinner v. Robert Nathaniel Reddix, Jr., M.D. and Jonathan David Boyle, M.D. Case No. 153‐288786‐16, Tarrant County District Court. Health care liability claim; filed but not served. Plaintiff seeks monetary relief over $1,000,000 for each Plaintiff. UNTHSC’s damages are statutorily capped at $250,000. Loss is reasonably possible. Anthony DeShawn Thomas v. John Mills, M.D., D. Peyton and Tarrant County Hospital District Case No. 16‐10061, U.S. Court of Appeals for the Fifth Circuit. Prisoner’s civil rights claim; on appeal following summary judgment for defendants. Plaintiff seeks actual and compensatory damages of $200,000 and punitive damages of $20,000. Loss is reasonably possible. Research Grant Repayment to National Institutes of Health UNTHSC recently concluded a compliance review of 114 of its NIH‐funded research projects over the last six years. UNTHSC determined that weaknesses exist in its reporting and certification of time and effort performed by researchers on NIH‐funded projects, which weaknesses cause UNTHSC to be non‐compliant with certain regulatory and/or sponsor‐imposed obligations. On or before January 10, 2017, UNTHSC will notify NIH of its intent to: (i) disclose to NIH the results of its review of NIH‐funded research projects; and (ii) offer to repay to NIH $8.72 million of previously received research grant funding. UNTHSC accrued a loss of $8.72 million in the current reporting period related to the repayment offer. UNTHSC believes it is reasonably possible that the government will require UNTHSC to pay an additional penalty in the amount of 50% to 100% of the repayment amount to resolve the matter.
Commitments The System continues to implement capital improvements to upgrade facilities. Approximately $457 million in capital commitments have been entered into for the construction and renovation of various facilities across all of its campuses. These projects are in various stages of completion. The estimated breakdown of funding sources available for this commitment is as follows: 61% Tuition Revenue Bonds, 30% Revenue Financing System Bonds, 6% HEAF, 2% auxiliary revenues, and less than 1% from designated funds. Approximately $230 million of the commitment, or roughly 50%, is expected to be spent in 2017.
On May 20, 2016 the System entered into a Purchase Agreement with JP Morgan to forward refund certain maturities of the Series 2009 Bonds and close and deliver on March 14, 2018. JP Morgan agreed to purchase, at closing, the Revenue Financing System Bonds, Forward Delivery Series 2018 bearing an interest rate of 2.40% annually.
Note 16: Subsequent Events On November 18, 2016 the Board of Regents approved an Extendible Commercial Paper program (“ECP”) with a maximum authorized amount of $75,000,000. Concurrently, the Board of Regents approved a resolution which limits
58

UNAUDITED
UNIVERSITY OF NORTH TEXAS SYSTEM Notes to the Consolidated Financial Statements
For the Year Ended August 31, 2016
the amount of self‐liquidity Commercial Paper (“CP”) down to $75,000,000 from $100,000,000, which may be outstanding at any one time. Following the changes adopted on November 18, 2016, the CP and ECP programs have a combined capacity of $150,000,000 up from the previous capacity of $100,000,000.
Note 17: Risk Management The System is exposed to a variety of civil claims resulting from the performance of its duties. It is System policy to periodically assess the proper combination of commercial insurance and retention of risk to cover losses to which it may be exposed. The System assumes substantially all risks associated with torts, theft, damage or destruction of assets, business interruption, errors or omissions, and job‐related illness or injuries to employees arising out of the performance of the System’s mission. Financial risks are transferred through contracts, or financed through commercial insurance or self‐insurance plans. Financial exposure from lawsuits for damages and injunctive relief arising from torts and contracts is mitigated by the function of sovereign, Eleventh Amendment and individual immunities and statutory limits on the amount of recovery. In addition, state law limits financial exposure for state law claims made against individual employees and officials. Currently the System does not carry System‐wide commercial general liability insurance for any of the institutions; commercial general liability policies are purchased on an as needed basis to address unique exposures. The System is not involved in any risk pools with other government entities. Liabilities are reported when it is both probable that a loss has occurred and the amount of that loss can be reasonably estimated. The System has various insurance and self‐insurance arrangements to manage risks of loss that are within the scope of GASB Statement No. 10, Accounting and Financial Reporting for Risk Financing and Related Insurance Issues, as amended. There are no claims pending or significant non‐accrued liabilities, except as stated in Note 15, Contingencies and Commitments. The System did not have any losses or settlements that exceeded insurance policy limits within the last three years.
Self‐Insurance Arrangements Medical Professional Liability Self‐Insurance Plan HSC manages a medical malpractice self‐insurance plan for its physicians. As of August 31, 2016, HSC had sufficient self‐insurance reserves for known claims against its health care professionals. The policy limits for this plan are $500,000/$1,500,000. Medical professional liability coverage is purchased for allied health care professionals and medical students with entity coverage, which provides a maximum per incident of $1,000,000 and an aggregate limit of $3,000,000 with no deductible. The following contingencies and Incurred But Not Reported (“IBNR”) activity was determined for the year ended August 31, 2016:
(1) The estimated claims payable for medical malpractice IBNR includes estimates of allocated loss adjustment expenses.
Student‐Athlete Accident Medical Self‐Insurance Plan The National Collegiate Athletic Association (the “NCAA”) requires its member institutions to certify coverage for medical expenses resulting from injuries sustained by student‐athletes and certain prospective student‐athletes while participating in qualifying NCAA‐sanctioned activities. UNT finances this plan to an actuarially determined attachment point and purchases commercial insurance for claims in excess of the attachment point. The attachment point for 2016 was $320,000. For the year ended August 31, 2016, claims paid out were not material.
August 31, 2015 Additions Reductions August 31, 2016
Incurred But Not Reported Self‐Insurance Claims (HSC) (1) $ 1,667,984.00 343,960.00 241,020.00 $ 1,770,924.00
Contingent Liabil itites $ 3,578,232.00 80,000.00 3,578,232.00 $ 80,000.00
59

UNAUDITED
UNIVERSITY OF NORTH TEXAS SYSTEM Notes to the Consolidated Financial Statements
For the Year Ended August 31, 2016
Incurred But Not Reported Self‐Insurance Claims The System self‐insures some physical injury and property damage claims that are not financed through commercial insurance, or are below the retention amounts for claims covered by commercial insurance. The System, as an agency of the State, is protected from risk of loss arising from these tort claims by sovereign immunity, except as such claims are permitted under the Texas Tort Claims Act. In addition to limiting the type of personal injury and damage claims that can be brought against the System, the Texas Tort Claims Act limits the loss that can result from claims that can be made to $250,000 for each person, $500,000 for each single occurrence of bodily injury or death, and $100,000 for each single occurrence of damage or destruction of property.
For the year ended August 31, 2016, claims against the System were below the liability limits established by the Texas Tort Claims Act, and thus immaterial.
Commercial Insurance Arrangements Directors and Officers/Employment Practices Liability Directors and Officers (“D&O”)/Employment Practices Liability (“EPL”) coverage insures all institutions in the System as well as all officers, employees and volunteers. The policy provides for a maximum limit of $10,000,000 with a zero deductible per insured individual and $50,000 deductible per insured entity for D&O; and $100,000 deductible per insured individual, $50,000 deductible for the entity, and a $25,000 deductible for volunteers for EPL.
Automobile The Texas Motor Vehicle Safety Responsibility Act requires that vehicles operated on a state highway be insured for minimum limits of liability in the amount of $30,000/$60,000 for bodily injury and $25,000 for property damage. The System carries liability insurance on its licensed vehicles in the amount of $1,000,000 combined single limit for bodily injury and property damage.
Medical Professional Liability UNT has medical professional liability insurance coverage for professionals at the Student Health and Wellness Center, Athletic Training and Rehabilitation Center, and the Kristin Farmer Autism Center. Under the coverage, professionals are defined as physicians, nurses, nurse practitioners, physician assistants, pharmacists, and athletic trainers. There is a maximum per incident limit of $250,000 and an aggregate limit of $1,000,000 and an aggregate of $3,000,000 with a $5,000 deductible.
Property The System carries property insurance to finance losses arising from damage to or destruction of capital assets. The insurance also covers business interruption, which protects against losses resulting from disruption to revenue streams. At the close of the fiscal year, all premium payments had been made and an insurance policy was in effect that carried a $1,000,000,000 shared limit through the State’s state‐wide property insurance program.
A property claim was filed in fiscal year 2014 for hail damage to most buildings at the University of North Texas, including the Discovery Park campus. Currently, the claim is still open and the estimated loss is $7,000,000 to $9,000,000, all of which is covered under the policy. Another property claim was filed in fiscal year 2016 for hail damage to buildings at the University of North Texas, including the Discovery Park campus. Currently, the estimated loss is $733,119, all of which is covered under the policy.
Workers’ Compensation The System is required by state law to participate in the State’s workers’ compensation insurance program administered through the State Office of Risk Management. This program covers risks of loss resulting from job‐ related illness or injuries to employees while in the course and scope of their work responsibilities. Following a work‐related illness or injury, employees enter into a return‐to‐work program, if necessary, thus reducing indemnity payments for loss compensation.
60

UNAUDITED
UNIVERSITY OF NORTH TEXAS SYSTEM Notes to the Consolidated Financial Statements
For the Year Ended August 31, 2016
Separate workers’ compensation policies are purchased to cover out‐of‐state employees as required by the laws of the state in which an employee works. As of August 31, 2016, the System maintains one policy for an out‐of‐state employee. Unemployment Compensation The State provides coverage for unemployment benefits from appropriations made to other state agencies for System employees. The current General Appropriations Act provides that the System must reimburse the General Revenue Fund – Consolidated one‐half of the unemployment benefits for former and current employees from System appropriations. The Texas Comptroller of Public Accounts determines the proportionate amount to be reimbursed from each appropriated fund type. The System has only one appropriated fund type. The System must reimburse the General Revenue Fund 100% of the cost for unemployment compensation for any employees paid from funds held in local bank accounts and local funds held in the State Treasury. Unemployment compensation is on a pay‐as‐you‐go basis through the State, with the exception of locally funded enterprises that have fund expenses and set‐aside amounts based on a percentage of payroll amounts. No material outstanding claims were pending at August 31, 2016. The System maintains reserves for unemployment compensation and workers’ compensation payments made for all claims and settlements not eligible for state funding. There were no material outstanding claims pending as of August 31, 2016. Health benefits are provided through the various state contracts administered by the Employee Retirement System. Miscellaneous Other lines of insurance purchased include: contractual bonuses, camp accident/medical, commercial crime, fine arts, inland marine, foreign liability, global medical, kidnap and extortion, specialized general liability and property insurance for the Elm Fork Education Center, and student professional liability.
Note 19: Financial Reporting Entity The System is composed of the University of North Texas System Administration and three academic institutions as follows: the University of North Texas, the University of North Texas Health Science Center at Fort Worth, and the University of North Texas at Dallas. The System is governed by a nine‐member Board of Regents appointed by the Governor of Texas and confirmed by the Texas State Senate. Three members are appointed every odd‐numbered year for six‐year terms. In addition, the Governor appoints a nonvoting student Regent for a one‐year term.
Assets Held By Affiliated Organizations GASB authoritative guidance provides criteria for determining whether certain organizations should be reported as component units based on the nature and significance of their relationship to the primary government, the System. This guidance states that a legally separate tax‐exempt organization should be reported as a component unit of a reporting entity if all of the following criteria are met:
1. The economic resources received or held by the separate organization are entirely or almost entirely for the direct benefit of the primary government, its component units, or its constituents.
2. The primary government is entitled to, or has the ability to otherwise access a majority of the economic resources received or held by the separate organization.
3. The economic resources received or held by an individual organization that the specific primary government, or its component units, is entitled to, or has the ability to otherwise access, are significant to that primary government.
61

UNAUDITED
UNIVERSITY OF NORTH TEXAS SYSTEM Notes to the Consolidated Financial Statements
For the Year Ended August 31, 2016
The System has defined significance as 3% of its net position. As of August 31, 2016, only the University of North Texas Foundation met the criteria for inclusion in the System’s financial statements.
Discretely Presented Component Unit University of North Texas Foundation The University of North Texas Foundation, Inc. (the “Foundation”) is reported as a discrete component unit. The Foundation is a separate nonprofit organization that is organized for various purposes, including transferring or using all or any part of the corpus or income for the benefit of the University of North Texas. Such uses are made in accordance with the general or specific purposes stipulated by the donors, grantors or testators, or in the absence of such stipulations, for such uses as may be determined by the Board of Directors of the Foundation; furthermore, the Foundation promptly distributes all net income in excess of operating requirements to promote the educational advancement of UNT. The governing board is self‐perpetuating, comprised of elected members separate from the System’s Board of Regents. The direction and management of the affairs of the Foundation and the control and disposition of its assets are vested in the Board of Directors of the Foundation. The System has no liability with regard to the Foundation, its operations or liabilities. The majority of endowments supporting university scholarships and other System programs are owned by the Foundation; therefore, including the Foundation’s financial reports is important to obtain a full understanding of the System’s financial position and resources.
The Foundation is an essential component of UNT’s program for university advancement and for the development of private sources of funding for capital acquisitions, operations, endowments, and other purposes relating to the mission of UNT.
In August 2003, UNT entered into an agreement with the Foundation to better define the relationship between the two entities and to comply with the statutory requirements of Chapters 2255 and 2260 of the Texas Government Code. The 2003 agreement provided that the development leadership for UNT would be provided by the Foundation’s Chief Executive Officer.
An amended agreement was approved by the Foundation’s Board of Directors in their June 2009 meeting, and subsequently approved by the System Board of Regents in August 2009. Under the amended agreement, UNT’s Vice President for Advancement will serve as the Foundation’s Director of Development and will oversee, coordinate and exercise decision making authority over the fundraising activities of both UNT and the Foundation. In this dual position, the Vice President for Advancement/Foundation’s Director of Development (the “VPA/FDD”) shall have no decision making authority in regard to governance of the Foundation or expenditure of funds by the Foundation. The VPA/FDD is an employee of UNT, and compensation for the position is the sole obligation of UNT. In consideration of this amended agreement, UNT has consistently reported the Foundation as a discrete component unit in the System’s financial statements.
Related Parties Through the normal course of operations, the System both receives funds from and provides funds to other state agencies in support of sponsored research programs. Funds received and provided during the year ended August 31, 2016 related to pass‐through grants were $31,326,811.17 and $206,016.96 respectively.
Other related‐party transactions identified in the financial statements include Due From/To Other Agencies, Legislative Appropriations, Capital Appropriations, Legislative Transfers In and Transfers From/To Other State Agencies.
Note 22: Donor Restricted Endowments
The System’s spending policy for unitized endowments reflects an objective to distribute as much total return as is consistent with overall investment objectives while protecting the real value of the endowment principal. An endowment is excluded from target distribution until the endowment has been established for one year.
62
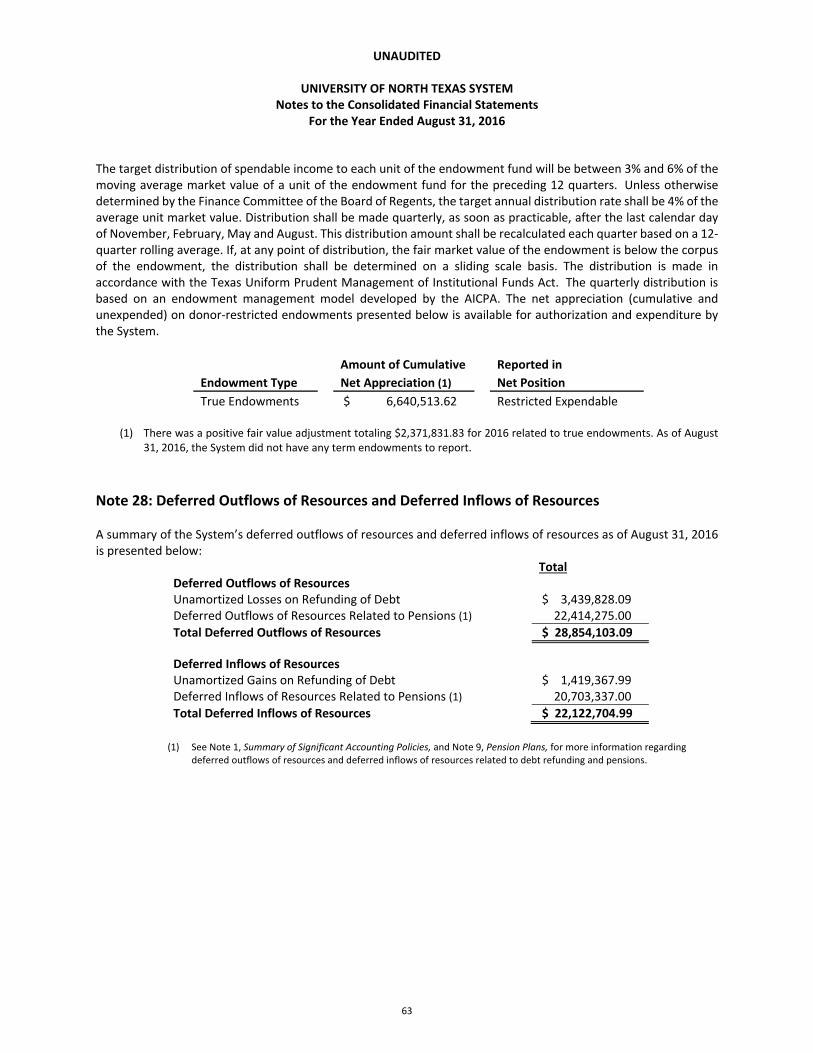
UNAUDITED
UNIVERSITY OF NORTH TEXAS SYSTEM Notes to the Consolidated Financial Statements
For the Year Ended August 31, 2016
The target distribution of spendable income to each unit of the endowment fund will be between 3% and 6% of the moving average market value of a unit of the endowment fund for the preceding 12 quarters. Unless otherwise determined by the Finance Committee of the Board of Regents, the target annual distribution rate shall be 4% of the average unit market value. Distribution shall be made quarterly, as soon as practicable, after the last calendar day of November, February, May and August. This distribution amount shall be recalculated each quarter based on a 12‐quarter rolling average. If, at any point of distribution, the fair market value of the endowment is below the corpus of the endowment, the distribution shall be determined on a sliding scale basis. The distribution is made in accordance with the Texas Uniform Prudent Management of Institutional Funds Act. The quarterly distribution is based on an endowment management model developed by the AICPA. The net appreciation (cumulative and unexpended) on donor‐restricted endowments presented below is available for authorization and expenditure by the System.
Amount of Cumulative Reported in
Endowment Type Net Appreciation (1) Net Position
True Endowments $ 6,640,513.62 Restricted Expendable
(1) There was a positive fair value adjustment totaling $2,371,831.83 for 2016 related to true endowments. As of August 31, 2016, the System did not have any term endowments to report.
Note 28: Deferred Outflows of Resources and Deferred Inflows of Resources A summary of the System’s deferred outflows of resources and deferred inflows of resources as of August 31, 2016 is presented below:
TotalDeferred Outflows of ResourcesUnamortized Losses on Refunding of Debt $ 3,439,828.09 Deferred Outflows of Resources Related to Pensions (1) 22,414,275.00
Total Deferred Outflows of Resources $ 28,854,103.09
Deferred Inflows of ResourcesUnamortized Gains on Refunding of Debt $ 1,419,367.99 Deferred Inflows of Resources Related to Pensions (1) 20,703,337.00
Total Deferred Inflows of Resources $ 22,122,704.99
(1) See Note 1, Summary of Significant Accounting Policies, and Note 9, Pension Plans, for more information regarding
deferred outflows of resources and deferred inflows of resources related to debt refunding and pensions.
63

UNAUDITED
UNIVERSITY OF NORTH TEXAS SYSTEM Required Supplementary Information For the Year Ended August 31, 2016
Required Supplementary Information (RSI)
Schedule of the System’s Proportionate Share of the Net Pension Liability
RSI ‐ Pension Proportionate Share
2016 2015
System's proportion of the net pension liability 0.3348771% 0.3870437%
System's proportionate share of the net pension liability $ 118,374,598.00 $ 103,405,818.19
System's covered payroll (1) 235,537,989.10 222,501,101.49
System's proportionate share of the net pension liability as
a percentage of its covered payroll
50.26% 46.47%
Plan fiduciary net position as a percentage of the total
pension liability
78.43% 83.25%
(1) Covered payroll is for the year prior, because the System’s net pension liability as of August 31 current year is based on a measurement date of August 31 of the previous year.
Schedule of the System’s Contributions RSI ‐ Pension Contributions
2016 2015 2014
Statutorily required contributions $ 10,041,557.00 $ 9,916,773.00
$ 9,812,632.02
Contributions in relation to the statutorily
required contributions
10,041,557.00 9,916,773.00
9,812,632.02
Contribution deficiency (excess) $ ‐ $ ‐ $ ‐
System's covered‐employee payroll $ 248,934,340.22 $ 235,537,989.10 $ 222,501,101.49
Contributions as a percentage of covered‐
employee payroll
4.03% 4.21%
4.41%
64

NOTES TO THE
FINANCIAL STATEMENTS
of the
UNIVERSITY OF NORTH TEXAS FOUNDATION, INC.
DENTON, TEXAS
For the Years Ended August 31, 2015 and 2016
65
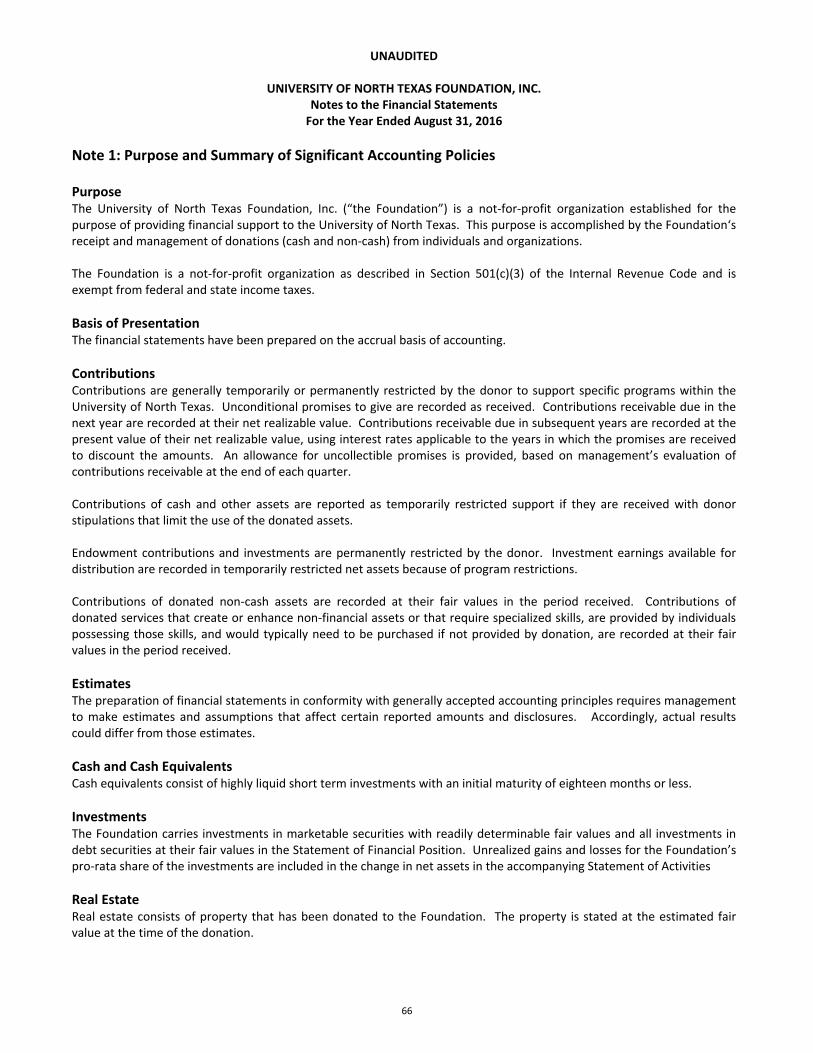
UNAUDITED
UNIVERSITY OF NORTH TEXAS FOUNDATION, INC. Notes to the Financial Statements For the Year Ended August 31, 2016
Note 1: Purpose and Summary of Significant Accounting Policies
Purpose The University of North Texas Foundation, Inc. (“the Foundation”) is a not‐for‐profit organization established for the purpose of providing financial support to the University of North Texas. This purpose is accomplished by the Foundation‘s receipt and management of donations (cash and non‐cash) from individuals and organizations.
The Foundation is a not‐for‐profit organization as described in Section 501(c)(3) of the Internal Revenue Code and is exempt from federal and state income taxes.
Basis of Presentation The financial statements have been prepared on the accrual basis of accounting.
Contributions Contributions are generally temporarily or permanently restricted by the donor to support specific programs within the University of North Texas. Unconditional promises to give are recorded as received. Contributions receivable due in the next year are recorded at their net realizable value. Contributions receivable due in subsequent years are recorded at the present value of their net realizable value, using interest rates applicable to the years in which the promises are received to discount the amounts. An allowance for uncollectible promises is provided, based on management’s evaluation of contributions receivable at the end of each quarter.
Contributions of cash and other assets are reported as temporarily restricted support if they are received with donor stipulations that limit the use of the donated assets.
Endowment contributions and investments are permanently restricted by the donor. Investment earnings available for distribution are recorded in temporarily restricted net assets because of program restrictions.
Contributions of donated non‐cash assets are recorded at their fair values in the period received. Contributions of donated services that create or enhance non‐financial assets or that require specialized skills, are provided by individuals possessing those skills, and would typically need to be purchased if not provided by donation, are recorded at their fair values in the period received.
Estimates The preparation of financial statements in conformity with generally accepted accounting principles requires management to make estimates and assumptions that affect certain reported amounts and disclosures. Accordingly, actual results could differ from those estimates.
Cash and Cash Equivalents Cash equivalents consist of highly liquid short term investments with an initial maturity of eighteen months or less.
Investments The Foundation carries investments in marketable securities with readily determinable fair values and all investments in debt securities at their fair values in the Statement of Financial Position. Unrealized gains and losses for the Foundation’s pro‐rata share of the investments are included in the change in net assets in the accompanying Statement of Activities
Real Estate Real estate consists of property that has been donated to the Foundation. The property is stated at the estimated fair value at the time of the donation.
66

UNAUDITED
UNIVERSITY OF NORTH TEXAS FOUNDATION, INC. Notes to the Financial Statements For the Year Ended August 31, 2016
Trust Property Trust Property consists of property that is held in a Charitable Remainder Trust. Periodically the property is appraised and the property is carried at the most current appraised value.
Inventory Inventory consists of paintings donated to the Foundation and held for sale. The paintings are recorded at their fair value as of the date of donation.
Agency Funds Agency funds consist of resources held by the Foundation as an agent for resource providers and will be transferred to third‐party recipients specified by the resource provider.
Note 2: Investments
Investment securities consists of the following: Unaudited Audited
August 31, 2016 August 31, 2015
Book Value Fair Value Book Value Fair Value
Equities $ 152,948,084 $ 179,635,369 $ 134,841,162 $ 152,760,713
Bonds 42,739,108 43,222,828 56,916,305 55,425,305
Alternatives 54,016,569 55,029,329 53,987,417 48,054,200
Cash & equivalents 133,654 133,654 230,603 230,603
DFA 1,828,949 2,428,312 2,463,059 2,321,951
$ 251,666,364 $ 280,449,492 $ 248,438,546 $ 258,792,772
Investment income consists of interest and dividends earned, realized gains and losses plus changes in unrealized appreciation and depreciation.
Note: 3 Contributions and Other Receivables
Contributions and other receivables were as follows: Unaudited Audited
August 31, 2016 August 31, 2015
Contributions Receivable in less than one year $ 2,514,252 $ 23,861,550
Contributions Receivable in one to five years 2,491,412 1,924,875
Contributions Receivable in six to ten years 220,000 291,245
Contributions Receivable in over ten years ‐ ‐
Total Contributions Receivable 5,225,664 26,077,670
Less discounts to net present value (8% discount rate) (312,807) (423,421)
Less Allowance for uncollectible pledges
(10% of discounted pledge receivables – plus specific reserves) (522,566) (8,398,177)
Net Contributions Receivable 4,390,291 17,256,072
Other amounts receivable 2,800 2,855
Total Contributions and Other Receivables $ 4,393,091 $ 17,258,927
67

UNAUDITED
UNIVERSITY OF NORTH TEXAS FOUNDATION, INC. Notes to the Financial Statements For the Year Ended August 31, 2016
A significant pledge made in 2011 had stated terms that it was to be paid by December 31, 2015. The pledge payment was not received on that date. The donor verbally renewed the pledge for a payment by March 31, 2016. This date also passed without receiving a payment. The University reached out to the donor and the response was the donor would not be able to honor the pledge at this time, but hoped to make the payment in the future. As the pledge no longer meets the criteria of an unconditional promise to give, we took steps to systematically reduce the receivable from this pledge by 1/3 for each of the last 3 quarters of fiscal year 2016. The pledge is completely off the books of the Foundation as of the close of the current fiscal year, August 31, 2016. We have recorded the reversal on the Statement of Financial Position by reducing Contributions Receivable, with the offset to Temporarily Restricted Net Assets. In order to not distort the current year operations. On the Statement of Activities, we have recorded the reversal in the Net Assets schedule as a Change due to Pledge Reversal.
Note 4: Temporarily Restricted Net Assets Temporarily restricted net assets consist of contributions from donors who have specified certain programs or scholarships within the University of North Texas for use of the contributions. Temporarily restricted net assets also include income from endowment funds that is available for distribution upon satisfaction of the specific program restriction stated in the endowment agreement.
Note 5: Permanently Restricted Net Assets Net assets were permanently restricted for the following purposes:
Unaudited Audited August 31, 2016 August 31, 2015
Endowments and other permanently restricted funds to support various programs, scholarships, and other activities of the University of North Texas $ 91,487,153 $ 86,324,889
Cash value of life insurance policies that will provide proceeds, upon the death of the insured, for endowments 513,979 512,137
Total $ 92,001,132 $ 86,837,026
Note 6: Real Property Real property donated to the Foundation is recorded at fair value at the date of the donation. Real property consists of the following at August 31, 2016:
Fair Value Fair Value
Recorded Current
Mineral Rights $ 12,860 Not Determined
Minahan Estate Property 29,948 29,948
Total $ 42,808
68

UNAUDITED
UNIVERSITY OF NORTH TEXAS FOUNDATION, INC. Notes to the Financial Statements For the Year Ended August 31, 2016
Note 7: Life Insurance Policies Several endowments have been established which are to be funded or partially funded by life insurance policies for which the Foundation has been named owner and beneficiary. Donors of the policies reimburse premium payments made by the Foundation. As of the end of the period, there were a total of 24 such policies with death benefits totaling $3,434,842 and cash values totaling $513,979.
Note 8: Income Tax Status The Foundation has received a letter of determination from the Internal Revenue Service advising that it qualifies as a not‐for‐profit corporation under Section 501(c)(3) of the Internal Revenue Code and, therefore, is not subject to income tax. The Foundation is not a private foundation within the meaning of Section 509(a) of the Internal Revenue Code.
Note 9: Retirement Plan The Foundation sponsors a defined contribution retirement plan covering all full time employees of the Foundation. The Foundation contributes 8.5% of eligible employees’ compensation to the plan, and employees are required to contribute a minimum of 6.65% of eligible compensation to the plan. Employees may make voluntary contributions in addition to the required contribution, up to the limits prescribed by the Internal Revenue Code. The fiscal year to date employer contributions were $73,062.
Note 10: Assets Held Under Split Interest Agreements The Foundation is the Trustee or Co‐Trustee of various charitable remainder trusts and administers numerous gift annuity contracts. The agreements require annuity payments to the income beneficiaries for life, with the remaining assets of the trusts or agreements creating endowments upon the death of the income beneficiary. The Foundation has recorded the present value of the annuity payments as annuity obligations. The annuity obligations are recorded at the present value of the expected future cash payments based on published life expectancy tables using a discount rate of six percent.
Note 11: Assets Held For Others The Foundation holds and invests certain funds in trust on behalf of the University of North Texas System (“UNTS”). Pursuant to an investment agreement dated March 15, 2012 and amended and restated on August 16, 2012, certain UNTS long‐term assets have been placed with the Foundation and invested in the Foundation's Consolidated Investment Pool. The UNTS investment funds are subject to the same investment management policy as the Foundation’s investments, but receive monthly distributions of interest, dividends, and realized gains/losses. The initial term of the agreement effective November 1, 2014 ended August 31, 2015. It contains a provision to automatically renew annually thereafter, as well as a provision for early termination as agreed by the parties. The Foundation also holds and invests certain funds in trust on behalf of the University of North Texas (“UNT”). Pursuant to an investment management agreement dated August 24, 2012, certain UNT endowment assets have been placed with the Foundation and invested in the Foundation's Consolidated Investment Pool or the Foundation’s DFA Short‐Term Government fund. The UNT endowment funds residing in the Foundation’s Consolidated Investment Pool are subject to the same investment management and distribution policies as the Foundation’s investments. The initial term of the agreement ended August 31, 2013, with a provision to automatically renew annually thereafter.
69
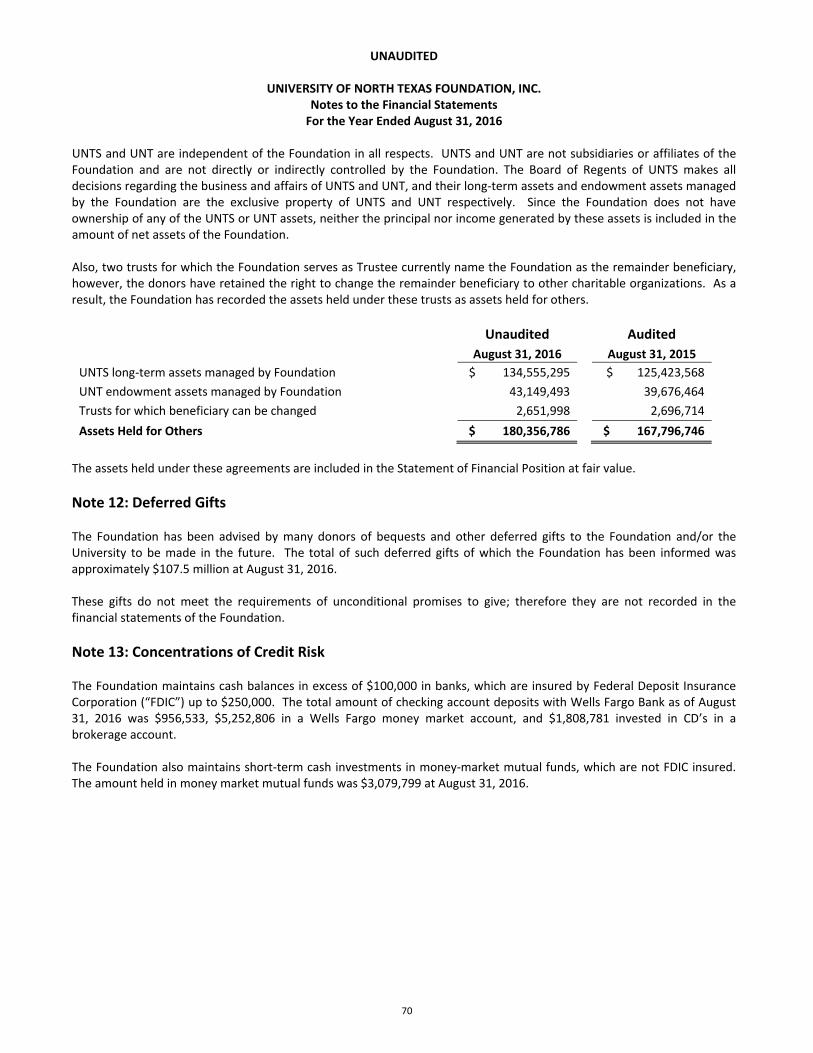
UNAUDITED
UNIVERSITY OF NORTH TEXAS FOUNDATION, INC. Notes to the Financial Statements For the Year Ended August 31, 2016
UNTS and UNT are independent of the Foundation in all respects. UNTS and UNT are not subsidiaries or affiliates of the Foundation and are not directly or indirectly controlled by the Foundation. The Board of Regents of UNTS makes all decisions regarding the business and affairs of UNTS and UNT, and their long‐term assets and endowment assets managed by the Foundation are the exclusive property of UNTS and UNT respectively. Since the Foundation does not have ownership of any of the UNTS or UNT assets, neither the principal nor income generated by these assets is included in the amount of net assets of the Foundation.
Also, two trusts for which the Foundation serves as Trustee currently name the Foundation as the remainder beneficiary, however, the donors have retained the right to change the remainder beneficiary to other charitable organizations. As a result, the Foundation has recorded the assets held under these trusts as assets held for others.
Unaudited Audited
August 31, 2016 August 31, 2015
UNTS long‐term assets managed by Foundation $ 134,555,295 $ 125,423,568
UNT endowment assets managed by Foundation 43,149,493 39,676,464
Trusts for which beneficiary can be changed 2,651,998 2,696,714
Assets Held for Others $ 180,356,786 $ 167,796,746
The assets held under these agreements are included in the Statement of Financial Position at fair value.
Note 12: Deferred Gifts
The Foundation has been advised by many donors of bequests and other deferred gifts to the Foundation and/or the University to be made in the future. The total of such deferred gifts of which the Foundation has been informed was approximately $107.5 million at August 31, 2016.
These gifts do not meet the requirements of unconditional promises to give; therefore they are not recorded in the financial statements of the Foundation.
Note 13: Concentrations of Credit Risk
The Foundation maintains cash balances in excess of $100,000 in banks, which are insured by Federal Deposit Insurance Corporation (“FDIC”) up to $250,000. The total amount of checking account deposits with Wells Fargo Bank as of August 31, 2016 was $956,533, $5,252,806 in a Wells Fargo money market account, and $1,808,781 invested in CD’s in a brokerage account.
The Foundation also maintains short‐term cash investments in money‐market mutual funds, which are not FDIC insured. The amount held in money market mutual funds was $3,079,799 at August 31, 2016.
70

CONSOLIDATED
SUPPLEMENTAL SCHEDULES
of the
UNIVERSITY OF NORTH TEXAS SYSTEM
DENTON, TEXAS
For the Year Ended August 31, 2016
71
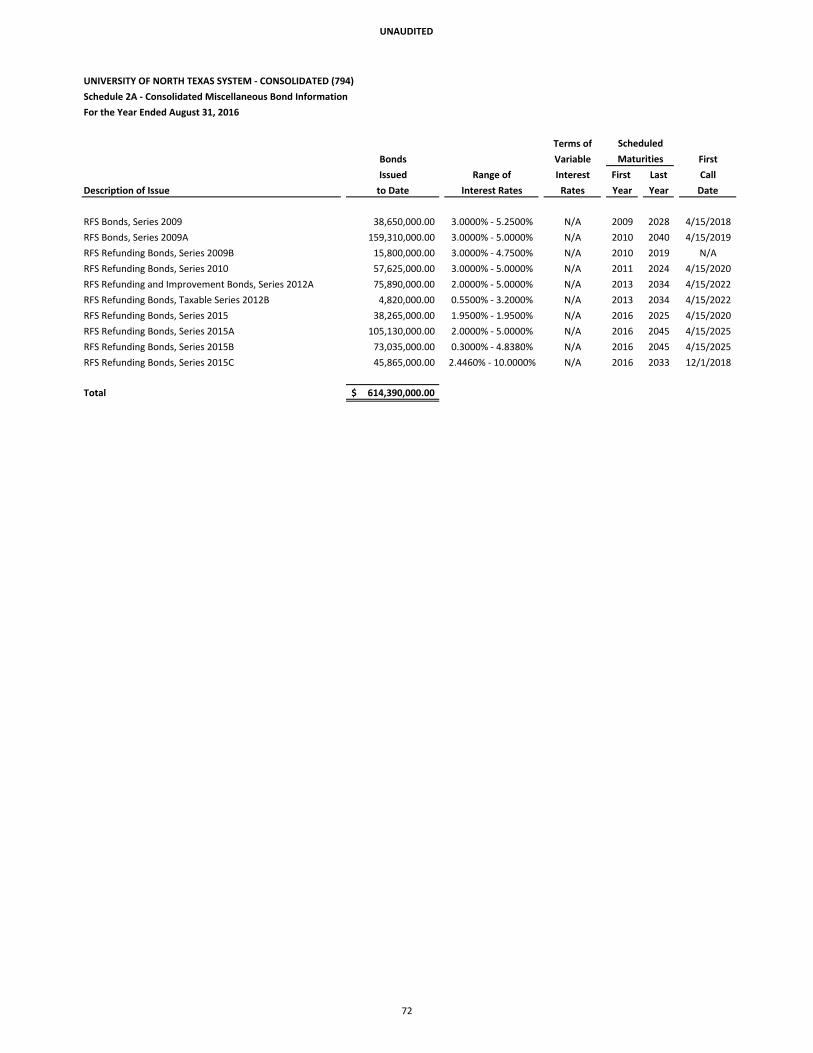
UNAUDITED
UNIVERSITY OF NORTH TEXAS SYSTEM ‐ CONSOLIDATED (794)
Schedule 2A ‐ Consolidated Miscellaneous Bond Information
For the Year Ended August 31, 2016
Terms of
Bonds Variable First
Issued Range of Interest First Last Call
Description of Issue to Date Interest Rates Rates Year Year Date
RFS Bonds, Series 2009 38,650,000.00 3.0000% ‐ 5.2500% N/A 2009 2028 4/15/2018
RFS Bonds, Series 2009A 159,310,000.00 3.0000% ‐ 5.0000% N/A 2010 2040 4/15/2019
RFS Refunding Bonds, Series 2009B 15,800,000.00 3.0000% ‐ 4.7500% N/A 2010 2019 N/A
RFS Refunding Bonds, Series 2010 57,625,000.00 3.0000% ‐ 5.0000% N/A 2011 2024 4/15/2020
RFS Refunding and Improvement Bonds, Series 2012A 75,890,000.00 2.0000% ‐ 5.0000% N/A 2013 2034 4/15/2022
RFS Refunding Bonds, Taxable Series 2012B 4,820,000.00 0.5500% ‐ 3.2000% N/A 2013 2034 4/15/2022
RFS Refunding Bonds, Series 2015 38,265,000.00 1.9500% ‐ 1.9500% N/A 2016 2025 4/15/2020
RFS Refunding Bonds, Series 2015A 105,130,000.00 2.0000% ‐ 5.0000% N/A 2016 2045 4/15/2025
RFS Refunding Bonds, Series 2015B 73,035,000.00 0.3000% ‐ 4.8380% N/A 2016 2045 4/15/2025
RFS Refunding Bonds, Series 2015C 45,865,000.00 2.4460% ‐ 10.0000% N/A 2016 2033 12/1/2018
Total 614,390,000.00$
Maturities
Scheduled
72

UNAUDITED
UNIVERSITY OF NORTH TEXAS SYSTEM ‐ CONSOLIDATED (794)
Schedule 2B ‐ Combined Changes in Bonded Indebtedness
For the Year Ended August 31, 2016
Bonds Bonds Bonds Bonds Net Bonds Amounts Bonds
Outstanding Bonds Matured Refunded or Outstanding Unamortized Outstanding Due Within Outstanding
Description of Issue 09/01/15 Issued or Retired Extinguished 08/31/16 Premium 08/31/16 One Year 08/31/16
RFS Bonds, Series 2007 46,960,000.00$ ‐$ 1,355,000.00$ 45,605,000.00$ ‐$ ‐$ ‐$ ‐$ ‐$
RFS Bonds, Series 2009 27,050,000.00 ‐ 1,555,000.00 ‐ 25,495,000.00 ‐ 25,495,000.00 1,635,000.00 23,860,000.00$
RFS Bonds, Series 2009A 134,425,000.00 ‐ 4,375,000.00 ‐ 130,050,000.00 6,241,010.77 136,291,010.77 5,188,497.90 131,102,512.87$
RFS Refunding Bonds, Series 2009B 8,880,000.00 ‐ 2,090,000.00 ‐ 6,790,000.00 159,075.51 6,949,075.51 2,253,528.79 4,695,546.72$
RFS Refunding Bonds, Series 2010 43,190,000.00 ‐ 3,855,000.00 ‐ 39,335,000.00 2,657,015.31 41,992,015.31 4,657,171.38 37,334,843.93$
RFS Refunding and Improvement Bonds, Series 2012A 65,720,000.00 ‐ 3,765,000.00 4,535,000.00 57,420,000.00 7,323,607.82 64,743,607.82 4,902,745.95 59,840,861.87$
RFS Refunding Bonds, Taxable Series 2012B 4,410,000.00 ‐ 175,000.00 ‐ 4,235,000.00 ‐ 4,235,000.00 180,000.00 4,055,000.00$
RFS Refunding Bonds, Series 2015 38,265,000.00 ‐ 6,840,000.00 ‐ 31,425,000.00 ‐ 31,425,000.00 6,930,000.00 24,495,000.00$
RFS Refunding Bonds, Series 2015A ‐ 105,130,000.00 1,025,000.00 ‐ 104,105,000.00 16,204,049.73 120,309,049.73 1,551,449.93 118,757,599.80$
RFS Refunding Bonds, Series 2015B ‐ 73,035,000.00 2,450,000.00 ‐ 70,585,000.00 ‐ 70,585,000.00 4,465,000.00 66,120,000.00$
RFS Refunding Bonds, Series 2015C ‐ 45,865,000.00 ‐ ‐ 45,865,000.00 ‐ 45,865,000.00 2,080,000.00 43,785,000.00$
Total 368,900,000.00$ 224,030,000.00$ 27,485,000.00$ 50,140,000.00$ 515,305,000.00$ 32,584,759.14$ 547,889,759.14$ 33,843,393.95$ 514,046,365.19$
73

UNAUDITED
UNIVERSITY OF NORTH TEXAS SYSTEM (794)
Schedule 2C ‐ Consolidated Debt Service Requirements
For the Fiscal Year Ended August 31, 2016
Description of Issue Year Principal Interest*
Revenue Bonds
RFS Bonds, Series 2009 2017 1,635,000.00$ 1,256,637.50$
2018 1,685,000.00 1,203,500.00
2019 1,745,000.00 1,144,525.00
2020 1,835,000.00 1,052,912.50
2021 1,930,000.00 956,575.00
2022‐2026 11,295,000.00 3,150,650.00
2027‐2028 5,370,000.00 406,000.00
25,495,000.00$ 9,170,800.00$
RFS Bonds, Series 2009A 2017 4,585,000.00$ 6,502,500.00$
2018 4,815,000.00 6,273,250.00
2019 5,055,000.00 6,032,500.00
2020 5,305,000.00 5,779,750.00
2021 5,570,000.00 5,514,500.00
2022‐2026 32,340,000.00 23,103,500.00
2027‐2031 30,610,000.00 14,426,750.00
2032‐2036 20,935,000.00 8,451,750.00
2037‐2040 20,835,000.00 2,667,750.00
130,050,000.00$ 78,752,250.00$
RFS Refunding Bonds, Series 2009B 2017 2,175,000.00$ 289,225.00$
2018 2,265,000.00 202,225.00
2019 2,350,000.00 111,625.00
6,790,000.00$ 603,075.00$
RFS Refunding Bonds, Series 2010 2017 4,045,000.00$ 1,813,300.00$
2018 4,200,000.00 1,651,500.00
2019 4,420,000.00 1,441,500.00
2020 6,880,000.00 1,264,700.00
2021‐2024 19,790,000.00 2,007,500.00
39,335,000.00$ 8,178,500.00$
Continued on Next Page
74

UNAUDITED
Description of Issue Year Principal Interest*
Revenue Bonds
RFS Refunding and Improvement Bonds, Series 2012A 2017 3,940,000.00$ 2,800,825.00$
2018 4,015,000.00 2,603,825.00
2019 3,460,000.00 2,420,475.00
2020 3,920,000.00 2,282,075.00
2021 4,115,000.00 2,086,075.00
2022‐2026 15,325,000.00 7,774,850.00
2027‐2031 17,095,000.00 4,035,250.00
2032‐2034 5,550,000.00 357,750.00
57,420,000.00$ 24,361,125.00$
RFS Refunding Bonds, Taxable Series 2012B 2017 180,000.00$ 145,335.00$
2018 185,000.00 142,635.00
2019 190,000.00 139,120.00
2020 195,000.00 134,940.00
2021 200,000.00 130,065.00
2022‐2026 1,085,000.00 553,657.50
2027‐2031 1,295,000.00 341,695.00
2032‐2034 905,000.00 74,317.50
4,235,000.00$ 1,661,765.00$
RFS Refunding Bonds, Series 2015 2017 6,930,000.00$ 612,787.50$
2018 4,795,000.00 477,652.50
2019 4,885,000.00 384,150.00
2020 2,350,000.00 288,892.50
2021 2,390,000.00 243,067.50
2022‐2025 10,075,000.00 495,885.00
31,425,000.00$ 2,502,435.00$
RFS Refunding Bonds, Series 2015A 2017 505,000.00$ 5,205,250.00$
2018 530,000.00 5,180,000.00
2019 560,000.00 5,153,500.00
2020 585,000.00 5,125,500.00
2021 665,000.00 5,096,250.00
2022‐2026 16,760,000.00 24,310,500.00
2027‐2031 31,405,000.00 18,025,750.00
2032‐2036 32,830,000.00 9,954,250.00
2037‐2041 12,875,000.00 3,342,250.00
2042‐2045 7,390,000.00 946,250.00
104,105,000.00$ 82,339,500.00$
Continued on Next Page
75
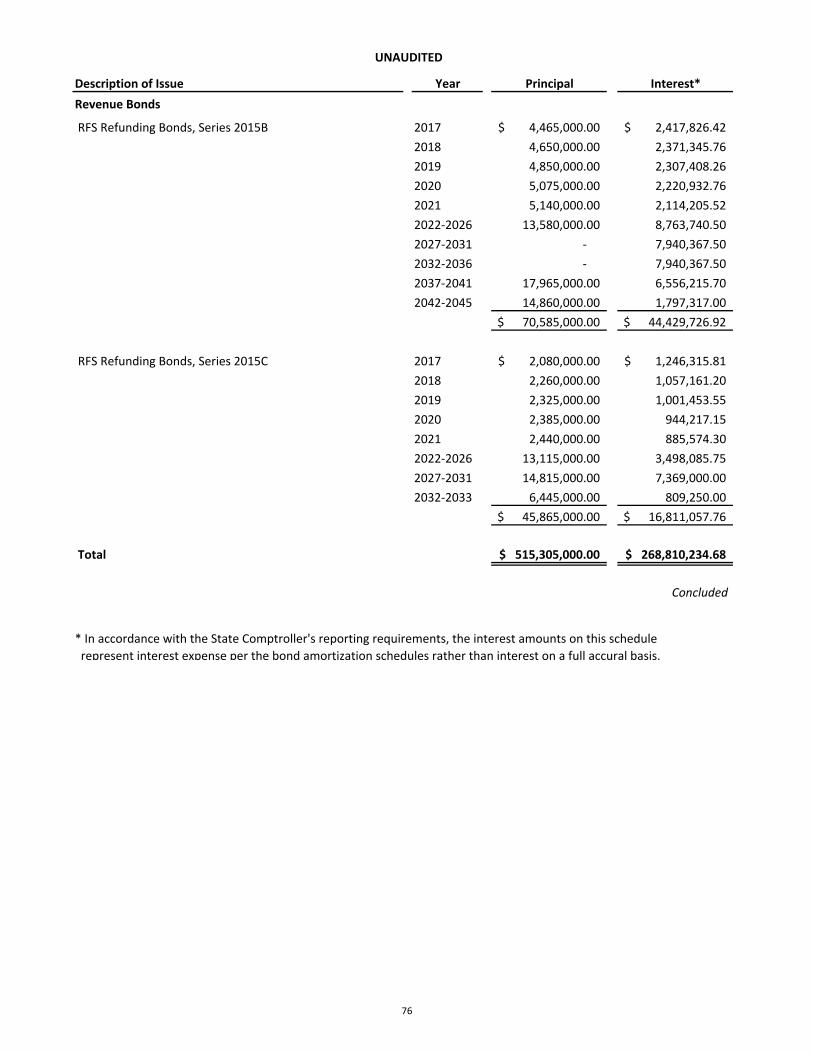
UNAUDITED
Description of Issue Year Principal Interest*
Revenue Bonds
RFS Refunding Bonds, Series 2015B 2017 4,465,000.00$ 2,417,826.42$
2018 4,650,000.00 2,371,345.76
2019 4,850,000.00 2,307,408.26
2020 5,075,000.00 2,220,932.76
2021 5,140,000.00 2,114,205.52
2022‐2026 13,580,000.00 8,763,740.50
2027‐2031 ‐ 7,940,367.50
2032‐2036 ‐ 7,940,367.50
2037‐2041 17,965,000.00 6,556,215.70
2042‐2045 14,860,000.00 1,797,317.00
70,585,000.00$ 44,429,726.92$
RFS Refunding Bonds, Series 2015C 2017 2,080,000.00$ 1,246,315.81$
2018 2,260,000.00 1,057,161.20
2019 2,325,000.00 1,001,453.55
2020 2,385,000.00 944,217.15
2021 2,440,000.00 885,574.30
2022‐2026 13,115,000.00 3,498,085.75
2027‐2031 14,815,000.00 7,369,000.00
2032‐2033 6,445,000.00 809,250.00
45,865,000.00$ 16,811,057.76$
Total 515,305,000.00$ 268,810,234.68$
Concluded
* In accordance with the State Comptroller's reporting requirements, the interest amounts on this schedule
represent interest expense per the bond amortization schedules rather than interest on a full accural basis.
76
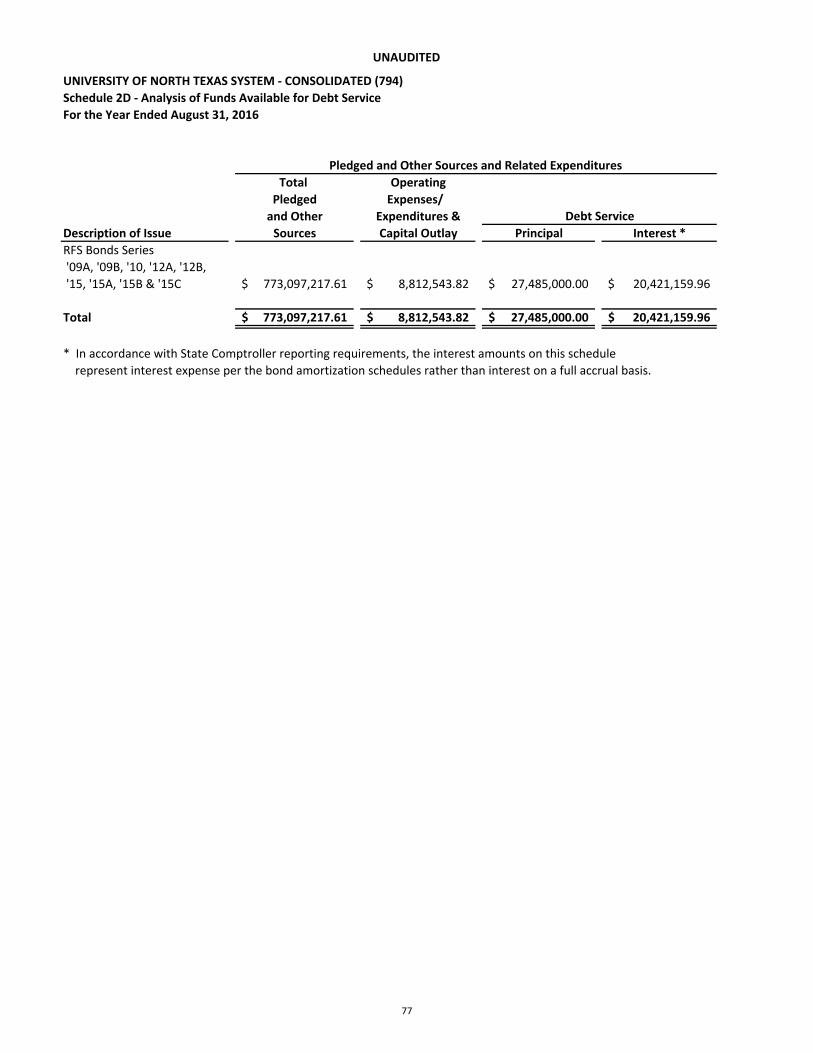
UNAUDITED
UNIVERSITY OF NORTH TEXAS SYSTEM ‐ CONSOLIDATED (794)
Schedule 2D ‐ Analysis of Funds Available for Debt Service
For the Year Ended August 31, 2016
Total Operating
Pledged Expenses/
and Other Expenditures &
Description of Issue Sources Capital Outlay Principal Interest *
RFS Bonds Series
'09A, '09B, '10, '12A, '12B,
'15, '15A, '15B & '15C 773,097,217.61$ 8,812,543.82$ 27,485,000.00$ 20,421,159.96$
Total 773,097,217.61$ 8,812,543.82$ 27,485,000.00$ 20,421,159.96$
* In accordance with State Comptroller reporting requirements, the interest amounts on this schedule
represent interest expense per the bond amortization schedules rather than interest on a full accrual basis.
Pledged and Other Sources and Related Expenditures
Debt Service
77
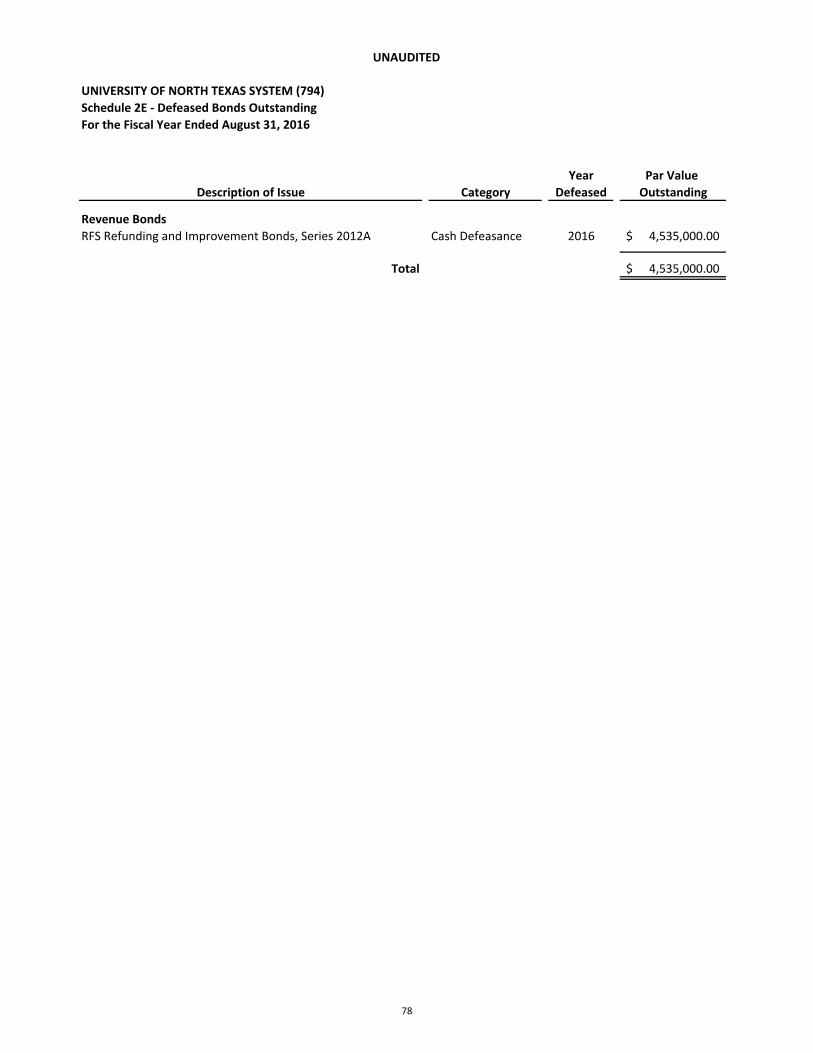
UNAUDITED
UNIVERSITY OF NORTH TEXAS SYSTEM (794)
Schedule 2E ‐ Defeased Bonds Outstanding
For the Fiscal Year Ended August 31, 2016
Year Par Value
Description of Issue Category Defeased Outstanding
Revenue Bonds
RFS Refunding and Improvement Bonds, Series 2012A Cash Defeasance 2016 4,535,000.00$
Total 4,535,000.00$
78

UNAUDITED
UNIVERSITY OF NORTH TEXAS SYSTEM ‐ CONSOLIDATED (794)
Schedule 2F ‐ Early Extinguishment and Refunding
For the Year Ended August 31, 2016
For Refundings Only
Amount Refunding Cash Flow Economic
Extinguished Issued Increase Gain/
Description of Issue Category or Refunded Par Value (Decrease) (Loss)
Revenue Bonds
RFS Bonds, Series 2007
Current
Refunding 45,605,000.00$ 45,865,000.00$ 8,902,792.24$ 4,469,507.99$
RFS Refunding and
Improvement Bonds, Series
2012A Cash Defeasance 4,535,000.00
Total 50,140,000.00$ 45,865,000.00$ 8,902,792.24$ 4,469,507.99$
79
THIS PAGE INTENTIONALLY LEFT BLANK
80

UNAUDITED
UNIVERSITY OF NORTH TEXAS SYSTEM ‐ CONSOLIDATED (794)
Schedule 3 ‐ Reconciliation of Cash in State Treasury
For the Year Ended August 31, 2016
Current
Cash in State Treasury Unrestricted Year Total
Local Revenue Fund 0258 4,106,855.72$ 4,106,855.72$
Local Revenue Fund 0280 4,189,136.68 4,189,136.68
Local Revenue Fund 0292 3,589,590.92 3,589,590.92
State Reimbursement‐ GRD 4,978,881.53 4,978,881.53
Total Cash in State Treasury (Statement of Net Position) 16,864,464.85$ 16,864,464.85$
81