Embed Size (px)
Citation preview

Consistency, Quality, and ResilienceThe NexT FroNTier For ProducTiviTy excelleNce
--- Advanced Confidential Copy – EMBARGOED UNTIL 3PM ON 12 AUG ---

B | Consistency, Quality, and Resilience
Established in 1927, FICCI is the largest and oldest apex business organization in India. FICCI has contributed to the growth of the industry by encouraging debate, articulating the private sector’s views and influencing policy. A non–government, not–for–profit organization, FICCI is the voice of India’s business and industry. FICCI draws its membership from the corporate sector, both private and public, including SMEs and MNCs; FICCI enjoys an indirect membership of over 2,50,000 companies from various regional chambers of commerce.
Indian Banks’ Association (IBA) is the premier service organization of the banking industry in India. Its members comprises of almost all the Public, Private, Urban Co–operative and Foreign banks having offices in India, developmental financial institutions, federations, merchant banks, housing finance corporations, asset reconstruction companies and other financial institutions.
The Boston Consulting Group (BCG) is a global management consulting firm and the world’s leading advisor on business strategy. We partner with clients from the private, public, and not–for–profit sectors in all regions to identify their highest–value opportunities, address their most critical challenges, and transform their enterprises. Our customized approach combines deep in sight into the dynamics of companies and markets with close collaboration at all levels of the client organization. This ensures that our clients achieve sustainable compet itive advantage, build more capable organizations, and secure lasting results. Founded in 1963, BCG is a private company with 78 offices in 43 countries. For more information, please visit bcg.com.
August 2013 | The Boston Consulting Group
ConsistenCy, Quality, and ResilienCe
The NexT FRoNTieR FoR PRoduCTiviTy exCelleNCe
SAUrABh TrIPAThI
BhArAT POddAr
YAShrAj ErANdE
Productivity in Indian Banking: 2013


The Boston Consulting Group • FiCCi • iBA | 3
Khuda tujhe kisi toofaan se aashna kar deKi tere beher ki moujoun mein izteraab nahin
God bring you acquainted with some storm!No billow in your sea (soul) break in foam (passion)
— Muhammad IqbalLegendry Urdu Poet (1877–1938)
A lot of human progress can be attributed to challenges that trigger passion and align minds towards resolute action. May the current mild turmoil engender a quantum leap in productivity and capacity in Indian banking.

4 | Consistency, Quality, and Resilience4 | Consistency, Quality, and Resilience
Contents
6 PREFACE
7 EXECUTIVE SUMMARY
9 THE OPPORTUNITY IN TURBULENCEProgress in indian Banking: enough to celebrate; lot More to doThree years hence: Many challenges; even More opportunities
16 HIGH PERFORMANCE CORPORATE BANKINGoverall Strong Advocacy; But Not For AllFix operations and Technology: industry Tell Bankshow to Be a Primary Bank?Pathways To a Resilient and Profitable Corporate Franchisehow to Win in SMesimplications for Banks
27 MANAGING BALANCE SHEET STRESSGreen Shoots in otherwise red landscapeGold can Be Golden: Possibilities in Agriculture lendingSpeed of credit Process: A covert driver of credit QualityAdvanced Approaches for risk ManagementBusiness Model for SMe credit: A Fine Balancing ActPulling it All Together: creating the right credit culturePricing: The White Knight of commercial BankingTough love: Smarter Way to restructure
39 BRANCHES OF THE FUTUREA Possible Trinity: coverage, clutter and client SourcingGeoanalytics: Next Generation Footprint and location PlanningThe Five Star Branch concept: roadmap to Sales excellencePeek into the Future: customer experience in 2015
50 CUSTOMER–CENTRIC AND LEAN OPERATIONSTooth–To–Tail ratio: Aim for Four–Fold increaseNo Back Office: Operations Paradigm Comes Full Circle?New Paradigm in Process optimization: end–To–end and customer–centricPerformance indicators: Fostering collaboration Across Siloslow iT Spends in indian Banking: Pride or Prejudice?Smart Source: From vendors to Partners

The Boston Consulting Group • FiCCi • iBA | 5The Boston Consulting Group • FiCCi • iBA | 5
60 DIGITAL TRANSFORMATION cash: continue to hold The Fort, But cracks visiblecheque: retail customers letting Go, Businesses holding onATM: easy Pickings Are over, Tighten The Beltsdigital channels: Making inroads, But Too early to declare victoryhow to Turbo charge digital Adoption: Four Pronged ApproachNew “New” channel: realizing Potential of Business correspondents (Bc)
75 HIGH PRODUCTIVITY ORGANIZATIONAL DESIGNoverheads: Bulge at the Top Functional excellence: Smarter decision Support investing in Performance Management: Business of People Performance culture: The holy Grail
81 APPENDIX
84 GLOSSARY
86 FOR FURTHER READING
87 NOTE TO THE READER

6 | Consistency, Quality, and Resilience
This report is the third in the “Productivity Excellence” series of BCG reports which are published and released on the occasion of
the annual FICCI–IBA Banking Conference (FIBAC). In 2011, a report titled “Being Five Star in Productivity” and in 2012, a report titled “From Five Star to Seven Star in Productivity” was published by BCG. These reports are based on very extensive primary research and analysis on the data collected from almost all the banks in India (38 banks in 2013), complemented with primary surveys on customers (over 500 corporate customers surveyed in 2013). The primary goal of the research is to identify and elucidate practices, ideas and approach-es that banks in India can adopt to sustain their financial strength while pursuing the objective of financial inclusion, which requires extra–ordinary cost efficiency, productivity and innovation. This series defines productivity in a broad sense covering diverse areas like branch, back–office, digital channels, administrative offices and bad debt management.
This report “Consistency, Quality and Resilience: The Next Frontier for Productivity Excellence” is being published amidst widespread negative sentiment in the Indian economy and valid but over stretched concerns regarding the health of Indian banks. The Indian banking industry is in solid health, when looked at, through a bal-anced spectrum of metrics. It enjoys continuously reducing leverage, lowering reliance on wholesale debt, increasing digital adoption, ro-bust and steady cost–income ratio and steady profitability as a sector. It is also ramping up branches at an unprecedented pace of 8 percent to reach semi–urban and rural India. Banks in India, because of their financial soundness, have been able to help the corporate sector sur-vive the policy hurdles regarding investments. This report identifies an action agenda for banks to come out stronger and from this phase. BCG research has shown that adaptive organizations which prepare to deal with volatility better, outperform others when better climate re-turns.
PReFaCe

The Boston Consulting Group • FiCCi • iBA | 7
eXeCutiVe suMMaRy
Corporate sector has dominated discussions on Indian banking for last several months—for sluggish credit growth or for extraordi-
nary levels of restructured debt. This study, deep dived into corporates with interviews of more than 500 corporate customers. We found that the advocacy level for Indian banks by their corporate clients, at 21 percent, is among the best in the world. But it drops dramatically in industries which use more transaction banking and advisory products that need high operations quality and technology expertise. Providers of current ac-counts are predominantly considered primary banks and they get nearly 2–3X share of wallet compared to secondary banks. The paradigm has shifted. Providers of term lending do not get even half the share of wallet. Industry expressed its unequivocal demand for better quality operations and technology from banks to facilitate faster turnaround, innovation, and customization.
Indian banking industry needs a step change in operations. 55 percent of workforce in the industry does non–customer facing back end work. This needs to go down to 20 percent. It needs lean and customer centric opera-tions driven by process quality and technology. Back offices are fragment-ed and sub scale. Processes are slow, error prone, and costly. Investment in technology is low with insufficient emphasis on operational excellence. Large number of new value–conscious consumers are entering the bank-ing industry in small towns and villages. They need a new model to be served profitably.
A new thinking on branch design is required. From a 2–3 percent growth per annum a decade back, today, the number of bank branches is growing at about ten percent. We predict that this pace will continue for next de-cade. But branches are getting more cluttered by the day. Number of cash transactions done inside branches has gone up by 7.5 percent in last two years. This is unsustainable. Rural low cost branches have to be based on a completely fresh thinking. The rural model has to reform the ultra effi-cient urban branches of the future. Branches need a step jump in adop-tion of self service. Branches of the future would be small, modular, pa-

8 | Consistency, Quality, and Resilience
perless, with no back office, and with on the spot fulfilment. For this, they need geoanalytics driven placement, true single windows and disciplined operating rhythm. Such branches are described in detail as “5– Star” branches in this report.
Much more intensive adoption of digital channels is needed than previ-ously imagined. Convenient mass banking is not viable without a step jump in digital adoption. This study has revealed that while there is good progress, the pace of digital adoption is not enough. We see slower adop-tion of digital in business banking (current accounts) as compared to per-sonal banking (savings accounts). Private sector is hitting a plateau on dig-ital adoption and needs fresh thinking. Public sector is catching up fast albeit from a lower base. Cash and cheque transaction per current ac-count of private sector went up by 20–25 percent in last two years. Indus-try needs to invest to make online propositions more powerful for busi-ness. The share of ATMs in digital transaction has come down from 80 percent to 70 percent in two years. The ten percent gap was filled by NEFT/RTGS (six percent) and mobile (three percent). However, share of POS transactions did not go up. Poor adoption of digital payments at mer-chant POS terminal remains one of the biggest weaknesses of Indian banking. The Business Correspondent (BC) channel has not taken off with average of one BC per branch. We predict this number to go to about 10 over the next decade as new bank entrants bring more committed energy to make it work.
On the issue of bad debt management, the banking industry is indeed in a tight spot. The NPA levels could cross five percent in next two years if policy uncertainty persists. Deeper examination of NPA profile shows more opportunity than threats. Over the last two years, retail segment NPA have come down across the bank type and product type. Use of in-formation bureau for retail loans has taken off extensively in this time frame. The same has not happened in MSME financing. This study found that banks have huge opportunity to use information analytics for credit assessment and early warning systems. Credit processes need to be re–en-gineered with technology to reduce response time. Banks with slow credit process have high NPA since best customers get fed up and leave. Credit is a judgment decision and cannot be abdicated to models. Capability and intuition of the credit cadre has to be enhanced through teaming and ap-prenticeship. Use of gold as collateral for agriculture lending could double the agriculture credit flow at very low NPA.
Restructuring of loans is a valid bank decision to assist a corporate in dis-tress. However, banks need to do a more thorough due diligence of the prospects of survival and a rigorous assessment of tough management ac-tions needed on strategy, operations, technology and HR to ensure that the turnaround indeed happens and banks’ sacrifice is paid off.
Indian banks need to invest now to get a step change in productivity and capacity. Higher customer demands, tighter regulation, and fierce new competition will necessitate it. They could support industry survive in dif-ficult times due to their sound health. They have to support industry thrive in better days. For that they need to be healthier.

The Boston Consulting Group • FiCCi • iBA | 9
tHe oPPoRtunity in tuRBulenCe
PoweRFul PRoduCTiviTy leveRs iN iNdiAN BANkiNG
“There is a tide in the affairs of menWhich, taken at the flood, leads on to fortune ...”
— William Shakespeare
This study is being published in the midst of widespread anxiety regarding
rising bad debt on the books of Indian banks. Rising bad debt and economic head winds are not the only worry for banks. There are stiffer challenges on the horizon in the form of fierce competition arising due to handing out of new banking licenses, a much more demanding regulatory environment and changing customer profile and expectations. The next three years will be a defining period for the Indian banking industry. While the challenges are real, a deeper examination also reveals a relatively solid banking system with many things to cheer about. While bad debt has gone up at an overall level, it has handsomely decreased in some segments. Digital adoption is showing an impressive trajectory and branches are being opened at three times the rate at which they were being opened a decade ago. Parallely, banks are maintaining a cost–income ratio below 50 percent with Return on Assets (ROA) close to one percent. Further, the leverage of the Indian banking industry has continuously reduced, reaching a safe value of 12.5 and the reliance on wholesale deposits has also come down remarkably in the last two years. In times of turmoil also lies a great opportunity for
players to make strategic moves and reshape the future. This is the opportunity that banks need to grab to build new capabilities and further improve productivity.
Progress in indian Banking: enough to Celebrate; lot More to doIn 2011, BCG had published a study on the productivity in Indian banking titled “Being 5–star in Productivity”. This report outlined an action agenda for the industry around five dimensions—branch sales and service, lean operations and technology, high perfor-mance organization design, digital channel excellence and bad debt management. Two years on, our latest study of the sector finds banks having made good progress on many dimensions, showing marginal improvement on some and regressing on a few.
Exhibit 1.1 summarizes the overall score card on various dimensions. There is creditable performance on digital adoption.
As depicted in Exhibit 1.2, across the board, there has been an increase in digital intensi-ty in bank transactions. In FY 2010–11, digi-tal transactions were 1.1 times the total cash and cheque transactions. Today they are 1.6 times—a 45 percent jump. Public sector banks have made the most visible progress (a 55 percent jump). Private sector banks have

10 | Consistency, Quality, and Resilience
seCtion HeadeR two linessuBTiTle Two liNes
Sources: FIBAC Productivity Survey 2011; FIBAC Productivity Survey 2013; BCG analysis.Note: NPA: Non–performing assets; hO: head office or corporate center of the bank; rO: regional offices / zonal offices / divisional offices of the bank.1Transaction digital intensity refers to ratio of number of transactions through digital channels (ATM, POS, internet / online and mobile) to cash and cheque transactions in the bank.
Exhibit 1.1 | Overall Assessment on Five Star in ProductivityMovement from FY 2010–11 to FY 2012–13
Sources: FIBAC Productivity Survey 2011; FIBAC Productivity Survey 2013; BCG analysis.Note: data of 2 Private (New), 2 Private (Old), 3 PSU (Large) and 4 PSU (Medium) banks excluded from the analysis because of data consistency issues or data unavailability. 1Transactions through digital channels includes all financial transactions at ATMs by own customers, POS terminals, internet / online transactions and all mobile transactions.
Exhibit 1.2 | Momentum Seen Towards Digitization Indian banks have done a reasonable job of increasing digital channel penetration
2.3
0.81.1
0.6
2.6
1.1
2.0
1.7 2.2
0.7
1.1
1.6
PSU (Large)
Private (Old)
PSU (Medium)
Private (New)
Number of transactions through digital channels1 / cash and cheque transactions
0.9
1.7
1.01.0
1.8
1.0
2.5
0.2
Industry average FY 2012-13 Industry average FY 2010-11
0.9
2.4
Average in FY 2012-13 Average in FY 2010-11 Low Median High
5 star in productivity
Branch sales and service excellence • Share of non-urban in new branches at
74% up from 59% in FY 2010-11 • No. of new branches opened has increased
by 7% over FY 2010-11 • Savings bank accounts opened per urban
branch has remained stagnant • Cash transactions per branch has increased
by 7.5% over FY 2010-11
New channel excellence • Active savings bank accounts in
metros using internet banking up by ~400 basis points over FY 2010-11 • Transaction digital intensity1 up by
~50 basis points over FY 2010-11
High–performance organization design • Percentage of admin (HO+RO) staff at
12%, close to best in class at 10% • Rise in admin staff by 1.6% over
FY 2010-11 • Variable component of compensation
increased from 1.6% in FY 2010-11 to 2.1% in FY 2012-13 • Not much change in finance, accounts,
planning and HR staff over FY 2010-11
Lean operations and operating model • Marginal increase (~15% over FY
2010-11) in size of back–offices—still sub–scale • Overall expenditure on IT still around
2.1% of revenues • No significant reduction in turnaround
time for account opening
Bad debt management • Overall Gross NPA (%) up by ~100
basis points over FY 2010-11 • Commercial segment Gross NPA up
by ~160 basis points over FY 2010-11 • Retail segment Gross NPA down by
~140 basis points over FY 2010-11 • Corporate debt restructuring at ~7%
of advances over FY 2010-11
Clear improvement Marginal improvement Clear deterioration Changes seen over FY 2010-11

The Boston Consulting Group • FiCCi • iBA | 11
also made progress (a 10 percent rise) from a relatively higher base and need a second wind. One of the subsequent chapters high-lights how personal banking customers have adopted digital channels much faster than corporate banking clients. The size of the op-portunity in digital is much bigger than what the banks have achieved so far. Progress on POS and mobile is not where it should be and the report highlights an action agenda for the same.
The industry has accelerated on branch addi-tions. As depicted in Exhibit 1.3, for the last four years, every year more branches have been added as compared to the previous one. Moreover, the branch additions in semi–ur-ban and rural areas have increased steadily, accounting for 75 percent of the total branch-es opened in FY 2012–13. This is an achieve-ment for the banking industry and for the Reserve Bank of India (RBI).
Driven by multiple factors, including– in-creasing branch penetration, the Indian banking industry reduced its reliance on bulk deposits during the last two years. This is de-
picted in Exhibit 1.4. For the banking indus-try as a whole, retail term deposits as a pro-portion of the total term deposit base increased from 46 percent to 52 percent. New private sector, which was particularly low at 26 percent retail composition in term deposits in FY 2010–11 has come up to 33 percent in two years. The overall systemic ro-bustness of the banking industry is steadily inching in the right direction. These achieve-ments notwithstanding, branches have more cash transaction per day than before and the clutter is only increasing. The number of ac-counts opened per day by branches has re-mained flat during this period. Banks need to build on their laurels in the branches.
Gross NPA on bank books have reached 3.4 percent of the total advances with the re-structured loans standing at 7.1 percent. There is a possibility that 15 to 20 percent of the restructured book may slip into NPA by FY 2013–14, should the economy not improve and gross NPA could reach close to 5 percent. Banks have lent a helping hand to industry which is stretched due to policy hurdles, ap-proval delays, and economic slowdown. And
Sources: IBA data; FIBAC Productivity Survey 2013; BCG analysis.Note: data of 4 PSU (Medium) banks excluded from the analysis because of data consistency issues or data unavailability.
Exhibit 1.3 | Branch Expansion up 45 percent in Five YearsSemi–urban and rural share in new branches upto 74 percent in FY 2012–13 from 44 percent in FY 2008–09
Break–up of new branches opened in each fiscal year (%)
31 3337
393325
2818
18 1431 23 2314 12
Fiscal year
2013
41
2012
30
2009
13
Rural
Semi- urban
Urban
Metro
2011
22
2010
16
6,421 4,664 5,982 6,238 4,422 Number of new branches opened

12 | Consistency, Quality, and Resilience
Sources: FIBAC Productivity Survey 2011; FIBAC Productivity Survey 2013; BCG analysis.Note: data of 2 Private (New), 3 Private (Old), 3 PSU (Large) and 9 PSU (Medium) banks excluded from the analysis because of data consistency issues or data unavailability.
Exhibit 1.4 | Less Reliance on Bulk Deposits
the impact of this restructuring on the banks’ books has been significant, implications of which loom large on the banking sector’s pro-jected financial performance. This research has highlighted a disaggregated position of NPA and found that retail NPA ratios de-clined handsomely during this timeframe from 3.4 percent to 2.0 percent. This is depict-ed in Exhibit 1.5. Despite the perceived slow-down in the economy, the retail engine kept humming fast and profitably. New practices adopted by the banking system, such as the usage of credit information bureaus for retail lending, are credited with driving a signifi-cant proportion of this improvement.
Customer feedback gathered for this report, from over 500 corporate clients of Indian banks, is stellar. While tepid demand for credit has hogged the limelight in discus-sions, the level of Indian corporates’ advoca-cy for their banks was found to be in line with the best BCG has seen across the world. Giving Indian banks a net advocacy score of 21 percent, corporate have handsomely rec-ognized the former’s contribution in terms of
flexibility and relationship. Along with the praise, corporates have highlighted the need for banks to improve operations, technology, turnaround time, and innovation. A study of corporates’ banking relationship revealed how banks can improve profitability of their relationships by building primary relation-ships with clients, improving service levels with regards to transaction banking products, and ensuring a multi product relationship with their clients.
Despite the challenges, the health of the In-dian banking industry continues to be solid. Exhibit 1.6 depicts the key ratios pertaining to the sector. The cost–income ratio has been range bound with a very marginal uptick. Profitability, measured by ROA, has also been steady, registering a marginal decline over the most recent fiscal year. Over the last ten years, the leverage (debt–to–equity ratio) of Indian banks came down from 17.4 to 12.5. The banking industry and the Reserve Bank of India have managed to make the fi-nancial system more robust so that it can ab-sorb shocks.
Break-up of term deposits into retail and non–retail term deposits (%)
5061
49 5061
53
26 3346 52
Fiscal year
48 51 39
50 54 67
74
47 39
50
Non–retail term deposits as % of total term deposits
Retail term deposits as % of total term deposits
Industry 2011 2013
PSU (Medium)
PSU (Large)
Private (Old)
Private (New)
2011 2013 2011 2013 2011 2013 2011 2013

The Boston Consulting Group • FiCCi • iBA | 13
Sources: FIBAC Productivity Survey 2011; FIBAC Productivity Survey 2013; BCG analysis.Note: data of 4 PSU (Medium) banks excluded from the analysis because of data consistency issues or data unavailability; bps: Basis points; NPA: Non–performing assets; MSME: Micro, small and medium enterprises.
Exhibit 1.5 | NPA Has Gone up But Not Everywhere
Sources: IBA data; Capitaline data; BCG analysis.Note: FY‘13E: Estimated value for FY 2012–13, data sourced from capitaline; Leverage refers to debt to equity ratio and is calculated as (rOE/rOA)–1; rOA: return on assets.1rOA is calculated for the Indian banking industry excluding foreign banks.
Exhibit 1.6 | Steady Financials
Movement in gross NPA (%) in FY 2012-13 over FY 2010-11
Fiscal year
3.7
2.0
3.4 3.5 2.5
3.2
1.5
5.3 4.3
4.8
% of industry advances
Retail Gross NPA%
2011 2011 2013 2013 2011 2013 2011 2013 2011 2013
Agricultural Gross NPA%
MSME Gross NPA%
Corporate Gross NPA%
Total Gross NPA%
100% 19% 13% 16% 52%
Deterioration seen over FY 2010-11 Improvement seen over FY 2010-11
–140 bps 110 bps 100 bps 170 bps 100 bps
Cost to income ratio for Indian banks flat (%)
Leverage of banking system has come down
45.544.345.445.049.9
63.3
Fiscal year
’13E ’12 ’11 ’10 ’05 ’01
1.01.11.1
1.01.0
0.5
’05 ’01
Fiscal year
’13E ’12 ’11 ’10
Period between FIBAC 2011 and FIBAC 2013
ROA1 has marginally decreased in the last 2 years (%)
12.512.913.113.1
15.3
17.4
Fiscal year
’13E ’12 ’11 ’10 ’05 ’01

14 | Consistency, Quality, and Resilience
three years Hence: Many Challenges; even More opportunitiesThe challenge is not just the economic uncer-tainty and their natural fall out in terms of rising bad debt. The next three years are ex-pected to witness trends that will compound the pressure on banks. As depicted in Exhibit 1.7, three other trends will put pressure on banks performance, apart from the economic uncertainty. The regulatory framework is ex-pected to be much tougher. Restructuring norms will result in additional provisions ev-ery year. New Priority Sector Lending (PSL) norms mean even higher remote business gathering with deeper penetration in rural and semi–urban areas. The new Basel III reg-ulatory framework would require banks to beef up their capital ratios, meaning that they will need to generate higher ROA to meet their profitability goals. An even bigger threat is likely to come from the new “new” private sector banks that should get banking licenses and begin operations within two to three years. These new “new” banks would come with customer value propositions that are a generation ahead of the ones offered by the incumbent industry players. They would come with next generation technology
without any legacy issues to deal with. They would seek to lure away customers and em-ployees from existing banks. All of this would lead to a spike in costs. Customer expecta-tions are rapidly rising. The corporate survey highlighted that customers are unhappy with the service quality, technology, and opera-tions. Meeting such expectations needs a continuous upgrade of infrastructure and ca-pabilities.
On the retail end, we expect a massive surge in customers– hither to unbanked– to enter the space. These customers come with very high value for money (“Paisa Vasool”) de-mands. They are large in number and they are based in smaller towns and villages. Serv-ing them will put strong demand on opera-tions and technology
Indian banks are not helpless in light of ex-ternal circumstances. They are blessed with powerful opportunities that can more than offset the challenges, thus ensuring sustained healthy balance sheets and value creation. Unfortunately, it is not a choice but a com-pulsion to invest heavily in these opportuni-ties in order to enhance productivity. These levers are critical to restore the banking in-
Source: BCG analysis.
Exhibit 1.7 | Looking Ahead, Productivity Enhancement More Crucial Than Ever
• Rapidly evolving and globalizing Indian corporate – Better technology – Improved operations
• The "new Indian consumer" – Smaller towns and villages—not just cities – Very large numbers—"Paisa vasool"
mindset
• Potential for new banks likely to ‘leap–frog’ extant operating models: – Better service / value proposition – Lower cost position
• Entry of new banks likely to increase competition for talent and hence costs • Non–banks (for example Telcos) also likely
to compete in select revenue streams
• BASEL III to enhance need for regulatory capital • Stringent provisioning norms for
restructured assets • Tighter priority sector lending norms for
direct lending • Aggressive push for financial inclusion
• Government action to expedite project closure and execution • Policy environment to enhance business
confidence and investment climate • External pressures due to global trends
New customers: new demands
Competitive intensity likely to rise
Regulatory trend to put pressure on returns
Economic uncertainty to continue
Productivity improvement more crucial
than ever
1 2
3 4
Salient reasons for focusing on productivity improvement

The Boston Consulting Group • FiCCi • iBA | 15
dustry to the pink of health, when the econo-my finally turns and the industry again looks at banks to support and fund their ambi-tions. This report has identified a range of ideas that banks should evaluate.
Chapter 2: Enhance profitability of corporate book with stronger transaction banking, deeper primary relationships, higher share of wallet through multi product relationships and better pricing
Chapter 3: Revamp credit processes and sys-tems with technology, information analytics, and capacity building in Small and Medium Enterprises (SME) credit and smarter restruc-turing
Chapter 4: Further enhance branch productiv-ity through a battle tested five star approach. Leap frog to next generation paperless branches
Chapter 5: Adopt lean processes and operat-ing model with high “tooth–to–tail” ratio and realign technology investments
Chapter 6: Step jump in digital adoption with special emphasis on new customer on–boarding and channel design
Chapter 7: Higher organizational effective-ness through delayering the administrative offices and more effective incentive system

16 | Consistency, Quality, and Resilience
HiGH PeRFoRManCe CoRPoRate BanKinGiNsiGhTs FRom iNdusTRy FeedBACk
“Your most unhappy customers are your greatest source of learning”
— Bill Gates
While the retail segment has been reasonably vibrant for Indian banks in
the last two years, the lack of credit demand from corporate has been a drag on growth. We surveyed over 500 companies ranging from very large to very small to understand how they bank and the level of satisfaction with Indian banks. We found overall advo-cacy of Indian banks is at par with interna-tional benchmarks. Nonetheless, when results are broken down by size of compa-nies, type of banks, sectors and products, several differences emerge. As a major feedback from corporates, Indian banks need to improve their operational and technologi-cal capabilities to meet the service expecta-tion. We found that across all segments, being a primary banker is disproportionately beneficial. Conventional wisdom that lending is crucial for primary banking relationship is challenged. Instead, we find that transaction banking products (such as current account) are primary drivers of such relationships. Product intensity varies across sectors and banks need to re–evaluate their current client portfolio to ensure they are not overweight on lending intensive sectors. Public sector’s client profile is one of the reasons why its NPA levels is high. Finally, an attempt is made to deep dive into the
attributes that are considered important by corporates for each product. Analysis shows stark differences in SMEs’ and large corpo-rates’ needs as well as satisfaction levels across attributes. Overall, banks have a significant profitability improvement oppor-tunity in their corporate books.
overall strong advocacy; But not For allThe overall advocacy level for Indian banks by corporate clients stands at 21 percent, a pretty good score given that scores above 20 percent are considered good for corporate banks internationally. However, there are sig-nificant variations. Exhibit 2.1 depicts the ad-vocacy scores for different types of Indian banks by the size of corporate clients. Overall, the score for public sector banks is highest at 23 percent, followed by the new private sec-tor banks at 18 percent and foreign banks at 16 percent.
The advocacy level for public sector banks goes up as we move from large to small cor-porates, standing out at 25 percent in the small corporate segment. The reverse is ob-served for foreign banks where the advocacy level falls as we move from large to small cor-porates. On the other hand, new private sec-tor banks enjoy the highest advocacy in the mid–corporate segment. Clearly, different segments of the Indian corporate sector find

The Boston Consulting Group • FiCCi • iBA | 17
the propositions from different type of banks most suitable.
The variations across industry and products are more pronounced. Exhibit 2.2 highlights the stark variations in advocacy scores by in-dustry, by product and by bank (top ten). Within the top ten banks, the advocacy score goes down from 38 percent to 10 percent. Two public sector banks top the charts. The list of top ten banks includes five public sec-tor banks, three new private sector banks and two foreign banks.
Advocacy scores by product show an interest-ing pattern. Traditional products such as term loans, working capital finance, current ac-count and trade finance get good advocacy scores. However, technology–and operations–intensive products like cash management, supply chain finance, custody, and advisory products like capital markets and investment management get relatively lower scores.
Certain sectors stand out in their advocacy for their bankers. Banks enjoy advocacy scores significantly above the average in ver-ticals including professional services, finan-
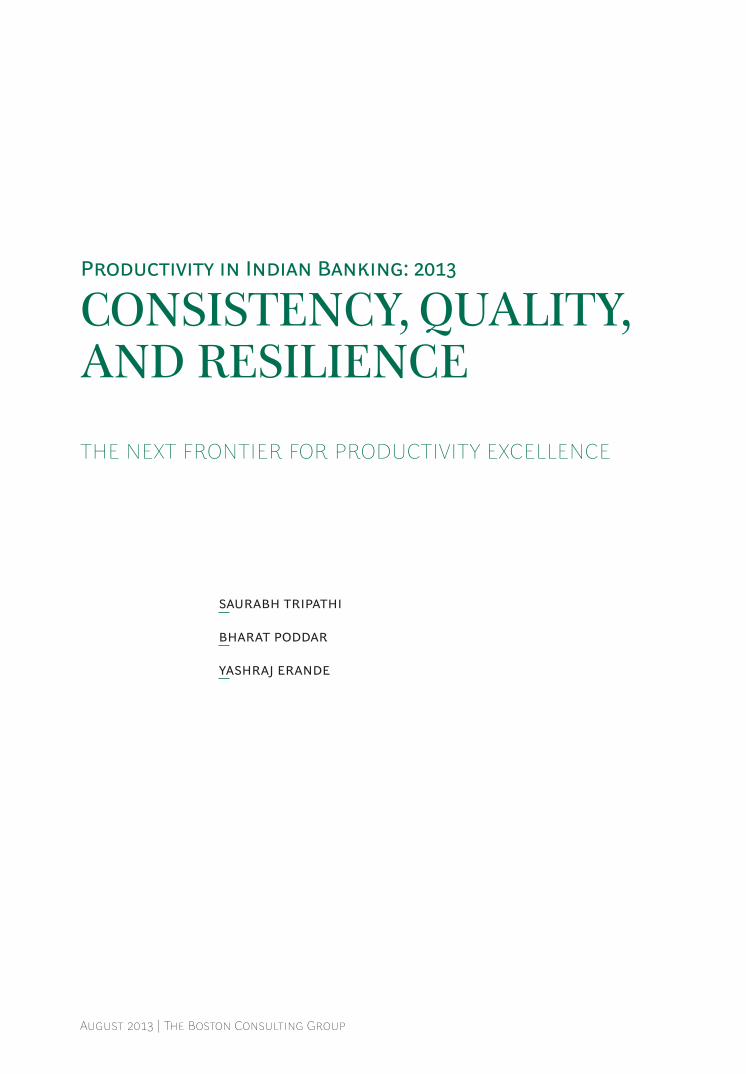
cial services, manufacturing, power, energy and infrastructure, and telecom and IT. On the other hand, logistics, pharma and health-care, real estate, retail and FMCG, metals and mining, education, etc. have significantly low-er advocacy scores. It is observed that indus-tries with higher product intensity (number of banking products used per customer) of transaction banking and advisory products, in general, have lower advocacy. Barring a few exceptions (for example, real estate, which has its unique context), most other industries show this pattern (as depicted in Exhibit 2.3).
Fix operations and technology: industry tell BanksExhibit 2.4 illustrates corporates’ perspective on the key strengths and weaknesses of the Indian banking industry. On the whole, three strengths stand out by a large margin. Corpo-rates believe that the Indian banks offer high–quality relationship management and good domestic branch network that serve their needs well. They also said that the Indi-an banks display a high degree of flexibility in supporting corporate clients. On the other hand, the perceived weaknesses show a pat-
Sources: FICCI–BCG Survey; BCG analysis.Note: Classification of corporates–Large: having revenue of more than rs. 1,000 cr. in FY 2012–13; Mid: having revenue between rs. 250–1,000 cr. in FY 2012–13; Small: having revenue of less than rs. 250 cr. in FY 2012–13; Public sector banks include SBI & Associates and nationalized banks; Old private sector banks (4) and other banks (4) have been excluded from the analysis above because of very small “N”.1Measured by Net Advocacy Score=Very Likely–Unlikely–Very Unlikely measured as a percentage of “N”.
Exhibit 2.1 | Healthy Advocacy Score for Indian BanksOverall advocacy for new private and foreign banks is lower than PSBs
Net advocacy score1 by size of corporates and type of banks (%)
21 2125 23
15
26
1518
21
15 14 16
21
Overall Small Mid Large
Type of corporate
Foreign banks New private banks Public sector banks Average in FY 2012-13

18 | Consistency, Quality, and Resilience
tern. Innovation stands out as the weakest spot. Speed of response / Turnaround Time (TAT), one of the top needs of corporate cli-ents, is also cited as one of the prominent weaknesses. In general, areas that need oper-ations– and technology–related expertise (for example, innovation, customization, fast pro-cessing and exception handling) are per-ceived as weaknesses.
How to Be a Primary Bank?Most corporate customers perceive one bank to be their overall primary bank. As we men-tioned earlier, this is the bank which has the first recall as their port–of–call for financial services. For some products the primary banks are different from the overall primary bank. Nonetheless, it is clear that the bank considered as overall primary bank gets larg-
Sources: FICCI–BCG survey, BCG analysis.Note: Sectors having less than 15 responses and banks having less than 15 data points have been excluded; Public sector banks include SBI and Associates and nationalized banks.1Measured by Net Advocacy Score=Very Likely–Unlikely–Very Unlikely measured as a percentage of “N”.
Exhibit 2.2 | Advocacy Varies by Sector, Product and by Bank
Net advocacy score1 by sector (%)
Net advocacy score1 by product (%)
Net advocacy score1 by bank (%)
10
13
13
17
17
21
22
22
23
23
23
Custody
Investmentmanagement
Cashmanagement
Supplychain finance
Capitalmarkets
Foreignexchange
Tradefinance
Workingcapital
finance
Payrollaccount
Currentaccount
Termloans
10
14
15
16
19
19
23
23
38
Bank 9
Bank 8
Bank 7
Bank 6
Bank 5
Bank 4
Bank 3
Bank 2
Bank 1
Public sector banks
New private banks
Foreign banks
6
9
9
13
13
14
14
17
17
27
29
29
31
32
Logistics
Real estate
Hospitality
Pharma & healthcare
Retail and FMCG
Metals, mining and capital goods
Education
Others
Media & entertainment
Telecom & IT
Power, energy & infrastructure
Manufacturing
Financial services
Professional services
The Boston Consulting Group • FiCCi • iBA | 19
Source: FICCI–BCG Survey; BCG analysis.1Net strength for an attribute is defined as number of corporates who voted it as strength minus the number of corporates who voted it as weakness. Positive values are overall strengths, negatives are weakness while zero values are neither strengths nor weaknesses.
Exhibit 2.4 | How Industry Views the Indian Banking Sector?
Sources: FICCI–BCG Survey; BCG analysis.Note: Lending includes term loans; Transaction banking (credit enabled) includes working capital finance, trade finance, supply chain finance; Transaction banking (non–credit enabled) includes cash management, current account, payroll account, forex and custody; Capital market and advisory include capital market products, investment management and insurance; Sectors with less than 15 responses excluded from analysis.1Measured by Net Advocacy Score = Very Likely–Unlikely–Very Unlikely measured as a percentage of “N”.
Exhibit 2.3 | Advocacy is Inversely Correlated with Product IntensityTransaction banking and advisory products are primary drivers of product intensity
Product intensity (average number of products per customer) and net advocacy score1 (%)
Transaction banking and advisory intensity
0
5
10
15
0
15
30
45
Retail and FMCG
Metal, mining and
capital goods
Telecom and IT
Media and Entertainment
Education
Pharma and Healthcare
Power, energy and infra
Manu-facturing
Financial services
Real Estate
Professional services
Net advocacy score Average number of products per customer
Hospitality
Logistics
3.0
1.2
0.7 0.8
2.7
1.1
1.5 0.8
2.7
0.8
0.2
2.6
1.0
0.6 1.7
3.9
1.8
0.5 1.8
3.8
1.9
0.7 1.6
3.7
1.9
0.7 1.6
3.5
1.5
0.8 1.4
3.2
1.5
0.7 0.9
2.6
4.5
2.5
0.8
2.3
4.3
2.4
0.8 2.0
4.3
2.0
0.7 2.1
4.0
2.0
0.6
Lending Capital market and advisory
Net advocacy score Transaction banking (non–credit enabled)
Transaction banking (credit enabled)
0.5
-30
-20
-10
0
10
20
30
Price
International network
Exception handling
Customization
Service charges
Turnaround time
Technology
Innovation
Net strength1 (%)
Quality of RM
Domestic network
Flexibility
Brand image
Product expertise
= Issues concerning operations
Corporate feedback on perceived strengths and weaknesses of Indian banks
Operating model not adequately customer centric
One stop shop
Length of relation
Amount of capital
Quality of online

20 | Consistency, Quality, and Resilience
er share of business. As shown in Exhibit 2.5, primary bank’s share of business from large corporate clients is typically 2X the share gar-nered by the secondary bank for same set of clients. The ratio increases to 3X for smaller clients. The same pattern is observed at the industry level (manufacturing and services). Hence, it is advantageous to be the primary bank of the corporates as such banks get pro-portionately higher share of clients’ banking business.
Exhibit 2.6 depicts the pattern of banking re-lationships from the overall primary bank and other banks. The graph shows the pro-portion of total customers who use a particu-lar product and within that, it shows the pro-portion of clients for whom the overall primary bank is the primary provider of that product as well. For instance, 93 percent of the sample uses current accounts and 82 per-cent have their overall primary bank as the primary bank for their current accounts also. Similarly, 42 percent of the 62 percent corpo-rates in the sample who take working capital
finance have their overall primary bank as the primary provider of working capital fi-nance also.
It is clear from the analysis that the product that defines primary banking relationship is current account. Almost 90 percent of clients (using current account) keep current accounts with a bank that they consider their overall primary bank. Working capital finance comes a distant second. The corporate customers who do not use current account (seven per-cent of the sample) treat working capital fa-cility (cash credit) for transaction purposes. For such customers, working capital finance determines the primary banking relationship.
It is very clear from Exhibit 2.7 that lending does not define primary banking relationship. Just because a bank is lending its balance sheet to a corporate client, it does not be-come the latter’s primary bank. On the other hand, banks with substantial balance sheet exposure to a corporate client should use their bargaining power to be considered pri-
Sources: FICCI–BCG Survey; BCG analysis.Note: Primary bank is defined as the bank having maximum share of a corporate’s banking business; Secondary bank is defined as the bank having second highest share of business; Classification of corporates—Large: having revenue of more than rs. 1,000 cr. in FY 2012–13; Mid: having revenue between rs. 250–1,000 cr. in FY 2012–13; Small: having revenue of less than rs. 250 cr. in FY 2012–13; Sectors have been classified as manufacturing and services based on National Industrial Classification report from Central Statistical Organization; Manufacturing includes power & energy, pharma, textiles, metal, mining and capital goods, real estate, retail & FMCG, gems & jewellery, oil & gas; Services include education, professional services, advertising, media & entertainment, hospitality, logistics, civil aviation, financial sector, healthcare, trading, travel & tourism, telecom & IT and other miscellaneous services.1P / S = Share of primary bank business / share of secondary bank business
Exhibit 2.5 | Primary Banks Get ~2–3x Business Share Than Secondary BanksPrimary banks get higher share from smaller companies
By size of corporate By type of corporate
Business from banking relationship (%) Business from banking relationship (%)
Small
76
24
Mid
60
27
Large
52
26
65
26
Services
67
26
Manufacturing
2.0 2.2 P / S1 3.1 2.5 2.5
Primary bank Secondary bank

The Boston Consulting Group • FiCCi • iBA | 21
Sources: FICCI–BCG Survey; BCG analysis.Note: Primary bank is defined as the bank which is regarded as the overall primary bank by the corporate.
Exhibit 2.6 | Current Account Determines Primary Banking RelationshipHow many of your corporate clients keep their primary current account with you?
Sources: FICCI–BCG Survey; BCG analysis.Note: Primary bank is defined as the bank which is regarded as the overall primary bank by the corporate.
Exhibit 2.7 | Lending is Not Enough to be Considered a Primary BankLenders need to negotiate better share in other products / increase overall share of wallet
11
39
78
14
18
14
14
11
6
4
2
3 5 2
8 6
9 5
15 9
34 23
40 26
56 42
59 41
62 48
80 2
Supply chain finance
92 53
Custody
93 82
Payroll account
Current account
Capital markets
Investment management
Trade finance
Cash management
Term loans
Foreign exchange
Working capital finance
Insurance
Others Primary bank
Corporates using various products (%)
56
68
79
32
39
27
19
10
7
4
4
56
5
8 4
9 2
15 5
Cash management
34 15 Trade finance
40 13
Investment management
59 20
Capital markets
62 30
Supply chain finance
80
Custody
92 24
Working capital finance
93 37
Foreign exchange
Payroll account
Insurance
Current account
Term loans
From other banks From primary term loan provider
Corporates using various products (%)

22 | Consistency, Quality, and Resilience
mary banks for other profitable products. Even as the off–take of term loans by corpo-rate clients for capacity expansion is low due to the ongoing economic slowdown (only 56 percent of corporates in the sample use term loans), banks could use this opportunity to build business in other products by leverag-ing the existing lending relationship.
Pathways to a Resilient and Profitable Corporate FranchiseExhibit 2.6 shows that primary banks often do not get a healthy share of all profitable products from their corporate clients. Payroll account is a case in point. Only 53 percent of customers use their overall primary bank as the primary bank for payroll accounts while 92 percent of the corporates in sample avail payroll account facility. Hence, banks are missing on a significant profitability opportu-nity given the huge float from salary accounts of corporates’ employees. Similarly, only 60–65 percent of corporate customers use their overall primary bank as the primary bank for cash management, forex products, trade fi-nance and working capital finance. Banks who enjoy primary bank status with their cor-porate clients can use the relationship to deepen their engagement with such custom-ers by offering more profitable products.
There are several industry segments that are not capital intensive and do not use term loans. Only 56 percent of the sample uses a term loan facility. Banks need to approach the remaining 44 percent with propositions that are not lending–driven, but are more ori-ented towards facilitating transactions. While there is tepid demand for credit in the corpo-rate segment currently, banks can focus on the non–credit driven parts of the product portfolio.
Exhibit 2.3 shows the intensity of product us-age by different sectors. It is evident that re-quirement of banking products and services is very high in case of certain sectors. Capital-izing on such relationships can be extremely profitable for banks, given their huge cross–selling potential.
As depicted in Exhibit 2.3, lending products (pure term lending and credit–enabled trans-
action products) are a small portion of the product portfolio needed by many sectors. Non–credit enabled transaction banking products (for example, current account, pay-roll account, forex etc.), and capital markets and advisory products constitute a major component of corporate demand. Banks need to evaluate whether their client mix has a fair share of customers from sectors that have high product intensity so as to achieve higher profitability per client.
Exhibit 2.8 shows the current pattern of pri-mary banking relationships in the Indian cor-porate banking market. It is evident that pub-lic sector banks dominate manufacturing and other more traditional industry segments such as power, energy and infrastructure. New private sector banks dominate the ser-vices segment. The manufacturing sector is more lending oriented in its product demand and this leads to a more lending–oriented product portfolio of public sector banks. Share of public sector banks in lending and credit–enabled transaction banking products is higher. This can be changed with a concert-ed attempt to broaden and balance the cus-tomer portfolio.
Public sector lenders are the predominant primary banks for large corporate clients. As the size of corporates reduce, the share of primary banking relationship shifts to new private sector banks. Smaller corporates are less price sensitive and give much higher share of their business to their primary bank. If managed well, the profitability of serving this segment is very high. The next section discusses the areas where small en-terprises are not happy, and what would it take for banks to build primary relationships with such customers.
On the other hand, data clearly highlights that public sector banks in general, and State Bank of India in particular, have a unique op-portunity to leverage the extensive primary banking relationships to enhance depth and profitability of their corporate franchise.
Primary banks can gain a share of corporate clients’ wallets by being competitive on the product portfolio. Exhibit 2.9 shows the rela-tive importance of various attributes in a

The Boston Consulting Group • FiCCi • iBA | 23
Sources: FICCI–BCG Survey; BCG analysis.Note: rates and charges include cost of capital and service charges; Technology includes quality of online and mobile banking; Others include exception handling, length of relationship and brand image of the bank.
Exhibit 2.9 | Product Wise Attributes Critical to Customers
Sources: FICCI–BCG Survey; BCG analysis.Note: Classification of corporates—Large: having revenue of more than rs. 1,000 cr. in FY 2012–13; Mid: having revenue between rs. 250–1,000 cr. in FY 2012–13; Small: having revenue of less than rs. 250 cr. in FY 2012–13; Lending products include term loans; Transaction banking (credit enabled) include working capital finance, trade finance and supply chain finance; Transaction banking (non–credit enabled) includes cash management, current account, payroll account, forex products and custodial services; Capital market and advisory products include capital market products, insurance and investment management. 1SIdBI and Cooperative bank.
Exhibit 2.8 | Pattern in Primary Banking Relationships
By size of corporate
Primary banking relationship (%)
By type of industry
Primary banking relationship (%)
By type of product
Primary banking relationship (%)
Small
41
85
80
36
Mid
28
42
31
13
Large
55
46
20
18
Services
38
60
85
38
Manufacturing
85
107
44
30
32
Transaction banking (credit
enabled)
14
26
34
25
Transaction banking
(non–credit enabled)
12
28
33
26
Capital market & advisory products
36
21
Lending products
28
37
24
8
Nationalized banks New private banks Others1SBI & Associates Old private banks Foreign banks
1 1 1 10
1 1 1 1
Product–wise importance of attributes (% of corporates)
17 1514 15 10 15
10 16 14 12
9 117 18
1212
1410 11 9
14
8 9
10
12
1112 15 16
10 1717
7 715
10
127 8
10
6 1116
147
12 10 119
12 8 16
89
7148978
17 23 24 24 25 26 26 26 29 34 35
Capital markets
Foreign exchange
Current account
Payroll account
Cash management
Trade finance
Working capital finance
Investment management
Supply chain
finance
Term loans
Insurance
Rates and charges Flexibility Turnaround time Amount of capital
Others Product expertise Innovation, technology and customization
Quality of relationship management
International branch Domestic branch
3 1 5 4 1 6
2 3 4 1
6
2
6
3
4 1
4 4
1 4
4
1 3 1 4
3
6
2 3
3 1
6
6 6 6 6
6

24 | Consistency, Quality, and Resilience
Sources: FICCI–BCG Survey; BCG analysis.Note: rates and charges include cost of capital and service charges; Technology includes quality of online and mobile banking; Others include exception handling, length of relationship and brand image of the bank; Large corporates: having revenue of more than rs. 1,000 cr. in FY 2012–13; Mid corporates: having revenue between rs. 250–1,000 cr. in FY 2012–13; Small: having revenue of less than rs. 250 cr. in FY 2012–13.
Exhibit 2.10 | Business Markets for SME Needs to Acknowledge Their Unique DemandsSME place lesser emphasis on price; higher on turnaround time and relationship management
product from a customer’s perspective. Pricing and service charges stand out as the predomi-nant factor across the board. The importance of price is higher in traditional lending–orient-ed products and is less important in transac-tion banking products. Banks whose product portfolio is skewed toward traditional prod-ucts face relatively higher margin pressure during times of economic slowdown. Beyond pricing, the top attributes important to cus-tomers are flexibility and shorter turnaround time. The other three critical elements are quality of relationship management, product expertise, and innovation, technology and cus-tomization. The weight of attributes varies by product and can be used by banks to fine–tune their product proposition.
How to win in sMesNeeds of the SMEs are very different from those of larger corporates. Exhibit 2.10 encap-sulates the feedback from companies of dif-ferent sizes for current account (non–credit enabled transaction product) and working capital finance (credit–enabled transaction product). SMEs are less price sensitive than
large corporates. The difference in sensitivity to price between the two is particularly stark in case of working capital finance. It is a bit subdued, but perceptible, even in case of cur-rent account. Therefore, SME franchise is more profitable with right pricing. SMEs place higher emphasis on turnaround time and quality of relationship management. By emphasizing on these two attributes, a bank can build a more compelling SME business model, and gain share as a primary bank in the segment.
Exhibits 2.11 depict the contrast in levels of satisfaction between large and small corpo-rate clients. The exhibits show the satisfac-tion levels for each attribute across six most used corporate banking products. It is evident that the satisfaction level of small corporates is invariably below that of large corporates across all products. The small corporate seg-ment does not get enough quality service. The gap between satisfaction levels of large and small corporates is much larger in cash management, working capital finance and trade finance while being smaller in current account, payroll account and term loan.
16 1614
8 1114
913 12
8798 11
12 8 8
Large Small
24
Mid
28 27
1717
11
910
13
9 10
8
9
12
787
Small
27
Mid
34
Large
40
Importance of attributes for current account (% of corporates)
Importance of attributes for working capital finance (% of corporates)
Rates and charges Flexibility Turnaround time Amount of capital
Others Product expertise Innovation, technology and customization
Quality of relationship management
International branch Domestic branch
5 1
4 4
4 4 1
6
4
4 3 1
6 7 5
3
4 5 1 5 1
6

The Boston Consulting Group • FiCCi • iBA | 25
Sources: FICCI–BCG Survey; BCG analysis.Note: Large corporates: having revenue of more than rs. 1,000 cr. in FY 2012–13; Small corporates: having revenue of less than rs. 250 cr. in FY 2012–131Net satisfaction score = Corporates who voted one minus the sum of corporates who voted as three or four on their satisfaction for each product attribute as a percent of total respondents for that particular product.
Exhibit 2.11 | Variation in Satisfaction Between Large and Small CorporatesHigher dissatisfaction in credit–enabled transaction banking (WCF, TF) and technology–centric products (CM)
3 1 5 4 2
1 2 3 4 5
4 1 5 2 3
4 1 5 2 3
4 1 5 2 3
0
30
60
0
30
60
Net satisfaction score1 for each product attribute (%)
Small Large Top five attributes for products
Non–credit enabled
transaction banking
products: Net satisfaction
score1 for each product attribute (%)
Current account
(CA)
Cash manage-
ment (CM)
Price
Flexibility
Amount of capital
Turnaround time
Quality of RM
Product expertise
Service charges
Domestic network
Quality of online
Customization
Brand image
Length of relation
Inter- national network
Innovation
Technology
Exception handling
Credit and credit
enabled products: Net satisfaction
score1 for each product attribute (%)
0
30
60
Payroll account
(PA)
0
30
60
0
30
60
Working capital finance (WCF)
Term Loans (TL)
Price
Flexibility
Amount of capital
Turnaround time
Quality of RM
Product expertise
Service charges
Domestic network
Quality of online
Customization
Brand image
Length of relation
Inter- national network
Innovation
Technology
Exception handling
0
30
60
Trade finance
(TF)
3 1 5 2 4
#

26 | Consistency, Quality, and Resilience
Clearly, small corporates do not get the de-sired service quality in products with a higher operations component.
SME business can be very profitable. For the banks who get it right, it is the most profit-able segment in the corporate bank. It re-quires a different business model. Pricing is better. Clients are more willing to pay for ser-vice than large corporate clients. Moreover, SMEs have the personal business of owners that can be cross sold by the banks (consumer loans, savings, wealth management). In India, bad debt is a major drag in SME business profitability. So, deeper discussion on SME business model has been placed in the fol-lowing chapters.
implications for BanksThe feedback from corporates carries clear implications for banks. Even with the current slowdown in credit demand, there is a tre-mendous scope to improve profitability in the corporate banking franchise. Banks need to answer the following questions regarding their client and product portfolios, as well as their service levels based on technological and operational capabilities:
For how many of your clients are you the 1. primary bank? Do you get your appropri-ate share in client business volumes? For how many products that your client purchases, are you a primary banker?
Is the client portfolio balanced? Is it too 2. biased toward industry segments that are credit heavy and transaction light?
Is the product portfolio balanced? Does 3. the bank have strengths in credit driven products and weaknesses in transaction products that are more driven by IT and operations?
Does the bank have a transaction banking 4. unit that focuses on excellence in transac-tion banking products like cash manage-ment, current account, trade finance etc.?
Does the bank have a distinct SME 5. banking model that ensures right level of relationship management, quick response time and right attention to operation quality in technology centric products?
Does the bank plan to use operation and 6. technology to differentiate its proposition to corporate clients?

The Boston Consulting Group • FiCCi • iBA | 27
“Our fears always outnumber our dangers”— Latin Proverb
Between FY 2010–11 and FY 2012–13, bad debt on the books of Indian banks
has increased inordinately. There is a justifi-able alarm. Naysayers believe there is a lot of bad debt that is hidden, and it would surface in days to come. Fatalists argue that it is driven by economic headwinds, and that we have to wait till the economic troubles abate. A closer examination of facts, however, throws up a nuanced view that belies both naysayers and fatalists. This research high-lights that:
Growth in bad debt is primarily driven by •corporate and SME credit, which account-ed for almost 90 percent of the growth in NPA. Every other category of lending saw at least one type of bank actually improv-ing their gross NPA ratio by more than 100 basis points
Cutting across bank type, retail credit saw •a dramatic decline in bad debt. Advanced approaches like use of credit information bureaus have played a role. Such ad-vanced approaches like deploying infor-mation and data analytics are missing in corporate credit
Banks need to invest in enhancing quality •of credit process, reducing cycle times,
enhancing technical capacity, and improv-ing pricing
Banks need to develop capabilities in •better strategic due diligence and moni-toring and oversight of management and operational turnaround of restructured assets
Green shoots in otherwise Red landscapeExhibit 3.1 depicts the disaggregated profile of NPA in the industry in FY 2012–13, and in FY 2010–11. MSME and agriculture advances stand out as Achilles’ heel. Both segments saw a one percent increase in gross NPA ra-tio over FY 2010–11. The corporate advances had the highest growth in gross NPA, from 1.5 percent in FY 2010–11 to 3.2 percent in FY 2012–13. Major segments of retail saw a reduction in NPA levels.
Exhibit 3.2 gives a more granular picture of the change in gross NPA observed in differ-ent segments between FY 2010–11 and FY 2012–13. In retail segments, almost all bank types witnessed a significant improvement in gross NPA. Corporate segment is the only one where we notice deterioration across all bank types–the trend being more pro-nounced in the public sector, a bit less so in the private sector. We find that the private sector has improved its NPA performance in
ManaGinG BalanCe sHeet stRess
NexT–GeNeRATioN CRediT ANd ColleCTioNs PRACTiCes

28 | Consistency, Quality, and Resilience
Sources: FIBAC Productivity Survey 2011; FIBAC Productivity Survey 2013; BCG analysis.Note: data of 4 PSU (Medium) banks excluded from the analysis because of data consistency issues or data unavailability; NPA: Non–performing assets; LAdS: Loan against deposits and shares; MSME: Micro, small and medium enterprises.1Other retail loans includes personal, clean, unsecured loans and credit card loans.
Exhibit 3.1 | NPA Profile in Indian Banking
Sources: FIBAC Productivity Survey 2011; FIBAC Productivity Survey 2013; BCG analysis.Note: data of 4 PSU (Medium) banks excluded from the analysis because of data consistency issues or data unavailability; NPA: Non–performing assets; MSME: Micro, small and medium enterprises.1Other retail loans include personal / clean / unsecured loans, student / education loans, credit cards, loan against deposits and security and non–agri jewel loans. 2Change in Gross NPA (%) in bps measured for FY 2012–13 over FY 2010–11.
Exhibit 3.2 | Green Shoots in an Otherwise Red LandscapeGreen in retail and private new banks; attention required on direct agricultural, corporate and MSME
Segment–wise comparison of gross NPAs (%) in FY 2012-13 and FY 2010-11
100 80 60 40 20 0
LADS Private car loan
Corporate advances
3.2
Agriculture advances
4.8
Other retail loans1
5.1
MSME advances
5.3
Home loan
1.3
Percentage of industry advances
2.2
0.2
4.3 3.7
4.9
1.5
4.0
Gross NPA in FY 2010-11 (%)
1.7
0.5
Gross NPAs (%)
Heat map indicating change in gross NPA (%)
0 to 100 bps > 100 bps –1 to –100 bps < –100 bps X
Y X = Gross NPA (%) in FY 2010-11 Y = Gross NPA (%) in FY 2012-13
Retail Agriculture Home Private car Direct Other1
Corporate MSME Indirect Bank type
PSU Large
PSU Medium
Private New
Private Old
5.0 2.2 1.9 2.4 3.6
6.6 2.2 3.8 1.4 2.6 3.5 1.8 1.1 2.1 3.4
4.8 3.1 3.4 2.2 2.9 2.2 1.0 1.7 2.1 2.8
1.5 10.4 1.9 1.5 0.7 4.5 3.1 1.4 9.8 13.3
2.3 1.4 1.7 1.9 5.3
2.4
1.3 2.5
1.8 3.0
1.7 1.4
0.6
5.1
7.3 3.7
5.0 5.9
2.9 1.0
1.3
Change in gross NPA (%) in basis point2
The Boston Consulting Group • FiCCi • iBA | 29
agriculture segments, with the old private banks having the best performance at 1.5 percent of gross NPA.
The banking industry’s success in retail lend-ing is explained in large measure by the sec-tor’s adoption of credit information bureaus for credit appraisal. Such measures have not yet been taken in agriculture and MSME cred-it. Over the next three to five years, banks have to capitalize on rollout of Aadhaar to en-sure adoption of information bureau for di-rect agriculture. MSME and corporate seg-ments lend themselves to much more extensive use of data driven analysis tech-niques. They have to be adopted with urgency.
Our research has highlighted a set of specific ideas for each segment that can be effective-ly deployed by banks in the meanwhile.
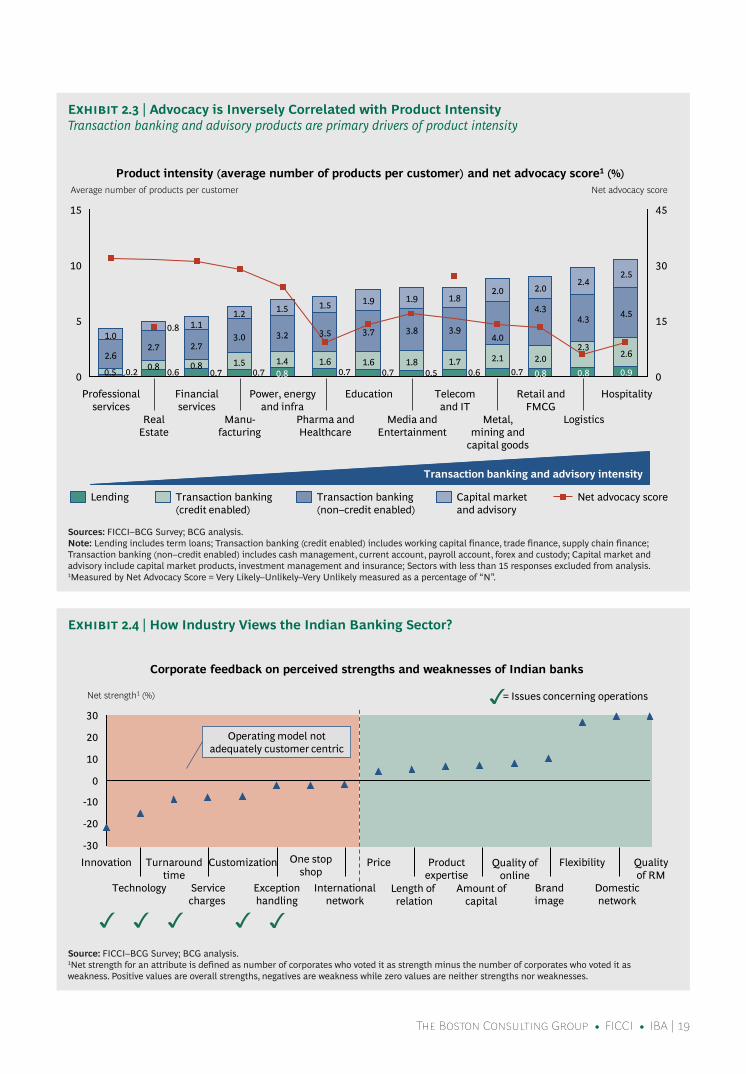
Gold Can be Golden: Possibilities in agriculture lendingAgriculture lending suffers from lack of any credible collateral. Threat of repossession of agricultural land is not a strong–enough de-
terrent to default. The experience of some banks and NBFCs in gold–backed agriculture loans offers an interesting opportunity in the medium term. Currently, about 16 percent of total direct agricultural lending of banks is based on gold being used as collateral.
It is estimated that the total gold stock held by households in semi–urban and rural India is close to Rs. 42 trillion. This stock is most likely to be in the form of jewellery. If 20 per-cent of this stock were to be used as collateral at 60 percent loan to value, to take loans for agricultural purposes, we could support Rs. 4.2 trillion of additional lending for agricul-ture purposes. This is nearly equal to the total current annual flow of credit for direct agri-culture. This is a realistic possibility when tri-angulated with reference to banks’ distribu-tion network. Rs. 5 trillion of direct agriculture credit amounts to Rs. 100 million of gold–backed agriculture lending from each semi–urban or rural branch. Some banks actively pursuing such lending have indeed found this much off–take of credit per–branch feasible. This scenario is depicted in Exhibit 3.3. The massive amount of unproductive gold in India
Sources: FIBAC Productivity Survey 2011; FIBAC Productivity Survey 2013; World Gold Council; rBI; BCG case experience; BCG analysis.Note: data of 3 Private (New), 3 Private (Old), 1 PSU (Large) and 6 PSU (Medium) banks excluded from the analysis (regarding proportion of jewel loan in direct agri loans) because of data consistency issues or data unavailability; LTV: Loan to value ratio.1Price of 10 gms of 24 karat gold taken as rs. 30,000.2data for FY 2012–13 for 37 listed Indian banks.3Based on BCG’s experience in Indian markets.
Exhibit 3.3 | Gold Can be GoldenOpportunity to nearly double direct–agricultural loan book using gold as a collateral
Opportunity for direct agricultural–jewel loan in semi–urban and rural India
430430500
~2x
Potential direct–
agricultural loan book with
20% of gold stock used
as collateral with 60% LTV
Current direct–agricultural loan book2
4,200
Total gold stock in semi–urban
and rural India1
~10
~50,000
~500
Total potential for Direct Agricultural–Jewel Loan in semi–urban / rural India (Rs. '000 Cr.)
b
c = a x b
Direct agricultural–jewel loan disbursal per annum per semi–urban / rural branch3 (Rs. Cr.)
a
Number of semi–urban / rural branches in industry
80
Rs. '000 Cr.
Direct agricultural–jewel loan
Direct agricultural–non–jewel loan

30 | Consistency, Quality, and Resilience
can thus be leveraged to facilitate flow of credit to the crucial sector in a profitable and sustainable manner.
speed of Credit Process: a Co-vert driver of Credit QualityBCG research and case experience have shown that the speed of decision making in the credit process has a direct bearing on the quality of the portfolio. Banks with very ro-bust and thorough–but slow–credit process often end up with poor loan book. High turn-around time triggers a vicious cycle that is self–feeding, and creates an ecosystem that fosters poor credit (as shown in Exhibit 3.4). Good customers, typically, do not wait for the delayed decision, and try out other sources. This leads to adverse selection, and only poor–quality customers end up with the bank. The bad debt experience of the bank leads to low confidence among its credit staff, and encourages heightened risk averse-ness. Banks react by adding more checks and balances, which further elongates the deci-sion time. Reduction of turnaround time is the first step in the journey toward excel-lence in credit. It is a tough nut to crack.
BCG project experience has shown that the following levers need to be pulled.
Segmentation of credit process: 1. Certain credit proposals have to be automatic, some need to have light touch, and the remaining require full due diligence. Based on the amount of loan and the credit score of the customer, the process can be segmented so that certain propos-als will be processed straight through while others get varying levels of manual processing. This is particularly true for annual renewals of the existing limits.
Workflow automation:2. The entire process has to be on an electronic platform, with minimum paper movement in the organization. Any paper involved is scanned at the very first instance, and then truncated.
Rationalization of product portfolio:3. Simplicity of product portfolio helps in ensuring that relationship managers and credit staff stay focused, and can explain to customers with confidence and author-ity. A plethora of products gives a false sense of comfort to the bank that it is customer centric. BCG case experience has shown that the majority of products are not known to the field staff, do not contribute much business, and simply add to complexity.
Source: BCG analysis.
Exhibit 3.4 | Delay in Credit Decisions Triggers a Vicious Cycle
Adversely selected
credit portfolio
High turnaround
time
Good customers
give up and
leave
Low credit staff
confidence
Risk averse credit
culture

The Boston Consulting Group • FiCCi • iBA | 31
Templatized short credit memoranda: 4. Long credit memoranda typically do not contain more information. They hide lack of real information in a lot of words. We have found that templatized memoranda with restriction in size ensures quality and brevity of note and hence the decision.
Modular documentation:5. Documentation is often very lengthy, with a large number of signatures required for legal docu-ments. In BCG experience, this documen-tation process can be streamlined by making it modular. Different modules may be required for different products.
Remove wasteful iterations:6. Redesign of processes steps should be undertaken to remove process inefficiency. Redundant checks, rework, queries and loops, and instances of “First Time Not Right (FTNR)” need to be identified and eliminated. The credit memoranda, prepared in the first instance, have to be final in terms of quality so that no rework is needed later.
Process transparency:7. The credit process has to be made transparent to the customer. If credit process workflow is automated, it is possible to give the customer access to the current status of his / her application. This has a strong bearing on customer satisfaction with the process, as well as on retention of quality customers.
Use of advanced data analytics approaches:8. Use of advanced approaches, based on analysis of data, to predict risk worthi-ness, or to provide early warning signals, is a powerful lever in commercial credit. It is of particular relevance in SME credit as it reduces cost of monitoring relatively small–ticket SME loans. Banks are at a particular advantage. Bank have core banking solutions established for the last five to seven years. They sit on huge data on customer transactions. This data can be analyzed to assess creditworthiness, or to trigger early warnings. In India, surrogate data gathered from external sources has to supplement financial and
transaction data. This is critical due to non–reliability of financial data of certain type of customers. Surrogate data can be non–financial data like utility bills, etc. Predictive techniques throw up signals to inform and complement human judgment, and not to replace it. It is critical that the final decision is not abdicated to the machine even as the machine aides in the decision process and makes it faster.
advanced approaches for Risk ManagementAdvanced risk management approaches re-late to the use of analytics on data gathered from a diverse range of sources. As shown in Exhibit 3.5, the following six types of analyt-ics have been found to be useful in commer-cial credit:
Statistically valid credit scoring:1. Ratings or scoring schemes used by banks are often not statistically valid. Information systems are now pervasive, and banks possess historical data for reasonably long periods. It is imperative that scoring schemes are statistically validated. BCG’s experience has been that such schemes that are purchased off the shelf typically do not give desired results. Credit scoring should be developed and validated in house by the bank’s own team. It is a core skill that should not be “outsourced”.
Predictive early warning systems: 2. Conduct of the current account (or cash credit / over draft) is a massive source of insight. Good old convention requires bankers to review the conduct of account personally to assess its health. With advanced analyt-ics, it is now possible to generate predic-tive signals that can trigger deeper scrutiny. This allows for right amount of human intervention early enough in an account, where otherwise it is unviable to do so given the high cost of human oversight.
Information bureau services:3. Impact of information bureau on quality of credit is apparent in retail. The same is not yet leveraged for commercial credit. Credit

32 | Consistency, Quality, and Resilience
history is a powerful enabler of SME credit, in the absence of collateral or reliable financials. Information bureau services need to be utilized not just at the point of origination, but also during the entire loan life cycle, to identify stress in portfolio that is not apparent superfi-cially. The fact that a borrower has defaulted to other lenders is an early indicator of upcoming stress on your
books also. Information bureaus have to be able to use not just information submitted by the banks, but also utility bill payments and similar records, to create valid scores.
Psychometric evaluation of creditworthiness:4. The latest innovation in SME credit is the use of psychometric assessments to predict a prospect’s creditworthiness. Psychometric
Source: BCG analysis.Note: SME: Small and medium enterprises; POS: Point of sale.
Exhibit 3.5 | Advanced Approaches for Risk Management
Statistically validated credit
scoring
Credit scoring based on surrogate data / non–financial metrics • Highly local factors • Factors specific to owners (vs. financials of business) • Ranking of financial metrics (vs. absolute values)
Predictive early warning systems
Predictive Early Warning Systems (EWS) • Statistically valid model based on conduct of operating account • Identify 15–20% accounts that deserve manual personal attention
Information bureau
SME information bureau • Credit history • Surrogate information (for example, utility bills)
Portfolio check / evaluation
Psychometric evaluation of
credit worthiness
Predict borrower propensity to repay • Statistical model • Qualitative questionnaire • Online administration
Standardized judgment
Standardise the subjective judgment to assess risk • Management behavior • Operating environment • Market feedback • Supply chain feedback
POS data based credit line
Track and analyse data of transactions at POS terminal to establish • Credit worthiness • Extent of credit limit
1
2
3
4
5
6

The Boston Consulting Group • FiCCi • iBA | 33
tests rely on statistical analysis of answers given by the prospect to a number of structured questions that relate to his or her willingness to repay, appreciation of the obligation, understanding of business economics and business acumen.
Standardized judgment:5. The element of judgment cannot be taken out in SME lending since data is never perfect and reliable. On the other hand, given the small ticket size of SME lending, it is not cost effective to allocate enough person-nel time to each loan account for assess-ment and ongoing monitoring. Automatic, data–based early warning systems throw up 15 percent accounts that merit atten-tion. Such accounts need to be subjected to judgment–based evaluation. It has been found that even in subjective assessment a few key questions have most predictive power, and leaving it to the discretion of credit officer risks losing sight of critical questions. In a standard-ized judgment approach, the critical questions are standardized and coded in a multiple choice format. This lends to easy data capture, analytics, and future validation.
POS data–based credit lines:6. Transactions at Point Of Sale (POS) terminals provide a very rich source of data regarding pat-terns of revenue flow for a merchant establishment. This data can be tracked, analyzed, and used to establish creditwor-thiness and the extent of loan limit for the establishment.
Business Model for sMe Credit: a Fine Balancing actBusiness model for SME banking requires a serious balancing act. SMEs are high risk, and the business model needs to provide for sufficient risk oversight. But their borrowing is smaller in ticket size. Operating costs for SME credit can be prohibitive with SMEs credit requiring the same dedicated attention and monitoring as large corporate credit. Further, it is found that personal banking business of SME clients (owners / propri-etors) is substantial, and critical to create a profitable SME business portfolio. The busi-
ness model design has to manage this com-plex interplay between operating costs, cost of bad debt, and cross–selling efficiency. Banks which do not get this interplay right risk having one of the vectors misaligned, leading to an unviable franchise.
Fully decentralized model:1. Traditionally, the model for SME has been fully decentral-ized. Branches are expected to be mini banks in themselves, and do all types of business. The branch manager is expected to lend up to his / her delegated limit, and seek approvals for higher amounts. The credit evaluation and subsequent monitor-ing are supposed to take place at the branch level where the customer relation-ship resides. This approach has obvious advantages in the form of credit sanction-ing and monitoring happening close to the customer. In an ideal context, this should lead to high–quality risk management and cross–selling. In practice, though, many banks have found it difficult. Branches do not have sufficient credit expertise. They tend to make mistakes or overlook impor-tant signals under client–relationship pressures, or anxiety to meet targets. They also do not make good–quality credit memoranda due to poor skills, believing that the same will be reviewed by senior authorities in any case.
Fully centralized model: The other extreme model tries to address the lack of credit skills in branches by fully centralizing the credit assessment and monitoring of SME credit at back–office credit centers. Branches are expected to source leads and send applications for sanction to the back–office center. The loan is parked in a branch, and the branch is expected to maintain relationship and cross–sell to the customer. Such a model has obvious advantages in terms of concentration of credit skills, with an expectation that it would lead to better credit decisions and monitoring. However, the model faces practical issues on the ground. Branches feel a lack of control over the process due to hand–off to the back office. More importantly, they feel a certain lack of confidence in facing the customer due to poor technical knowledge. This hampers

34 | Consistency, Quality, and Resilience
the quality of their conversations and cross–selling. The customer would rather talk directly to the central credit team to clarify / discuss as credit matters are rarely straightforward. If the central team is difficult to reach, good customers are unlikely to stick around.
A destination model that is some way away:2. A model to which advanced economies have gradually migrated is one where branches retain the power to sanction credit based on a powerful statistically valid scoring system. Branches can take quick decisions based on scoring system, and therefore all the branches can be fully leveraged to generate business. A central credit team maintains and updates the scoring system. The central team also monitors the credit closely while the branches manage relationships and cross–sell other products. Statistically valid scoring systems are a prerequisite for this approach.
An intermediate hybrid model:3. A viable model in the interim is to have branches serving as primary vehicles of relation-ship and cross–selling, with acquisition of new customers and credit monitoring to be done by a credit trained, outbound sales force that is centrally managed and mentored by a competent credit authority in the SME business unit. The sales force is physically stationed in high SME potential branches.
Asset–based finance model:4. Financing productive assets (construction equip-ment, commercial vehicle, etc.), with the option of repossessing them in the event of default, is a successful model espoused by non–bank finance companies across the world, and also in India. In India, some banks are also successfully deploy-ing this model to create a very profitable SME business. Given the prevailing challenges in availability of financials of SMEs and difficulties in enforcing collat-
Sources: FIBAC Productivity Survey 2011; FIBAC Productivity Survey 2013; BCG analysis.Note: data of 1 Private (New), 1 Private (Old) and 5 PSU (Medium) banks excluded from the analysis because of data consistency issues or data unavailability; The total staff includes the staff of captive subsidiary company as well as the outsourced staff.1Credit and risk staff includes credit and risk staff at head–office, regional offices, processing centers (retail and SME) and at branches.2Gross NPA (%) calculated for the period FY 2010–11 to FY 2012–13.
Exhibit 3.6 | Building Foundations of Bank’s Credit Expertise
Number and location of credit and risk staff vs. gross NPA experience
0
10
20
30
0
2
4
6
Credit and risk staff1 / total staff (%) Gross NPA (%)
30 29 28 27 26 25 24 23 22 21 20 19 18 17 16 15 14 13 12 11 10 9 8 7 6 5 4 3 2 1 Banks
Credit and risk staff in branches / total staff (%) Credit and risk staff in HO, RO and processing centres / total staff (%) Overall gross NPA (%)2

The Boston Consulting Group • FiCCi • iBA | 35
eral, this model breaks the compromise. However, experience has not been uniform. The model requires specialized expertise in the form of repossession of equipment, disposal of repossessed equip-ment, and direct feet–on–street–based customer acquisition and collections (which are often in cash). In a bank, this business has to be run as an independent vertical within the SME unit to ensure the key tenants of this business model are kept intact and not diluted.
Pulling it all together: Creating the Right Credit CultureLending is often considered synonymous with banking. Credit management is a core skill for banks. The recent banking crisis in the West has highlighted the perils of overde-pendence on statistical models, external rat-ing agencies, external guarantee providers, as well as the danger of overspecialization of risk function wherein line staff start to feel less responsible for bad debt. Even as Indian banks adopt advanced approaches, it is criti-cal for them to embrace a balanced model that nurtures the right credit culture of the bank and creates right foundations for own-ership and responsibility. The element of judgment and intuition in credit has to be re-tained and nurtured, and not jettisoned for black–box models. Such skills come with careful training and personal mentorship of credit specialists.
Exhibit 3.6 depicts the proportion of total staff time that is spent on credit in various banks. It ranges from close to three percent of total effective FTE to almost 30 percent. This is a massive range. Banks that have a high proportion of staff involved in credit be-lieve in the generalist paradigm, i.e. credit powers should lie with all bankers in impor-tant positions. This is helpful in ensuring ownership. Banks that have multilayered credit processes, where the file moves through multiple hands, end up involving even more people in the credit process. As the chart shows, bad debt management is not any better in cases where a lot of people are involved in credit. It is actually marginal-ly worse. Perhaps because quality time spent per person is actually less, the depth of ex-
pertise is low, and multiple hand–offs reduce the level of responsibility that any one per-son feels.
The other important question is the location of credit staff. Exhibit 3.6 shows the percent-age of credit staff working in branches (dark green portion in the bars) versus those in centralized locations like administrative of-fices and back–office processing centers (light green portion). A significant variation is evident from the exhibit. While some banks have almost entire credit staff central-ized in a few places, others have them decen-tralized in branches. Centralization leads to better mentorship due to co–location of ex-perts with apprentices. Decentralization al-lows credit managers to know customers bet-ter—a critical factor in SME lending.
Depending upon the line of business, the model should be carefully designed. Retail, SME and corporate lending require different models. Banks need to answer the following set of questions:
How many employees are involved in •credit? Is there responsible ownership at each level or is it just one more proce-dural step in the chain?
How are the skills being developed? How •much through structured instruction? How much through mentorship and on–the–job apprenticeship?
Do employees take full ownership of •statistical models, or is there a reliance on external agencies for creation and updating of models?
Does the bank rely too much on external •advice, and comfort itself in the form of ratings and guarantees?
Does the credit process ensure rich •appreciation and knowledge of the customer, or does it take the decision away from customer?
Does the credit process scuttle intuition •and personal judgment, or does it allow the same in meaningful ways to inform the judgment?
36 | Consistency, Quality, and Resilience
Pricing: the white Knight of Commercial BankingBCG experience has shown that disciplined pricing can lead to a 15 percent to 20 percent jump in the revenues for a bank’s commercial credit portfolio. This is a powerful lever in en-suring a profitable commercial lending fran-chise and is often grossly under–leveraged. The common reasons for under–pricing that need to be challenged are explained below:
Risk–based pricing:1. In India, many credit segments operate at one price for all. There is no explicit linkage of price to risk assessment. BCG experience has shown a ten percent to 15 percent uptick in rev-enue on the portfolio by following a more disciplined approach to pricing.
Marginal cost pricing:2. Since costs are typically fixed, banks focus on incremental revenue to defray them. If incremental revenues cover only marginal cost, banks, over time, accumulate a number of clients who do not meet margin thresholds. In a bank, BCG found 17 percent of clients unprofitable on a variable basis, and an additional 15 percent unprofitable on a full–cost basis.
Absence of deliberate de–averaging:3. Whole-sale contracts allow individual clients to be priced according to the competitive inten-sity and the bargaining power both parties have in the situation. Yet, we found that a majority of the firms still do not robustly segment customers (for example, based on size, stickiness and bargaining power). We found several instances where the smaller clients paid lower prices than larger ones. Similarly, we observed practices such as lower prices for “price insensitive” seg-ments, and flat fees for growth segments.
Bundling gone awry:4. Bundled pricing tends to help cross–sell more products. But when it is structured poorly, the provider can lose out substantially. The scenario can go like this: the client starts negotiating on prices; the provider agrees to lower prices if the customer buys another product; the customer agrees, so the bank lowers prices. So far so good. But what if the customer suddenly stops buying the additional
product? The profitable product exits but the subsidized one stays.
One way street on volume discounts: 5. Simi-larly, volumes may decline over time while the pricing structure remains the same. Either the original pricing was not “tiered” to volume ranges, or the bank does not effectively track volume changes. In the sample of banks that we observed, we consistently found almost zero (actual R square1 of 0.01) correlation between price and volume.
Omitted charges:6. In industries with recur-ring revenue streams, it is common to see service creep. As much as 50 percent of revenue can be lost due to “leakage” (not billing for services rendered) and “slip-page” (not charging for certain services appearing in the fee schedule).
Dated service charges:7. BCG has often found in its client work that almost 20 percent of client contracts were over ten years old. Just on an inflation–adjusted basis, the service charges should have gone up significantly over time. It is not built into the contract.
Adverse sales incentives:8. In pursuit of market share, sales incentives often reward revenue growth or retention. In the absence of pricing criteria, this can create an adverse incentive to actually lower prices (and therefore margin) to get more revenue. Right pricing discipline will ensure custom-ers are charged according to their risk profile and in line with service levels. Any attrition of customers subsequent to introduction of such disciplined pricing is more than offset by the uptick in revenues from the remaining portfolio. Typically, the most attractive customers get right price and stick around with the bank.
tough love: smarter way to RestructureOver last two years, banks have supported corporates with massive restructuring of debt. At almost seven percent of advances, this is an unprecedented helping hand. Banks should go out and support the indus-

The Boston Consulting Group • FiCCi • iBA | 37
Exhibit 3.7 | Tough Love—Smarter Way to RestructureCritical capabilities needed to ensure turnaround of restructured assests
Source: BCG analysis.
try through temporary crises. This is a role expected of banks and it has an overall posi-tive impact on the economy as it keeps the factories humming and wages flowing. The underlying assumption here is that the re-structuring has been done with sufficient due diligence so that the units are indeed vi-able and going through only a temporary downturn, and that their promoters will do what they are promising. This is where we have a gap in our system. Banks need to adopt the “tough love” approach.
Banks need to develop systems and capabili-ties in two specific areas. First is strategic due diligence of restructuring applicants’ business plan, and second is a mechanism to maintain oversight of the restructured busi-ness. Corporte Debt Restructuring (CDR) and bilateral mechanisms restructure the debt under certain conditions and assumptions re-garding business growth, profitability, market share, product quality, cost efficiency, etc. Banks need to have more robust technical ex-pertise to do a more thorough pressure test-ing of business assumptions, and should
benchmark it to other players in the industry. Whether a unit would be resurrected is criti-cally dependent upon promoter actions and they need to be enforced through appropri-ate restructuring package oversight mecha-nism, covenants, and corporate governance.
An example is the U.S. government’s restruc-turing aid to the U.S. auto giant General Mo-tors (GM). The substantial infusion of funds was based on a thorough due diligence of vi-ability of the business and identification of action points. This due diligence focused on benchmarking GM business with healthier competitors, and identifying an action agen-da with regard to product portfolio, cost re-duction, distribution set–up and productivity. The emphasis of due diligence was to ascer-tain a whole range of hard decisions and tough management initiatives that were real-ly critical to turn around the company. This systematic approach ensured that GM fol-lowed through in earnest on the tough man-agement actions to receive the support. Ex-hibit 3.7 depicts two critical capability gaps in current Indian banks’ approach to restruc-
Strategic due diligence to ascertain viability and establish action agenda /
tough management decisions
Oversight of restructuring package implementation / ensuring follow through
on management end operational turnaround
Product portfolio gaps vs. the projected market demand Distribution network productivity vs. competition Product quality benchmarking and identification of action points Pressure testing of projections on market share and margins Operations benchmarking vs. competition • Wages • Economies of scale • Manufacturing flexibility in the plant
Management capability audit / reshuffle needed
Corporate governance / board restructuring needed
Monitoring of management action plan • Milestones agreed in roadmap • Especial emphasis on tough decisions
– Cost reduction – Product / brand rationalization etc.
Oversight mechanism • Board positions, reporting
Specialist 3rd party support • Over see and report compliance
Align promoter interests • Promoter contribution / sacrifice • Explore asset sell opportunities • Unlock capital / release cash in a structure
manner • Sale of subsidiaries, unrelated investments,
brands
1
2
3
4
5
6
7

38 | Consistency, Quality, and Resilience
Source: BCG analysis.
Exhibit 3.8 | Due to Economic Downturn, More Distressed Corporations Sliding Into ‘Liquidity crisis’, Increasing Need for Turnaround WorkBanks should trigger restructuring before clients ask for it
turing of assets. Alongwith the ‘love’ in form of banks’ sacrifice to support and follow through on restructuring, there should be a ‘tough’ stance to force and follow through on tough decisions.
Restructuring of bank credit is needed when the corporate entity has gone to an advanced stage of stress. As depicted in Exhibit 3.8, a corporate entity goes through a strategy cri-sis followed by a profit crisis before entering liquidity crisis when financial restructuring is required. Vigilent banks should insist on a profit improvement exercise and operational turnaround program to be taken up by the management team at that stage. This restruc-turing would be without sacrifice for banks. Banks need to develop internal expertise and
partnerships to be able to follow through on these early stage actions. Their monitoring systems should trigger demands on their cor-porate clients for profit improvement or op-erational improvement programmes.
Note:1. R square refers to the co–efficient of determination
Vis
ibili
ty o
f the
cri
sis
Low
High
Urgency of taking counter measures
Strategy crisis
• Drop in revenue, profitability • Plan goals “at risk” or missed • Generally still cash flow positive • Pressing need for action
recognized in / out of company
• Decline in competitive advantage • Lack of capabilities
required for success
• Impending inability to fund business—likely “burning cash” • Debt overload relative to cash
generation ability • Impending refinancing "hurdle"
Liquidity crisis
Bankruptcy
Profit crisis
Operational transformation
Turnaround Crisis management or bankruptcy
Profit improvement
High Low
Type of intervention needed:
Transition from Profit to Liquidity crisis can happen rapidly, often precipitated by an outside event beyond company's control
(e.g., inability to refinance debt obligations)

The Boston Consulting Group • FiCCi • iBA | 39
BRanCHes oF tHe FutuRe
“Be sure you have put your feet in the right place…then stand firm”
— Abraham Lincoln
Branches are a strategic asset for banks. While digital channels indeed
complement branches, so far all prophecies predicting complete cannibalization of branches by digital channels have not come true. In fact, the FIBAC 2012 study found that branches continue to be crucial for banks. At a basic level, a physical presence gives the customer the psychological comfort of security of his / her savings. At a more nuanced level, BCG research for FIBAC 2012 found that banks which had customers visiting their branches, were more likely to have customer advocacy. Nonetheless, the branches in India have not kept pace with the change in customer needs and rapidly evolving technology capabilities. By and large, they continue to provide a cluttered interface to the customer. The common tendency is to take a standard format and try to customize it for new requirements – be it rural branches or GenY branches. This is rather suboptimal. A paradigm shift is needed to ensure that branches stay profit-able as massive number of very different customers get banked over the next few years in different locations with different needs. Hence, banks need to design the future branches keeping the target audience in mind.
a Possible trinity: Coverage, Clutter and Client sourcing
Over the last decade, the Indian banking sec-tor has witnessed a step change in the growth rate of branches, and emerged from the era of its own so called Hindu rate of growth. While the banking industry1 added around 590 branches (growth of approximately 1.1 per-cent) in FY 2002–03, it added another 6,800 branches (growth of approximately 8.9 per-cent) in FY 2011–12. This is testament to the fact that banks rightfully see branches as a core channel for extending banking services in a customer–centric manner. Further, given the low penetration level of branches in India (refer Exhibit 4.1)—India has approximately only 71 branches per million people2, com-pared to 110 for Brazil3 and 150 for China4—the acceleration in branch footprint expan-sion is a welcome improvement.
As seen from Exhibit 4.1, rural India accounts for approximately 60 percent of India’s popu-lation, but is facing an acute shortage of branches—only around 36 branches per mil-lion people, as against a national average of around 70.5. This statistic is bound to im-prove since Indian banks, under the guidance of the RBI, have been doing a commendable job of accelerating branch growth in rural ar-eas (as shown in Exhibit 1.3). Approximately 30 percent of the new branches opened in FY 2011–12 and 41 percent of the new branches

40 | Consistency, Quality, and Resilience
Sources: rBI; Census 2001; Census 2011; World Bank; IBA; FIBAC Productivity Survey 2013; BCG analysis.1For US, data for FY 2010–11. Only commercial banks have been included.2For China, data for FY 2008–09. Post–offices and rural financial institutions have been included because post–offices and rural financial institutions are allowed to do banking in China.3For Brazil, data for FY 2010–11. Post–offices have not been included.4For India, data for FY 2012–13. Only scheduled commercial banks have been included for India. Co–operative banks and regional rural banks have not been considered. Population CAGr assumed to be similar to 2001 to 2011 growth in metro, urban, semi–urban and rural.
Exhibit 4.1 | India Under–Penetrated in Terms of Number of Branches Per Million Population
opened in FY 2012–13 were in rural centers5. All banking segments—private and public—opened a significant percentage of their branches in rural centers. The FIBAC 2013 survey found that new private banks and PSU large—and PSU medium–size banks opened over 40 percent of their new branch-es in rural centers (refer Exhibit 4.2). If the Indian banking sector adds another 70,000 branches in the next seven years and 25 per-cent of these new branches are located in ru-ral unbanked centers (as currently mandated by RBI) and assuming that some branches in under–banked districts are also in rural cen-ters, in FY 2019–20, it is conceivable that the national average density of branches in FY 2019–20 will be close to Brazil’s current den-sity. Density of branches in metro centers may start touching 200 per million people, rural density could be as high as today’s na-tional average of 70 and urban and semi–ur-ban centers may have branch density of 120–150 per million people.
If we shift our focus from growth to produc-tivity, a major challenge facing the Indian banking sector becomes evident. Data from
the FIBAC 2013 and 2011 surveys show that branch productivity—measured in terms of number of savings accounts opened per met-ro and urban branch—has remained stagnant (refer Exhibit 4.3) for the industry as a whole.
While the new private sector banks have been able to improve their branch produc-tivity by seven percent per annum over the last two fiscal years, for the industry as a whole the total number of savings accounts opened per (MU)6 branch per annum has barely moved—from 1,076 in FY 2010–11 to 1,089 in FY 2012–13.
Further, despite growth in branches and in-creasing adoption of alternate channels, the number of cash transactions per branch per day has increased in FY 2012–13 over FY 2010–11 (refer Exhibit 4.4). This is another alarming sign that branches continue to be used as transaction hubs instead of sales and service centers.
Overall, low productivity and intense trans-action focus are serious causes of concern for the sector.
Number of branches per million population (FY 2012-13)
Percentage of India’s total
population 8.1% 14.5% 17.2% 60.2%
36
116
173
71
110
150
290
Rural Semi–urban Urban Metro
India4 average
U.S.1 average
Brazil3 average
China2 average
106

The Boston Consulting Group • FiCCi • iBA | 41
Sources: IBA; FIBAC Productivity Survey 2013; BCG analysis.Note: data of 4 PSU (Medium) banks excluded from the analysis because of data consistency issues or data unavailability.1data for FY 2012–13. 2Increase in FY 2012–13 over FY 2011–12.
Exhibit 4.2| Indian Banking Appropriately Focussed on Under Penetrated Areas
Sources: FIBAC Productivity Survey 2011; FIBAC Productivity Survey 2013; BCG analysis.Note: data of 3 PSU (Medium) banks excluded from the analysis because of data consistency issues or data unavailability.
Exhibit 4.3 | Branch Productivity as a Sales Engine Helps Stayed StagnantMassive range between the best and worst in each of the four categories of banks
Break–up of new branches opened (%)
34 30 47 32
1416
1312
10 14 14
Rural
Semi– urban
Urban
Metro
42 34 40 41
9% 6% 11% 18%
30,773 36,412 4,571 8,965 Total branches1
Overall increase2
5
PSU (Medium)
PSU(Large)
Private (Old)
Private (New)
PSU (Large)
Private (Old)
PSU (Medium)
Private (New)
Industry average FY 2012-13 Industry average FY 2010-11
1,352
8831,224
879
1,881
1,331
1,554
1,868
1,831
8651,009
831
287
705544
1,076 1,089
Average in FY 2012-13 Average in FY 2010-11 Low Median High
933
1,185
886 817
1,594
Number of savings bank accounts opened per metro and urban branch
Marginal increase over
FY 2010-11

42 | Consistency, Quality, and Resilience
Geoanalytics: next Generation Footprint and location PlanningGoing forward with rising branch density in metro and urban centers, location of branch will disproportionately impact its productiv-ity. Technology has to supplement judgment in determining location and footprint in a major way. Geoanalytics has come of age and the technology is ready to be deployed in India.
If the Indian banking sector adds 7,000 to 10,000 branches annually over the next sev-en years, and assuming 75 percent of these are in semi–urban and rural centers, we ex-pect the sector as a whole to spend over Rs. 10,000 crore (almost $2 billion) for branch build–out. Since a significant capital is at stake, it is imperative for banks to get the highest efficiency out of branches to ensure healthy return on capital.
Several aspirants for the new banking licens-es have existing physical footprint. If a sig-nificant proportion of the existing footprint gets converted into branches, the intensity of competition for existing as well as new branches of current banks will dramatically rise.
On 3 April 1984, when the then prime minis-ter of India, Mrs. Indira Gandhi, asked astro-naut Rakesh Sharma how India looked from space, his response was “Saare Jahan Se Ach-cha Hindustan Hamara”. With today’s Geoana-lytics capabilities, one can say a lot more about Indian topography without leaving the room. For example, it is possible for banks to pinpoint which exact location is best suited for opening a branch or an ATM by analyzing the population density, economic potential, competitors’ branches / ATMs and geographi-cal proximity to economic hot spots (upcom-ing areas like residential hubs, business cen-ters etc). As shown in Exhibit 4.5, proprietary tools can be used to visually map precise lo-cations for new branches, as well as to opti-mize existing footprint by relocating branch-es. The main power of Geoanalytics is that the tools can allow overlaying detailed geo-graphical information like road distance, com-mute time with demographics data to identi-fy optimal branch network.
the Five star Branch Concept: Roadmap to sales excellenceThe FIBAC 2013 survey reveals that branch resources are still spending inordinate
Source: FIBAC Productivity Survey 2011; FIBAC Productivity Survey 2013; BCG analysis.Note: data of 2 Private (New), 2 Private (Old), 1 PSU (Large) and 13 PSU (Medium) banks excluded from the analysis because of data consistency issues or data unavailability; A year is assumed to have 300 working days; y–o–y: Year on year.
Exhibit 4.4 | The Clutter in the Branches is RisingNumber of cash transactions per day per branch has gone up for all four categories of banks
127 118
Number of cash transactions per day per branch
15787 9489
142
83 93 96
117
87
59
1008289
103
147
224
103
1734
PSU (Large)
Private (Old)
PSU (Medium)
Private (New)
Industry average FY 2012-13 Industry average FY 2010-11
Average in FY 2012-13 High Median Low Average in FY 2010-11
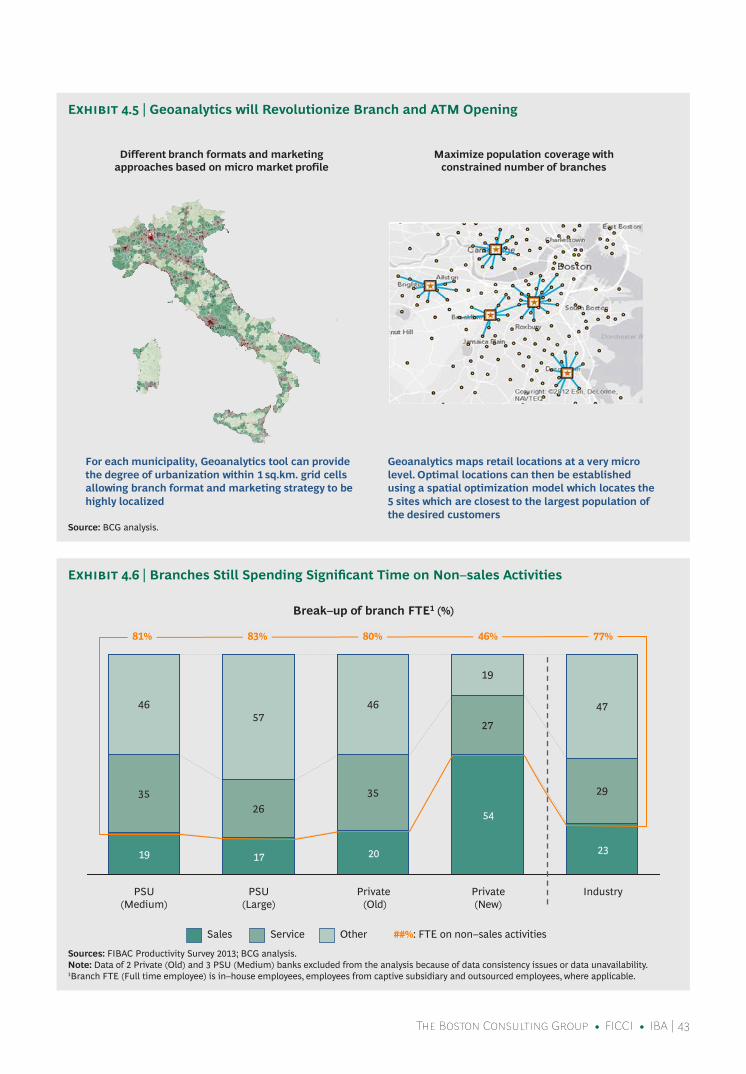
The Boston Consulting Group • FiCCi • iBA | 43
Source: BCG analysis.
Exhibit 4.5 | Geoanalytics will Revolutionize Branch and ATM Opening
Exhibit 4.6 | Branches Still Spending Significant Time on Non–sales Activities
Sources: FIBAC Productivity Survey 2013; BCG analysis.Note: data of 2 Private (Old) and 3 PSU (Medium) banks excluded from the analysis because of data consistency issues or data unavailability.1Branch FTE (Full time employee) is in–house employees, employees from captive subsidiary and outsourced employees, where applicable.
Different branch formats and marketing approaches based on micro market profile
Maximize population coverage with constrained number of branches
For each municipality, Geoanalytics tool can provide the degree of urbanization within 1 sq.km. grid cells allowing branch format and marketing strategy to be highly localized
Geoanalytics maps retail locations at a very micro level. Optimal locations can then be established using a spatial optimization model which locates the 5 sites which are closest to the largest population of the desired customers
Break–up of branch FTE1 (%)
3526
35
27
29
4657
46
19
47
Private (Old)
Private (New)
PSU (Large)
20 23
PSU (Medium)
54
Industry
17 19
##%: FTE on non–sales activities Sales Service Other
83% 80% 46% 77% 81%

44 | Consistency, Quality, and Resilience
amounts of time (around 77 percent at in-dustry level) in service and back–office activ-ities (refer Exhibit 4.6). To a large extent, this is because bank branches in India have not leveraged the dramatic improvements enabled by changes in technology. The last wave of fundamental change in branches’ operations was during the Core Banking roll-out in the early part of the last decade, where several manual processes were auto-mated and workload at the branches was dramatically reduced. Considering the subse-quent advances in technology around self–service, workflow automation, image pro-cessing, and potentially eKYC, it is time for Indian banks to dramatically transform their branches.
Some banks have undertaken branch trans-formation initiatives over the last two years. These initiatives have not yet resulted in marked improvement in business productiv-ity (refer Exhibits 4.3 and 4.4). One needs to be extremely wary of superficial changes that put form above function and do not fundamentally change the operations of the branches.
We have found that real transformation of branches is hampered by five typical issues:
Low levels of self–service—self–service is •not optional, it’s mandatory
Inefficient branch workflow / single •window—not just new counters but a dramatic reduction in touch points and TAT
No systematic operating rhythm and role •clarity—not just about reducing mun-dane work at branches, but fundamen-tally recasting the branch roles and rhythm to orient toward sales
Inefficient branch layout / format—not •just good looking but functional layout
Poorly defined branch business metrics— •simple, sharp and incessant focus on business
For banks to be able to fundamentally trans-form their branches into sales engines, a sys-tematic five star approach is required. This is depicted in Exhibit 4.7. Each star stands for one of self service / technology enablement, single window, structured operating and sales rhythm, smart format and sharp branch business metrics. Branch that excels on all five is called a five star branch. In
Source: BCG analysis.
Exhibit 4.7 | Five Star Branch Model for Taking Branch Productivity to the Next Frontier
SELF SERVICE/ TECHNOLOGY ENABLEMENT
SMART FORMAT
STRUCTURED OPERATING
RHYTHM AND SALES PROCESS
SINGLE WINDOW SHARP
BRANCH BUSINESS METRICS

The Boston Consulting Group • FiCCi • iBA | 45
Source: BCG case experience.Note: Txs: Transactions; CASA: Current account and savings bank account; Td: Term deposits; CdM: Cash deposit machine; ChdM: Cheque deposit machine; POS: Point of sales; PUM: Passbook updation machine; QMS: Queue management system.
Exhibit 4.8 | Self Service Technology Can Reduce Branch Transaction Footfalls by 30–40%Higher customer service, faster turnaround time, less paper, fewer errors
BCG case experience, five star branches have shown a much higher and sustainable uplift in sales productivity.
1. SELF–SERVICE AND WORKFLOW TECH-NOLOGY ENABLEMENT: PUTTING BRANCHES IN THE ‘E’ MODE.As a first step toward de–cluttering branches, it is important to allow customers to under-take basic transactions in a self–service mod-el. Basic transactions such as cash deposit, passbook updation and cheque deposit ac-count for a very large proportion of branch transactions. By using self–service machines like Bulk Note Acceptors (BNAs), pass book updation kiosk and cheque deposit machines
/ truncation, a significant proportion of the branch transaction load can be eliminated. BCG experience suggests a 30–40 percent re-duction in footfall is possible in a typical met-ro branch through self–service enablement. This is depicted in Exhibit 4.8.
Moreover, as depicted in Exhibit 4.9, the FIBAC 2013 survey found that the banks which have higher levels of self service en-ablement in their branches have significant-ly lower proportion of non–sales staff in the branches.
However, blind enablement is not the solution. The IT architecture facilitating the interface
Credit activities
5–6
Other routine
3–4
High value cash txs
CASA, TD, 3rd party products sale / closure
5–10
20–30
15–20
Fund transfers
Low value cash txs
40–45
Typical profile of a Metro
branch (Number of
daily walk–ins indexed to 100)
ATM ChDM PUM CDMx2
Reduce transaction time (avoid rework /
sign) and paper
Reduce branch traffic by 30–40%
POS based routine transactions
Route all non–cash, non–credit
transactions via QMS
Reduce clutter, improve customer
experience
Sanitized case experience

46 | Consistency, Quality, and Resilience
Source: FIBAC Productivity Survey 2013; BCG analysis.Note: data of 1 Private (New), 3 Private (Old), 1 PSU (Large) and 12 PSU (Medium) banks excluded from the analysis because of data consistency issues or data unavailability; FTE: Full time employee.1Extent of new channel coverage=(Number of ATMs + Number of cash deposit machines + Number of cheque deposit machine + Number of passbook printers) / Branch.
Exhibit 4.9 | Greater Coverage of Self Service Channels Per Branch Translates Into Less Time Spent on Non–sales Activities
with the core banking system, as well as the ease of use of the machines, is crucial to ascer-tain. The added benefit of self–service is that the customers can access the machines 24x7.
Routine transactions, such as CASA account opening and third–party sales, can be made electronic by the use of smart work–flow technologies enabled by smart POS termi-nals. Adopting these technologies requires fundamental reworking of the work–flows. These technologies, if implemented correct-ly, can dramatically improve customer expe-rience, employee satisfaction and branch productivity, making it a win–win proposi-tion (Refer call out on “Peek into the future” at end of the chapter for more details).
2. CORRECTING THE MYTHS: GETTING TRUE PRODUCTIVITY GAIN OUT OF SIN-GLE WINDOWSingle window is one of the most misunder-stood concepts in Indian banking. The FIBAC 2013 survey found that genuine sin-gle–window enablement is still a distant
dream—while many banks claim some level of single–window enablement, the benefits are not visible. The common understanding is that single window means getting coun-ters to do more than one type of transaction. It is easier said than done.
Real single–window enablement requires banks to strike the right balance between generalizing the majority of counters to smoothen out workload versus retaining a few specialized counters to cater to unique branch needs (such as huge intersol fund transfers). Further, for banks with maker / checker transactions, it is imperative that the maker / checker are thoughtfully located to ensure genuine single touch point for cus-tomers. Finally, the right MIS using the Queue Management System (QMS) is crucial for regular monitoring to ensure bottlenecks are identified early and eliminated.
We have found that a dramatic reduction in turnaround time, increase in customer / em-ployee satisfaction and branch productivity
Non–sales FTE in branches as a percentage of total staff vs. extent of new channel coverage in branches
100%
4
75%
50%
25%
0% 3 2 1 0
Extent of new channel coverage in branches1
PSU (Medium) PSU (Large) Private (Old) Private (New)
R square ~ 76% High correlation between extent of new channel coverage in branches and time
spent on non–sales activities
Percentage of non–sales FTE in branches

The Boston Consulting Group • FiCCi • iBA | 47
Sources: FIBAC Productivity Survey 2013; BCG analysis.Note: data of 1 Private (Old) and 4 PSU (Medium) banks excluded from the analysis because of data consistency issues or data unavailability; mid–point of the range of values submitted by the banks has been considered for analysis 1–5 meetings/branch/month has been converted to 3 meetings/branch/month; 6–10 meetings/branch/month has been converted to 8 meetings/branch/month; 11–15 meetings/branch/month has been converted to 13 meetings/branch/month; >15 meetings/branch/month has been converted to 18 meetings/branch/month.
Exhibit 4.10 | Creating Sales Culture in Branches
are possible if banks implement single win-dow with the right rigor and thought.
3. STRUCTURED OPERATING RHYTHM AND ROLE CLARITYAs a first step towards improving branch productivity, the reporting structure and roles in branches need to be fundamentally recast to ensure that resources in the right numbers—and with the right skills—are de-ployed in the right activities. And also, for the five star branch banking to become the norm, setting in place a structured operating rhythm is crucial.
A structured operating rhythm refers to a format and frequency of conducting branch reviews to ensure the branch leadership is able to identify challenges and opportunities early on to make timely interventions. We have found that branches with better oper-ating rhythm have happier employees with enhanced knowledge about banking and sharper customer focus. The FIBAC 2013 survey found that there is a massive gap be-tween the frequency of structured branch meetings between private new banks and other banks. As depicted in Exhibit 4.10,
new private banks have, on an average, 13 structured branch meetings per month, as compared to the industry average of five.
4. SMART FORMAT: BRANCH IN A BOXSmart format involves two principles: (a) the overall layout of the branch has to ensure optimal customer pathways for navigating and interacting with the branch, and (b) hav-ing the right format based on the business potential of the catchment area.
In terms of optimal customer pathways, it is crucial to create a layout where the custom-er is able to easily navigate to the right desti-nation, has appropriate visibility of impor-tant information– marketing material or statutory information—and has to traverse minimum distance / minimum touch points to fulfill his / her requirement. Achieving this requires scientifically locating various elements of the branch infrastructure, such as counters, printers, QMS machines, self service kiosks, marketing signage, etc.
As far as the right format pertaining to catch-ment potential is concerned, it is important to define different branch formats based on
Frequency of average structured branch staff meetings per month per branch
5
PSU (Medium)
PSU (Large)
4 5
Private (Old)
3
Private (New)
Industry average FY 2012-13
13

48 | Consistency, Quality, and Resilience
Source: BCG case experience.
Exhibit 4.11| Smart Format: Graduate to Need Based FormatsNeed to scientifically define branch formats based on customer segments and needs
catchment business potential. Specifically for rural areas, Indian banks cannot try to import the urban / metro branch layout by trying to downsize it to reduce cost. A fundamentally different branch format needs to be envi-sioned keeping in mind the rural customers’ requirements and economics of serving the rural populace. An illustrative list of choices for branch formats is depicted in Exhibit 4.11.
Banks need to break up a branch into sever-al modules and define heuristics for usage of appropriate modules in the right location. Modular design makes it possible to stan-dardize branches, accelerate branch build out, centrally manufacture units and eventu-ally reduce branch break–even point and payback period while improving customer experience. It is not too difficult to imagine a branch getting assembled from modular-ized components in almost a Lego block like fashion—some progressive banks are al-ready moving to this concept.
5. SIMPLE, SHARP AND SHARED BRANCH BUSINESS METRICSHaving the right set of branch metrics is the cornerstone of a productive branch. Howev-er, it is imperative to not confuse the branch with too many or too complex metrics. We have often seen that banks either do not give branches a well–defined set of metrics or err on the side of giving too many (as high as 60 to 90) metrics which the branches cannot operate with.
It is important to ensure that a simple, sharp and shared vocabulary around branch per-formance is created and adhered to through the structured operating rhythm to drive productivity.
Going back to the Abraham Lincoln quote, the time is now for Indian banks to define their branch network footprint carefully, and then optimize productivity to create “branches of the future”.
Full function branch 2
• Standard and integrated network
• Fully–featured
Common branch 3
• Medium–sized in community
• Sales / advisory and transaction
Convenient branch 4
• Convenience • Focus on
transaction services, including self and semi–self
Wealth management center 5
• High–end and professional
• High–end facilities and senior advisor
SME center 6
• Services to small enterprises
• Settlement and credit
Rural branch 7
• Clear brand indentify
• Low cost infrastructure set-up
• Small sized outlet
Flagship store 1
• Large functional concept store, leading the new ideas, processes
• Role model for other branches and branding for the public
BCG case experience

The Boston Consulting Group • FiCCi • iBA | 49
Note:1. Only scheduled commercial banks have been included for India. Co–operative banks and regional rural banks have not been considered. Population CAGR assumed to be similar to 2001 to 2011 growth in metro, urban, semi–urban and rural. 2. For India, data for FY 2012–13. 3. For Brazil, data for FY 2010–11. Post–offices have not been included.4. For China, data for FY 2008–09. Post–offices and rural financial institutions have been included because post–offices and rural financial institutions are allowed to do banking in China.
5. Data of 3 PSU (Medium) banks excluded from the analysis because of data consistency issues or data unavailability.6. M: Metro, U: Urban.
A paperless branch is no more a pipe dream. Technologies exist that can help create workflows in branches that require no paper—other than for regulatory
compulsions. At each stage of the transac-tion value chain technologies can help transact completely in the e–Mode.
PeeK iNTo The FuTure: cuSToMer exPerieNce iN 2015
Source: BCG analysis.
Approach for paperless banking
Enquiry / marketing
Account opening On boarding Service Cross sell /
up sell
• Mobile or internet based lead generation and capturing • Initiate
purchase in any channel; close purchase in any channel
• Digital displays for sharing product information (interactive screens / tablets)
• Biometrics for eKYC and capturing customer data • Data capture at
time of account opening directly on tablet. No scanning. No data entry • Fulfilment at
the point of sale—internet, mobile banking—all active as you walk out of branch • Branch is able
to do live demonstrations of all channels and features to the customer
• Smart cards (e.g. using RFID or smart chip) to identify customers in branches • Smart cards
allow branch to be aware of last customer visit, purpose of visit and status of request in real-time • Data once
updated on channel, updates all channels
• One view of customer ensures data for existing customer is automatically available with no need to fill redundant information during cross / up sell situation • Smart cards
can help capture profile of customer quickly and thus provide quality sales cues to branch staff

50 | Consistency, Quality, and Resilience
“I seem to have been like a child playing on the sea shore, finding now and then a prettier shell than ordinary, whilst the great ocean of truth lay undiscovered before me.”
— Abraham Lincoln
More employees in Indian banks are engaged in non customer–facing activi-
ties than those performing customer–facing activities. Optimization of in non customer–facing activities is, therefore, the single largest lever for banks to improve the overall produc-tivity. However, misguided Business Process Re–engineering (BPR) efforts, focused only on cost improvement and “freeing up” of the people, invariably lead to reduced customer service and increased risk. Process optimiza-tions need a new paradigm—one involving an end–to–end redesign. Start with the first customer touch point and end with immacu-late delivery of service to the customer, in a tightly controlled manner. This will require banks to collaborate across organizational silos, and to adopt new–age technology. In BCG experience, such end–to–end optimiza-tion leads to better service, lower costs and lower risks.
tooth–to–tail Ratio: aim for Four–Fold increaseExhibit 5.1 shows that the tooth–to–tail ratio for Indian banks is 0.8. The global best for this ratio is 4. Tooth being the sales and ser-
vice employees facing the customer, and tail being the non–customer–facing employees. 55 percent of banking employees are in-volved in non–customer activities, aka, oper-ations or back–office activities. This is likely an underestimate since many employees classified as sales and service are routinely involved in operational tasks such as filling forms for customers, doing data entry, col-lecting documents, delivering documents.
The best–in–class tooth–to–tail ratio requires 80 percent of employees in frontline, 10 per-cent in administrative roles (for example, HO, RO, ZO) and 10 percent in operational and credit roles. For the Indian banking sec-tor, employees in administrative roles, at 12 percent, are close to the global best–in–class.
Meanwhile, 43 percent of the employees are in other non customer–facing roles, way above the global best–in–class figure of 10 percent—the primary driver being manual and paper–based operations. A plethora of vouchers and paper–based applications result in an army of people processing information:
Redundant checks as paper crosses •organizational boundaries in the name of control and risk—efficacy of which is still to be proven
Suboptimal process designs and lack of job •aids that could help improve efficiency
CustoMeR–CentRiC and lean oPeRationNew PARAdiGm iN oPeRATioNs

The Boston Consulting Group • FiCCi • iBA | 51
High fragmentation and low standardiza- •tion in middle and back offices
As depicted in Exhibit 5.2, globally, 71 per-cent of the processes like credit document preparation and review, transaction process-ing, payments, fraud management, etc. are shared across business segments. Indian banks only share about 50 percent of pro-cesses across business segments, resulting in fragmentation, lack of standardization and duplication of efforts. As shown in Exhibit 5.3, the average size of processing center in Indian banks is 22. While most banks have a few large processing centers, the manual and paper–based nature of operations results in a proliferation of large number of small pro-cessing centers at the city level.
Banks need to adopt a five–pronged approach in order to increase the tooth–to–tail ratio.
Ensure instant customer on–boarding •and real–time resolution: Break the
compromise between cost, customer and control
Implement lean processes in a customer– •centric way
Foster collaboration and alignment across •organizational silos
Unleash full potential of technology for •operational improvement
Smart source: Outsource low value–add •activities, develop vendor partnerships
no Back office: operations Paradigm Comes Full Circle?The single most leveraged initiative is to re-duce the operational workload in branches, either by regionalizing or centralizing activi-ties. Account opening, cheque clearing, de-livery of statements / cheque book, etc. are the most common processes that undergo
Source: FIBAC Productivity Survey 2013; BCG analysis.Note: data of 2 Private (Old) and 3 PSU (Medium) banks excluded from the analysis because of data consistency issues or data unavailability; FTE: Full time employee.1Sales FTE includes branch FTE on sales and out–bound sales force.2Service includes branch FTE on service, call centre staff and internet banking staff.3hO–rO includes all personnel in head–office and regional–offices, Zonal–offices and divisional–offices.4Back–office staff includes branch based back–office FTE, staff in operational back–offices and data–centre staff.5Credit includes branch FTE on credit and staff involved in credit processes (retail and SME) in processing centres.
Exhibit 5.1 | Tooth–to–tail Ratio: India Industry Average at 0.8Well below global best–in–class benchmark of 4
Break–up of bank FTE (%)
3022 25
17
23
1111
12
13
12
1617
16
12
16
1613
11 12
1022 17 15
Industry Private (New)
Private (Old)
PSU (Large)
18 22
PSU (Medium)
46
16 16
Tooth–to– tail ratio 0.8 0.9 0.6 0.8 1.7
Global best = 4.0
Credit5 Service2 Sales1 OtherHO–RO3 Back–office4
47
Tooth to tail ratio is defined as ratio of total bank staff involved in sales and service to total bank staff involved in other activities

52 | Consistency, Quality, and Resilience
Sources: FIBAC Productivity Survey 2011; FIBAC Productivity Survey 2013; BCG retail Banking Operational Excellence Survey 2012; BCG analysis.Note: data of 2 Private (Old) and 3 PSU (Medium) banks excluded from the analysis because of data consistency issues or data unavailability.1Global best is for FY 2011–12.
Exhibit 5.2 | Room to Improve Standardization in Processes
Source: FIBAC Productivity Survey 2011; FIBAC Productivity Survey 2013; BCG analysis.Note: data of 2 Private (Old) and 3 PSU (Medium) banks excluded from the (Number of FTE / processing center) analysis because of data consistency issues or data unavailability; FTE: Full time employee.1Includes in–house FTE, captive subsidiary and outsourced FTE.2Processing centers include credit processing centers and operational back–office processing centers.
Exhibit 5.3 | Room to Improve Centralization and Standardization
Number of FTE1 per processing center2
1918
12
26
10
2220
18
36
9
PSU (Large)
PSU (Medium)
Private (Old)
Industry Private (New)
Average in FY 2010-11 Average in FY 2012-13
Marginal increase in size of back-office in FY 2012-13
over FY 2010-11
Extent of standardization in processes across customer segments (%)
35
Credit document preparation and review
51
43
46
49
54
54
62
65
68
Billing / statements, printing and mailing
Credit decisioning and underwriting
Collections
Document management, imaging
Fraud management
Payments
Customer service voice–inbound, outbound
Transaction processing
Account application, set–up and modification
Global best1 = 71

The Boston Consulting Group • FiCCi • iBA | 53
this treatment. In most cases, such initiatives have lowered the costs and delivered relief to the branches. However, customer service has suffered more often than not, and risk has not reduced, as paper moves from cus-tomer to branch to regional center to central offices and then back. This results in high turnaround times, multiple back–and–forth between banks’ offices, errors in processing, and an increase in risk through multiple manual hand–offs.
Advanced banking operating models have come a full circle—providing instant custom-er on–boarding, facilitating limited to zero middle—or back–office processing, and en-suring resolution at first point of contact. More importantly, this is happening at lower costs, and with improved controls—breaking the eternal compromise between cost, cus-tomer service and control.
Banks will have to draw up a comprehensive roadmap to design and execute the new oper-ating model. However, they could take many simple steps now, as shown in Exhibit 5.3, to initiate the model that on–boards customers instantly and provides real–time resolution at low cost, and with tighter controls. Adoption of this operating model will result in virtual elimi-nation of regional processing centers and very thin to no back–offices. The few starting steps toward new operating paradigm could be:
Tablet–driven account opening—taking •pictures at customer premises, data entry by the customer in many cases, taking scans of important documents at the spot
Potential of e–KYC and authentication •through Aadhaar
Instant kits in the branches that could be •activated once proper KYC is done
Enhanced use of scanning at the branches •to truncate paperwork
Straight–through processing enabled by •use of technology, smart rule engines, and use of credit information bureaus
Incentivizing customers to move to •self–service
new Paradigm in Process opti-mization: end–to–end and Customer–CentricTraditional BPR and lean efforts focus on finding and eliminating waste in individual departments and sub–processes. Take, for ex-ample, an initiative focused on lean account opening process. Traditional lean efforts will focus on optimizing one or a few elements at a time, for example, improving the turaround time and reducing cost for producing and de-livering personalized welcome kits after the opening of the account in Core Banking Sys-tem (CBS). Other elements typically targeted for optimization include speeding up the pro-cess of opening the account in CBS after the documentation arrives in back office, or im-proving the “First Time Right” (FTR) at the customer interface.
While such efforts do deliver some improve-ments and many departments improve their metrics, the overall process is only marginal-ly better off. Most unproductive delays, inef-ficiencies and costs are incurred when paper or process moves from one department to the next, or during hand–offs within the de-partments. A better way to lean processes is to take the “end–to–end” view—starting from the customer and ending with the de-livery of product or service to the customer. In case of the account opening process, this would mean that the workflow is mapped out—all the way from first point of contact with the customer (could be physical or vir-tual, like online) to activation of customer transactions through multiple channels. This would require bringing the people from sales, branch, middle–office processing units, central processing units, outsourced vendors (for example, data entry, courier services), compliance, on–boarding teams (for exam-ple, product specialists, call–center people) into one room, and discuss threadbare the target outcome, issues and opportunities for leaning the process. The most impactful rec-ommendations will be those that straddle organizational boundaries, for example, sales and front–office committing to capture data at the point of sale through use of tab-let or other mechanisms—thereby eliminat-ing entire functions in the back office, en-hancing accuracy, improving speed, and tightening controls.

54 | Consistency, Quality, and Resilience
The former approach to executing BPR is a customer–centric and an end–to–end lean process (as shown in Exhibit 5.4). As com-pared to the traditional lean approach, it de-livers multifold impact—best customer expe-rience, high employee engagement, high efficiency, and a culture of performance and continuous improvement.
Performance indicators: Foster-ing Collaboration across silosTake the example of the account opening process. In a typical bank with a reasonable level of centralization and sophistication, up to eight different departments are involved in the end–to–end process. This is illustrated in Exhibit 5.5.
Each department will have its own Key Perfor-mance Indicators (KPIs), and targets will be fixed for those metrics. As a simple illustration, assume that each department has turnaround time as its KPI and that the target is to achieve a 96 percent accuracy on this KPI. In other words, a given department will have to ensure that 96 percent of the applications it receives are processed within the prescribed TAT. The
best–in–class mathematical outcome of such a set–up will be multiplication of 96 percent across eight departments, or 72 percent accura-cy. Add to it the complexity derived from other metrics like KYC accuracy and cost, and it is easy to see that the designed accuracy of such a system will be even lower. Moreover, individ-ual departments regularly blame the upstream or downstream department for issues caused in their own department. Back offices com-plain that front offices send incomplete and er-roneous documents downstream. Front offices, on the other hand, complain that back offices are inflexible and return the documents for frivolous reasons to optimize back–office TATs. The overall outcome is poor customer service, finger pointing across organizational silos, and employee dissonance.
The typical organizational response to such problems is more checks, more KPIs and more departments. These would invariably be counterproductive. Instead, organizations need simpler KPIs that cut across organiza-tional boundaries, rationalization of organi-zational structure to reduce boundaries, and lean processes to reduce hand–offs. Targets, objectives and role mandates of people will
Exhibit 5.4 | Core of the Lean Program is to Drive Customer ExperienceAll other targets of secondary priority ( for example, FTE reduction, etc.)
Source: BCG analysis.
The "Lean Bank"
Best customer experience through short response time and right first time High employee engagement through involvement in shaping processes and removing bureaucracy High efficiency with simple automated processes A culture of performance and continuous improvement driven by management
Lean bank outcomes
Lean mindset
Customer experience
Clear process ownership
Measurements, analytics and KPIs
Apply Lean toolbox to all processes in business units and support functions
Embed Lean thinking in management cadre and let it be part of the DNA
Eliminate manual and unnecessary activities
through automation

The Boston Consulting Group • FiCCi • iBA | 55
have to change; new dashboards and metrics will have to be created; cooperation mecha-nisms will have to be fostered. However, co-operation cannot be decreed. It is not a mat-ter of structure, processes or systems alone. Cooperation happens only when the work context makes it individually useful for peo-ple to cooperate. By leveraging the state–of–the–art of social sciences, notably organiza-tional sociology, BCG has developed a set of “Smart Rules” to create such work contexts1 (refer Exhibit 5.6).
Improve knowledge of others: • Knowing each other’s strengths
Reinforce integrators: • Giving to manage-ment, notably field managers at the most operational levels, power and interest to make their teams cooperate
Increase total quantity of power: • This allows reconciliation of power at the center for consistency with power at the customer interface for responsiveness—breaking the compromise between centralization and decentralization
Enlarge the domain of reciprocity: • Remov-ing resources that fuel internal monopo-lies and dysfunctional self–sufficiency
Expand the shadow of the future: • Exposing people to the consequences of their actions, for example, posting them in downstream departments through rotation policy
Modify the pay–off matrix: • Reward those who cooperate and put the blame on those who don’t; creating management
Source: BCG analysis. Note: KYC: Know your customer; CBS: Core banking solution.
Exhibit 5.5 | Conventional Account Opening Process Straddles and DepartmentsHand off across department is a big source of inefficiency
Sales sources the account, gets the customer to fill the application and collects the documents
Branch operations does first level checks, completes the documentation and sends the documents to scanning hubs
Regional hubs scan the documents and do one more check
A back-offices department checks the final KYC and give a go-ahead to open the account
Data entry department opens the account in CBS
Printing and deliverables department prepares welcome kits, PINs, cards, etc.
Courier delivers the client documentation
On-boarding teams initiate contact with the customer to get them to transact in multiple channels
1
2
3
4
5
6
7
8

56 | Consistency, Quality, and Resilience
dialogues and performance criteria, that make those who do not cooperate bear the cost
Because these rules help companies deal with the new complexity of business without organizational complicatedness, BCG calls this approach “Smart Simplicity”. Every time these rules have been implemented in banks the result has been enhanced cross–function-al efficiency, with a simultaneous improve-ment in employee engagement and perfor-mance—notably operational excellence and commercial effectiveness.
low it spends in indian Banking: Pride or Prejudice?Almost all banks in India have achieved close upto 100 percent implementation of the Core Banking System (CBS). What next? Exhibit 5.7 shows the break–up of IT spend across categories. A significant 43 percent of the IT budget is spent in “maintaining” the bank and 13 percent on management of cur-rent IT infrastructure. In a growth–oriented economy like India, and in a scenario where banks have not yet fully leveraged IT, this
suggests underinvestment in developing IT capabilities of the future. In fact, as Exhibit 5.8 shows, the IT spend of about 2 percent (as a proportion of banks’ revenue) is less than a quarter of the global median. Indian banks need to triple or quadruple their non–maintenance IT spend. Mix of this invest-ment needs to shift toward projects that help optimize the operations and IT of the bank.
The current mix of top ten projects, as shown in Exhibit 5.9, suggests that only 30 percent of the new projects are targeting IT and op-erational improvements—with more than 50 percent eyeing growth (new products, chan-nels) and management reporting. This prob-ably reflects the relative weight of various or-ganizational silos in allocating the limited IT budget, with business unit—and manage-ment–led IT projects taking precedence over projects that deliver improved operations and IT capabilities. Launching new products, creating better reporting platforms and opti-mizing channels will not lead to tangible re-sults unless the operations and back–end IT capabilities are robust, scalable and up to date. In fact, banks need to build operations and IT capabilities first before launching into
Source: Y. Morieux (2011), ‘Smart rules: Six Ways to Get People to Solve Problems Without You’, harvard Business review, volume 89, n°9, September: pp78–86.
Exhibit 5.6 | Smart Rules to Enhance Cooperation, Leadership, Engagement
Expand the shadow of the future • Adjust duration • Increase frequency • Promote inversion
Improve knowledge of others • Their work, strengths • Management to recognize
performance
Reinforce integrators • Remove rules • Remove dimensions in the
matrix, delayering • Refuse escalation
Increase total quantity of power • To give all actors enough cards
to play a more collective game
Enlarge the domain of reciprocity • Set rich objectives • Cut resources • Eliminate internal monopolies
Modify the pay-off matrix • Make those who don't cooperate
bear the cost
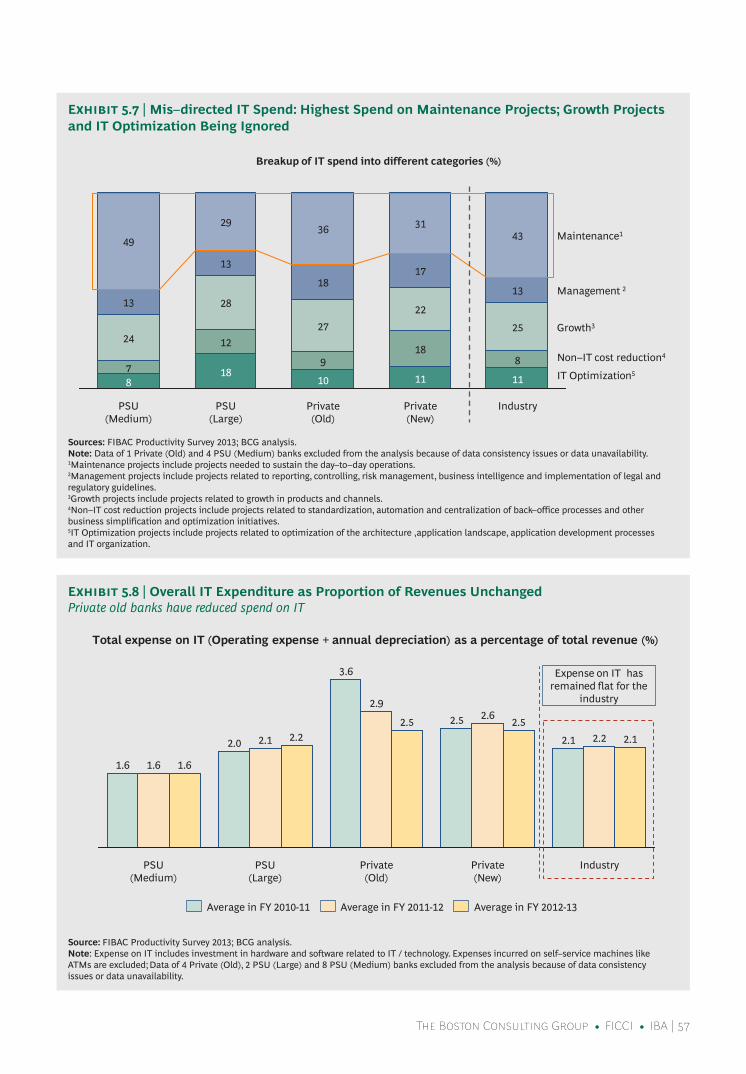
The Boston Consulting Group • FiCCi • iBA | 57
Sources: FIBAC Productivity Survey 2013; BCG analysis.Note: data of 1 Private (Old) and 4 PSU (Medium) banks excluded from the analysis because of data consistency issues or data unavailability.1Maintenance projects include projects needed to sustain the day–to–day operations.2Management projects include projects related to reporting, controlling, risk management, business intelligence and implementation of legal and regulatory guidelines.3Growth projects include projects related to growth in products and channels.4Non–IT cost reduction projects include projects related to standardization, automation and centralization of back–office processes and other business simplification and optimization initiatives.5IT Optimization projects include projects related to optimization of the architecture ,application landscape, application development processes and IT organization.
Exhibit 5.7 | Mis–directed IT Spend: Highest Spend on Maintenance Projects; Growth Projects and IT Optimization Being Ignored
Source: FIBAC Productivity Survey 2013; BCG analysis.Note: Expense on IT includes investment in hardware and software related to IT / technology. Expenses incurred on self–service machines like ATMs are excluded; data of 4 Private (Old), 2 PSU (Large) and 8 PSU (Medium) banks excluded from the analysis because of data consistency issues or data unavailability.
Exhibit 5.8 | Overall IT Expenditure as Proportion of Revenues UnchangedPrivate old banks have reduced spend on IT
Breakup of IT spend into different categories (%)
8 7
24
13
49
10
9
27
18
36
PSU (Large)
18
12
28
13
29
PSU (Medium)
Growth3
Management 2
IT Optimization5
Industry
Non–IT cost reduction4
Maintenance1
11
8
25
13
43
Private (New)
11
18
22
17
31
Private (Old)
Total expense on IT (Operating expense + annual depreciation) as a percentage of total revenue (%)
2.1
Private (New)
2.5 2.6 2.5
Private (Old)
2.5
2.9
3.6
PSU (Large)
2.2 2.1 2.2
Industry
2.1 2.0
PSU (Medium)
1.6 1.6 1.6
Average in FY 2011-12 Average in FY 2010-11 Average in FY 2012-13
Expense on IT has remained flat for the
industry

58 | Consistency, Quality, and Resilience
new front–end capabilities. Banks need to in-crease their IT budgets and rebalance the IT portfolio in order to improve the mix of proj-ects involving operational and IT capabili-ties. Design principles for efficient and adaptable IT capabilities will have many of the following elements:
One front end everywhere for assisted •customer sales and service, and for financial transactions in front office, call center and back office
Eliminate paper in the organization—only •let images / data into the organization
Integrate self–service and assisted •channels into a common core, across leads, contacts, applications, service and transactions
Enforce unique identifiers for people •(customers, staff and third parties), places (channels, branches, customer premises)
and things (accounts, products, tasks, documents); index and link all informa-tion to these identifiers
Define the golden sources of truth for •operational and analytic data, and strive for coverage, completeness and accuracy
Fulfil requests immediately to eliminate •waste, rework; Work in progress through real–time banking—open accounts, service clients, and process and post transactions immediately
Create product configuration engines— •configure and launch products in days
Implement “tick–and–flick” task manage- •ment (routing, tracking) to move work requests to more skilled, lower–cost staff to free up time in the frontline
Implement one HR system for staff and •contractors that involves a single pro-
Sources: FIBAC Productivity Survey 2013; BCG analysis.Note: data of 1 Private (Old) and 4 PSU (Medium) banks excluded from the analysis because of data consistency issues or data unavailability. 1IT Optimization projects include projects related to optimization of the architecture, application landscape, application development processes and IT organization.2Non–IT cost reduction projects include projects related to standardization, automation and centralization of back–office processes and other business simplification and optimization initiatives.3Growth projects include projects related to growth in products and channels.4Management projects include projects related to reporting, controlling, risk management, business intelligence and implementation of legal and regulatory guidelines.5Maintenance projects include projects needed to sustain the day–to–day operations.
Exhibit 5.9 | Mis–directed IT Effort: IT Optimization Projects Being Ignored By All Bank Segments
23
12
Private (New)
19
13
33
Industry
11
Private (Old)
7 9
28
28
28
PSU (Large)
23
20
33
13
10
PSU (Medium)
17
10
33
28
13
17
19
28
26
Breakup of top ten priority IT projects into different categories (%)
IT Optimization1 Management4Growth3 Maintenance5Non–IT cost reduction2

The Boston Consulting Group • FiCCi • iBA | 59
cess—linked to role–based authorizations by level and employment status—for hiring, retirements and promotions
smart source: From Vendors to PartnersConsider a list of some of the activities that banks do—data entry, filling ATMs with cash, maintaining self–service machines, deliver-ing documents, maintaining servers, helping employees with basic computer–related is-sues, maintaining IT applications, securing premises, managing records, housekeeping, maintaining facilities, preparing payroll, etc. A large number of bank employees are en-gaged in carrying out these types of activi-ties. Are these core activities of the bank? Should these be necessarily done by bank employees? Is doing these activities in–house the most productive use of relatively expen-sive banking talent? Would it dilute control or increase risk if some of these activities were outsourced?
Answers to these questions could vary slight-ly for different banks, given their starting points, cultures and organizational limita-tions. However, the fact remains that banks
would only benefit from higher levels of out-sourcing of low value–added activities. These activities could be done in a cheaper, better way and in many cases, with better controls through use of outsourced agencies. Banks will need to create a framework for outsourc-ing. To start with, they will have to develop robust capabilities for vendor relationship management in order to realize the full ben-efits of outsourcing. Also, banks need to choose a select number of vendors who are almost partners in the business, and are as interested in continuous improvement as the banks themselves are. Exhibit 5.10 shows that only about 25 percent of public sector banks are planning to outsource tasks—other banks need to consider this lever as well for improving the tooth–to–tail ratio.
Note:1. Source: Y. Morieux (2011), ‘Smart Rules: Six Ways to Get People to Solve Problems Without You’, Harvard Business Review, volume 89, n°9, September: pp78–86.
Source: FIBAC Productivity Survey 2013; BCG global enterprise excellence database for banks; BCG analysis.Note: data of 1 PSU (Large) and 4 PSU (Medium) banks excluded from the analysis because of data consistency issues or data unavailability.
Exhibit 5.10 | Opportunity to Increase Focus on Outsourcing to Ensure Greater Efficiency
“Do you plan to outsource tasks in the future?”
71
29
Private (Old)
40
60
Private (New)
71
PSU (Large)
20
80
PSU (Medium)
29
% of banks
Have plans to outsource tasks No plans in the near future
60 | Consistency, Quality, and Resilience
diGital tRansFoRMationThe ChAlleNGe oF AdoPTioN
“You cannot escape the responsibility of tomor-row by evading it today.”
— Abraham Lincoln
We established the importance of digital channels and transactions in
last year’s FIBAC report. Higher use of digital channels and more transactions lead to improved customer retention and higher balances in accounts. At the same time, digital channels do not make branches redundant. Branches, in fact, play a crucial role in developing emotional engagement with customers, and creating advocates among customers.
Let us recap the salient insights from the one–of–its–kind survey of about 14,000 bank customers (validated and normalized for so-cio–economic class of customers) as shown in Exhibit 6.1.
Propensity to switch reduces by more •than 10 percent when customers use three or more digital channels
Balances are 40 percent higher for •customers using at least three digital channels
Balances are almost 35 percent higher in •accounts when customers transact four or more times in a month
Customers visiting branch at least four •times a month have an almost 55 percent higher Net Promoter Score
Banks need to embrace a two–pronged ap-proach in order to retain customers, increase balances and turn clients into advocates. They should encourage customers to carry out transactions on digital channels. Banks should also strive to get customers to visit branches—not to facilitate transactions, but to offer them advice on their banking and investment matters.
This year’s banking survey reveals that cash and cheque transactions per account have only marginally come down over the last two years. There has been a steady progress in the adoption of digital channels, but big gains remain elusive. There are new “new” channels on the horizon—like corporate business correspondents, mobile operators and regular business correspondents agents. These new “new” channels present a huge, untapped opportunity. Making the digital and new “new” channels work will require commitment from the top, engagement from within the organization, new mutually ben-eficial partnerships, user–friendly digital in-terfaces, attractive use cases, and a concert-ed customer education and incentivization campaign.

The Boston Consulting Group • FiCCi • iBA | 61
Cash: Continue to Hold the Fort, But Cracks Visible
The number of cash transactions per day per branch has increased by 8 percent over the last two years, from 118 to 127, as shown in Exhibit 4.4. However, the number of cash transactions per active SB account per an-num has fallen by 12 percent, from 4.9 to 4.3, with the corresponding figure for cur-rent account declining by 8 percent, from 30.1 to 27.6 (as shown in Exhibits 6.2 and 6.3 respectively). Cash transactions are increas-ing because the growth in new CASA ac-counts is faster than the growth in the num-ber of branches, as shown in Exhibit 6.4. Compounding the problem is the fact that the new accounts are more mass market, semi–urban and rural, where the prevalence of cash is higher.
Bankers, betting on cash disappearing or re-ducing in branches, will need to rework their strategies. The number of cash tellers will not come down any time soon. Unless, of course, cash deposit machines are installed in the
branches, or at off–site locations co–located with ATMs. One cash deposit machine could free up 1 to 1.5 tellers in the branch. Freed–up manpower could be more productively de-ployed for higher value–add activities like sales, service, advisory, or for training custom-ers on how to use digital channels.
Cheque: Retail Customers letting Go, Businesses Holding onThe number of cheque transactions per branch per day has decreased by 10 percent-age, from 79 to 71 as shown in Exhibit 6.5, in the last two years, with cheque transactions per active SB account per annum declining by a whopping 35 percent, from 2.3 to 1.5 (as shown in Exhibit 6.6). However, the number of cheque transactions per active current ac-count per annum is only marginally down, from 73.6 to 72.7 (as shown in Exhibit 6.7).
Retail customers are adopting digital channels for transactions at a much faster pace than businesses. In fact, many retail customers still using cheques have businesses on the other leg
Sources: BCG’s Center for Consumer and Customer Insight (CCI) Survey, Sample size ~ 13,900 customers; BCG analysis.1digital channels include ATM, debit card, Mobile banking, Call center and Internet.2Interactions is defined as the number of times any of the 6 channels (Branch, ATM, debit card, Mobile banking, Call center and Internet) is used.3% of promoters (customers who gave scores 9–10) minus % of detractors (customers who gave scores 0–6) on a 11 point scale.
Exhibit 6.1 | Higher Customer Interactions Can Lead to Significant Benefits
Percentage of customers who will
never switch
SB account balance
(Rs.)
SB account balance
(Rs.)
Net promoter score3
Customers using less than 3 digital channels1
67.5%
62.5%
Customers using 3 or more digital channels1
44,000
Customers using 3 or more digital channels1
Customers using less than 3 digital channels1
63,000
Customers with more than 4 interactions2 per month
Customers with upto 4 interactions2 per month
55,000
41,000
28 Customers with less than 4 branch visits per month
44 Customers with 4 or more branch visits per month

62 | Consistency, Quality, and Resilience
Sources: FIBAC Productivity Survey 2011; FIBAC Productivity Survey 2013; BCG analysis.Note: data of 2 Private (New), 1 Private (Old), 3 PSU (Large) and 14 PSU (Medium) banks excluded from the analysis because of data consistency issues or data unavailability.
Exhibit 6.2 | Concerted Effort Required From Indian Banking Industry Cash transaction per active savings bank account per annum marginally decreased in FY 2012–13 over FY 2010–11
Sources: FIBAC Productivity Survey 2011; FIBAC Productivity Survey 2013; BCG analysis.Note: data of 2 Private (New), 1 Private (Old), 3 PSU (Large) and 14 PSU (Medium) banks excluded from the analysis because of data consistency issues or data unavailability.
Exhibit 6.3 | Concerted Effort Required From Indian Banking IndustryCash transaction per active current account customer per annum increased in FY 2012–13 over FY 2010–11
PSU (Large)
Private (Old)
PSU (Medium)
Private (New)
Industry average FY 2012-13 Industry average FY 2010-11
4.65.95.5
4.1
5.0
7.4
6.1
7.2
3.9
5.4
2.42.8
3.42.8
4.3 4.9
4.4 4.05.4
3.8 3.8
4.4
Cash transactions per active savings bank account per annum
Average in FY 2010-11 Low Median High Average in FY 2012-13
PSU (Large)
Private (Old)
PSU (Medium)
Private (New)
303126
20
26
49
3934
29 3334
23
18191917
28 32
17 25
34 38
Cash transaction per active current account per annum
Average in FY 2012-13 Average in FY 2010-11 Low Median High
Industry average FY 2012-13 Industry average FY 2010-11

The Boston Consulting Group • FiCCi • iBA | 63
Sources: FIBAC Productivity Survey 2011; FIBAC Productivity Survey 2013; BCG analysis.Note: data of 6 PSU (Medium) banks excluded from the analysis because of data consistency issues or data unavailability; CASA: Current account and savings bank account.
Exhibit 6.4 | CASA Customers Growing Faster Than Number of Branches for PSU Banks, There-by Potentially Increasing Cash Transactions Per Branch
Sources: FIBAC Productivity Survey 2011; FIBAC Productivity Survey 2013; BCG analysis.Note: data of 2 Private (New), 2 Private (Old), 2 PSU (Large) and 13 PSU (Medium) banks excluded from the analysis because of data consistency issues or data unavailability; A year is assumed to have 300 working days.1Cheque transactions include total cheques cleared (inward + outward) at branches as well as processing centres.
Exhibit 6.5 | Number of Cheque Transactions Per Day Per Branch has Decreased For All Bank Categories
CAGR of number of ATMs, CASA accounts and number of branches over FY 2010-11 (%)
2116
3035
2320 17
1316 17
9 712
18
9
Industry Private (New)
PSU (Large)
PSU (Medium)
Private (Old)
CASA accounts ATMs Branches
PSU (Large)
Private (Old)
PSU (Medium)
Private (New)
Number of cheque transactions1 per day per branch
177
678354
201
138
71
163
4871
33
55
24
71 79
52 64 6651
162
150
64
Average in FY 2012-13 Average in FY 2010-11 Low Median High
Industry average FY 2012-13 Industry average FY 2010-11

64 | Consistency, Quality, and Resilience
Sources: FIBAC Productivity Survey 2011; FIBAC Productivity Survey 2013; BCG analysis.Note: data of 3 Private (New), 3 Private (Old), 3 PSU (Large) and 18 PSU (Medium) banks excluded from the analysis because of data consistency issues or data unavailability..
Exhibit 6.6 | Cheque Transaction Per Active Savings Bank Account Per Annum Has Decreased Since FY 2010–11
Sources: FIBAC Productivity Survey 2011; FIBAC Productivity Survey 2013; BCG analysis.Note: data of 3 Private (New), 3 Private (Old), 3 PSU (Large) and 18 PSU (Medium) banks excluded from the analysis because of data consistency issues or data unavailability.
Exhibit 6.7 | Cheque Transactions Per Active Current Account Per Annum Has Remained Stable Since FY 2010–11
PSU (Large)
Private (Old)
PSU (Medium)
Private (New)
Number of cheque transactions per active savings bank account per annum
5.5
2.32.61.8
4.4
2.02.0
5.5
1.5
4.2
1.20.91.1
1.5
2.3
2.51.6
1.10.9 1.5
4.3
4.4
Low Median High Average in FY 2012-13 Average in FY 2010-11
Industry average FY 2012-13 Industry average FY 2010-11
PSU (Large)
Private (Old)
PSU (Medium)
Private (New)
98
637067
121
8281
64 73
104
4039
73 74
54
46
59 68
66 119
112
Number of cheque transactions per active current account per annum
High Average in FY 2012-13 Average in FY 2010-11 Low Median
Industry average FY 2012-13 Industry average FY 2010-11

The Boston Consulting Group • FiCCi • iBA | 65
of the transaction. Banks need to incentivize corporates to increasingly use channels other than cheques, make it easy for corporates to shift, and fully leverage the new payment in-frastructure getting built in the country, like IMPS, ACH and GIRO. For cheques still remain-ing in the branches, banks should consider in-vesting in cheque deposit machines that are compatible with CTS clearing standards. This will further free up the valuable manpower in branches and back–offices for use in higher value–add activities of banks.
atM: easy Pickings are over, tighten the BeltsThe average number of cash withdrawals per day at ATMs is down by nearly 20 percent, from 138 to 112, as shown in Exhibit 6.8. While ATM transactions per account have only dropped by 6 percent, the rest of the re-duction has come from the high growth rate of ATMs. The number of ATMs has increased at a compound annual growth rate of 23 per-cent over the last two years, while the CASA accounts and branches have grown at 17 per-cent and 9 percent, respectively. Banks con-
tinuing to install more ATMs and white–label ATM operators should take notice of this trend. The answer is not to decelerate the ATM deployment. Rather, operators should:
Find more viable locations •
Improve uptime •
Find alternate sources of revenue, and •
Take drastic steps to become more •cost–efficient
Banks have achieved varied levels of success with ATM adoption and migration of trans-actions. Exhibit 6.8 illustrates the number of cash withdrawal transactions per ATM for banks across different categories. Some banks have achieved very high levels of transactions (200 transactions per day per ATM, which is close to the highest in the world). However, there is no scale evident in the level of usage in ATM network. A few banks with small networks are as successful as a few banks with large networks in achieving high usage. The leading public sec-
Sources: FIBAC Productivity Survey 2011; FIBAC Productivity Survey 2013; BCG analysis.Note: data of 1 Private (Old), 1 PSU (Large) and 6 PSU (Medium) banks excluded from the analysis because of data consistency issues or data unavailability.
Exhibit 6.8 | Number of Cash Withdrawal Hits Per ATM Per Day Down by ~20%PSU large banks winning back share from other categories
PSU (Large)
Private (Old)
PSU (Medium)
Private (New)
Cash withdrawal hits per ATM per day
140113
144124
121127
217179
88
54
82
55
3043
24
112
138
Average in FY 2012-13 Average in FY 2010-11 Low Median High
51
154
6321
105
Industry average FY 2012-13 Industry average FY 2010-11
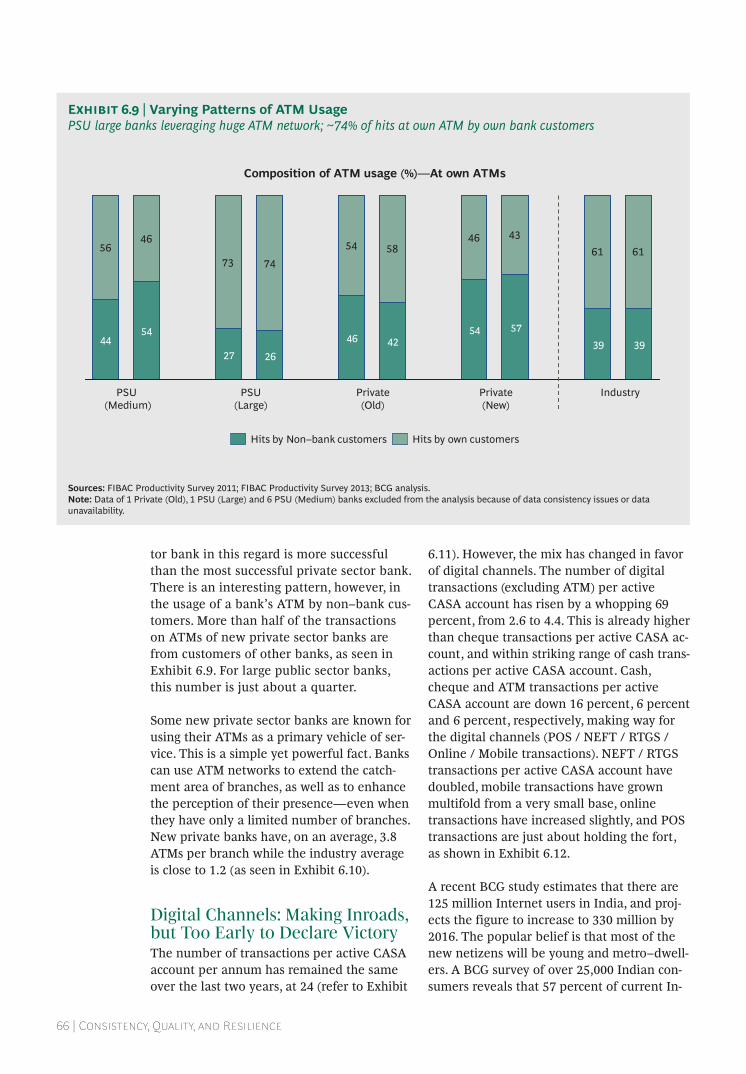
66 | Consistency, Quality, and Resilience
tor bank in this regard is more successful than the most successful private sector bank. There is an interesting pattern, however, in the usage of a bank’s ATM by non–bank cus-tomers. More than half of the transactions on ATMs of new private sector banks are from customers of other banks, as seen in Exhibit 6.9. For large public sector banks, this number is just about a quarter.
Some new private sector banks are known for using their ATMs as a primary vehicle of ser-vice. This is a simple yet powerful fact. Banks can use ATM networks to extend the catch-ment area of branches, as well as to enhance the perception of their presence—even when they have only a limited number of branches. New private banks have, on an average, 3.8 ATMs per branch while the industry average is close to 1.2 (as seen in Exhibit 6.10).
digital Channels: Making inroads, but too early to declare VictoryThe number of transactions per active CASA account per annum has remained the same over the last two years, at 24 (refer to Exhibit
6.11). However, the mix has changed in favor of digital channels. The number of digital transactions (excluding ATM) per active CASA account has risen by a whopping 69 percent, from 2.6 to 4.4. This is already higher than cheque transactions per active CASA ac-count, and within striking range of cash trans-actions per active CASA account. Cash, cheque and ATM transactions per active CASA account are down 16 percent, 6 percent and 6 percent, respectively, making way for the digital channels (POS / NEFT / RTGS / Online / Mobile transactions). NEFT / RTGS transactions per active CASA account have doubled, mobile transactions have grown multifold from a very small base, online transactions have increased slightly, and POS transactions are just about holding the fort, as shown in Exhibit 6.12.
A recent BCG study estimates that there are 125 million Internet users in India, and proj-ects the figure to increase to 330 million by 2016. The popular belief is that most of the new netizens will be young and metro–dwell-ers. A BCG survey of over 25,000 Indian con-sumers reveals that 57 percent of current In-
Sources: FIBAC Productivity Survey 2011; FIBAC Productivity Survey 2013; BCG analysis.Note: data of 1 Private (Old), 1 PSU (Large) and 6 PSU (Medium) banks excluded from the analysis because of data consistency issues or data unavailability.
Exhibit 6.9 | Varying Patterns of ATM Usage PSU large banks leveraging huge ATM network; ~74% of hits at own ATM by own bank customers
Composition of ATM usage (%)—At own ATMs
5646
74
54 5846 43
61 6173
39 39 54
44 57 54
42 46
26 27
Industry PSU (Large)
Private (Old)
PSU (Medium)
Private (New)
Hits by own customers Hits by Non–bank customers
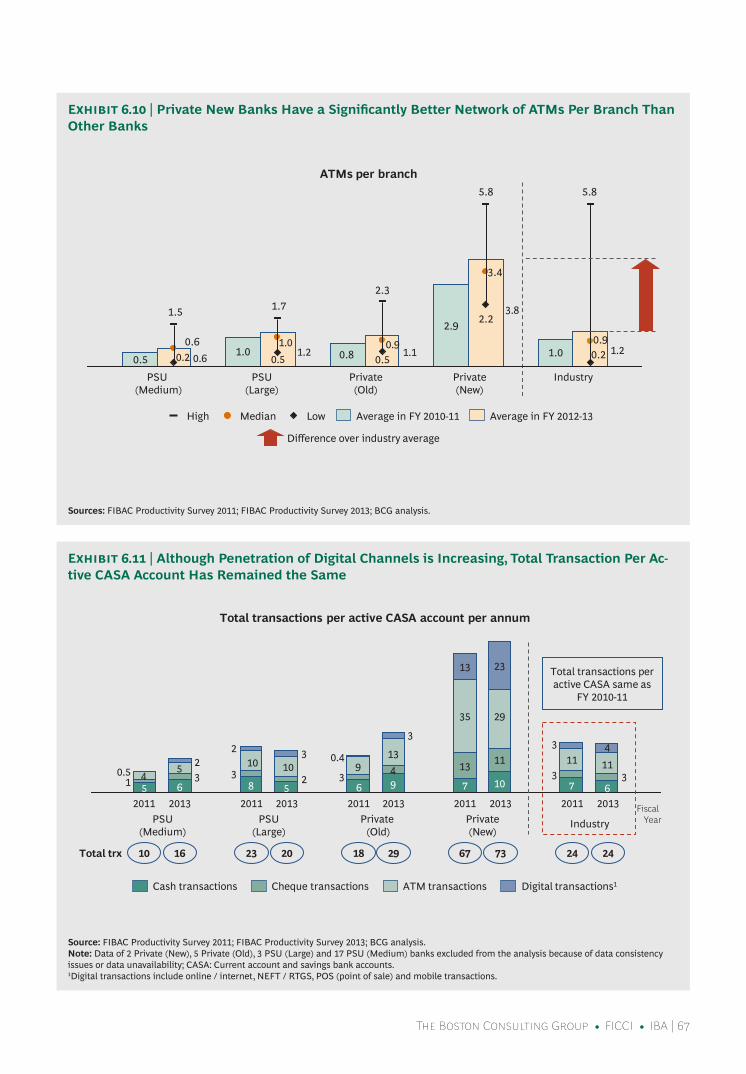
The Boston Consulting Group • FiCCi • iBA | 67
Sources: FIBAC Productivity Survey 2011; FIBAC Productivity Survey 2013; BCG analysis.
Exhibit 6.10 | Private New Banks Have a Significantly Better Network of ATMs Per Branch Than Other Banks
Source: FIBAC Productivity Survey 2011; FIBAC Productivity Survey 2013; BCG analysis.Note: data of 2 Private (New), 5 Private (Old), 3 PSU (Large) and 17 PSU (Medium) banks excluded from the analysis because of data consistency issues or data unavailability; CASA: Current account and savings bank accounts. 1digital transactions include online / internet, NEFT / rTGS, POS (point of sale) and mobile transactions.
Exhibit 6.11 | Although Penetration of Digital Channels is Increasing, Total Transaction Per Ac-tive CASA Account Has Remained the Same
Total transactions per active CASA account per annum
Total trx 10 16 23 20 18 29 67 73 24 24
Fiscal Year PSU
(Large) Private
(Old) PSU
(Medium) Private (New)
Industry
2011 2013 2011 2013 2011 2013 2011 2013 2011 2013 51 40.5
63
58
310
2
52
103
9413
3
63
90.42
7
13
35
13
10
11
29
23
6
114
3
311
37
Cheque transactions Digital transactions1Cash transactions ATM transactions
Total transactions per active CASA same as
FY 2010-11
Industry PSU (Large)
Private (Old)
PSU (Medium)
Private (New)
1.0
2.9
0.81.00.5
5.85.8
2.31.71.5
0.9
3.4
0.60.2
2.2
0.50.9
Average in FY 2012-13 Average in FY 2010-11 Low Median High
ATMs per branch
Difference over industry average
0.2 0.6 1.20.5
1.01.1
3.8
1.2

68 | Consistency, Quality, and Resilience
ternet users are over 25 years old, with the number expected to grow to 70 percent by 2016. Almost 60 percent of Internet users are in sub–urban and rural areas. These custom-ers, on an average, are more affluent, and val-ue convenience and variety more than dis-counts on Internet. Customers with access to the Web currently control close to a third of the urban consumption, and this figure will grow to almost 60 percent by 2016. Nearly half of these people are accessing the Inter-net through mobile devices, and Internet on mobile will only grow. Almost a third of con-sumers of financial services firms currently have access to the Internet, with the figure expected to grow to about 50 percent by 2016. Indian banks cannot ignore this digital customer—if they do, they might very well ig-nore 50 percent of the customers and almost 60 percent of the banking pool by value.
Internet adoption by active SB customers has increased by 25 percent in both metro and non–metro locations in the last two years. SB accounts with active Internet banking is up, from 16 percent (as a proportion of total ac-
tive SB accounts) to 20 percent, in metro branches, and up from four percent to five percent in non–metro branches, as shown in Exhibit 6.13. Mobile banking activation has surged by between 200 and 300 percent. While this is encouraging, it is too early to de-clare a victory. Virtually all banking custom-ers have a mobile phone, but still only three percent are using mobile for transactions. Al-most 35 percent of banking customers in met-ro and semi–urban areas have access to the Internet, but less than half of them are using Internet banking.
Even when banks have managed to persuade customers to use digital channels, spends by clients on these channels have yet to pick up. New private banks have been more successful at activating customers and having them spend using digital channels, as shown in Ex-hibit 6.14. The amount of digital spend per SB account is seven to eight times at new private banks, as compared to the industry average.
The banking industry’s Return on Investment (RoI) on the massive infrastructure it has set
Sources: FIBAC Productivity Survey 2011; FIBAC Productivity Survey 2013; BCG analysis.Note: data of 5 Private (Old), 1 PSU (Large) and 15 PSU (Medium) banks excluded from the analysis because of data consistency issues or data unavailability; CASA: Current account and savings bank account; POS: Point of sale.1Mobile transactions include both financial and non–financial transactions.
Exhibit 6.12 | Digital Transactions Per Active CASA Customers Increased Marginally Share of NEFT / RTGS, online and Mobile transactions increased at the expense of ATM transactions
Break–up of digital transactions per active CASA account per annum among different channels (%)
7 10 6
5
814
16 7 11
811
613
139
11
6
10
5
5
17
16
77 75 84
76
90
71 69 79
70
NEFT / RTGS POS ATM Internet / Online Mobile1
PSU (Large)
Private (Old)
PSU (Medium)
Private (New)
Industry 2011 2011 2011 2011 2011 2013 2013 2013 2013 2013
Total digital transactions per active CASA per
annum
3 2 1 3 2 3
4 4
4
3 4 4
Fiscal year
6.0 7.5 11.7 11.8 20.5 20.9 46.3 49.5 14.7 15.1
0.3 0.2 0.3 0.2
57

The Boston Consulting Group • FiCCi • iBA | 69
Source: FIBAC Productivity Survey 2011; FIBAC Productivity Survey 2013; BCG analysis.Note: data of 1 Private (New), 4 Private (Old), 2 PSU (Large) and 12 PSU (Medium) banks excluded from the analysis because of data consistency issues or data unavailability.
Exhibit 6.13 | Active Savings Bank Accounts Using Alternate Channels: Increase Over FY 2010–11 For Metro as Well as Non–Metro BranchesIncreased adoption of alternate channels across the board
Sources: FIBAC Productivity Survey 2013; BCG analysis.Note: For POS spend, data of 1 Private (Old), 1 PSU (Large) and 9 PSU (Medium) banks excluded from the analysis because of data consistency issues or data unavailability; For ECS, data of 2 Private (New), 3 Private (Old), 1 PSU (Large) and 12 PSU (Medium) banks excluded from the analysis because of data consistency issues or data unavailability; For Internet banking spend, data of 2 Private (New), 3 Private (Old), 1 PSU (Large) and 15 PSU (Medium) banks excluded from the analysis because of data consistency issues or data unavailability; POS: Point of sale; p.m.: Per month; ECS: Electronic clearing system.
Exhibit 6.14 | Indian Banks Need to Discover a New Approach for Alternate ChannelsAverage spend per new channel low
Penetration of new channels— Metro branches
Penetration of new channels— Non metro branches
% of active savings bank accounts
1
16
53
3
20
54
Active mobile banking
Active internet banking
Active ATM card
Average in FY 2010-11 Average in FY 2012-13
1
4
32
2
5
36
% of active savings bank accounts
Average POS spend per active savings bank account p.m. (Rs.)
Average internet banking spend per active savings bank account p.m. (Rs.)
Average value of ECS transactions per active
savings bank account p.m. (Rs.)
~Rs. 2,000 ~Rs. 7,000 ~Rs. 10,000
708
91
414
65
372
Private (New)
Private (Old)
PSU (Large)
PSU (Medium)
122
56
247
1,424
183
222
201
743
791
5,798
Industry average FY 2012-13 Average in FY 2012-13
Average POS spend per active POS user p.m.
Average ECS spend per active ECS user p.m.
Average internet banking spend per active internet
banking user p.m.

70 | Consistency, Quality, and Resilience
up for digital payments will be difficult to de-fend with such adoption and spend rates. As highlighted in Exhibit 6.15, the foremost rea-son cited by customers for non–adoption is the lack of awareness / education. Debit cards suffer from the perception of security risk, while customers find the Internet to be incon-venient. Mobile customers do not feel the need to use digital channels—the use case is unclear.
However, none of the reasons for non–adop-tion are seemingly insurmountable for banks. The importance of digital channels for im-proving overall productivity and creating loy-alty and satisfaction among customers cannot be overstated. The current situation must change for the better, before banks can de-clare victory on the digital front.
How to turbo Charge digital adoption: Four Pronged ap-proachBCG experience suggests that banks need to fire on all cylinders to drive an increase in adoption and spend rates, as far as digital
channels are concerned. As shown in exhibit 6.16, we recommend a four pronged ap-proach to be undertaken by banks to ensure that they do not miss the digital wave.
Commit to digitalCommitment from the topThe top management needs to commit to dig-ital for adoption and spend rates to really go up. And for that to happen, three issues need to be tackled.
Top management needs to fully under- •stand what is digital and what it can do
Digital needs to be among the top three to •five items on the senior leadership’s radar
Top management needs to have a me- •dium– to longer–term perspective
As the saying goes, charity begins at home. Top management needs to be “reverse–men-tored” for them to be able to fully grasp the potential of digital. Banks should leverage their young and new employees to hold “re-verse–mentoring” sessions for the top man-
Source: BCG India Customer Survey 2012; BCG analysis.Note: Sample size used in this analysis is 13,900 bank customers.
Exhibit 6.15 | Reasons for Poor Channel Adoption
Reason # 1 Reason # 2 % not using Channel
Not aware
Not aware
Don't feel the need
Not aware
Not aware
Do not know how to use
Safety concerns
Not aware
Bad experience in past
Inconvenience
18%
72%
72%
77%
77%
Debit card
Mobile banking
Call center
Internet
ATM
xx% Percentage of users not using the channel
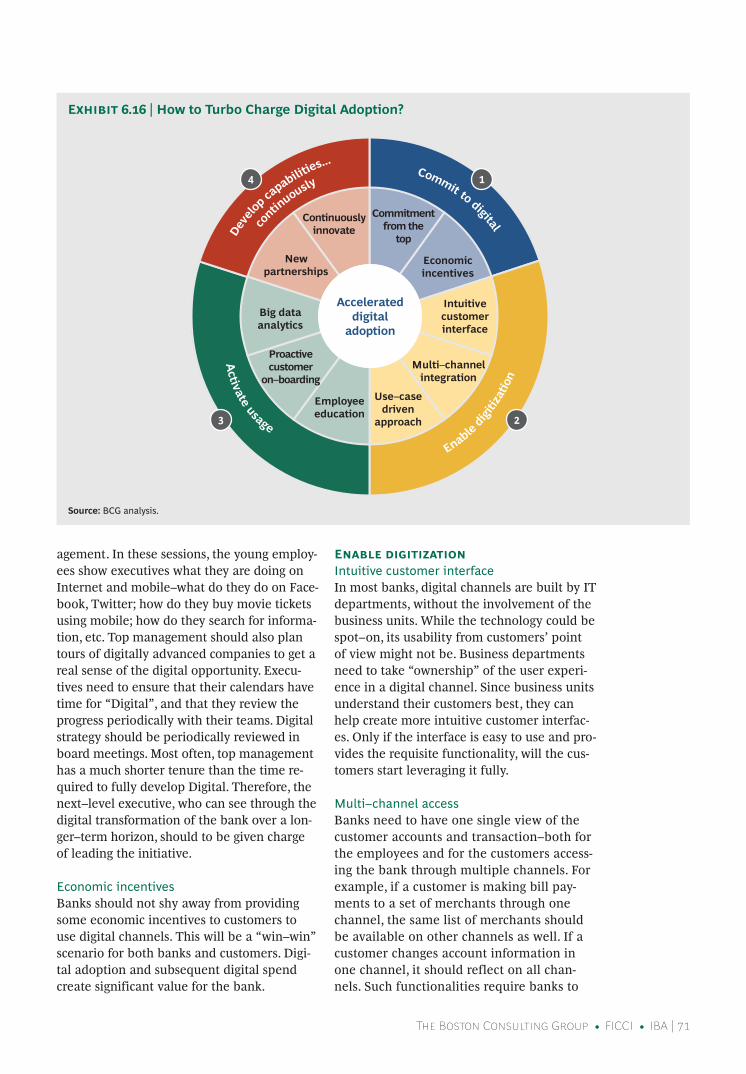
The Boston Consulting Group • FiCCi • iBA | 71
agement. In these sessions, the young employ-ees show executives what they are doing on Internet and mobile–what do they do on Face-book, Twitter; how do they buy movie tickets using mobile; how do they search for informa-tion, etc. Top management should also plan tours of digitally advanced companies to get a real sense of the digital opportunity. Execu-tives need to ensure that their calendars have time for “Digital”, and that they review the progress periodically with their teams. Digital strategy should be periodically reviewed in board meetings. Most often, top management has a much shorter tenure than the time re-quired to fully develop Digital. Therefore, the next–level executive, who can see through the digital transformation of the bank over a lon-ger–term horizon, should to be given charge of leading the initiative.
Economic incentivesBanks should not shy away from providing some economic incentives to customers to use digital channels. This will be a “win–win” scenario for both banks and customers. Digi-tal adoption and subsequent digital spend create significant value for the bank.
Enable digitizationIntuitive customer interfaceIn most banks, digital channels are built by IT departments, without the involvement of the business units. While the technology could be spot–on, its usability from customers’ point of view might not be. Business departments need to take “ownership” of the user experi-ence in a digital channel. Since business units understand their customers best, they can help create more intuitive customer interfac-es. Only if the interface is easy to use and pro-vides the requisite functionality, will the cus-tomers start leveraging it fully.
Multi–channel accessBanks need to have one single view of the customer accounts and transaction–both for the employees and for the customers access-ing the bank through multiple channels. For example, if a customer is making bill pay-ments to a set of merchants through one channel, the same list of merchants should be available on other channels as well. If a customer changes account information in one channel, it should reflect on all chan-nels. Such functionalities require banks to
Exhibit 6.16 | How to Turbo Charge Digital Adoption?
Source: BCG analysis.
Accelerated digital
adoption
Employee education
Proactive customer
on–boarding
Intuitive customer interface
Economic incentives
Use–case driven
approach
Big data analytics
Multi–channel integration
Commitment from the
top
New partnerships
Continuously innovate
1
2 3
4

72 | Consistency, Quality, and Resilience
develop seamless multi–channel access ca-pabilities. The core back–end processing and rule engine need to be common across chan-nels, with only the front end changing for each channel.
Use case–driven approachThe “inside–out” approach to the develop-ment of digital channels results in a plethora of initiatives, with banks delivering a host of technological solutions–a functional website, a mobile platform for transactions or for en-quiries, etc. However, banks fail to track the activation and usage of these channels. One common cause is that customers are not aware of what to use these capabilities for. So, just offering a mobile platform is not enough. Banks need to create initial use cas-es for customers, for example, “pay your telephone bill using mobile”, “buy your rail ticket using net banking on our website”. This creates a “trial” of the service for cus-tomers. Once the customer starts using one service, he/ she gets hooked, and finds it much easier to use other digital functional-ities and services.
Activate usageBig data analyticsBanks have reams of data on their customers’ transaction patterns. Seldom is this data mined to serve the customers better. For ex-ample, banks could very easily identify cus-tomers who have an active digital account, but have not carried out enough digital trans-actions. Banks could then send targeted mes-sages to these customers to increase their dig-ital usage.
Employee engagement and educationOur survey of more than 40,000 banking em-ployees last year revealed that only about 50 percent of the respondents themselves use digital channels like mobile. Banks need to undertake massive internal training and sen-sitization programs to get their own staff on–boarded, with regard to digital channels. Only the employees who are using such platforms themselves can truly and confidently influ-ence customers to embrace digital channels. Frontline employees’ key performance indica-tors should have explicit weightage and tar-gets for on–boarding existing and new cus-tomers to digital channels.
Proactive customer on–boardingBanks should not consider a new account opening process complete until they have on–boarded the given customer to at least three digital channels (including ATM). This process will ensure that the customer has information like PIN numbers easily available when the account is opened. Outbound call centers could contact the customer to hand–hold him/ her through the on–boarding process.
Develop capabilities continuouslyNew partnershipsUnlike branch banking, digital banking will require banks to forge new relationships. For example, they will need to develop mutually beneficial partnerships with telecom opera-tors to fully leverage the potential of mobile banking. Banks could also look at signing up businesses and merchants (directly, or indi-rectly through intermediaries) to develop a robust bill–pay network for their customers. Another way for banks might be to tie up with numerous nimble non–banking organi-zations to bring innovative value propositions to customers.
Continuous innovationSomeone said that traditional banking is and should be boring. Digital banking is anything but boring. Continuous change and innova-tion are integral to digital banking. Banks that do not embrace continuous change will tend to lose out to competition much faster than they did in the traditional banking era.
new “new” Channel: Realizing Potential of Business Correspon-dents (BC)‘Business correspondents’ is perhaps one of the most under leveraged banking channel in India. FIBAC 2013 survey shows very low penetration of business correspondents across bank types. As shown in Exhibit 6.17 Indian banks have an average of 0.9 BCs per branch with minimum being 0.1 and maxi-mum being 3.2.
However, global experience in countries such as Brazil or Kenya reveals that BCs can be an extremely successful alternate channel for ex-tending banking services, which is economi-cally attractive for both for the bank and the

Exhibit 6.18 | Equity Bank Executing BC Model Profitably in Kenya
The Boston Consulting Group • FiCCi • iBA | 73
Exhibit 6.17 | Number of BCs Per Branch Range From 0.1 to 3.2 For a Sample of Branches
Source: FIBAC Productivity Survey 2013; BCG analysis.Note: data of 4 Private (New), 4 Private (Old), 1 PSU (Large) and 13 PSU (Medium) banks excluded from the analysis because of data consistency issues or data unavailability.1BCs (Business correspondents) include both individual and institutional business correspondents.
Context Key features
• In 2010 Central Bank of Kenya (CBK) rolled out guidelines for agency banking • Financial institutions were allowed to conduct
banking transactions through agents • Access to formal financial institutions low at 40% till
2009 • People had to travel to long distances to get to bank
branches involving cost and time
Equity bank started it's agency banking model using mobile phone and Point of Sale (POS) technology Initial rollout began in Dec 2010 By Dec 2011, rollout was successful– • Number of agents increasing from 875 in
beginning of the year to 3,339 by the end of year • Agents account for 20% of all cash transactions of
bank
An Equity Bank agent is a– • Commercial entity • Contracted to offer banking services like account
opening and savings • At his / her outlet • Duly approved by Central Bank of Kenya
Mobile phones used along with POS for transactions– • Customer to submit account opening form to
agent who submits data to centralized backend team through mobile • Photo and ID proof captured through mobile
camera and sent through phone to backend • Customer receives account opening confirmation
and MPIN in 2 working days
Transaction fees and compensation– • No charges on customers for deposits • Charges on withdrawals higher than those on
ATMs • Bank pays agents on deposits
Overview
2.0
1.6
1.11.0
0.40.3
3.2
1.2
0.9
0.50.3
2.0
0.10.10.3
10 9 8 7 6 5 4 3 2 1
0.9
16 15 14 13 12 11 Banks
Industry average FY 2012-13 PSU (Medium) PSU (Large) Private (Old) Private (New)
Number of business correspondents1 per branch
0.7

74 | Consistency, Quality, and Resilience
BC. For example, as shown in Exhibit 6.18, Equity Bank in Kenya uses franchisees which are commercial entities which are contracted by the bank to offer banking services like ac-count opening and savings at his / her outlet. Equity Bank uses a thorough certification process to certify the BC. In fact the BC of Eq-uity Bank is also expected to invest own capi-tal to become a BC. Once a BC is accredited it is treated as a remote outlet of the bank. The Equity Bank model is a savings led model where Mobile phones along with PoS are used to carry out transactions. The customer pays a transaction fee for withdrawal but not for deposit and the bank also pays the agent on sourcing deposits. On the whole as a result of this model, Equity Bank has grown much faster than its peers in Kenya with improve-ment in NIMs, reduction in CIR and a strong growth in low cost deposit base.
Globally, different BC models are found to be successful provided the intent, economic ra-tionale and right mandate is provided to the BCs. For example, in Brazil, individuals on a part time basis are used as BCs and help in remote collections as well as distribution of financial products.
In the next few years more customers are go-ing to join the banking fold in India than ever before. Organically growing the physical Branch—ATM network is challenging. Pro-gressive banks (new as well as existing) are expected to take the lead in rapidly expand-ing their BC network to serve these new cus-tomers ahead of other banks and in a profit-able manner. As the BC model gains prominence, the laggard banks may lose the first mover advantage. It is crucial for Indian banks and BCs to seriously consider how to build a model that is of the right scale and is economically viable for all stakeholders—as global experience has shown, it can be done and we expect to see it taking shape soon.

The Boston Consulting Group • FiCCi • iBA | 75
HiGH PRoduCtiVity oRGaniZational desiGn
“Nothing is less productive than to make more efficient what should not be done at all.”
— Peter drucker
The paucity of talent is a fairly consistent la-ment you hear across several banks. In such an environment, nothing can be more harm-ful for a bank than having its manpower work at low levels of productivity. Where and how a bank gets its people to focus their energies significantly impacts the efficiency and effectiveness of the organization. There-fore, a careful design of the organization structure is a crucial lever in taking enter-prise productivity to the next level.
However, as we had noted in the FIBAC 2011 report, changes in organizational structure should be made only after careful thought because organizational changes are not eas-ily reversible—these tend to endure in the perceptions of people. Perceptions take a lot longer than reality to change.
overheads: Bulge at the topExhibit 7.1 illustrates administrative full–time–equivalent as a percentage of total FTE in Indian banks. Administrative staff which used to account for about 11 percent of total employees in Indian banks has increased marginally and now accounts for about 12 percent from FY 2010–11 to FY 2012–13. The trend is same across the four categories of
banks. Administrative staff includes employ-ees working in head office, regional offices, and other such layers above branches. It does not include workers in back–office pro-cessing centers and business development teams that are not based at the branches. Some banks in India have as low as seven percent administrative staff. Others have as high as about 19 percent. Clearly there is a wide range in productivity of administrative staff. Scale effect is not visible. Large banks, on an average, do not have lower adminis-trative overheads. It can be argued that there is a case for many banks to enhance productivity significantly by optimizing their central overheads.
Nonetheless, optimization in overheads has to be carried out with great caution. Wrong cuts can be retrograde and debilitating. A common mistake (which was cited in the previous FIBAC report published in 2012) made by some organizations is to pursue a blanket reduction of one tier in the organi-zation hierarchy (“four–tiers to three–tiers”). This is often found to be counterproductive. Different businesses require different num-ber of tiers to provide effective spans of con-trol. Corporate banking needs a two–tier structure; SME banking needs a three–tier structure; retail needs a four–tier structure or more. Organizational tiers have to be aligned to the economics of the different businesses.
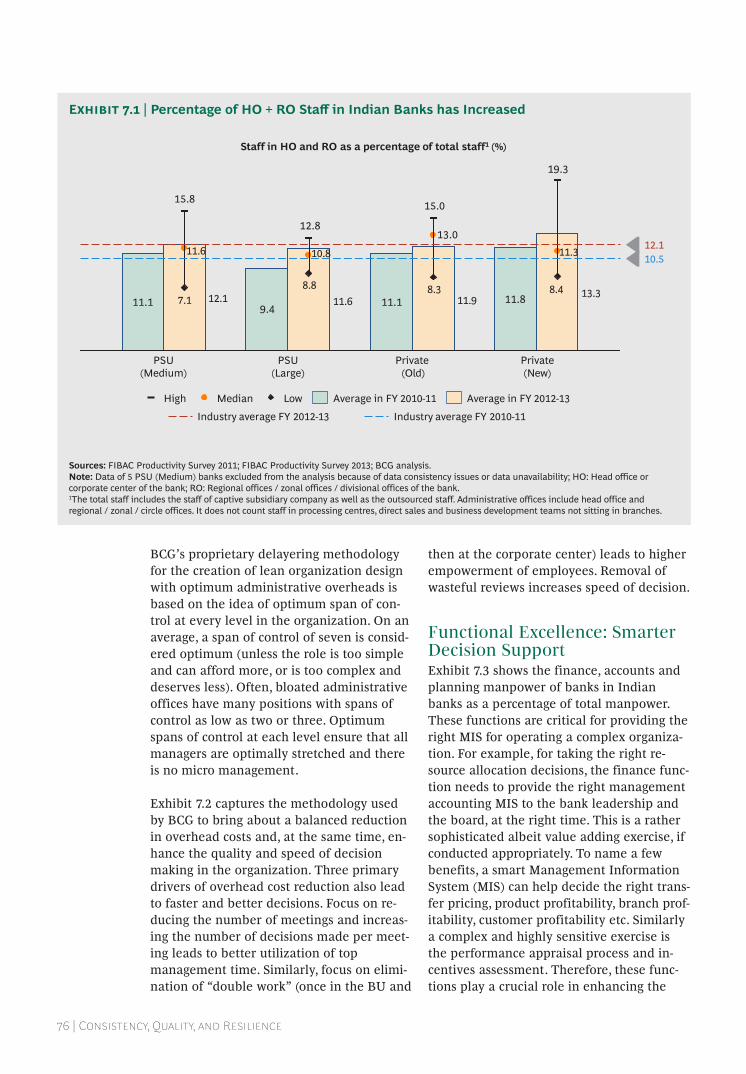
76 | Consistency, Quality, and Resilience
BCG’s proprietary delayering methodology for the creation of lean organization design with optimum administrative overheads is based on the idea of optimum span of con-trol at every level in the organization. On an average, a span of control of seven is consid-ered optimum (unless the role is too simple and can afford more, or is too complex and deserves less). Often, bloated administrative offices have many positions with spans of control as low as two or three. Optimum spans of control at each level ensure that all managers are optimally stretched and there is no micro management.
Exhibit 7.2 captures the methodology used by BCG to bring about a balanced reduction in overhead costs and, at the same time, en-hance the quality and speed of decision making in the organization. Three primary drivers of overhead cost reduction also lead to faster and better decisions. Focus on re-ducing the number of meetings and increas-ing the number of decisions made per meet-ing leads to better utilization of top management time. Similarly, focus on elimi-nation of “double work” (once in the BU and
then at the corporate center) leads to higher empowerment of employees. Removal of wasteful reviews increases speed of decision.
Functional excellence: smarter decision support Exhibit 7.3 shows the finance, accounts and planning manpower of banks in Indian banks as a percentage of total manpower. These functions are critical for providing the right MIS for operating a complex organiza-tion. For example, for taking the right re-source allocation decisions, the finance func-tion needs to provide the right management accounting MIS to the bank leadership and the board, at the right time. This is a rather sophisticated albeit value adding exercise, if conducted appropriately. To name a few benefits, a smart Management Information System (MIS) can help decide the right trans-fer pricing, product profitability, branch prof-itability, customer profitability etc. Similarly a complex and highly sensitive exercise is the performance appraisal process and in-centives assessment. Therefore, these func-tions play a crucial role in enhancing the
Sources: FIBAC Productivity Survey 2011; FIBAC Productivity Survey 2013; BCG analysis.Note: data of 5 PSU (Medium) banks excluded from the analysis because of data consistency issues or data unavailability; hO: head office or corporate center of the bank; rO: regional offices / zonal offices / divisional offices of the bank.1The total staff includes the staff of captive subsidiary company as well as the outsourced staff. Administrative offices include head office and regional / zonal / circle offices. It does not count staff in processing centres, direct sales and business development teams not sitting in branches.
Exhibit 7.1 | Percentage of HO + RO Staff in Indian Banks has Increased
Staff in HO and RO as a percentage of total staff1 (%)
11.811.19.411.1
19.3
15.0
12.8
15.8
13.0
10.5 12.1
PSU (Large)
Private (Old)
PSU (Medium)
Private (New)
8.4 8.3 8.8 7.1
11.6 11.3
Industry average FY 2012-13 Industry average FY 2010-11
10.8
11.6 12.1 11.9 13.3
Average in FY 2012-13 Average in FY 2010-11 Low Median High

The Boston Consulting Group • FiCCi • iBA | 77
Source: BCG analysis.
Exhibit 7.2 | Overhead Efficiency by Better Decision Making Processes
Sources: FIBAC Productivity Survey 2011; FIBAC Productivity Survey 2013; BCG global enterprise excellence database for banks; BCG analysis.Note: data of 4 PSU (Medium) banks excluded from the analysis because of data consistency issues or data unavailability; A year is assumed to have 300 working days.1Finance staff does not include staff involved in assessment of risk.2Total staff includes the staff of captive subsidiary company as well as the outsourced staff.3Global median is for FY 2011–12.
Exhibit 7.3 | Scientific Decision Support System Capabilities Need to Improve Finance, accounts and planning staff increased post FIBAC 2011 but still below global standards
Drive to a lower cost structure
Enable and accelerate effectiveness and growth
• Fewer meetings, more decisions • More decisions focused on customer,
revenue or cost actions
• More intense customer focus throughout the organization • Senior leaders closer to the customer
• Removal of double-work due to multiple decision nodes • Fewer ad hoc low-value-added requests
• Employees empowered with broader, clearer mandates • Fewer “blockers” to say no • “Shadow organizations” eliminated • Limited micro-managing
• Path-to-outcome requires fewer resources, less time • Reduced waste from order-taking
mentality; employees ask “why” and “how”?
• Decisions communicated and implemented more rapidly • Ideas from line less distorted as they move
up the organization
Better decision making
Enhanced accountability
Faster decision to action
1
2
3
PSU (Large)
Private (Old)
PSU (Medium)
Private (New)
Staff in finance1, accounts and planning as a percentage of total staff2 (%)
Industry average FY 2012-13 Industry average FY 2010-11 Global median3
0.40.61.0
1.0
2.0
1.5
2.2
1.01.0
0.7
0.20.40.40.2
1.2
2.9
0.9 0.7
Huge gap between Indian
average and global
median
0.50.90.91.0 0.7
High Average in FY 2010-11 Low Median Average in FY 2012-13

78 | Consistency, Quality, and Resilience
overall efficiency and productivity of the bank. It is heartening to note that there has been an upward bias on the average number of finance, accounts and planning staff as a percentage of total staff. On average, the fi-nance, accounts and planning staff has grown from 0.7 percent in FY 2010–11 to 0.9 percent in FY 2012–13. However, this trend is not true across the bank segments, with private old banks having witnessed a reduc-tion in percentage staff in all these impor-tant functions.
Notwithstanding the marginal improvement overall, as an industry, Indian banks at 0.9 percent are significantly below the global median of 2.9 percent.
The key issue in these functions is not about cost reduction but expertise and capability enhancement to implement best–in–class practices to improve employee productivity. Considering current levels of underinvest-ment, many banks will benefit by continued augmenting of their finance, accounts and planning teams with expert manpower.
investing in Performance Man-agement: Business of People We had noted in FIBAC 2011 survey that the functional expertise in the HR function in Indian banks needed to be improved signifi-cantly. FIBAC 2013 survey reveals that the percentage of HR staff as a proportion of to-tal staff at an industry level has depleted marginally from 0.83 percent in FY 2010–11 to 0.77 percent in FY 2012–13—still well be-low the global average of 1.44 percent (as shown in Exhibit 7.4). It is interesting to note that except for private new category of banks, the remaining three categories of banks have a few banks which are near the global average.
A strong HR function plays a crucial role in operating an organization that is perfor-mance oriented with the right performance management systems. Compromising on the HR function can put the entire performance culture at risk. In the HR function as well, Indian banks would benefit significantly from strengthening the skills in their HR function.
Sources: FIBAC Productivity Survey 2011; FIBAC Productivity Survey 2013; BCG global enterprise excellence database for banks (2012); BCG analysis.Note: data of 2 Private (Old) and 4 PSU (Medium) banks excluded from the analysis because of data consistency issues or data unavailability; hr: human resources.1Global median for FY 2011–12.2Global best for FY 2011–12.
Exhibit 7.4 | HR Department Still Understaffed; Around Half of Global Average
PSU (Large)
Private (Old)
PSU (Medium)
Private (New)
HR staff / Total staff (%)
0.41.11.00.9
0.7
1.5
1.2
1.6
0.3
1.01.0
0.70.60.2
0.77 0.83
1.44
4.43
0.3 0.6
Average in FY 2012-13 Average in FY 2010-11 Low Median High
Industry average FY 2012-13 Industry average FY 2010-11 Global Median1 Global Best2
0.9 0.41.0 0.8

The Boston Consulting Group • FiCCi • iBA | 79
Performance Culture: the Holy Grail The ultimate objective of all manpower transformation efforts is to generate perfor-mance culture. BCG experience suggests that organizations struggle from two structural challenges that undermine the creation of a performance culture (a) proliferation of complexity and (b) weak performance man-agement system.
As organizations grow and become more complex the typical response of dealing with complexity is to create more complexity in the organization structure. The fall out of this complexity is that people get confused about their mandate and often stop thinking of the organization as a whole, instead fo-cusing only on their daily routine leading to lack of genuine team work. In chapter five, we have explained the six smart rules that can help break down the silos and enhance collaboration or team work.
Beyond simplicity in structure, for building a real performance culture it is crucial that
role mandates, decision rights and incentives / variable compensation measures are de-fined considering the right balance between comprehensiveness vs. simplicity and, objec-tivity vs. subjectivity in criteria. BCG experi-ence has demonstrated that performance in-centive is the single most powerful lever to enhance productivity. This is not to say that banks should propagate mercenary behav-iour. On the contrary, as explained in Chap-ter 5, creating a smart pay–off matrix that reinforces the right behaviours is the single most powerful lever for improving produc-tivity.
Typically, variable compensation at 15–20 percent of fixed compensation is found to be effective in providing credible incentive. Ex-hibit 7.5 illustrates variable compensation as a percentage of total employee cost in Indi-an banking for various banks. On an aver-age, the percent variable compensation has increased from around 1.6 percent in FY 2010–11 to around 2 percent in FY 2012–13. While the variable pay as a percentage of to-tal pay has come down for all banking
Sources: FIBAC Productivity Survey 2011; FIBAC Productivity Survey 2013; BCG analysis.Note: data of 2 Private (Old), 3 PSU (Large) and 14 PSU (Medium) banks excluded from the analysis because of data consistency issues or data unavailability. For PSU banks; ratio used is variable pay as a percentage of fixed pay.1The total cost attributable to the employees includes fixed salary, bonus, pension and gratuity.
Exhibit 7.5 | Variable Pay Has Increased Overall Though it Has Reduced For All Bank Categories
11.214.1
1.6 2.1
PSU (Large)
Private (Old)
PSU (Medium)
Private (New)
Typical benchmark range (15–20%)
Variable pay as a percentage of total pay1 (%)
0.2 0.1 0.2 0.2
5.2 4.4
Industry average FY 2012-13 Industry average FY 2010-11
Average in FY 2012-13 Average in FY 2010-11

80 | Consistency, Quality, and Resilience
groups, the overall number has increased due to an increase in the weightage of the private banks (in the total pay of all bank employees in India) from 12 percent in FY 2010–11 to 26 percent in FY 2012–13.
Public sector banks are in an urgent need to introduce credible performance–linked com-pensation. The current spend on variable pay is almost negligible. Existing guidelines from the ministry of finance limit variable compensation to one percent of previous year’s PAT, which is roughly one percent of total employee costs. Banks typically find it difficult to distribute even up to this low pre-scribed limit. PSU banks should expeditious-ly deploy systems that can facilitate differen-tiation among employees based on the right pay–off matrix, and award variable compen-sation to staff. The Government of India should facilitate higher levels of variable compensation to PSU bank employees.

The Boston Consulting Group • FiCCi • iBA | 81
introduction to Banking ResearchResearch was conducted across five key areas of productivity—NPA management, Front–office model, Adoption of new channels, Organization design and Back–office model. Information was captured through 11 forms, which were filled up by each of the participating banks:
Form 01: • Head office and Regional office / Zonal office / Divisional office Man–Power Calculations
Form 02: • Processing–Centre Man–Power Capacity and Throughput Calculations
Form 03: • Branch and Sales Man–Power Calculations
Form 04: • Overall Bank Business
Form 05: • Fee Income
Form 06: • Cost Efficiency
Form 07: • Branch Information and Service Maturity
Form 08: • Channel Usage and Transaction Profile
Form 09: • NPA Management
Form 10: • Information Technology Related
Form 11: • Qualitative Questions
Methodology of ResearchThe survey was filled by 38 banks (12 Private Sector banks and 26 Public Sector banks). Re-sponses from these surveys were analyzed collectively to understand the performance of these banks on various productivity metrics.
In order to maintain confidentiality, results and analysis of the survey are presented bank—category wise throughout the report. Banks have been divided into four catego-ries—Private New, Private Old, PSU Large, PSU Medium. Bank category averages along with high, median and low values are pre-sented to show variance amongst peers.
A similar survey was administered in FIBAC 2011. Wherever possible, a comparison be-tween the values in 2011 and in 2013 has been shown to give the readers an idea of the movement in the productivity metrics across bank categories in the last two years.
Participating Banks (as shown in table 1)38 banks customers participated in the survey:
5 Private New banks •
7 Private Old banks •
6 PSU Large banks •
20 PSU Medium banks •
aPPendiX
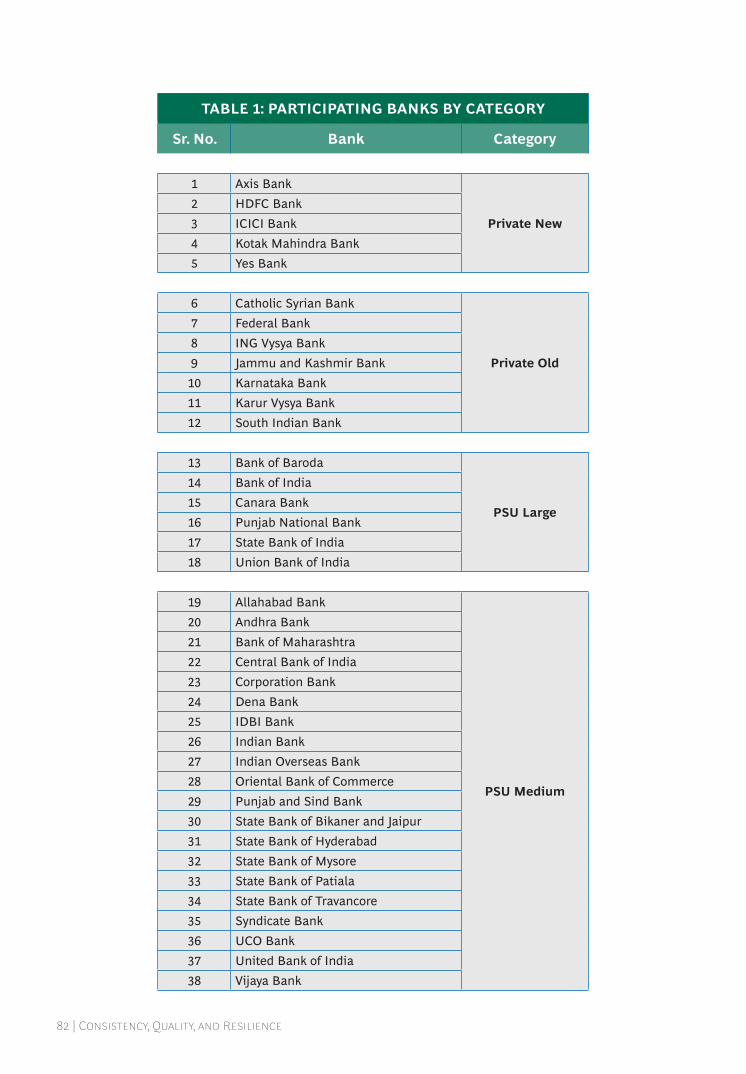
82 | Consistency, Quality, and Resilience
TABLE 1: PARTICIPATING BANKS BY CATEGORY
Sr. No. Bank Category
1 Axis Bank
Private New2 hdFC Bank3 ICICI Bank4 Kotak Mahindra Bank5 Yes Bank
6 Catholic Syrian Bank
Private Old
7 Federal Bank8 ING Vysya Bank9 jammu and Kashmir Bank
10 Karnataka Bank11 Karur Vysya Bank12 South Indian Bank
13 Bank of Baroda
PSU Large
14 Bank of India15 Canara Bank16 Punjab National Bank17 State Bank of India18 Union Bank of India
19 Allahabad Bank
PSU Medium
20 Andhra Bank21 Bank of Maharashtra22 Central Bank of India23 Corporation Bank24 dena Bank25 IdBI Bank26 Indian Bank27 Indian Overseas Bank28 Oriental Bank of Commerce29 Punjab and Sind Bank30 State Bank of Bikaner and jaipur31 State Bank of hyderabad32 State Bank of Mysore33 State Bank of Patiala34 State Bank of Travancore35 Syndicate Bank36 UCO Bank37 United Bank of India38 Vijaya Bank

The Boston Consulting Group • FiCCi • iBA | 83
introduction to Corporate ResearchResearch was conducted across five areas—Advocacy of Indian banks across customer segments, Importance of being a primary bank and what is takes to be one, Importance of various attributes and satisfaction levels among corporates across these attributes, Pat-tern in corporate banking relationships in In-dia and Strengths and improvement areas of corporate banks in India. Survey was filled by 503 corporates from 25 sectors.
The survey included topics covering business profile of corporates, their current banking relationships, level of satisfaction with prima-ry banking relationships and their perspec-tive on the banking industry. Responses from this survey were analyzed collectively to un-derstand the dynamics of the corporate bank-ing industry in India.
In order to maintain confidentiality, results and analysis of the survey are presented bank– and corporate–category wise through-out the report. Banks have been divided into 6 categories—SBI and associates, national-ized banks, old private banks, new private banks, foreign banks and others.
Corporates have been divided into 4 categories:
Based on size: very small, small, medium •and large
Based on type of industry: manufacturing, •services and others
Based on sectors of operation: 25 •categories
A brief snapshot of the participating corporates can be seen in Table 2
TABLE 2: PARTICIPATING CORPORATES BY CATEGORYBy size By sector (cont’d)
Large 142 Mining 11
Very small 129 renewable Energy 11
Small 117 Trading 11
Mid 115 Metal and Capital Goods 10
N 503 Gems and jewellery 9
Others 9
Oil and Gas 7
By sector Textiles 7
Manufacturing 131 Travel and Tourism 5
Professional services 38 Other services 4
Pharma and healthcare 34 Advertising 3
Power and Energy 34 Agriculture and Agri–processing 1
real Estate 24 Civil Aviation and Aerospace 1
retail and FMCG 24 N 503
hospitality 23
Telecom and Information Technology 22
Education 21 By industryLogistics 18 Manufacturing 270
Media and Entertainment 18 Services 223
Financial Sector 16 Others 10
Infrastructure 11 N 503
84 | Consistency, Quality, and Resilience
GlossaRy
ABBREVIATIONSAgri. Agricultural
ATM Automated teller machine
BC Business correspondent
bps Basis points
CA Current account
CASA Current account and savings bank account
Cdr Corporate debt restructuring
CIr Cost–income ratio
ECS Electronic clearing system
FX products Foreign exchange spot, derivatives, and financial risk management products
FTE Full time employee / equivalent
FX Foreign exchange
FY Fiscal year
GNPA Gross non–performing assets (as per rBI definition)
hO head office or corporate center of the bank
hr human resources
IBA Indian Banks’ Association
IT Information technology
LAdS Loan against deposits and shares
MIS Management information system
MSME Micro, small and medium enterprises (as per rBI definition)
NEFT National electronic fund transfer
No. Number
NPA Non–performing assets (as per rBI definition)
p.a. Per annum
PB Primary bank
p.m. Per month
POS Point of sale
rBI reserve Bank of India
rO regional offices / zonal offices / divisional offices of the bank
The Boston Consulting Group • FiCCi • iBA | 85
TERMS DEFINITIONS
Active accounts Accounts with at least one customer initiated transaction over the past six monthsBack–office Activities like data–entry, filing, daily closing, concurrent checking / auditCaptive subsidiary Wholly owned subsidiary of the company or of the group of companiesFTE A full time employee is one who works on an activity full time. For employees with
several roles, time spent is split across activities—for example, if a staff spends 1/4th of his time on an activity, 0.25 FTE is attributed to that activity. Probationary officers are considered, but trainees and interns are not considered
FTE from captive subsidiary
headcount of employees, engaged in activities of the bank, employed by captive subsid-iary of the bank / group
GNPA Gross non–performing assets as a percentage of gross advances outstanding for the corresponding fiscal year
In–house FTE Employees of the bank who are on the payroll of the bankLarge companies Companies with revenue more than rs. 1,000 crore per annumMid companies Companies with revenue between rs. 250–1,000 crore per annumNon–branch based outbound sales / mar-keting force
Employees engaged in sales / marketing and can be present in rO / ZO / hO but not in the branches
Non–metro branch Includes branches in urban, semi–urban and rural areasretail advances Includes home loan, private car loan, personal / clean / unsecured loan, student / edu-
cation loan, gold loan, credit card and loan against deposits and shares, unless speci-fied otherwise
Sales Act of acquiring new customers for any product/service or cross selling / up–selling of new products to an existing customer. This also includes sales pitches and credit origi-nation
Service Act of resolving queries, grievances of existing customers. This also includes retention related activities
Single window The system facilitates delivery of all banking services at a single counter, that is, all cus-tomer needs are attended to at a single point of delivery
Small companies Companies with revenue between rs. 50–250 crore per annumFinancial transactions Only transactions that include a debit or a credit to a customer accountVery small companies Companies with revenue less than rs. 50 crore per annum
ABBREVIATIONS
rOA return on assets
rOI return on investment
rs. Indian National rupee
rs. cr. rupees crore
rTGS real time gross settlement
SB Savings bank
SBI State Bank of India
Telcos Telecom companies
Tx / Txs Transaction(s)
vs. Versus
y–o–y Year on year

86 | Consistency, Quality, and Resilience
The Boston Consulting Group publishes other reports and articles on related topics that may be of interest to senior executives. recent examples include:
Global Asset Management 2013: Capitalizing on the Recovery A report by The Boston Consulting Group, july 2013
Global Wealth 2013: Maintaining Momentum in a Complex WorldA report by The Boston Consulting Group, May 2013
Global Capital Markets 2013: Survival of the FittestA report by The Boston Consulting Group, April 2013
Distribution 2020: The Next Big Journey for Retail BanksA focus by The Boston Consulting Group, March 2013
Committing to Customers in the “New New Normal”: Operational Excellence in Retail BankingA focus by The Boston Consulting Group, February 2013
An Inflection Point in Global Banking: Risk Report 2012–2013A report by The Boston Consulting Group, december 2012
From 5 Star to 7 Star in Productivity: Excellence in Banking with Customer and Employee CentricityA report by The Boston Consulting Group in association with The Federation of Indian Chambers of Commerce and Industry (FICCI) and Indian Bank’s Association (IBA), August 2012
Customer–Centricity in Retail Banking A focus by The Boston Consulting Group, March 2012
A New Virtuous Cycle for Banks: Linking Social Media, Big Data, and Signal AdvantageAn article by The Boston Consulting Group, February 2012
Operational Excellence in Retail Banking: Raising Performance in Turbulent TimesA focus by The Boston Consulting Group, February 2012
Being Five Star in Productivity: Roadmap for Excellence in Indian BankingA report by The Boston Consulting Group in association with The Federation of Indian Chambers of Commerce and Industry (FICCI) and Indian Bank’s Association (IBA), August 2011
The Mobile Financial Services Development ReportA report by the World Economic Forum, prepared in collaboration with The Boston Consulting Group, May 2011
Financial Inclusion: From Obligation to OpportunityA report by The Boston Consulting Group, February 2011
Indian Banking 2020: Making the Decade’s Promise Come TrueA report by The Boston Consulting Group, September 2010
FoR FuRtHeR ReadinG
The Boston Consulting Group • FiCCi • iBA | 87
note to tHe ReadeR
About the AuthorsSaurabh Tripathi is a Partner & di-rector in the Mumbai office of the Boston Consulting Group. Bharat Poddar is a Partner & director in the Mumbai office of the Boston Consulting Group. Yashraj Erande is a Principal in the Mumbai office of the Boston Consulting Group.
For Further ContactIf you would like to discuss the themes and content of this report, please contact:
Alpesh ShahBCG Mumbai+91 22 6749 7163 [email protected]
Ashish GargBCG New delhi+91 124 459 7123 [email protected]
Ashish IyerBCG Mumbai+91 22 6749 7249 [email protected]
Bharat PoddarBCG Mumbai+91 22 6749 7145 [email protected]
Neeraj AggarwalBCG New delhi+91 22 124 459 7078 [email protected]
Pranay MehrotraBCG Mumbai+91 22 6749 7143 [email protected]
Ranu DayalBCG New delhi+91 124 459 [email protected]
Ruchin GoyalBCG Mumbai+91 22 6749 7147 [email protected]
Saurabh TripathiBCG Mumbai+91 22 6749 [email protected]
Yashraj ErandeBCG Mumbai+91 22 6749 [email protected]
AcknowledgmentsThis report has been prepared by the Boston Consulting Group. The authors would like to thank IBA and FICCI for conducting surveys within member banks and the corporates respectively. The authors would also like to thank the FIBAC Steering Committee for their continuous guidance throughout the course of the study. The analysis of the survey has been included in this report. The authors also gratefully acknowl-edge the contributions of deepesh Goel, Nikit Shah, rashik Gupta and Varun Kejriwal in conducting vari-ous analyses for this report. A spe-cial thanks to jasmin Pithawala for managing the marketing process and jamshed daruwalla, rahul Surve and Sajit Vijayan for their contribution towards the design and production of the report.
The authors gratefully acknowledge the data collection efforts on various metrics from the 38 participating banks made by the respective nodal teams as listed below. This report would not have been possible with-out their invaluable support.
Mr. P. Kumaraswamy Allahabad BankPSU (Medium)
Mr. M. V. Narayana ReddyAndhra BankPSU (Medium)
Mr. Julius SamsonAxis BankPrivate (New)
Mr. Ajay K. Govil Bank of BarodaPSU (Large)
Mr. Rajiv Saxena Bank of IndiaPSU (Large)
Mr. G. V. Ramana Bank of Maharashtra PSU (Medium)
Mr. Rajib Kumar SahooCanara BankPSU (Large)
Mr. Mohan Menon T Catholic Syrian BankPrivate (Old)
Mr. Ram S. Sangapure Central Bank of IndiaPSU (Medium)
Mr. B. V. Baliga Corporation Bank PSU (Medium)
Mr. B. M. Nanda dena BankPSU (Medium)
Mr. Renji Alex Federal BankPrivate (Old)

88 | Consistency, Quality, and Resilience
Ms. Vanita Das hdFC Bank Private (New)
Mr. Laxminarayan Achar ICICI Bank Private (New)
Ms. Kiran Balwani IdBI BankPSU (Medium)
Mr. V. RadhakrishnanIndian BankPSU (Medium)
Mr. K. V. Krishnan Indian Overseas BankPSU (Medium)
Ms. Gargi Dash ING Vysya Bank Private (Old)
Mr. Layeek Ahmed jammu and Kashmir Bank Private (Old)
Mr. Anantha PadmanabhaKarnataka BankPrivate (Old)
Mr. Dharmarajan Karur Vysya Bank Private (Old)
Ms. Shilpa Joshi Kotak Mahindra Bank Private (New)
Mr. S. C. DasOriental Bank of Commerce PSU (Medium)
Mr. Deepak Maini Punjab and Sind Bank PSU (Medium)
Mr. R. K. Anand Punjab National Bank PSU (Large)
Mr. T. L. Babu South Indian BankPrivate (Old)
Mr. Sushil K. Jain State Bank of Bikaner and jaipur PSU (Medium)
Mr. K. T. Surendran State Bank of hyderabadPSU (Medium)
Mr. Sanjay KapoorState Bank of India PSU (Large)
Mr. Shashikanth Rathod State Bank of MysorePSU (Medium)
Mr. Sunil Kumar Jain State Bank of PatialaPSU (Medium)
Mr. K. C. Jayanna State Bank of TravancorePSU (Medium)
Mr. H. N. Vishweshwar Syndicate Bank PSU (Medium)
Mr. B. Mukhopadhyay UCO BankPSU (Medium)
Mr. Nitesh Ranjan Union Bank of India PSU (Large)
Mr. Parameshwar MishraUnited Bank of IndiaPSU (Medium)
Ms. Manimekhalai AVijaya BankPSU (Medium)
Mr. Malcolm Athaide Yes BankPrivate (New)

© The Boston Consulting Group, Inc. 2013. All rights reserved.
For information or permission to reprint, please contact BCG at:E–mail: bcg–[email protected]: +91 22 6749 7001, attention BCG/PermissionsMail: BCG/Permissions The Boston Consulting Group (India) Private Limited. Nariman Bhavan 14th Floor Nariman Point Mumbai 400 021 India
Please contact FICCI at:E–mail: [email protected] • Website: www.ficci.comFax: 91–11–23320714 – 23721504Tel: +91–11–23487424 (d) – 23487262 (d)Mail: Ms rosy jose Financial Sector Federation of Indian Chambers of Commerce & Industry Federation house 1, Tansen Marg New delhi 110 001 India
Please contact IBA at:E–mail: [email protected] • Website: www.iba.org.inFax: +91–22–22184222Tel: +91–22–22174018Mail: Mr. P.V. Venkatachalam Indian Banks’ Association Corporate Communications, Centre 1 6th Floor, World Trade Centre, Cuffe Parade Mumbai 400 005 India
To find the latest BCG content and register to receive e–alerts on this topic or others, please visit bcgperspectives.com.
Follow bcg.perspectives on Facebook and Twitter.
08/13


Consisten
cy, Quality, an
d Resilien
ce
FiCCi • iBa
Printer: Spine text instructions
Title should be top aligned with top of the title on the front cov-er; bottom of BCG logo should bottom align with BCG logo on front cover
Title and Logo should match cap heights—adjust both to fit width of spine; allow «breathing room» for text