Embed Size (px)
Citation preview

USER GUIDE
TRADE COMPETITIVENESS MAP
Benchmarking national and sectoral trade performance
CONSISTENCY OF TRADE STATISTICS
Market Analysis and Research
Division of Market Development
International Trade Centre

ITC’s Market Analysis and Research – Consistency of Trade Statistics User Guide
International Trade Centre (ITC) i
Table of Contents
CCHHAAPPTTEERR 11 –– IINNTTRROODDUUCCTTIIOONN ....................................................................................................... 1
11..11 OOvveerrvviieeww ................................................................................................................................ 1
11..22 WWhhyy uussee TTrraaddee CCoommppeettiittiivveenneessss MMaapp............................................................................... 3
11..33 PPrroodduucctt NNoommeennccllaattuurree aanndd DDaattaa SSoouurrcceess ........................................................................ 4
11..33..11.. PPrroodduucctt NNoommeennccllaattuurree ......................................................................................................... 4
11..33..22.. SSoouurrcceess ooff iinnffoorrmmaattiioonn ......................................................................................................... 5
11..44 AAcccceessss ttoo tthhee ttooooll.................................................................................................................. 5
CCHHAAPPTTEERR 22 –– HHOOWW TTOO UUSSEE ............................................................................................................ 7
22..11 HHooww ttoo eenntteerr tthhee ddaattaabbaassee .................................................................................................. 7
22..22 CCoouunnttrryy PPrrooffiillee ....................................................................................................................... 8
CCHHAAPPTTEERR 33 –– CCOONNSSIISSTTEENNCCYY OOFF TTRRAADDEE SSTTAATTIISSTTIICCSS ......................................................... 10
33..11 PPuurrppoossee ................................................................................................................................ 10
33..22 ““CCoonnssiisstteennccyy ooff TTrraaddee SSttaattiissttiiccss”” MMaaiinn MMeennuu ................................................................. 13
CCHHAAPPTTEERR 44 –– CCOONNSSIISSTTEENNCCYY IINNDDIICCAATTOORRSS ............................................................................. 16
44..11 MMeetthhooddoollooggyy ........................................................................................................................ 16
44..22 DDeessccrriippttiioonn ooff tthhee iinnddiiccaattoorrss .............................................................................................. 17
44..33 MMeeaanniinngg aanndd ccaallccuullaattiioonn ooff ddiissccrreeppaannccyy mmeeaassuurreess ....................................................... 21
44..44 TThhee SSccoorriinngg PPrroocceessss .......................................................................................................... 23
Table of Figures
Figure 1. Trade Competitiveness Map homepage .......................................................................... 7
Figure 2. Country Profile ..................................................................................................................... 8
Figure 3. Analysis applications ........................................................................................................... 9
Figure 4. Consistency of Trade Statistics interface ...................................................................... 13
Figure 5. Consistency of Trade Statistics homepage ................................................................... 15

ITC’s Market Analysis and Research – Consistency of Trade Statistics User Guide
International Trade Centre (ITC) 1
CCHHAAPPTTEERR 11 –– IINNTTRROODDUUCCTTIIOONN
11..11 OOvveerrvviieeww
Some sceptics consider trade statistics so unreliable that they simply disregard them
as a source of information. This view is not borne out by the experience of ITC.
Though trade statistics cannot provide precise information on traded values and
quantities, they do indicate orders of magnitude. There are, of course, a few
countries and a number of special products for which trade statistics are of little use.
Moreover, it is essential to maintain efforts towards further improving the quality of
trade statistics. Compared with most other economic data, however, merchandise
trade statistics tend to be fairly reliable, as they are by-products of customs control.
In contrast to statistics on value added production or savings, they relate to the
movement of physical goods that have to pass through a limited number of ports,
airports and other border stations, which are monitored by customs authorities.
Notwithstanding the attractiveness of this comprehensive source of information,
users of database and applications based on trade statistics should take into account
some of the weak points of foreign trade statistics.
Trade data are never complete. Smuggling and non-reporting represent a serious
problem in a number of countries. In addition, trade statistics - as any source of
information - are not free of mistakes and omissions.
Most countries include imports for re-exports and re-exports in their trade statistics.
A low-income country may be an exporter of airplanes simply because its national
airline has sold second-hand planes.
According to international conventions for reporting trade statistics, the export value
refers to the total or contract value, which may, of course, be very different from local
value added. For instance, for many processing activities, the local value added
remains below 20 per cent of the export value.

ITC’s Market Analysis and Research – Consistency of Trade Statistics User Guide
International Trade Centre (ITC) 2
Detailed trade statistics are available only for merchandise trade and not for
services, although the latter may account for a sizeable share of national exports.
Even at the lowest level of disaggregation, product groups in the trade
nomenclatures do not necessarily reflect trade names and often contain a wide
spread of different products. Moreover, the product nomenclature is sometimes
misleading. The labels of aggregated product groups are often very general and
provide at times only limited guidance on the leading items within the group of
products concerned.
Exchange rates fluctuations are not always properly recorded in international trade
statistics. Values are normally aggregated over the period of one year in local
currency and converted into US dollars.
For countries that do not report trade data to the United Nations, ITC uses partner
country data, an approach referred to as mirror statistics. Mirror statistics are a
second-best solution (better than having no data at all). At the same time, they have
a number of shortcomings when compared to the first-best solution of nationally
reported data. First and foremost, they do not cover trade with other non-reporting
countries. As a result, mirror statistics hardly cover South-South trade. For an
assessment of intra-African trade, for instance, mirror statistics are not a suitable
source of information. Second, there is the problem of transhipments, which may
hide the actual source of supply. Third, mirror statistics invert the reporting standards
by valuing exports in CIF1 terms (i.e. including transport cost and insurance) and
imports in FOB2 terms (excluding these items).
In view of the above shortcomings, trade statistics should never be the sole source
of insight but need to be complemented by other sources, and in particular cross-
checked by product specialists and industry insiders. Overall, ITC's experience
suggests that trade statistics represent a very useful source of information and a
valid point of departure for strategic market research, if analysed with a healthy mix
of scepticism and pragmatism vis-à-vis their strength and shortcomings.
1 Cost, Insurance and Freight.
2 Free on Board.

ITC’s Market Analysis and Research – Consistency of Trade Statistics User Guide
International Trade Centre (ITC) 3
In order to tackle this issue of "unreliability" or inconsistency of trade statistics, ITC
has developed two useful sources of information, which complement each other.
1. Technical notes on trade data
2. Indicators on consistency
These sources are both available on ITC's Trade Competitiveness Map sub-site at
http://www.intracen.org/ . While indicators on consistency show to which extent a
country's trade data is consistent with its partner customs declarations (hence
providing an assessment of discrepancies), technical notes on trade data try to
explain why trade data reported by one country may be not reliable or inconsistent
with other sources (including mirror estimates). Both sources of information try to
highlight the products and partner countries with potential problems, regarding the
analysis or the estimation of trade flows.
11..22 WWhhyy uussee TTrraaddee CCoommppeettiittiivveenneessss MMaapp
The International Trade Centre UNCTAD/WTO (ITC) has developed from the
previous Country Market Analysis Profiles (Country Map) the new Trade
Competitiveness Map with the explicit objective of facilitating strategic market
research, monitoring national trade performance and, designing and prioritizing the
trade development programs of both the business sector and trade support
institutions.
Trade Competitiveness Map addresses strategic market research from a country
perspective and is available on ITC’s Internet Web site http://www.intracen.org. This
Map includes a country’s Trade Performance Index, National Export Performance
and National Import Profile, Foreign Investment Statistics, Trade Statistics and the
Reliability of Trade Statistics.
Although the business community remains an indispensable source for such
information, it does not always have readily available or unbiased answers. Some
private consultancy firms gather large amounts of market research information,

ITC’s Market Analysis and Research – Consistency of Trade Statistics User Guide
International Trade Centre (ITC) 4
which is available for a substantial fee. There is much information available in the
public domain as well, if you know where to find it. However, the information and
tools offered by ITC’s Trade Competitiveness Map is unique in terms of its coverage,
methodological approach, and accessibility.
11..33 PPrroodduucctt NNoommeennccllaattuurree aanndd DDaattaa SSoouurrcceess
11..33..11.. PPrroodduucctt NNoommeennccllaattuurree
The “Consistency of Trade Statistics” module is based on the Harmonized System
(HS) 1996 edition (data is arranged in four-digit level).
The Harmonized System is an international nomenclature for the classification of
products published by the World Customs Organization (http://www.wcoomd.org). It
allows participating countries to classify traded goods on a common basis for
customs purposes. At the international level, the Harmonized System (HS) for
classifying goods is a six-digit code system. The HS comprises approximately 5,300
article/product descriptions that appear as headings and subheadings, arranged in
99 chapters, grouped in 21 sections. The six digits can be broken down into three
parts. The first two digits (HS-2) identify the chapter the goods are classified in, e.g.
09 = Coffee, Tea, Maté and Spices. The next two digits (HS-4) identify groupings
within that chapter, e.g. 09.02 = Tea, whether or not flavoured. The next two digits
(HS-6) are even more specific, e.g. 09.02.10 Green tea (not fermented)... Up to the
HS-6 digit level, all countries classify products in the same way (a few exceptions
exist where some countries apply old versions of the HS).
Beyond the six-digit level, the classification becomes national. Countries are free to
introduce national distinctions for tariffs by adding more digits to make the HS
classification of products even more specific. This greater level of specificity is
referred to as the national tariff line level. For example, Canada adds another two
digits to its exports and imports to classify them in greater depth, and the code
09023010 is the code for black tea, packaged as tea bags.

ITC’s Market Analysis and Research – Consistency of Trade Statistics User Guide
International Trade Centre (ITC) 5
11..33..22.. SSoouurrcceess ooff iinnffoorrmmaattiioonn
Different sources of information are contained in Trade Competitiveness Map. First,
Trade Competitiveness Map is based on the world’s largest database of trade
statistics, COMTRADE, maintained by the United Nations Statistics Division (UNSD)
- http://unstats.un.org/unsd/comtrade. COMTRADE covers more than 90% of world
trade or around 160 countries. Trade Competitiveness Map is able to present data
for an even larger number of countries and territories (around 180) by using both
reported and mirror statistics.
Reported data and mirrors statistics
Annual data is available not only for countries that report their own trade data, but
also for the primarily low-income countries that do not report national trade statistics
to COMTRADE.
When a country’s export data is not available, this study uses mirror statistics, i.e.
amounts reported by the importing rather than exporting country. This approach has
the advantage of covering the numerous non-reporting countries. At the same time,
mirror statistics have some shortcomings which need to be taken into account.
Firstly, contrary to international convention, these export data are expressed in C.I.F.
terms, i.e. cost, insurance and freight are included. As a general rule, C.I.F. values
tend to be about 10% higher than the free-on-board (F.O.B) values normally used for
exports. Secondly, mirror statistics only capture those exports of non-reporting
countries that are imports of the reporting countries. As a result, a major share of
trade among developing countries is excluded.
11..44 AAcccceessss ttoo tthhee ttooooll
Thanks to financial contributions from World Bank and ITC’s Global Trust Fund, ITC
has been able to provide free access to its market analysis tools to users in
developing countries.

ITC’s Market Analysis and Research – Consistency of Trade Statistics User Guide
International Trade Centre (ITC) 6
ITC is delighted to be able to respond to the growing demand for online access to its
trade intelligence tools.
Users in developing countries and economies in transition, can register to ITC
market analysis online tools through a common registration portal at
http://legacy.intracen.org/marketanalysis/
For users in developed countries, the tools are available on a subscription basis. You
may want to first register online for a one-week free trial to familiarise yourself with
the tools. Please visit our web page for more information on subscription option and
fees at http://legacy.intracen.org/marketanalysis/OptionsFees.aspx

ITC’s Market Analysis and Research – Consistency of Trade Statistics User Guide
International Trade Centre (ITC) 7
CCHHAAPPTTEERR 22 –– HHOOWW TTOO UUSSEE
22..11 HHooww ttoo eenntteerr tthhee ddaattaabbaassee
Figure 1. Intracen homepage which will grant you access to Trade Competitiveness Map.
By typing the URL address http://www.intracen.org/ into your Internet Address bar,
you will access to the ITC homepage. On the top right corner of the page, you have
the choice to switch from the English, to the French or Spanish version, and to
choose the text size as well.
Hereinafter the screen shots will always be of the generic English version of the tool.
Choose a country
Choose a different
language

ITC’s Market Analysis and Research – Consistency of Trade Statistics User Guide
International Trade Centre (ITC) 8
22..22 CCoouunnttrryy PPrrooffiillee
Figure 2. Country Profile
Once you select the country, you will be directed to the country’s profile page. This is
the main selection menu from which you can choose the different analysis tools.
The menu items highlighted in Figure 2 above provide you with access to the lists of
trade information sources and contacts concerning the country you selected, as well
as access to graphs and trade and investment data.

ITC’s Market Analysis and Research – Consistency of Trade Statistics User Guide
International Trade Centre (ITC) 9
Figure 3. Analysis applications
Figure 3 shows the list of the different options relative to the Competitiveness Trade
Map. We opened the different options relative to Trade and Investment Data.
Select the trade performance link you wish to visualize by clicking on the appropriate
link as shown in the figure above. In this example, click on ‘Consistency of Trade
Statistics’. This will automatically take you to the main interface of Trade
Competitiveness Map for the selected option.
This guide will present the functioning of the “Consistency of Trade Statistics”
module (from the export point of view). In order to have additional information on the
other modules of Trade Competitiveness Map, please consult the respective
downloadable User Guide.
Trade
Performance
links
Choose
Consistency of
Trade Statistics

ITC’s Market Analysis and Research – Consistency of Trade Statistics User Guide
International Trade Centre (ITC) 10
CCHHAAPPTTEERR 33 –– CCOONNSSIISSTTEENNCCYY OOFF TTRRAADDEE
SSTTAATTIISSTTIICCSS
33..11 PPuurrppoossee
As opposed to most economic data, such as production or consumption, there are
usually two records for merchandise trade data, since transactions are both recorded
by the customs offices in the exporting and the importing countries.
Hence, it is instructive to analyse the discrepancies between a country's export
statistics and the corresponding import statistics of its partner country (mirror
estimate). An approximate match of trade statistics and their mirror statistics is a
good sign of data reliability. Import figures should be slightly higher than export
figures, as they include freight and insurance costs, although these costs obviously
vary between products. An average difference of about 10% between import and
export figures is the norm.
There are many reasons to have discrepancies, described in box 1 hereafter.
However, in the context of high discrepancies, the trade analyst should question
himself which data source is the best, if any. Consequently, the next step would be
to look at information on the collection of trade data in the country under analysis.
Looking at ITC's technical notes on trade data or at the United Nations Statistics
Division website (http://www.un.org/depts/unsd) could help him in this respect. The
UNSD website contains very useful information on good practice in official statistics,
methods and classification. It also contains information on national reporting
practices in international merchandise trade statistics for around 140 countries.

ITC’s Market Analysis and Research – Consistency of Trade Statistics User Guide
International Trade Centre (ITC) 11
Box 1: Sources of discrepancies
There are, of course, many reasons for discrepancies. For a complete description,
see "Inconsistency between the reported imports and reported exports of trading
partners: An overview of the reasons for discrepancy". Revised note by WTO, Task
Force on International Trade statistics, Washington, March 1999. The different
reasons can be regrouped as follows:
1. Coverage and time of recording , of which:
a. Goods to be included or not (returned goods, vessels, emergency aid,
military goods)
b. Classification as goods or services (e.g. software)
c. Statistical threshold values (e.g. intra-EU trade)
d. Confidentiality (usually at the 6 digit level of the HS)
e. Simplification
f. Time lag in compilation (the time lag between the shipment and the arrival in
the country of destination)
g. Reference period (July-June or January-December)
h. Illegal and unrecorded trade (ex: cut flowers in Uganda)
2. Trade system (General/Special Trade Systems)3
3. Commodity classification (same goods under different headings)
4. Valuation, of which
a. CIF / FOB
b. Currency conversions
5. Quantity measurement (gross-net, units)
6. Partner country (transit trade or re-exports)
7. Errors and estimations
The statistical territory in the General Trade System is broader than in the Special
Trade System, since it includes both warehouses, commercial and industrial free
zones, whereas in the strict version of the Special Trade System, the statistical
3 For more information on General and Special Trade Systems and the differences between the two, refer to
http://www.un.org/depts/unsd

ITC’s Market Analysis and Research – Consistency of Trade Statistics User Guide
International Trade Centre (ITC) 12
territory is limited to the free circulation area of the country. Around 2/3 of the
countries use the General Trade System.
In this context, it is often difficult to assess the origin and the final destination for
goods that transit through one or even more countries. For example, many goods
transit through Hong-Kong, Panama, Dubai (Emirates) or the Netherlands.
Consequently, the Netherlands appear in the statistical databases as an exporter of
bananas to other EU countries, while it is clear that there is no local production.
Another famous case is Hong Kong, which functions as a major “international
marketing centre” for China, re-exporting Chinese production with an average
margin of around 30%. Chinese producers are often not aware of the final
destination of the products.

ITC’s Market Analysis and Research – Consistency of Trade Statistics User Guide
International Trade Centre (ITC) 13
33..22 ““CCoonnssiisstteennccyy ooff TTrraaddee SSttaattiissttiiccss”” MMaaiinn MMeennuu
Figure 4 shows the interface of the “Consistency of Trade Statistics” module. It is
composed of three drop-down menus that allow the user to select an object (Exports,
Imports or both), Country/Industry and year that he wants to analyse, as well as the
“options” links (Settings, Country metadata, Technical notes, Export data function).
On the other hand, Figure 5 shows the “Consistency of Trade Statistics” home page.
Figure 4. Consistency of Trade Statistics interface
Before starting, the user has to choose what type of analysis he wishes to conduct.
As for all modules of Trade Competitiveness Map, it is also possible with
“Consistency of Trade Statistics” to analyse and compare, at the same time, one
specific industry for all countries (Industry mode), or all industries of one single
country (Country mode). In order to choose the mode, the user simply has to click on
the relative button as shown in the figure below:
After choosing a mode of analysis, it is possible to consider the single domestic
industry (single country) going from a 2-digit level analysis to a 4-digit one by simply
clicking on the button at the beginning of every row of the results table.
Country mode
classification
Industry mode
classification

ITC’s Market Analysis and Research – Consistency of Trade Statistics User Guide
International Trade Centre (ITC) 14
In the “Country mode”, clicking on the first button next to one industry will open
4-digit results by that industry, while clicking on the second button will open
results by partner countries for the selected industry.
In the “Industry mode”, clicking on the first button next to one country will open 4-
digit results by that industry for the country under review, while clicking on the
second button will open results by partner countries for the selected industry.
4-digit results for the
respective industry
Results by partner countries
for the respective industry
4-digit results for the
selected country
Results by partner countries
for the selected country

ITC’s Market Analysis and Research – Consistency of Trade Statistics User Guide
International Trade Centre (ITC) 15
Figure 5. Consistency of Trade Statistics homepage

ITC’s Market Analysis and Research – Consistency of Trade Statistics User Guide
International Trade Centre (ITC) 16
CCHHAAPPTTEERR 44 –– CCOONNSSIISSTTEENNCCYY IINNDDIICCAATTOORRSS
HHooww rreelliiaabbllee aarree yyoouurr ccoouunnttrryy’’ss ttrraaddee ssttaattiissttiiccss??
WWhhaatt aarree tthhee ssppeecciiaall cchhaarraacctteerriissttiiccss iinn tthhee wwaayy aa ccoouunnttrryy rreeppoorrttss iittss
ttrraaddee ssttaattiissttiiccss tthhaatt yyoouu sshhoouulldd kknnooww??
44..11 MMeetthhooddoollooggyy
Trade statistics are a unique source of detailed, product-specific information on
global markets, primarily because they are generated as a by-product of customs
procedures. Yet, the reliability of trade data is far from perfect and users of trade
data need to be aware of the shortcomings of the country- and product-specific data
they analyze.
In support of users of trade data, ITC has established a facility that compares the two
observations typically available for each trade flow, namely the data of both the
exporting and importing countries. This section covers all countries reporting trade
data to the UNSD COMTRADE database. For each of these countries, it provides
four pages covering exports by leading products and exports by leading partner
countries, as well as imports by leading products and imports by leading partner
countries. Products are defined at the HS 2/HS 4-digit level.
It is worth mentioning the exclusion of a few reporting countries because these
territories are characterised by a large share of re-exports and their inclusion in the
sample would have generated additional noise of a systematic nature.

ITC’s Market Analysis and Research – Consistency of Trade Statistics User Guide
International Trade Centre (ITC) 17
44..22 DDeessccrriippttiioonn ooff tthhee iinnddiiccaattoorrss
As mentioned in the previous paragraph consistency indicators4 are calculated at the
2/4-digit level of the HS for almost all countries reporting data to the UNSD
COMTRADE database.
For each country, four tables have been constructed. Their purpose is to analyse
both imports and exports by partner country and by major product.
The different indicators are briefly defined as follows:
EXPORT VALUE REPORTED BY COUNTRY
Exports to the sample countries, as reported by the country under review
NUMBER OF PARTNER COUNTRIES
Number of active importing countries (values > 0), according to the country’s
statistics
EXPORTS TO THE REPORTING PARTNERS
Exports to countries that report their imports
NUMBER OF REPORTING PARTNERS
Number of active partner countries that report their imports
NON REPORTED EXPORTS AS %
Exports (as percentage) to the sample countries that do not report data (values
reconstructed by mirror estimates)
MIRROR ESTIMATES – VALUE
Sum of the imports of the sample countries from the country under review (mirror
estimate)
4 Consistency means by asymmetry “Discrepancy” that reflects the gap in official trade statistics between two
trading partner countries.

ITC’s Market Analysis and Research – Consistency of Trade Statistics User Guide
International Trade Centre (ITC) 18
MIRROR ESTIMATES - NUMBER OF PARTNERS
Estimated number of active importing countries (values > 0)
MEASURE OF DISCREPANCY - FROM DETAIL
Discrepancy defined as ratio of the absolute difference in official trade statistics to
total trade between two partner countries5
SCORING OF DISCREPANCY
Measures the magnitude of discrepancy (Very Low, Low, Average, High, Very
High)
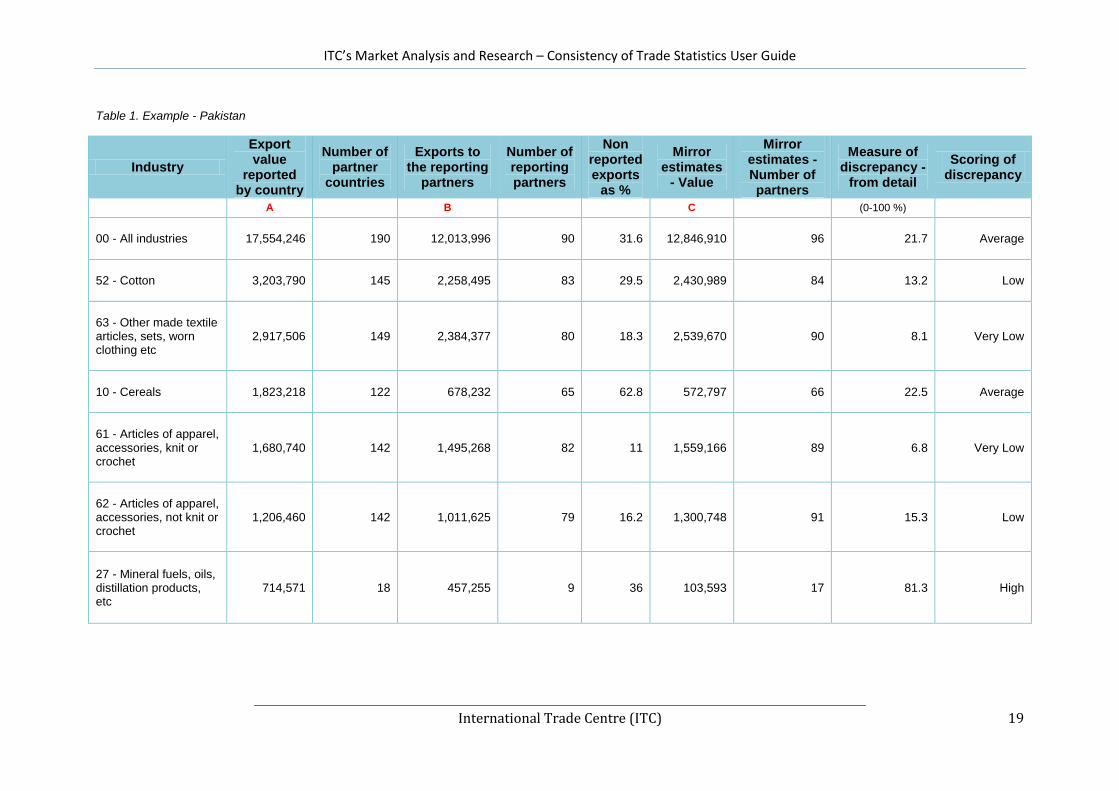
Examples
Table 1 provides an example of consistency indicators for Pakistani exports.
We can see from the table that the situation in Pakistan is not negative. Considering
all exporting industries, the score of discrepancy is medium, as there are some
industries that are performing very well and some others that are very critical.
For example, data consistency for textile related industries (“Cotton”, “Other made
textile articles, sets, worn clothing etc”) is very good while for others, like “Mineral
fuels, oils, distillation products”, the performance is very negative.
On the other hand, Table 2 provides an example of consistency indicators for the
“Products of animal origin, nes" industry.
We can conclude that the situation is quite different from country to country. Some
countries are performing very well, while some others are doing less well, but there
does not seem to be a geographical bias.
5 Calculation of the measures of discrepancy, see the following sections.
ITC’s Market Analysis and Research – Consistency of Trade Statistics User Guide
International Trade Centre (ITC) 19
Table 1. Example - Pakistan
Industry
Export value
reported by country
Number of partner
countries
Exports to the reporting
partners
Number of reporting partners
Non reported exports
as %
Mirror estimates
- Value
Mirror estimates - Number of partners
Measure of discrepancy -
from detail
Scoring of discrepancy
A
B
C
(0-100 %)
00 - All industries
17,554,246 190 12,013,996 90 31.6 12,846,910 96 21.7 Average
52 - Cotton
3,203,790 145 2,258,495 83 29.5 2,430,989 84 13.2 Low
63 - Other made textile articles, sets, worn clothing etc
2,917,506 149 2,384,377 80 18.3 2,539,670 90 8.1 Very Low
10 - Cereals
1,823,218 122 678,232 65 62.8 572,797 66 22.5 Average
61 - Articles of apparel, accessories, knit or crochet
1,680,740 142 1,495,268 82 11 1,559,166 89 6.8 Very Low
62 - Articles of apparel, accessories, not knit or crochet
1,206,460 142 1,011,625 79 16.2 1,300,748 91 15.3 Low
27 - Mineral fuels, oils, distillation products, etc
714,571 18 457,255 9 36 103,593 17 81.3 High

ITC’s Market Analysis and Research – Consistency of Trade Statistics User Guide
International Trade Centre (ITC) 20
Table 2. Example - "Products of animal origin, nes" industry
Country
Export value
reported by
country
Number of
partner
countries
Exports to
the reporting
partners
Number of
reporting
partners
Non
reported
exports as
%
Mirror
estimates -
Value
Mirror
estimates -
Number of
partners
Measure of
discrepancy -
from detail
Scoring of
discrepancy
Exports
(0-100 %)
China 1,217,600 101 786,820 67 35.4 872,946 69 20.6 Average
Germany 700,309 114 500,062 72 28.6 437,070 67 15.2 Low
Brazil 391,108 91 339,604 49 13.2 224,852 45 48.3 High
France 221,525 95 176,484 62 20.3 140,468 61 18.7 Low
New Zealand 217,771 77 183,195 49 15.9 117,065 51 41.5 High
Canada 173,175 101 152,357 65 12 142,092 65 9.4 Very Low
Taipei Chinese 125,100 42 44,337 27 64.6 53,216 31 19.6 Low
United Kingdom 104,838 79 73,320 52 30.1 71,395 54 26.8 Average

ITC’s Market Analysis and Research – Consistency of Trade Statistics User Guide
International Trade Centre (ITC) 21
44..33 MMeeaanniinngg aanndd ccaallccuullaattiioonn ooff ddiissccrreeppaannccyy mmeeaassuurreess
In order to determine the reliability of trade statistics, three different measures of
discrepancy are calculated: simple, relative and from detail. However, to simplify the
use of the application, the latter will only show the “discrepancy from detail”, because
it provides more information than the other two indicators and allows the user to
identify the critical areas where the analysis should be directed.
The meaning and calculation of the different various measures of discrepancy are
briefly defined as follows:
Simple measure of discrepancy
Defined as the difference between mirror estimates and exports to the reporting
partners. It takes a value between -∞ and +∞. A positive (negative) value means that
estimated exports are higher (lower) than recorded imports from partners countries.
The more the value of this indicator is far from zero, the less reliable the statistic will
be. The user will have to investigate the possible causes of that.
Relative measure of discrepancy
Defined as the ratio between simple discrepancy and the sum of mirror estimates
and exports to the reporting partners:
( )
( )
The value of this indicator varies between -100% (C=0, B0) and 100% (B=0, C0).
If B (mirror estimates) is twice bigger than C (reported data) then the discrepancy = -
33.3% (for example, (C- 2C)/(C+2C)). Since import statistics include freight and
insurance costs, we usually can expect a positive value (close to 5%).
This indicator is calculated for all products at the 4/2-digit level of the Harmonized
System and single results are aggregated.

ITC’s Market Analysis and Research – Consistency of Trade Statistics User Guide
International Trade Centre (ITC) 22
The final value provides an overall picture of the reliability of trade statistics, but it is
less indicative than the discrepancy given by the “from detail” one: the simple
discrepancy is divided for a country’s total trade and this, in some cases, may
strongly compensate different values (partner countries’ performance), with the
consequence of getting an underestimated final result.
Measure of discrepancy from detail
Defined as the relative deviations, the indicator is calculated as follows:
∑ | |
∑ ( )
represents the exports of the country under review to country C; are country's i
imports from the country under review, and n is the number of partner countries.
The value of this indicator varies between 0% and 100%. The lower the value of d’,
the lower the size of the discrepancies, and therefore, the higher the degree of
consistency. For example, a value of 10% indicates a stronger level of consistency of
trade statistics than a value of 20%.
This indicator is calculated for each trade partner and for all sectors at the 2/4-digit
level of Harmonized System. Then single results are merged with a simple average.
The final value provides a more precise picture on trade statistics’ reliability than the
relative discrepancy’s one: the simple discrepancy is calculated for bilateral relations
and divided for bilateral trade and this, eliminating the problem of underestimation,
gives an accurate final result.
Basically, high values of this index indicate problems with specific countries and,
once these countries identified, the user could direct the analysis to find possible
causes of these situations.

ITC’s Market Analysis and Research – Consistency of Trade Statistics User Guide
International Trade Centre (ITC) 23
44..44 TThhee SSccoorriinngg PPrroocceessss
To understand the discrepancy level, a qualitative index is calculated: “Scoring of
Discrepancy”. The scoring process behind this indicator is defined as follows:
If Indicator < 0.1 then Scoring =5; Very Low;
Else if Indicator < 0.2 then Scoring =4; Low;
Else if Indicator < 0.3 then Scoring =3; Average or Medium;
Else if Indicator < 0.4 then Scoring =2; High;
Else if 0.4 < Indicator ≤ 1 then Scoring =1; Very High.
Possible reasons for trade statistics discrepancy
There can be multiple sources of discrepancy of trade statistics. The main ones are
related to differences in the recording system, to registration errors, and to the
exchange rate effect.
Differences in the recording system: these are due to various factors such as
inclusion or exclusion of particular commodities, timing (time of recording),
including valuation (Imports CIF, Exports FOB)6.
Registration errors: these are problems related to the treatment of low-value
transactions, unregistered cross-border trade (for example Africa informal trade),
missing or incomplete information (commodity classification), quantity
measurement and partner country, and the intentionally incorrect reporting to
avoid tariffs and quotas. Some countries do not register below a threshold (JPN,
CAN, AUS, etc).
The “Exchange Rate” effect: this effect consists in a distortion in
the estimation of exports due to an unexpected change in the currency exchange
rate that causes significant changes in the trade flows.
Geographic Coverage: problems could occur if a country includes (or not) some
geographical areas in the count of trade statistic. For example, the United States
includes trade with Puerto Rico and the U.S. Virgin Islands in its merchandise
trade statistics. In contrast, Mexico treats them as separate trading partners.
6 See Box 2.

ITC’s Market Analysis and Research – Consistency of Trade Statistics User Guide
International Trade Centre (ITC) 24
Similar problems occur with China and its administrative provinces (Hong Kong,
Taipei, Macau etc).
Non-filing of exports: single national export regulations may require the reporting
of all export transactions valued over a certain value. Some companies,
however, do not submit all the required declarations, especially companies
exporting out of foreign trade zones.
Low value transactions: some countries do not include transactions valued below
a certain value in their export trade statistics, while others record instead all
trade transactions, regardless of value.
Box 2. What do CIF and FOB mean?
FOB (free on board) means the seller’s obligation to deliver is fulfilled when the
goods have passed over the ship’s rail at the named port of shipment. Then the
buyer has to bear all costs and risks of loss or of damage to goods from that named
point.
CIF (Cost including insurance and freight) means the seller must pay the costs and
freight necessary to bring the goods to named port of destination, but the risk of loss
or of damage to the goods, as well as any additional costs due to events occurring
after the time the goods have been delivered on board vessel, is transferred from the
seller to the buyer when the goods pass the ship’s rail in the port of shipment. In
addition, the seller has to procure marine insurance against the buyer’s risk of loss or
of damage to goods during the carriage. The seller contracts for insurance and pays
the insurance premium.

ITC’s Market Analysis and Research – Consistency of Trade Statistics User Guide
International Trade Centre (ITC) 25