Embed Size (px)
Citation preview

Considerations of Multicenter Studies in Cancer Epidemiology
Yuan-Chin Amy Lee, PhD
Epidemiology 244
Spring 2009

Motivation (I): statistical power
Meta-analysis can only rely on already calculated estimates with variable adjustments Dose-response (?) Stratified analysis (?) Interaction (?)
Early onset of disease outcome Non-smokers Non-drinkers

Motivation (II)

Motivation (III)
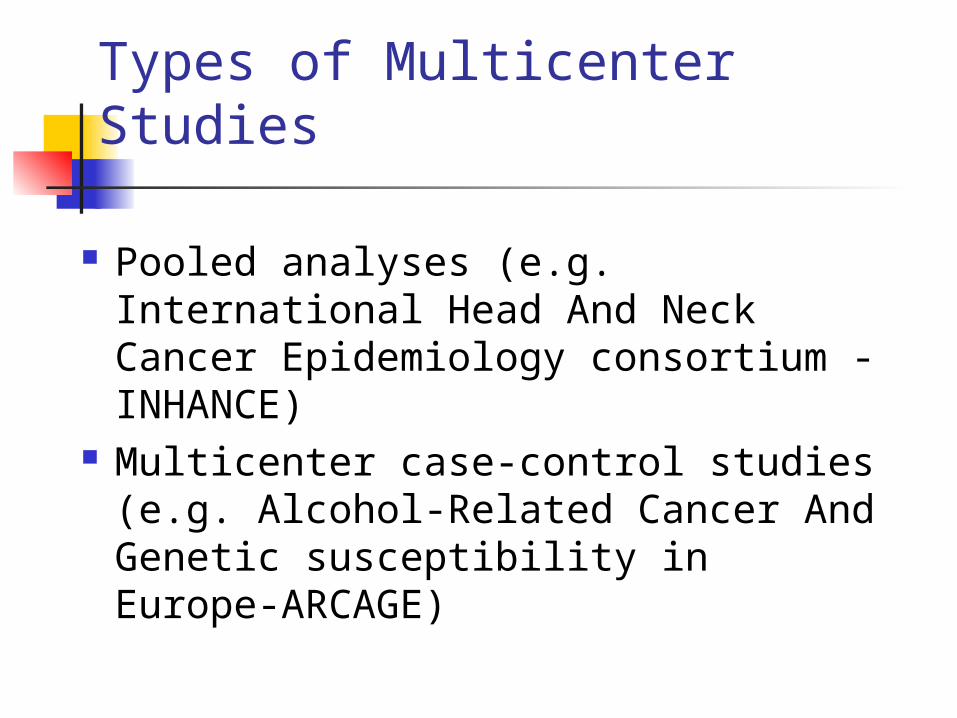
Types of Multicenter Studies
Pooled analyses (e.g. International Head And Neck Cancer Epidemiology consortium -INHANCE)
Multicenter case-control studies (e.g. Alcohol-Related Cancer And Genetic susceptibility in Europe-ARCAGE)

Definition of Pooled Analyses Obtaining raw data from individual
studies Transforming these datasets into a
common format Merging the data together for
analysis

The Difference between A Meta-Analysis and A Pooled Analysis
Meta-analysis Using published risk estimates
Pooled analysis Using individual level data
Inconsistency in terminology use

Steps for Pooled Analysis
Study selection Inclusion and exclusion criteria development Data request Data validation
Data standardization Data analysis
Pooled estimates Heterogeneity test Publication bias assessment Subgroup and stratified analyses

Study Selection (I)
To collect a list of relevant studies To tabulate the study design, laboratory
methods, and analysis of the data To set inclusion and exclusion criteria

Study Selection (II): study design
Cross-section e.g. markers of exposure
Case-control e.g. genetic markers
Cohort Limit recall and selection bias

Study Selection (III)
Criteria Appropriate source population Sample size Relevant variables Appropriate measurement methods

Data Request (I)
Determine variables to be included Send invitation letters Make sure data are anonymous

Data Request (II): pre-questionnaireThe Follow-up Data Availability Questionnaire
Please return this questionnaire to xxx DATE dd/ mm/ yyyy
Investigator
Number of case Study location
Follow-up completed?
If not, are there plans for?
If planned, please mark the boxes for which you plan to get information on
Type of follow-up information on the subjects … Please mark the box when the information is available
Stage of Index Primary Cancer (State whether clinical or pathologic stage)
Grade of primary cancer
Date of last follow-up
Vital Status (i.e., Alive vs. Dead)
Date of death
Cause of death (ICD-10)
Recurrence Status
Date of recurrence diagnosis
Histology of recurrence
Grade of recurrence
If 2nd primary cancer
Date of diagnosis of 2nd primary cancer
Site of 2nd primary cancer (ICDO-2)
Histology of 2nd primary cancer
Stage of 2nd primary cancer (state the method use to distinguished metastasis from primary cancer)

Data Validity
Evaluate the reliability of the evidence from each study
Apply a quality scoring system

Data Standardization (I)
Standardization of variables of interest (both independent and dependent variables)
Possible solution: post-hoc data standardization, categorization of data within each study, application of statistical modeling for correlated data
Collection of a minimum set of epidemiological variables

Data Standardization (II): Questionnaire Wording
Childhood Spouse
1. Central Europe
Non-smokers only
Ever Did your husband/wife/partner smoke cigarettes?
Other How many did he or she smoke per day?Duration During which period did they smoke (from year to year)?
Frequency On average, how many hours per day did you spend in the same room with them?
Intensity
6. Tampa, Florida
Non-smokers only
Ever Up to 18 yo, did anyone in your household smoke in your presence? > 18 yo, did anyone in your household smoke in your presence?
Duration/Frequency Who, type of tobacco, hours/day, total years exposed Who, type of tobacco, packs/day, hours/day, total years, present exposure
OtherDid you know if your mother smoked when she was pregnant with you?
Other
7. Puerto Rico
Non-smokers and Ever-married (interviewee could be a relative)
EverDid your spouse or significant other ever smoke any tobacco products while living with you? (only refer to the one with whom you have lived the longest)
DurationHow many years did your spouse or significant other smoke while living with you?
FrequencyApproximately how much did your spouse or significant other smoke per day or per week while living with you?
OtherDid your spouse or significant other smoke cigarettes, cigars, a pipe, or a combination of these?
8. South America
Non-smokers only
Ever Have you been married (or living as married) with a smoker?
Duration/FrequencyPlease describe the smoking habit of your spouse in your presence: From age, To age, # of hours/day during which your spouse smoked in your presence (weekdays and weekends)
10. Los Angeles
All EverBefore age 18, did anyone in your household smoke cigarettes, cigars, or pipes regularly at home for a period of one year or more?
Sicne age 18, did anyone in your household smoke cigarettes, cigars, or pipes regularly at home for a period of one year or more?
Relationship Relationship to the subject Relationship to the subjectStarting age Age of the start of interval Age of the start of intervalDuration Years of exposure to passive smoking at home Years of exposure to passive smoking at home
15. Houston
All Ever Have you ever been regularly exposed to other people's cigarette smoke at home? (1:Never; 2: Occasionally; 3:Regularly
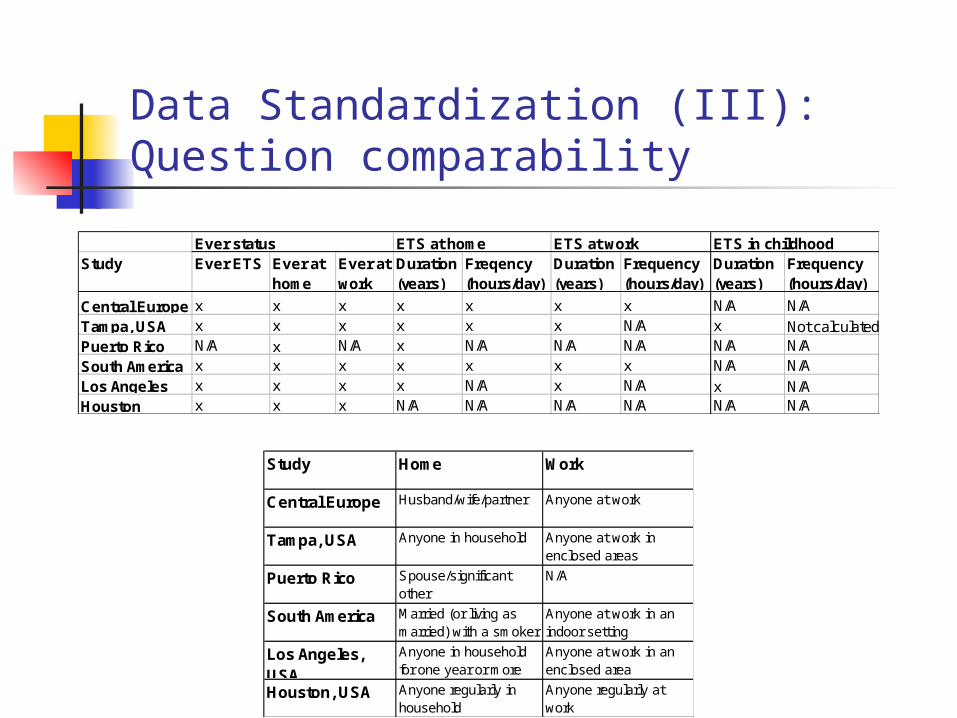
Data Standardization (III): Question comparability
Study Home Work
Central Europe Husband/wife/partner Anyone at work
Tampa, USA Anyone in household Anyone at work inenclosed areas
Puerto Rico Spouse/significantother
N/A
South America Married (or living asmarried) with a smoker
Anyone at work in anindoor setting
Los Angeles,USA
Anyone in householdfor one year or more
Anyone at work in anenclosed area
Houston, USA Anyone regularly inhousehold
Anyone regularly atwork
Study Ever ETS Ever at home
Ever at work
Duration (years)
Freqency (hours/day)
Duration (years)
Frequency (hours/day)
Duration (years)
Frequency (hours/day)
Central Europe x x x x x x x N/A N/ATampa, USA x x x x x x N/A x Not calculatedPuerto Rico N/A x N/A x N/A N/A N/A N/A N/ASouth America x x x x x x x N/A N/ALos Angeles x x x x N/A x N/A x N/AHouston x x x N/A N/A N/A N/A N/A N/A
Ever status ETS at home ETS at work ETS in childhood

Definition of Ever Smokers in Each StudyStudy Definition
Milan 1 cig/ day for 1 year (≥ 365 cigarettes)
Aviano 1 cig/ day for 1 year (≥ 365 cigarettes)
France (Benhamou)* Regularly
Italy Multicenter 1 cig/ day for 1 year (≥ 365 cigarettes)
Switzerland 1 cig/ day for 1 year (≥ 365 cigarettes)
Central Europe ≥100 cigarettes
NY multicenter Once a day for ≥1 year (≥ 365 cigarettes)
Seattle >100 cigarettes (note: more than 100, not 100 or more)
Iowa ≥1/ 2 pack/ week for ≥1 year (≥ 520 cigarettes)
North Carolina ≥100 cigarettes
Tampa 1 cig/ day for ≥1 year (≥ 365 cigarettes)
Los Angeles ≥100 cigarettes
Houston ≥100 cigarettes
Puerto Rico ≥100 cigarettes
Latin America 1 cig/ day for ≥1 year (≥ 365 cigarettes)
Intl Multicenter 1 cig/ day for ≥1 year (≥ 365 cigarettes)
Boston ≥100 cigarettes
Rome Current or former cigarette smoker
USmulticenter ≥100 cigarettes before one year ago
Sao Paulo Smoke at least 1 cigarette, cigar, pipe, or straw cigarette a day for
1 year

Data Analysis: Forest Plot
(Hashibe 2007 JNCI)
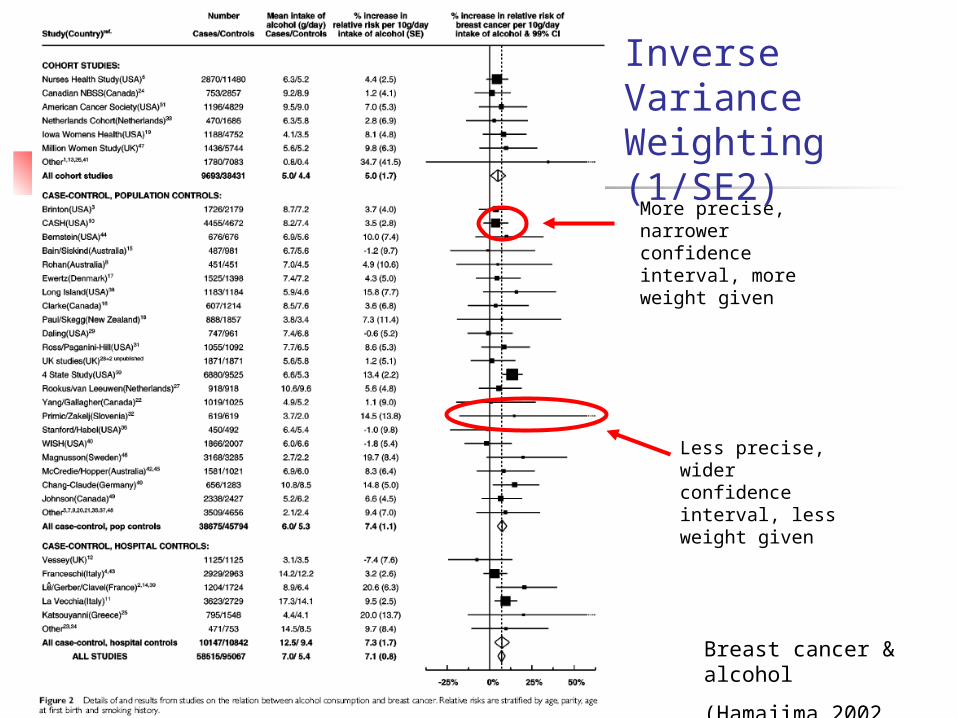
Breast cancer & alcohol
(Hamajima 2002 BJC)
Less precise, wider confidence interval, less weight given
More precise, narrower confidence interval, more weight given
Inverse Variance Weighting (1/SE2)

Heterogeneity Test
Heterogeneity: there are differences in the risk estimates across certain strata
Heterogeneity due to the different distribution of risk factors vs. attributable to external variables
Use of univariate analysis to evaluate the possible source of heterogeneity
Removal of outliers with no obvious explanation
It is inappropriate to calculate the summary estimate if there is heterogeneity

Heterogeneity It is important to assess & present characteristics of
the individual study, to examine sources of heterogeneity
Examples of characteristics to assess: Study design Sample size Study location Study period Subject eligibility criteria Ascertainment methods Matching of controls Definition of disease (histology?) Exposure assessment methods

Test for Heterogeneity
A test of the hypothesis θi = θ for all i is a test for true differences between studies
Small p-value reject homogeneity

Heterogeneity

Fixed Effects Model vs. Random Effects Model
Expected value of a study estimate is modeled as a fixed function of measured study characteristics
Disadvantages Assumption of a true
effect fixed across all studies
Within group homogeneity assumption not realistic
Allows for heterogeneity between studies for unknown sources
More conservative (usually the estimate does not change but CI widens), but not always
Disadvantages Smaller studies are given
more weight than in fixed model
If there is substantial heterogeneity, it may be inappropriate to summarize RRs
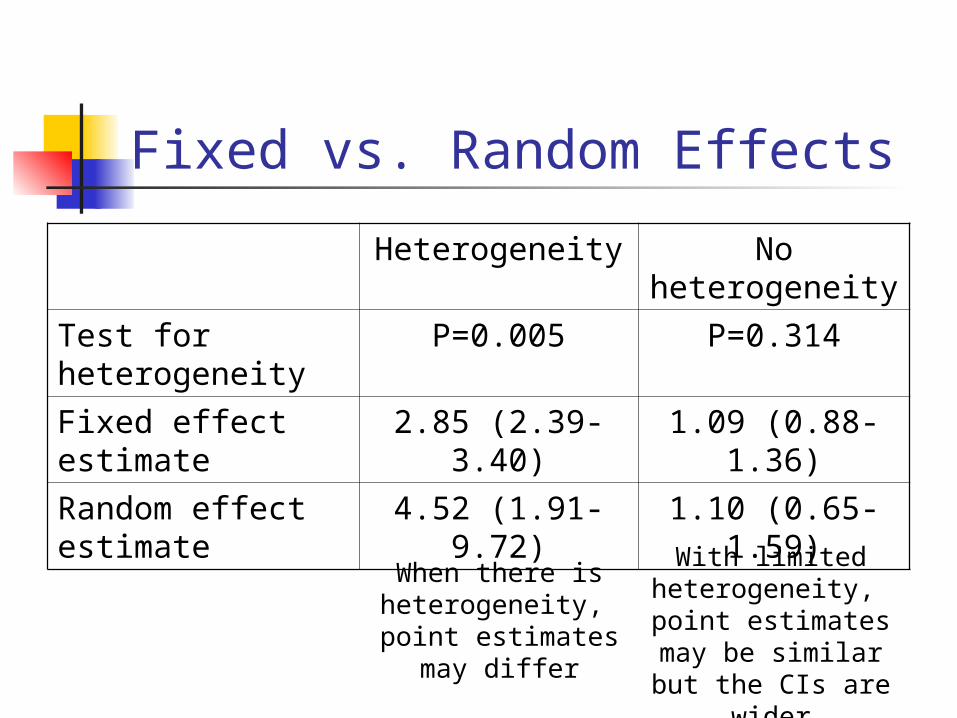
Fixed vs. Random Effects
Heterogeneity No heterogeneity
Test for heterogeneity
P=0.005 P=0.314
Fixed effect estimate
2.85 (2.39-3.40) 1.09 (0.88-1.36)
Random effect estimate
4.52 (1.91-9.72) 1.10 (0.65-1.59)
When there is heterogeneity,
point estimates may differ
With limited heterogeneity,
point estimates may be similar but the CIs
are wider

Publication Bias
Definition: a tendency of journals to accept preferentially papers reporting an association over papers reporting no association
Comparison of the frequency of relevant variables before pooling
Assessment of inclusion bias

Tests for Publication Bias Funnel-plot assymetry
Rank correlation method (Begg & Mazumdar, 1994)
A direct statistical analogue of the visual funnel graph Power for detecting bias is limited, publication bias cannot be
ruled out if test is not significant Tests for correlation between effect estimates and their
variances
Weighted regression (Egger et al, 1997) Suggests presence of publication bias more frequently than the
Begg approach Detects funnel plot assymetry by determining whether the
intercept deviates significantly from zero in a regression of standardized effect estimates against their precision
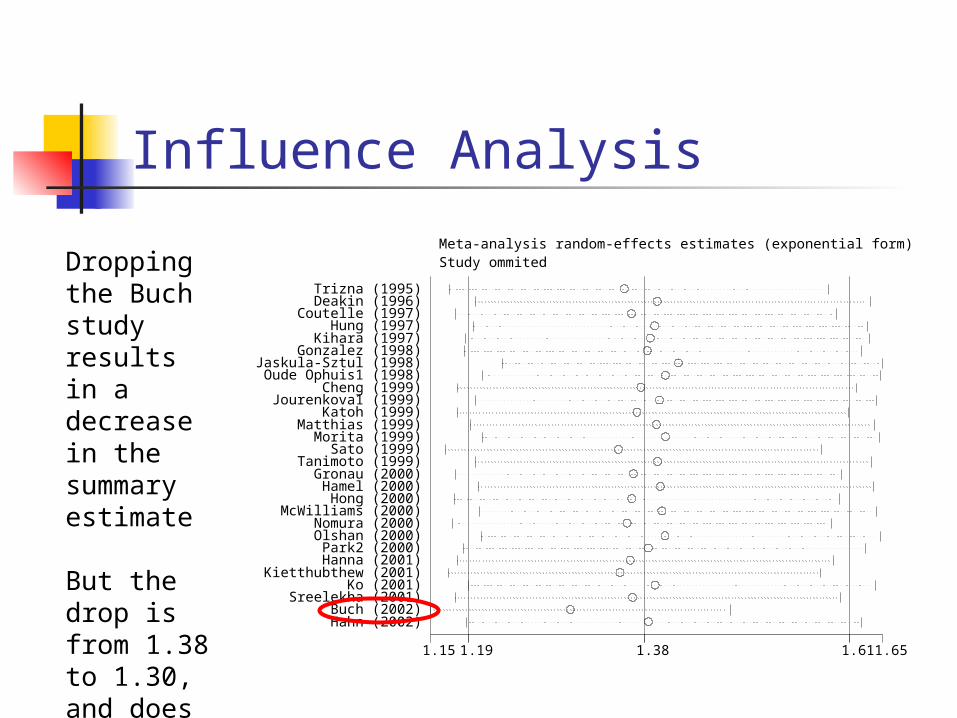
Influence Analysis
1.15 1.38 1.19 1.61 1.65
Trizna (1995) Deakin (1996)
Coutelle (1997) Hung (1997)
Kihara (1997) Gonzalez (1998)
Jaskula-Sztul (1998) Oude Ophuis1 (1998)
Cheng (1999) Jourenkova1 (1999)
Katoh (1999) Matthias (1999)
Morita (1999) Sato (1999)
Tanimoto (1999) Gronau (2000) Hamel (2000) Hong (2000)
McWilliams (2000) Nomura (2000) Olshan (2000) Park2 (2000)
Hanna (2001) Kietthubthew (2001)
Ko (2001) Sreelekha (2001)
Buch (2002) Hahn (2002)
Study ommited Meta-analysis random-effects estimates (exponential form)
Dropping the Buch study results in a decrease in the summary estimate
But the drop is from 1.38 to 1.30, and does not change the inference

Influence Analysis
Systematic Reviews in Health Care, 2nd edition
In this example, dropping the ISIS-4 study changes the inference from no association, to a protective association.
Thus it would be inappropriate to conclude there is no association.

Examples of Pooled Analyses
INternational Head And Neck Cancer Epidemiology (INHANCE) consortium (inhance.iarc.fr)
International Lung Cancer COnsortium (ILCCO) (ilcco.iarc.fr)
International Liver Cancer Study (ILCS) (ilcs.iarc.fr)


Relevant References for Pooled Analysis
C. Wild, P. Vineis, S. Garte. Molecular Epidemiology of Chronic Diseases. (Chapter 15)

Multicenter Studies

Multicenter Studies
Definition: a clinical trial that is carried out at more than one medical institution

Advantages & Disadvantages
Advantages over pooled analyses Designed for the same objectives Same questionnaire More complete adjustment variables
Disadvantages More time and efforts to reach consensus
among colloaborators (e.g. to agree on one set of questionniare, to analyze the data, etc.)

An Example of Multicenter Case-Control Study
The association between tobacco smoking and upper-aerodigestive-tract cancer risk in western Europe (ARCAGE study)

Variable Issues for Education

Oslo
Bremen
Edinburgh
ManchesterNewcastle
Dublin
Prague
Inserm
Barcelona
AvianoPadova Zagreb
Tartu
Athens
Study period 2002-2005
16 research centers
UADT cancer in Europe
2103 cases/2221 controls
European Commission grant (QLK1-CT2001-00182)
Alcohol-Related Cancers And Genetic Susceptibility in Europe (ARCAGE)
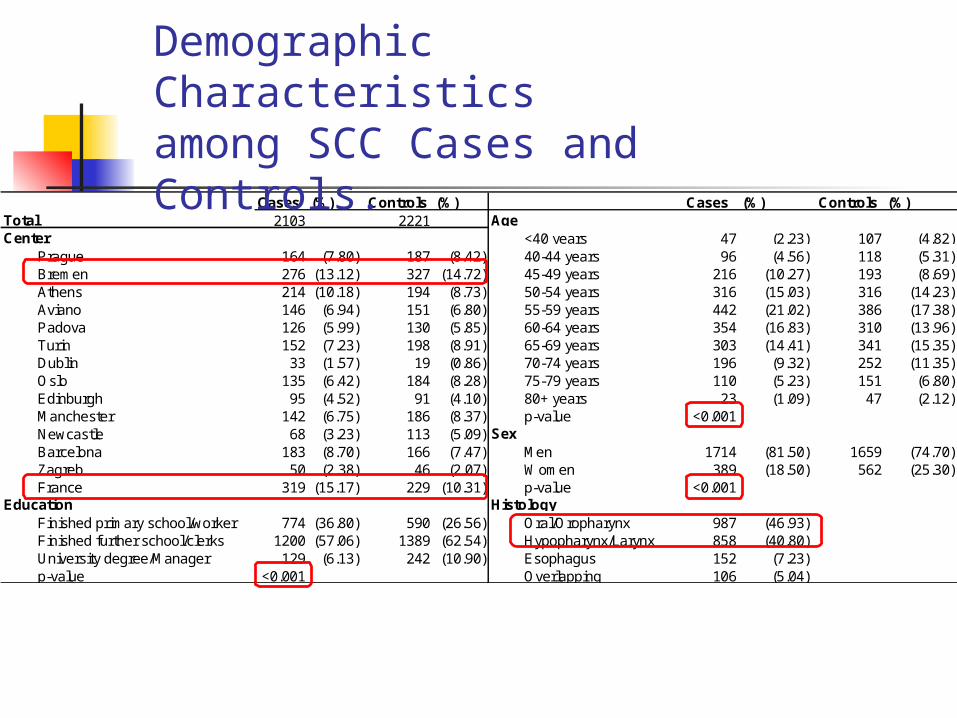
Cases (%) Controls (%) Cases (%) Controls (%)Total 2103 2221 AgeCenter <40 years 47 (2.23) 107 (4.82)
Prague 164 (7.80) 187 (8.42) 40-44 years 96 (4.56) 118 (5.31)Bremen 276 (13.12) 327 (14.72) 45-49 years 216 (10.27) 193 (8.69)Athens 214 (10.18) 194 (8.73) 50-54 years 316 (15.03) 316 (14.23)Aviano 146 (6.94) 151 (6.80) 55-59 years 442 (21.02) 386 (17.38)Padova 126 (5.99) 130 (5.85) 60-64 years 354 (16.83) 310 (13.96)Turin 152 (7.23) 198 (8.91) 65-69 years 303 (14.41) 341 (15.35)Dublin 33 (1.57) 19 (0.86) 70-74 years 196 (9.32) 252 (11.35)Oslo 135 (6.42) 184 (8.28) 75-79 years 110 (5.23) 151 (6.80)Edinburgh 95 (4.52) 91 (4.10) 80+ years 23 (1.09) 47 (2.12)Manchester 142 (6.75) 186 (8.37) p-value <0.001Newcastle 68 (3.23) 113 (5.09) SexBarcelona 183 (8.70) 166 (7.47) Men 1714 (81.50) 1659 (74.70)Zagreb 50 (2.38) 46 (2.07) Women 389 (18.50) 562 (25.30)France 319 (15.17) 229 (10.31) p-value <0.001
Education HistologyFinished primary school/worker 774 (36.80) 590 (26.56) Oral/Oropharynx 987 (46.93)Finished further school/clerks 1200 (57.06) 1389 (62.54) Hypopharynx/Larynx 858 (40.80)University degree/Manager 129 (6.13) 242 (10.90) Esophagus 152 (7.23)p-value <0.001 Overlapping 106 (5.04)
Demographic Characteristics among SCC Cases and Controls.

Ca Co OR 95% CITobacco smoking status
never 108 712 1.00former 201 741 1.78 ( 1.35 - 2.35 )current 659 714 5.78 ( 4.47 - 7.49 )
Tobacco smoking intensityNever 108 712 1.00>0-2 cigarettes/day 14 44 2.43 ( 1.26 - 4.68 )3-4 cigarettes/day 18 49 2.77 ( 1.52 - 5.06 )5-10 cigarettes/day 89 301 1.93 ( 1.39 - 2.68 )11-20 cigarettes/day 384 597 4.23 ( 3.25 - 5.51 )>20 cigarettes/day 350 461 4.81 ( 3.61 - 6.43 )
Tobacco smoking durationNever 108 712 1.001-20 years 78 404 1.28 ( 0.91 - 1.79 )21-40 years 489 736 3.76 ( 2.90 - 4.88 )>40 years 289 313 6.73 ( 4.99 - 9.06 )
Tobacco age at startNever 108 712 1.0020+ years 239 423 3.09 ( 2.32 - 4.13 )15-19 years 419 756 2.65 ( 2.02 - 3.48 )<15 years 196 274 2.69 ( 1.94 - 3.73 )
Smoking status & packyears*Never 108 712 1.00former (>0-20 py) since >=20 yr 39 263 1.07 ( 0.71 - 1.62 )former (>20 py) since >=20 yr 19 95 1.51 ( 0.86 - 2.67 )former (>0-20 py) since <20 yr 40 132 2.15 ( 1.41 - 3.27 )former (>20 py) since <20 yr 103 247 3.00 ( 2.15 - 4.19 )current (>0-20 py) 100 219 3.38 ( 2.41 - 4.72 )current (21-40 py) 259 258 6.70 ( 4.99 - 9.01 )current (>40 py) 297 244 8.46 ( 6.22 - 11.51 )
0 1 10
Oral Cavity & Oropharynx
p <0.001
p <0.001
p <0.001
p <0.001

Ca Co OR 95% CITobacco smoking status
Never 35 712 1.00Former 221 741 4.21 ( 2.85 - 6.21 )Current 570 714 11.79 ( 8.06 - 17.26 )
Tobacco smoking intensityNever 35 712 1.00>0-2 cigarettes/day 9 44 3.91 ( 1.71 - 8.93 )3-4 cigarettes/day 8 49 3.14 ( 1.35 - 7.27 )5-10 cigarettes/day 53 301 3.25 ( 2.05 - 5.17 )11-20 cigarettes/day 320 597 8.21 ( 5.60 - 12.05 )>20 cigarettes/day 397 461 10.78 ( 7.28 - 15.96 )
Tobacco smoking durationNever 35 712 1.001-20 years 50 404 2.09 ( 1.31 - 3.34 )21-40 years 431 736 7.67 ( 5.25 - 11.21 )>40 years 307 313 12.97 ( 8.68 - 19.39 )
Tobacco age at startNever 35 712 1.0020+ years 223 423 5.32 ( 3.54 - 7.99 )15-19 years 386 756 4.74 ( 3.20 - 7.03 )<15 years 180 274 4.32 ( 2.78 - 6.70 )
Smoking status & packyears*Never 35 712 1.00former (>0-20 py) since >=20 yr 27 263 1.80 ( 1.05 - 3.07 )former (>20 py) since >=20 yr 22 95 2.84 ( 1.55 - 5.22 )former (>0-20 py) since <20 yr 29 132 4.54 ( 2.64 - 7.81 )former (>20 py) since <20 yr 146 247 8.30 ( 5.47 - 12.59 )current (>0-20 py) 46 219 4.63 ( 2.84 - 7.56 )current (21-40 py) 200 258 13.66 ( 9.07 - 20.58 )current (>40 py) 325 244 17.64 ( 11.75 - 26.50 )
0 1 10 100
Hypopharynx & larynx
p <0.001
p <0.001
p <0.001
p <0.001
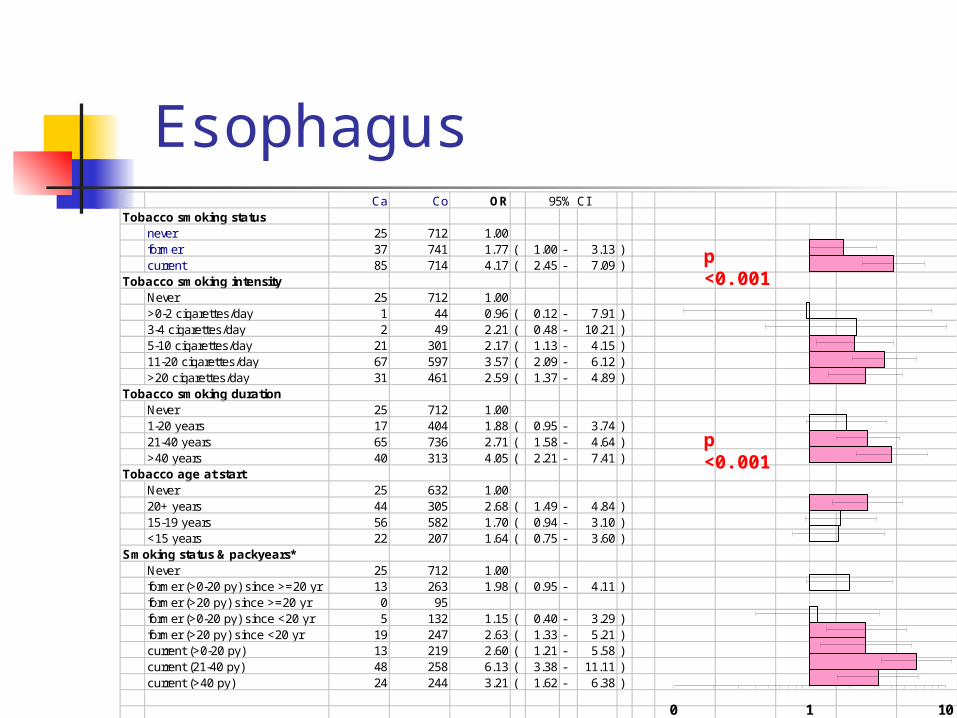
Ca Co OR 95% CITobacco smoking status
never 25 712 1.00former 37 741 1.77 ( 1.00 - 3.13 )current 85 714 4.17 ( 2.45 - 7.09 )
Tobacco smoking intensityNever 25 712 1.00>0-2 cigarettes/day 1 44 0.96 ( 0.12 - 7.91 )3-4 cigarettes/day 2 49 2.21 ( 0.48 - 10.21 )5-10 cigarettes/day 21 301 2.17 ( 1.13 - 4.15 )11-20 cigarettes/day 67 597 3.57 ( 2.09 - 6.12 )>20 cigarettes/day 31 461 2.59 ( 1.37 - 4.89 )
Tobacco smoking durationNever 25 712 1.001-20 years 17 404 1.88 ( 0.95 - 3.74 )21-40 years 65 736 2.71 ( 1.58 - 4.64 )>40 years 40 313 4.05 ( 2.21 - 7.41 )
Tobacco age at startNever 25 632 1.0020+ years 44 305 2.68 ( 1.49 - 4.84 )15-19 years 56 582 1.70 ( 0.94 - 3.10 )<15 years 22 207 1.64 ( 0.75 - 3.60 )
Smoking status & packyears*Never 25 712 1.00former (>0-20 py) since >=20 yr 13 263 1.98 ( 0.95 - 4.11 )former (>20 py) since >=20 yr 0 95former (>0-20 py) since <20 yr 5 132 1.15 ( 0.40 - 3.29 )former (>20 py) since <20 yr 19 247 2.63 ( 1.33 - 5.21 )current (>0-20 py) 13 219 2.60 ( 1.21 - 5.58 )current (21-40 py) 48 258 6.13 ( 3.38 - 11.11 )current (>40 py) 24 244 3.21 ( 1.62 - 6.38 )
0 1 10
Esophagus
p <0.001
p <0.001

Oral cavity & oropharynx Hypopharynx & larynxCa Co OR 95% CI Ca Co OR 95% CI
Tobacco smoking statusNever 32 166 1.00 5 166 1.00Former 5 52 0.61 ( 0.21 - 1.79 ) 12 52 9.12 ( 2.45 - 33.99 )Current 19 54 2.17 ( 0.97 - 4.89 ) 28 54 43.23 ( 11.24 - 166.30 )
Tobacco smoking frequencyNever 32 166 1.00 5 166 1.00>0-10 cigaretts/day 8 28 1.52 ( 0.58 - 4.01 ) 8 28 14.62 ( 3.69 - 57.99 )11-20 cigarettes/day 9 41 1.13 ( 0.43 - 2.94 ) 14 41 20.11 ( 5.38 - 75.21 )>20 cigarettes/day 7 36 1.53 ( 0.52 - 4.55 ) 17 36 20.68 ( 5.33 - 80.27 )Ptrend
Tobacco smoking durationNever 32 166 1.00 5 166 1.001-20 years 5 30 0.75 ( 0.22 - 2.63 ) 7 30 10.54 ( 2.41 - 46.12 )21-40 years 8 55 0.93 ( 0.35 - 2.47 ) 19 55 17.02 ( 4.66 - 62.14 )>40 years 11 20 3.20 ( 1.13 - 9.04 ) 13 20 28.50 ( 7.05 - 115.10 )Ptrend
Tobacco smoking packyearsNever 32 166 1.00 5 166 1.00>0-20 py 11 46 1.20 ( 0.51 - 2.84 ) 10 46 12.20 ( 3.15 - 47.21 )21-40 py 5 37 0.86 ( 0.26 - 2.86 ) 8 37 12.58 ( 3.05 - 51.82 )>40 py 8 22 2.64 ( 0.90 - 7.72 ) 21 22 49.75 ( 12.16 - 203.60 )Ptrend 0.178 <0.001
<0.001
<0.001
0.451
0.110
Among never alcohol drinkers

UADT Oral cavity & oropharynx Larynx & hypopharynx Esophagus Ca Co OR 95%CI Ca Co OR 95%CI Ca Co OR 95%CI Ca Co OR 95%CI
Passive smoking exposurenever 39 210 1.00 21 210 1.00 7 210 1.00 9 210 1.00ever at home or work 139 492 1.59 ( 1.04- 2.46) 87 492 1.78 ( 1.03- 3.08) 28 492 2.05 ( 0.81- 5.22) 15 492 0.76 ( 0.27- 2.12)
Duration of exposure at homenever 75 336 1.00 46 336 1.00 14 336 1.00 13 336 1.001-15 years 26 103 0.98 ( 0.57- 1.70) 14 103 0.81 ( 0.40- 1.63) 7 103 2.05 ( 0.69- 6.10) 1 103 0.15 ( 0.01- 1.71) >15 years 64 190 1.45 ( 0.94- 2.25) 41 190 1.39 ( 0.82- 2.35) 10 190 1.89 ( 0.72- 4.94) 10 190 1.28 ( 0.43- 3.77) Ptrend 0.100 0.241 0.176 0.663
Duration of exposure at worknever 88 388 1.00 52 388 1.00 16 388 1.00 15 388 1.001-15 years 35 137 1.21 ( 0.75- 1.97) 21 137 1.15 ( 0.62- 2.12) 8 137 1.88 ( 0.71- 4.96) 4 137 0.99 ( 0.27- 3.64) >15 years 53 174 1.70 ( 1.10- 2.64) 33 174 1.96 ( 1.14- 3.37) 11 174 1.33 ( 0.54- 3.25) 5 174 0.96 ( 0.27- 3.36) Ptrend 0.019 0.019 0.462 0.948
Duration of exposure both at home and at worknever 39 210 1.00 21 210 1.00 7 210 1.00 9 210 1.001-15 years 35 143 1.31 ( 0.75- 2.28) 22 143 1.37 ( 0.68- 2.77) 9 143 2.39 ( 0.78- 7.30) 1 143 0.15 ( 0.02- 1.45) >15 years 99 319 1.78 ( 1.13- 2.80) 61 319 2.00 ( 1.13- 3.56) 18 319 1.93 ( 0.72- 5.16) 14 319 1.10 ( 0.39- 3.12) Ptrend 0.011 0.015 0.250 0.647
Involuntary smoking and UADT cancer overall and by subsite

Issues of multicenter studies Random effect models Proposal for new analysis Biospecimen management Authorship regulation
An Example of an author list A susceptibility locus for lung cancer maps to nicotinic
acetylcholine receptor subunit genes on 15q25. Hung RJ, McKay JD, Gaborieau V, Boffetta P, Hashibe M,
Zaridze D, Mukeria A, Szeszenia-Dabrowska N, Lissowska J, Rudnai P, Fabianova E, Mates D, Bencko V, Foretova L, Janout V, Chen C, Goodman G, Field JK, Liloglou T, Xinarianos G, Cassidy A, McLaughlin J, Liu G, Narod S, Krokan HE, Skorpen F, Elvestad MB, Hveem K, Vatten L, Linseisen J, Clavel-Chapelon F, Vineis P, Bueno-de-Mesquita HB, Lund E, Martinez C, Bingham S, Rasmuson T, Hainaut P, Riboli E, Ahrens W, Benhamou S, Lagiou P, Trichopoulos D, Holcátová I, Merletti F, Kjaerheim K, Agudo A, Macfarlane G, Talamini R, Simonato L, Lowry R, Conway DI, Znaor A, Healy C, Zelenika D, Boland A, Delepine M, Foglio M, Lechner D, Matsuda F, Blanche H, Gut I, Heath S, Lathrop M, Brennan P.
Nature. 2008 Apr 3;452(7187):633-7.

Summary Advantages
Multi-disciplinary Experts’
contribution Statistical power Stratified
analysis/subgroup
Disadvantages Center
heterogeneity (e.g. geographical, cultural, etc.)
Coordination efforts
Protocol compliance
Consensus issues