Embed Size (px)
Citation preview

4 CONSOLIDATED
FINANCIAL STATEMENTS
NO
TE
S

CONSOLIDATED FINANCIAL STATEMENTS
155 Consolidated Income Statement
156 Consolidated Statement of Comprehensive Income
157 Consolidated Statement of Financial Position
158 Consolidated Statement of Changes in Equity
160 Consolidated Statement of Cash Flows
161 Notes to the Consolidated Financial Statements for Fiscal Year 2014
185 Notes to the Consolidated Income Statement
193 Notes to the Consolidated Statement of Financial Position
224 Other Notes
240 Managing Board
241 Supervisory Board
242 Additional Disclosures on the Members of the Supervisory Board and the Managing Board
244 Responsibility Statement
245 Audit Opinion

CONSOLIDATED INCOME STATEMENTOF THE HUGO BOSS GROUP FOR THE PERIOD FROM JANUARY 1 TO DECEMBER 31, 2014
0 4|01 CONSOLIDATED INCOME STATEMENT (in EUR thousand)
Notes 2014 2013
Sales (1) 2,571,616 2,432,133
Cost of sales (2) (872,523) (852,583)
Gross profit 1,699,093 1,579,550
In % of sales 66.1 64.9
Selling and distribution expenses (3) (994,861) (891,588)
Administration expenses (4) (236,204) (228,518)
Other operating income and expenses (5) (19,307) (3,291)
Operating result (EBIT) 448,721 456,153
Net interest income/expenses (4,518) (14,428)
Other interest and similar income 1,627 1,994
Interest and similar expenses (6,145) (16,422)
Other financial items (7,055) (8,259)
Financial result (6) (11,573) (22,687)
Earnings before taxes 437,148 433,466
Income taxes (7) (102,668) (100,107)
Net income 334,480 333,359
Attributable to:
Equity holders of the parent company 333,262 328,965
Non-controlling interests (8) 1,218 4,394
Earnings per share (EUR) 1 (9) 4.83 4.77
Dividend per share (EUR) (24) 3.62 2 3.341 Basic and diluted earnings per share.2 2014: Proposed dividend.
Annual Report 2014
155
Consolidated Financial StatementsConsolidated Income Statement

CONSOLIDATED STATEMENT OF COMPREHENSIVE INCOMEOF THE HUGO BOSS GROUP FOR THE PERIOD FROM JANUARY 1 TO DECEMBER 31, 2014
0 4|02 CONSOLIDATED STATEMENT OF COMPREHENSIVE INCOME (in EUR thousand)
2014 2013
Net income 334,480 333,359
Items that will not be reclassified to profit or loss
Remeasurements of defined benefit plans (11,632) 651
Items to be reclassified subsequently to profit or loss
Currency differences 31,634 (11,921)
Gains/losses from cash flow hedges (1,587) 4,460
Other comprehensive income, net of tax 18,415 (6,810)
Total comprehensive income 352,895 326,549
Attributable to:
Equity holders of the parent company 352,062 322,582
Non-controlling interests 833 3,967
Total comprehensive income 352,895 326,549
Annual Report 2014
156
Consolidated Financial StatementsConsolidated Statement of Comprehensive Income

CONSOLIDATED STATEMENT OF FINANCIAL POSITIONOF THE HUGO BOSS GROUP AS OF DECEMBER 31, 2014
0 4|03 CONSOLIDATED STATEMENT OF F INANCIAL POSIT ION (in EUR thousand)
Assets Notes 2014 2013
Intangible assets (11) 147,998 139,223
Property, plant and equipment (12) 383,349 368,582
Deferred tax assets (7) 100,382 80,693
Non-current financial assets (15), (30) 19,783 17,399
Non-current tax receivables 1,167 1,695
Other non-current assets (15) 7,573 3,953
Non-current assets 660,252 611,545
Inventories (16) 507,408 440,837
Trade receivables (17) 250,532 226,204
Current tax receivables (7) 8,291 10,781
Current financial assets (15), (30) 22,528 23,323
Other current assets (15) 83,022 69,402
Cash and cash equivalents (18) 128,631 119,242
Assets held for sale (13) 1,136 0
Current assets 1,001,548 889,789
TOTAL 1,661,800 1,501,334
Equity and liabilities
Subscribed capital (19) 70,400 70,400
Own shares (20) (42,363) (42,363)
Capital reserve (21) 399 399
Retained earnings (22) 801,330 701,514
Accumulated other comprehensive income (23) 14,672 (15,760)
Equity attributable to equity holders of the parent company 844,438 714,190
Non-controlling interests (8) (520) 26,107
Group equity 843,918 740,297
Non-current provisions (25), (26) 70,545 52,739
Non-current financial liabilities (27), (30) 153,643 164,768
Deferred tax liabilities (7) 10,132 17,462
Other non-current liabilities (28) 37,871 30,967
Non-current liabilities 272,191 265,936
Current provisions (25) 115,656 99,868
Current financial liabilities (27), (30) 18,256 14,653
Income tax payables (7) 59,944 63,372
Trade payables (29) 254,959 235,286
Other current liabilities (28) 96,876 81,922
Current liabilities 545,691 495,101
TOTAL 1,661,800 1,501,334
Annual Report 2014
157
Consolidated Financial StatementsConsolidated Statement of Financial Position

CONSOLIDATED STATEMENT OF CHANGES IN EQUITYOF THE HUGO BOSS GROUP FOR THE PERIOD FROM JANUARY 1 TO DECEMBER 31, 2014
0 4|0 4 CONSOLIDATED STATEMENT OF CHANGES IN EQUIT Y (in EUR thousand)
Retained earningsAccumulated other comprehensive
income Group equity
Subscribed capital Own shares Capital reserve Legal reserve Other reservesCurrency
translation
Gains/lossesfrom cash flow
hedges
Total beforenon-controlling
interestsNon-controlling
interests Group equity
Notes (19) (20) (21) (22) (22) (23) (23) (8)
January 1, 2013 (as reported) 70,400 (42,363) 399 6,641 586,961 (5,196) (3,521) 613,320 24,587 637,907
Change in accounting policies/corrections (6,331) (9) (6,339) (6,339)
January 1, 2013 (adjusted) 70,400 (42,363) 399 6,641 580,629 (5,205) (3,521) 606,980 24,587 631,567
Net income 328,965 328,965 4,394 333,359
Other income 651 (11,494) 4,460 (6,383) (427) (6,810)
Comprehensive income 329,616 (11,494) 4,460 322,582 3,967 326,549
Changes in basis of consolidation (43) (43) (43)
Dividend payment (215,330) (215,330) (2,448) (217,779)
December 31, 2013 70,400 (42,363) 399 6,641 694,873 (16,699) 939 714,190 26,107 740,297
January 1, 2014 70,400 (42,363) 399 6,641 694,873 (16,699) 939 714,190 26,107 740,297
Net income 333,262 333,262 1,218 334,480
Other income (11,632) 32,019 (1,587) 18,800 (385) 18,415
Comprehensive income 321,630 32,019 (1,587) 352,062 833 352,895
Dividend payment (230,514) (230,514) (230,514)
Acquisition of non-controlling interests 8,700 8,700 (27,460) (18,760)
December 31, 2014 70,400 (42,363) 399 6,641 794,689 15,320 (648) 844,438 (520) 843,918
Annual Report 2014
158
Consolidated Financial StatementsConsolidated Statement of Changes in Equity

CONSOLIDATED STATEMENT OF CHANGES IN EQUITYOF THE HUGO BOSS GROUP FOR THE PERIOD FROM JANUARY 1 TO DECEMBER 31, 2014
0 4|0 4 CONSOLIDATED STATEMENT OF CHANGES IN EQUIT Y (in EUR thousand)
Retained earningsAccumulated other comprehensive
income Group equity
Subscribed capital Own shares Capital reserve Legal reserve Other reservesCurrency
translation
Gains/lossesfrom cash flow
hedges
Total beforenon-controlling
interestsNon-controlling
interests Group equity
Notes (19) (20) (21) (22) (22) (23) (23) (8)
January 1, 2013 (as reported) 70,400 (42,363) 399 6,641 586,961 (5,196) (3,521) 613,320 24,587 637,907
Change in accounting policies/corrections (6,331) (9) (6,339) (6,339)
January 1, 2013 (adjusted) 70,400 (42,363) 399 6,641 580,629 (5,205) (3,521) 606,980 24,587 631,567
Net income 328,965 328,965 4,394 333,359
Other income 651 (11,494) 4,460 (6,383) (427) (6,810)
Comprehensive income 329,616 (11,494) 4,460 322,582 3,967 326,549
Changes in basis of consolidation (43) (43) (43)
Dividend payment (215,330) (215,330) (2,448) (217,779)
December 31, 2013 70,400 (42,363) 399 6,641 694,873 (16,699) 939 714,190 26,107 740,297
January 1, 2014 70,400 (42,363) 399 6,641 694,873 (16,699) 939 714,190 26,107 740,297
Net income 333,262 333,262 1,218 334,480
Other income (11,632) 32,019 (1,587) 18,800 (385) 18,415
Comprehensive income 321,630 32,019 (1,587) 352,062 833 352,895
Dividend payment (230,514) (230,514) (230,514)
Acquisition of non-controlling interests 8,700 8,700 (27,460) (18,760)
December 31, 2014 70,400 (42,363) 399 6,641 794,689 15,320 (648) 844,438 (520) 843,918
Annual Report 2014
159
Consolidated Financial StatementsConsolidated Statement of Changes in Equity

CONSOLIDATED STATEMENT OF CASH FLOWSOF THE HUGO BOSS GROUP FOR THE PERIOD FROM JANUARY 1 TO DECEMBER 31, 2014
0 4|0 5 CONSOLIDATED STATEMENT OF CASH FLOWS (in EUR thousand)
Notes 2014 2013
(35)
Net income 334,480 333,359
Depreciation/amortization (10) 122,760 105,262
Unrealized net foreign exchange gain/loss (3,049) 18,916
Other non-cash transactions 5,178 (3,965)
Income tax expense/refund (7) 102,668 100,107
Interest income and expenses (6) 4,518 14,428
Change in inventories (45,778) (36,307)
Change in receivables and other assets (31,987) (30,584)
Change in trade payables and other liabilities 27,684 21,988
Result from disposal of non-current assets (2,478) 2,741
Change in provisions for pensions (26) (1,319) (2,414)
Change in other provisions 13,969 5,628
Income taxes paid (128,389) (104,799)
Cash flow from operations 398,257 424,360
Interest paid (6) (4,458) (10,005)
Interest received (6) 1,628 1,984
Cash flow from operating activities 395,427 416,339
Investments in property, plant and equipment (12) (104,459) (160,243)
Investments in intangible assets (11) (25,307) (13,083)
Acquisition of subsidiaries and other business entities less cash and cash equivalents acquired (35) 0 (11,659)
Effects from disposal of subsidiaries 0 (1,698)
Cash receipts from sales of property, plant and equipment and intangible assets 2,702 366
Cash flow from investing activities (127,064) (186,317)
Dividends paid to equity holders of the parent company (24) (230,514) (215,330)
Dividends paid to non-controlling interests 0 (2,448)
Change in current financial liabilities 262 (254,645)
Cash receipts from non-current financial liabilities 0 111,350
Repayment of non-current financial liabilities (10,354) 0
Repayment of borrowings (2,093) (2,012)
Cash outflows for the purchase of additional interests in subsidiaries without change of control (18,838) 0
Cash flow from financing activities (261,537) (363,085)
Exchange-rate related changes in cash and cash equivalents 2,563 (2,301)
Change in cash and cash equivalents 9,389 (135,364)
Cash and cash equivalents at the beginning of the period 119,242 254,606
Cash and cash equivalents at the end of the period (18) 128,631 119,242
Annual Report 2014
160
Consolidated Financial StatementsConsolidated Statement of Cash Flows

NOTES TO THE CONSOLIDATED FINANCIAL STATEMENTS FOR FISCAL YEAR 2014
GENERAL INFORMATION
HUGO BOSS AG is a publicly listed stock corporation with registered offices in Dieselstrasse 12, 72555 Metzingen, Germany. The Company is filed in the commercial register of Stuttgart local court under HRB 360610.
The purpose of HUGO BOSS AG and its subsidiaries (together the “HUGO BOSS Group”) is the development, marketing and distribution of high-end men’s and women’s fashion and accessories in the premium and luxury segment. With its brand world, HUGO BOSS caters for clearly defined target groups. The brands cover a comprehensive product range encompassing classic-modern apparel, elegant evening wear and sportswear, shoes, leather accessories and licensed fragrances, eyewear and watches.
HUGO BOSS AG compiles the consolidated income statement using the cost of sales method.
The consolidated financial statements and combined management report of HUGO BOSS AG, Metzingen, were authorized for issue to the Supervisory Board by the Managing Board by resolution dated February 19, 2015.
Due to rounding differences and the presentation in EUR thousand, it is possible that individual figures in the consolidated financial statements of HUGO BOSS AG do not exactly add up to the reported totals and that the reported percentage figures do not exactly reflect the reported absolute figures.
To improve the clarity of presentation, various items in the consolidated statement of financial position and consolidated income statement have been summarized. These items are shown separately and explained in the notes to the consolidated financial statements.
As a rule, the Group classifies assets and liabilities as current if they are expected to be recovered or settled within twelve months from the reporting date.
FINANCIAL REPORTING
The consolidated financial statements of HUGO BOSS AG as of December 31, 2014, were prepared in accordance with IFRSs as issued by the International Accounting Standards Board (IASB) and adopted by the European Union (EU), and the additional requirements of German commercial law pursuant to Sec. 315a (1) HGB [“Handelsgesetzbuch”: German Commercial Code]. All International Financial Reporting Standards (IFRS) and International Accounting Standards (IAS) together with the Interpretations of the International Financial Reporting Interpretations Committee (IFRIC) applicable as of the fiscal year 2014 were taken into account.
Annual Report 2014
161
Consolidated Financial StatementsNotes to the Consolidated Financial Statements for Fiscal Year 2014

ADOPTION OF NEW OR AMENDED IFRS
During the year, the Group adopted the following new and revised IFRSs and IFRICs endorsed by the EU. This also includes the amendments published as part of the ongoing Improvements to IFRSs project of the IASB. Unless otherwise stated, adoption of these revised standards and interpretations does not have any material effects on the presentation of the Group’s results of operations, net assets and financial position. It did, however, give rise to additional disclosures in some cases.
New IFRSs and amended IAS adopted for the first time in fiscal year 2014:
Standard/ interpretation
Publication by IASB
Expected adoption
EU endorsement Content
IFRS 10 Consolidated Financial Statements
May 2011 January 1, 2014 December 2012 IFRS 10 completely replaces SIC 12 “Consolidation – Special Purpose Entities” and partially replaces IAS 27. The standard introduces a single consolidation model for all entities based on control, irrespective of the nature of the investee. The comprehensive concept of control governs which entities should be included in the consolidated financial statements.
IFRS 10 Consolidated Financial Statements
June 2012 January 1, 2014 April 2013 The amendments to IFRS 10 clarify transition guidance. Accordingly, comparative information only has to be provided for the comparative period immediately preceding the given period.
IFRS 10 Consolidated Financial Statements
October 2012 January 1, 2014 November 2013 The amendments to IFRS 10 concern the definition of investment entities. This is less restrictive than the definition in the Exposure Draft.
IFRS 11 Joint Arrangements
May 2011 January 1, 2014 December 2012 IFRS 11 replaces IAS 31 “Interests in Joint Ventures” and SIC 13 “Jointly Controlled Entities – Non-Monetary Contributions by Ventures”. The standard focuses on the nature of the rights and duties arising from the arrangement rather than its legal form. The option to proportionately consolidate jointly controlled entities has been removed. The remaining method is accounting for the interest using the equity method. In addition, jointly controlled assets have been abolished, leaving only joint operations and joint ventures.
IFRS 11 Joint Arrangements
June 2012 January 1, 2014 April 2013 The amendments to IFRS 11 clarify transition guidance. Accordingly, comparative information only has to be provided for the comparative period immediately preceding the given period.
IFRS 12 Disclosure of Interests in Other Entities
May 2011 January 1, 2014 December 2012 IFRS 12 replaces the guidance in IAS 27, IAS 28, IAS 31 and SIC 12 on the disclosures to be included in the notes. By introducing new and more extensive disclosures for all types of interests in equities, the standard aims to improve disclosures on consolidated and non-consolidated entities.
IFRS 12 Disclosure of Interests in Other Entities
June 2012 January 1, 2014 April 2013 The amendments to IFRS 12 clarify transition guidance. Accordingly, comparative information only has to be provided for the comparative period immediately preceding the given period. In addition, the requirement to disclose comparative information for non-consolidated entities for periods prior to the first-time application of IFRS 12 has been removed.
Annual Report 2014
162
Consolidated Financial StatementsNotes to the Consolidated Financial Statements for Fiscal Year 2014

Standard/ interpretation
Publication by IASB
Expected adoption
EU endorsement Content
IFRS 12 Disclosure of Interests in Other Entities
October 2012 January 1, 2014 November 2013 The amendments to IFRS 12 concern the definition of investment entities, which is less restrictive than the definition in the Exposure Draft.
IAS 27 Consolidated and Separate Financial Statements
May 2011 January 1, 2014 December 2012 The consolidation requirements previously contained in IAS 27 were revised and are now contained in IFRS 10 Consolidated Financial Statements. Accordingly, IAS 27 now only contains guidance governing separate financial statements.
IAS 27 Consolidated and Separate Financial Statements
October 2012 January 1, 2014 November 2013 The amendments to IAS 27 concern the definition of invest-ment entities, which is less restrictive than the definition in the Exposure Draft.
IAS 28 Investments in Associates
May 2011 January 1, 2014 December 2012 The amendments to IAS 28 are follow-up changes resulting from the new IFRS 10, IFRS 11 and IFRS 12. As a result, the scope of IAS 28 has been extended to include the accounting treatment of joint ventures.
IAS 32 Financial Instruments
December 2011 January 1, 2014 December 2012 The amendments to IAS 32 clarify existing offsetting rules.
IAS 39 Financial Instru-ments: Recognition and Measurement
June 2013 January 1, 2014 December 2013 In certain circumstances, the novation of a hedging instrument to a central counterparty on account of legal requirements does not lead to the dissolution of a hedging relationship.
IFRIC 21 Levies
May 2013 January 1, 2014 June 2014 IFRIC 21 provides guidance on the accounting treatment of public levies that do not qualify as income taxes and clarifies in particular when to recognize a liability to pay such a levy. It also clarifies that levies that are triggered when specific thresholds are reached are not accounted for until they are reached.
The IASB has also published additional standards and interpretations. However, these either do not have any material effect on the consolidated financial statements of HUGO BOSS AG or the consequences of adoption are currently being examined. The following accounting standards were not yet subject to mandatory adoption in fiscal year 2014 and were therefore not adopted by HUGO BOSS:
Standard/ interpretation
Publication by IASB
Expected adoption
EU endorsement Content
IFRS 9 Financial Instruments
November 2009 January 1, 2018 Pending IFRS 9 Financial Instruments governs the recognition, classification and measurement of financial instruments and replaces IAS 39. The basis taken for assessment is the nature of the contractually agreed cash flows from financial assets and the way in which an entity manages its financial instruments. A uniform impairment method is also envisaged. In October 2010, IFRS 9 was extended to include requirements on the accounting treatment of financial liabilities. In July 2014, the expected date of application was postponed from January 1, 2017. The Group is currently examining the impact that the application of IFRS 9 will have on its consolidated financial statements.
Annual Report 2014
163
Consolidated Financial StatementsNotes to the Consolidated Financial Statements for Fiscal Year 2014

Standard/ interpretation
Publication by IASB
Expected adoption
EU endorsement Content
IFRS 9 Financial Instruments
November 2013 January 1, 2018 Pending The primary objective of the revised requirements on hedge accounting is to improve the presentation of entities’ risk activities in the financial statements. In July 2014, the expected date of application was postponed from January 1, 2017. The Group is currently examining the impact that the application of IFRS 9 will have on its consolidated financial statements.
IFRS 9 Financial Instruments
July 2014 January 1, 2018 Pending The new standard contains the guidance revised in 2009 on the classification and measurement of financial assets, including guidance on impairments, and supplements the new guidance on hedge accounting published in 2013. The Group is currently examining the impact that the application of IFRS 9 will have on its consolidated financial statements.
IFRS 10 IAS 28 Consolidated Financial Statements Investments in Associates and Joint Ventures
September 2014 January 1, 2016 Pending The amendments address an acknowledged inconsistency between the requirements in IFRS 10 and those in IAS 28 (2011), in dealing with the sale or contribution of assets between an investor and its associate or joint venture. In the future, the full gain or loss resulting from a transaction is only recognized when the assets sold or contributed constitute a business within the meaning of IFRS 3, regardless of whether or not the transaction is designed as a share-based or asset-based deal. A partial gain or loss is recognized when a transaction involves assets that do not constitute a business.
IFRS 10 IFRS 12 IAS 28 Consolidated Financial StatementsDisclosure of interests in Other Entities Investments in Associates and Joint Ventures
December 2014 January 1, 2016 Pending This standard is intended to clarify application of the exception from the consolidation obligation under IFRS 10 if the parent entity meets the definition of an “investment entity”:• The exemption from preparing consolidated financial
statements is available to an entity even if the parent entity measures all of its subsidiaries at fair value under IFRS 10.
• A subsidiary that provides services related to the parent’s investment activities should not be consolidated if the subsidiary itself is an investment entity.
• When applying the equity method to an associate or a joint venture, an investor that is not an investment entity may retain the fair value measurement applied by the associate or joint venture to its interests in subsidiaries.
IFRS 11 Joint Arrangements
May 2014 January 1, 2016 Pending The amendments provide additional guidance on the question as to how the acquisition of shares in a joint operation that is recognized in relation to the interest held in accordance with IFRS 11.20 is to be accounted for. The amendments clarify that the acquisition of shares in a joint operation that constitutes a business as defined in IFRS 3 Business Combinations must be accounted for in accordance with IFRS 3 (i.e. using the acquisition method) and other relevant standards such as IAS 12, IAS 38 and IAS 36.
IFRS 15 Revenue from Contracts with Customers
May 2014 January 1, 2017 Pending The guidance and definitions contained in IFRS 15 will replace the content of both IAS 18 “Revenue” and IAS 11 “Construction Contracts” in the future. The new standard does not draw any distinction between different types of contracts and services, instead defining uniform criteria to determine when a performance obligation is to be recognized at a point in time or over time. The Group is currently examining the impact that the application of IFRS 15 will have on its consolidated financial statements.
Annual Report 2014
164
Consolidated Financial StatementsNotes to the Consolidated Financial Statements for Fiscal Year 2014

Standard/ interpretation
Publication by IASB
Expected adoption
EU endorsement Content
IAS 1 Presentation of Financial Statements
December 2014 January 1, 2016 Pending The amendments essentially comprise the following points: • Clarification that disclosures are only required in the
notes if their content is not immaterial. This also applies if an IFRS has a list of minimum disclosure requirements.
• Explanations concerning the aggregation and disaggre-gation of items in the statement of financial position and the statement of comprehensive income
• Clarification regarding how the share of other compre-hensive income arising from entities measured using the equity method should be presented in the statement of comprehensive income
• Elimination of predefined note format in favor of a method that reflects relevance within an individual entity
IAS 16 IAS 38 Property, Plant and Equipment Intangible Assets
May 2014 January 1, 2016 Pending The amendments provide guidance on the methods to be used for calculating depreciation and amortization of property, plant and equipment and intangible assets. It stipulates that the revenue-based method is not appropriate under IAS 16. This is because this method only reflects a pattern of generation of an asset’s expected future economic benefits, rather than the pattern of consumption of an asset’s expected future economic benefits. This is correspondingly clarified in IAS 16.62A. IAS 38.98A includes a rebuttable assumption that a revenue-based depreciation method is not appropriate for the same reasons as specified in IAS 16.
IAS 19 Employee Benefits
November 2013 July 1, 2014 Pending The amendment is intended to supplement IAS 19.93 such that employee contributions or contributions by third parties are recognized as a reduction in the service cost in the period in which the related service is rendered.
IAS 27 Separate Financial Statements
August 2014 January 1, 2016 Pending The amendments now permit the use of the equity method as an option for accounting for shares in subsidiaries, joint ventures and associated companies in an investor’s separate financial statements.
Various IAS and IFRSs
December 2013 July 1, 2014 Pending Annual improvements to the IFRSs – Cycle 2010 – 2012 This concerns the following standards:• IFRS 2 “Share-based Payment”• IFRS 3 “Business Combinations”• IFRS 8 “Operating Segments”• IFRS 13 “Fair Value Measurement”• IAS 16 “Property, Plant and Equipment”• IAS 24 “Related Party Disclosures”• IAS 38 “Intangible Assets”
Various IAS and IFRSs
December 2013 January 1, 2015 December 2014 Annual improvements to the IFRSs – Cycle 2011 – 2013 This concerns the following standards:• IFRS 1 “First-time Adoption of International Financial
Reporting Standards”• IFRS 3 “Business Combinations”• IFRS 13 “Fair Value Measurement”• IAS 40 “Investment Property”
Various IAS and IFRSs
September 2014 July 1, 2016 Pending Annual improvements to the IFRSs – Cycle 2012 – 2014 This concerns the following standards:• IFRS 5 “Non-current Assets Held for Sale and Discontinued
Operations”• IFRS 7 “Financial Instruments: Disclosures”• IAS 19 “Employee Benefits”• IAS 34 “Interim Financial Reporting”
Annual Report 2014
165
Consolidated Financial StatementsNotes to the Consolidated Financial Statements for Fiscal Year 2014

BASIS OF CONSOLIDATION
The HUGO BOSS Group’s basis of consolidation includes HUGO BOSS AG, Metzingen, Germany and the following entities that it controls (100% share in capital in each case, unless otherwise indicated):
BIL Leasing Verwaltungs-GmbH & Co. 869 KG Pullach, Germany 1,3
GRAMOLERA Grundstücks-Vermietungsgesellschaft Objekt Ticino mbH Metzingen, Germany 3
HUGO BOSS (Schweiz) AG Zug, Switzerland
HUGO BOSS Australia Pty. Ltd. Preston, Australia
HUGO BOSS Belgium BVBA Diegem, Belgium
HUGO BOSS Belgium Retail BVBA Diegem, Belgium
HUGO BOSS Benelux B.V. Amsterdam, Netherlands
HUGO BOSS Benelux B.V. y CIA, S.C. Madrid, Spain
HUGO BOSS Benelux Retail B.V. Amsterdam, Netherlands
HUGO BOSS Beteiligungsgesellschaft mbH Metzingen, Germany 3
HUGO BOSS Canada, Inc. Toronto, Canada
HUGO BOSS China Retail Co. Ltd. Shanghai, China
HUGO BOSS Cleveland, Inc. Cleveland, OH, U.S.A.
HUGO BOSS Dienstleistungs GmbH Metzingen, Germany
HUGO BOSS do Brasil Ltda. São Paulo, Brazil
HUGO BOSS Fashions, Inc. Wilmington, DE, U.S.A.
HUGO BOSS Finland OY Helsinki, Finland
HUGO BOSS France SAS Paris, France
HUGO BOSS Guangdong Trading Co. Ltd. Guangzhou, China
HUGO BOSS Hellas LLC Athens, Greece
HUGO BOSS Holding Netherlands B.V. Amsterdam, Netherlands
HUGO BOSS Holding Sourcing S.A. Coldrerio, Switzerland
HUGO BOSS Holdings Pty. Ltd. Preston, Australia
HUGO BOSS Hong Kong Ltd. Hong Kong
HUGO BOSS International B.V. Amsterdam, Netherlands
HUGO BOSS International Markets AG Zug, Switzerland
HUGO BOSS Internationale Beteiligungs-GmbH Metzingen, Germany 3
HUGO BOSS Ireland Ltd. Dublin, Ireland
HUGO BOSS Italia S.p.A. Milan, Italy
HUGO BOSS Japan K.K. Tokyo, Japan
HUGO BOSS Licensing, Inc. Wilmington, DE, U.S.A.
HUGO BOSS Lotus Hong Kong Ltd. Hong Kong
HUGO BOSS Magazacilik Ltd. Sirketi Izmir, Turkey
HUGO BOSS Mexico Management Services S.A. de C.V. Mexico City, Mexico
HUGO BOSS Mexico S.A. de C.V. Mexico City, Mexico
HUGO BOSS Nordic ApS Copenhagen, Denmark
HUGO BOSS Portugal & Companhia Lisbon, Portugal
HUGO BOSS Retail, Inc. New York, NY, U.S.A.
HUGO BOSS Rus LLC Moscow, Russia1 Investments with a 94% share in capital and 10% of voting rights.2 Investments with a 94% share in capital and 15% of voting rights.3 Subsidiaries that exercise the exemption of Secs. 264 (3) and 264b HGB [“Handelsgesetzbuch”: German Commercial Code].
Annual Report 2014
166
Consolidated Financial StatementsNotes to the Consolidated Financial Statements for Fiscal Year 2014

HUGO BOSS Scandinavia AB Stockholm, Sweden
HUGO BOSS Shoes & Accessories Italia S.p.A. Morrovalle, Italy
HUGO BOSS Shoes & Accessories Poland Sp. z o.o. Radom, Poland
HUGO BOSS South East Asia Pte. Ltd. Singapore
HUGO BOSS Switzerland Retail AG Zurich, Switzerland
HUGO BOSS Textile Industry Ltd. Izmir, Turkey
HUGO BOSS Ticino S.A. Coldrerio, Switzerland
HUGO BOSS Trade Mark Management GmbH & Co. KG Metzingen, Germany 3
HUGO BOSS Trade Mark Management Verwaltungs-GmbH Metzingen, Germany
HUGO BOSS UK Ltd. London, Great Britain
HUGO BOSS USA, Inc. New York, NY, U.S.A.
HUGO BOSS Vermögensverwaltungs GmbH & Co. KG Metzingen, Germany 3
Lotus Concept Trading (Macau) Co., Ltd. Macau
Lotus (Shenzhen) Commerce Ltd. Shenzhen, China
ROSATA Grundstücks-Vermietungsgesellschaft mbH & Co. Objekt Dieselstrasse KG Grünwald, Germany 2,3
ROSATA Grundstücks-Vermietungsgesellschaft mbH & Co. Objekt Metzingen KG Grünwald, Germany 2,3
1 Investments with a 94% share in capital and 10% of voting rights.2 Investments with a 94% share in capital and 15% of voting rights.3 Subsidiaries that exercise the exemption of Secs. 264 (3) and 264b HGB [“Handelsgesetzbuch”: German Commercial Code].
Effective July 4, 2014, the HUGO BOSS Group established a new subsidiary in South Korea, known as HUGO BOSS Korea Ltd., South Korea. The HUGO BOSS Group has a 100% shareholding in this company. On grounds of immateriality for the Group, HUGO BOSS Korea Ltd. is not included in the consolidated financial statements as of December 31, 2014.
Companies in which HUGO BOSS and one more party have joint control are accounted for using the equity method:
Distributionszentrum Vermietungsgesellschaft mbH & Co. Objekt HUGO BOSS Filderstadt KG Pullach, Germany 1
GRETANA Grundstücks-Vermietungsgesellschaft mbH & Co. Objekt D 19 KG Grünwald, Germany 2
1 Investments with a 100% share in capital and 20% of voting rights, head office Filderstadt.2 Investments with a 100% share in capital and 15% of voting rights, head office Metzingen.
Annual Report 2014
167
Consolidated Financial StatementsNotes to the Consolidated Financial Statements for Fiscal Year 2014

CHANGES IN BASIS OF CONSOLIDATION
In the reporting period from January 1 to December 31, 2014, the number of consolidated companies increased from 55 to 56 in comparison to the consolidated financial statements as of December 31, 2013. Overall, the number of companies included in the consolidated financial statements was as follows in fiscal year 2014:
2014 2013
January 1 55 54
Newly founded/consolidated companies 1 3
Merged companies/disposal 0 (1)
Derecognized due to loss of control 0 (1)
December 31 56 55
The new company HUGO BOSS Finland OY, Helsinki, Finland, which was founded in fiscal year 2013, was not included in the consolidated financial statements as of December 31, 2013, on the grounds of immateriality. The subsidiary was consolidated for the first time on May 1, 2014.
As was the case on December 31, 2013, two companies were included in the consolidated financial statements using the equity method in fiscal year 2014.
DISCLOSURE ON THE LARGEST GROUP OF CONSOLIDATED COMPANIES
As of December 31, 2014 Red & Black Lux S.à r.l., Luxembourg, held 31.82% of the voting rights in HUGO BOSS AG. The consolidated financial statements of HUGO BOSS AG are included in the consolidated financial statements of Red & Black Lux S.à r.l., Luxembourg, as the largest group of consolidated companies.
CONSOLIDATION PRINCIPLES
The HUGO BOSS Group’s basis of consolidation comprises HUGO BOSS AG and all subsidiaries, including structured entities, over which HUGO BOSS AG can exercise direct or indirect control. Control exists if HUGO BOSS AG as the parent company has the power of decision over a subsidiary based on voting rights or other rights, if it participates in positive and negative variable returns from a subsidiary, and if it can affect these returns by its power of decision. The subsidiary is deconsolidated as soon as the control by the parent company ceases.
Subsidiaries with an immaterial influence on the net assets, financial position and results of operations of the Group are not included in the consolidated financial statements. Influence is deemed immaterial if the sales, earnings and total assets on aggregate make up less than 1% of the corresponding figures for the Group. This is reassessed at each reporting date. Non-consolidated subsidiaries are measured at fair value or, if this cannot be determined reliably, at cost, and reported under other non-current financial assets.
Annual Report 2014
168
Consolidated Financial StatementsNotes to the Consolidated Financial Statements for Fiscal Year 2014

Structured entities which are controlled by the parent company are also consolidated. Structured entities are entities which have been designed in such a way that voting or similar rights are not relevant in deciding who controls the entity. This is the case, for example, if voting rights relate to administrative tasks only and the relevant activities are governed by contractual arrangements.
Entities whose business activities are jointly controlled by the Group and one more party (joint ventures) are consol-idated using the equity method. Joint control is the contractually agreed sharing of control of an arrangement. It exists only when decisions about the relevant activities require the unanimous consent of the parties sharing control.
The sale of shares in subsidiaries as a result of which the Group’s share in such subsidiary increases or decreases without any loss of control is recognized within the equity of the corresponding equity providers.
The financial statements of subsidiaries are prepared using uniform accounting policies.
The effects of intercompany transactions are eliminated. Receivables and liabilities between the consolidated companies are offset against each other; intercompany gains and losses pertaining to intangible assets, property, plant and equipment and inventories are eliminated; intercompany income is offset against the corresponding intercompany expenses. Deferred taxes are recognized on temporary differences arising on consolidation in accordance with IAS 12.
BUSINESS COMBINATIONS
All business combinations are accounted for using the acquisition method. The cost of an acquisition is measured as the aggregate of the consideration transferred measured at acquisition-date fair value and the amount of any non-controlling interest in the acquiree. The identifiable assets acquired and liabilities assumed (including contingent liabilities) in a business combination are measured at their acquisition-date fair values. Non-controlling interests are measured at their proportionate share in the fair value of the identifiable assets and liabilities. Acquisition-related costs incurred are expensed.
GOODWILL
When a company obtains control over another company, this constitutes a business combination within the meaning of IFRS 3. In accordance with IFRS 3, business combinations must be accounted for using the acquisition method, which entails the performance of a purchase price allocation.
The goodwill resulting from a business combination is the excess between the consideration transferred and the fair value of the non-controlling interest in the assets acquired and liabilities assumed. If the consideration is lower than the fair value of the net assets of the acquiree, the difference is reassessed and then recognized in profit or loss.
Annual Report 2014
169
Consolidated Financial StatementsNotes to the Consolidated Financial Statements for Fiscal Year 2014

After initial recognition, goodwill is carried at cost in the functional currency of the foreign acquiree less any accumulated impairment losses. Any goodwill recognized is tested for impairment annually and whenever there is an indication that the assets might be impaired.
ELIMINATION OF INTERCOMPANY PROFITS
The HUGO BOSS distribution companies generally source finished goods and merchandise solely from the Group’s in-house production and procurement units. Gains on intercompany deliveries of merchandise still in stock as of the reporting date are eliminated.
If the carrying amount in the books of the distribution company has been written down locally below the cost recognized at Group level, no intercompany profits are eliminated.
Any difference between the carrying amount of the merchandise at the level of the distribution company following the local recognition of write-downs and the cost recognized at Group level is eliminated.
In addition, merchandise carried at cost at Group level is tested for impairment from the perspective of the HUGO BOSS Group. If the cost recognized at Group level exceeds the expected recoverable sales proceeds, an impairment loss is charged. The expected recoverable sales proceeds from the Group’s perspective are determined by reference to the Group’s own sales channels worldwide, particularly its warehouse and outlet capacity.
CURRENCY TR ANSL ATION
The Group’s reporting currency is the functional currency of the parent company, HUGO BOSS AG. As a rule, the functional currency of the subsidiaries included in the consolidated financial statements is the corresponding local currency. For units that conduct a significant portion of their sales and procurement activities and that finance operations in a currency other than the corresponding local currency, the functional currency is the currency of the primary business environment. Accordingly, the euro is the functional currency of HUGO BOSS Textile Industry Ltd., Turkey, and HUGO BOSS International Markets AG, Switzerland, as these companies conduct most of their business in euro.
FOREIGN CURRENCY TR ANSACTIONS AND BAL ANCES
In the separate financial statements, transactions in foreign currency are translated at the exchange rates valid at the dates of the transactions. Monetary items (cash and cash equivalents, receivables and liabilities) denominated in foreign currencies are translated into the functional currency at closing rates.
The resulting exchange rate gains and losses are recognized through profit and loss in other financial items.
TR ANSL ATION OF THE SEPAR ATE F INANCIAL STATEMENTS
The financial statements of the foreign Group companies whose functional currency is not the euro are translated into the Group reporting currency, the euro. Items are translated using the modified closing rate in accordance with IAS 21, under which assets, including goodwill, and liabilities are translated at closing rates, and income statement items are translated at the average exchange rates for the reporting period. Differences from currency translation of income statements at average rates and statements of financial position at closing rates are reported without effect on profit or loss in other comprehensive income. The currency difference resulting from the translation of equity at historical rates is likewise posted to other comprehensive income. Currency differences recognized in other comprehensive income are recycled to the income statement if the corresponding Group company is sold.
Annual Report 2014
170
Consolidated Financial StatementsNotes to the Consolidated Financial Statements for Fiscal Year 2014

The most important exchange rates applied in the consolidated financial statements developed as follows in relation to the euro:
Currency Average rate Closing rate
Country 1 EUR = 2014 2013 2014 2013
Australia AUD 1.4726 1.3764 1.4829 1.5423
China CNY 8.1977 8.1636 7.5358 8.3491
Great Britain GBP 0.8067 0.8492 0.7789 0.8337
Hong Kong HKD 10.3179 10.2989 9.4170 10.6933
Japan JPY 140.2427 129.5244 145.2300 144.7200
Switzerland CHF 1.2149 1.2310 1.2024 1.2276
Turkey TRY 2.9085 2.5228 2.8272 2.9344
U.S.A. USD 1.3305 1.3278 1.2141 1.3791
ACCOUNTING POLICIES
The financial statements of HUGO BOSS AG and the German and foreign subsidiaries are prepared pursuant to uniform accounting policies in accordance with IFRS 10.
RECOGNITION OF INCOME AND EXPENSES
Income is recognized to the extent that it is probable that the economic benefits will flow to the Group and the income can be reliably measured. Income is measured at the fair value of the consideration received. Income is reported after deductions including discounts and other price deductions and net of VAT. The specific recognition criteria described below must also be met before income is recognized.
Sale of merchandise and goodsIn the wholesale channel, income from the sale of goods is recognized when the significant risks and rewards of ownership of the goods have passed to the buyer. Sales from the Group’s own retail business are recognized when transactions with customers are completed. Claims from returned goods agreements and return rights are deducted from income if their occurrence is sufficiently certain. Provisions for returned goods are determined based on historical rates of goods returned for each sales channel.
Annual Report 2014
171
Consolidated Financial StatementsNotes to the Consolidated Financial Statements for Fiscal Year 2014

License and other incomeLicense and other income are recognized in the period in which they are generated in accordance with the terms of the underlying agreements.
Operating income is recognized in the income statement when the service is used or generated where there is a direct relationship between the costs incurred and the corresponding income.
Interest incomeInterest is recognized pro rata temporis taking into account the effective yield on the asset.
FUNCTIONAL COSTS
Operating expenses are essentially allocated to the individual function based on the respective cost centers. Expenses incurred in connection with cross-functional activities or projects are spread among the function costs concerned using an adequate allocation principle.
RESEARCH AND DEVELOPMENT COSTS
Research costs are expensed as incurred. Development costs are likewise expensed as incurred if they do not satisfy the criteria for recognition as internally generated intangible assets. Production-related development costs are generally included in the calculation of the cost of unfinished and finished goods. These essentially comprise the cost of technical product development in the third phase of the collection creation process.
INCOME TA XES
Current income tax assets and liabilities for the current period are measured at the amount expected to be recovered from or paid to the taxation authorities. The tax rates and tax laws used to compute the amount are those that are enacted or substantively enacted at the reporting date in the countries where the Group operates and generates taxable income.
In accordance with IAS 12, deferred tax assets and deferred tax liabilities are recognized for all temporary differences between the tax bases and the carrying amounts for financial reporting purposes of the separate entities and the carrying amounts in the consolidated financial statements in accordance with IFRSs and for certain consolidation entries. Deferred tax assets and deferred tax liabilities are recognized using the liability method.
Deferred tax assets also include tax credits that result from the expected utilization of existing unused tax losses in subsequent years and the realization of which can be assumed with reasonable assurance.
Deferred tax assets and deferred tax liabilities are measured at the tax rates that are expected to apply when the temporary differences reverse. Deferred tax liabilities are recognized on the retained earnings of foreign subsidiaries to the extent that it is likely that these will be distributed in the future.
Annual Report 2014
172
Consolidated Financial StatementsNotes to the Consolidated Financial Statements for Fiscal Year 2014

Deferred tax assets and deferred tax liabilities are presented on a net basis to the extent that the Group companies have a right to set off current tax assets against current tax liabilities and the deferred tax assets and deferred tax liabilities relate to the same taxable entity. Deferred taxes relating to items recognized directly in equity are likewise recognized directly in equity.
INTANGIBLE ASSETS
Acquired and internally generated intangible assets are recognized if it is probable that a future economic benefit will flow to the company from the use of the asset and the cost of the asset can be reliably determined. Acquired intangible assets and internally generated intangible assets are measured at cost. Cost of conversion includes all costs directly allocable to the production process as well as an appropriate portion of production-related overheads. Borrowing costs are expensed as incurred to the extent that the criteria for recognition in the carrying amount of an asset are not satisfied. Purchased and internally generated intangible assets with finite useful lives are amortized using the straight-line method over their useful life. The average useful life of software and licenses remains unchanged at six years. Rights to use the HUGO BOSS brand name which were reacquired in connection with business combinations and the acquisition of other business units (“reacquired rights”) are also recognized under intangible assets and amortized over the contractual useful life. Key money is also considered to be an intangible asset. These are one-off payments made to the previous tenant when leases are entered into for own retail stores in prime locations. The distinction between finite and indefinite useful life is made by reference to the actual circumstances in the countries in which the retail stores are located. Key money with a finite useful life is written down on a straight-line basis over the term of the lease agreement, seven years on average. At present, key money with indefinite useful lives is recognized in France and Denmark.
Intangible assets with an indefinite useful life are tested for impairment once a year. If the carrying amount of the asset is no longer recoverable, an impairment loss is recognized.
PROPERT Y, PL ANT AND EQUIPMENT
Property, plant and equipment that are used in business operations for longer than one year are measured at cost less accumulated depreciation. Cost of conversion includes all costs directly allocable to the production process as well as an appropriate portion of production-related overheads. Borrowing costs are expensed as incurred to the extent that the criteria for recognition in the carrying amount of an asset are not satisfied. The underlying useful lives correspond to the expected useful lives within the Group.
A useful life of 30 years is generally set for buildings. Buildings and leasehold improvements on third-party land are depreciated over the term of the underlying lease agreements or the lower useful lives. The present value of the expected cost for the decommissioning of an asset after its use is included in the cost of the respective asset if the recognition criteria for a corresponding provision are satisfied.
Property, plant and equipment are generally depreciated using the straight-line method. Technical equipment and machinery has a useful life ranging between 5 and 15 years, while other equipment, operating and office equipment has a useful life of between 2 and 15 years.
Annual Report 2014
173
Consolidated Financial StatementsNotes to the Consolidated Financial Statements for Fiscal Year 2014

The useful lives and depreciation methods used for property, plant and equipment are reviewed regularly to ensure that the methods and periods of depreciation are consistent with the expected economic benefit from the items of property, plant and equipment.
IMPAIRMENT OF NON-FINANCIAL ASSETS
Non-financial assets (property, plant and equipment and intangible assets including goodwill) are assessed at every reporting date as to whether there is an indication of impairment (“triggering events”). If there is any such indication, the recoverable amount of the asset is estimated. Irrespective of whether there is any indication of impairment, intangible assets with indefinite useful lives (key money and brand rights) and goodwill acquired in a business combination are tested for impairment annually. The recoverable amount is the higher of fair value of the asset less costs to sell and value in use. The value in use is the present value of the expected cash flows. The expected cash flows are discounted using the after-tax weighted average cost of capital that reflects the risks specific to the asset. In determining fair value less costs to sell, external appraisals are taken into account, if available. If it is not possible to estimate the recoverable amount of an individual asset, the recoverable amount of the smallest identifiable group of assets to which the asset belongs (cash-generating unit – CGU) is determined.
If the carrying amount of the asset or CGU exceeds the corresponding recoverable amount, an impairment loss is immediately recognized through profit or loss. If a CGU is impaired, the carrying amount of any goodwill allocated to the unit is reduced first. Any remaining impairment loss reduces the other non-current assets of the CGU pro rata.
If, following an impairment loss recognized in prior periods, an asset or CGU has a higher recoverable amount, the impairment loss is reversed to the lower of the recoverable amount or the carrying amount that would have been determined (net of amortization or depreciation) had no impairment loss been recognized for the asset in prior periods. The impairment loss is reversed through profit or loss. Reversals of impairment losses recognized on goodwill are not permitted.
ENTIT IES UNDER JOINT CONTROL ACCOUNTED FOR USING THE EQUIT Y METHOD
Companies in which HUGO BOSS and one more party have joint control are accounted for using the equity method and initially recognized at cost. The carrying amounts of investments accounted for using the equity method are increased or decreased annually by the Group’s share of the net profit or loss, dividend distributions or other changes in equity. If the losses incurred by the investment accounted for using the equity method are equal to or exceed the carrying amount, no additional shares in losses are recognized since no loss compensation obligations exist vis-à-vis the investments accounted for using the equity method.
INVENTORIES
Raw materials and supplies as well as merchandise are generally measured at moving average cost. Work in progress and finished goods are measured at cost. Cost of conversion of finished goods includes direct material, direct labor, proportionate material and production overheads, and production-related amortization and depreci-ation insofar as this is a consequence of production. Also included are general administrative expenses, product development expenses, expenses for social facilities, expenses for voluntary social benefits and occupational
Annual Report 2014
174
Consolidated Financial StatementsNotes to the Consolidated Financial Statements for Fiscal Year 2014

pensions, to the extent that they are related to production and are incurred in the production period. Borrowing costs are expensed as incurred to the extent that the criteria for recognition in the carrying amount of an asset are not satisfied.
Inventories are carried at the lower of cost or realizable sales price less costs to sell.
NON- CURRENT ASSETS HELD FOR SALE
Individual non-current assets or disposal groups are classified as “held for sale” if their sale is highly probable and they are available for immediate sale in their present condition. Non-current assets held for sale are reported separately in the statement of financial position and are measured at the lower of their carrying amount and fair value less costs to sell. Depreciation of the assets or disposal groups ceases when they are classified as non-current assets held for sale.
LEASES
In the case of lease arrangements with the Group as lessee, economic ownership of the leased asset is allocated to the lessee in accordance with IAS 17 if substantially all the risks and rewards incidental to ownership of the leased asset are transferred to the Group (finance lease). The depreciation methods and useful lives applied correspond to those for comparable assets acquired for a consideration. Leased assets are generally capitalized as of the date on which the agreement is concluded at the fair value of the leased property or, if lower, the present value of the minimum lease payments. Initial direct costs are added to the carrying amount of the asset. The lease obligations, which correspond to the carrying amount of the leased assets and are amortized and measured in subsequent periods using the effective interest method, are reported under financial liabilities. The interest component of the lease liabilities is reported in the consolidated income statement over the term of the lease.
If economic ownership of a leased asset is attributable to the lessor (operating lease), the leased asset is recog-nized by the lessor. The corresponding lease payments are generally recognized as an expense on a straight-line basis over the lease term.
A substantial number of rental agreements have been entered into within the HUGO BOSS Group which qualify as operating leases based on their substance, such that the leased asset is attributable to the lessor. This concerns in particular the rental agreements for the real estate used by the retail stores operated by the Group, warehouses and office space used by the Group companies, most of which are based on minimum lease payments. Lease arrangements are also in place that contain agreements on contingent rents (particularly rents linked to sales). Some agreements contain renewal options that are taken into account when determining the lease term and present value of the minimum lease payments, if it is reasonably certain at the inception of the lease that the option will be exercised.
FINANCIAL INSTRUMENTS
Pursuant to IAS 39, a financial instrument is a contract that gives rise to both a financial asset of one entity and a financial liability or equity instrument of another entity.
Annual Report 2014
175
Consolidated Financial StatementsNotes to the Consolidated Financial Statements for Fiscal Year 2014

Financial assets encompass cash and cash equivalents, trade receivables and other loans and receivables originated by the Group, derivative financial assets held for trading as well as other financial assets.
Financial liabilities comprise trade payables, liabilities due to banks, liabilities from finance leases, derivative financial liabilities held for trading and other financial liabilities.
Financial assets and financial liabilities, to the extent that they are currently relevant to the HUGO BOSS Group, are classified into the following categories:
a / Financial assets at fair value through profit or loss (FAHfT)b / Loans and receivables (LaR)c / Financial liabilities at fair value through profit or loss (FLHfT)d / Other financial liabilities measured at amortized cost using the effective interest method (FLAC)e / Available-for-sale assets at fair value (AFS)
If there is no active market and fair value cannot be reliably determined, equity instruments are measured at amortized cost.
Financial assets and liabilities are designated to the above categories upon initial recognition. If permitted and necessary, any reclassifications are made at the end of the fiscal year.
FINANCIAL ASSETS
All regular way purchases and sales of financial assets are recognized on the trade date, which is the date that the Group commits to purchase or sell the asset.
Financial assets are recognized initially at fair value. For all financial assets that are not measured at fair value through profit or loss, directly attributable transaction costs are also taken into account.
As a rule, the fair values recognized in the statement of financial position are the market prices of the corresponding financial assets. If these are not available, fair value is determined using generally accepted valuation models by reference to current market parameters. Such techniques include using recent arm’s length market transactions, reference to the current market value of another instrument which is substantially the same, or discounted cash flow analysis and other valuation models.
Cash and cash equivalents recognized in the statement of financial position comprise cash in hand, balances with banks and other short-term deposits with an original term of less than three months; they are measured at amortized cost.
Annual Report 2014
176
Consolidated Financial StatementsNotes to the Consolidated Financial Statements for Fiscal Year 2014

Trade receivables and other loans and receivables are subsequently measured at amortized cost (less any impairment losses), using the effective interest method where applicable. Gains and losses are recognized through profit or loss when the receivables are derecognized, impaired or settled.
Financial assets are measured at fair value through profit or loss if they were acquired for the purpose of selling them in the near future. This includes derivative financial instruments that are not designated to an effective hedging relationship in accordance with IAS 39. Gains and losses from financial assets measured at fair value through profit or loss are always posted to profit or loss.
Financial assets that are not measured at fair value through profit or loss are tested for impairment at every reporting date. If the carrying amount of a financial asset exceeds its fair value, it is reduced to the fair value. This decrease constitutes an impairment loss that is posted through profit or loss. An impairment loss recognized in profit or loss in a prior period is reversed if this is necessary on account of events occurring after it was originally recognized. Available-for-sale assets comprise non-derivative financial assets which are not allocated to any other measurement category and other financial assets which contain non-consolidated subsidiaries.
A financial asset is derecognized when the contractual rights to receive cash flows from the financial asset expire or are transferred. In the latter case, substantially all the significant risks and rewards of ownership of the financial assets must be transferred or control over the asset must be transferred.
FINANCIAL L IABIL IT IES
Financial liabilities are initially measured at fair value less any directly attributable transaction costs.
Derivatives that are not designated to an effective hedging relationship are measured at fair value though profit or loss. Negative fair values are reported under other financial liabilities. Gains and losses from subsequent measurement are recognized in profit or loss.
Trade payables and interest-bearing loans are subsequently measured at amortized cost using the effective interest method. Any resulting gains and losses are posted to profit or loss when the liabilities are derecognized or extinguished.
A financial liability is derecognized when the obligation underlying the liability is discharged, canceled or expired.
DERIVATIVE F INANCIAL INSTRUMENTS
In the HUGO BOSS Group, derivative financial instruments are solely used to hedge interest rate and currency risks from the operating business.
When hedges are entered into, specific derivatives are allocated to hedged items. The requirements of IAS 39 for the designation of hedges are satisfied.
Annual Report 2014
177
Consolidated Financial StatementsNotes to the Consolidated Financial Statements for Fiscal Year 2014
Pursuant to IAS 39, all derivative financial instruments are measured at fair value through profit or loss irrespec-tive of the purpose or intention for which they were concluded. Changes in the fair value of derivative financial instruments are generally recognized in profit or loss.
To the extent that the financial instruments used are effective hedges as part of a hedging relationship in accordance with the requirements of IAS 39 (cash flow hedges), fair value fluctuations during the term of the derivative do not affect profit or loss for the period. Instead, fair value fluctuations are recognized in equity in the corresponding reserve item. The cumulative amounts recognized in equity are recycled through profit or loss in the same period during which the hedged cash flows affect profit or loss.
Fair value generally corresponds to the market value or quoted price. If there is no active market, fair value is determined using generally accepted valuation models and bank valuations. In the HUGO BOSS Group all financial instruments that are not quoted in an active market are measured using observable measurement parameters.
It is the Group’s policy to solely enter into effective derivatives for the purpose of hedging interest and currency risks. The substantive and formal requirements of IAS 39 for hedge accounting were satisfied both at the inception of the hedges and on the reporting date.
OWN SHARES
If the Group reacquires own equity instruments, those instruments are recognized at cost and deducted from equity. No gain or loss is recognized in profit or loss on the purchase, sale, issue or cancellation of the Group’s own equity instruments. Any difference between the carrying amount and the consideration, if sold or reissued, is recognized as a share premium. The Group cannot exercise the voting rights of own shares. Moreover, they are not allocated dividends.
PROVISIONS
Provisions are recognized if a past event has led to a current legal or constructive obligation to third parties which is expected to lead to a future outflow of resources that can be estimated reliably. Provisions are reviewed at each reporting date and adjusted to reflect the current best estimate. Provisions for rebuild obligations in retail stores are recognized as liabilities at the present value of the best estimate of the amount required to settle the obligation. Corresponding assets are capitalized at the equivalent amount and depreciated over the term of the lease agreement. Provisions with a term of more than one year are discounted using a risk-free interest rate. Where the effect of the time value of money is material, the amount of the provision is the present value of the expenditures expected to be required to settle the obligation.
PROVISIONS FOR PENSIONS
Provisions for pensions are measured using the projected unit credit method required under IAS 19 for defined benefit plans, which takes into account future adjustments to salaries and pensions. The year-end present value determined using the projected unit credit method was compared to the fair value of plan assets in external funds to the extent that offsetting is permissible (asset ceiling). Actuarial gains and losses are immediately posted in full to other comprehensive income. Actuarial gains and losses are not reclassified from other comprehensive income to consolidated net income in subsequent years. The same applies to all effects of the asset ceiling. Net interest determined by multiplying the net defined benefit liability by the discount rate underlying the net defined benefit obligation (DBO) is reported in the financial result. The difference between the actual return on plan assets and the anticipated return on plan assets obtained using the discount rate is posted to other comprehensive income. The service cost is reported in the operating result.
Annual Report 2014
178
Consolidated Financial StatementsNotes to the Consolidated Financial Statements for Fiscal Year 2014

RESTRUCTURING PROVISIONS
Restructuring expenses are recognized in the period in which they are incurred or in which the criteria for the recognition of a provision are satisfied. Early termination payments are recognized as an expense and an obligation if the Company has verifiably made a commitment under a formal plan by either offering termination benefits intended as an incentive for voluntary redundancy or has committed to early termination before the normal retirement age is reached.
CONTINGENT L IABIL IT IES AND CONTINGENT ASSETS
Contingent liabilities are not recognized. They are disclosed in the notes to the financial statements, unless an outflow of resources embodying economic benefits is very unlikely. Contingent assets are likewise not recognized. They are disclosed in the notes to the financial statements if an inflow of economic benefits is probable.
SEGMENT REPORTING
In accordance with the management approach, the HUGO BOSS Group’s segment reporting is based on the internal organizational and reporting structure. The data used to determine the internal indicators are derived from the financial statements prepared in accordance with IFRSs.
EXERCISE OF JUDGMENT AND ESTIMATES WHEN APPLYING ACCOUNTING POLICIES
The preparation of the Group’s consolidated financial statements requires management to make judgments, estimates and assumptions that affect the reported amounts of income, expenses, assets and liabilities, and the disclosure of contingent liabilities, at the end of the reporting period. These estimates and assumptions are made to obtain a fair presentation of the Group’s net assets, financial position and results of operations. The underlying assumptions are continually revised. However, actual amounts can deviate from the original estimates.
In the process of applying the Group’s accounting policies, management has made the following judgments, which have the most significant effect on the amounts recognized in the consolidated financial statements:
OBLIGATIONS UNDER OPER ATING LEASES
The Group has entered into leases for retail stores, warehouses and office spaces. These leases are classified as operating leases on the basis of the customary limits for determining the proportion of the useful life of the assets in question and the present value of the minimum lease payments. In this connection, it has been determined that the opportunities and risks arising from ownership of this floor space and real estate leased under operating leases remain with the corresponding property companies and lessors.
Annual Report 2014
179
Consolidated Financial StatementsNotes to the Consolidated Financial Statements for Fiscal Year 2014

CONSOLIDATION OF STRUCTURED ENTIT IES
Leasing companies are recognized in accordance with the guidance provided in IFRS 10 on structured entities. HUGO BOSS consolidates leasing entities if it has power over the entity’s relevant activities and is thus able to affect the amount of the variable returns. In view of the leases which were already determined when two entities were established, HUGO BOSS assumes in its assessment that the decision-making rights with respect to the use of the leased assets during the term of the lease and with respect to the exercise of the call and renewal options provided for in the lease, which were calculated on the basis of the respective expected market value and are therefore unfavorable for HUGO BOSS as at December 31, 2014, do not constitute any decision-making powers with respect to the relevant activities of the entity in question.
The most important forward-looking assumptions and other key sources of estimation uncertainty as at the reporting date giving rise to a significant risk of a material adjustment to the carrying amounts of assets and liabilities within the next fiscal year are explained below.
IMPAIRMENT OF NON-FINANCIAL ASSETS
Specific fundamental assumptions were made to determine the recoverable amount when assessing the recoverability of intangible assets (goodwill, brand rights with indefinite useful lives, key money with finite and indefinite useful lives) and property, plant and equipment of the Group’s own retail business. In this context, the expected cash flows used in impairment testing are derived from budgets from medium-term planning for each respective CGU. Management assumes that the assumptions and estimates underlying the discounted cash flows are appropriate. However, changes in the economic environment and the industry-specific growth assumptions can have consequences for impairment testing resulting in the need to recognize additional impairment losses or to reverse impairment losses in the future.
The key assumptions used to determine the recoverable amount for the different CGUs, including a sensitivity analysis, are further explained in Note 14.
Impairment losses of EUR 15,281 thousand (2013: EUR 13,881 thousand) and reversals of impairment losses of EUR 0 thousand (2013: EUR 2,248 thousand) were made. Further explanations are provided in Notes 10 to 12 and 14.
INVENTORY MEASUREMENT
Write-downs provide for inventory risks from slow-moving goods and the resulting decrease in the recoverability.
Write-downs are recognized on raw materials based on analyses of range of coverage and movement rate. Unfinished goods, finished goods and merchandise are measured based on the net realizable value through the Group’s own sales channels.
Merchandise and finished goods are tested for impairment on the basis of analyses of movement rate, range of coverage, and net realizable value. Impairment losses recognized to account for lower expected sales prices both at the level of the sales companies and from the perspective of the Group are anticipated through these write-down routines.
Inventories of EUR 80,575 thousand (2013: EUR 82,312 thousand) were recognized at net realizable value. In fiscal year 2014, impairment losses of EUR 11,259 thousand were recognized (2013:EUR 13,004 thousand). These are explained in Note 16.
Annual Report 2014
180
Consolidated Financial StatementsNotes to the Consolidated Financial Statements for Fiscal Year 2014

INDIVIDUAL BAD DEBT ALLOWANCES
The recoverability of trade receivables is assessed based on the estimated likelihood of default. Accordingly, receivables from wholesale customers on whose assets insolvency proceedings have been initiated are written off in full (to the extent that any collateral provided is not recoverable) by recognizing individual bad debt allowances. Individual bad debt allowances ranging between 1% and 100% are recognized on overdue receivables. All subsid-iaries of the HUGO BOSS Group have to prepare an analysis of the aging structure of their trade receivables. This permits the recognition of risk-adjusted valuation allowances. External appraisals on the value of collateral were also obtained in the course of assessing the recoverability of receivables.
In the event of the deterioration of the financial position of wholesale customers and concession partners, the amounts actually derecognized can exceed the bad debt allowances already recognized, which can have an adverse impact on the results of operations.
Impairment losses of EUR 15,876 thousand (2013: EUR 15,126 thousand) were recognized as of the reporting date. Further explanations are provided in Note 17.
PROVISIONS
As the HUGO BOSS Group has operating activities in numerous countries, it is subject to many different legal conditions. Owing to the complexity of international requirements, differences arising between the actual events and the assumptions made or any adjustments to such assumptions could necessitate future adjustments to provisions recognized by the Group. Based on reasonable estimates, provisions are recognized for the potential ramifications of legal issues. Such assessment also takes into account the estimation of local, external experts such as lawyers and tax advisors. Any deviations between the original estimates and the actual outcome can impact the Group’s net assets, financial position and results of operations in the given period.
Other provisions of EUR 140,573 thousand (2013: EUR 122,812 thousand) were recognized as of the reporting date. Further explanations are provided in Note 25.
Since 2012, a tax field audit is in progress for the assessment periods 2007 through 2011 at HUGO BOSS AG, which has not been completed yet. Based on the findings available so far and the audit notes of the ongoing tax field audit, the Company has identified potential tax risks from issues recognized and issues not recognized on the face of the statement of financial position as well as from structural changes. As the tax field audit had not been completed at the time of preparing the financial statements, new findings in connection with the tax field audit could lead to changes in the risks provided for as liabilities as of December 31, 2014.
Income tax liabilities of EUR 59,944 thousand (2013: EUR 63,372 thousand) were recognized as of the reporting date. These include provisions relating to risks from the tax field audit of HUGO BOSS AG for the years 2007 through 2011. Further explanations are provided in Note 7.
Annual Report 2014
181
Consolidated Financial StatementsNotes to the Consolidated Financial Statements for Fiscal Year 2014

PROVISIONS FOR PENSIONS
The expense from defined benefit plans is determined based on actuarial calculations. This involves making assumptions about discount rates, future wage and salary increases, mortality rates and future pension increases. The discount rates used are based on the market yields of high-quality, fixed-interest corporate bonds.
Provisions for pensions of EUR 45,628 thousand (2013: EUR 29,795 thousand) were recognized as of the reporting date. Please refer to Note 26 for further details.
DEFERRED TA XES ON UNUSED TA X LOSSES
Deferred tax assets are recognized on unused tax losses to the extent that it is probable that taxable profits will be available in the future against which the unused tax losses can be utilized. In this regard, management exercises judgment as to the expected timing and the amount of the taxable profits and measures deferred tax assets on unused tax losses accordingly.
As of the reporting date, deferred taxes were recognized on unused tax losses amounting to EUR 10,662 thousand (2013: EUR 10,295 thousand). Please refer to Note 7 for further details.
ACCOUNTING TREATMENT OF BUSINESS COMBINATIONS/ACQUISIT IONS OF OTHER
BUSINESS UNITS
Goodwill is disclosed in the statement of financial position in connection with business combinations and the acquisition of other business units. This constitutes the difference between the consideration transferred and the amount of the non-controlling interest in the assets acquired and the liabilities assumed. Moreover, any reacquired rights are capitalized and amortized over their useful lives.
All identifiable assets and liabilities are recognized at fair value upon first-time consolidation. The fair values recognized constitute a significant estimate. If intangible assets are identified, the fair value is determined using appropriate valuation methods taking their nature into account. These measurements are based on various input factors and are partially associated with assumptions of management about the future development of the value of the respective asset and the discount rates used.
No companies or other business units were acquired during fiscal year 2014. Explanations on the acquisitions recognized in fiscal year 2013 can be found in the notes on business combinations/acquisitions of other business units.
Annual Report 2014
182
Consolidated Financial StatementsNotes to the Consolidated Financial Statements for Fiscal Year 2014

BUSINESS COMBINATIONS/ACQUISITIONS OF OTHER BUSINESS UNITS
TAKEOVERS IN F ISCAL YEAR 2014
No companies were acquired in the reporting period from January 1 to December 31, 2014.
TAKEOVERS IN F ISCAL YEAR 2013
In fiscal year 2013, the HUGO BOSS Group acquired a total of ten stores and the associated assets in asset deals from former franchise partners in Australia, the United States and Singapore. In addition, one store was taken over in France as part of a share deal. The business acquisitions were made to support the expansion of the Group’s own retail business.
The following overview shows the allocation of the purchase price to the acquired assets performed in fiscal year 2013 as well as the resulting goodwill:
(in EUR thousand)
2013
Purchase consideration transferred
Agreed purchase price 12,556
Liabilities incurred (552)
Total purchase price 12,003
Fair value of the acquired assets and liabilities assumed
Intangible assets 8,532
Property, plant and equipment 2,875
Inventories 1,870
Cash and cash equivalents 92
Other assets 254
Total assets 13,622
Financial liabilities 933
Trade payables 530
Other liabilities 728
Total liabilities 2,191
Goodwill 572
Control over the assets in each case was achieved through payment of the agreed purchase price. As not all of the information needed for complete recognition of the business acquisitions was available in fiscal year 2013, a purchase price allocation was performed on a preliminary basis.
As part of the purchase price allocations, intangible assets were identified on a preliminary basis in the form of reacquired rights. These are rights to use the HUGO BOSS brand name that HUGO BOSS had granted to the franchise partners for the respective stores under franchise agreements. The franchise agreements were concluded at arm’s length conditions.
Annual Report 2014
183
Consolidated Financial StatementsNotes to the Consolidated Financial Statements for Fiscal Year 2014

Goodwill is attributable to Asia and contains non-separable intangible assets and expected synergy effects. The goodwill is not expected to be tax-deductible. In accordance with IAS 36, it is not amortized but is instead tested for impairment annually.
Total transaction costs amounted to EUR 301 thousand which were recognized immediately through profit or loss in the consolidated income statement in fiscal year 2013.
The purchase price allocations were finalized in fiscal year 2014 within twelve months of the acquisition date in each case. The finalization of the purchase price allocations had only an immaterial effect on the HUGO BOSS Group’s net assets, financial position and results of operations in fiscal year 2014 and the comparable period in 2013.
If the business acquisitions had taken place as of January 1, 2013, Group sales would have been EUR 7,596 thousand higher in fiscal year 2013. The change in consolidated net income would have been immaterial.
The additional consolidated sales generated by the business acquisitions came to EUR 6,751 thousand in fiscal year 2013.
ACQUISITION OF NON-CONTROLLING INTERESTS WITHOUT CHANGE OF CONTROL
Effective from June 30, 2014, HUGO BOSS took over the remaining 40% share in the already fully-consolidated “joint venture” from its long-standing franchise partner Rainbow Group. The shares were acquired by HUGO BOSS International B.V., Amsterdam, the Netherlands, which therefore now holds 100% of the shares in HUGO BOSS Lotus Hong Kong Ltd., Hong Kong, and its subsidiaries in Macau and China. The agreed purchase price for the remaining 40% of the shares is HKD 198,872 thousand (EUR 18,839 thousand), which has already been paid in full. The carrying amount of the non-controlling shares acquired is EUR 27,539 thousand. This figure includes transaction costs in the amount of EUR 79 thousand. The difference of EUR 8,700 thousand between the purchase price and carrying amount of the assets has been recorded directly in equity.
(in EUR thousand)
Dec. 31, 2014
Carrying amount of non-controlling interests acquired 27,539
Consideration paid to non-controlling interests (18,839)
Excess of consideration paid recognized in Group‘s equity 8,700
Annual Report 2014
184
Consolidated Financial StatementsNotes to the Consolidated Financial Statements for Fiscal Year 2014

NOTES TO THE CONSOLIDATED INCOME STATEMENT
1| SALES
(in EUR thousand)
2014 2013
Sale of goods 2,513,952 2,374,270
Licenses 57,664 57,863
TOTAL 2,571,616 2,432,133
2| COST OF SALES
(in EUR thousand)
2014 2013
Cost of purchase 755,406 737,734
Cost of conversion 117,117 114,849
TOTAL 872,523 852,583
Cost of purchase contains the cost of materials, which corresponds to the amount of inventories expensed in the fiscal year. The line item also mainly includes freight-in and customs costs.
In fiscal year 2014, impairment losses on inventories and the reversal of impairment losses previously charged resulted in net income of EUR 655 thousand (2013: net income of EUR 9,509 thousand). This is included in the cost of sales.
Capitalized overheads allocated to production cost comprise the cost of technical product development in the third phase of the collection creation process and the overhead costs of the product implementation and procurement phase.
3| SELLING AND DISTRIBUTION EXPENSES
(in EUR thousand)
2014 2013
Expenses for Group‘s own retail business, sales and marketing organization 764,042 694,410
Marketing expenses 163,003 137,498
Logistic expenses 67,816 59,680
TOTAL 994,861 891,588
Annual Report 2014
185
Consolidated Financial StatementsNotes to the Consolidated Income Statement

The expenses for the Group’s own retail business and the sales and marketing organization mostly relate to personnel and lease expenses for wholesale distribution and retail services. Moreover, selling expenses contain sales-based commission, freight-out and customs costs as well as credit card charges.
The marketing expenses comprise expenses of EUR 180,406 thousand (2013: EUR 154,283 thousand) and income from the allocation of marketing expenses of EUR 17,403 thousand (2013: EUR 16,785 thousand). Income from the allocation of marketing expenses mainly contains costs for the allocation of the cost of store fittings, marketing materials and advertising and sponsorship activities.
Logistics expenses mainly include personnel and lease expenses for warehouse logistics.
In total, selling and distribution expenses contain other taxes of EUR 2,501 thousand (2013: EUR 2,834 thousand).
4| ADMINISTRATION EXPENSES
(in EUR thousand)
2014 2013
General administrative expenses 174,679 169,835
Research and development costs 61,525 58,683
TOTAL 236,204 228,518
Administration expenses primarily comprise rent for premises, maintenance expenses, IT operating expenses and legal and consulting fees as well as personnel expenses in these functions.
Research and development costs in the HUGO BOSS Group primarily relate to the creation of collections. Total expenditure on research and development of EUR 61,525 thousand (2013: EUR 58,683 thousand) breaks down as follows: personnel expenses of EUR 42,254 thousand (2013: EUR 40,447 thousand) amortization of EUR 2,083 thousand (2013: EUR 1,675 thousand), and other operating expenses of EUR 17,188 thousand (2013: EUR 16,561 thousand).
Significant income was generated in the area of administration expenses by cross-charging of other costs and services amounting to EUR 9,141 thousand (2013: EUR 6,629 thousand) and from the reversal of provisions EUR 3,138 thousand (2013: EUR 11,360 thousand).
In total, administration expenses contain other taxes of EUR 3,843 thousand (2013: EUR 2,677 thousand).
5| OTHER OPERATING EXPENSES AND INCOME
The net expense arising from other operating expenses and income of EUR 19,307 thousand in fiscal year 2014 resulted from special items which were essentially related to the early dissolution of the agreement with a trade agent in the Middle East and the closure of the production site in Cleveland, Ohio, which is scheduled for the first half of 2015. Net expense amounted to EUR 3,291 thousand in the previous year and was mainly related to organizational adjustments made in Europe.
Annual Report 2014
186
Consolidated Financial StatementsNotes to the Consolidated Income Statement

Other operating expenses and income include income of EUR 2,600 thousand (2013: income of EUR 381 thousand). Of this, EUR 1,511 thousand were the result of the sale of a showroom in France. As in the prior year, the remaining income of EUR 1,089 thousand is largely attributable to the reversal of provisions.
6| FINANCIAL RESULT
(in EUR thousand)
2014 2013
Interest income on bank deposit 429 539
Other interest income 1,198 1,455
Other interest and similar income 1,627 1,994
Interest expenses from financial liabilities (4,474) (10,013)
Other interest expenses (1,671) (6,409)
Interest and similar expenses (6,145) (16,422)
Net interest income/expenses (4,518) (14,428)
Exchange rat gains/losses from receivable and liabilities 357 (19,027)
Gains/losses from hedging transactions (5,048) 10,449
Other financial expenses/income (2,364) 319
Other financial items (7,055) (8,259)
Financial result (11,573) (22,687)
The interest expenses from financial liabilities contain expenses in connection with interest rate swaps amounting to EUR 1,134 thousand (2013: EUR 5,791 thousand). Other interest expenses contain the net interest amount from provisions for pensions and interest expenses from the measurement of other non-current provisions at present value amounting to EUR 1,384 thousand (2013: EUR 2,865 thousand). In addition, the other interest expenses item contains interest on non-financial liabilities such as tax liabilities.
The exchange rate gains and losses from receivables and liabilities comprise exchange rate gains of EUR 25,668 thousand (2013: EUR 21,468 thousand) and exchange rate losses of EUR 25,311 thousand (2013: EUR 40,495 thousand). The result from hedging transactions contains the effects from the fair value measurement of foreign exchange forwards and swaps.
Annual Report 2014
187
Consolidated Financial StatementsNotes to the Consolidated Income Statement
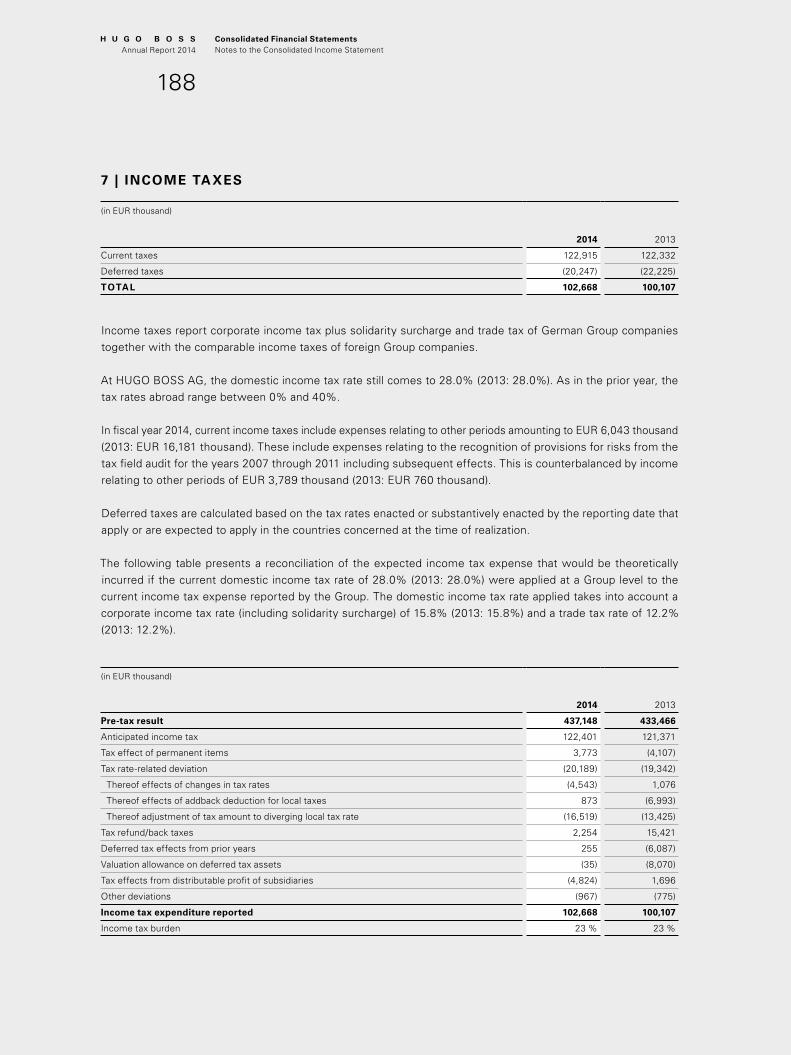
7 | INCOME TAXES
(in EUR thousand)
2014 2013
Current taxes 122,915 122,332
Deferred taxes (20,247) (22,225)
TOTAL 102,668 100,107
Income taxes report corporate income tax plus solidarity surcharge and trade tax of German Group companies together with the comparable income taxes of foreign Group companies.
At HUGO BOSS AG, the domestic income tax rate still comes to 28.0% (2013: 28.0%). As in the prior year, the tax rates abroad range between 0% and 40%.
In fiscal year 2014, current income taxes include expenses relating to other periods amounting to EUR 6,043 thousand (2013: EUR 16,181 thousand). These include expenses relating to the recognition of provisions for risks from the tax field audit for the years 2007 through 2011 including subsequent effects. This is counterbalanced by income relating to other periods of EUR 3,789 thousand (2013: EUR 760 thousand).
Deferred taxes are calculated based on the tax rates enacted or substantively enacted by the reporting date that apply or are expected to apply in the countries concerned at the time of realization.
The following table presents a reconciliation of the expected income tax expense that would be theoretically incurred if the current domestic income tax rate of 28.0% (2013: 28.0%) were applied at a Group level to the current income tax expense reported by the Group. The domestic income tax rate applied takes into account a corporate income tax rate (including solidarity surcharge) of 15.8% (2013: 15.8%) and a trade tax rate of 12.2% (2013: 12.2%).
(in EUR thousand)
2014 2013
Pre-tax result 437,148 433,466
Anticipated income tax 122,401 121,371
Tax effect of permanent items 3,773 (4,107)
Tax rate-related deviation (20,189) (19,342)
Thereof effects of changes in tax rates (4,543) 1,076
Thereof effects of addback deduction for local taxes 873 (6,993)
Thereof adjustment of tax amount to diverging local tax rate (16,519) (13,425)
Tax refund/back taxes 2,254 15,421
Deferred tax effects from prior years 255 (6,087)
Valuation allowance on deferred tax assets (35) (8,070)
Tax effects from distributable profit of subsidiaries (4,824) 1,696
Other deviations (967) (775)
Income tax expenditure reported 102,668 100,107
Income tax burden 23 % 23 %
Annual Report 2014
188
Consolidated Financial StatementsNotes to the Consolidated Income Statement

The income tax burden was reduced by tax-free income of EUR 11,332 thousand (2013: EUR 9,181 thousand). The opposite tax effects as a result of the non-deductible business expenses come to EUR 15,105 thousand (2013: EUR 5,074 thousand).
Tax effects from the add-back/deduction for local taxes amounting to EUR 873 thousand (2013: income of EUR 6,993 thousand) stem for the most part from the requirements on trade tax additions and deductions for the calculation of the trade tax assessment basis.
Additional deviations related to the tax rate amounting to EUR 16,519 thousand (2013: EUR 13,425 thousand) are attributable to the difference between the nominal income tax rate of 28.0% in Germany and the effective tax rates abroad.
In addition to the effects from the origination or reversal of temporary differences between carrying amounts in the consolidated financial statements and the tax bases, the deferred tax expense includes income from the impact of changes in tax rates of EUR 4,543 thousand (2013: expenses of EUR 1,076 thousand).
Deferred tax expense from prior years of EUR 255 thousand was recognized in fiscal year 2014 (2013: income of EUR 6,087 thousand). This is mainly attributable to the recognition of deferred tax liabilities and the derecognition of deferred tax assets attributable to corrections in prior years.
Other comprehensive income includes deferred taxes amounting to EUR 4,549 thousand (2013: EUR 924 thousand). Of this amount, EUR 700 thousand (2013: EUR 1,487 thousand) is attributable to the recognition directly in equity of fluctuations in the fair value of derivatives designated to hedging relationships and income of EUR 3,849 thousand (2013: income of EUR 563 thousand) from the recognition of actuarial gains and losses from provisions for pensions in equity.
Deferred tax assets and liabilities are presented on a net basis if they pertain to the same taxable entity and the same taxation authority. Deferred taxes in the consolidated statement of financial position are related to the following items:
(in EUR thousand)
2014 2013
Deferred tax assets
Deferred tax liabilities
Deferred tax assets
Deferred tax liabilities
Provisions and other liabilities 44,938 (42,730) 33,375 (15,588)
Unused tax losses 20,923 0 23,070 0
Inventory measurement 42,374 (3,733) 39,835 (3,298)
Recognition and measurement of non-current assets 53,269 (14,392) 22,787 (16,878)
Receivables measurement 6,968 (2,478) 4,842 (2,153)
Market valuation of financial instruments 1,802 0 1,793 (2,497)
Retained earnings of subsidiaries 0 (2,768) 0 (7,334)
Other differences in recognition and measurement 442 (1,374) 132 (1,507)
170,716 (67,475) 125,834 (49,255)
Impairments 1 (12,991) 0 (13,348) 0
Netting (57,343) 57,343 (31,793) 31,793
TOTAL 100,382 (10,132) 80,693 (17,462)1 Including unrecognized unused tax losses.
Annual Report 2014
189
Consolidated Financial StatementsNotes to the Consolidated Income Statement

Deferred tax assets are recognized for all deductible temporary differences, unused tax credits and unused tax losses and interest carryforwards, to the extent that it is probable that taxable profit will be available against which the deductible temporary differences and the unused tax credits and unused tax losses and interest carryforwards can be utilized.
Of the deferred tax assets, EUR 76,373 thousand (2013: EUR 41,976 thousand) are non-current, while EUR 60,369 thousand (2013: EUR 41,306 thousand) of the deferred tax liabilities are non-current. The full amount is reported as non-current in the statement of financial position.
If there is uncertainty as to their future recoverability, deferred taxes on unused tax losses and temporary differences are not recognized or are written down. Such write-downs are determined by taking into account all positive and negative factors influencing the generation of sufficient future profit.
Deferred taxes were written down by EUR 10,261 thousand (2013: EUR 12,775 thousand) due to unused tax losses that are not expected to be usable in the future and by EUR 2,730 thousand (2013: EUR 573 thousand) due to temporary differences.
Distributable profits at foreign subsidiaries are to be paid out in the coming years, partly to Germany. The tax expense attributable to the distribution amounting to EUR 1,200 thousand (2013: EUR 1,200 thousand) was recognized as a deferred tax liability. In addition, deferred taxes were recognized for distributable profits from subsidiaries paid out to other subsidiaries to the extent that withholding tax is payable on future dividends. Deferred tax liabilities of EUR 1,568 thousand (2013: EUR 6,134 thousand) were recognized for these withholding tax expenses.
Further deferred tax liabilities were not recognized on distributable profits at subsidiaries amounting to EUR 381,013 thousand (2013: EUR 509,582 thousand) as the present intention is to permanently reinvest these profits. If the profits were to be distributed in Germany, 5% would be subject to taxation in Germany or possibly trigger withholding tax in other countries. Distributions thus as a rule lead to an added tax expense. Estimation of unrecognized deferred tax liabilities on undistributed profits would require an unreasonable effort.
Unused income tax losses mainly pertain to foreign Group companies and break down as follows:
(in EUR thousand)
2014 2013
Expiry within
1 year 8,700 2,222
2 years 1,122 8,687
3 years 6,809 1,082
4 years 7,161 8,366
5 years 3,276 7,123
After 5 years 25,490 33,544
unlimited carryforward 19,170 14,844
TOTAL 71,728 75,868
Annual Report 2014
190
Consolidated Financial StatementsNotes to the Consolidated Income Statement

As in prior fiscal years, a corresponding deferred tax asset of EUR 10,662 thousand was recognized on unused tax losses as of December 31, 2014 (2013: EUR 10,295 thousand). In fiscal year 2014, no deferred taxes were recognized on unused tax losses of EUR 32,249 thousand (2013: EUR 43,260 thousand).
8| NON-CONTROLLING INTERESTS IN CONSOLIDATED NET INCOME
The consolidated financial statements include companies in which HUGO BOSS AG has a shareholding that is less than 100%. In accordance with IFRS 10, non-controlling interests are reported in the statement of financial position within equity, separately from equity attributable to equity holders of the parent company. Net income attributable to non-controlling interests is likewise reported separately in the consolidated income statement.
9| EARNINGS PER SHARE
In accordance with IAS 33, earnings per share is determined by dividing net income attributable to the equity holders of the parent company by the weighted average number of shares outstanding during the fiscal year.
There were no shares outstanding that could have diluted earnings per share as of December 31, 2014, or December 31, 2013.
(in EUR thousand)
2014 2013
Net income attributable to equity holders of the parent company 333,262 328,965
Average number of shares outstanding 1 69,016,167 69,016,167
Earnings per share (EPS) in EUR 2 4.83 4.771 Not including own shares.2 Basic and diluted earnings per share.
10| ADDITIONAL DISCLOSURES TO THE CONSOLIDATED INCOME STATEMENT
PERSONNEL EXPENSES
(in EUR thousand)
2014 2013
Cost of sales 88,957 84,354
Selling and distribution expenses 283,093 267,817
Administration expenses 133,300 128,650
Other operating expenses/income 9,001 2,244
TOTAL 514,351 483,065
Annual Report 2014
191
Consolidated Financial StatementsNotes to the Consolidated Income Statement

The special items included in other operating expenses and income in fiscal year 2014 amounting to EUR 9,001 thousand were essentially related to the closing of the production site in Cleveland, Ohio, which is scheduled for the first half of 2015 and organizational adjustments made in Europe and the Americas.
The special items included in other operating expenses and income in fiscal year 2013 amounting to EUR 2,244 thousand mainly relate to the organizational adjustments made in Europe.
(in EUR thousand)
2014 2013
Wages and salaries 435,692 411,383
Social security 72,405 65,837
Expenses and income for retirement and other employee benefits 6,254 5,845
TOTAL 514,351 483,065
The average headcount for the year was as follows:
2014 2013
Industrial employees 4,861 4,740
Commercial and administrative employees 9,652 8,934
TOTAL 14,513 13,674
AMORTIZ ATION AND DEPRECIATION
(in EUR thousand)
2014 2013
Cost of sales 5,656 5,461
Selling and distribution expenses 96,237 78,799
Administration expenses 20,867 21,002
TOTAL 122,760 105,262
Amortization of intangible assets and depreciation of property plant and equipment amount to EUR 122,760 thousand (2013: EUR 105,262 thousand). A breakdown of amortization and depreciation to the corresponding positions of the statement of financial position is presented in the following notes to the consolidated statement of financial position.
COST OF MATERIALS
In the past fiscal year, the cost of materials came to EUR 715,081 thousand (2013: EUR 706,211 thousand).
Annual Report 2014
192
Consolidated Financial StatementsNotes to the Consolidated Income Statement

NOTES TO THE CONSOLIDATED STATEMENT OF FINANCIAL POSITION
PROPERTY, PLANT AND EQUIPMENT AND INTANGIBLE ASSETS
(in EUR thousand)
Property, plant and equipment
Intangible assets TOTAL
Cost of acquisition
January 1, 2013 806,920 238,028 1,044,948
Change in the basis of consolidation (55,567) 2,453 (53,114)
Currency translation effects (20,390) (4,253) (24,643)
Additions 163,045 20,196 183,241
Disposals (26,158) (9,108) (35,266)
Transfers 4,101 (8,363) (4,262)
December 31, 2013 871,951 238,953 1,110,904
Change in the basis of consolidation 0 0 0
Currency translation effects 33,591 5,624 39,215
Additions 109,428 25,307 134,735
Disposals (45,780) (3,152) (48,932)
Transfers (15,798) (1,218) (17,016)
December 31, 2014 953,392 265,514 1,218,906
Amortization, depreciation and impairment
January 1, 2013 449,466 95,818 545,284
Change in the basis of consolidation 554 0 554
Currency translation effects (12,825) (911) (13,736)
Amortization and depreciation 76,160 17,469 93,629
Impairment 10,644 989 11,633
Disposals (23,503) (6,500) (30,003)
Transfers 2,873 (7,135) (4,262)
December 31, 2013 503,369 99,730 603,099
Change in the basis of consolidation 0 0 0
Currency translation effects 20,564 1,829 22,393
Amortization and depreciation 88,846 18,633 107,479
Impairment 15,022 259 15,281
Disposals (43,096) (1,717) (44,813)
Transfers (14,662) (1,218) (15,880)
December 31, 2014 570,043 117,516 687,559
Carrying amount December 31, 2014 383,349 147,998 531,347
Carrying amount December 31, 2013 368,582 139,223 507,805
Annual Report 2014
193
Consolidated Financial StatementsNotes to the Consolidated Statement of Financial Position

11| INTANGIBLE ASSETS
(in EUR thousand)
Software, licenses and other rights Brand rights Key Money
InternallydevelopedSoftware Goodwill TOTAL
Cost of acquisition
January 1, 2013 146,547 14,992 31,925 5,603 38,961 238,028
Change in the basis of consolidation (525) 0 2,978 0 0 2,453
Currency translation effects (1,208) 0 (1,045) 0 (2,000) (4,253)
Additions 19,444 0 218 0 534 20,196
Disposals (5,956) 0 (3,152) 0 0 (9,108)
Transfers (8,515) 0 152 0 0 (8,363)
December 31, 2013 149,787 14,992 31,076 5,603 37,495 238,953
Change in the basis of consolidation 0 0 0 0 0 0
Currency translation effects 3,391 0 612 0 1,621 5,624
Additions 22,305 0 2,583 0 419 25,307
Disposals (2,969) 0 (183) 0 0 (3,152)
Transfers (1,715) 0 0 0 497 (1,218)
December 31, 2014 170,799 14,992 34,088 5,603 40,032 265,514
Amortization/impairment
January 1, 2013 76,149 0 12,886 5,603 1,180 95,818
Change in the basis of consolidation 0 0 0 0 0 0
Currency translation effects (495) 0 (369) 0 (47) (911)
Amortizazion 15,554 0 1,915 0 0 17,469
Impairment 30 0 959 0 0 989
Disposals (5,531) 0 (969) 0 0 (6,500)
Transfers (7,071) 0 (64) 0 0 (7,135)
December 31, 2013 78,636 0 14,358 5,603 1,133 99,730
Change in the basis of consolidation 0 0 0 0 0 0
Currency translation effects 1,514 0 315 0 0 1,829
Amortization 16,873 0 1,760 0 0 18,633
Impairment 0 0 259 0 0 259
Disposals (1,557) 0 (160) 0 0 (1,717)
Transfers (1,218) 0 0 0 0 (1,218)
December 31, 2014 94,248 0 16,532 5,603 1,133 117,516
Carrying amount December 31, 2014 76,551 14,992 17,556 0 38,899 147,998
Carrying amount December 31, 2013 71,151 14,992 16,718 0 36,362 139,223
Annual Report 2014
194
Consolidated Financial StatementsNotes to the Consolidated Statement of Financial Position

SOF T WARE, L ICENSES AND OTHER R IGHTS
The item software, licenses and other rights mainly contains software and software licenses as well as intangible assets identified in the course of purchase price allocations.
The Columbus IT project launched in fiscal year 2003 led to the acquisition of new software covering all areas of enterprise resource management. This affected systems for procurement, production management, logistics, distribution and financial systems (worldwide). Over the full duration of the project, intangible assets totaling EUR 76,318 thousand (2013: EUR 68,223 thousand) were capitalized in connection with Columbus for the ERP system, comprising the industry solution SAP AFS and SAP Retail for the company’s own retail business. Of this total cost, EUR 49,531 thousand had already been amortized as of the reporting date (2013: EUR 42,883 thousand). As a result of investments in software and user rights in connection with the continuous enhancement of the ERP system, the remaining amortization period has increased to 4.0 years (2013: 3.0 years). Apart from the aforementioned software, other software licenses totaling EUR 33,471 thousand (2013: EUR 26,670 thousand) are included, whose remaining amortization period is 5.5 years (2013: 6.6 years). The disposals from the change in the basis of consolidation in fiscal year 2013 stemmed from the deconsolidation of Distributionszentrum Vermietungsgesellschaft mbH & Co. Objekt HUGO BOSS Filderstadt KG.
In addition, the line item software, licenses and other rights contains intangible assets from purchase price allocations. As part of the acquisition accounting of the joint venture entities in fiscal year 2010, some of the items capitalized included business licenses and franchise agreements that had a net carrying amount of EUR 12,667 thousand as of December 31, 2014 (2013: EUR 12,475 thousand) and a remaining amortization period of 10.6 years (2013: 11.5 years). The franchise agreements identified as part of the purchase price allocation of the mono-brand stores of the franchise partner Moss Bros in Great Britain in 2011 are reported at a net carrying amount of EUR 833 thousand as of the reporting date (2013: EUR 1,760 thousand). The remaining amortization period is a further 0.6 years (2013: 1.1 years). When the purchase price allocation was finalized for franchise agreements identified in fiscal year 2013, an insignificant reclassification was effected within intangible assets.
BR AND RIGHTS
The reported brand rights amounting to EUR 14,992 thousand (2013: EUR 14,992 thousand), which are primarily attributable to the rights for the use of the brand names BOSS, HUGO and HUGO BOSS in the United States, are also classified as assets with indefinite useful lives.
KEY MONEY
Key money totaling EUR 17,556 thousand (2013: EUR 16,718 thousand) was recognized as of the reporting date. Of that amount, 6,353 thousand (2013: EUR 5,776 thousand) pertains to key money with an indefinite useful life and EUR 11,203 thousand (2013: EUR 10,942 thousand) to key money with a finite useful life. As of December 31, 2014, key money with an indefinite useful life only concerns DOS in France at EUR 6,353 thousand (2013: EUR 5,776 thousand). The key money with an indefinite useful life in Denmark had already been written off in full in fiscal year 2013. Key money with a finite useful life primarily concerns DOS in Switzerland, Great Britain and Brazil. An amortization period of 6.4 years remains (2013: 5.7 years).
Further information on the impairment losses can be found in Note 14.
Annual Report 2014
195
Consolidated Financial StatementsNotes to the Consolidated Statement of Financial Position

12| PROPERTY, PLANT AND EQUIPMENT
(in EUR thousand)
Lands andbuildings
Technicalequipment and
machinery
Other equipment,operating and
office equipmentConstruction
in progress TOTAL
Cost of acquisition
January 1, 2013 252,872 87,077 442,233 24,738 806,920
Change in the basis of consolidation (17,849) 0 1,071 (38,789) (55,567)
Currency translation effects (5,400) (413) (14,464) (113) (20,390)
Additions 21,328 3,754 104,991 32,972 163,045
Disposals (3,923) (1,812) (20,423) 0 (26,158)
Transfers 8,127 19 9,440 (13,485) 4,101
December 31, 2013 255,155 88,625 522,848 5,323 871,951
Change in the basis of consolidation 0 0 0 0 0
Currency translation effects 5,476 550 27,496 69 33,591
Additions 11,633 1,908 93,020 2,867 109,428
Disposals (3,665) (2,470) (39,645) 0 (45,780)
Transfers (3,093) (8,594) (1,102) (3,009) (15,798)
December 31, 2014 265,506 80,019 602,617 5,250 953,392
Depreciation/impairment
January 1, 2013 114,532 63,902 271,032 0 449,466
Change in the basis of consolidation 0 0 554 0 554
Currency translation effects (3,015) (404) (9,406) 0 (12,825)
Depreciation 13,196 5,084 57,880 0 76,160
Impairment (380) 0 11,024 0 10,644
Disposals (3,238) (1,619) (18,646) 0 (23,503)
Transfers 0 0 2,870 3 2,873
December 31, 2013 121,095 66,963 315,308 3 503,369
Change in the basis of consolidation 0 0 0 0 0
Currency translation effects 5,462 527 14,575 0 20,564
Depreciation 15,195 4,637 69,014 0 88,846
Impairment 0 0 15,022 0 15,022
Disposals (3,544) (2,468) (37,084) 0 (43,096)
Transfers (2,615) (8,363) (3,684) 0 (14,662)
December 31, 2014 135,593 61,296 373,151 3 570,043
Carrying amount December 31, 2014 129,913 18,723 229,466 5,247 383,349
Carrying amount December 31, 2013 134,060 21,662 207,540 5,320 368,582
Annual Report 2014
196
Consolidated Financial StatementsNotes to the Consolidated Statement of Financial Position

Land charges in connection with land and buildings amount to EUR 42,043 thousand (2013: EUR 45,019 thou-sand).
Impairment losses of EUR 15,022 thousand (2013: EUR 10,644 thousand) were recognized on property, plant and equipment, which have been allocated to the corresponding functions in the consolidated income statement. Most of the impairment losses were recognized after impairment testing of property, plant equipment in connection with the Group’s own retail business. No impairment losses (2013: EUR 1,868 thousand) or impairment reversals (2013: EUR 2,248 thousand) were recognized on land and buildings in fiscal year 2014. Transfers mainly relate to the reclassification as “non-current assets held for sale”. Further information on the impairment losses can be found in Note 14.
The changes in the basis of consolidation in fiscal year 2013 concern from the deconsolidation of Distributionszen-trum Vermietungsgesellschaft mbH & Co. Objekt HUGO BOSS Filderstadt KG as well as the business combination in France.
13| NON-CURRENT ASSETS HELD FOR SALE
As part of the consolidation process for its production sites, HUGO BOSS reached and announced its decision in the fourth quarter of 2014 to close its site in Cleveland, Ohio, in the first half of 2015. As a result of the intent to sell in fiscal year 2015, property, plant and equipment and intangible assets relating to buildings, technical equipment and machines in the amount of EUR 1,136 thousand belonging to HUGO BOSS Cleveland, Inc., Cleveland, Ohio, USA, were classified as “non-current assets held for sale”.
14| IMPAIRMENT TESTING IN THE HUGO BOSS GROUP
Non-financial assets (property, plant and equipment and intangible assets including goodwill) are assessed at every reporting date as to whether there is an indication of impairment (“triggering events”). Irrespective of whether there is any indication of impairment, intangible assets with indefinite useful lives (key money and brand rights) and goodwill acquired in a business acquisition are tested for impairment annually. As of the reporting date December 31, 2014, the following non-current assets were tested for impairment in the course of annual impairment testing or in response to a triggering event:
• Depreciated property, plant and equipment and amortized intangible assets at the Group’s own retail store level• Other intangible assets with indefinite useful lives (key money) • Brand rights with an indefinite useful life • Goodwill
The assessment of impairment is based on detailed planning of results of operations, of the statement of financial position and of investments for the next three years for all units of the Group prepared annually in the company-wide budget planning process, taking account of the current business situation. For periods beyond the planning horizon of the budget, a long-term growth rate is set to project future cash flows. The long-term growth rates used for this purpose are consistent with external sources of information. Investment and trade net working capital planning is based on budget planning data and is extrapolated on the basis of historical experience.
Annual Report 2014
197
Consolidated Financial StatementsNotes to the Consolidated Statement of Financial Position

The cost of capital for the HUGO BOSS Group determined using an after-tax WACC model that discounts all forecast cash flows in local currency, while factoring in both general market and country-specific risk mark-ups (sovereign risk mark-up) as well as a currency risk mark-up (inflation risk mark-up). The after-tax cost of capital rate used as of December 31, 2014, is based on a risk-free interest rate of 2.0% (2013: 2.75%) and a market risk mark-up of 5.5% (2013: 5.5%).
DEPRECIATED PROPERT Y, PL ANT AND EQUIPMENT AND AMORTIZED INTANGIBLE ASSETS AT
THE GROUP’S OWN RETAIL STORES LEVEL
In the HUGO BOSS Group, the directly operated stores (DOS) have been identified as a CGU, i.e., the smallest group of assets that can independently generate cash flows.
The DOS assets amortized or depreciated on a systematic basis are tested for impairment if there are indications or changes to planning assumptions suggesting that the carrying amount of the assets is not recoverable. For this purpose, after preparing the annual budget planning, HUGO BOSS conducts a triggering event test at DOS level. If defined year-on-year sales and profitability indicators are not reached, the non-current assets of the DOS in question are tested for impairment.
The recoverable amount of the DOS is determined by calculating the value in use based on a discounted cash flow method. The planned cash flows for the DOS from the bottom-up one-year budget approved by management of HUGO BOSS AG are used for this purpose. The forecast period is derived based on the expected useful lives for all DOSs and is reassessed annually. After the bottom-up budget, the values for the remaining useful lives are determined based on sales and cost developments specific to each country and CGU. The growth rates used for this purpose are based on the nominal, expected retail growth in each respective market for the corresponding planning year. Single-digit growth rates were thus determined for most DOSs. Low double-digit growth rates were determined for some emerging markets. At the end of the residual useful life, it is assumed that the respective DOS is wound up and that sales proceeds are obtained equivalent to the residual value of the operating assets. When calculating the value in use of the DOS, cash flows were discounted using a weighted average cost of capital of between 4.4% and 14.8% (2013: between 4.5% and 16.5%). This was based on a risk-free interest rate of 0.8% (2013: 1.3%) with an equivalent term.
DOS impairment testing in the past fiscal year resulted in impairment losses of EUR 15,281 thousand (2013: EUR 13,178 thousand), which were immediately recognized in the income statement under selling and distribution expenses. In response to negative developments in the profitability of individual locations, impairment losses had to be recognized on the non-current assets of certain DOSs following impairment testing. The increase is primarily attributable to retail store locations in the Americas and Asia/Pacific. Impairment losses in Europe, on the other hand, were lower than the prior year.
Annual Report 2014
198
Consolidated Financial StatementsNotes to the Consolidated Statement of Financial Position

GOODWILL AND INTANGIBLE ASSETS WITH INDEFINITE USEFUL L IFE
The following table presents the main assumptions underlying the calculation of the value in use or fair value less costs to sell of the goodwill and intangible assets with indefinite useful lives assigned to each group of CGUs:
(in EUR thousand)
Carrying amount Assumptions
Goodwill
Intangible assets with indefinite
useful life WACCLong-term
growth rate
2014
Europe 277 6,353 6.9–8.1% 3.2–3.3%
Sales unit UK 277 0 8.1% 3.2%
DOS within the sales unit France 0 6,353 6.9% 3.3%
Asia/Pacific 232 0 8.0% 3.8%
Sales unit USA 232 0 8.0% 3.8%
Asia/Pacific 19,680 0 7.8–8.3% 3.6–5.0%
Sales unit Shenzhen 4,746 0 8.2% 5.0%
Sales unit Macau 5,935 0 7.8% 3.9%
Sales unit Australia 8,587 0 8.3% 4.9%
Sales unit Singapore 412 0 8.1% 3.6%
Licenses 0 14,992 8.0–8.3% 2.4–3.8%
Brand rights U.S.A. 0 13,615 8.0% 3.8%
Brand rights Italy 0 1,377 8.3% 2.4%
Corporate Units 18,710 0 8.3% 2.0%
Production unit shoes and leather accessories Italy 18,710 0 8.3% 2.0%
TOTAL 38,899 21,345 6.9–8.3% 2.0–5.0%
2013
Europe 259 5,776 8.1–8.6% 2.8–4.1%
Sales unit UK 259 0 8.6% 4.1%
DOS within the sales unit France 0 5,776 8.1% 2.8%
Asia/Pacific 17,399 0 8.0–9.8% 4.1–6.0%
Sales unit Shenzhen 4,219 0 9.8% 6.0%
Sales unit Macau 5,214 0 8.0% 4.1%
Sales unit Australia 7,782 0 9.4% 4.9%
Sales unit Singapore 184 0 8.2% 4.2%
Licenses 0 14,992 8.4–10.7% 1.6–4.1%
Brand rights U.S.A. 0 13,615 8.4% 4.1%
Brand rights Italy 0 1,377 10.7% 1.6%
Corporate Units 18,710 0 10.7% 1.9%
Production unit shoes and leather accessories Italy 18,710 0 10.7% 1.9%
TOTAL 36,368 20,768 8.0–10.7% 1.6–6.0%
Annual Report 2014
199
Consolidated Financial StatementsNotes to the Consolidated Statement of Financial Position

In the table, goodwill was allocated to Europe, the Americas and Asia/Pacific and linked to the corporate units and the relevant CGU. The takeover of the mono-brand stores in fiscal year 2011 gave rise to goodwill that is allocable to the sales unit UK. Goodwill stemming from the acquisition of stores from a former franchise partner in 2013 is allocable to the sales unit USA. In Asia/Pacific, goodwill acquired from the acquisition of the shares in the sales units Lotus (Shenzhen) Commerce Limited and Lotus Concept Trading (Macau) Co., Ltd., in fiscal year 2010. Goodwill from the acquisition of shares in the Australia sales unit in 2002 as well as the takeover of a retail store operated by a franchise partner in 2013 are allocated to the Australia sales unit. Goodwill also arose in fiscal year 2013 from the takeover of a franchise partner in Singapore. The goodwill allocated to the corporate units results from the acquisition of shares in the companies of the shoes and leather accessories business unit in fiscal year 2004.
The table presents the combined intangible assets with indefinite useful lives for all countries in Europe. The key money with an indefinite useful life is allocable to various retail locations in the markets France and Denmark; viewed individually, these are not material. Brand rights for the use of the brands, mainly for the U.S. and Italian markets, are allocated to the licenses segment. Brand rights are tested for impairment at country level.
The procedure used to assess the recoverability of goodwill and intangible assets with indefinite useful lives at CGU level is presented below:
OTHER INTANGIBLE ASSETS WITH AN INDEFINITE USEFUL L IFE (KEY MONEY)
Key money with an indefinite useful life paid in connection with the conclusion of a rental agreement is tested for impairment once a year or if there are indications of impairment. The recoverable amount of the CGU is determined with the assistance of external appraisals that calculate either the fair value less costs to sell or the value in use using discounted cash flow models.
For DOS to which key money with an indefinite useful life was allocated, no impairment losses were recognized in fiscal year 2014 (2013: EUR 605 thousand). In fiscal year 2013, the impairment losses mainly concern the key money of two DOS in France, caused by the change in the local real estate market.
BR AND RIGHTS WITH AN INDEFINITE USEFUL L IFE
The brand rights with an indefinite useful life are primarily attributable to rights acquired in 1997 for the use of the brands BOSS, HUGO and HUGO BOSS in the United States and the brand rights acquired in Italy. The indefinite useful life stems from the estimate of an indefinite use of the registered brand name.
The recoverable amount of brand rights with an indefinite life is determined based on fair value less costs to sell and classified as Level 3 of the fair value hierarchy pursuant to IFRS 13. This is based on a sales forecast for the respective market approved by management as part of the budget process. Country-specific sales growth rates are also used. After the five-year detailed planning phase, planned sales are extrapolated using a long-term nominal retail growth rate for each of the respective markets.
No impairment losses were recognized on the brand rights with indefinite useful lives in fiscal years 2014 and 2013.
Annual Report 2014
200
Consolidated Financial StatementsNotes to the Consolidated Statement of Financial Position

GOODWILL
The recoverable amount of the respective CGUs was derived from the value in use determined using cash flow projections based on medium-term financial budgets approved by management. Restructuring to which the Group has not yet committed to and investment to improve or enhance the earnings power of the tested CGU that is not allocable to current business operations are not taken into account. After the detailed planning phase, country-specific sales growth rates derived from normal retail growth are used.
As in the prior year, no impairment losses were recognized on any goodwill in fiscal year 2014.
KEY ASSUMPTIONS USED TO CALCUL ATE THE VALUE IN USE AND
FAIR VALUE LESS COSTS TO SELL
The following key assumptions, estimation uncertainty and judgments by management underlie the calculation of the value in use and fair value less costs to sell of the aforementioned assets:
• Nominal, long-term retail growth • Gross profit margin • Fixed cost development • Discount rates • Expected useful life of DOS
Estimation of growth rate – Growth rates are derived from published market research for the industry that is based on country-specific nominal retail growth. These growth rates were mainly factored in after the detailed planning phase and in the terminal value used to calculate the value in use.
Estimating gross profit margin – The planned gross profit margin factors in both efficiency improvements and margin shifts due to differences in the sales mix of the various channels. A constant gross profit margin was assumed after the detailed planning phase.
Cost development – The cost development is derived from growth of real gross domestic product in each country and the inflation rate in each country.
Discount rates – The discount rates reflect current market assessments of the risks specific to each CGU. This takes into account the interest effect and the risks specific to the assets. Country-specific costs of capital are taken into account for individual CGUs, which factor in sovereign risk and a currency risk mark-ups. The after-tax weighted average cost of capital (WACC) takes into account both debt and equity. In addition, the beta factor, the cost of borrowed capital and the capital structure are derived by reference to a peer group in accordance with IAS 36 and calculated based on publicly available market data.
Annual Report 2014
201
Consolidated Financial StatementsNotes to the Consolidated Statement of Financial Position

Useful life of DOS – The forecast period underlying the impairment testing of non-current assets at DOS level amortized or depreciated on a systematic basis is based on the average remaining terms of the lease agreements. These are determined and reassessed annually. Prolongation options are taken into account when determining the average remaining terms if management can exercise the option without incurring significant costs.
SENSITIVIT Y TO CHANGES IN ASSUMPTIONS
As of December 31, 2014, scenarios for critical measurement parameters such as the discount rates used and the growth rates underlying forecast cash flows were determined to verify the values in use determined. Management of the HUGO BOSS Group considers it plausible for the discount rate to increase by 10.0% on average in relative terms. In addition, for the DOS under review and the CGUs to which goodwill is allocated, an annual relative divergence in growth rates of 15.0% in the detailed planning phase is deemed plausible. Furthermore, for the CGUs to which goodwill is allocated, a 15.0% decrease in the relative sales growth rates underlying the extrapolation of cash flows after the detailed planning phase is deemed plausible.
A 10.0% increase in the discount rate would result in an additional impairment of EUR 372 thousand (2013: EUR 102 thousand) for the DOS under review. Under the above assumption, the value of use of all items of goodwill would exceed their respective carrying amounts.
In the event of a 15.0% reduction of the annual growth rates in the detailed planning phase, it would be necessary to recognize an additional impairment loss of EUR 1,645 thousand (2013: EUR 923 thousand) for the DOS under review; by contrast, the value in use of all items of goodwill would exceed their carrying amounts.
In the event of a 15.0% reduction in the growth rate of sales used to extrapolate the cash flow forecast after the detailed planning period, the value in use of all items of goodwill would exceed their carrying amounts (2013: 15.0%).
15| FINANCIAL AND OTHER ASSETS
(in EUR thousand)
2014 2013
Thereof current
Thereof non-current
Thereof current
Thereof non-current
Financial assets 42,181 22,528 19,653 40,685 23,323 17,362
Tax refund claims and prepayments 13,520 12,353 1,167 11,437 9,743 1,694
Other assets 78,242 70,669 7,573 63,612 59,659 3,953
Other financial assets 130 0 130 38 0 38
TOTAL 134,073 105,550 28,523 115,772 92,725 23,047
Financial assets include positive market values of currency hedges amounting to EUR 3,908 thousand (2013: EUR 5,026 thousand), interest hedges of EUR 0 thousand (2013: EUR 1,252 thousand) and rent deposits for the Group’s own retail stores of EUR 13,714 thousand (2013: EUR 12,956 thousand). Financial assets also include receivables from credit card companies amounting to EUR 15,924 thousand (2013: EUR 16,302 thousand).
Annual Report 2014
202
Consolidated Financial StatementsNotes to the Consolidated Statement of Financial Position

The tax refund claims and tax prepayments are mostly VAT receivables.
Other assets contain refund claims from returns in the amount of EUR 17,353 thousand (2013: EUR 13,692 thousand), bonus receivables from supplier arrangements and prepayments for service agreements and leases.
Impairment losses of EUR 457 thousand were recognized on other assets in the past fiscal year (2013: EUR 266 thousand).
Other financial assets contain the investment carried at amortized cost in the subsidiary HUGO BOSS Korea Ltd., South Korea, which was founded in fiscal year 2014 but not consolidated. In the prior year, other financial assets contained shares in the subsidiary HUGO BOSS Finland OY, Helsinki, Finland, which was not consolidated.
Also included in other financial assets are interests in entities under joint control accounted for using the equity method. The carrying amount of shares in the property companies whose activities consist of the leasing of buildings and associated properties amounts to EUR 35 thousand. The maximum default risk is equal to this capital contribution.
The following is a summary of financial information for entities under joint control accounted for using the equity method. The information contained therein relates to 100% of the associates and not to the Group’s share of those associates.
(in EUR thousand)
Dec. 31, 2014 Dec. 31, 2013
Non-current assets 124,470 102,005
Current assets 9,115 29,513
Liabilities 137,253 134,658
(in EUR thousand)
Dec. 31, 2014 Dec. 31, 2013
Sales 6,355 1,909
Depreciation and amortization (4,279) (1,077)
Other interest and similar income 40 59
Interest and similar expenses (2,450) (628)
Net income/(loss) (633) (823)
The financial information is based on financial statements prepared in accordance with local gaap. IFRS financial statements are not prepared for reasons of materiality.
Annual Report 2014
203
Consolidated Financial StatementsNotes to the Consolidated Statement of Financial Position

16| INVENTORIES
(in EUR thousand)
2014 2013
Finished goods and merchandise 448,245 379,600
Raw materials and supplies 52,817 54,025
Work in progress 6,346 7,212
TOTAL 507,408 440,837
Inventories carried at fair value less costs to sell amount to EUR 80,575 thousand (2013: EUR 82,312 thousand). In fiscal year 2014, impairment losses of EUR 11,259 thousand (2013: EUR 13,004 thousand) were recognized, mainly on finished goods and raw materials, and reported within cost of sales. This was counterbalanced by reversals of impairment losses of EUR 11,914 thousand (2013: EUR 22,513 thousand), following the sale of finished goods and raw materials on which impairment losses had previously been recognized.
17| TRADE RECEIVABLES
(in EUR thousand)
2014 2013
Trade receivables, gross 266,408 241,330
Accumulated allowance (15,876) (15,126)
Trade receivables, net 250,532 226,204
Trade receivables are non-interest-bearing and are generally due between 30 and 90 days.
All recognizable risks are provided for by appropriate valuation allowances. Actual default leads to derecognition of the receivables in question.
Valuation allowances on doubtful debts developed as follows:
(in EUR thousand)
2014 2013
Allowances for doubtful accounts as of January 1 15,126 16,628
Additions 7,021 4,632
Use (2,647) (1,829)
Release (3,793) (4,009)
Currency differences 169 (296)
Allowances for doubtful accounts as of December 31 15,876 15,126
Any expenses and income from allowances on trade receivables are reported under selling and distribution expenses.
Annual Report 2014
204
Consolidated Financial StatementsNotes to the Consolidated Statement of Financial Position

As at December 31, the ageing analysis of trade receivables is as follows:
(in EUR thousand)
2014 2013
Trade receivables, net 250,532 226,204
Thereof neither overdue, nor impaired 192,007 160,287
Thereof overdue, but not impaired 51,779 56,489
≤ 30 days 32,467 34,793
30 to 60 days 14,726 14,658
60 to 90 days 4,586 7,038
90 to 120 days 0 0
120 to 180 days 0 0
180 to 360 days 0 0
> 360 days 0 0
Thereof: overdue and impaired 6,746 9,428
As regards receivables that were neither overdue nor impaired, there were no indications as of the reporting date that the debtors would not settle their payment obligations. Specific valuation allowances ranging between 1% and 100% are recognized on trade receivables.
Pursuant to the general terms and conditions for sales, ownership of the goods supplied is transferred to wholesale partners upon complete payment of all receivables. No collateral has been provided in the Group for individual receivables.
18| CASH AND CASH EQUIVALENTS
(in EUR thousand)
2014 2013
Balances with banks and other cash items 121,055 108,890
Checks/ec-cash 590 863
Cash in hand 6,986 9,489
TOTAL 128,631 119,242
Apart from liquid assets in the narrow sense – i.e. checks, cash in hand, balances with banks – cash and cash equivalents contain short-term deposits that can be converted to cash and cash equivalents at any time and are only subject to insignificant fluctuations in value.
As of the end of the reporting date, the line item balances with banks and other cash items contains short-term deposits of EUR 10,000 thousand (2013: EUR 25,000 thousand).
Annual Report 2014
205
Consolidated Financial StatementsNotes to the Consolidated Statement of Financial Position

19| SUBSCRIBED CAPITAL
The fully paid in share capital of HUGO BOSS AG is unchanged and amounts to EUR 70,400 thousand as of December 31, 2014. It is made up of 70,400,000 no-par value ordinary shares. The shares have an imputed nominal value of EUR 1 each.
The Management Board of HUGO BOSS AG may with the Supervisory Board’s consent increase the share capital by up to EUR 35,200 thousand until May 12, 2019 by issuing 35,200,000 new registered shares on a cash and/or non-cash basis once or repeatedly (Authorized Capital). Generally, shareholders have a subscription right.
CAPITAL MANAGEMENT
Equity comprises the equity attributable to the equity holders of the parent.
The primary objective of the HUGO BOSS Group’s capital management is to secure the financial headroom to make value-enhancing investments for further business growth and, in turn, to increase the enterprise value in a sustainable manner.
To increase the enterprise value, the Group focuses on maximizing free cash flow over the long term. Maintaining positive free cash flow on a lasting basis secures the Group’s financial independence and its solvency at all times. The main levers for improving free cash flow are increasing sales and operating income, defined as EBITDA (earnings before interest, taxes, depreciation and amortization) before special items. Strict management of trade net working capital and value-oriented investment activities also support the development of free cash flow. To maintain or adjust the capital structure, the Group may adjust the dividend payment to shareholders, return capital to shareholders or issue new shares.
No changes were made to the objectives, policies and methods as of December 31, 2014, and December 31, 2013.
In addition, efficient use of capital and the capital structure are regularly monitored based on the leverage ratio, i.e. the ratio of net financial liabilities to EBITDA before special items:
(in EUR thousand)
2014 2013
Liabilities due to banks 164,294 176,250
Cash and cash equivalents (128,631) (119,242)
Net financial liabilities 35,663 57,008
Operating profit 590,789 564,706
Financing strength 0.1 0.1
Annual Report 2014
206
Consolidated Financial StatementsNotes to the Consolidated Statement of Financial Position

Total leverage improved further year on year driven by the positive development of the operating result and the improvement in net financial liabilities. As in the prior year, the ratio was at 0.1 on the reporting date and thus substantially lower than the maximum permissible value pursuant to the covenant agreed as part of the refinanced syndicated loan agreement from fiscal year 2013.
20| OWN SHARES
The number of own shares remains unchanged compared to the prior year:
2014 2013
Shares 1,383,833 1,383,833
Share of subscribed capital in % 2.0 2.0
At the Annual Shareholders’ Meeting of June 21, 2010, a resolution was passed to authorize the Managing Board until June 20, 2015 to redeem registered ordinary shares and/or registered preferred shares without voting rights of the Company up to 10% in total of the current share capital.
21| CAPITAL RESERVE
The capital reserve contains premiums on the issue of shares.
22| RETAINED EARNINGS
Retained earnings contain profits that have not been distributed and that were generated in the past by the entities included in the consolidated financial statements, effects on earnings from consolidation entries in prior periods and effects from the revaluation of provisions for pensions.
23| ACCUMULATED OTHER COMPREHENSIVE INCOME
Accumulated other comprehensive income contains the differences without effect on income arising from translation of the financial statements of foreign subsidiaries amounting to EUR 15,320 thousand (2013: EUR
– 16,699 thousand) and the effects of the measurement of cash flow hedges after tax without effect on income. Deferred taxes on the measurement of cash flow hedges recognized directly in equity amount to EUR 387 thousand (2013: EUR – 313 thousand).
Reference is made to the consolidated statement of comprehensive income for the income and expenses recognized directly in equity.
Annual Report 2014
207
Consolidated Financial StatementsNotes to the Consolidated Statement of Financial Position

24| DIVIDEND
Pursuant to the AktG [“Aktiengesetz”: German Stock Corporation Act], the dividend that can be distributed to the shareholders is measured based on the unappropriated surplus reported in the financial statements of HUGO BOSS AG amounting to EUR 254,848 thousand. The net retained profit of HUGO BOSS AG for 2014 proposed to the Annual Shareholders’ Meeting for distribution amounts to EUR 249,839 thousand. This corresponds to EUR 3.62 per share. It is also proposed to the Annual Shareholders’ Meeting that the dividend attributable to own shares totaling EUR 5,009 thousand be carried forward to new account.
In 2014, a dividend of EUR 230,514 thousand was paid out for shares outstanding for fiscal year 2013 (in 2013 for 2012: EUR 215,330 thousand). This corresponds to EUR 3.34 per share for 2013 (2012: EUR 3.12 per share).
25| PROVISIONS
(in EUR thousand)
2014 2013
Provisions for pensions 45,628 29,795
Other non-current provisions 24,917 22,944
Non-current provisions 70,545 52,739
Current provisions 115,656 99,868
TOTAL 186,201 152,607
Other provisions of EUR 140,573 thousand (2013: EUR 122,812 thousand) comprise current provisions of EUR 115,656 thousand (2013: EUR 99,868 thousand) and other non-current provisions of EUR 24,917 thousand (2013: EUR 22,944 thousand).
In fiscal year 2014, other provisions developed as follows:
(in EUR thousand)
Balance on Jan. 1, 2014
Currency differences Compounding Addition Use Release
Balance on Dec. 31, 2014
Provisions for personnel expenses 53,381 1,064 89 32,308 (36,213) (5,091) 45,538
Refund for goods 20,164 494 0 24,856 (18,210) (1,749) 25,555
Provisions for rebuild obligations 9,102 677 212 3,468 (365) (810) 12,284
Costs of litigation, pending legal disputes 8,508 83 0 2,498 (2,141) (1,478) 7,470
Miscellaneous provisions 31,657 1,062 0 33,524 (9,660) (6,857) 49,726
TOTAL 122,812 3,380 301 96,654 (66,589) (15,985) 140,573
Annual Report 2014
208
Consolidated Financial StatementsNotes to the Consolidated Statement of Financial Position
The provisions for personnel expenses mainly concern the provisions for short- and medium-term profit sharing and bonuses, severance payment claims, phased retirement arrangements and overtime.
Overall, it is expected that the provisions for personnel expenses of EUR 11,317 thousand (2013: EUR 12,562 thousand) will be paid out in more than 12 months.
Provisions for goods returned, which are largely expected to be completed within 12 months, are determined based on historical rates of goods returned.
Non-current provisions for rebuild obligations relate to Group-operated retail stores, warehouses and office space used by the Group companies.
The provisions for costs of litigation and pending legal disputes include various, individually immaterial ongoing litigations as well as litigation costs for the protection of brand rights. These provisions are classified as current.
Miscellaneous provisions also contain provisions for the potential ramifications of legal and tax issues and provisions for expenses related to the decision to close the production site in Cleveland, Ohio, which has already been communicated.
The risk-free interest rates used to discount non-current provisions range between 0.5% and 4.5% (prior year: between 1.1% and 4.9%) depending on the term and currency zone in question.
26| PROVISIONS FOR PENSIONS AND SIMILAR OBLIGATIONS
Provisions for pensions are recognized for obligations from future and current post-employment benefits to eligible current and former employees of the HUGO BOSS Group. The benefits agreed under the pension plans depend for the most part on the length of service of the eligible employee. In general, company pension plans are classified into two types of plans: defined contribution plans and defined benefit plans. In the HUGO BOSS Group most of the plans are defined benefit plans. In the past year, the main defined benefit plans were granted in Germany, Switzerland and Turkey. The characteristics of these plans are described in the following.
DEFINED BENEFIT PL ANS
GERMANY
Since fiscal year 2014 there have only been direct pension obligations in Germany. A distinction is also made between general and individually agreed benefits. Under the general benefits granted, each employee who joined the Company prior to July 1, 2012 is entitled to benefits from company pension plans. Employees who first receive benefits under the plan upon reaching the age of 50 or who have temporary employment agreements are excluded. Benefits comprise a retirement benefit in the form of an old-age pension, an early-retirement benefit or a disability benefit or a surviving dependents’ benefit in the form of a dependent child benefit. The retirement benefits, early-retirement benefits and dependent child benefits have been indirectly granted through a welfare fund, while HUGO BOSS has granted the disability benefit directly. The general benefits previously granted via the welfare fund were transferred to HUGO BOSS AG as the sponsoring company in fiscal year 2014 in return for waiver of the plan assets granted as a loan. Active employees were subsequently offered a cash settlement of the vested benefits or, alternatively, transfer of the vested benefits to the Company’s direct insurance scheme (plan settlement). The remaining general pension commitments have been retained as HUGO BOSS AG’s direct pension commitments.
Annual Report 2014
209
Consolidated Financial StatementsNotes to the Consolidated Statement of Financial Position

Individually agreed benefits are only granted to active and former members of the Managing Board. Benefits can take the form of retirement benefits as old-age pensions or disability annuities and take the form of surviving dependents’ benefits as a surviving spouse or child benefit.
In addition, the HUGO BOSS Group offers the Managing Board and executives the option of acquiring additional pension benefits under deferred compensation agreements. This supplementary pension plan can take the form of retirement benefits or, alternatively, the form of occupational incapacity benefits and/or surviving dependents’ benefits and/or the form of a lump-sum death grant. The pension benefits take the form of monthly payments, while surviving dependents’ benefits can also be granted in the form of a lump-sum capital payment.
In Germany, the company pension plan for individually agreed benefits and deferred compensation agreements is funded by plan assets for which there is employer’s pension liability insurance which is a qualifying insurance policy within the meaning of IAS 19.8 in conjunction with IAS 19.113 et seq. The assets concerned can be classified as non-marketable assets. Employer’s pension liability insurance has not been taken out for general benefits granted.
SWITZERL AND
In Switzerland, employee pension plans must be allocated to a pension fund that is separate from the employer. The BVG [“Bundesgesetz über die berufliche Alters-, Hinterlassenen- und Invalidenvorsorge”: Swiss Federal Act on Occupational Retirement, Survivors’ and Disability Pension Plans] imposes minimum benefits. HUGO BOSS uses a collective foundation to provide for its employees against the economic consequences of old age, disability and death. Under this model, the foundation assets are the plan assets. The board of trustees of the collective foundation is responsible for the investment policy; at present the majority of plan assets are invested in fixed interest securities such as sovereign bonds. The supreme governing body of the collective foundation comprises an equal number of employer and employee representatives. The plans are financed by employer and employee contributions, which are defined as a percentage of the insured wage. The old-age pension is calculated as the retirement assets accumulated upon reaching a pensionable age multiplied by the conversion rates specified in the fund regulations. Employees can opt to receive their pension benefits as a lump-sum payment from the retirement assets. The benefit payments under the Swiss plans encompass old-age pensions, disability benefits and surviving dependents’ benefits. The collective foundation can change its financing system (contributions and future benefits) at any time. In addition, the collective foundation can terminate the affiliation agreement with HUGO BOSS; in such an event, the latter would have to join another welfare fund. Depending on the conditions of the affiliation agreement and the current partial liquidation rules, a deficit and the risks of increasing life expectancy (current pensions) can be transferred.
TURKEY
In Turkey, severance payment commitments have been made to employees, which have to be recognized as defined benefit plans in accordance with IAS 19. The severance payment that must be paid by HUGO BOSS complies with the legally required benefits of up to one month per year of service and is granted upon retirement, in the event of employment termination by the employer without due cause, upon marriage, in the event of death or conscription to military service. Employees are entitled to benefits after one year of service. The monthly salary used as a basis to calculate the obligation is capped at an amount set by the Turkish authorities. Obligations in Turkey are funded by provisions.
Annual Report 2014
210
Consolidated Financial StatementsNotes to the Consolidated Statement of Financial Position

The pension obligations of the HUGO BOSS Group break down as follows:
(in EUR thousand)
Present Value of the Defined Benefit Obligation Fair Value of Plan Assets Net Defined Benefit Liability
2014 2013 2014 2013 2014 2013
Germany 81,711 73,996 56,633 58,068 25,078 15,928
Switzerland 36,055 28,252 22,333 19,428 13,722 8,824
Turkey 4,146 2,868 0 0 4,146 2,868
Others 1 2,682 2,175 0 0 2,682 2,175
TOTAL 124,594 107,291 78,966 77,496 45,628 29,7951 Additional defined benefit plans are in place in Italy, France and Mexico.
The amount of the pension obligations was determined using actuarial methods in accordance with IAS 19 “Employee Benefits”.
Annual Report 2014
211
Consolidated Financial StatementsNotes to the Consolidated Statement of Financial Position
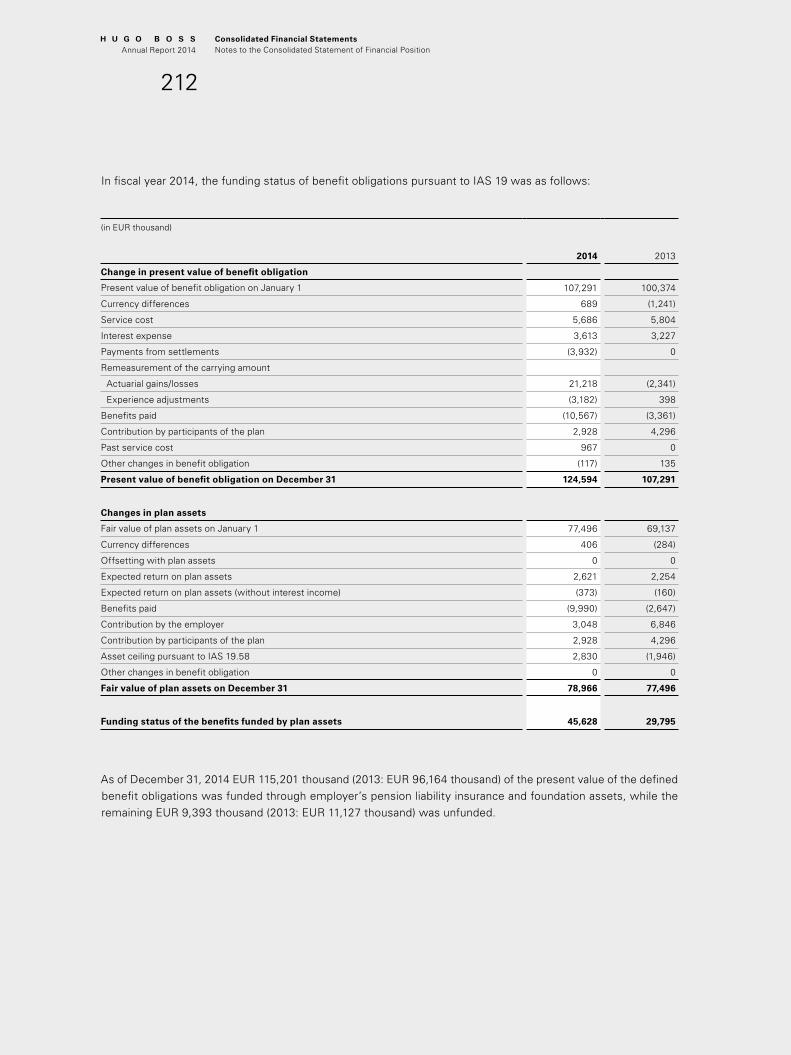
In fiscal year 2014, the funding status of benefit obligations pursuant to IAS 19 was as follows:
(in EUR thousand)
2014 2013
Change in present value of benefit obligation
Present value of benefit obligation on January 1 107,291 100,374
Currency differences 689 (1,241)
Service cost 5,686 5,804
Interest expense 3,613 3,227
Payments from settlements (3,932) 0
Remeasurement of the carrying amount
Actuarial gains/losses 21,218 (2,341)
Experience adjustments (3,182) 398
Benefits paid (10,567) (3,361)
Contribution by participants of the plan 2,928 4,296
Past service cost 967 0
Other changes in benefit obligation (117) 135
Present value of benefit obligation on December 31 124,594 107,291
Changes in plan assets
Fair value of plan assets on January 1 77,496 69,137
Currency differences 406 (284)
Offsetting with plan assets 0 0
Expected return on plan assets 2,621 2,254
Expected return on plan assets (without interest income) (373) (160)
Benefits paid (9,990) (2,647)
Contribution by the employer 3,048 6,846
Contribution by participants of the plan 2,928 4,296
Asset ceiling pursuant to IAS 19.58 2,830 (1,946)
Other changes in benefit obligation 0 0
Fair value of plan assets on December 31 78,966 77,496
Funding status of the benefits funded by plan assets 45,628 29,795
As of December 31, 2014 EUR 115,201 thousand (2013: EUR 96,164 thousand) of the present value of the defined benefit obligations was funded through employer’s pension liability insurance and foundation assets, while the remaining EUR 9,393 thousand (2013: EUR 11,127 thousand) was unfunded.
Annual Report 2014
212
Consolidated Financial StatementsNotes to the Consolidated Statement of Financial Position

ACTUARIAL ASSUMPTIONS UNDERLYING THE CALCUL ATION OF THE PRESENT VALUE OF
THE PENSION OBLIGATION AS OF DECEMBER 31, 2014
The following premises were defined:
Actuarial assumptions 2014 2013
Discount rate
Germany 2.25% 3.50%
Switzerland 1.40% 2.20%
Turkey 8.50% 10.50%
Future pension increases
Germany 1.75% 1.75%
Switzerland 0.00% 0.00%
Turkey 0.00% 0.00%
Future salary increases
Germany 2.50% 2.50%
Switzerland 3.50% 4,00%
Turkey 5.00% 5.00%
Pension benefits in Germany are determined on the basis of biometric principles in accordance with the 2005 G mortality tables of Prof. Dr. Klaus Heubeck. The BVG 2010 mortality tables are used to measure the obligations of Swiss companies. The pension obligations in Turkey are determined using the CSO 1980 mortality tables.
SENSITIVIT Y ANALYSIS OF KEY ACTUARIAL ASSUMPTIONS
The HUGO BOSS Group is exposed to special risks in connection with the aforementioned defined benefit plans. The funding status of pension obligations is influenced by both changes in the present value of the defined benefit obligations and changes in the fair value of plan assets. These are determined using actuarial methods that make assumptions concerning discount rates, future pension increases, future wage and salary increases and mortality rates. Future deviations between actual conditions and the underlying assumptions can lead to an increase or a decrease in the present value of the defined benefit obligations or the fair value of plan assets.
In addition, future amendments to the accounting standards governing the accounting treatment of pension obligations can affect the pertinent items of net assets, financial position and results of operations of the HUGO BOSS Group.
A change in the key actuarial parameters according to the scenarios presented below has the effects presented in the table below on the present value of the pension obligations as of December 31, 2014.
When conducting the sensitivity analysis, each parameter was altered ceteris paribus and not in combination with changes in other assumptions, thus excluding interdependencies between parameters. In addition, only ranges of values deemed to be reasonably plausible up to the date of preparing the HUGO BOSS Group’s next set of consolidated financial statements were selected.
Annual Report 2014
213
Consolidated Financial StatementsNotes to the Consolidated Statement of Financial Position

Actuarial assumptions 2014 2013
Discount rate
December 31,
Increase of 75 basis points (11,943) (12,407)
Decline of 75 basis points 14,883 15,188
Future pension increases
December 31,
Increase of 25 basis points 2,069 1,980
Decline of 25 basis points (970) (1,178)
Future salary increases
December 31,
Increase of 50 basis points 2,246 1,675
Decline of 50 basis points (2,184) (1,564)
Life expectancy
December 31,
Increase of 10 percent (2,502) (1,349)
Decline of 10 percent 2,810 1,199
BREAKDOWN OF THE PENSION EXPENSES IN THE PERIOD
The pension expenses recognized in the consolidated income statement comprise the current service cost and the net interest expense. In addition, remeasurement effects from the change in financial assumptions and experience adjustments together with the return on plan assets that is not included in interest expenses and interest income are recognized in other comprehensive income in the consolidated statement of comprehensive income. The net effect from the asset ceiling is also recognized in other comprehensive income in accordance with IAS 19.58.
(in EUR thousand)
2014 2013
Current service costs 5,686 5,804
Past service costs 967 0
Net interest costs 992 973
Recognized pension expenses in the comprehensive statement of income 7,645 6,777
Expense from plan assets (without interest effects) 373 160
Recognized actuarial (gains)/losses 18,037 (1,943)
Asset ceiling (without interest effects of asset ceiling) (2,929) 1,695
Recognized remeasurement of the carrying amount in the comprehensive statement of income 15,480 – 88
The net interest expense is calculated by multiplying the net pension obligation by the discount rate underlying the measurement of the defined benefit obligation (DBO).
In the case of deferred compensation commitments, current service cost is only incurred in the year of deferral. An increase in the service rendered does not increase the benefits granted.
Annual Report 2014
214
Consolidated Financial StatementsNotes to the Consolidated Statement of Financial Position

For fiscal year 2015, the Group expects employer contributions to plan assets of EUR 3,010 thousand (2014: EUR 2,296 thousand).
DUR ATION
The duration of the defined benefit plans of the HUGO BOSS Group on December 31 stood at:
(Duration in years)
2014 2013
Germany 20 18
Switzerland 19 17
Turkey 13 12
DEFINED CONTRIBUTION PL ANS
Employer contributions to defined contribution plans totaled EUR 16,173 thousand in the fiscal year (2013: EUR 17,093 thousand) and are reported under personnel expenses in the income statement. The HUGO BOSS Group’s main defined contribution plans are in Germany, the United States, the Benelux countries, Scandinavia and Hong Kong. Significant components of the amounts recognized in the income statement are contributions to statutory pension insurance and the employer’s contribution to employer-funded direct insurance in Germany.
27| FINANCIAL LIABILITIES
All interest-bearing and non-interest-bearing obligations as of the respective reporting date are reported under financial liabilities. They break down as follows:
(in EUR thousand)
2014 2013
Non-current financial liabilities 153,643 164,768
Current financial liabilities 18,256 14,653
TOTAL 171,899 179,421
(in EUR thousand)
2014With remaining
term up to 1 year 2013With remaining
term up to 1 year
Financial liabilities due to banks 164,293 15,137 176,250 13,889
Other financial liabilities 7,606 3,119 3,171 764
TOTAL 171,899 18,256 179,421 14,653
Annual Report 2014
215
Consolidated Financial StatementsNotes to the Consolidated Statement of Financial Position

Other financial liabilities include negative market values from derivative financial instruments amounting to EUR 7,546 thousand (2013: EUR 3,051 thousand). As in the prior year, there were no liabilities from finance lease agreements.
The following tables show the terms and conditions of financial liabilities:
LIABIL IT IES DUE TO BANKS
2014 2013
Remaining term
Weighted average
interest rate
Carrying amount
EUR thous.
Weighted average
interest rateCarrying amount
EUR thous.
Up to 1 year 4.01% 15,137 3.84% 13,889
1 to 5 years 1.30% 116,948 1.45% 135,861
More than 5 years 2.97% 32,208 3.54% 26,500
The majority of financial liabilities due to banks are classified as non-current following the refinancing of the syndicated line of credit in fiscal year 2013.
OTHER FINANCIAL L IABIL IT IES
2014
2013
Remaining term
Weighted average
interest rate
Carrying amount
EUR thous.
Weighted average
interest rateCarrying amount
EUR thous.
Up to 1 year 0.90% 3,640 4.16% 764
1 to 5 years 3.60% 2,967 5.10% 1,722
More than 5 years 5.69% 999 5.48% 685
By contrast to the prior year, the share of non-interest-bearing financial liabilities has risen. As of the reporting date, they contain interest and currency derivatives with negative market values.
Annual Report 2014
216
Consolidated Financial StatementsNotes to the Consolidated Statement of Financial Position

The table below shows the contractually agreed undiscounted cash flows for non-derivative financial liabilities and for derivative financial instruments with a negative fair value:
(in EUR thousand)
2014 Expected cash flows
Non-derivative financial liabilitiesCarrying amount
Total cash flows < 1 year 1 – 5 years > 5 years
Financial liabilities due to banks 164,293 179,029 17,010 137,092 24,927
Liabilities from finance leases 0 0 0 0 0
Derivative financial liabilities
Undesignated derivatives 5,998 5,998 3,119 1,880 999
Derivatives subject to hedge accounting 1,548 1,548 521 1,027 0
Other financial liabilities 60 60 0 60 0
TOTAL 171,899 186,635 20,650 140,059 25,926
2013
Non-derivative financial liabilities
Financial liabilities due to banks 176,250 195,312 24,578 140,667 30,067
Liabilities from finance leases 0 0 0 0 0
Derivative financial liabilities
Undesignated derivatives 3,051 3,170 765 1,636 769
Derivatives subject to hedge accounting 0 0 0 0 0
Other financial liabilities 120 120 0 120 0
TOTAL 179,421 198,602 25,343 142,423 30,836
Annual Report 2014
217
Consolidated Financial StatementsNotes to the Consolidated Statement of Financial Position
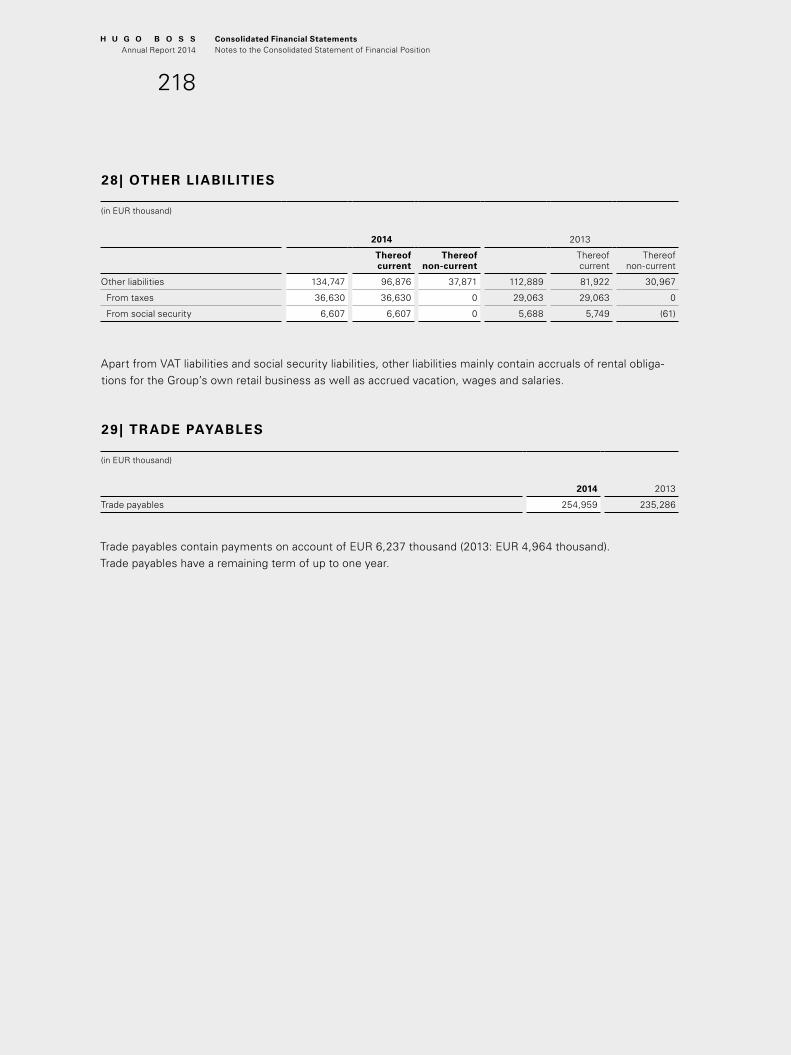
28| OTHER LIABILITIES
(in EUR thousand)
2014 2013
Thereof current
Thereof non-current
Thereof current
Thereof non-current
Other liabilities 134,747 96,876 37,871 112,889 81,922 30,967
From taxes 36,630 36,630 0 29,063 29,063 0
From social security 6,607 6,607 0 5,688 5,749 (61)
Apart from VAT liabilities and social security liabilities, other liabilities mainly contain accruals of rental obliga-tions for the Group’s own retail business as well as accrued vacation, wages and salaries.
29| TRADE PAYABLES
(in EUR thousand)
2014 2013
Trade payables 254,959 235,286
Trade payables contain payments on account of EUR 6,237 thousand (2013: EUR 4,964 thousand). Trade payables have a remaining term of up to one year.
Annual Report 2014
218
Consolidated Financial StatementsNotes to the Consolidated Statement of Financial Position

30| ADDITIONAL DISCLOSURES ON FINANCIAL INSTRUMENTS
Set out below is a comparison of the carrying amounts and fair value of the Group’s financial instruments that are carried in the financial statements.
CARRYING AMOUNTS AND FAIR VALUES BY CATEGORY OF F INANCIAL INSTRUMENTS
(in EUR thousand)
2014 2013
Assets IAS 39 categoryCarrying amount Fair value
Carrying amount Fair value
Cash and cash equivalents LaR 128,631 128,631 119,242 119,242
Trade receivables LaR 250,532 250,532 226,204 226,204
Other financial assets 42,276 42,276 40,688 40,688
Thereof:
Available-for-sale investments AfS 95 95 3 3
Undesignated derivatives FAHfT 3,395 3,395 5,026 5,026
Derivatives subject to hedge accounting n. a. 513 513 1,252 1,252
Other financial assets LaR 38,273 38,273 34,407 34,407
Liabilities
Financial liabilities due to banks FLAC 164,293 169,578 176,250 179,492
Trade payables FLAC 254,959 254,959 235,286 235,286
Other financial liabilities 7,606 7,606 3,171 3,171
Thereof:
Undesignated derivatives FLHfT 5,998 5,998 3,051 3,051
Derivatives subject to hedge accounting n. a. 1,548 1,548 0 0
Other financial liabilities FLAC 60 60 120 120
Total for categories of financial instruments according to IAS 39:
Loans and Receivables LaR 417,436 417,436 379,853 379,853
Available-for-Sale investments AfS 95 95 3 3
Financial Assets Held for Trading FAHfT 3,395 3,395 5,026 5,026
Financial Liabilities Measured at Amortized Cost FLAC 419,312 424,597 411,656 414,898
Financial Liabilities Held for Trading FLHfT 5,998 5,998 3,051 3,051
Annual Report 2014
219
Consolidated Financial StatementsNotes to the Consolidated Statement of Financial Position

The fair value of the financial assets and liabilities is included at the amount at which the instrument could be exchanged in a current transaction between willing parties. The following methods and assumptions were used to estimate the fair values:
Cash and cash equivalents, trade receivables, other financial assets, trade payables and other current liabilities approximate their carrying amounts largely due to the short-term maturities of these instruments.
The fair value of loans from banks and other financial liabilities, obligations under finance leases and other non-current financial liabilities is calculated by discounting future cash flows using rates currently available for debt on similar terms, credit risk and remaining maturities.
The Group enters into derivative financial instruments with various counterparties, principally financial institutions with investment grade credit ratings. Financial transactions with parties with a lower credit rating require the approval of the Managing Board and are concluded only to a limited degree. Derivatives valued using valuation techniques with observable market data are mainly interest rate swaps and forward exchange contracts. The most frequently applied valuation techniques include forward pricing and swap models, using present value calculations. The models incorporate various inputs including the creditworthiness of counterparties, foreign exchange spot and forward rates, interest rate curves and forward rate curves of the underlying base rates.
As of December 31, 2014, the marked-to-market value of derivative asset positions is net of a credit valuation adjustment attributable to derivative counterparty default risk. The credit risk of the counterparty did not lead to any significant effects.
FAIR VALUE HIER ARCHY
The Group uses the following hierarchy for determining and disclosing the fair value of financial instruments by valuation technique:
Level 1: Quoted (unadjusted) prices on active markets for identical assets or liabilities.
Level 2: Other techniques for which all inputs that have a significant effect on the recorded fair value are observable, either directly or indirectly.
Level 3: Techniques which use inputs that have a significant effect on the recorded fair value and are not based on observable market data.
As of December 31, 2014, as in the prior year, all financial instruments measured at fair value in the categories FAHfT, FLHfT and derivatives designated to a hedge relationship were assigned to level 2. During fiscal year 2014, there were no transfers between level 1 and level 2 or from level 3. The financial instruments measured at fair value comprised forward exchange contracts, currency swaps and interest derivatives. These were assigned to the categories FAHfT, FLHfT and derivatives used for hedging. The assets amounted to EUR 3,908 thousand and liabilities to EUR 7,546 thousand. The fair value of financial instruments carried at amortized cost in the statement of financial position was likewise determined using a level 2 method.
INTEREST AND CURRENCY RISK HEDGES
To hedge against interest and currency risks, the HUGO BOSS Group enters into hedging transactions in some areas to mitigate risk. As of the reporting date, EUR 110,916 thousand (2013: EUR 111,495 thousand) in variable interest finance liabilities were hedged. EUR 100,000 thousand (2013: EUR 100,000 thousand) thereof was designated as an effective hedging instrument. Moreover, as of the reporting date, future cash flows in foreign
Annual Report 2014
220
Consolidated Financial StatementsNotes to the Consolidated Statement of Financial Position

currencies of EUR 12,532 thousand (2013: EUR 0 thousand) were hedged and fully designated as an effective hedging instrument. The change in unrealized gains/losses from marking hedges to market in other comprehensive income amounted to EUR – 1,587 thousand (2013: EUR 4,460 thousand).
NET RESULT BY MEASUREMENT CATEGORY
(in EUR thousand)
Interest income and
expensesChanges in
fair valueCurrency
translationBad debt
losses
Disposal of financial
instruments 2014 2013
Derivatives (FAHfT and FLHfT) 0 (1,341) 0 0 (4,299) (5,640) 11,736
Loans and Receivables (LaR) 1,617 0 2,831 (2,642) 0 1,806 (12,874)
Financial liabilities measured at amortized cost (FLAC) (7,218) 0 (2,474) 0 0 (9,692) (16,908)
Interest on financial instruments is reported in the interest result (cf. notes to the consolidated income statement, Note 6).
The bad debt allowances recognized on trade receivables allocable to the loans and receivables measurement category are reported under selling and distribution expenses.
Exchange gains and losses from the translation of foreign currency receivables and liabilities as well as fair value changes and effects of disposals of exchange rate hedges are reported in the other financial result.
Annual Report 2014
221
Consolidated Financial StatementsNotes to the Consolidated Statement of Financial Position

31| OFFSETTING OF FINANCIAL INSTRUMENTS
(in EUR thousand)
Gross amounts
recognized assets
Gross amounts
offset liabilities
Net asset amounts
disclosed in statement of fin. pos.
Liabilities not offset
in the statement of fin. pos.
Cash deposits
received not offset in the
statement of fin. pos.
Net amounts
2014
Cash and cash equivalents 128,631 0 128,631 0 0 128,631
Trade receivables 264,631 (14,099) 250,532 0 0 250,532
Other financial assets 42,276 0 42,276 (1,473) 0 40,803
Thereof available-for-sale 95 0 95 0 0 95
Thereof derivatives 3,908 0 3,908 (1,473) 0 2,435
Thereof other financial assets 38,273 0 38,273 0 0 38,273
TOTAL 435,443 (14,099) 421,344 (1,473) 0 419,871
2013
Cash and cash equivalents 119,242 0 119,242 0 0 119,242
Trade receivables 239,006 (12,802) 226,204 0 0 226,204
Other financial assets 40,688 0 40,688 (126) 0 40,562
Thereof available-for-sale 3 0 3 0 0 3
Thereof derivatives 6,278 0 6,278 (126) 0 6,152
Thereof other financial assets 34,407 0 34,407 0 0 34,407
TOTAL 398,933 (12,802) 386,131 (126) 0 386,005
Annual Report 2014
222
Consolidated Financial StatementsNotes to the Consolidated Statement of Financial Position

(in EUR thousand)
Gross amounts
recognized liabilities
Gross amounts
offset assets
Net liabilities amounts
disclosed in statement of fin. pos.
Assets not offset in the
statement of fin. pos.
Cash deposits
received not offset in the
statement of fin. pos.
Net amounts
2014
Liabilities due to banks 164,293 0 164,293 0 0 164,293
Trade payables 259,791 (4,832) 254,959 0 0 254,959
Other financial assets 7,606 0 7,606 (1,473) 0 6,133
Thereof derivatives 7,546 0 7,546 (1,473) 0 6,073
Thereof other financial liabilities 60 0 60 0 0 60
TOTAL 431,690 (4,832) 426,858 (1,473) 0 425,385
2013
Liabilities due to banks 176,250 0 176,250 0 0 176,250
Trade payables 241,898 (6,612) 235,286 0 0 235,286
Other financial assets 3,171 0 3,171 (126) 0 3,045
Thereof derivatives 3,051 0 3,051 (126) 0 2,925
Thereof other financial liabilities 120 0 120 0 0 120
TOTAL 421,319 (6,612) 414,707 (126) 0 414,581
The liabilities of EUR 14,099 thousand (2013: EUR 12,802 thousand) offset against trade receivables as of the reporting date are outstanding credit notes to customers. The assets offset against trade payables are receivables in the form of supplier credit notes of the HUGO BOSS Group. These amounted to EUR 4,832 thousand (2013: EUR 6,612 thousand).
Standard master agreements for financial future contracts are in place between the HUGO BOSS Group and its counterparties governing the offsetting of derivatives. These prescribe that derivative assets and derivative liabilities with the same counterparty can be combined into a single offsetting receivable.
Annual Report 2014
223
Consolidated Financial StatementsNotes to the Consolidated Statement of Financial Position

OTHER NOTES
32| CONTINGENT LIABILITIES
As in the previous year, there were no contingent liabilities towards external third parties as at the reporting date.
Contingent liabilities arising from the provision of collateral for third-party liabilities are valued at EUR 8,547 thousand as at December 31, 2014 (2013: EUR 8,547 thousand) and relate to the consolidated structured entities BIL Leasing Verwaltungs-GmbH & Co. 869 KG, ROSATA Grundstücks-Vermietungsgesellschaft mbH & Co. Objekt Dieselstrasse KG and ROSATA Grundstücks-Vermietungsgesellschaft mbH & Co. Objekt Metzingen KG.
33| OTHER FINANCIAL OBLIGATIONS
OPER ATING LEASES
A substantial number of rental agreements have been entered into which qualify as operating leases based on their substance, such that the leased asset is attributable to the lessor.
Operating leases concern in particular the rental agreements for the real estate used by the retail stores operated by the Group, warehouses and office space used by the Group companies, most of which are based on minimum lease payments. The main real estate lease agreements (operating leases) for the use of buildings and associated land include purchase options and, in some cases, renewal options for the respective property. Lease arrangements that contain agreements on contingent rents (particularly rents linked to sales) are also in place.
Rental expenses under operating leases of EUR 318,442 thousand were recognized in fiscal year 2014 (2013: EUR 260,463 thousand). Contingent rental expenses amounted to EUR 90,876 thousand (2013: EUR 88,690 thousand).
The following minimum lease payments under operating leases fall due in subsequent periods:
(in EUR thousand)
2014
Due 2015
Due 2016 – 2019
Due after 2019 TOTAL
Sum of future minimum lease payments (operating lease) 232,091 667,004 409,003 1,308,098
Other obligations 2,054 3,210 353 5,617
TOTAL 234,145 670,214 409,356 1,313,715
2013Due
2014 Due
2015 – 2018Due
after 2018 TOTAL
Sum of future minimum lease payments (operating lease) 188,973 588,737 373,573 1,151,283
Other obligations 1,526 2,824 522 4,872
TOTAL 190,499 591,561 374,095 1,156,155
Annual Report 2014
224
Consolidated Financial StatementsOther Notes

The other obligations line item contains other service and maintenance agreements.
In fiscal year 2014, the Group earned income of EUR 164 thousand from subleases (2013: EUR 282 thousand). Total future minimum lease payments from subleases as of the reporting date December 31, 2014, which are expected to be received as they pertain to non-cancellable leases, amount to EUR 493 thousand (2013: EUR 1,871 thousand).
FINANCE LEASES
In the fiscal year 2014 and in the prior year, property, plant and equipment did not contain any land whose economic ownership would be attributable to the Group in accordance with IAS 17. Nor were there any items of operating and office equipment that qualify.
OTHER FINANCIAL OBLIGATIONS
The HUGO BOSS Group has entered into advertising and sponsorship agreements that result in other financial obligations. This leads to the following payments in subsequent years:
(in EUR thousand)
2014
Due
2015Due
2016 – 2019Due
after 2019 TOTAL
Advertising and sponsorship contracts 9,507 17,058 0 26,565
TOTAL 9,507 17,058 0 26,565
2013Due
2014 Due
2015 – 2018Due
after 2018 TOTAL
Advertising and sponsorship contracts 10,734 15,477 0 26,211
TOTAL 10,734 15,477 0 26,211
In addition, there are purchase obligations for investments amounting to EUR 1,401 thousand (2013: EUR 2,118 thousand). Of this amount, EUR 712 thousand is attributable to property, plant and equipment (2013: EUR 699 thousand) and EUR 689 thousand (2013: EUR 1,419 thousand) to intangible assets. The obligations as of December 31, 2014 fall due within one year.
Annual Report 2014
225
Consolidated Financial StatementsOther Notes

34| HEDGING POLICY AND FINANCIAL DERIVATIVES
The following presentation shows the nominal amounts and the fair value of derivative financial instruments:
(in EUR thousand)
2014 2013
Assets Nominal-values Fair values Nominal-values Fair values
Currency hedging contracts 78,262 3,908 91,716 5,026
Interest hedging contracts 0 0 100,000 1,252
Liabilities
Currency hedging contracts (80,266) (2,541) (19,505) (185)
Interest hedging contracts (110,916) (5,005) (11,495) (2,866)
TOTAL (112,920) (3,638) 160,717 3,227
The nominal values are the amount hedged by the corresponding hedge. The fair values of derivative financial instruments are recognized as other financial assets or as other financial liabilities. They do not necessarily correspond to the amounts that will be generated in the future under normal market conditions.
Of the reported fair value from derivative financial instruments, an amount of EUR – 2,603 thousand (2013: EUR 1,975 thousand) stems from financial assets and liabilities that were classified as held for trading.
After deducting deferred taxes, negative effects from the fair value measurement of interest hedges of EUR – 1,161 thousand (2013: EUR 939 thousand) were recognized in other comprehensive income as of December 31, 2014. Of the amount recognized in other comprehensive income, interest hedges of EUR – 411 thousand after tax expenses were recycled through the income statement in fiscal year 2014 (2013: expenses of EUR – 3,873 thousand). This breaks down into an interest expense of EUR – 548 thousand (2013: EUR – 5,164 thousand) and income from deferred taxes of EUR 137 thousand (2013: EUR 1,291 thousand). The fair value changes came to EUR – 2,511 thousand (prior year: EUR 588 thousand) after deferred taxes.
Unlike in the prior year, positive effects from the fair value measurement of currency hedges after deferred taxes were recognized with EUR 513 thousand in other comprehensive income as of December 31, 2014 (2013: EUR 0 thousand). Of the amount recognized in other comprehensive income, no expenses were reclassified from equity into profit for the period due to initial recognition.
As a group with international operations, HUGO BOSS is exposed to risks from exchange rate and interest fluctuations in connection with its operating activities. Derivative financial instruments are used to mitigate such risks. Only marketable instruments with adequate liquidity are used. At HUGO BOSS, use of derivative financial instruments is subject to internal policies and control mechanisms.
Annual Report 2014
226
Consolidated Financial StatementsOther Notes

In its use of derivative financial instruments, the HUGO BOSS Group is exposed to the risk of counterparty default. This risk is countered by only entering into contracts with banks that have excellent to good credit ratings.
CURRENCY RISKS
The disclosures required under IFRS 7 on currency risks and a corresponding sensitivity analysis are presented in detail in the risk report section of the management report. Currency risk is determined based on currency exposure already recognized and future cash flows, since the hedging strategy aims to mitigate accounting risks and risks arising from future cash flows.
INTEREST R ATE R ISKS
The disclosures required under IFRS 7 on interest risks and a corresponding sensitivity analysis are presented in detail in the risk report section of the management report.
35| NOTES TO THE STATEMENT OF CASH FLOWS
The statement of cash flows of the HUGO BOSS Group shows the change in cash and cash equivalents over the reporting period using cash transactions. In accordance with IAS 7, the sources and applications of cash flows are categorized according to whether they relate to operating, investing or financing activities. The cash inflows and outflows from operating activities are calculated indirectly on the basis of the Group’s net profit for the period. By contrast, cash flows from investing and financing activities are directly derived from the cash inflows and outflows.
Changes in the Group’s cash and cash equivalents are the result of the development of the individual cash flows after exchange rate effects.
The cash and cash equivalents presented in the statement of cash flows contain all cash and cash equivalents shown in the statement of financial position, i.e. apart from liquid assets in the narrow sense – checks, cash in hand, balances with banks – cash and cash equivalents contain short-term investments that can be converted to cash and cash equivalents at any time and are only subject to insignificant fluctuations in value. Cash and cash equivalents are measured at amortized cost.
Non-cash expenses and income concern in particular unrealized exchange rate gains and losses, fair value changes of derivative financial instruments recognized in profit or loss and non-cash changes in financial liabilities.
Annual Report 2014
227
Consolidated Financial StatementsOther Notes

36| SEGMENT REPORTING
The Managing Board of HUGO BOSS AG manages the company by geographic areas. The HUGO BOSS national companies are responsible for the sale of all HUGO BOSS products that are not sold as licensed products by third parties in their respective sales territories. The managing directors of the national companies report to the regional directors in charge in each case, who in turn report to the Managing Board of HUGO BOSS AG. This organizational structure enables the direct implementation of Group objectives while taking into account specific market conditions.
Accordingly, the operating segments are organized into the three regions Europe, Americas and Asia/Pacific, in addition to the license division. The regions are allocated to the corresponding distribution companies of the HUGO BOSS Group, while the complete licenses business of HUGO BOSS with third parties is allocated to the license division.
The Managing Board of HUGO BOSS AG is the chief operating decision maker of the HUGO BOSS Group.
Management of the regional business units is aligned to the value added contribution at Group level.
The most important performance indicator used by the Managing Board to make decisions about resources to be allocated to segments is EBITDA before special items. The segment result is thus defined as EBITDA before special items of the sales units plus the gross profit margin of the sourcing units and intercompany license sales.
Group financing (including interest income and expenses) and income taxes are managed on a Group-wide basis and are not allocated to operating segments.
Management of the operating figures inventories and trade receivables is assigned to the sales territories. These items are regularly reported to the Managing Board. Consequently, segment assets only contain trade receivables and inventories.
Liabilities are not part of internal management reporting. The segment liabilities are therefore not disclosed.
The accounting rules applied in the segment information are in line with the accounting rules of the HUGO BOSS Group as described in the accounting policies.
The Managing Board regularly reviews certain effects recognized in the statement of comprehensive income, including in particular amortization, depreciation and impairment losses.
Capital expenditure is also regularly reported to the Managing Board as part of internal reporting, making it a component of segment reporting.
All expenses and assets that cannot be directly allocated to the sales territories or the license segment are reported in the reconciliations below under corporate units/consolidation. All Group-wide central functions are pooled in the corporate units. The remaining expenses of the procurement, production and R&D units make up an operating cost center. No operating income is allocated to the corporate units.
Annual Report 2014
228
Consolidated Financial StatementsOther Notes

(in EUR thousand)
Europe 1
Americas
Asia/Pacific
Licenses
Total operating segments
2014
Sales 1,566,538 586,606 360,808 57,664 2,571,616
Segment profit 536,130 151,084 112,158 49,128 848,500
In % of sales 34.2 25.8 31.1 85.2 33.0
Segment assets 237,265 200,272 98,624 16,996 553,157
Capital expenditure 50,474 23,041 26,323 0 99,838
Impairments (3,193) (6,821) (5,267) 0 (15,281)
Thereof property, plant and equipment (2,934) (6,821) (5,267) 0 (15,022)
Thereof intangible assets (259) 0 0 0 (259)
Depreciation/amortization (33,024) (23,808) (18,969) 0 (75,801)
SAR expenses and hedging 0 0 0 0 0
2013
Sales 1,457,389 570,104 346,777 57,863 2,432,133
Segment profit 2 490,227 152,013 117,291 49,301 808,832
In % of sales 2 33.6 26.7 33.8 85.2 33.3
Segment assets 209,729 143,200 79,360 17,623 449,912
Capital expenditure 53,013 39,110 33,603 1 125,727
Impairments (9,125) (2,661) (2,095) 0 (13,881)
Thereof property, plant and equipment (8,188) (2,661) (2,043) 0 (12,892)
Thereof intangible assets (937) 0 (52) 0 (989)
Depreciation/amortization 2 (28,022) (17,687) (16,709) 0 (62,418)
SAR expenses and hedging 0 0 0 0 01 Including Middle East/Africa. 2 Due to a reallocation of cost centers between Corporate Units and Europe, the amounts do not correspond to the figures reported in the prior year.
RECONCILIATION
SALES
(in EUR thousand)
2014 2013
Sales – operating segments 2,571,616 2,432,133
Corporate units 0 0
Consolidation 0 0
TOTAL 2,571,616 2,432,133
Annual Report 2014
229
Consolidated Financial StatementsOther Notes

OPER ATING INCOME
(in EUR thousand)
2014 2013
Segment profit – operating segments 1 848,500 808,832
Depreciation/amortization – operating segments 1 (75,801) (62,418)
Impairments – operating segments (15,281) (13,881)
Special items – operating segments (9,884) (3,010)
Operating income (EBIT) – operating segments 1 747,534 729,523
Corporate units 1 (287,104) (277,934)
Consolidation 1 (11,709) 4,564
Operating income (EBIT) HUGO BOSS Group 448,721 456,153
Net interest income/expenses (4,518) (14,428)
Other financial items (7,055) (8,259)
Earnings before taxes HUGO BOSS Group 437,148 433,4661 Due to a reallocation of cost centers between Corporate Units and Europe, the amounts do not correspond to the figures reported in the prior year.
SEGMENT ASSETS
(in EUR thousand)
2014 2013
Segment assets – operating segments 553,157 449,912
Corporate units 204,783 217,129
Consolidation 0 0
Current tax receivables 8,291 10,781
Current financial assets 22,528 23,323
Other current assets 83,022 69,402
Cash and cash equivalents 128,631 119,242
Non-current assets held for sale 1,136 0
Current assets HUGO BOSS Group 1,001,548 889,789
Non-current assets 660,252 611,545
TOTAL assets HUGO BOSS Group 1,661,800 1,501,334
CAPITAL EXPENDITURES
(in EUR thousand)
2014 2013
Capital expenditure – operating segments 99,838 125,727
Corporate units 34,898 59,577
Consolidation 0 0
TOTAL 134,736 185,304
Annual Report 2014
230
Consolidated Financial StatementsOther Notes

IMPAIRMENTS
(in EUR thousand)
2014 2013
Impairment – operating segments 15,281 13,881
Corporate units 0 (2,248)
Consolidation 0 0
TOTAL 15,281 11,633
DEPRECIATION/AMORTIZ ATION
(in EUR thousand)
2014 2013
Depreciation/amortization – operating segments 1 75,801 62,418
Corporate units 1 31,678 31,211
Consolidation 0 0
TOTAL 107,479 93,6291 Due to a reallocation of cost centers between Corporate Units and Europe, the amounts do not correspond to the figures reported in the prior year.
SAR-EXPENSES AND HEDGING
(in EUR thousand)
2014 2013
SAR-expenses and hedging – operating segments 0 0
Corporate units 0 (295)
Consolidation 0 0
TOTAL 0 (295)
GEOGR APHIC INFORMATION
(in EUR thousand)
Third party sales Non-current assets
2014 2013 2014 2013
Germany 446,246 416,541 180,682 177,813
Other European markets 1,117,688 1,039,163 185,479 172,910
U.S.A. 464,496 447,504 58,790 54,191
Other North, Central and South American markets 123,971 123,162 13,581 14,527
China 215,695 211,761 36,456 38,823
Other Asian markets 145,856 136,139 50,200 40,180
Licenses 57,664 57,863 15,029 15,046
TOTAL 2,571,616 2,432,133 540,217 513,490
Annual Report 2014
231
Consolidated Financial StatementsOther Notes

37| RELATED PARTY DISCLOSURES
In the reporting period from January 1 to December 31, 2014, the following transactions requiring disclosure were conducted with related parties:
PARENT COMPANY
In fiscal year 2010, HUGO BOSS AG and Red & Black Holding GmbH, Oberursel (Taunus), as the direct parent company of HUGO BOSS AG, concluded a service agreement. This service agreement, which expired in 2013, governed the preparation of quarterly and annual financial statements as well as the consolidated financial statements of Red & Black Holding GmbH, Oberursel (Taunus). In return, HUGO BOSS AG received an adequate annual fee at arm’s length conditions amounting to EUR 50 thousand, for the last time in fiscal year 2013. Effective July 1, 2013, Red & Black Holding GmbH, Oberursel (Taunus) was merged into Red & Black Lux S.à.r.l., Luxembourg. As of December 31, 2014, the Group did not have any receivables from the business relationship which ended in 2013.
In the period from January 1 to December 31, 2014, as in the prior year, no legal transactions were conducted with Permira Holdings Limited, Guernsey, as the ultimate parent company of the HUGO BOSS Group, or with companies affiliated with this company. There were no open items relating to these business transactions as of December 31, 2014.
NON- CONSOLIDATED SUBSIDIARIES
No sales were generated with the non-consolidated subsidiary HUGO BOSS Korea Ltd. in fiscal year 2014. In the prior year no transactions were conducted with the subsidiary HUGO BOSS Finland OY, which was not consolidated at the time. The company has been included in the basis of consolidation since fiscal year 2014.
ENTIT IES UNDER JOINT CONTROL
Within the scope of existing real estate lease agreements, rents in the amount of EUR 7,069 thousand were paid to companies under joint control in fiscal year 2014 (2013: EUR 2,579 thousand). There were no open liabilities relating to these business transactions as of December 31, 2014. The lease agreements also include purchase options for the respective property at expected marked value. In addition, the agreement with Distributionszentrum Vermietungsgesellschaft mbH & Co. Objekt HUGO BOSS Filderstadt KG contains a renewal option to market conditions. The remaining term of the non-cancellable lease agreements is 13 years at GRETANA Grundstücks-Ver-mietungsgesellschaft mbH & Co. Objekt D– 19 KG and 11 years at Distributionszentrum Vermietungsgesellschaft mbH & Co. Objekt HUGO BOSS Filderstadt KG.
A construction support services agreement is also in place between Distributionszentrum Vermietungsgesellschaft mbH & Co. Objekt HUGO BOSS Filderstadt KG and HUGO BOSS AG. This encompasses the preparation, execution and monitoring of construction projects, including preparation of building applications, validation of invoicing and the conclusion of agreements on behalf and for the account of Distributionszentrum Vermietungsgesellschaft mbH & Co. Objekt HUGO BOSS Filderstadt KG in connection with the establishment of a flat-packed goods distribution center in Filderstadt. For the provision of construction support services, HUGO BOSS AG received a fixed fee of EUR 250 thousand, which became due when the flat-packed goods distribution center went into operation in 2014, and EUR 10 thousand for continued construction support.
Annual Report 2014
232
Consolidated Financial StatementsOther Notes

REL ATED PARTIES
Related parties comprise members of the Managing Board and Supervisory Board. Members of the Supervisory Board and Managing Board are reported on pages 240 to 241.
Compensation of active members of the Managing BoardCompensation within the meaning of IAS 24 for active members of the Managing Board is as follows:
The expense for short-term employee benefits totaled EUR 4,434 thousand in 2014 (2013: EUR 4,321 thousand). In 2014, a service cost of EUR 2,148 thousand was incurred for company pension plans (2013: EUR 1,638 thousand). An expense of EUR 534 thousand was incurred for other long-term employee benefits reportable in 2014 (2013: EUR 1,596 thousand). As in the prior year, no expenses were incurred from termination benefits relating to members of the Managing Board active in the reporting year. There are no obligations to make share-based payments to active members of the Managing Board, nor were there any in the prior year.
By resolution of the Annual Shareholders’ Meeting of June 21, 2010, the individual amounts paid to members of the Managing Board are not disclosed. Accordingly, the disclosures required under Sec. 285 Sentence 1 No. 9 a) Sentences 5 to 8 HGB and Sec. 314 (1) No. 6 a) Sentences 5 to 8 HGB are not being made for a period of five years. This applies to the fiscal year beginning on January 1, 2010 and the following four fiscal years, i.e. until December 31, 2014. As a consequence, the total compensation is disclosed as an aggregate amount and broken down into the individual compensation components.
Total compensation of the members of the Managing Board within the meaning of Sec. 314 (1) No. 6 a) Sentences 1 to 4 HGB came to EUR 4,434 thousand in fiscal year 2014 (prior year: EUR 5,211 thousand). Of this amount, EUR 3,682 thousand was attributable to fixed salary components including fringe benefits (2013: EUR 3,466 thousand).
The total compensation for fiscal year 2014 does not include any annual bonus (in contrast to the previous year). The annual bonus is omitted if the parameter used to measure it – trade net working capital – reaches or exceeds a certain percentage above the annual target. This percentage was exceeded in fiscal year 2014.
The total compensation for fiscal year 2014 contains an amount of EUR 752 thousand for short-term variable incentives. This is related to actual target achievement for the annual bonus for 2013 and constitutes the difference between the amount of EUR 1,607 thousand paid out in 2014 and the amount of EUR 855 thousand retained as a provision in the previous year. In contrast to the previous year, no long-term variable incentives (multi-year bonuses 2013– 2015 and 2014– 2016) are included in total compensation for the year due to the three-year measurement period. In the previous year, total compensation included an amount of EUR 890 thousand equaling the difference between actual target achievement for the multi-year bonuses 2010– 2012 and the pro rata amount which had been retained as a provision in the previous year.
In fiscal year 2014, the Managing Board received an advance installment totaling EUR 2,844 thousand (2013: EUR 0) of the multiple-year bonus for fiscal year 2013, the final amount of which is calculated on the basis of target achievement for the multiple-year period 2013– 2015.
Moreover, no loans were granted to nor contingent liabilities assumed in favor of members of the Managing Board in fiscal year 2014.
Annual Report 2014
233
Consolidated Financial StatementsOther Notes

Compensation of former members of the Managing BoardIn 2014, former members of the Managing Board and their surviving dependents received total compensation of EUR 197 thousand (2013: EUR 3,967 thousand). In the fiscal year just ended, the total compensation does not include any payments to former members of the Managing Board in connection with post-employment benefits or the exercise of outstanding participation rights from the stock appreciation rights program (2013: EUR 3,774 thousand).
There are pension obligations of EUR 27,700 thousand for former members of the Managing Board and their surviving dependents (2013: EUR 22,811 thousand). The corresponding plan assets in the form of employer’s liability insurance amount to EUR 17,801 thousand (2013: EUR 17,390 thousand).
Compensation of the Supervisory BoardThe Supervisory Board received remuneration for its activities in 2013 amounting to EUR 2,134 thousand. For fiscal year 2014, total compensation is expected to come to EUR 2,209 thousand. This figure includes a provision for the variable component of EUR 1,454 thousand (2013: EUR 1,408 thousand), which is calculated on the basis of the earnings per share in the consolidated financial statements. The total compensation of the Supervisory Board falls due in the short term.
Other related party disclosuresIn total, the members of the Managing Board and Supervisory Board hold less than 1% (2013: less than 1%) of the shares issued by HUGO BOSS AG.
Members of the Managing Board and Supervisory Board purchase HUGO BOSS products as part of the compen-sation in kind granted to them supplementary to their salary and for their personal use. Besides this, no significant transactions were concluded between companies of the HUGO BOSS Group and key management personnel and their close family members.
In addition, a type of share-based payment was introduced in 2008 for members of the Managing Board and for second-tier executives with the management participation program (MPP). Under the MPP, managers could obtain an indirect investment in Red & Black TopCo S.à r.l., Luxembourg, which is a related party within the meaning of IAS 24.9. Reference is made to Note 38 as regards the framework conditions of the MPP.
38| SHARE-BASED PAYMENTS
STOCK APPRECIATION RIGHTS PROGR AM
In fiscal 2001, HUGO BOSS AG introduced a stock appreciation rights program for Managing Board members and executives.
Under the stock appreciation rights program executives of HUGO BOSS AG and its subsidiaries were granted a certain number of participation rights, which allowed them to benefit from increases in the value of HUGO BOSS AG shares. The participation rights can only be settled in cash and do not entitle the holder to any HUGO BOSS AG shares.
Annual Report 2014
234
Consolidated Financial StatementsOther Notes

1) Program change 2009In order to avoid additional expenses in connection with hedging instruments, management of HUGO BOSS AG decided in December 2009 to revise the general terms and conditions of the stock appreciation rights program. Effective December 14, 2009, all eligible executives were therefore offered the following revised program:
1 / Waiver of the participation rights and all rights from the tranches issued in the years 2005 through 2008 in exchange for cash compensation
2 / Adjustment of the exercise conditions for the tranche issued in 2009
The compensation payment for the waiver of the rights relating to tranches 5 to 8 corresponded to the sum of the option value of each tranche multiplied by the number of participation rights. The option value factored into the calculation was determined as of December 14, 2009 by external banks engaged by HUGO BOSS AG using a valuation model as is customary in the sector. The reference value used for the share price was the unweighted average closing price of preferred shares of HUGO BOSS AG in the Xetra index of the Frankfurt stock exchange on the five trading days immediately preceding December 14, 2009.
To limit upside and downside effects from extraordinary and unforeseeable share price developments, the revised program set floors and caps on the exercise premium possible per option for the participation rights in tranche 9. In effect, the remuneration granted corresponded to at least the difference between the imputed market capitalization allocable to a preference share of HUGO BOSS AG for the five trading days immediately preceding December 14, 2009, and the strike price of the preferred share, but no more than EUR 33.20. In addition, effective December 14, 2009, the revised program allowed eligible parties to exercise up to one third of the participation rights of tranche 9 early prior to the expiry of the vesting period. This was possible for the first time as of December 14, 2009. The exercise gain in such an event corresponded to the aforementioned minimum remuneration of EUR 11.77.
Under the revised program, the holding period was prolonged to a period of three years ending December 31, 2011, (a two-year period was set prior to the revision of the program); accordingly, the exercise period was shortened to a period of two years ending December 14, 2013 (a three-year exercise period was set prior to the revision of the program). The total term of the tranche 9 issued in fiscal year 2009 remained unchanged at five years.
Following the continuous increase in the share price, the maximum possible exercise gain per option for the participation rights of tranche 9 had already been reached in October of fiscal year 2010. Under the program revised in 2009, it was possible to fully exercise tranche 9 for the first time at the beginning of 2012.
2) Early termination of tranche 9As the stock appreciation rights program causes a considerable administrative expense in both the HR and Finance departments of the HUGO BOSS Group, management of HUGO BOSS AG decided to terminate tranche 9 early and offered all holders of participation rights in tranche 9 a payout of the maximum exercise gain possible per option exercised as of December 15, 2010. Early termination of the program did not result in any additional expenses, provided the share price did not exceed EUR 45.00 at the end of 2011. The expenses from the pro rata additions to provisions for tranche 9 relating to 2011 were merely brought forward to 2010.
Annual Report 2014
235
Consolidated Financial StatementsOther Notes

As of December 31, 2010, the share price of the preferred shares stood at EUR 56.50 and was thus significantly above the share price of EUR 45.00 that would entail the maximum possible exercise gain.
Following the program revision in 2010, it was still possible to exercise any remaining participating rights of tranche 8 under the rules of the original option conditions.
3) General terms and conditions of stock appreciation rights programWith the exception of the replaced tranche 9, the other tranches of the stock appreciation rights program had a term of six years. The four-year exercise period began upon expiry of the lock-in period of two years. Following the program revision in 2009, it was still possible to exercise any remaining participating rights of tranches 5 to 8 under the regulations governing the original option conditions.
If the development of the market capitalization of HUGO BOSS AG exceeded the development of the MDAX by 5 percentage points (exercise hurdle) at the end of the lock-up period or during the subsequent exercise period, it was possible to exercise participation rights in tranche 8. The remuneration payable was based on the difference between the market capitalization allocable to a preferred share of HUGO BOSS taking into account the average share price during the five trading days preceding the exercise date and the strike price of the preferred share pursuant to the underlying terms and conditions. The strike price corresponded to the average price of a preferred share of HUGO BOSS AG during the 20 trading days preceding the date of issue.
In order to limit the risk arising from share price fluctuations in connection with the stock appreciation rights program and hence the potential impact on the cash flow and earnings of HUGO BOSS AG, a corresponding hedging program was entered into at the end of 2007 with effect as of fiscal year 2008. Under the hedging program, in the first quarter of fiscal year 2008 HUGO BOSS AG purchased from independent banks U.S. call options for HUGO BOSS preferred shares with the same terms as the granted stock appreciation rights (SAR). The subscription right was 1:1, i.e., each option corresponded to one preferred share. The total investment volume was just under EUR 33 million.
If the corresponding call options were sold back to the issuing bank when the stock option rights were exercised by employees, the outflow of funds from the exercise of stock option rights was offset by an inflow of funds from the sale of call options.
The obligations arising from the SARs for HUGO BOSS AG which were recognized in the form of corresponding provisions and the call options used as hedging instruments were recognized at fair value though profit or loss as of each reporting date. The measurements of the call options and SAR obligations were based on the market values provided by the issuing banks. As the value of the call options and the corresponding SARs were identical at the reporting date, the resulting effects on earnings largely offset each other.
Changes in the value of SARs with effect on profit or loss within the exercise period together with the corresponding hedging transaction were netted against the personnel expenses of the function administration expenses and other operating expenses/income.
In fiscal year 2014, as in the prior year, the stock appreciation rights did not affect personnel expenses. Likewise, no expense was recognized in the financial result as a result of the measurement and derecognition of hedging transactions (2013: EUR 295 thousand).
Annual Report 2014
236
Consolidated Financial StatementsOther Notes

As a result, no expenses were incurred in connection with stock appreciation rights for fiscal year 2014 (2013: EUR 295 thousand). No stock appreciation rights remained as of December 31, 2013. The provisions were utilized in full in connection with the amounts paid out in fiscal year 2013. Correspondingly, an intrinsic value and a fair value for the participation rights were no longer recognized. There were no derivatives used for hedging purposes left in the portfolio.
At the Annual Shareholders’ Meeting of HUGO BOSS AG on May 8, 2008 a resolution was passed by majority vote to pay out a special dividend. The SAR parameters were adjusted to the EUREX conditions in line with the prevailing exercise conditions of the SAR program. An R-factor of 87.24% was used in this context, which means that the previous strike prices (100%) and quantities were adjusted by this factor. This resulted in the following adjusted strike prices:
Tranche 7 Tranche 8
Date of issue January 2007 January 2008
Strike price (EUR) pre special dividend 39.08 42.11
Strike price (EUR) post special dividend 34.09 36.74
The stock appreciation rights program developed as follows in 2014 and 2013:
2014WASP 2014 1
(EUR) 2013WASP 2013 1
(EUR)
Number of SARs on Jan. 1 0 0.00 68,760 36.74
Newly granted SARs 0 0.00 0 0.00
Forfeited SARs 0 0.00 0 0.00
Exercised SARs 0 0.00 (68,760) 36.74
Expired SARs 0 0.00 0 0.00
Replaced SARs 0 0.00 0 0.00
Number of SARs on Dec. 31 0 0.00 0 0.00
Number of SARs exercisable on Dec. 31 0 0.00 0 0.001 WASP = Weighted average strike price.
All remaining options were exercised in 2013. Derivatives held for hedging purposes were sold in connection with the exercise.
In fiscal year 2014, no payments were made to eligible executives in connection with the stock appreciation rights program (2013: EUR 3,774 thousand).
MANAGEMENT PARTIC IPATION PROGR AM
Under the management participation program (MPP) introduced in 2008, members of the Managing Board and second tier executives were given the opportunity to invest indirectly in Red & Black TopCo S.à r.l. in exchange for a payment. Since the restructuring performed at the end of 2009, Red & Black TopCo S.à r.l. holds, through Red
Annual Report 2014
237
Consolidated Financial StatementsOther Notes

& Black Lux S.à r.l., a direct 100% holding in Valentino Fashion Group S.p.A in addition to the indirect investment in HUGO BOSS AG. Management of HUGO BOSS has therefore invested not only in the HUGO BOSS Group, but also in the companies of the Valentino Fashion Group not controlled or influenced by HUGO BOSS.
The indirect investment in Red & Black TopCo S.à r.l. is held via a German partnership with the company Red & Black Management Beteiligungs GmbH & Co. KG (“MPP KG”). MPP KG holds a 0.07% investment in the voting capital of Red & Black TopCo S.à r.l. and holds Class D shares. The partnership agreement has been concluded for an indefinite period of time, but at least until the end of 2024. The legal position of the managers in MPP KG is governed by the partnership agreement. The maximum investment in MPP KG is set individually. The managers are limited partners in MPP KG entered in the commercial register.
At the end of 2010, the MPP was modified for managers who already held an investment (hereinafter “old managers”), and managers who did not yet hold an investment (hereinafter “new managers”) were again offered the opportunity to invest in MPP KG.
The new managers acquired the limited partnership interests in MPP KG in December 2010 at the fair value at that time. The old managers continue to hold the shares in MPP KG they acquired in 2008. The shares in MPP KG held by the old managers are neither exchanged nor sold.
Following the restructuring of the MPP, in the event of an IPO or the sale of the HUGO BOSS Group (hereinafter “exit”), management of HUGO BOSS will participate through MPP KG only in the exit proceeds allocable to HUGO BOSS (hereinafter “HB AG proceeds”). All proceeds and costs allocable to Valentino Fashion Group S.p.A. would be eliminated in the process of determining the HB AG proceeds. The right to participate in these HB AG proceeds arose pro rata temporis over a multi-year vesting period ending on December 31, 2014.
In the context of the modification of the MPP, the subordination to the individual financial instruments and the ratchet of these class D shares no longer apply. With respect to the partnership agreement, the restructuring led to the creation of liquidity preferences. These give priority to certain capital before distribution of the HB AG proceeds to the limited partners and serve as financial compensation for investors for the decline in value of the class D shares in the interim compared to the current fair value.
If MPP shares attributable to managers are sold as part of an exit, the manager is entitled to a proportionate amount of the HB AG proceeds generated net of liabilities and liquidation preferences. The managers’ entitlement to payouts of the proportionate residual sales proceeds is tied to the condition that the manager concerned has not left the HUGO BOSS Group at the time of the exit. The only restrictions on the entitlement to payouts of the proportionate exit proceeds pertain to managers who leave the Company before an exit. If a manager leaves the company prematurely, Red & Black TopCo S.à r.l. has the right in principle to acquire the interests held by the manger concerned. The manager leaving is classified as a “good leaver” or a “bad leaver” when determining the acquisition price.
If the planned exit is executed, future profit distributions and future gains on disposal are allocated to participating members of the Managing Board and executives based on their position as partners. In such cases HUGO BOSS would not incur any staff costs that would have to be posted to profit or loss.
Annual Report 2014
238
Consolidated Financial StatementsOther Notes

As in the prior year, the MPP did not affect the profit or loss of the HUGO BOSS Group in 2014, as no exits or comparable transactions have been entered into since the introduction of the MPP that would have required measurement at fair value. No assets or liabilities were recognized in connection with the MPP as of December 31, 2010, and nor as of the reporting date.
39| SUBSEQUENT EVENTS
HUGO BOSS will take over the last stores in the Chinese market that are still operated under the franchise model. The agreement reached with the partner Wenzhou Noble on January 26, 2015 provides for control over all 21 BOSS stores to be transferred to HUGO BOSS on April 1, 2015. This will enable the Group to implement its strategy, which aims at enhancing the brand image and upgrading the retail network, in an even more targeted manner and consistently across all channels.
Between the end of fiscal year 2014 and the release for publication of this report on February 19, 2015 there were no further notable macroeconomic, socio-political, industry-related or company-specific changes which could have a material impact on the Company’s results of operations, net assets and financial position according to the expectations of management.
Finally, HUGO BOSS AG’s shareholder structure changed on February 10, 2015 following two share placements by Red & Black Lux S.à r.l., an entity in which Permira Holdings Limited holds a majority interest. Prior to the placements, this entity had held 22.4 million shares, equivalent to 32% of the share capital, and was thus the largest single shareholder. Following the placement of 9 million shares with institutional investors and the sale of a further package of just under 5 million shares to PFC S.r.l. and Zignago Holding S.p.a., which are owned by the Italian Marzotto family, it now holds just under 8.5 million shares, equivalent to 12% of the share capital.
40| GERMAN CORPORATE GOVERNANCE CODE
In December 2014, the Managing Board and Supervisory Board of HUGO BOSS AG issued the declaration of compliance prescribed by Sec. 161 AktG. It is available for shareholders on the Company’s website.
41| GROUP AUDITOR FEES
(in EUR thousand)
2014 2013
Audit services 388 384
Other assurance services 56 5
Tax advisory services 228 118
Other services 45 192
TOTAL 717 699
Annual Report 2014
239
Consolidated Financial StatementsOther Notes

MANAGING BOARD
CL AUS-DIETRICH L AHRS
Stuttgart, GermanyChairman of the Managing Board Responsible for Sales, Own Retail, Communications, Licenses
MARK L ANGER
Stuttgart, GermanyResponsible for Finance & Controlling, Investor Relations, Legal, Compliance and Risk Management, IT, Logistics, Human Resources Director of Labor Relations
CHRISTOPH AUHAGEN
Stuttgart, GermanyResponsible for Creative Management, Brand Management, Sourcing and Production
Annual Report 2014
240
Consolidated Financial StatementsManaging Board

SUPERVISORY BOARD
DR. HELLMUT ALBRECHT
Munich, Germany
Management Consultant Chairman of the Supervisory Board
ANTONIO SIMINA
Metzingen, GermanyTailor/Chairman of the Works Council HUGO BOSS AG, Metzingen, Germany Deputy Chairman of the Supervisory Board Employee representative
GERT BAUER
Reutlingen, GermanyFirst Authorized Representative of the German Metalworkers´ Union (IG Metall), Reutlingen/Tübingen, Germany Employee representative
HELMUT BRUST
Bad Urach, GermanySenior Head of Corporate Culture, Health and Safety HUGO BOSS AG, Metzingen, Germany Employee representative
DAMON MARCUS BUFFINI
Surrey, Great BritainManaging Director Permira Advisers LLP, London, Great Britain
MONIK A LERSMACHER
Kornwestheim, GermanySecretary of the German Metalworkers´ Union IG Metall Area Headquaters Baden-Württemberg, Stuttgart, Germany Employee representative
DR. KL AUS MAIER
Stuttgart, Germany
Management Consultant
GAETANO MARZOT TO
Milan, ItalyChairman of the Supervisory Board Gruppo Santa Margherita S.p.A., Fossalta di Portogruaro, Italy
LUCA MARZOT TO
Venice, Italy Chief Executive Officer Zignago Holding S.p.A., Fossalta di Portogruaro, Italy
SINAN PISKIN
Metzingen, GermanyAdministrative Employee HUGO BOSS AG, Metzingen, Germany Employee representative
BERND SIMBECK
Metzingen, GermanyAdministrative employee HUGO BOSS AG, Metzingen, Germany Employee representative
DR. MARTIN WECKWERTH
Frankfurt/Main, GermanyPartner Permira Beteiligungsberatung GmbH, Frankfurt/Main, Germany
Annual Report 2014
241
Consolidated Financial StatementsSupervisory Board

ADDITIONAL DISCLOSURES ON THE MEMBERS OF THE SUPERVISORY BOARD AND THE MANAGING BOARD
The members of HUGO BOSS’ Supervisory Board are also members of an executive body at the following companies1:
Dr. Hellmut Albrecht
MME Moviement AG 2
Berlin, Germany
Gert Bauer ElringKlinger AG Dettingen/Erms, Germany
Monika Lersmacher Berthold Leibinger GmbH Ditzingen, Germany
Dr. Klaus Maier Diehl Stiftung & Co. KG 2
Titan X Holding ABGaleria Kaufhof GmbH
Nuremberg, GermanyMjällby, SwedenCologne, Germany
Gaetano Marzotto Zignago Holding S.p.A.Santa Margherita S.p.A. 2
Zignago Vetro S.p.A.Alpitour S.p.A.
Fossalta di Portogruaro, ItalyFossalta di Portogruaro, ItalyFossalta di Portogruaro, ItalyTurin, Italy
Luca Marzotto Zignago Holding S.p.A. 2
Santa Margherita S.p.A.H. Farm Ventures S.p.A.New High Glass Inc.Centervue S.p.A.Cà del Bosco Srl – Società AgricolaVetri Speciali S.p.A.Zignago Vetro S.p.A.Telecom Italia
Fossalta di Portogruaro, ItalyFossalta di Portogruaro, ItalyRoncade, ItalyMiami, FL, U.S.A.Padua, ItalyErbusco, ItalyTrento, ItalyFossalta di Portogruaro, ItalyMilan, Italy
1 The members not named have no seats on executive or advisory bodies at other companies.2 Member holds position of Chairman.
The Managing Board is also member of an executive body at the following company1:
Claus-Dietrich Lahrs Ravensburger AG Ravensburg, Germany1 The members not named have no seats on executive or advisory bodies at other companies.
Annual Report 2014
242
Consolidated Financial StatementsAdditional Disclosures on the Members of the Supervisory Board and the Managing Board

PUBLICATION
The annual and consolidated financial statements of HUGO BOSS AG are published in the German Federal Gazette and on the website of HUGO BOSS.
Metzingen, February 19, 2015
HUGO BOSS AGThe Managing Board
Claus-Dietrich Lahrs Christoph AuhagenMark Langer
Annual Report 2014
243
Consolidated Financial StatementsAdditional Disclosures on the Members of the Supervisory Board and the Managing Board

RESPONSIBILITY STATEMENT
To the best of our knowledge, and in accordance with the applicable reporting principles, the consolidated financial statements give a true and fair view of the assets, liabilities, financial position and profit or loss of the Group, and the management report, which is combined with the management report of HUGO BOSS AG, includes a fair review of the development and performance of the business and the position of the HUGO BOSS Group, together with a description of the principal opportunities and risks associated with the expected development of the Group.
Metzingen, February 19, 2015
HUGO BOSS AGThe Managing Board
Claus-Dietrich Lahrs Christoph AuhagenMark Langer
Annual Report 2014
244
Consolidated Financial StatementsResponsibility Statement
AUDIT OPINION
We have issued the following opinion on the consolidated financial statements and the group management report, which has been combined with the management report of the Company:
“We have audited the consolidated financial statements prepared by HUGO BOSS, Metzingen, comprising the income statement, the statement of comprehensive income, the statement of financial position, the statements of cash flows and changes in equity and the notes to the consolidated financial statements, together with the group management report, which has been combined with the management report of the Company, for the fiscal year from 1 January to 31 December 2014. The preparation of the consolidated financial statements and the group management report in accordance with IFRSs as adopted by the EU and the additional requirements of German commercial law pursuant to Sec. 315a (1) HGB [“Handelsgesetzbuch”: German Commercial Code] is the responsibility of the Company’s management. Our responsibility is to express an opinion on the consolidated financial statements and on the management report based on our audit.
We conducted our audit of the consolidated financial statements in accordance with Sec. 317 HGB and German generally accepted standards for the audit of financial statements promulgated by the Institut der Wirtschaftsprüfer [Institute of Public Auditors in Germany] (IDW). Those standards require that we plan and perform the audit such that misstatements materially affecting the presentation of the net assets, financial position and results of opera-tions in the consolidated financial statements in accordance with the applicable financial reporting framework and in the group management report are detected with reasonable assurance. Knowledge of the business activities and the economic and legal environment of the Group and expectations as to possible misstatements are taken into account in the determination of audit procedures. The effectiveness of the accounting-related internal control system and the evidence supporting the disclosures in the consolidated financial statements and the group management report are examined primarily on a test basis within the framework of the audit. The audit includes assessing the annual financial statements of those entities included in consolidation, the determination of entities to be included in consolidation, the accounting and consolidation principles used and significant estimates made by management, as well as evaluating the overall presentation of the consolidated financial statements and the group management report. We believe that our audit provides a reasonable basis for our opinion.
Our audit has not led to any reservations.
In our opinion, based on the findings of our audit, the consolidated financial statements comply with IFRSs as adopted by the EU as well as the additional requirements of German commercial law pursuant to Sec. 315a (1) HGB and give a true and fair view of the net assets, financial position and results of operations of the Group in accordance with these requirements. The group management report is consistent with the consolidated financial statements and as a whole provides a suitable view of the Group’s position and suitably presents the opportunities and risks of future development.”
Stuttgart, February 19, 2015
Ernst & Young GmbHWirtschaftsprüfungsgesellschaft
Matischiok BillerWirtschaftsprüfer Wirtschaftsprüferin[German Public Auditor] [German Public Auditor]
Annual Report 2014
245
Consolidated Financial StatementsAudit Opinion