Embed Size (px)
Citation preview

UnipolSai Assicurazioni2014 Consolidated Financial Statements


UnipolSai Assicurazioni S.p.A. _____________________________________________________ Registered Offices at Via Stalingrado 45, Bologna - Fully paid-up share capital €1,996,129,451.62 Tax Code and Bologna Register of Companies No. 00818570012 - R.E.A. No. 511469 Authorised insurance company pursuant to Art. 65, Royal Decree no. 966 of 29 April 1923, converted to Law no. 473 of 17 April 1925. Entered in Section I of the Insurance and Reinsurance Companies List at No. 1.00006 and a member of the Unipol Insurance Group, entered in the Register of Insurance Groups - No. 046. Company subject to management and coordination by Unipol Gruppo Finanziario S.p.A. www.unipolsai.com - www.unipolsai.it
2014 Consolidated Financial Statements
Bologna, 19 March 2015


CONTENTS Company bodies .......................................................................................................................... 7
Introduction Macroeconomic background and market performance ............................................................... 9 Principal new legislation ............................................................................................................ 14
Graph showing Consolidation Scope at 31 December 2014 .................................................. 17 MANAGEMENT REPORT Preamble ...................................................................................................................................... 21 Group highlights ........................................................................................................................... 29 Management report ...................................................................................................................... 31 Salient aspects of business operations ........................................................................................ 40 Insurance Sector .......................................................................................................................... 43 Real Estate Sector ....................................................................................................................... 55 Other Businesses Sector .............................................................................................................. 57 Asset and financial management ................................................................................................. 59 Shareholders’ equity..................................................................................................................... 63 Technical provisions and financial liabilities ................................................................................. 65 Other information
Human Resources .................................................................................................................. 67 Social and environmental responsibility .................................................................................. 67 Group sales network ............................................................................................................... 69 IT services .............................................................................................................................. 69 Transactions with related parties ............................................................................................ 71 Report on corporate governance and ownership structures pursuant to Art. 123-bis of Legislative Decree 75 of 24 February 1998 ..................................................... 72 Statement pursuant to Art. 2.6.2, paragraph 9 of the Regulation governing markets organised and managed by Borsa Italiana SpA ...................................................................................... 72
Significant events after the reporting period ................................................................................. 73 Business outlook............................................................... ........................................................... 75 CONSOLIDATED FINANCIAL STATEMENTS AT 31 DECEMBER 2014 CONSOLIDATED FINANCIAL STATEMENTS Statement of financial position ..................................................................................................... 78 Income statement and comprehensive income statement ........................................................... 80 Statement of changes in shareholders’ equity ............................................................................. 82 Statement of cash flows ............................................................................................................... 83
3

NOTES TO THE FINANCIAL STATEMENTS 1. Basis of presentation ................................................................................................................ 87 2. Main accounting standards ..................................................................................................... 93 3. Notes to the Statement of Financial Position ......................................................................... 122 4. Notes to the Income Statement .............................................................................................. 143 5. Other information ................................................................................................................... 150
5.1 Hedge Accounting .......................................................................................................... 150 5.2 Information relating to the actual or potential effects of netting agreements .................. 151 5.3 Earnings (loss) per share ................................................................................................ 152 5.4 Dividends ........................................................................................................................ 152 5.5 Non-current assets or assets of a disposal group held for sale ...................................... 152 5.6 Transactions with related parties .................................................................................... 154 5.7 Fair value measurements – IFRS 13 .............................................................................. 158 5.8 Information on personnel ................................................................................................ 161 5.9 Non-recurring significant transactions and events .......................................................... 163 5.10 Atypical and/or unusual positions or transactions ............................................................. 163 5.11 Criteria to determine the recoverable amount of goodwill with an indefinite useful life (impairment test)................ ..................................................................... ......164 5.12 Notes on Non-Life business .......................................................................................... 167 5.13 Notes on Life business ................................................................................................. 170 5.14 Risk Report ................................................................................................................... 171 5.15 Information requested by Consob pursuant to Art. 114, paragraph 5, of Legislative Decree 58/98.......................................................................................... 189
TABLES APPENDED TO THE NOTES TO THE FINANCIAL STATEMENTS Consolidation scope ................................................................................................................... 194 Consolidation scope: interests in entities with material non-controlling interests ....................... 196 Details of unconsolidated investments ....................................................................................... 197 Statement of financial position by business segment ................................................................. 198 Income statement by business segment .................................................................................... 199 Details of property, plant & equipment and intangible assets ..................................................... 200 Details of financial assets ........................................................................................................... 201 Details of assets and liabilities relating to insurance contracts where the investment risk is borne by policyholders and arising from pension fund management .................................................................................... 202 Details of technical provisions – reinsurers' share ..................................................................... 203 Details of technical provisions .................................................................................................... 204 Details of financial liabilities ........................................................................................................ 205 Details of technical insurance items ........................................................................................... 206 Investment income and charges ................................................................................................ 207 Details of insurance business expenses .................................................................................... 208 Details of other consolidated comprehensive income ................................................................ 209 Assets and liabilities at fair value on a recurring and non-recurring basis: breakdown by fair value level ....................................................................................................................... 210
4

Details of changes in level 3 assets and liabilities at fair value on a recurring basis ................................................................................................ 211 Assets and liabilities not measured at fair value: breakdown by fair value level ........................ 212
STATEMENT ON THE CONSOLIDATED FINANCIAL STATEMENTS IN ACCORDANCE WITH ART. 81-TER, CONSOB REGULATION NO. 11971/1999 .................................................................. 215
SUMMARY OF FEES FOR THE YEAR FOR SERVICES PROVIDED BY THE INDEPENDENT AUDITORS ....... 219
ADDITIONAL INFORMATION ON THE SIGNIFICANT EVENTS OCCURRED AFTER APPROVAL OF THE CONSOLIDATED FINANCIAL STATEMENTS AT 31 DECEMBER 2014 ................................................... 223
BOARD OF STATUTORY AUDITORS’ REPORT ................................................................................. 227
INDEPENDENT AUDITORS’ REPORT ............................................................................................... 231
5

Company bodies
Board of Directors
Chairman Fabio Cerchiai (*)
Vice Chairman Pierluigi Stefanini (*)
The Chief Executive Officer Carlo Cimbri (*)
Directors Francesco Berardini Milva Carletti Paolo Cattabiani Lorenzo Cottignoli Ernesto Dalle Rive Cristina De Benetti Ethel Frasinetti Giorgio Ghiglieno
Massimo Masotti Maria Rosaria Maugeri Maria Lillà Montagnani Nicla Picchi (*) Giuseppe Recchi Barbara Tadolini Francesco Vella (*) Mario Zucchelli
Secretary of the Board of Directors Roberto Giay
(*) Members of the Executive Committee
Board of Statutory Auditors
Chairman Giuseppe Angiolini
Statutory Auditors Sergio Lamonica Giorgio Loli
Alternate Auditors Domenico Livio Trombone Maria Luisa Mosconi Giovanni Rizzardi
Independent auditors PricewaterhouseCoopers SpA
Joint representative of the Class “A” Savings Shareholders Joint representative of the Class “B” Savings Shareholders
Dario Trevisan
Giuseppe Dolcetti
Manager in charge of financial reporting
Maurizio Castellina
7


Introduction Macroeconomic background and market performance
Macroeconomic background
The year 2014 was characterised by global economic growth of a little over 3%, essentially in line with the results achieved in 2013. Economic activity in the USA, after the false start of the first quarter of 2014 attributable to the exceptional cold weather, recorded satisfactory expansion rates: +5% yoy in the third quarter and +2.2% in the fourth, for a total growth of 2.4% compared to 2013. Several factors contributed to this result: the strength of private consumption, expansionary fiscal policy and a good investments trend. The labour market became stronger, with an unemployment which fell gradually during the year to reach 5.6% in December. Though completing the third Quantitative Easing, the Federal Reserve kept official rates at near zero, reserving the right to increase them at an as yet unspecified future date. Japan, despite the Quantitative Easing put into place by the central bank, again fell into a recession as a result of the mid-year tax increase to limit the considerable public deficit, whilst implementation of the structural reforms of the Abe Government - reconfirmed at the recent elections - is slow. Though marginally slowing its growth rate, China continues the process of changing its development model in order to enhance demand on the home market by restructuring the impact seen thus far from exports and investments. In 2014 a number of emerging countries, particularly Russia and Venezuela, saw a significant drop in oil prices, whilst the stronger dollar caused tension in countries such as Turkey and Brazil that have a greater need to attract capital to finance their structural deficits. For the Italian economy, 2014 was the third consecutive year of recession, with GDP down by 0.4%. Growth in the Eurozone failed to rise above 0.9%.
The weak economic trend in Europe led to the ECB’s adoption of an expansionary monetary policy, as far as its statutory restrictions will permit. At the same time, the Federal Reserve found itself managing a positive economic development. The dichotomy between the directions taken by the world’s two major central banks led to the dollar appreciating against the euro from late spring of 2014 onwards.
Confirming Europe’s fragility, a gradual narrowing of differences in consumer prices was seen in 2014. In December, Eurozone inflation recorded a negative value (-0.2%), representing a framework in which over half of European countries have fallen into a deflationary phase. An important contribution to the consumer price freeze came from the collapse of oil prices (Brent), from a peak of $115.43 per barrel reached on 19 June 2014 to $54.76 at year end (-52.6%). To combat these signs, the ECB cut the refinancing rate in September to 0.05% and launched a series of initiatives to provide greater funding to the banking system, a condition necessary to reactivating the flow of lending to the economy, including the ABS purchase programme, that relating to covered bonds and TLTRO (Targeted Longer Term Refinancing Operations), the latter with the aim of allowing banks to grant credit to businesses and households.
In this scenario Italy continued to suffer low growth associated with high unemployment. Demand on the home market proved weak, particular in terms of investments, which would be the determining factor in increasing GDP and reabsorbing the unemployed labour force. Some positive signs on the employment front emerged in the last month of the year. ISTAT reported that the balance of trade (goods) in 2014 was positive by just under
9

€43bn (+46.8% on 2013). However, though positive per se, these figures are the result of a modest increase in exports (+2%) and a drop in imports (-1.6%) concentrated solely in the energy segment (-14.4%).
The public deficit-GDP ratio reached 132.1% in December 2014, up on the 128.5% recorded in September 2013. It should be specified that these figures benefit from the new national accounting system (SEC2010) in which GDP (the ratio denominator) now includes an estimate of transactions associated with criminal activities (drug trafficking, smuggling and prostitution).
Lower nominal interest rates recognised on government securities would result in only a limited benefit to the public debt sustainability. The significant drop in inflation has in effect led to an increase in the real cost of debt.
Financial markets
In 2014, the money market interest rate curve recorded a general decrease affecting all maturities. However, stronger decreases were recorded on long-term nodes with 20 and 30-year IRS down by over 120 basis points. Short-term rates fell at a slower pace as they are already so close to zero. As regards government returns, the German bond curve recorded a similar trend, with more pronounced decreases on nodes with longer maturities, whilst the 2- and 3-year maturities began following a negative rate curve. Not very dissimilar was the path followed by Italian government rates, these too seeing a downturn across the entire time horizon. The spread between returns on Italian and German securities narrowed in 2014 by around 50 basis points on curve nodes up to 10 years, whilst for longer term securities the spread narrowed by a more modest extent. From the end of the summer onwards, in the wake of forecasts of an ECB launch of monetary easing, the euro suffered gradual depreciation which led to the USD-EUR rate dropping from the peak of 1.40 recorded on 8 May to 1.21 at the end of December.
In a context of extremely low market rates, both for macroeconomic reasons and due to the direct action by the main central banks, the 2014 performance of European equity markets was not particularly bright. The Eurostoxx 50 index, representing Eurozone securities with the highest level of capitalisation, increased by only 1.2% (-2.5% in the fourth quarter of 2014). The German Dax performed well with a rise of +2.7% (+3.5% in the last quarter of the year), while Borsa Italiana (the Italian Stock Exchange), with the Milan FTSE Mib index, gained +0.2% (-9% in the fourth quarter of 2014). Lastly, Madrid’s Ibex recorded a positive performance, rising +3.7% (-5.0% in the final quarter of 2014). The Standard & Poor’s 500 index, representing the main listed companies in the United States, recorded an increase of +11.4% (+4.4 in the fourth quarter of 2014), while in Japan, the Nikkei index gained 7.1% in 2014 (+7.9% in the fourth quarter of 2014). Lastly, in relation to the emerging market indices, the most representative index, the Morgan Stanley Emerging Market, rose by +2.5% in 2014 (-0.4% in the fourth quarter of 2014).
The Itraxx Senior Financial index, representing the average spread of financial sector companies with a high credit rating, rose by 3.9 basis points, from 63.5 to 67.4 at the end of the fourth quarter of 2014 (in reference to all of 2014 the change was of the opposite sign, contracting by 19.4 basis points from 86.8 to 67.4). The expansion in the final quarter of the year was seen mainly as a result of the higher market volatility caused by persisting international geopolitical tension and the return of political risk in Greece.
Insurance sector
Again in 2014 the Italian insurance market growth rates saw a further decline in the Non-Life business, whilst the Life business market rates recorded a highly significant increase.
10

Throughout the third quarter of 2014, Non-Life business (also including cross-border operations) saw a 3.1% decrease compared to the same period of 2013. The decline was concentrated in the MV segment, where motor vehicle TPL was down 7.3% as a result of two separate phenomena: on the one hand the drop in claims frequency, strictly associated with lower mileage averages per vehicle due to the economic crisis, and on the other hand the high level of competition in the sector which allows benefits from the drop in claims to be transferred directly to consumers. Available figures show that, at the end of the third quarter of 2014, the decrease in average MV TPL premiums (-5.9% year on year) was higher in absolute terms than the drop in claims seen in the same period (-3.9%, also calculated yoy). It follows that, at market level, the trend is one of lower technical profitability in the main Non-Life business.
Premiums in Land Vehicle Hulls business recorded a slower decline of 2.4% (-8.6% in 2013). The partial recovery in vehicle registrations (+4.9% in 2014 after six consecutive years of decline) limited the erosion of the business unit’s premiums. The trend in the Non-MV Non-Life class appears to be more structured. The overall figure shows a slower growth in premiums (+1.3% in the first nine months of 2014), against which certain segments have shown a significant decrease (Transport -9%), others remained stationary (Accident, Health and General TPL) and others still under development (Other Damage to Property +5.3%, Legal Expenses +6.6%, Assistance +10%, Pecuniary Losses +11.1%). A 2.2% increase was seen in premiums collected in Italy by representative companies in the European Economic Area (ANIA data), compared to a 1.2% growth recorded by Italian and non-EU businesses. This confirms the shift of major customer segments towards specialised operators able to best meet specific requirements in complex management segments, such as civil liability insurance or goods in transit insurance.
Despite the difficult economic scenario, in the last few quarters ISTAT has reported a stronger appetite for investment of households, now recovering after the minimum seen in the last quarter of 2012. This trend suggests the transformation of consumer models seen in correspondence with a complex economic phase, which Italians clearly no longer see as transitional. In this context, in 2014 new Life business for individuals recorded a remarkable leap forward: +44.4% on 2013 to give a monetary volume of more than €106bn (including cross-border activities). This is an extraordinary result aided by different factors: the low interest rates resulting from ECB monetary policy, the commercial drive of banks at a time when pressure has eased on accumulating direct deposits, and investors’ search for products to satisfy their poor appetite for risk. Business development centred on Class I products (over €67bn in new premiums, corresponding to growth of 42.5%). Considerable increases were recorded by unit-linked policies (+60.6%) and in class V business (+100.5%). The banking and post office channel confirmed its leading position with a market share of 71.3% and a 49.2% development rate. As a result of the recovery seen in the last few months of the year, financial advisors recorded a stronger growth rate: +65.0%. According to ANIA preliminary forecasts, Life business premiums for 2014 will be around €110bn (excluding cross-border activities), up 30% on the previous year. Life business net premium income, i.e. the difference between premiums and services paid by insurers are expected to reach €46bn in 2014, around three times the figure achieved in 2013. In this respect, note the decline in the surrender ratio (ratio between amounts paid for partial and/or total surrenders and the average total of technical provisions) from 9.17% in 2013 to 7.9% in the first nine months of 2014. As a result of these phenomena, Life technical provisions rose by €55.4bn in the last twelve months, reaching the new milestone of €502.4bn at the end of September 2014.
11

Pension funds
The Supervisory Commission for Pension Funds has published its figures for 2014. In terms of the number of subscribers, the total has risen by 6.1% compared to 2013. More precisely: subscribers to occupational pension funds fell by 0.3% to 1.9m; a 7.0% increase was seen in the number subscribing to open pension funds (over 1 million). The more consistent increase, however, is related to the “new” Personal Pension Funds, up +15.0% with a user base now close to 2.5 million individuals. The managed volumes of supplementary pensions totalled over €126bn at the end of 2014, up 8.5% on the previous year. The strongest increase was recorded by the new Personal Pension Funds (+21.2%, to a total value of €15.8bn). Open funds also recorded a positive result, with a 16.4% increase (around €14.0bn), and growth in occupational pension funds cannot be disregarded, with funds assigned to servicing these reaching €39.6bn (+14.9% compared to 2013).
At the end of 2014, the total supplementary pension assets represented around 8.0% of GDP and 3.0% of the financial assets of Italian households. At the end of 2006, prior to the reform, these values were 3.5% and 1.5% respectively. Despite still being limited compared to international levels, in national terms Italian pension funds are beginning to take on a fairly significant dimension. In 2014 average returns remained positive for all the main types of pension funds. Occupational and open pension funds yielded averages, respectively of 7.3% and 7.5%, whilst the new Class III Personal Pension Funds earned 7.3%. By comparison, note that in 2014 post-employment benefits saw a 1.5% revaluation. New aspects for the pension funds system were introduced by the 2015 Stability Act. In particular, Art. 1, paragraph 621 increased the substitute tax rate applied on operating results accrued by supplementary pension schemes to 20.0%. Then paragraph 622 contained measures concerning the calculation method for taxable income on the aforementioned operating result, which aim to ensure that income on Italian and White List countries’ debt securities - perceived by supplementary pension schemes - are subject to 12.5% tax.
Banking sector
Loans to non-financial companies reduced by 0.7% compared to the end of 2013 (which would be -2.9% if certain statistical discontinuities were taken into account), whilst loans to households recorded a decline of 0.9%. Stagnation on the lending side also had a downward effect on direct deposits, down 5.7%, whilst the most rapidly declining component was bonds (-18.1% yoy in December). Funding from overseas was also down by 3.9%. Likewise, the securities portfolio recorded a drop of over €92bn (-10.3% compared to December 2013). It is important to emphasise that, despite an overall downsizing of banks’ financial investments, the Italian government securities component has increased by 3.4% to exceed €400bn. In these numbers it is not difficult to capture the effects of a crippled economic system in which the recession tends to discourage demand for loans: business investments and household consumption, in fact, both saw changes for the worse. On the other hand, the trend for deterioration of credit quality (+17.8% in gross bad and doubtful loans, now standing almost at €184bn) could not fail to result in a highly cautious approach to lending on the supply side. The interaction between these two phenomena is indicated in the fall in volumes traded by the banking system.
The ECB cuts in the main refinancing rate in 2014, the last of which (in September) took the monetary policy rate to 0.05%, contributed to a widespread reduction in the interest rates on new loans both to households and companies. The cost of borrowing on new loan transactions of less than €1m to businesses dropped from 4.3% in December 2013 to 3.3% at the end of 2014. Also down are the rates on transactions of over €1m (from 2.8% to 2.2%). The interest rate applied on home purchase loans to households fell from 3.5% at the
12

end of 2013 to 2.9% twelve months later. The rates assigned to consumer credit recorded a more limited decrease: from 7.3% to 6.9%. Also in terms of direct deposits, further decreases in the remuneration on new transactions were recorded. On term deposits the rate dropped from 1.8% in December 2013 to 1.0% a year later; for repurchase transactions the decrease was by 62 basis points (from 1.4% to 0.8%).
At the end of October 2014 the ECB published its Comprehensive Assessment, i.e. the analysis performed to assess the soundness of the European credit segment, preliminary to the entry into force of the single supervisory system for banks. The assessment, which included both the Asset Quality Review and the Stress Test against future adverse economic scenarios, was positive overall. Only 15.0% of banks assessed showed a capital deficit. However, the fact that two major Italian banking groups failed to pass the assessment led to strong volatility on Italy’s equity market, possibly paving the way to a new consolidation phase in the sector.
In 2014 the spread in bank rates narrowed as a result of the lower mark-up, in turn caused by improved conditions in terms of the cost of funding. Nevertheless, the 2014 result was subject to the extent of provisions allocated against the loan portfolio. As you are aware, for many Italian banks the Asset Quality Review reported the need for new adjustments to loans. Therefore it can be assumed that, again in 2014, the Italian banking system will show an overall loss.
Real Estate market
According to Land Registry figures, in the third quarter of 2014 the number of real estate transactions recorded an increase compared to the same period of 2013: +3.4% the purchases and sales in the residential segment with related land; +4.9% for property units for business use. For the latter figure it is worth noting the distinction between the sales trend in property for production activities (+1.6%), commercial use (+9.0%) and services (-2.0%). Considering activities as a whole in the first nine months of the year, both segments (residential and non-residential) recorded an increase of 0.7% compared to the first three quarters of the previous year. This is the first positive result after four consecutive years of decline. Confirmation of the first signs that the real estate market is waking up comes from ISTAT data produced on the number of mortgage-backed loans disbursed. In the third quarter of 2014 the figure reached 66k, up almost 14.0% on the same quarter of 2013. In the second half of 2014, however, unit prices were still falling (by around 1.7% for homes, offices and trade outlets). Rents (again expressed in prices per square metre) also decreased for all three property types. The economic survey on the Italian housing market, conducted quarterly by the Bank of Italy on a sample of real estate agents regarding the status of the housing market, still indicates a negative price trend. 67.6% of those interviewed reported a drop in prices in the fourth quarter of 2014 (66.0% in the third quarter). This survey also shows that the sale of a residential property takes almost ten months on average. ________________________________________________________________________________________
The Consolidated financial statements of UnipolSai Assicurazioni SpA are subject to an audit by independent auditors PricewaterhouseCoopers SpA (PwC), the company tasked with performing the legally-required audit of the consolidated financial statements for the 2013/2021 period.
13
Principal new legislation
Regulations issued by IVASS
Measure no. 17 of 15 April 2014 The document contains amendments to various ISVAP Regulations and, more specifically, to ISVAP Regulation no. 20/2008 governing internal controls, risk management and outsourcing and ISVAP Regulation no. 36/2011 concerning investments and assets covering technical provisions. The document also contains a draft letter to the market on the application of EIOPA guidelines regarding governance systems, forward-looking risk assessment (based on ORSA principles), transmission of information to the national competent authorities and pre-application for internal models. The guidelines are directed at national authorities and, in essence, anticipate parts of the future prudential supervision system “Solvency II”. The aim of the guidelines is to ensure that the companies that will be subject to said system will be ready in time for its first-time application, set for 1 January 2016.
Measure no. 22 of 21 October 2014 The document contains updates to ISVAP Regulation no. 36/2011 concerning investments and assets covering technical provisions. Amongst other things, these changes expand insurance companies’ option for investments and for diversifying their investments by holding a wider range of risk-return combinations, also taking into account the additional or stronger internal audit controls to prepare for Solvency II.
Measure no. 29 of 27 January 2015 The document contains updates to ISVAP Regulation no. 7/2007, relating to the layout of the financial statements of insurance companies that must adopt IFRS, introduced to include new aspects entering into force with effect from 2014 financial statements. In general, the new aspects introduced refer mainly to quantitative disclosure pursuant to IFRS 12, in relation to which the Statement of Changes in Shareholders’ Equity has been amended to add a new column (Changes in investments), which illustrates the consequences of changes in investments in subsidiaries that do not involve loss of control (IFRS 12.18), and separate indication in the statement of Consolidation Scope of the registered office and the operating office. Furthermore, two new statements were introduced: one being the “Consolidation scope: interests in entities with material non-controlling interests”, including information on subsidiaries with significant non-controlling interests (IFRS 12.12), the other being “Interests in unconsolidated structured entities” to add information of this nature (IFRS 12.27-29).
The following main legislative changes were introduced to the tax domain:
Law no. 23 of 11 March 2014 - Delegation of powers to central government concerning provisions for atax system that is fairer, more transparent and growth-oriented (the “Tax Delegation”), as a result of whicha series of measures will be introduced on topics related to reform of the reference legislation. Theseinclude: the review of tax deductions and relief, anti-evasion and abuse of rights regulations, simplified taxobligations, tax disputes, the introduction to corporate systems of structured tax compliance,implementation of the group VAT regime and the reform of the land registry and tax litigation system. Todate, Legislative Decree 175/2014 on simplifications has been issued.
Decree Law no. 66 of 24 April 2014 (the “Renzi Decree”), converted with amendments to Law no. 89 of23 June 2014, which envisaged the following measures of interest to the sector: decrease in the nominalIRAP rate, which for insurance companies is 6.22% from 2014; increase in the substitute tax rate on therevaluation of Bank of Italy shares (new rate 26%) and mandatory payment in one lump sum by16 June 2014; increase from 11% to 11.5% for substitute tax on returns accrued by pension funds for2014 only; increase from 20% to 26%, with certain exceptions, in the tax rate on financial annuities with
14
effect from 1 July 2014; and exemption from withholding tax on income achieved by insurance companies on shares or quotas included among assets covered by Life business mathematical provisions deriving from investment in established Italian and Luxembourg-based UCIs and in foreign UCITS.
Decree Law no. 90 of 24 June 2014, converted with amendments to Law no. 114 of 11 August 2014,containing urgent measures for the simplification, administrative transparency and efficiency of courtoffices, important among which are the suppression of the AVCP (Public Works Contracting Authority) andthe transfer of functions to the National Antitrust Authority, incentives for electronic civil and administrativeproceedings, reduction in the cases for exclusion from public tenders with enhancement of the authorityfor fast-track processing (granting a settlement deadline for the payment of penalties).
Decree Law no. 91 of 24 June 2014 (“2014 Competition Decree), converted with amendments to Law no.116 of 11 August 2014, which introduces the option of transforming excess income subject to ACE relief(except for transfers in cases of consolidation or transparency), calculated on the basis of the currentIRES tax rate, into a tax credit for use against IRAP, divided into five equal amounts. The revaluation ofland and agricultural income is also remodelled.
Decree Law no. 133 of 12 September 2014 (“Sblocca Italia Decree”), converted with amendments to Lawno. 164 of 11 November 2014, containing Urgent measures for opening work sites, carrying out publicworks, country digitization, bureaucratic simplification, the emergence of hydrogeological instability andthe recovery of production. Various measures for relaunch of the economy are covered, including -mentioned due to their potential effect on Group companies - those relating to the real estate and hotelsectors.
Law no. 186 of 15 December 2014, containing provisions on the emergence and return of capital held inother countries and on strengthening the fight against tax evasion. The law introduces the offence of self-money laundering into Italian law. Consequently, Legislative Decree 231/2001 on corporate administrativeliability for crime was also integrated to include self-money laundering among the offences for whichcorporate liability could arise. This calls for updating of the Organisational and Management Model (on theprevention of crimes for the purpose of Legislative Decree 231/2001).
Law no. 190 of 23 December 2014, containing provisions on preparation of State annual and multi-annualfinancial statements - the “2015 Stability Act”, the most important to the Company being: the repeal from2014 of provisions that reduced IRAP rates for all production sectors, bringing the IRAP rate back to6.82% for insurance companies, 5.57% for banks and 3.90% for other companies; from 2015 thededuction for IRAP purposes of the difference between the total costs for short-term contract personneland the current analytical or one-off deductions relating to the cost of labour; freezing of the IMU and TASIincreases in 2015; increase to 20% of taxation on pension funds and changes to the taxation of incomefrom Life policies paid in the event of death of the policyholder, limiting the IRPEF exemption to only theportion of principal disbursed to cover demographic risk. Circulars providing interpretation of taxation onpension funds were issued by the Supervisory Commission for Pension Funds (Circulars of9 January 2015 and 6 March 2015) and by the Tax Authorities (Circular of 13 February 2015).
Solvency II: recent legislative changes
The difficulties in the process of defining and approving the legislative details of the Solvency II project have in the past led to the need to defer their entry into force, through the drafting of the Omnibus II Directive, which was approved in the plenary session of the European Parliament in March 2014. This document introduced significant amendments to Directive 2009/138/EC “Solvency II”, including a series of transitory measures for “soft launch” of the new legislative framework of EU supervision. As a result of the agreement reached on 13 November 2013 by the European Parliament, European Council and European Commission on the “Quick Fix 2” Directive, Directive 2013/58/EU was published in the Official Journal of the European Union on 18 December 2013, which established the entry into force of Solvency II on 1 January 2016, and its acknowledgement by EU Member States on 31 March 2015. On 10 February 2015 the Italian Council of
15

Ministers gave its preliminary approval of the outline of the legislative decree implementing the Solvency II Directive. The text was then submitted to the relevant Parliamentary Committees which are expected to issue their opinion by the end of March.
On 27 September 2013, EIOPA published the definitive guidelines for the preparatory phase for the entry into force of Solvency II, directed at the Supervisory Authorities of the individual Member States.
In January 2014, IVASS launched a public consultation on the provisions that said Authority intends to adopt in accordance with the new European supervisory regulations. Again in 2014, IVASS published its initial instructions for the preparatory phase of data transmission to the competent national Authorities as required under Solvency II. In particular, by the Letter to the Market dated 15 April 2014, the EIOPA guidelines were adopted with regard to the contents and timing for report generation and transmission pursuant to Pillar III of Solvency II. By Circular Letter to the Insurance Undertakings dated 4 December 2014, IVASS also adopted the requirement determining the transmission format for Pillar III reports as issued by the EIOPA (XBRL).
On 10 October 2014 the European Commission adopted the Acts of Delegation (ADs) relating to the Solvency II Directive. The European Parliament and Council had three months to present comments. At the end of this period, the ADs were published in the EU Official Journal and officially entered into force. The ADs contain a set of application rules that aim to define a series of more detailed requirements for insurance companies and groups, based on Solvency II provisions.
On 30 October 2014 the EIOPA submitted the 1st Set of Implementing Technical Standards (ITS) to the European Commission in connection with various aspects of Pillar I, such as: The Internal Model (IM), Own Funds, Solvency II Assessments at Group level, ORSA and Governance, Technical Provisions, the Supervisory Review Process and Equivalence between National Competent Authority (NCA) procedures and those of the different member states.
Lastly, on 2 December 2014 the EIOPA launched the public consultation on the 2nd set of Implementing Technical Standards (Pillar I quantitative basis, Pillar II qualitative requirements and Pillar III reporting and supervisory transparency) and on the 2nd set of guidelines (Guidelines relevant for Pillar II quantitative requirements and Pillar III enhanced reporting and disclosure). For the EIOPA, this publication marks the start of the final stage prior to the entry into force of Solvency II. The consultation closed on 2 March 2015. ________________________________________________________________________________________
16

Casa di Cura Villa Donatello
100%
Centro Oncologico Fiorentino Casa di Cura Villanova
100%
Florence Centro di Chirurgia Ambulatoriale - 100%
Donatello Day Surgery in liquidation - 100%
Città della salute 47.5%
(6)50%
REAL ESTATESECTOR
INSURANCESECTOR
Punta di Ferro100%
Midi100%
Athens RE Fund100%
Tikal RE Fund95.00%
SIM Etoile100%
Villa Ragionieri100%
UnipolSaiReal Estate
Marina di Loano
Meridiano Secondo
Progetto Bicocca La Piazza
S.E.I.S.
100%
100%
100%
74%
51.67%
Consorzio Castello - 99.57%
Nuove Iniziative Toscane
100%
Additional shares held by Group companies:
(1) indirect share of 94.69% through SAI Holding Italia(2) indirect share of 25.61% through SAI Holding Italia (3) indirect share of 100% through UnipolSai
Nederland, a wholly-owned subsidiary of UnipolSai(4) 1.59% share held by other subsidiaries (5) 34.5% share held by other subsidiaries(6) 2.5% share held by Florence Centro di Chirurgia
Ambulatoriale(7) 1.19% share held by Pronto Assistance(8) 100% share held by UnipolSai Finance(9) 100% share held by UnipolSai Finance(10) 36.15% share held by UnipolSai Finance
OTHER ACTIVITIESSECTOR
SAI MercatiMobiliari SIM
100%
UnipolSai InvestimentiSGR 100%
Tenute del Cerro 98.81%
SAI Holding Italia 100%
Sainternational
Finsai International
Sailux
100%
Srp Services - 100%
Gruppo Fondiaria-SAIServizi
98.37%(4)
Consolidation Scope chart at 31 December 2014
Systema100%
Dialogo Assicurazioni
99.85%
Liguria99.97%
Liguria Vita
100%
Pronto Assistance100%
Incontra Assicurazioni
51%
Europa Tutela Giudiziaria
100%
BIM Vita50%
SIAT(1)
The Lawrence LifeAssurance Company LTD
100%
Popolare Vita24.39%
(2)
Pronto Assistance Servizi65.40%
(5)Saint George
Capital Management
(7)
in liquidation
in liquidation
(direct holding out of total share capital)
Sogeint 100%
DDOR RE
99.998%
Unipol RE Limited
DDOR Novi Sad99.99%
(3)
0.002%
UnipolSaiFinance
100%
Service Gruppo Fondiaria-SAI
Service Gruppo Fondiaria-SAI
100%
UnipolSai Nederland B.V.
100%
Atahotels 100%
Italresidence - 100%
63.85%
UnipolSaiServizi Tecnologici
100%Auto Presto & Bene100%
APB Car Service - 70%
in liquidation
For more details see the relevant appendix to the Notes “Consolidation Scope”
(8)
(10)
(9)
in liquidation
17


Management Report


Preamble Recognition of the business combination and re-statement of the figures of the previous year
On 6 January 2014, the merger by incorporation of Unipol Assicurazioni, Milano Assicurazioni and Premafin into Fondiaria-SAI (the “Merger”) took effect, with accounting and tax effects backdated to 1 January 2014. The resulting company simultaneously took the name of UnipolSai Assicurazioni SpA (“UnipolSai” or the “Company”).
According to the IAS/IFRS international accounting standards, the Merger qualifies as a business combination between entities under common control since all companies participating in it were already previously controlled by Unipol Gruppo Finanziario (hereinafter also “Unipol” or “UGF”).
The business combination under common control is explicitly excluded from the scope of application of the IFRS 3 accounting standard, and is currently not specifically regulated by other international accounting standards or interpretations. As there are no specific IFRS standards to apply to the Merger, based on IAS 8.10 management must rely on its own judgement to develop and apply accounting that provides disclosure that is both significant and reliable at the same time. In forming its judgement, management must consider (i) the provisions and application guidelines in the IFRSs regulating similar and related cases, and (ii) the definitions, criteria and concepts in the framework.
In agreement with Unipol and bearing in mind what is set out above, UnipolSai decided that in order to adequately represent the objectives of the business combination the accounting has to be based on the following key assumptions: the Unipol Group, considered a unitary economic entity, changed due to the purchase of the Premafin
Group in July 2012; in the programmes of the Unipol Group, the subsequent reorganisation has no other aims than that of
rationalising its structure by replicating its image conveyed to the market as far as possible, also on the corporate level.
The Unipol Group therefore decided to confirm, also with reference to the former Premafin Group, its choice of a unitary and total management that is adequately expressed in the valuations, estimates and accounting policies adopted for the purpose of drawing up the financial reports.
It is therefore considered that the above-mentioned unitary and total management can be adequately represented in the UnipolSai Consolidated Financial Statements only by recognising the figures of the assets and liabilities acquired on the basis of the figures shown in the Consolidated Financial Statements of the common Group.
The Consolidated Financial Statements at 31 December 2014 were therefore drawn up following the principle of value continuity with the UGF Consolidated Financial Statements and confirming the effects of the accounting allocation process already carried out at the time UGF acquired control of the Premafin Group (hereinafter “Purchase Price Allocation” or “PPA”). These effects, as IFRS 3 allows, were measured at the end of the measurement period, i.e. one year from the date of acquisition, and were reported in the UGF condensed Consolidated Financial Statements at 30 June 2013. This led to discontinuity of values compared to the UnipolSai Consolidated Financial Statements at 31 December 2013, approved by the Board of Directors on 20 March 2014 and referring to the pre-Merger
21
Group perimeter. The 2013 figures, shown as comparative data of the previous financial year, were consequently restated in consistency with the accounting criteria adopted for the business combination.
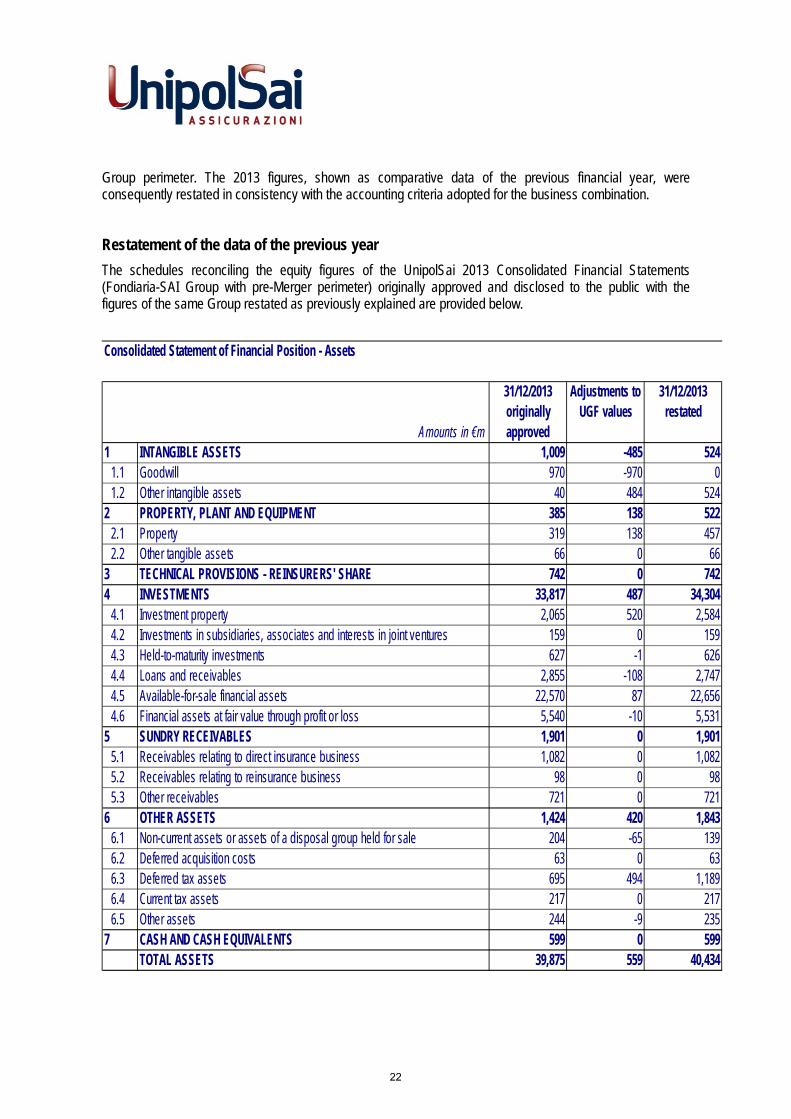
Restatement of the data of the previous year
The schedules reconciling the equity figures of the UnipolSai 2013 Consolidated Financial Statements (Fondiaria-SAI Group with pre-Merger perimeter) originally approved and disclosed to the public with the figures of the same Group restated as previously explained are provided below.
Consolidated Statement of Financial Position - Assets
31/12/2013 originally approved
Adjustments to UGF values
31/12/2013 restated
1 INTANGIBLE ASSETS 1,009 -485 5241.1 Goodwill 970 -970 01.2 Other intangible assets 40 484 524
2 PROPERTY, PLANT AND EQUIPMENT 385 138 5222.1 Property 319 138 4572.2 Other tangible assets 66 0 66
3 TECHNICAL PROVISIONS - REINSURERS' SHARE 742 0 7424 INVESTMENTS 33,817 487 34,304
4.1 Investment property 2,065 520 2,5844.2 Investments in subsidiaries, associates and interests in joint ventures 159 0 1594.3 Held-to-maturity investments 627 -1 6264.4 Loans and receivables 2,855 -108 2,7474.5 Available-for-sale financial assets 22,570 87 22,6564.6 Financial assets at fair value through profit or loss 5,540 -10 5,531
5 SUNDRY RECEIVABLES 1,901 0 1,9015.1 Receivables relating to direct insurance business 1,082 0 1,0825.2 Receivables relating to reinsurance business 98 0 985.3 Other receivables 721 0 721
6 OTHER ASSETS 1,424 420 1,8436.1 Non-current assets or assets of a disposal group held for sale 204 -65 1396.2 Deferred acquisition costs 63 0 636.3 Deferred tax assets 695 494 1,1896.4 Current tax assets 217 0 2176.5 Other assets 244 -9 235
7 CASH AND CASH EQUIVALENTS 599 0 599TOTAL ASSETS 39,875 559 40,434
Amounts in €m
22

Consolidated Statement of Financial Position - Shareholders' Equity and Liabilities(€K)
31/12/2013 originally approved
Adjustments to UGF values
31/12/2013 restated
1 SHAREHOLDERS' EQUITY 3,226 -160 3,0661.1 attributable to the owners of the Parent 2,510 -185 2,3251.1.1 Share capital 1,195 0 1,1951.1.2 Other equity instruments 0 0 01.1.3 Capital reserves 199 0 1991.1.4 Income-related and other equity reserves 613 -498 1161.1.5 (Treasury shares) -68 68 01.1.6 Reserve for foreign currency translation differences -69 73 51.1.7 Gains or losses on available-for-sale financial assets 285 212 4971.1.8 Other gains or losses recognised directly in equity 26 1 261.1.9 Profit (loss) for the year attributable to the owners of the Parent 330 -41 2881.2 attributable to non-controlling interests 716 25 7411.2.1 Share capital and reserves attributable to non-controlling interests 574 -54 5211.2.2 Gains or losses recognised directly in equity 55 68 1231.2.3 Profit (loss) for the year attributable to non-controlling interests 87 10 97
2 PROVISIONS 317 3 3203 TECHNICAL PROVISIONS 32,783 18 32,8004 FINANCIAL LIABILITIES 2,248 -22 2,226
4.1 Financial liabilities at fair value through profit or loss 554 0 5544.2 Other financial liabilities 1,694 -22 1,672
5 PAYABLES 655 0 6555.1 Payables arising from direct insurance business 95 0 955.2 Payables arising from reinsurance business 73 0 735.3 Other payables 487 0 487
6 OTHER LIABILITIES 646 720 1,3666.1 Liabilities associated with disposal groups 53 22 746.2 Deferred tax liabilities 133 694 8276.3 Current tax liabilities 68 -1 676.4 Other liabilities 393 5 398
TOTAL SHAREHOLDERS’ EQUITY AND LIABILITIES 39,875 559 40,434
Amounts in €m
23

INCOME STATEMENT
31/12/2013 originally approved
Adjustments to UGF values
31/12/2013 restated
1.1 Net premiums 9,650 0 9,6501.1.1 Gross premiums earned 9,979 0 9,9791.1.2 Earned premiums ceded to reinsurers -328 0 -3281.2 Commission income 8 0 81.3 Gains and losses on financial instruments at fair value through profit or loss 143 17 160
1.4Gains on investments in subsidiaries, associates and interests in joint ventures
8 0 8
1.5 Gains on other financial instruments and investment property 1,451 38 1,4891.5.1 Interest income 898 75 9731.5.2 Other income 109 0 1091.5.3 Realised gains 432 -25 4061.5.4 Unrealised gains 12 -12 11.6 Other revenue 463 2 466
1 TOTAL REVENUE AND INCOME 11,723 58 11,7802.1 Net charges relating to claims -8,379 47 -8,3322.1.2 Amounts paid and changes in technical provisions -8,556 47 -8,5092.1.3 Reinsurers' share 177 0 1772.2 Commission expense -6 0 -6
2.3Losses on investments in subsidiaries, associates and interests in joint ventures
-2 0 -2
2.4 Losses on other financial instruments and investment property -348 49 -2992.4.1 Interest expense -49 -16 -642.4.2 Other charges -67 -1 -682.4.3 Realised losses -62 23 -402.4.4 Unrealised losses -169 43 -1272.5 Operating expenses -1,609 0 -1,6092.5.1 Commissions and other acquisition costs -1,174 0 -1,1742.5.2 Investment management expenses -24 0 -242.5.3 Other administrative expenses -412 0 -4122.6 Other costs -726 -140 -866
2 TOTAL COSTS AND EXPENSES -11,071 -44 -11,115PRE-TAX PROFIT (LOSS) FOR THE YEAR 652 13 665
3 Income tax -234 -44 -278PROFIT (LOSS) FOR THE YEAR AFTER TAXES 418 -31 387
4 PROFIT (LOSS) FROM DISCONTINUED OPERATIONS -1 0 -1CONSOLIDATED PROFIT (LOSS) 417 -31 386of which attributable to the owners of the Parent 330 -41 288of which attributable to non-controlling interests 87 10 97
Amounts in €m
24
The main effects on the Statement of Financial Position at 31 December 2013 are summarised hereunder: - elimination of goodwill regarding the Fondiaria-SAI Consolidated Financial Statements (€970m) since UGF
recalculated the goodwill on the basis of the PPA after UGF’s acquisition; - measurement of the fair value of the other intangible assets tied to the Life and Non-life businesses (“VIF”
and “VOBA”) net of the intangible assets already included in the Fondiaria-SAI Consolidated Financial Statements before the acquisition and net of the amortisation recorded up to the reporting date (total effect amounting to €484m);
- adjustment of the tangible assets regarding properties for own use and investment property to fair value at the date of acquisition (totalling €658m) determined based on the appraisals of the independent experts appointed, net of changes that took place (including depreciation) up to the date of reference;
- adjustment of a portion of the financial assets to fair value and reclassification, with resulting decrease in loans and receivables (for €108m), increase in available-for-sale financial assets (for €87m) and decrease in financial assets at fair value through profit and loss (for €10m). This reclassification was made in order to bring the classification criteria adopted by the Unipol Group into line;
- decrease in non-current assets or assets of a disposal group (for €65m) consequent to the different composition and different value of intangible assets attributable to the company complex transferred to Allianz;
- increase in risk provisions to recognise potential liabilities relating to events that occurred before the date of acquisition by UGF (€3m);
- redetermination of the technical provisions to adjust the effects of the shadow accounting as a consequence of the different value given to the financial assets (for a total effect of €18m);
- adjustment of subordinated financial loans to fair value (€22m) included amongst the other financial liabilities and recognised at amortised costs;
- increase (€22m) in non-current liabilities or liabilities of a disposal group mainly as a consequence of the deferred taxes regarding the intangible assets attributable to the company complex transferred to Allianz;
- recognition of the tax effects connected with the previous adjustments.
The main effects on the Income Statement at 31 December 2013 are summarised hereunder: - the impact on the gains and losses on financial instruments at fair value through profit or loss (+€17m) is
due to gains arising from the closure of cash flow hedge operations; - the increase of interest income (€75m) relates to the redetermination of the amortised cost of available-for-
sale financial assets, loans and receivables and held-to-maturity investments on the basis of the fair value calculated in the PPA phase;
- the decrease of realised gains (€25m) relates to the redetermination of the gains on the basis of the fair value of the financial assets (totalling -€13m) and of the investment property (-€12m) calculated in the PPA phase;
- the reduction of unrealised gains (€12m) relates to the redetermination of the result arising from the measurement at fair value in the PPA phase of the financial assets (-€9m) and of the investment property (-€3m);
- the increase of other revenue (€2m) mainly relates to lower expense for potential liabilities included in the PPA phase (€5m) and to the elimination of capital gains on investments already recognised in Shareholders’ equity in the PPA phase (equal to -€3m);
- the decrease in the amounts paid and changes in technical provisions item (€47m) is mainly due to adjustment of the shadow accounting relating to recalculation of the effects on the fair value of the financial assets;
- the increase in interest expense (€16m) is due to the redetermination of the amortised cost of the subordinated financial liabilities of Fondiaria-SAI and Milano Assicurazioni on the basis of the fair value calculated in the PPA phase;
25
- the reduction of realised losses (€23m) relates to the redetermination of the realised losses in the period on the basis of the fair value of the available-for-sale financial assets and of the loans and receivables calculated in the PPA phase;
- the reduction of unrealised losses (€43m) relates to the lower amortisation/depreciation of the period on investment property due to the redetermination of the fair value in the PPA phase and to the standardisation of the accounting standards (totalling €24m) and to the elimination of the unrealised losses on available-for-sale financial assets and investment property (€19m);
- the increase in other costs (€140m) is mainly due to allocating portions of intangible assets, i.e. VIF and VOBA, measured in the PPA phase (€158m), reversing the portions of amortisation of intangible assets recorded by the subsidiaries Liguria Assicurazioni and DDOR (€4m), eliminating provisions already included in the PPA phase (€20m) and to greater amortisation/depreciation and write-downs of property for own use after recalculation of its fair value in the PPA phase (€7m);
- recognition of the tax effects connected with the previous adjustments (€44m).
________________________________________________________________________________________
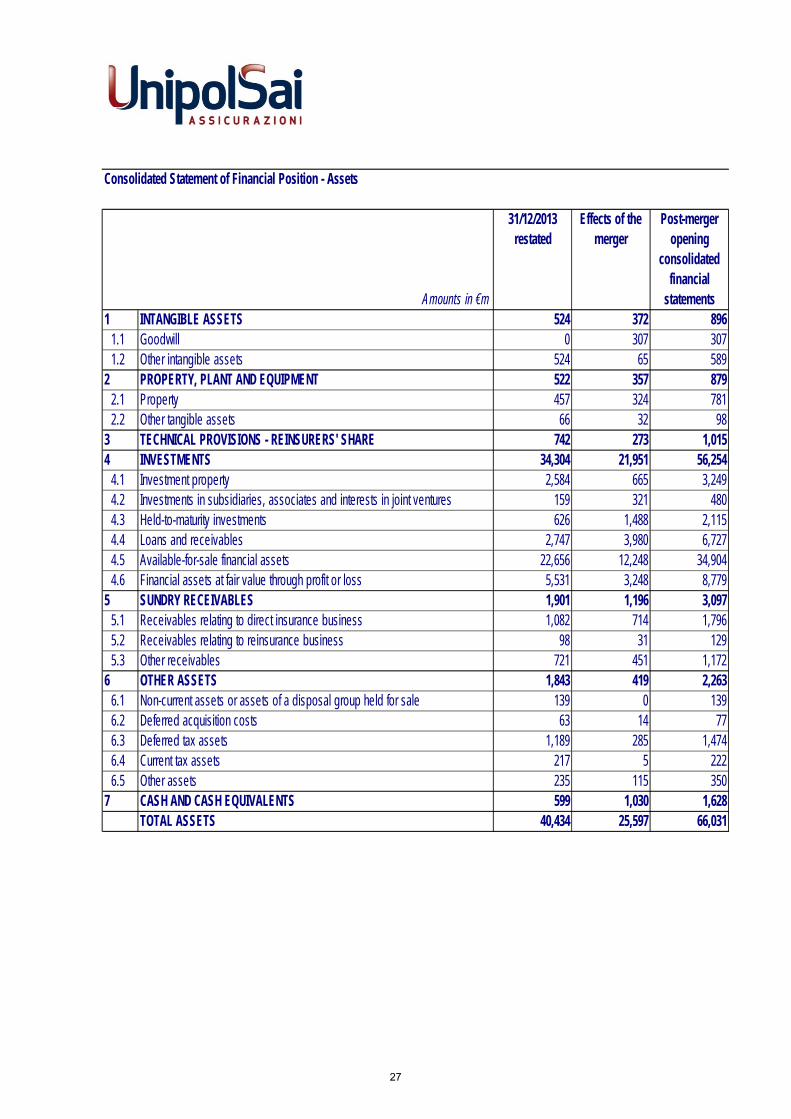
Recognition of the business combination: quantitative information
Owing to the Merger, UnipolSai incorporated the assets and liabilities of the former Premafin Group other than those of the former Fondiaria-SAI Group, and the assets and liabilities of the former Unipol Assicurazioni and its subsidiaries.
As already explained above, the assets and liabilities acquired by incorporation were recognised at the same values assigned to them in the Consolidated Financial Statements at 31 December 2013 of the common holding company UGF, with accounting effect starting on 1 January 2014.
The effects of the merger in connection with the opening balances of the UnipolSai Consolidated Financial Statements at 1 January 2014 are shown in the following tables.
26
Consolidated Statement of Financial Position - Assets
31/12/2013 restated
Effects of the merger
Post-merger opening
consolidated financial
statements1 INTANGIBLE ASSETS 524 372 896
1.1 Goodwill 0 307 3071.2 Other intangible assets 524 65 589
2 PROPERTY, PLANT AND EQUIPMENT 522 357 8792.1 Property 457 324 7812.2 Other tangible assets 66 32 98
3 TECHNICAL PROVISIONS - REINSURERS' SHARE 742 273 1,0154 INVESTMENTS 34,304 21,951 56,254
4.1 Investment property 2,584 665 3,2494.2 Investments in subsidiaries, associates and interests in joint ventures 159 321 4804.3 Held-to-maturity investments 626 1,488 2,1154.4 Loans and receivables 2,747 3,980 6,7274.5 Available-for-sale financial assets 22,656 12,248 34,9044.6 Financial assets at fair value through profit or loss 5,531 3,248 8,779
5 SUNDRY RECEIVABLES 1,901 1,196 3,0975.1 Receivables relating to direct insurance business 1,082 714 1,7965.2 Receivables relating to reinsurance business 98 31 1295.3 Other receivables 721 451 1,172
6 OTHER ASSETS 1,843 419 2,2636.1 Non-current assets or assets of a disposal group held for sale 139 0 1396.2 Deferred acquisition costs 63 14 776.3 Deferred tax assets 1,189 285 1,4746.4 Current tax assets 217 5 2226.5 Other assets 235 115 350
7 CASH AND CASH EQUIVALENTS 599 1,030 1,628TOTAL ASSETS 40,434 25,597 66,031
Amounts in €m
27

Consolidated Statement of Financial Position - Shareholders' Equity and Liabilities(€K)
31/12/2013 restated
Effects of the merger
Post-merger opening
consolidated financial
statements1 SHAREHOLDERS' EQUITY 3,066 2,502 5,569
1.1 attributable to the owners of the Parent 2,325 2,885 5,2101.2 attributable to non-controlling interests 741 -382 359
2 PROVISIONS 320 196 5163 TECHNICAL PROVISIONS 32,800 19,894 52,6944 FINANCIAL LIABILITIES 2,226 2,214 4,440
4.1 Financial liabilities at fair value through profit or loss 554 609 1,1634.2 Other financial liabilities 1,672 1,605 3,277
5 PAYABLES 655 377 1,0335.1 Payables arising from direct insurance business 95 57 1515.2 Payables arising from reinsurance business 73 10 835.3 Other payables 487 311 798
6 OTHER LIABILITIES 1,366 414 1,7806.1 Liabilities associated with disposal groups 74 0 746.2 Deferred tax liabilities 827 86 9136.3 Current tax liabilities 67 46 1136.4 Other liabilities 398 282 680
TOTAL SHAREHOLDERS’ EQUITY AND LIABILITIES 40,434 25,597 66,031
Amounts in €m
Statement of changes The equity figures at 31 December 2013 on a like-for-like basis refer to the figures of the Post-merger
opening consolidated financial statements (adjusted following recognition of the business combination). The changes in percentage on a like-for-like basis are therefore calculated according to the afore-mentioned data;
The economic figures at 31 December 2013 on a like-for-like basis refer to aggregated data relating to the post-merger UnipolSai Group perimeter. The changes in percentage on a like-for-like basis are therefore calculated based on the afore-mentioned data.
28

Amounts in €m
Amounts in €m 31/12/2014 31/12/2013 31/12/2013
restated on a like-for-
like basis
Non-Life direct insurance premiums 8,424 5,789 9,257% variation 45.5
% variation on a like-for-like basis -9.0
Life direct insurance premiums 7,584 3,958 6,137% variation 91.6
% variation on a like-for-like basis 23.6
of which Life investment products 50 44 61
% variation 12.7
% variation on a like-for-like basis -18.4
Direct insurance premiums 16,008 9,747 15,394% variation 64.2
% variation on a like-for-like basis 4.0
Annual Premium Equivalent (APE) Life business - Group share 643 286 554% variation 124.9
% variation on a like-for-like basis 16.1
Non-Life loss ratio - direct business 68.1% 71.9% 68.2%Non-Life expense ratio - direct business 27.3% 24.2% 25.2%Non-Life combined ratio - direct business 95.3% 96.1% 93.3%
Net gains on financial instruments (excl. assets/liabilities at fair value) 1,784 1,159 1,979% variation 54.0
% variation on a like-for-like basis -9.9
Consolidated profit (loss) 783 386 694% variation 103.2% variation on a like-for-like basis 12.9
Balance on the statement of comprehensive income 1,487 321 883% variation n.s.% variation on a like-for-like basis n.s.
Investments and cash and cash equivalents 62,878 35,359 58,664% variation 77.8
% variation on a like-for-like basis 7.2
Technical provisions 56,228 32,800 52,694% variation 71.4
% variation on a like-for-like basis 6.7
Financial liabilities 3,813 2,226 4,440% variation 71.3
% variation on a like-for-like basis -14.1
Shareholders' Equity attributable to the owners of the Parent 6,295 2,325 5,210% variation 170.7% variation on a like-for-like basis 20.8
No. staff 10,271 7,461 11,163
GROUP HIGHLIGHTS
29

Alternative performance indicators Alternative performance indicators business 31/12/2014 31/12/2013
31/12/2013 on a like-for-like basis
Loss ratio - direct business (including OTI ratio) non-life 68.1% 71.9% 68.2%
Expense ratio - direct business non-life 27.3% 24.2% 25.2%
Combined ratio - direct business (including OTI ratio) non-life 95.3% 96.1% 93.3%
Loss ratio - net of reinsurance non-life 68.6% 72.8% 69.3%
Expense ratio (calculated on premiums earned) - net of reins. non-life 26.0% 23.1% 24.3%
Combined ratio (with expense ratio calculated on premiums earned) - net of reins. non-life 94.6% 95.9% 93.6%
Premium retention ratio non-life 95.0% 94.5% 95.6%
Premium retention ratio life 99.8% 99.8% 99.8%
Premium retention ratio total 97.3% 96.6% 97.2%
Group pro-rata APE (amounts in €m) life 643 286 554
Expense ratio - direct business life 4.2% 4.9% 4.4%
Expense ratio - net of reinsurance life 4.2% 4.8% 4.3% These indicators are not defined by accounting rules; rather, they are calculated based on economic-financial procedures used in the sector. Loss ratio: primary indicator of the cost-effectiveness of operations of an insurance company in the Non-Life sector. This is the ratio of the cost of claims for the period to premiums for the period.
OTI (Other Technical Items) ratio: ratio of the sum of the balance of other technical charges/income and the change in other technical provisions to net premiums for the period. From 2013, the OTI ratio (the ratios of the previous periods were adjusted accordingly) was also included in the Loss ratio.
Expense ratio: percentage indicator of the ratio of total operating expenses to premiums written as far as direct business is concerned, and the premiums as far as retained business, net of reassurance, is concerned.
Combined ratio: indicator that measures the balance of Non-Life technical management, represented by the sum of the loss ratio and the expense ratio.
APE – Annual Premium Equivalent: the new Life business expressed in APE is a measurement of the volume of business relating to new policies and corresponds to the sum of periodic premiums of new products and one tenth of single premiums. This indicator is used to assess the business along with the in force value and the Life new business value of the Group.
The premium retention ratio is the ratio of premiums retained (total direct and indirect premiums net of premiums ceded) to total direct and indirect premiums. Investment products are not included in calculating this ratio.
30

Management report
Creation of UnipolSai Assicurazioni
On 31 December 2013, the merger by incorporation of Unipol Assicurazioni, Milano Assicurazioni and Premafin (jointly, the “Merged Companies”) into Fondiaria-SAI (the “Merging Company”) was stipulated, which as a result of the merger assumed the company name UnipolSai Assicurazioni SpA or UnipolSai SpA.
The merger took effect on 6 January 2014 (“Effective Date”), following the registration of the associated deed with the competent offices of the Register of Companies, which took place on 2 January 2014. The tax and accounting effects of the Merger were instead from 1 January 2014. The merger between the long-established companies, among the most important in the domestic insurance field in terms of brands, tradition, expertise and experience, was the final and essential act in the Unipol Group and Premafin/Fondiaria-SAI Group integration plan launched at the beginning of 2012, details of which were provided in previous years’ financial statements.
At the Effective Date, all shares of the merged companies were cancelled and exchanged for shares of the Merging Company, which arranged:
the assignment of all shares of the Merging Company owned by the Merged Companies through their redistribution via the share swaps, without ever being acquired as treasury shares of the Merging Company, and
as regards the excess portion, increased its share capital for a total of €782,960,791.85, through the issuing of 1,330,340,830 new ordinary shares and 55,430,483 new class B savings shares, all with no nominal value and with regular dividend entitlement, to be allocated to the shareholders of Unipol Assicurazioni, Milano Assicurazioni and Premafin, based on the following share exchange ratio: 0.050 ordinary shares of the Merging Company for every Premafin ordinary share; 1.497 ordinary shares of the Merging Company for every Unipol Assicurazioni ordinary share; 0.339 ordinary shares of the Merging Company for every Milano Assicurazioni ordinary share; 0.549 Class B savings shares of the Merging Company for every Milano Assicurazioni savings share.
The statutory amendments associated with the Merger entered into force from the Effective Date, and the share capital of UnipolSai amounted to €1,977,533,765.65 (entirely subscribed and paid-in), comprising 2,250,906,752 ordinary shares, 1,276,836 Class A savings shares and 377,193,155 Class B savings shares, all without nominal value. The shares already issued by Milano Assicurazioni and Premafin were delisted on 6 January 2014.
The new issues of ordinary shares and Class B savings shares were listed on the MTA market organised and managed by Borsa Italiana S.p.A. with effect from 6 January 2014, at par with the ordinary shares and Class B savings shares of the Merging Company outstanding at the time of issue.
No holder of Milano Assicurazioni savings shares exercised the right of withdrawal pursuant to Art. 2437, paragraph 1, letter g) of the Civil Code.
By contrast, the right of withdrawal was legitimately exercised by Premafin ordinary shareholders, in relation to a total of 13,975,294 ordinary Premafin shares, corresponding to 0.6495% of Premafin’s share capital, for a total settlement amount of €2,441,483.86.
31

On 14 January 2014 the rights issue and right of pre-emption (the “Rights Issue”) for Premafin shareholders other than withdrawing holders of 13,975,294 ordinary Premafin shares in relation to which the right of withdrawal through the Merger was legitimately exercised and which, in application of the swap ratio, became 698,764 ordinary UnipolSai shares (the latter hereinafter the “Shares Subject to Withdrawal”). On conclusion of the Rights Issue a total of 5,144 Shares Subject to Withdrawal were purchased pursuant to Art. 2437-quater, paragraph 3 of the Civil Code, for €3.494 per Share Subject to Withdrawal, and therefore for a total of €17,973.13. For the remaining 693,620 Shares Subject to Withdrawal not purchased as part of the Rights Issue (the “Unsold Shares”), their offer on the MTA market, organised and managed by Borsa Italiana SpA (the “MTA market”) was arranged in accordance with Art. 2437-quater, paragraph 4 of the Civil Code. The stock exchange offering period concluded on 31 January 2014, following which all 693,620 ordinary UnipolSai shares involved remained unsold. On 26 February 2014, pursuant to Art. 2437-quater, paragraph 5 of the Civil Code, the Unsold Shares were refunded by UnipolSai via the purchase of treasury shares using the available reserves for €3.494 for each share subject to withdrawal, therefore for a total of €2,423,508.28.
Issue of a Convertible Loan by UnipolSai
On 15 January 2014, the Board of Directors of UnipolSai, resolved, inter alia, to exercise the power conferred to it by the shareholders’ meeting on 25 October 2013, pursuant to Articles 2420-ter and 2443 of the Civil Code, for the issuing of a €201.8m loan convertible into ordinary UnipolSai shares, with the subsequent increase in share capital in service of the conversion for a total maximum value of €201.8m, including share premium, to be carried out through the issuing of ordinary company shares of UnipolSai with no nominal value, with regular dividend rights, with the same characteristics as those outstanding at the issue date (the “Convertible Loan”). The issue of the Convertible Loan was planned from the outset as part of the Merger plan and included in the Premafin debt restructuring agreement entered into with the lending banks, subject to the effectiveness of the Merger.
The Board of Directors resolved to: approve the regulation relating to the Convertible Loan, granting mandate to the Chief Executive Officer to
define the final text of the Regulation by inserting the elements missing at 15 January 2014; approve the increase in share capital, against payment and in indivisible form, in one or more tranches
and by the final deadline of 31 December 2015 - in service of the Convertible Loan, with the exclusion of the option right pursuant to Art. 2441, paragraph 5 of the Civil Code, for a maximum of €201.8m, including share premium, to be carried out through the issuing of ordinary UnipolSai shares, with no nominal value, with regular dividend entitlement, with the same characteristics as those outstanding at the issue date, reserved irrevocably and unconditionally for the conversion of the bonds, with the exclusion of the option right;
consequently amend Art. 6 of the By-Laws to reflect the exercise of the aforementioned powers.
On 24 April 2014 UnipolSai issued the Convertible Loan, represented by 2,018 bonds with a unit nominal value of €100k, for a total of €201.8m. The bond loan was subscribed as follows: (i) €134.3m by the lending banks that had approved the debt restructuring agreement of the former Premafin,
excluding GE Capital Interbanca SpA, which - due to the Merger - became lenders of UnipolSai, and (ii) €67.5m by the Parent Unipol Gruppo Finanziario.
32

The bonds issued are bearer bonds, which cannot be split up, and are freely transferable as well as included in the Monte Titoli SpA centralised management system for dematerialised securities. They constitute direct - not guaranteed or subordinated - obligations, accrue gross annual interest (which cannot be capitalised) of 6.971%, calculated on the unit nominal value, with deferred payment every six months, with the first coupon scheduled for 31 May 2014. The conversion ratio, equal to 36,630.037 newly issued ordinary UnipolSai shares for each bond held, is calculated as the ratio of (a) the unit nominal value of the bonds to (b) the initial conversion price (€2.730 per share). Therefore, a maximum number of 73,919,414 shares will be issued to serve the Convertible Loan.
Bondholders have the option to convert the bonds at any time during the period from 24 April 2014 to 22 December 2015 and, in any event, shall be automatically converted into shares on 31 December 2015 (expiry date of the Convertible Loan).
On 5 May 2014 Unipol requested the conversion of all 675 bonds subscribed on issue of the Loan. Following the conversion, according to the terms and conditions of the Regulation of the Loan, Unipol took ownership of 24,725,274 newly issued ordinary UnipolSai shares. As a result, Unipol’s interest in the ordinary capital of UnipolSai at the date of conversion increased from 63.00% to 63.41%, i.e. 54.38% of the total capital.
Issue of subordinated bond securities with an indefinite maturity by UnipolSai
On 11 June 2014, UnipolSai successfully placed subordinated bond securities with an indefinite maturity for a total nominal amount of €750m, targeted exclusively at institutional investors. The transaction registered demand 3 times the amount offered, with offers exceeding €2.2bn, proof of the recognised strength and reliability of the Company. Foreign investors accounted for around 70% of the total order portfolio.
These securities meet the requirements for being included in the elements of the available Solvency margin of the company up to a maximum limit of 50%, given UnipolSai has obtained the necessary regulatory authorisations in this regard.
The securities pay a fixed coupon of 5.75% until the first early repayment date, set for 18 June 2024. After that date, the coupon will be variable and based on the 3-month Euribor plus a spread of 518 basis points. The issue price is 100% of nominal value. The securities were regulated on 18 June 2014.
The newly issued securities, as per the prevailing market practice, were listed on the Luxembourg Stock Exchange. The issue was placed by J.P. Morgan Securities plc, Mediobanca SpA and UniCredit Bank AG.
Revenue from the issue was used for the early repayment of subordinated loans with an indefinite maturity disbursed in the past from Mediobanca SpA to Fondiaria-SAI SpA (now UnipolSai) and to merged entities Milano Assicurazioni SpA and Unipol Assicurazioni SpA for a total amount of €750m, all falling within the available Solvency margin of the financed companies to the limit of 50%.
The issues and the subsequent repayment, already authorised by IVASS, not only diversify the sources of financing and lengthen the average duration of UnipolSai’s subordinated debt, they make it possible to comply with the relevant measures prescribed by the Antitrust Authority at the time of authorisation of the transaction involving the acquisition of control of the former Premafin/Fondiaria-SAI Group, which made provision for the reduction of existing debt with Mediobanca for a total amount of €350m by 2015.
Following the transaction, the incidence of subordinated loans granted by Mediobanca SpA on total subordinated debt fell from 72% to 35%.
33

Disposals planned in compliance with Measure dated 19 June 2012 of the Antitrust Authority
It should be remembered that, by measure dated 19 June 2012 (the “Measure”) which authorised the Unipol Group’s acquisition of control of the Premafin/Fondiaria-SAI Group, the Antitrust Authority prescribed certain measures and disposals, in part already carried out in previous years. For further details of the contents of the Measure and action taken in compliance with the Measure in previous years, reference should be made to the financial statements of the Company and the consolidated financial statements of the Unipol Group for 2012 and 2013. Information on the measures implemented during the year are provided below, including the disposal of an insurance business unit of the former Milano Assicurazioni.
Transfer of a former Milano Assicurazioni insurance business unit to Allianz
On 15 March 2014, UnipolSai and Allianz signed an agreement for the transfer of a business unit including a Non-Life insurance portfolio for a value of €1.1bn (2013 figures), 729 insurance agencies and 500 employees dedicated to managing these activities. The transfer of the assets forming part of former Milano Assicurazioni (now UnipolSai) made provision for a maximum consideration of €440m. On 30 June 2014, UnipolSai and Allianz signed the contract for transfer of the insurance business unit, effective from 1 July 2014. As part of said contract, the transfer of the insurance product sales activities took effect immediately, carried out, inter alia, by a network of 725 agencies and 470 employees dedicated to managing these activities, against the payment by Allianz of a consideration of €200m. The business unit transferred also included the Non-Life insurance portfolio managed by the agencies transferred. The transfer was finalised in December 2014 after obtaining IVASS authorisation. On 19 December 2014, in fact, having ascertained that the conditions precedent of the transfer agreement signed on 30 June 2014 were met, UnipolSai completed the business unit transfer to Allianz and - with effect from 31 December 2014 - the Non-Life insurance portfolio managed by the agencies transferred, against payment from Allianz on 20 February 2015 of a price integration, calculated on the total portfolio transferred or renewed during the second half of 2014, of €179m (and therefore a total business unit price of €379m). The total capital gain realised in Unipol’s consolidated financial statements was €325m, net of the deducted value of the portfolio already recognised in previous years among intangible assets, for its own attributable share of the business unit transferred. In relation to the business unit transfer, accessory charges of €34m were also incurred.
Non-compliance proceedings launched by the Antitrust Authority and the Unipol application for review of the Measure of 19 June 2012
On 19 February 2014, the Antitrust Authority notified Unipol of provision protocol no. 0016093 with which it started non-compliance proceedings, notifying Unipol and UnipolSai of the breach of Art. 19, paragraph 1, of Law 287/1990, for not having observed the obligation of selling the assets indicated in the Measure by the pre-established deadlines set by said Measure. Unipol and UnipolSai, deeming their actions to be proper on the basis of valid arguments in fact and in law, took the necessary defensive actions and submitted a request aimed at obtaining a revision of some of the measures set forth by the Measure.
As a result of said request, on 30 May 2014, the Antitrust Authority resolved (i) to extend the term for closing the non-compliance proceedings to 30 October 2014 and (ii) the start of proceedings, to be concluded by 30 October 2014, for evaluating the aforementioned review application. With reference to the latter proceedings, it should be noted that, by means of a notice dated 25 July 2014, the Antitrust Authority communicated the results of a preliminary investigation performed by the competent offices of said Authority (Direzione Settoriale Credito - Credit Division - of the General Competition Department) to Unipol and
34

UnipolSai, by means of which the aforesaid offices held the review application formulated by Unipol and UnipolSai to be acceptable. The Antitrust Authority sent the following to the companies Unipol and UnipolSai on 4 November 2014: a) the measure relating to the conclusion of proceedings concerning assessment of the review application, by
which the Authority decided to replace the provisions of points f) and g) of the Measure of 19 June 2012 as follows:
- (i) merger of Liguria Assicurazioni SpA and Liguria Vita SpA into UnipolSai; - (ii) non-use of the Milano Assicurazioni and Sasa brands; - (iii) release of the customer portfolio managed by each agency, for an amount equal to the excess
of existing premiums, in the provinces of Barletta-Andria-Trani, Cosenza, Enna, Catania, Ragusa and Cagliari only;
b) the measure relating to the conclusion of non-compliance proceedings, by which the Authority considered there were no grounds for inflicting the penalty pursuant to Art. 19, paragraph I of Law 287/1990.
With reference to the replacement measures indicated under point a), prescribed by the Antitrust Authority, note that: a) as already notified to the Antitrust Authority, completion of the merger of Liguria Assicurazioni SpA and
Liguria Vita SpA into UnipolSai is expected by 31 December 2015; b) the rebranding to comply with replacement measure (ii) has been completed; c) UnipolSai has taken the necessary action to release the portfolio, which in the provinces of Barletta-Andria-
Trani, Cosenza, Enna, Catania, Ragusa and Cagliari has resulted in the Company transferring premiums for a total of €18.6m, higher than the €18.2m minimum indicated in the Antitrust Authority measure.
Reduction of overall exposure to Mediobanca It should be noted that the measures imposed by the Antitrust Authority also required the Unipol Group to reduce its overall debt to Mediobanca by €350m over the 2013-2015 period. On 18 June 2014, as illustrated in the previous pages, UnipolSai arranged for the repayment of subordinated loans with an indefinite maturity disbursed by Mediobanca to said entity and to the merged entities Milano Assicurazioni and Unipol Assicurazioni for a total amount of €750m, all falling within the available Solvency margin of the financed companies up to the limit of 50%. Hence, UnipolSai exceeded the specified amount and disclosed the times for implementing said measure. Main corporate rationalisation operations of the Group In 2014 the corporate structure of the real estate sector was simplified and rationalised as approved by the Boards of Directors of Unipol and UnipolSai in June 2014. Specifically, the following transactions were carried out: (i) merger by incorporation of the following companies 100% directly or indirectly controlled by UnipolSai into
Immobiliare Fondiaria-SAI, which at the same time changed the company name to UnipolSai Real Estate: Immobiliare Milano Assicurazioni, IN.V.ED, Mizar, R.EDIL.MO., Bramante, Cascine Trenno, Trenno Ovest, IAT, Meridiano Bellarmino, Immobiliare Litorella, Meridiano Bruzzano, Meridiano Aurora, Campo Carlo Magno, Sintesi Seconda, Stimma, UnipolSai Servizi Immobiliari (formerly Immobiliare Lombarda SpA), International Strategy and Unifimm; and
(ii) absorption of the subsidiaries Covent Garden and Comsider into the subsidiary Midi.
35

In the Other Businesses sector, the merger by incorporation of Eurosai, Finadin and Saifin Saifinanziaria into Smallpart SpA took effect on 23 December 2014, and at the same time took on the name of UnipolSai Finance. On 3 November 2014 the merger of Banca Sai (a 100% subsidiary of UnipolSai) into the investee Unipol Banca also became effective (accounting and tax effects backdated to 1 January 2014), as resolved by the respective shareholders on 3 October 2014. Based on the swap transaction agreed in the merger plan, UnipolSai received 132,428,578 new Unipol Banca shares (equal to a €132m increase in share capital in service of the merger), increasing the interest held from 32.25% to 42.25%. The put and call option rights agreed with Unipol regarding the investment do not extend to the new Unipol Banca shares received in the swap transaction resulting from the merger (for more information, refer to the section providing information on related party transactions).
All transactions carried out in 2014 are explained in the Consolidation scope section of the Notes, which should be referred to.
Bankruptcy order of Im.Co. SpA in liquidation and Sinergia Holding di Partecipazioni SpA in liquidation
By means of judgment issued on 14 June 2012, the companies belonging to the Sinergia Holding di Partecipazioni SpA Group in liquidation (“Sinergia”), including the subsidiary Immobiliare Costruzioni Im.Co. SpA in liquidation (“Im.Co.”), were declared bankrupt by the second civil section of the Court of Milan. Europrogetti Srl was also declared bankrupt on 14 December 2012.
On 17 November 2014 the Court of Milan approved the bankruptcy agreement regarding Im.Co that had been put forward by Visconti, the company Unicredit and Banca Popolare di Milano incorporated with the objective of proposing a bankruptcy agreement to settle the insolvency of the companies Im.Co. and Sinergia. The main effects of the relevant decree included transfer of the real estate complex in Milan at Via De Castillia to UnipolSai, and the real estate complex in Parma, Località San Pancrazio Parmense, to UnipolSai Real Estate. At 31 December 2013 they were respectively recorded in the financial statements as receivables, net of their bad debt provisions, for €25m (versus an original receivable of €77m) and €8m (versus a receivable of €23m).
On 5 December 2014 the bankruptcy agreement regarding Sinergia was also approved.
All the details pertaining to the agreement with Visconti are provided in the paragraph Provisions of the Notes, to which reference is made; execution of this agreement will be completed during the year.
36
Operating performance
The first financial year of UnipolSai was 2014. UnipolSai is the result of the merger by incorporation of Unipol Assicurazioni, Milano Assicurazioni and Premafin into Fondiaria-SAI, the operation that completed the corporate integration plan of the Unipol Group with the former Premafin/Fondiaria-SAI Group started in 2012.
Group activities in 2014 therefore essentially related to the corporate integration of UnipolSai, which is now the leading company in the domestic Non-Life insurance market, with a leading agency network in Italy in terms of distribution, widespread coverage and actual ability to meet customer requirements. The integration involved organisational/logistics aspects and the preliminary activities for the sharing of the agency underwriting systems among the various agency networks, a crucial step towards full exploitation of the synergies identified in the 2013-2015 Business Plan. The first roll-outs of former Fondiaria-SAI agencies on the UnipolSai underwriting systems started in September, while starting from the month of June actions were launched for the release of the new claims management IT system (“Liquido”), which is gradually being applied at present to the claims portfolio of the former Unipol Assicurazioni to then be extended to the claims portfolios of the former Fondiaria-SAI.
From the company simplification standpoint, many mergers affecting the real estate and financial sectors were completed in order rationalise the businesses in which the Group operates. Following the authorisation of the Bank of Italy on 25 September 2014, on 3 November 2014 the merger by incorporation of the subsidiary Banca Sai into Unipol Banca was concluded, and took effect on 1 January 2014 for tax and accounting purposes.
As already mentioned, the Group’s activity was also concentrated on discharging commitments undertaken with the Antitrust Authority (AGCM) regarding, among others, the disposal of insurance assets that led the Group to enter into an agreement with Allianz for the disposal of the former Milano Assicurazioni insurance assets achieved by transferring a network of 725 agencies (together with their contracts portfolio) and 470 employees who manage these assets at the end of the first half of 2014. Allianz paid UnipolSai the amount of €379m in two tranches for the disposal, of which €179m were paid as the second tranche on the basis of the actually transferred or renewed portfolio on 20 February 2015. The capital gain realised amounted to €325m against which accessory charges totalling €34m were incurred.
From a business perspective, in 2014 the UnipolSai Group had a positive operating performance in terms of the income statement and the financial position, due to the favourable Non-Life loss ratio trend, despite a tariff squeeze, growth in the Life business and profitability of financial investments in a scenario of a return to stability in the financial markets. A summary of the performance of the key sectors compared against the figures of the previous year on a like-for-like basis, i.e. calculated in relation to the aggregated post-Merger perimeter, is provided hereunder.
For the Non-Life sector, direct premiums decreased, affected by the recession and the effects on tariffs - particular MV TPL - of the highly competitive scenario triggered by the profitability of this sector. UnipolSai premiums were also impacted from 1 July 2014 by the effects of the transfer of 725 former Milano Assicurazioni agencies to Allianz. In this context, consolidated Non-Life direct premiums amounted to €8,424m at 31 December 2014 (-9.0% compared to 31/12/2013). Based on management assessments performed, excluding the effect of the aforementioned portfolio transfer, the ongoing trend estimated for Non-Life direct premiums for the current year (the “estimated operating figure”) should be around -6.1%, recording a slight recovery on the figure at 30 September 2014 (-6.8%).
37

In the motor vehicle TPL class, commercial policies aimed to protect the policy portfolio and production relaunch, also through the continuation of targeted advertising and sales campaigns, such as zero-interest premium instalment payment plans in synergy with the associate Finitalia, which met with a positive reception by UnipolSai customers. Also note the successful continuation of the electronic product mix: at 31 December 2014 the number of policies matched to black boxes exceeded two million. Premiums in this class came to €4,351m, down 13.1% on 31 December 2013 (operating figure estimated at -9.2%). The Land Vehicle Hulls class declined (-10.8%), recording premiums of €658m which remain conditioned by the effects of the recession on the automotive market (operating figure estimated at -7.4%).
The Non-MV segment showed greater staying power with respect to the unfavourable macroeconomic scenario, with premiums of €3,414m and a slight dip of 2.7% (operating figure estimated at -1.5%).
Analysing the Non-Life results of the main Group companies, UnipolSai collected a total of €8,000m to consolidated premiums (-9.1%; operating figure estimated at -6.0%). Also marking a decrease were direct premiums of Liguria Assicurazioni (€146m, -15.3%) and of SIAT, Transport classes, particularly the sea vehicles sector (€114, down 5.3%).
With regard to Non-Life claims, during the year MV TPL business recorded a drop in claims with a further slight decrease in claims frequency which, albeit only in part, allowed the effects of the decline in average premiums applied to policyholders to be limited. The average cost of claims continued to benefit from the lower impact of claims involving injuries and from action to limit the cost of vehicle repairs and combat fraud, but especially in the final months of the year it was affected by a higher incidence of claims with fatalities compared to last year and by their prudent increase.
Among Non-MV classes, as a result of maintaining strict subscription policies, the loss ratio improved considerably over the year in the General TPL and Health businesses. The loss ratio for Fire, however, deteriorated due to the stronger presence of significant claims and flood damage, that for Marine Vessels due to a highly significant claim almost fully absorbed by reinsurance, and the Bonds business in particular felt the impact of the negative economic scenario associated with the building industry that has a strong effect on the portfolio of this class.
After strengthening in recent years, provisions for prior year claims remained steady, though for prudential reasons a number of actuarial integrations were made in the TPL classes of certain companies. At UnipolSai Group level, however, a positive balance was recorded in the total Non-Life run-off of direct business, net of recoveries, for around €23m compared to the negative €174m of the previous year. The net profit (loss) of the breakdown of the provisions for claims for the main businesses is provided in the following table:
Amounts in €m Net breakdown
MV TPL -93
Land Vehicle Hulls 17
General TPL -52
Other Classes 152
Total 23
In this context, at the end of 2014 the UnipolSai Group’s loss ratio for direct business (including the balance of other technical items) was 68.1%, essentially in line with the figure at 31 December 2013 (68.2%).
38
The expense ratio for direct business, affected by the conspicuous drop in premiums associated with the tariff decrease and the disposal of insurance assets, reached 27.3%. They were also affected by the commercial efforts made to support the recovery in production and investments in the IT system required during this integration phase, as well as a greater incidence of commissions due to the changes in the production mix and the improvement in technical business which impacts the variable part.
Overall, the Group’s combined ratio of direct business stood at 95.3% at 31 December 2014 compared to 93.3% at 31 December 2013.
In the Life sector, the 2014 performance - more marginally impacted by the effects of the aforementioned sale of former Milano agencies historically most active in the Non-Life sector - showed a strong increase in premiums on traditional guaranteed products, aided by the lower interest rates and the lower risk appetite of policyholders. Group direct premiums therefore increased significantly, +23.6% to reach €7,584m.
In this segment, the UnipolSai Group benefited from the growth in the bancassurance channel represented mainly by the Popolare Vita Group companies, which with €3,664m recorded growth of 44.6% at 31 December 2014. With €3,696m in premiums, UnipolSai also experienced growth of 7.5% despite the fact that some considerable collections on policies which positively impacted 2013 were not repeated. As a result of the above, the volume of new business in terms of pro-quota APE stood at €643m at 31 December 2014 (€554m at 31/12/2013), of which €437m contributed by the traditional companies and €206m relating to bancassurance companies.
In 2014, in an improved financial markets scenario backed by constant ECB action to relaunch economic growth and put a halt to the current deflationary drift, the market value of the portfolio, mostly comprising Italian government debt securities, increased considerably. In this context, though with a view to maintaining consistency between assets and liabilities assumed with respect to policyholders and reducing exposure to structured securities, the Group’s insurance financial investments achieved a significant return of approximately 4.7% of the assets invested. Note the decrease in 2014 in the portfolio of Level 2 and Level 3 structured securities for around €2bn, also resulting in the recognition of a total capital gain of approximately €30m. In this respect, note again that in January 2015 the “Willow” structured security was sold for a total of around €438m with a capital gain of over €9m.
As regards the Real Estate sector, operations focused on cost containment, also via the merger of numerous real estate companies, and on the rationalisation and redevelopment of property assets by seeking valuation opportunities despite market conditions remaining influenced by the tough crisis affecting the entire sector, with constantly declining prices and rents that have led to the write-down of a number of portfolio properties.
The results recorded by companies in the other sectors in which the Group conducts business, particularly in the hotel, clinical, medical and agricultural sectors, improved with respect to the past - though still negative - due to redevelopment and new business development initiatives implemented by the new management.
________________________________________________________________________________________
The UnipolSai Group closed 2014 with a positive consolidated result of €783m (€694m at 31/12/2013), while the consolidated solvency position was equal to roughly 1.63 times the minimum required, up over 2013.
39

Salient aspects of business operations
The Consolidated Financial Statements at 31 December 2014 closed with a net income totalling €783m (€386m at 31/12/2013, €694m on a like-for-like basis), to which the Insurance sector contributed €830m (€493m at 31/12/2013, €814m on a like-for-like basis), of which €669m relating to Non-Life business (€180m at 31/12/2013, €444m on a like-for-like basis) and €161m to Life business (€313m at 31/12/2013, €369m on a like-for-like basis). The results of the other sectors in which the Group carries out business are as follows:
- the Other Businesses sector recorded a break-even result (-€60m at 31/12/2013, -€75m on a like-for-like basis). The result of the sector was particularly positively influenced by the net income of Banca Sai at 30 September 2014 for €19m; on 3 November 2014 it was incorporated into the associate Unipol Banca, whose contribution to the income statement of the consolidated financial statements referring to the fourth quarter is classified under the Non-Life and Life sectors;
- the Real Estate sector recorded a -€46m loss (-€47m at 31/12/2013, -€45m on a like-for-like basis).
The important factors that marked the performance of the Group included the following:
direct insurance premiums, gross of reinsurance, totalled €16,008m (€9,747m in 2013 and €15,394m on alike-for-like basis, +4.0%). Non-Life direct premiums amounted to €8,424m (€5,789m in 2013 and €9,257mon a like-for-like basis, -9.0%) and Life direct premiums €7,584m (€3,958m in 2013 and €6,137m on a like-for-like basis, +23.6) €50m of which related to Life investment products (€44m in 2013 and €61m on a like-for-like basis);
earned premiums, net of reinsurance, amounted to €15,961m (€9,650m in 2013 and €15,288m on a like-for-like basis), €8,439m of which was from Non-Life business (€5,743m in 2013 and €9,225 on a like-for-likebasis) and €7,522m from Life business (€3,907m in 2013 and €6,063m on a like-for-like basis). On a like-for-like basis the overall variation was +4.4%;
net charges relating to claims, net of reinsurance, amounted to €13,892m (€8,135m in 2013, €12,798m ona like-for-like basis), €5,709m of which was from Non-Life business (€4,077m in 2013, €6,269m on a like-for-like basis) and €8,183m from Life business (€4,059m in 2013 and €6,529m on a like-for-like basis), including€421m in net gains on financial assets and liabilities at fair value (€197m in 2013, €293m on a like-for-likebasis);
the loss ratio of direct Non-Life business was 68.1% (71.9% in 2013, 68.2% on a like-for-like basis);
operating expenses amounted to €2,646m (€1,609m in 2013, €2,652m on a like-for-like basis). On a like-for-like basis the variation was -0.2%. In the Non-Life business, they amounted to €2,255m (€1,334m in2013, €2,273m on a like-for-like basis), €356m in the Life business (€203m in 2013, €293m on a like-for-likebasis), €66m in the Other Businesses sector (€313m in 2013 and €320m on a like-for-like basis), and €10min the Real Estate sector (€0 in 2013, €8m on a like-for-like basis);
the combined ratio of direct Non-Life business was 95.3%, (96.1% in 2013 and 93.3% on a like-for-likebasis);
net gains on investments and financial income from financial assets and liabilities (excluding net gains onfinancial assets and liabilities at fair value relating to Life business) amounted to €1,784m (€1,159m in 2013and €1,892m on a like-for-like basis);
the gross result came to €1,142m (€665m in 2013 and €1,172m on a like-for-like basis), after discountingwrite-downs of real estate loans and receivables and available-for-sale assets amounting to €167m, and
40

amortisation of intangible assets coming to €133m. The gross result was positive impacted for €325m (gross of €34m for accessory charges) by the realisation of the capital gain regarding the disposal of insurance assets to Allianz, €316m of which in the Non-Life segment and €9m in the Life segment;
taxation for the period constituted a net expense of €355m (€278m in 2013 and €476m on a like-for-like basis). The tax rate was 31.0%, (41.8% in 2013 and 40.6% on a like-for-like basis, more specifically impacted by the 8.5% IRES surcharge on financial/insurance companies);
net of the €44m profit attributable to non-controlling interests, the result attributable to the owners of the Parent at 31 December 2014 was a profit of €740m (€288m in 2013, €636m on a like-for-like basis);
the net result just for the fourth quarter of 2014 was positive to the tune of €190m (profit of €23m in the fourth quarter of 2013, profit of €97m on a like-for-like basis);
the comprehensive result was a profit of €1,487m (€321m in 2013, €883m on a like-for-like basis), because of the increase in the reserve for gains or losses on available-for-sale financial assets (€660m), which continued to benefit, in particular, from the recovery in Italian government bonds;
investments and cash and cash equivalents amounted to €62,878m (€35,359m in at 31/12/2013 and €58,664m on a like-for-like basis), after having reclassified €23m under assets held for disposal, pursuant to IFRS 5;
technical provisions and financial liabilities amounted to €60,041m (€35,026m in 2013, €57,134m on a like-for-like basis);
following the application of IFRS 5, €24m was reclassified under Non-current assets or assets of a disposal group, and €3m reclassified under Liabilities associated with disposal groups.
Below is a summary of the consolidated income statement at 31 December 2014, broken down by business segment: Insurance (Life and Non-Life), Other Businesses and Real Estate, compared with the figures at 31 December 2013, with the reminder that the figures of last year refer to the Fondiaria-SAI consolidated financial statements restated as explained above.
41

Valor
i in M
ilioni
di Eu
ro
Amou
nts in
€m31
/12/20
1431
/12/20
13%
var.
31/12
/201 4
31/12
/201 3
% va
r.31
/12/20
1431
/12/20
13%
var.
31/12
/2014
31/12
/2013
% va
r.31
/12/20
1431
/12/20
13%
var.
31/12
/2014
31/12
/2013
% va
r.31
/12/20
1431
/12/20
13%
var.
Net p
remium
s 8,4
395,7
4346
.97,5
223,9
0792
.515
,961
9,650
65.4
00
0.00
00.0
00
0.015
,961
9,650
65.4
Net c
ommi
ssion
inco
me
00
0.00
0-67
.20
0-10
7.57
13-43
.20
00.0
-6-12
-47.8
12
-27.6
Finan
cial in
come
/expe
nse (
excl.
asse
ts/liab
ilities
at fa
ir valu
e)49
730
065
.71,3
2988
350
.51,8
251,1
8354
.443
422.4
-34-30
14.6
-51-36
38.9
1,784
1,159
54.0
Net in
teres
t inco
me39
823
470
.01,0
8764
768
.01,4
8588
168
.544
47-6.
7-2
-2-7.
9-24
-1472
.51,5
0391
264
.8
Othe
r gain
s and
loss
es50
2597
.2-12
19-15
9.638
45-14
.80
040
1.934
1512
5.2-27
-2318
.345
3721
.9
Realis
ed ga
ins an
d los
ses
160
9961
.123
821
212
.339
831
127
.88
637
.8-1
-2-40
.80
00.0
404
315
28.4
Unrea
lised g
ains a
nd lo
sses
-111
-5988
.416
522
9.8-95
-5475
.9-8
-10-21
.6-66
-4158
.70
00.0
-169
-106
59.7
Net c
harge
s rela
ting to
claim
s-5,
709
-4,07
740
.0-8,
183
-4,05
910
1.6-13
,892
-8,13
570
.80
00. 0
00
0.00
00.0
- 13,89
2-8,
135
70.8
Opera
ting ex
pens
es-2,
255
-1,33
469
.0-35
6-20
375
.7-2,
611
-1,53
769
.9-66
-313
-78.9
-100
n.s.
4124
1-83
.0-2,
646
-1,60
964
.4
Comm
ission
s and
othe
r acq
uisitio
n cos
ts-1,
797
-1,06
369
.0-20
8-12
468
.1-2,
006
-1,18
768
.90
00.0
00
0.024
1470
.2-1,
982
-1,17
468
.9
Othe
r exp
ense
s-45
8-27
168
.8-14
8-79
87.7
-605
-350
73.0
-66-31
3-78
.9-10
0n.s
.17
227
-92.3
-664
-436
52.3
Othe
r gain
s and
loss
es-17
-297
-94.2
-57-97
-40.7
-74-39
4-81
.119
208
-90.8
-30-21
39.0
20-19
3-11
0.1-66
-400
-83.6
Pre-t
ax pr
ofit (l
oss)
954
334
185.4
254
433
-41.2
1,208
767
57.5
4-50
n.s.
-74-51
43.6
40
n.s.
1,142
665
71.6
Incom
e tax
-285
-154
85.4
-93-12
0-22
.4-37
9-27
438
.1-4
-8-48
.129
4n.s
.0
00.0
-355
-278
27.3
Profit
(loss
) from
disc
ontinu
ed op
eration
s0
0-10
0.00
00.0
00
-100.0
1-1
n.s.
-10
0.0-4
0n. s
.-4
-1n.s
.
Cons
olida
ted pr
ofit (l
oss)
669
180
271.2
161
313
-48.5
830
493
68.4
0-60
-100.0
-46-47
-2.5
00
0.078
338
610
3.2
Profi
t (los
s) att
ributa
ble to
the o
wners
of th
e Pare
nt 66
714
912
223
378
938
20
-55-50
-390
074
028
815
6.4
Profi
t (los
s) att
ributa
ble to
non-c
ontro
lling i
nteres
ts1
3139
7940
110
0-5
3-8
00
4497
-54.9
Cond
ense
d Con
solid
ated O
pera
ting I
ncom
e Stat
emen
t bro
ken d
own b
y bus
ines
s seg
ment
NON-
LIFE
BUSI
NESS
LIFE
BUSI
NESS
INSU
RANC
E
SECT
OR
OTHE
R BU
SINE
SSES
SECT
OR
REAL
EST
ATE
SECT
OR (*
)
CONS
OLID
ATED
TOTA
L
Inter
segm
ent
elim
inati
ons
(*) T
he R
eal E
stat
e se
ctor
onl
y in
clud
es re
al e
stat
e co
mpa
nies
con
trolle
d by
Uni
polS
ai
42

Insurance Sector The Group’s insurance business ended with a profit of €830m (€493m at 31/12/2013, €814m on a like-for-like basis, of which €669m relating to the Non-Life segment (€180m at 31/12/2013, €444m on a like-for-like basis) and €161m relating to the Life segment (€313m at 31/12/2013 and €369m on a like-for-like basis). The Non-Life segment benefited from the capital gain realised on the disposal of the insurance assets of the former Milano Assicurazioni amounting to €316m, before relevant taxation. In relation to the business unit transfer, accessory charges of €34m were also incurred. Total premium income (direct and indirect premiums and investment products) amounted to €16,037m at 31 December 2014 (€9,751m at 31/12/2013, €15,432m on a like-for-like basis). Life premiums amounted to €7,586m (€3,959m at 31/12/2013, and €6,139m on a like-for-like basis) and Non-Life premiums totalled €8,451m (€5,792m at 31/12/2013 and €9,294m on a like-for-like basis). All premiums in the Non-Life classes of Group insurance companies are classified under insurance premiums, as they meet the requirements of IFRS 4 (presence of significant insurance risk). As regards Life business, investment products at 31 December 2014 worth €50m, related to Class III (unit- and index-linked policies), Class V (capitalisation insurance) and Class VI (pension funds).
Amounts in €m31/12/2014 % comp. 31/12/2013 % comp. % var.
% var. on a
like-for-like
basis
Non-Life direct premiums 8,424 5,789 45.5 -9.0
Non-Life indirect premiums 28 3 n.s. -24.7
Total Non-Life premiums 8,451 52.7 5,792 59.4 45.9 -9.1
Life direct premiums 7,535 3,914 92.5 24.0
Life indirect premiums 1 1 n.s. -17.1
Total Life business premium income 7,536 47.0 3,915 40.1 92.5 24.0
Total Life investment products 50 0.3 44 0.5 12.7 -18.4
Total Life business premium income 7,586 47.3 3,959 40.6 91.6 23.6
Overall total 16,037 100.0 9,751 100.0 64.5 3.9
Consolidated premiums
Premiums of the fourth quarter of 2014 alone amounted to €4,129m (€2,731m in the fourth quarter of 2013 and €4,376m on a like-for-like basis).
43

Direct premium income amounted to €16,008m (€9,747m at 31/12/2013, and €15,394m on a like-for-like basis), of which Non-Life premiums totalled €8,424m and Life premiums €7,584m. Direct premium income
Amounts in €m
31/12/2014 % comp. 31/12/2013 % comp. % var.
% var. on a
like-for-like
basis
Non-Life direct premiums 8,424 52.6 5,789 59.4 45.5 -9.0
Life direct premiums 7,584 47.4 3,958 40.6 91.6 23.6Total direct premium income 16,008 100.0 9,747 100.0 64.2 4.0 With regard to Non-Life claims, during the year MV TPL business recorded a drop in claims with a further slight filing in claims frequency which, albeit only in part, allowed the effects of the reduction in average premiums applied to policyholders to be limited. The average cost of claims continued to benefit from the lower impact of claims involving injuries and from action to limit the cost of vehicle repairs and combat fraud, but especially in the final months of the year it was affected by a higher incidence of claims with fatalities compared to last year and by their prudent increase. Among Non-MV classes, as a result of maintaining strict subscription policies, the loss ratio improved considerably over the year in the General TPL and Health businesses. The loss ratio for Fire, however, deteriorated due to the stronger presence of significant claims and flood damage, that for Marine Vessels due to a highly significant claim almost fully absorbed by reinsurance, and the Bonds business in particular felt the impact of the negative economic scenario associated with the building industry that has a strong effect on the portfolio of this class. After strengthening in recent years, provisions for prior year claims remained steady, though for prudential reasons a number of actuarial integrations were made in the TPL classes of certain Companies. At UnipolSai Group level, however, a positive balance was recorded in the total Non-Life run-off of direct business, net of recoveries, for around €23m compared to the negative €174m of the previous year. The loss ratio solely for Non-Life direct business, including the OTI ratio, stood at 68.1% (71.9% at 31/12/2013 and 68.2% on a like-for-like basis). The number of claims reported, without considering the MV TPL class, fell by 5.7%. The table with the changes per class is provided below. Number of claims reported (excluding MV TPL)
31/12/2014 31/12/2013 % var.
% var. on a
like-for-like
basis
Land Vehicle Hulls (class 3) 319,823 223,202 43.3 -9.5
Accident (class 1) 144,008 66,359 117.0 6.8
Health (class 2) 468,321 271,690 72.4 -26.1
Fire and Other damage to property (classes 8 and 9) 363,280 215,122 68.9 7.3
General TPL (class 13) 120,413 81,235 48.2 -8.0
Other classes 374,939 158,021 137.3 21.5Total 1,790,784 1,015,629 76.3 -5.7
44
As regards the MV TPL class, where the CARD1 agreement is applied, in 2014 cases relating to “fault” claims (Non-Card, Debtor Card or Natural Card) reported totalled 744,004, down 15.5% compared to the 2013 figure on a like-for-like basis (880,246). Claims reported that present at least a Debtor Card claim numbered 429,343, down 20.5% compared to the same period in the previous year. Note that from 2014, claims between the former Unipol Assicurazioni, Fondiaria-SAI and Milano Assicurazioni are to be considered as “Natural” and therefore classified solely as Handler Card. Handler Card claims totalled 536,953 (including 133,747 Natural Card claims, claims between policyholders at the same company), down by 6.7%. The settlement rate in 2014 was 80.2% as compared to 80.4% recorded last year. The weight of cases to which the Card agreement may be applied (both Handler Card and Debtor Card claims) out of total cases (Non-Card + Handler Card + Debtor Card) in 2014 came to 84.2% (84.3% in 2013). The average cost of “with result” (paid plus reserved) for claims reported rose in 2014 by 1.6% compared to the previous year (+6.1% in 2013). The average cost of the amount paid out recorded a 1.2% increase.
The expense ratio for Non-Life direct business was 27.3% (24.2% at 31/12/2013, 25.2% on a like-for-like basis), a value affected by the drop in premiums, the greater impact of commissions (changes in production mix), the improvement in technical business that affects the growth of the variable part of the commissions, the investments in the IT system required during this integration phase, as well as the investments made to support the recovery in production (instalments at zero interest rate, advertising campaign and black box).
The combined ratio, based on direct business, was 95.3% at 31 December 2014 (96.1% at 31/12/2013 and 93.3% on a like-for-like basis).
Performance of Non-Life Premiums
Total premiums (direct and indirect premiums) of the Non-Life portfolio at 31 December 2013 amounted to €8,451m (€5,792m at 31/12/2013, and €9,294m on a like-for-like basis).
Direct business premiums alone amounted to €8,424m (€5,789m at 31/12/2013, and €9,257m on a like-for-like basis). Indirect business premiums amounted to €28m (€3m at 31/12/2013, €37m on a like-for-like basis).
1 CARD - Convenzione tra Assicuratori per il Risarcimento Diretto - Agreement between Insurers for Direct Compensation: Motor TPL claims may be classified into one of three cases of claims managed: Non-Card claims: claims governed by the ordinary regime, to which CARD is not applied; Debtor Card claims: claims governed by CARD where “our” policyholder is fully or partially liable, which are settled by the
counterparty’s insurance companies, to which “our” insurance company must pay a flat rate payout (“Debtor Flat Rate”); Handler Card claims: claims governed by CARD where “our” policyholder is fully or partially not liable, which are settled by “our”
insurance company, to which the counterparty’s insurance companies must pay a flat rate payout (“Handler Flat Rate”). However, it must be noted that this classification is a simplified representation because, in effect, each individual claim may contain damages included in each of the three above cases.
45

The breakdown of direct business relating to the main classes compared with 31 December 2013 is set out in the following table:
Non-Life business direct premium income
Amounts in €m
31/12/2014 % comp. 31/12/2013 % comp. % var.
% var. on a
like-for-like
basis
Motor vehicles - TPL and sea, lake and river (classes 10 and 12) 4,351 3,174 37.1 -13.1
Land Vehicle Hulls (class 3) 658 482 36.7 -10.8
Total premiums - Motor vehicles 5,009 59.5 3,656 63.2 37.0 -12.8
Accident and Health (classes 1 and 2) 963 580 65.9 -7.6
Fire and Other damage to property (classes 8 and 9) 1,172 774 51.4 -1.4
General TPL (class 13) 754 444 69.8 -2.7
Other classes 525 334 57.0 4.0
Total premiums - Non-Motor vehicles 3,414 40.5 2,133 36.8 60.1 -2.7
Total Non-Life direct premiums 8,424 100.0 5,789 100.0 45.5 -9.0
11.4%
51.7%
7.8%
13.9%
9.0%
6.2%
% breakdown of Non-Life direct business premiums
Accident and Health
Land Vehicle TPL
Land Vehicle Hulls
Fire and Other damage to property
General TPL
Other Classes
Direct premiums decreased, affected by the recession and the effects on tariffs - particular MV TPL - of the highly competitive scenario triggered by the profitability of this sector. UnipolSai premiums were also impacted from 1 July 2014 by the effects of the transfer of 725 former Milano Assicurazioni agencies to Allianz. In this context, consolidated Non-Life direct premiums amounted to €8,424m at 31 December 2014 (-9.0% compared to 31/12/2013 on a like-for-like basis). Based on management assessments performed, excluding the effect of the aforementioned portfolio transfer, the ongoing trend estimated for Non-Life direct premiums for the current year (the “estimated operating figure”) should be around -6.1%, recording a slight recovery on the figure at 30 September 2014 (-6.8%). In the motor vehicle TPL class, commercial policies aimed to protect the policy portfolio and production relaunch, also through the continuation of targeted advertising and sales campaigns, such as zero-interest
46

premium instalment payment plans in synergy with the associate Finitalia, which met with a positive reception by UnipolSai customers. Also note the successful continuation of the electronic product mix: at 31 December 2014 the number of policies matched to black boxes exceeded two million. Premiums in this class came to €4,351m, down 13.1% on 31 December 2013 (operating figure estimated at -9.2%). The Land Vehicle Hulls class declined (-10.8%), recording premiums of €658m which remain conditioned by the effects of the recession on the automotive market (operating figure estimated at -7.4%).
The Non-MV segment showed greater staying power with respect to the unfavourable macroeconomic scenario, with premiums of €3,414m and a slight dip of 2.7% (operating figure estimated at -1.5%).
Performance of the main Group companies at 31 December 2014 is summarised in the following table:
Amounts in €mInvestments Gross Technical
Provisions
NON-LIFE INSURANCE SECTORUNIPOLSAI ASSICURAZIONI SpA 8,045 -9.8% 18,569 15,958DDOR NOVI SAD ADO 69 7.7% 38 63INCONTRA ASSICURAZIONI SpA 66 63.4% 121 133LIGURIA ASS.NI SpA 146 -15.6% 376 367PRONTO ASSISTANCE SpA 69 -4.5% 20 1SIAT SpA 132 -4.0% 119 301
Premiums written
Variation
The direct premiums of only UnipolSai, the Group’s main company, stood at €8,000m (€8,800m at 31/12/2013, -9.1%, operating figure estimated at 6.0%), of which €4,856m in the MV classes (€5,546m at 31/12/2013, -12.4%) and €3,144m in the Non-MV classes (€3,254m at 31/12/2013, -3.4%).
In the MV classes, premiums included €4,216m in the MV TPL class (€4,832m at 31/12/2013, -12.7%). The considerable reduction of total premiums was caused by three key factors: recourse to application of tariffs aimed at boosting greater competitiveness (in particular for the new policies), the sale of the business unit to Allianz and a drop in number of contracts in the portfolio. With reference to the Land Vehicle Hulls class, total premiums of the guarantees in addition to the mandatory coverage decreased with a slow-down of the negative trend during the latter part of the year. The ageing of the vehicle fleet on the road led to a drop in number of insured vehicles and a progressive reduction of the values covered by insurance. The decrease in premiums in Non-MV classes regarded both businesses and individuals. What surely made a decisive impact were the economic crisis, as well as the effect of the transfer of the business unit to Allianz, and - to a lesser extent - the redevelopment actions which concerned the portfolios of the Fondiaria, Sai, Milano, Previdente and Nuova Maa Divisions. Claims reported that present at least Debtor Card claims handling numbered 418,516, down 20.7% compared to the same period in the previous year. The appreciable reduction reflected the classification between the Natural Cards of claims between policyholders of the former Unipol Assicurazioni, Fondiaria-SAI and Milano Assicurazioni, as commented above. Handler Card claims totalled 525,530 (including 133,496 Natural Card claims), down by 6.6%. The settlement rate in 2014 was 80.2% as compared to 80.4% recorded last year.
DDOR Novi Sad recorded a €2.4m loss at 31 December 2014 (slightly lower than the -€2.2m at 31/12/2013) compared to an increase in total gross premiums (including both the Non-Life and Life segments), which rose from €69.1m at year-end 2013 (of which €63.9m in the Non-Life segment) to €74.4m at 31 December 2014 (of which €68.8m in the Non-Life segment). The Serbian macroeconomic situation, still unstable, did not prevent the company from improving its technical profitability along with growth in its business. The MV TPL class posted a 24.6% increase against growth in the number of policies underwritten (11%), while the Other Damage
47

to Property class went up to 14.9%. The net Non-life combined ratio dropped from 110.2% in 2013 to 102.5% in 2014.
Dialogo Assicurazioni, active in placing insurance products of the MV and Protection of Assets and Individuals businesses through the telephone channel and Internet closed 2014 with a €2.5m loss (-€1.1m at 31/12/2013) and total premiums down at €19.6m (€22.9m at 31/12/2013).
Incontra Assicurazioni recorded a €2.1m profit at 31 December 2014 (markedly higher than the €0.9m at 31/12/2013) with total premiums greater than last year, up from €40.6m in 2013 to €66.3m at year-end 2014. The volume of total investments at 31 December 2014 amounted to €120.6m, almost all concentrated in available-for-sale financial assets.
Liguria Società di Assicurazioni closed 2014 with net profit of €3.1m, up compared to €1.9m profit recorded at 31 December 2013. Total premiums amounted to €146.1m, down compared to the 2013 figure (€173.0m). The decrease was due not only to the shrinkage of the Non-Life market, but also to the combined effect of competitiveness in the market and the redevelopment of the portfolios. As for technical performance, development of the MV TPL class loss ratio improved during the year. The indicators of claims handled in this class are improving, with claims down by 11.3%, the rate reduced from 6.0% in 2013 to 5.6% in 2014, and the impact of claims with physical damages falling from 19.7% at 31 December 2013 to 17.8% at 31 December 2014, with a significant positive impact on the results attained.
Pronto Assistance, active in placing assistance services insurance policies in the home, health, MV and business segments, personalisable to meet the customer’s needs, closed 2014 with a profit of €3.9m (profit of €3.3m recorded in 2013). The year 2014 posted total premiums amounting to €68.8m, with a decrease of 4.5% mostly due to indirect business.
SIAT recorded a €3.6m profit in 2014 (€3.1m at 31/12/2013) with total gross premiums (direct and indirect) at €132.1m (€137.6m in 2013). The regression can be attributed to both the Sea, Lake and River Vessels class, mostly due to several long-term (18 months) policies issued in the previous year, whose renewal is expected in 2015, and the production regarding the Goods in Transit class, which recorded a decrease in so far as it suffered from the economic crisis still unfavourable today, in particular with regard to the domestic component. On the other hand, 2014 production sustained the considerable appreciation (12.0%) that was recorded by the US dollar (currency in which a considerable portion of business in the Transport market is denominated, particularly for the Sea, Lake and River Vessels class) compared to the common currency. Indeed, remarkable changes compared to the most recent past were not recorded on the international insurance market. It continues to be marked by an underwriting capacity in both Italy and Europe, which brings about pressure on the rates and terms of renewal, especially on the most important business with a positive statistical trend. The company continue to apply a restrictive technical policy on the business undertaken by accentuating the stance to keep a higher retention on that considered more profitable.
Offer of policies payable in instalments at zero interest rate (TAN 0%, TAEG 0%)
UnipolSai decided to extend to 31 December 2014 the option to pay motor policies in monthly instalments at zero interest rate, intended both for current and new customers, whereby the policyholders will not incur any additional costs because all financial expenses will be borne by UnipolSai (TAN, or annual nominal rate: 0.0%; TAEG, or annual percentage rate: 0.0%; purchase fees: 0.0%)
Continuing with the successful experience matured in MV TPL, in July UnipolSai extended the option to pay the premium in instalments at zero interest rate to numerous other Non-MV products. In this period of
48

prolonged economic crisis, which is having a significant impact on household and business spending power, the ability to further facilitate traditional premium payment methods confirms our focus on customer needs and is a distinctive element of our commercial offering.
New products
In 2014 UnipolSai introduced the following products: UnipolSai Casa Smart, dedicated to the home, to pre-defined and unalterable combinations; UnipolSai Infortuni Smart, dedicated to accidents and designed to offer people and families individual
(or household) insurance coverage in the case of an occupational accident outside the workenvironment;
UnipolSai Attività Smart is an innovative solution addressed to small economic operators who carry ona handicraft or commercial business, individually or family owned, having three employees at the mostand a single site of risk.
A new Earthquake tariff was introduced on 1 October 2014. It is based on the municipal appraisal of the risk and introduces a considerable reduction in rates currently in use for 80% of Italy. The tariff intervention was applied to the products that already include the Earthquake tariff.
Activities to impede and prevent insurance fraud relating to civil liability deriving from motor vehicle traffic (MV TPL)
Preventing and impeding insurance fraud are consolidated activities and an integral aspect of the company’s core business. The results of these activities not only make positive impacts directly on the financial statements of the Group Companies, but also generate deterrent effects on the proliferation of these offences, with consequent benefits for the customers as well. Decree Law no. 1/2012 envisages that insurance companies are required to provide an estimate of the reduced charges for claims arising from verification of fraud in their Management Report or in the Notes to the Financial Statements annexed to the annual financial statements and to publish it on their websites or using another appropriate form of disclosure. Pursuant to and in accordance with Art. 30, paragraph 2 of Decree Law no. 1/2012, the estimate of the reduction of charges for claims arising from this activity totals about €43m. This estimate is made up of the sum of provisions/forecasts of expense for claims to be investigated for anti-fraud purposes that were settled without follow-up in 2014, regardless of the year when they are generated.
49

Performance of Life Premiums
Life premiums (direct and indirect) amounted to €7,586m (€3,959m at 31/12/2013, and €6,139m on a like-for-like basis), driven mainly by bancassurance companies that totalled €3,855m (+44.3%). The increases recorded are mostly concentrated in class I, which is characterised by insurance products with minimum guaranteed yield.
Direct premiums, which comprise almost all premiums, break down as follows:
Life business direct premium income
Amounts in €m31/12/2014 % comp. 31/12/2013 % comp. % var.
% var. on a
like-for-like
basis
Premiums
I - Whole and term Life insurance 5,016 66.6 2,564 65.5 95.6 34.7
II - Marriage, birth 0 0.0 0 0.0 0.0 0.0
III - Unit-linked/index-linked policies 1,473 19.5 1,062 27.1 38.7 38.6
IV - Health 1 0.0 1 0.0 57.2 21.8
V - Capitalisation insurance 576 7.6 287 7.3 100.5 -35.3
VI - Pension funds 469 6.2 0 0.0 0.0 17.8
Total Life business premium income 7,535 100.0 3,914 100.0 92.5 24.0
Investment products
I - Whole and term Life insurance 0 0.0 0 0.0 0.0 0.0
III - Unit-linked/index-linked policies 8 15.9 10 21.6 -17.2 -33.3
V - Capitalisation insurance 0 0.0 0 0.0 0.0 n.s.
VI - Pension funds 42 84.1 35 78.4 20.9 -12.7
Total Life investment products 50 100.0 44 100.0 12.7 -18.4
Total premium income
I - Whole and term Life insurance 5,016 66.1 2,564 64.8 95.6 34.7
II - Marriage, birth 0 0.0 0 0.0 0.0 0.0
III - Unit-linked/index-linked policies 1,481 19.5 1,072 27.1 38.2 37.8
IV - Health 1 0.0 1 0.0 57.2 21.8
V - Capitalisation insurance 576 7.6 287 7.3 100.5 -35.4
VI - Pension funds 511 6.7 35 0.9 n.s. 14.5
Total Life business direct premium income 7,584 100.0 3,958 100.0 91.6 23.6
New business in terms of APE, net of non-controlling interests, amounted to €643m at 31 December 2014 (€286m at 31/12/2013 and €554m on a like-for-like basis).
50

Performance of the main Group companies at 31 December 2014 is summarised in the following table:
Amounts in €mInvestments Gross Technical
Provisions
LIFE INSURANCE SECTORUNIPOLSAI ASSICURAZIONI SpA 3,655 7.9% 31,103 27,653BIM VITA SpA 186 40.7% 700 653POPOLARE VITA SpA 2,981 88.3% 8,245 7,745THE LAWRENCE LIFE ASS. CO Ltd 682 -28.3% 3,168 3,152
Premiums written
Variation
UnipolSai collected a total of direct premiums amounting to €3,653m (€3,384m at 31/12/2013, +8.0%) to which financial products amounting to €43m (€54m at 31/12/2013, -20.0%) are added. As in previous years, the traditional class I and V policies make a predominant impact on the total premiums of the individual segment, once again showing the preference of customers for products offering financial protection such as the revaluable products. Marketing of the first products standardised for all sales divisions kicked off in 2014. They have substantially fewer financial guarantees than those previously sold by the pre-Merger network of Companies.
Popolare Vita recorded a profit of €85.8m at the end of 2014 (€127.8m at 31/12/2013), of which €11.8m came from the valuation of the subsidiary Lawrence Life (€13.7m at 31/12/2013). Gross premiums written amounted to €2,981m (€1,583m at 31/12/2013). The volume of total investments (Non-Life and Life sectors) reached the amount of €8,249m (€6,765m at 31/12/2013), of which €83.7m referred to the value of interest in Lawrence Life (€122.2m at 31/12/2013).
Lawrence Life recorded a profit of €11.8m at the end of 2014 (€13.7m at 31/12/2013). Gross premiums written amounted to €681.9m (€950.6m at 31/12/2013), almost entirely referring to insurance contracts. The volume of total investments reached the amount of €3,168m (€3,124m at 31/12/2013).
BIM Vita recorded a profit of €1.6m at the end of 2014 (€0.7m at 31/12/2013). Gross premiums written amounted to €185.7m (€132m at 31/12/2013). The volume of total investments reached the amount of €699.6m (€567.3m at 31/12/2013).
Pension Funds
The UnipolSai Group retained its leading position in the supplementary pension market, despite a difficult competitive context.
The UnipolSai Group managed a total of 21 Occupational Pension Fund mandates at 31 December 2014 (13 of them for accounts “with guaranteed capital and/or minimum return”). In 2014 three mandates (of which one guaranteed) were sold and the mandate of the Fondinps pension fund was purchased. On the same date resources under management totalled €3,719m (€2,671m with guaranteed capital). At 31 December 2013, it managed a total of 23 mandates (13 of them for accounts “with guaranteed capital and/or minimum return”) and total resources managed came to €3,681m (of which €2,269m with guaranteed capital).
The UnipolSai Group managed 8 Open-Ended Pension Funds (Unipol Insieme, Unipol Previdenza, Conto Previdenza, Fondiaria Previdente, Fondo Pensione Aperto Sai, Fondo Pensione Aperto Milano Assicurazioni, Fondo Pensione Aperto Popolare Vita and Fondo Pensione Aperto BIM Vita) that at 31 December 2014
51

amounted to a total of 45,157 members for total assets of €802m. At 31 December 2013, there were 8 Open-Ended Pension Funds for total assets of €723m and total member numbers of 45,533.
New products
With reference to UnipolSai, marketing of the first products standardised for all sales divisions kicked off in the first half of 2014. They have substantially fewer financial guarantees than those previously sold by the network of Companies falling within the merger perimeter. In April “UnipolSai Investimento MIX 4”, a single premium investment product with revaluable services linked to the yield of four separately managed accounts, was put on the market. At the end of May “UnipolSai Investimento Flex”, a single premium investment product, was put on the market. It offers the possibility of additional payments and features a decreasing loading as the accumulation of premiums rises. “UnipolSai Investimento Free” and “UnipolSai Risparmio Protetto” were marketed at the same time. They are mixed savings products with single premium and constant annual premium, respectively.
Marketing of new standardised products continued during the third quarter. Specifically, in September five new products were put on the market, maintaining the primary objective of standardising the sales catalogue for all divisions. The first product marketed was “UnipolSai Risparmio Attivo”, a full lifetime event of death product with single recurring premiums and possibility of additional payments. ”UnipolSai Risparmio Giovane” was later put on the market. It is a school contingency product with fixed term and constant annual premium that features a final bonus of benefits and exemption from payment of premiums in the event of death or disability of the relative-policyholder.
Afterwards a deferred capital insurance policy with annual revaluation of the principal with constant annual premium bonus and return of premiums, “UnipolSai Risparmio Bonus”, was marketed. It is characterised at maturity by a guaranteed coefficient of life annuity with return of premiums. At the end of the third quarter two single premium individual capitalisation products were introduced. The first, “UnipolSai Investimento Capital One”, features the presence of a loading on the paid-in premium, and the second, “UnipolSai Investimento Capital Top”, is characterised by a higher level of penalisation in the event of early surrender of the contract.
Finally, starting from November 2014 the range of products standardised for all UnipolSai divisions was put on the market, “UnipolSai Vita Smart” e “UnipolSai Vita”, offering temporary coverage in the event of death, with constant principal and annual premium.
52

Reinsurance
Indirect business
Indirect Non-Life and Life premiums amounted to €29m at 31 December 2014 (€4m in 2013, €39m on a like-for-like basis) and was made up of €28m of premiums from Non-Life business (€3m in 2013 and €37m on a like-for-like basis) and €1m from Life business (€1m at 31/12/2013, €2m on a like-for-like basis).
Indirect business
Amounts in €m
31/12/2014 % comp. 31/12/2013 % comp. % var.
% var. on a
like-for-like
basis
Non-Life premiums 28 95.1 3 86.2 n.s. -24.7
Life premiums 1 4.9 1 13.8 n.s. -17.1
Total indirect premiums 29 100.0 4 100.0 n.s. -24.4
Reinsurance ceded
Group premiums ceded totalled €434m (€327m in 2013, €425m on a like-for-like basis), €420m of which came from Non-Life premiums ceded (€319m in 2013, €410m on a like-for-like basis) and €14m from Life premiums ceded (€8m at 31/12/2013 and €15m on a like-for-like basis).
Premiums ceded
Amounts in €m
31/12/2014 % comp. 31/12/2013 % comp. % var.
%
var. on a like-
for-like basis
Non-Life premiums 420 96.8 319 97.7 31.6 2.5
Retention ratio - Non-Life business (%) 95.0% 94.5%
Life premiums 14 3.2 8 2.3 87.6 -7.1
Retention ratio - Life business (%) 99.8% 99.8%
Total premiums ceded 434 100.0 327 100.0 32.9 2.2
Overall retention ratio (%) 97.3% 96.6%
The retention ratio is the ratio of premiums retained (total direct and indirect premiums net of premiums ceded) to total direct and indirect premiums. Investment products are not included in calculating this ratio.
At 31 December 2014, the technical result of Non-Life premiums ceded was positive for reinsurers, while the technical result of Life premiums ceded was basically break-even.
UnipolSai Group reinsurance policy
As regards the risks underwritten in the Non-Life classes, the reinsurance strategy of the new Group focused, since 2013, on developing synergies and economies of scales by acquiring standard insurance coverage for all companies in Group. This process was further developed with the renewal of the treaties for 2014, by obtaining not only an increase in overall capacities, but also a reasonable cost saving.
53

The following Group cover was negotiated and acquired:
- excess of loss treaties for the protection of MV TPL, General TPL, Fire (by risk and by event), Theft and Accident, Aviation classes (Aircraft / Aircraft TPL) portfolios;
- stop loss treaty for the Hail class; - proportional treaties for risks in the technological sector (C.A.R. - Contractors’ All Risks-, Erection all Risks
and Decennale Postuma - Ten-year Building Guarantee), for “D&O” policies in the TPL sector and for new “multi-risk” policies underwritten in the Hail class.
Therefore, there are still separate insurance policies for the Unipol Assicurazioni Division and for the former Fondiaria-SAI Group Division in the Credit and Bonds classes, protected with proportional treaties. In addition, for the Transport class, the renewal of the excess of loss treaty due to expire was negotiated for the former Unipol Assicurazioni Division, while the former Fondiaria-SAI Group Divisions continue to cede on a proportional basis to SIAT, the Group’s specialist company. Lastly, the policies of the Assistance and Legal Expenses classes were ceded by each of the Divisions to specialised reinsurers and/or specialist Group companies.
In order to minimise the counterparty risk, reinsurance continues to be fragmented and placed with leading professional reinsurers rated very sound financially by the main rating agencies, for the purposes of a comprehensive and competitive service.
As regards the risks underwritten in the Life classes, the reinsurance strategy involves the same forms of cover as 2013. In particular, the former Unipol Assicurazioni Division continues to protect itself with automatic proportional types of cover by directly addressing the market, while the former Fondiaria-SAI Group Division continues to cede on a proportional basis to the company UnipolRe (formerly Lawrence Re), which in turn is protected on the market with non-proportional retrocessions in the form of excess of loss and stop loss.
54

Real Estate Sector
In 2014 simplification of the corporate structure of the real estate sector got underway as approved by the Boards of Directors of UGF and UnipolSai in June 2014. This transaction involved: (i) a planned merger by incorporation into Immobiliare Fondiaria-Sai, which at the same time changed the
company name into UnipolSai Real Estate Srl, of the subsidiaries Immobiliare Milano Assicurazioni, IN.V.ED, Mizar, R.EDIL.MO., Bramante, Cascine Trenno, Trenno Ovest, IAT, Meridiano Bellarmino, Immobiliare Litorella, Meridiano Bruzzano, Meridiano Aurora, Campo Carlo Magno, Sintesi Seconda, Stimma, UnipolSai Servizi Immobiliari, International Strategy and Unifimm;
(ii) another simplification project with absorption of the subsidiaries Covent Garden and Comsider into the subsidiary Midi S.r.l.
The Boards of Directors and Shareholders’ Meetings of all of the real estate companies involved approved the planned mergers in September, which were concluded in November/December with accounting taking effect on 1 January 2014.
In 2014, disposal of a portion of the portfolio continued through a series of transactions involving properties held for sale in fractions, individual properties located throughout Italy and buildings. The most significant disposal of this transaction was the property located in Milan at viale Boezio no. 20, accommodation facilities closed since 2009. In terms of operations aimed at optimising properties’ profitability, design activities commenced concerning some of the properties that will undergo renovation works. Among the most significant transactions, of note is the upcoming enhancement project on the property located in Assago, Milanofiori - Street 6 - Building A, aimed at leasing the entire property to leading leaseholders. In relation to the renovation and enhancement of the building located in Milan, via Fara 41 (“Torre Galfa”), completely vacant since 2001, note that in 2014 a lease agreement with a primary international hotel operator regarding the portion of property with future receptive use was completed and the step to apply for permits started. Investments continued, through some Group companies, for the creation of the real estate development project in the area known as “Porta Nuova” in Milan, structured into the independent projects Porta Nuova Garibaldi, Porta Nuova Varesine and Porta Nuova Isola. In relation to the area in Milan in via Melchiorre Gioia at the corner of via Don Sturzo, owned by the Group, with an urban redevelopment zone known as “Porta Nuova Garibaldi”, preliminary design activities are underway for the construction of a new multi-storey building. Works on the hotel facility in Bologna at via Larga were completed and opened for business in April.
In July the subsidiary Marina di Loano repaid the residual debt of €48m on the bank loan granted in 2009. In order to meet this commitment, the company used, for €44m, a loan originally granted by UnipolSai that was then transferred to UnipolSai Finance as part of a transaction to reallocate financial credit and debit relations within the Group.
55

The key financial data for the Real Estate sector are summarised below:
Income Statement - Real Estate Sector
Amounts in €m 31/12/2014 31/12/2013 % var.
% var. on a
like-for-like
basis
1.3 Gains (losses) on financial instruments at fair value through profit or loss -1 -2 -41.0 -41.0
1.5 Gains on other financial instruments and investment property 75 49 54.7 33.4
1.6 Other revenue 41 22 86.4 4.1
Total revenue and income 115 69 66.9 22.5
2.3 Losses on investments in subsidiaries, associates and interests in joint ventures -3 0 n.s. n.s.
2.4 Losses on other financial instruments and investment property -106 -77 38.0 21.0
2.5 Operating expenses -10 0 n.s. 25.1
2.6 Other costs -70 -43 62.9 48.2
2 Total costs and expenses -189 -120 56.9 31.9
Pre-tax profit (loss) for the year -74 -51 43.6 50.0
The pre-tax result at 31 December 2014 was a loss of €74m (-€51m at 31/12/2013 and -€49m on a like-for-like basis), after having effected property write-downs of €68m and depreciation of investment property and other tangible assets for €33m.
Investments and cash and cash equivalents of the real estate sector (including instrumental properties for own use) totalled €1,858m at 31 December 2014 (€1,437m at 31/12/2013 and €1,912m on a like-for-like basis), consisting mainly of investment property and properties for own use amounting to €1,640m (€1,262m at 31/12/2013, €1,718m on a like-for-like basis).
Financial liabilities amounted to €164m at 31 December 2014 (€172m at 31/12/2013 and €175m on a like-for-like basis).
56

Other Businesses Sector
Redevelopment and commercial development actions of the diversified companies started in 2013 continued in 2014. The actions carried out are starting to have positive effects on the results of the companies, which although negative, have sharply improved compared to the same date of the previous year.
In the hotels segment, although Atahotels reported a loss (-€9m), its result definitely improved in comparison with the same period of 2013 (-€23m). Extraordinary and non-recurring components regarding tax liabilities and building amnesties also made a negative impact for a total of €2m on the result, which benefits from the rationalisation initiatives already implemented. Note that in September an agreement was signed between Atahotels and the Chinese company BTG-Jianguo Hotels & Resort, belonging to the Beijing Tourism Group, the primary Chinese tourist operator that, among other activities also manages over 2,000 accommodation facilities in China. The agreement sets out to intercept a broad share of Chinese tourists expected to come to Italy for Expo 2015 and to define a cross training programme between the two hotel chains focussing on cuisine and the cultural training of staff.
As for the medical clinics, Centro Oncologico Fiorentino reported a €13m loss (-€12m in 2013) after having absorbed extraordinary expenses amounting to €3m due to the write-down of real estate assets owned by the company. With regard to ordinary operations, a considerable increase in non-region sales and the introduction of several production cost monitoring measures are reported. These measures, also thanks to a new internal organisation, produced the first positive effects in terms of cost savings and an increase in structures’ efficiency. Despite the improvements achieved in ordinary operations, the company still has an unbalanced costs/revenue structure not remediable in the short term. In order to allow it to pursue its business, during the year the holding company UnipolSai resolved an operation to strengthen equity through a shareholders payment of €13.5m into the equity account. It was paid in the month of September. The loss of Villa Donatello, amounting to €3m due to extraordinary provisions totalling €2m and that includes the results of Donatello Day Surgery (company placed into liquidation at the start of 2014 and whose activities, primarily ophthalmology, were transferred to Villa Donatello) improved from result of 2013 (-€9m).
With regard to the result of the agricultural activities, it improved compared to the previous year, although negative. In fact, the result of the company Tenute Del Cerro (former Saiagricola) went from -€11m at 31 December 2013 to -€1m at 31 December 2014. The 31 December 2014 figure recorded increased value of production (+55 compared to 2013) and reduced industrial costs (-13%). The result was negatively impacted by the financial expenses relating to the contracting of a loan originally granted by UnipolSai (now transferred to UnipolSai Finance) at the end of 2013 under market conditions, to purchase the land of Tenuta del Cerro, previously rented. Important agreements were signed in 2014 with a primary French large-scale retail chain and with the Chinese hotel group Beijing Tourism Group, former Atahotels partner, which will produce the first results in 2015. ________________________________________________________________________________________
57

The key income statement figures regarding the Other Businesses sector are provided below:
Income Statement - Other Businesses
Amounts in €m 31/12/2014 31/12/2013 % var.
% var. on a
like-for-like
basis
1.2 Commission income 11 19 -40.4 -40.9
1.3 Gains (losses) on financial instruments at fair value through profit or loss 0 1 -58.0 -84.3
1.5 Gains on other financial instruments and investment property 57 64 -11.4 -11.6
1.6 Other revenue 307 634 -51.6 -51.7
Total revenue and income 375 718 -47.8 -47.9
2.2 Commission expense -4 -6 -33.7 -33.7
2.3 Losses on investments in subsidiaries, associates and interests in joint ventures 0 -2 -95.6 -95.2
2.4 Losses on other financial instruments and investment property -14 -21 -34.1 -52.2
2.5 Operating expenses -66 -313 -78.9 -79.3
2.6 Other costs -288 -427 -32.6 -33.1
2 Total costs and expenses -371 -768 -51.6 -52.7
Pre-tax profit (loss) for the year 4 -50 n.s. n.s.
The pre-tax result at 31 December 2014 was a profit of €4m (-€50m at 31/12/2013 and -€65m on a like-for-like basis). The sector benefited from the pre-tax profit realised by Banca Sai at 30 September 2014 (and by its subsidiary Finitalia) amounting to €28m. On 3 November 2014 the merger of Banca Sai, a 100% subsidiary of UnipolSai, into the investee Unipol Banca became effective, consolidated with the equity method.
The items Other revenue and Other costs include revenue and costs for services provided to Group companies belonging to other sectors, eliminated during the consolidation process. Note that the employees of the Gruppo Fondiaria SAI Services Scrl consortium were taken on in UnipolSai starting in 2014.
At 31 December 2014, Investments and cash and cash equivalents of the Other Businesses Sector (including properties for own use totalling €126m) amounted to €481m (€1,522m at 31/12/2013, €1,564m on a like-for-like basis). The change is due to the deconsolidation of Banca Sai (absorbed into Unipol Banca, an associate measured with the equity method, during the year) and its subsidiary Finitalia.
Financial liabilities amounted to €94m (€915m at 31/12/2013 and €1,363m on a like-for-like basis; this latter figure includes €379m of payables to banks of the former Premafin today incorporated in UnipolSai and attributed to the Non-Life sector).
58

Asset and financial management
Investments and cash and cash equivalents
Transactions carried out in 2014
In 2014, the investment policies implemented in the finance area adhered, in terms of medium/long-term investments, to the general criteria of prudence and of preserving asset quality consistent with the Guidelines defined in the Investment Policy. The objectives were achieved through: activities carried out in compliance with the instructions defined during the meetings of the Group’s
Investments Committee and the Financial Investments Committees, by availing themselves of the analyses conducted by the competent departments;
transactions geared towards reaching profitability targets consistent with the asset return profile and with the trend in liabilities over the long-term.
The guideline for the development of investment activities was maintaining a high standard of portfolio quality through a process for the selection of issuers based on the criteria of issuer diversification and strength, placing particular attention on the liquidity profile.
The main object of the transactions was the bond segment, for the most part involving the non-government issues and, to a lesser extent and specifically in the Life segment, government bonds. During 2014 the increased exposure in government bonds, mostly issued by the Italian Treasury, amounted to €311m. In the course of the period, the net balance of Government bonds was positive on the Life segment (€1,298m), whereas it was negative on the Non-Life segment, where the decrease amounted to €987m. Purchases on the Life portfolio involved mainly fixed rate securities, and were useful to meet the ALM requirements of the Segregated Funds, continuing the rationalisation of the maturity dates of liabilities with covering assets. This activity, carried out on the basis of the contractual commitments and the goals of the Business Plan, was also implemented by using zero coupon type government bonds, primarily BTP (Long-Term Treasury Bond) strips and to a lesser extent Spanish bonds, which allow the protection of minimum guaranteed returns and of the coupon reinvestment risk in a deflationary macroeconomic scenario marked by low interest rates. A swap to cover the risk of rising interest rates was also concluded on the Life portfolio for the nominal value of €160m. The aim of this transaction was to bring the durations of the assets and liabilities in the Separately Managed Accounts involved in the macroeconomic context just described back into line. In the Non-Life sector, whereas there was a net reduction in the exposure to nominal Government bonds, exposure to Italian government bonds linked to European inflation increased, with purchases spread over varying maturities, thus benefiting from the high returns offered by this segment. Furthermore, coverage strategies were implemented on government bonds. They were aimed at reducing the concentration on Italian government bonds and came to a value of roughly €1,700. Net of this transaction, at 31 December 2014 the reduced exposure to Italian government bonds was €2,690m.
The non-government component of bond securities saw an overall exposure of €1,660m, with increased exposure mostly concerning financial issuers and, to a marginal extent, industrial issuers. The Non-Life business transactions for the most part involved financial subordinated and hybrid industrial securities, while the purchases of Lower Tier 2 senior or subordinated securities prevailed in the Life business. On the whole, net exposure to subordinated securities increased by €1,589m.
59

Asset portfolio simplification activities continued during the period. Level 2 and 3 structured bonds saw an overall reduction of €1,903m. The following table gives the exposure in structured Group securities:
Amounts in €mCarrying
amount
Market
valueImplied +/-
Carrying
amount
Market
valueImplied +/-
Simple structured securities (1) 912 825 -87 1,940 1,749 -191
Complex structured securities (2) 388 393 5 517 491 -27
Other securities with plain vanilla pay-off (SPV, CLN and CMS) 4,289 4,463 174 3,543 3,587 44
Total structured securities 5,589 5,681 93 6,000 5,826 -174
of which levels 2 and 3 2,276 2,200 -75 4,179 3,834 -345
31/12/2014 31/12/2013 on a like-for-like basis
(1) Bonds with returns linked to floating rates (predominantly Libor rates or constant maturity swap rates) with cap or floor options are considered simple structured financial instruments. These securities generally have an adequate degree of liquidity for being sold in the short-term. (2) Bonds with returns linked predominantly either to the volatility of market interest rates and the gradient and level of the interest rate curve or credit risk are considered complex structured financial instruments. These securities generally do not have an adequate degree of liquidity for being sold in the short-term.
Share exposure increased in 2014 by €150m. Transactions were broken down based on individual shares and ETF (Exchange Traded Funds), representing share indexes. A put option was purchased against this increase for hedging purposes on the stock market on the Eurostoxx 50 index with strike price 2400 and expiry date in January 2016. The value hedged by the option is about €760m. The portfolio contained bonds with a good scope for future profits and a high profit flow. Almost all equity instruments in the portfolio belong to the main European share indexes.
Exposure to alternative funds, a category that includes Private Equity Funds and Hedge Funds, amounted to €383m, up by €162m during the year. The transaction involved subscriptions of Hedge funds for €245m and sales for about €54m. The new funds selected mainly comply with the criteria of the European UCITS IV directive. Exposure to the Private Equity segment, amounting to €104m, contracted as a result of redemptions amounting to approximately €29m. A commitment to participate in a new fund launched by a manager already in the portfolio for €20m was communicated. The effect of this commitment will surface starting from 2015 and in the coming years.
Currency operations were conducted exclusively to hedge the currency risk of outstanding equity and bond positions.
The overall Group insurance portfolio duration stood at 5.22 years (3.16 years in the Non-Life segment and 6.12 years in the Life segment). The fixed rate and floating rate components of the bond portfolio remained stood at 81.4% and 18.6% respectively. The government component accounted for approximately 78.6% of the bond portfolio whilst the corporate component accounted for the remaining 21.4%, split into 16.2% financial and 5.2% industrial credit. Italian government bonds accounted for 72.7% of the total bond portfolio.
A total of 92.9% of the bond portfolio is invested in with a rating higher than BBB-: 3.3% of the total was between AAA and AA-, whilst 5.9% was rated A. The exposure to securities with a BBB rating was 83.7%:
60

At 31 December 2014, Group Investments and cash and cash equivalents totalled €62,878m (€35,359m at 31/12/2013 and €58,664m on a like-for-like basis), with the following breakdown according to type of business: Investments and cash and cash equivalents - Breakdown by business segment
Amounts in €m31/12/2014 % comp. 31/12/2013 % comp. % var.
% var. on a
like-for-like
basisInsurance 60,844 96.8 33,231 94.0 83.1 8.5
Other Businesses 481 0.8 1,522 4.3 -68.4 -69.3
Real Estate 1,858 3.0 1,437 4.1 29.3 -2.8
Intersegment eliminations -304 -0.5 -831 -2.4 -63.4 -65.3
Total investments and cash and cash equivalents (*) 62,878 100.0 35,359 100.0 77.8 7.2
(*) Including properties for own use. The breakdown by investment category is as follows: Investments and cash and cash equivalentsValori in Milioni di Euro
Amounts in €m
31/12/2014 % comp. 31/12/2013 % comp. % var.
% var. on a
like-for-like
basis
Property (*) 3,896 6.2 3,041 8.6 28.1 -3.3
Investments in subsidiaries, associates and interests in joint
ventures 608 1.0 159 0.5 n.s. 26.7
Held-to-maturity investments 1,420 2.3 626 1.8 n.s. -32.8
Loans and receivables 5,169 8.2 2,747 7.8 88.2 -23.1
Debt securities 4,215 6.7 1,637 4.6 n.s. -17.3
Loans and receivables from bank customers 0 0.0 460 1.3 -100.0 -100.0
Interbank loans and receivables 0 0.0 1 0.0 n.s. n.s.
Deposits with ceding companies 31 0.0 19 0.1 61.6 -12.8
Other loans and receivables 924 1.5 629 1.8 46.8 -18.3
Available-for-sale financial assets 42,114 67.0 22,656 64.1 85.9 20.7
Financial assets at fair value through profit or loss 8,986 14.3 5,531 15.6 62.5 2.4
held for trading 348 0.6 101 0.3 n.s. -10.6
at fair value through profit or loss 8,639 13.7 5,429 15.4 59.1 3.0
Cash and cash equivalents 684 1.1 599 1.7 14.3 -58.0
Total investments and cash and cash equivalents 62,878 100.0 35,359 100.0 77.8 7.2
(*) Including properties for own use.
61

Net gains on investments and financial income The breakdown of net gains (losses) on investments and financial income and charges is shown in the table below: Net investment income(amounts in €)
Amounts in €m
31/12/2014 % comp. 31/12/2013 % comp. % var.
% var. on a
like-for-like
basis
Investment property -95 -5.0 -76 -6.2 24.8 20.6
Gains/losses on investments in subsidiaries and associates and interests in joint ventures -19 -1.0 6 0.5 n.s. n.s.
Net gains on held-to-maturity investments 67 3.5 17 1.4 n.s. -13.6
Net gains on loans and receivables 132 6.9 106 8.7 24.4 -41.6
Net gains on available-for-sale financial assets 2,180 113.8 1,194 98.0 82.5 27.5
Net gains on held-for-trading financial assets and at fair value through profit or loss (*) -356 -18.6 -38 -3.1 n.s. n.s.
Balance on cash and cash equivalents 6 0.3 9 0.7 -32.9 -37.6
Total net gains on financial assets, cash and cash equivalents 1,915 100.0 1,218 100.0 57.2 -3.2
Net losses on held-for-trading financial liabilities and at fair value through profit or loss (*) 7 0 2218.2 -55.4
Net losses on other financial liabilities -138 -60 129.7 34.5
Total net losses on financial liabilities -131 -60 119.2 50.7
Total net gains (*) 1,784 1,159 54.0 -5.7
Net gains on financial assets at fair value (**) 459 197
Net losses on financial liabilities at fair value (**) -38 0
Total net gains on financial instruments at fair value (**) 421 197 113.6 43.6Total net gains on investments and net financial income 2,205 1,356 62.6 0.9
(*) excluding net gains and losses on financial instruments at fair value through profit or loss for which investment risk is borne by customers (index- and unit-linked) and arising from pension fund management (**) net gains and losses on financial instruments at fair value through profit or loss with investment risk borne by customers (index- and unit-linked) and arising from pension fund management At 31 December 2014, the following impairment losses on financial instruments classified in the available-for-sale asset category for €15m (€20m at 31/12/2013, €45m on a like-for-like basis) and write-downs on investment property for €113m (€56m at 31/12/2013 and €59m on a like-for-like basis).
62

Shareholders' equity Shareholders’ equity, excluding non-controlling interests, breaks down as follows:
Amounts in €m
31/12/2014 31/12/2013variation in
amount
variation in
amount on a
like-for-like
basisShare capital 1,996 1,195 802
Other equity instruments 110 0 110
Capital reserves 248 199 49
Income-related and other equity reserves 2,063 116 1,947
(Treasury shares) -50 0 -49
Reserve for foreign currency translation differences 4 5 -1
Gains/losses on available-for-sale financial assets 1,169 497 672
Other gains and losses recognised directly in equity 15 26 -11
Profit (loss) for the year 740 288 451
Total shareholders' equity attributable to the owners of the Parent 6,295 2,325 3,970 1,085 Movements in shareholders’ equity recognised during the year with respect to 31 December 2013 are set out in the attached statement of changes in shareholders’ equity. The main changes in the year in Shareholders' equity attributable to the owners of the Parent, on a like-for-like basis, were as follows: decrease due to dividend distribution for €565m; an increase as a result of the increase in the provision for gains and losses on available-for-sale financial
assets, net of both the related tax liabilities and the part attributable to the policyholders and charged to insurance liabilities for €674m;
an increase of €187m deriving from the combined effect of the component attributable to equity instrument of the convertible loan issued by UnipolSai and the subsequent conversion on 5 May of 675 bonds subscribed by UGF;
change of €740m for Group profit of the period. Treasury shares and shares of the holding company At 31 December 2014, UnipolSai held a total of 53,549,686 ordinary treasury shares, of which 725,620 directly and 52,824,066 indirectly through the subsidiaries UnipolSai Finance (38,454,775), UnipolSai Nederland (9,443,258), SAI Holding (3,225,720), Sainternational (1,254,300), Pronto Assistance (344,313) and Popolare Vita (101,700). At 31 December 2014 UnipolSai held a total of 3,175,902 ordinary shares issued by the holding company Unipol Gruppo Finanziario SpA. During the year 3,029,024 ordinary shares were purchased to implement the programme for the purchase of shares of the holding company, in the service of compensation plans based on financial instruments (performance share type), intended for the managers of the Companies, who were also assigned 68,112 ordinary shares as part of the above-mentioned financial instrument-based compensation plan. The UnipolSai Group held no shares issued by the indirect holding company Finsoe SpA at year-end.
63
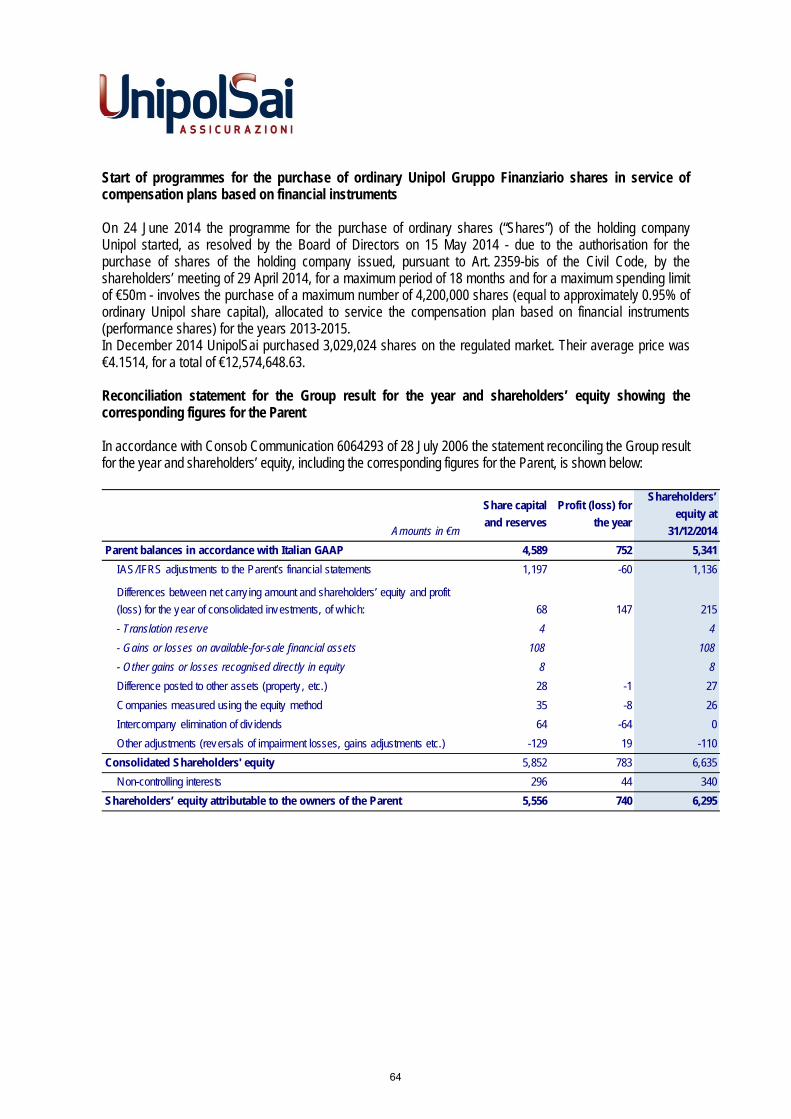
Start of programmes for the purchase of ordinary Unipol Gruppo Finanziario shares in service of compensation plans based on financial instruments
On 24 June 2014 the programme for the purchase of ordinary shares (“Shares”) of the holding company Unipol started, as resolved by the Board of Directors on 15 May 2014 - due to the authorisation for the purchase of shares of the holding company issued, pursuant to Art. 2359-bis of the Civil Code, by the shareholders’ meeting of 29 April 2014, for a maximum period of 18 months and for a maximum spending limit of €50m - involves the purchase of a maximum number of 4,200,000 shares (equal to approximately 0.95% of ordinary Unipol share capital), allocated to service the compensation plan based on financial instruments (performance shares) for the years 2013-2015. In December 2014 UnipolSai purchased 3,029,024 shares on the regulated market. Their average price was €4.1514, for a total of €12,574,648.63.
Reconciliation statement for the Group result for the year and shareholders’ equity showing the corresponding figures for the Parent
In accordance with Consob Communication 6064293 of 28 July 2006 the statement reconciling the Group result for the year and shareholders’ equity, including the corresponding figures for the Parent, is shown below:
Amounts in €m
Share capital
and reserves
Profit (loss) for
the year
Shareholders’
equity at
31/12/2014
Parent balances in accordance with Italian GAAP 4,589 752 5,341
IAS/IFRS adjustments to the Parent’s financial statements 1,197 -60 1,136
Differences between net carry ing amount and shareholders’ equity and profit
(loss) for the year of consolidated investments, of which: 68 147 215
- Translation reserve 4 4
- Gains or losses on available-for-sale financial assets 108 108
- Other gains or losses recognised directly in equity 8 8
Difference posted to other assets (property , etc.) 28 -1 27
Companies measured using the equity method 35 -8 26
Intercompany elimination of div idends 64 -64 0
Other adjustments (reversals of impairment losses, gains adjustments etc.) -129 19 -110
Consolidated Shareholders' equity 5,852 783 6,635
Non-controlling interests 296 44 340
Shareholders’ equity attributable to the owners of the Parent 5,556 740 6,295
64
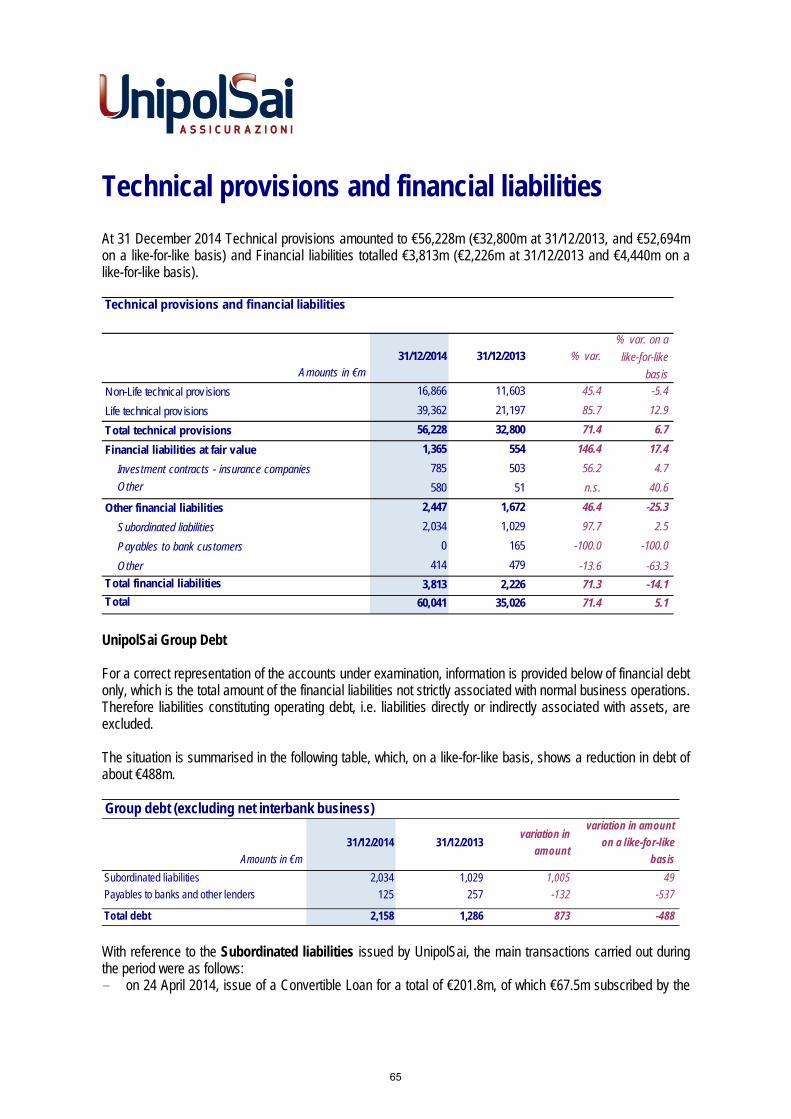
Technical provisions and financial liabilities At 31 December 2014 Technical provisions amounted to €56,228m (€32,800m at 31/12/2013, and €52,694m on a like-for-like basis) and Financial liabilities totalled €3,813m (€2,226m at 31/12/2013 and €4,440m on a like-for-like basis). Technical provisions and financial liabilitiesValori in Milioni di Euro
Amounts in €m31/12/2014 31/12/2013 % var.
% var. on a
like-for-like
basis
Non-Life technical prov isions 16,866 11,603 45.4 -5.4
Life technical prov isions 39,362 21,197 85.7 12.9
Total technical provisions 56,228 32,800 71.4 6.7
Financial liabilities at fair value 1,365 554 146.4 17.4
Investment contracts - insurance companies 785 503 56.2 4.7
Other 580 51 n.s. 40.6
Other financial liabilities 2,447 1,672 46.4 -25.3
Subordinated liabilities 2,034 1,029 97.7 2.5
Payables to bank customers 0 165 -100.0 -100.0
Other 414 479 -13.6 -63.3
Total financial liabilities 3,813 2,226 71.3 -14.1
Total 60,041 35,026 71.4 5.1 UnipolSai Group Debt For a correct representation of the accounts under examination, information is provided below of financial debt only, which is the total amount of the financial liabilities not strictly associated with normal business operations. Therefore liabilities constituting operating debt, i.e. liabilities directly or indirectly associated with assets, are excluded. The situation is summarised in the following table, which, on a like-for-like basis, shows a reduction in debt of about €488m. Group debt (excluding net interbank business)
Amounts in €m
31/12/2014 31/12/2013variation in
amount
variation in amount
on a like-for-like
basis
Subordinated liabilities 2,034 1,029 1,005 49
Payables to banks and other lenders 125 257 -132 -537
Total debt 2,158 1,286 873 -488 With reference to the Subordinated liabilities issued by UnipolSai, the main transactions carried out during the period were as follows: - on 24 April 2014, issue of a Convertible Loan for a total of €201.8m, of which €67.5m subscribed by the
65

holding company Unipol and converted into shares on 22 May 2014. Pursuant to IAS 32.15, the loan was recognised upon issue to increase Shareholders’ Equity for its component attributable to instruments representing share capital, equal to an amount of €180.2m. The remainder, recognised under Financial Liabilities, had a residual value at 31 December 2014 of €9.6m, reduced owing to payment of the coupons due on the loan;
- on 18 June 2014, issue of a subordinated bond with indefinite maturity for a total nominal amount of €750m, with the simultaneous early repayment of subordinated loans with indefinite maturity disbursed in the past from Mediobanca to Fondiaria-SAI (now UnipolSai) and to merged entities Milano Assicurazioni and Unipol Assicurazioni for a total amount of €750m.
In application of the contractual clauses, on 11 September 2014 UnipolSai and Mediobanca signed an agreement to amend some Loan Agreements covering medium-term subordinated loans amounting to €700m. This agreement provides for the amendment of several economic terms, including payment by way of compromise, of an annual indemnity equal to €71.5 basis points, in the form of spread in addition to that originally provided for in the Loan Agreements, thereby raising the total spread from 180 to 251.5 basis points. Please note that the additional cost for 2014 was €5m. Payables to banks and other lenders, totalling €125m, include €111m (unchanged compared to 31/12/2013) referring to the loan stipulated by the Tikal R.E. Closed Real Estate Fund with Mediobanca as Agent Bank. The loan, originally for €119m, was granted for the purchase of property and improvements. Since 2008, the Fund has made use of interest rate derivatives in implementation of a policy hedging the potential risk of an increase in interest rates on the loan taken out. Reduction of the debt is mainly due to the following transactions: - extinction for €379m of the former Premafin loan concerning the “Amended Post-Integration Loan
Agreement” (€340m), the “GE Capital Agreement” (€39m), transactions planned from the start as part of the Merger and included in the rescheduling plan for Premafin debt entered into with the lending banks, subject to the effectiveness of the Merger. Specifically: on 24 April 2014 €202m were repaid, with the concomitant issue of a convertible loan of the same
amount; on 7 August 2014 the other €178m were extinguished in advance (of which €138m were to fall due in
2018 and €39m in 2020); - expiry of the loan repurchase agreement of the former Unipol Assicurazioni for approximately €104m; - repayment by Marina di Loano of the loan agreement entered into with Intesa SanPaolo as Agent Bank for
about €48m; - repayment by the former Finadin, today incorporated in UnipolSai Finance (formerly Smallpart) of the two
loan agreements entered into with Banca Popolare di Milano and Banco Popolare for a total carrying amount of about €12m.
66

Other information Human Resources
The total number of employees in the Group at 31 December 2014 was 10,271 (+2,810 compared with 2013, -892 on a like-for-like basis).
Human Resources
31/12/2014 31/12/2013 variation
variation on
a like-for-like
basisTotal number of UnipolSai Group employees 10,271 7,461 2,810 -892
of which on a fixed-term contract 381 338 43 37
Full Time Equivalent - FTE 9,838 7,113 2,725 -826
This includes 111 seasonal staff of Atahotels at 31 December 2014 (72 at 31/12/2013), and foreign company employees (1,408) include 597 agents.
The reduction of 630 employees is due to adherence to the Solidarity Fund pursuant to the trade union agreement of 18 December 2013 and to the Call for Retirement, while 470 employees were transferred to Allianz as part of the disposal of insurance assets of the former Milano Assicurazioni. Employees also entered, for the most part due to mobility within the Unipol Group, of which 245 employees coming from UGF.
The management of human resources based on corporate social responsibility focuses on individuals, paying particular attention not only to them as employees but also to the various requirements of their entire professional lives, by developing, inter alia, supplementary welfare benefits able to adequately meet the new requirements both for products and services. Group company employees, holding managerial and non-managerial functions, can become members of both a Pension Fund and a Welfare Fund. Various funds and assistance schemes are offered simultaneously, based on the sector and company of origin. This commitment is enriched with a constant and continuous activity of offering services supplementing work life, “Noi Unipol”, to support management of the time and resources of those working in the Group.
Social and environmental responsibility
In order to guarantee policy uniformity and consistency, Group sustainability is directly handled by the holding company for all Group companies. The operating structure is made up of the staff reporting to the Chairman to guarantee conformity with the values and completeness of vision on the activities carried out, while the policy function is carried out by the Sustainability Committee of the Board of Directors, which examined and evaluated the path taken throughout the entire year, and issued its judgments on the process adopted and on the main sustainability decisions taken by the Group. The first year of UnipolSai was 2014, and this is why focus was placed on promoting and consolidating the sustainability goals and policies in the new Company by involving the middle management structures as much as possible. Immediately providing UnipolSai with its own Sustainability Report was deemed advisable. It contains descriptions of the insurance business activities, the main economic, environmental and social performance indicators, relations with stakeholders and the performance results attained at 31 December 2014.
67

UnipolSai’s attention to social responsibility starts with the Charter of Values and the Code of Ethics of the Unipol Group, adopted by the Board of Directors, and draws inspiration from the Group’s 2013-2015 Sustainability Plan.
The Plan is divided into 10 Policies, each of which associated with a quantitative objective to be achieved by the end of the Plan, monitored and reported on a half-yearly basis and disclosed to the public through the Group’s sustainability web site. These Policies are essentially made up of 48 actions and over 100 indicators for monitoring progress and efficiency, the result of participation by the working groups responsible for preparing the integration plan, following discussions with the management, all heads of department and Top Managers. The Sustainability Plan was initially approved by the Board of Directors, after which it was presented at six meetings held in the Group’s major cities of operation (in addition to Palermo).
Of the many projects that typified 2014, UnipolSai was a key figure in the activities addressed to the population in terms of education on the identification, management and prevention of risk, with the objective of improving their awareness and knowledge through insurance mechanisms and tools, with particular attention paid to the younger generation. The column Conoscere l’assicurazione was also started with the bi-monthly writing of in-depth articles, in addition to the pilot project on several schools of the educational programme on life situations I casi della vita. An in-depth analysis on the impact of the spread of gambling in the Italian production and cultural fabric was started at the same time.
The sustainability department also performed a support role for company departments in the development of specific projects with a high social or environmental value, in particular:
- the Unipol Climate project, whose objective is to help the Italian population and companies to become more resilient to climate change, by offering the necessary insurance coverage and also assistance services and incentives for good conduct, has been developed. This was the result of the year’s work on a Position Paper on this issue and a three-year plan of action, which reiterate the importance of developing knowledge and awareness in all players and increasing co-responsibility throughout the country;
- the sustainability certification was extended to UnipolSai Life insurance investment products by Bureau Veritas International through set of rules and regulations according to the values of equity, transparency and product value;
- ISO50001 energy certification was obtained on four instrumental properties, and it will gradually be extended to all UnipolSai places of work;
- rating requirements in relation to legal status were introduced to the suppliers register to improve supplier chain monitoring;
- the UnipolIdeas “incubator” project, a platform for promoting entrepreneurship and innovation in young people and all those with ideas and projects for contributing to the country’s sustainable growth, was launched as an open innovation tool for the Group. 2014 saw the launch of a social innovation tender which led to an intensive two-month acceleration for eight start-ups, followed by investment in some of these. At the end of the year the commitment was strengthened with the creation of UnipolSai FutureLab to provide crowdfunding support for innovative start-ups in the fields of mobility, sharing economy, culture and the environment;
- the setup of an Emerging and reputational risks monitor led this year to the identification of materiality issues for the insurance sector and for the Group, through the application of meeting points that were later merged into the materiality matrix;
- the company welfare programme, NoiUnipol, became fully operational in Bologna, which led to the activation of “free time” and family support services for employees to help them best manage their work-life balance, and extension to the other Group offices has begun;
68
- a number of initiatives were organised by the company volunteer groups at the main offices. The main ones were food collections, food parcels in partnership with the Stop Hunger Now association, and participation in the “Puliamo il Mondo” initiative with Legambiente.
Group sales network At 31 December 2014 3,595 agencies were operational (at 31/12/2013 there were 4,449 agencies, of which 1,412 of the former Unipol Assicurazioni and 3,037 of the former Fondiaria-SAI Group), in which 5,522 agents work (5,881 agents at 31/12/2013). The reduction since the beginning of the year is particularly due to the transfer of 725 agencies with 950 agents to Allianz as part of the disposal of the insurance company business described above. However, please note that these agencies are continuing their activity for UnipolSai only for handling the Life and Bonds business, which is not part of the transfer perimeter. UnipolSai Assicurazioni also placed Life products through the branches of Unipol Banca. The leading bancassurance companies of the Group placed their products through the following sales networks: - Popolare Vita and The Lawrence Life through the sales network of Banco Popolare Società Cooperativa
and Banca Aletti; - Bim Vita through Banca Intermobiliare, Banca Ipibi and Cassa di Risparmio di Fermo; - Incontra Assicurazioni through Unicredit Group.
IT services In line with plans, 2014 saw the continuation of activities covered by the 2013-2015 Three-year Plan by the Group’s IT Services. With reference to UnipolSai, following the merger at the beginning of 2014, the unification plans were completed for the merged companies as regards the IT platforms for the Administration, Accounts, Management and Budget Control, Finance and Treasury, Risk Management, Anti-Money Laundering and Complaints departments. In addition, the following main activities were undertaken: Non-Life Systems: procedures were implemented during the year for the migration from the Non-Life
systems of the former Fondiaria-SAI to the target Essig Non-Life systems, and September saw the start of the gradual migration of former Fondiaria-SAI agencies to the Group Non-Life system.
Life Systems: after consolidation to the single Essig Life system of old systems still in use by the former Unipol Assicurazioni divisions, action began during the year to migrate the individual policies of former Fondiaria-SAI divisions, due for completion by the end of 2015.
Claims Systems: 2014 saw the completion of development of the new claims system and the new integrated trustees portal, and the release was successfully performed and according to deadlines across the entire adjusters network of the former Unipol Assicurazioni (over 5,000 human resources already online). Completion of the migration of business claims and the release of a number of special insurance business functions is due in the first few months of 2015. Activities to make the new claims system available to the agencies and adjusters network of the former Fondiaria-SAI as well and for the opening of new claims will also be started.
Processing centre unification and construction of the new Data Centre: insourcing of the infrastructures and personnel of UnipolSai Servizi Tecnologici was completed during the year, allowing removal of the outsourcing service and a major economic saving. Construction works are in the final stages on the new Data Centre, to which systems currently hosted by multiple Group offices will be migrated. As a result of
69

the design techniques and innovative technology adopted, the new Data Centre obtained TIER IV certification which makes it an international leader in terms of security, structural reliability and energy efficiency.
Automation of the agency networks: work began in 2014 on the automation of UnipolSai agencies andsub-agencies (5,581 points of sale to be automated) in accordance with a new unified agency architecturethat standardises operating methods and introduces latest generation technology through the supply ofover 19,000 new integrated multimedia workstations that allow agency personnel to work online inpaperless mode and make use of new advanced digital signature functions, alternative storage and directlinks to the Company’s geographic network. The installation and activation of the new infrastructure wascompleted for the former Unipol Assicurazioni network and is continuing for the former Fondiaria-SAI/Milano Assicurazioni network in parallel with the migration to the operational target systems.
Transfer of insurance assets: the project to transfer insurance assets of the former Milano Assicurazionibecame a major commitment for the Systems Division in 2014, with regard to preparation of the assets forthe operational start-up in Allianz of the 725 agencies transferred, migration of the portfolio transferredand planning of an IT service to Allianz as operations support for 2015 regarding the MV portfoliotransferred.
Activities were also implemented to port a further 23 companies of the former Fondiaria-SAI Group (insurance, real estate and financial companies) to the central SAP accounting system with effect from 2015.
The activities described, however, did not block ordinary business operations in support of profitability and commercial activity (8 new MV TPL/Land Vehicle Hull tariffs, around 30 portfolio rebuilding actions, 3 new converging Non-MV products and approximately 15 sales campaigns) or upgrading activities resulting from the continuous regulatory developments. Various technology innovation activities were also completed which allowed the introduction of new services such as advanced digital signatures (already in operation at 8,000 “signing” points), alternative document storage, the new multi-quote calculator for general classes and the new agency intranet.
In terms of innovation, as part of the Group’s IT Services Division a special ICT Innovation Lab was also set up, dedicated to research and testing of innovative ICT technology within the Group, which began looking into advanced monitoring systems for web-based and social media-based activities and big data analysis and management with a view to fraud prevention and the marketing aspects of Advanced Business Capability Development.
With reference to the Group’s specialist and diversified companies, the following should be noted: Auto Presto e Bene and MyGlass: the integration with Unipol Group applications was completed for the use of Auto Presto e Bene and MyGlass channelling and provisioning services in managing Group claims, together with the operational consolidation of MyGlass. Projects were launched for upgrading to the new release of the ERP system management component and for the adoption of the SAP platform for accounting, the completion of which is planned during 2015. Atahotels: work was completed on the design and implementation of the new hotel IT system. Marina di Loano: IT activities to improve port control and provide ICT services for the new Molo Grandi Navi (large vessels wharf) were carried out. Tenute del Cerro: insourcing of the ICT infrastructure and implementation of the new administrative and production management ERP system were completed.
70

Transactions with related parties
The Procedure for the performance of transactions with related parties (the “Procedure”), prepared in accordance with Art. 4 of Consob Regulation no. 17221 of 12 March 2010 and subsequent amendments (the “Regulation”), was approved by the Board of Directors of the then Fondiaria-SAI SpA on 30 November 2010 and then amended by the Board of Directors of UnipolSai Assicurazioni SpA on 15 May 2014 (with effect from 1/6/2014), subject to prior opinion in favour from the Committee of Independent Directors.
The objective of the Procedure is to define, in compliance with the Regulation and also taking into account the indications and guidelines outlined by Consob in Communication dated 24 September 2010, a procedural system to ensure greater transparency and correctness in the preliminary phase of negotiations and approval of related party transactions carried out by UnipolSai Assicurazioni SpA, directly or via subsidiaries.
No transactions “of major relevance” with related parties took place in 2014 and neither did any transactions that, according to Art. 2427, paragraph 2 of the Civil Code, had any significant effect on UnipolSai’s financial position and results of operations.
The information required by IAS 24 and Consob Communication DEM/6064293/2006 is contained in paragraph 5.6 of the Notes to the financial statements – Transactions with related parties.
The main transactions “of minor relevance” carried out during 2014 are listed below.
Merger of Banca Sai into Unipol Banca
The merger by incorporation of Banca Sai into Unipol Banca (the “Transaction”) falls within the broader process of integrating Unipol and Fondiaria-SAI insurance groups following the Unipol’s acquisition of the latter and, in line with the 2013-2015 Business Plan of the Unipol Group, it is aimed at rationalising the work of the Group’s banking business through the creation of a single Banking Group.
The Transaction was implemented between: (i) Banca Sai, related party of UnipolSai pursuant to the Consob Regulation adopted with resolution no. 17221
of 12 March 2010 and no. 17389 of 23 June 2010 (the “Regulation”) as it is entirely held by the latter, and (ii) Unipol Banca, also a related party of UnipolSai, according to the Regulation, which directly holds a 32.25%
interest (pre-Transaction share) while the remaining interest is directly held by the Parent Unipol.
Pursuant to the joint provisions of Articles 8 and 10 of the current Procedure for the performance of transactions with related parties (the “Procedure”) recently adopted by UnipolSai at the Board of Directors meeting of 15 May 2014, the Transaction is classified as a Transaction with Related Parties of Minor Relevance, carried out through a Subsidiary. The Procedure also requires that the Transactions of Minor Relevance carried out by Subsidiaries with Related Parties of UnipolSai be subject to the approval of the competent Delegated Body of UnipolSai, in this case the Board of Directors, based on the granting of a justified unbinding opinion by the Committee on the interest of the Subsidiary and UnipolSai itself upon completion of the Transaction.
Put and call option on Unipol Banca shares
As part of the Merger, on 31 December 2013 Unipol Gruppo Finanziario granted Fondiaria-SAI a put option on the interest formerly held by the merging company Unipol Assicurazioni in Unipol Banca SpA, equal on that
71

date to 32.25% of its share capital, to be exercised on expiry of the fifth year after the statutory effective date of the Merger, at a price no lower than the present carrying amount of said interest, i.e. approximately €332m (thus increased from the previous year as a result of the pro-rata subscription on 25/6/2014 of the capital increase resolved by the investee on 23 April 2014). In view of the above, Fondiaria-SAI granted Unipol Gruppo Finanziario a corresponding call option on said interest, at the same price, but providing Unipol Gruppo Finanziario with the possibility of exercising the option for the entire period running between the statutory effective date of the Merger and the expiry of the fifth year after said date. The put and call option rights were extended to shares subscribed by UnipolSai in implementing the increase in share capital resolved by the investee on 23/4/2014. On the contrary, these rights were not extended to the shares issued to serve the merger with Banca Sai and assigned to UnipolSai. Therefore at 31 December 2014 the put and call options referred to 246,726,761 Unipol Banca shares, corresponding to 27.49% of the investee’s share capital for a total value of €332m.
Resolution to transfer a 51% interest of the share capital of UnipolSai Investimenti SGR (former SAI Investimenti SGR) to Unipol
In execution of the request of Bank of Italy aimed at bringing the setup of the Unipol Banking Group into line with the new regulations on banking groups pursuant to Bank of Italy Circular no. 285 of 17/12/2013, on 13 November 2014 the Board of Directors of Unipol and UnipolSai approved, subject to obtainment of the required legal authorisations, the transaction to transfer 51% interest of the share capital of the company UnipolSai Investimenti SGR from UnipolSai to Unipol. Classified as an intercompany transaction pursuant to ISVAP Regulation no. 25 of 27 May 2008, the transaction is subordinate to the approval of IVASS.
Report on corporate governance and ownership structures pursuant to Art. 123-bis of Legislative Decree 58 of 24 February 1998
The information required by Art. 123-bis of Legislative Decree 58 of 24 February 1998 and amended by Art. 5 of Legislative Decree 173 of 3 November 2008, is contained in the annual report on Corporate Governance, approved by the Board of Directors and published, together with the management report, in accordance with Art. 89-bis of the Regulation adopted by Consob in its Resolution no. 11971 of 14 May 1999 and with Section IA.2.6. Instructions on the Regulation of Markets organised and managed by Borsa Italiana SpA.
The annual Corporate Governance report is available in the “Governance/Corporate Governance System/Annual Report on Corporate Governance” Section on the Company’s website (www.unipolsai.com).
Statement pursuant to Art. 2.6.2, paragraph 9 of the Regulation governing markets organised and managed by Borsa Italiana SpA
Pursuant to the requirements set forth in Art. 2.6.2, paragraph 9 of the Regulation governing markets organised and managed by Borsa Italiana SpA with reference to subsidiaries subject to the management and coordination of another company, it is hereby stated that the conditions set forth in Art. 37 of Consob Regulation no. 16191/2007 exist for UnipolSai SpA .
72
Significant events after the reporting period
Approval for the mandatory conversion of Class A and Class B savings shares into ordinary UnipolSai shares
On 26 January 2015, the UnipolSai Assicurazioni SpA (“UnipolSai” or the “Company”) Extraordinary Shareholders’ Meeting approved the mandatory conversion of Class A savings shares (“Class A Savings Shares”) and Class B savings shares (“Class B Savings Shares”) into ordinary UnipolSai shares (the “Conversion”), in accordance with the following conversion ratio:
(i) 100 ordinary shares, with normal dividend rights, for each Class A Savings Share, without equalisation payment;
(ii) 1 ordinary share, with normal dividend rights, for each Class B Savings Share, without equalisation payment.
The Special Shareholders’ Meeting of holders of Class A Savings Shares and the Special Shareholders’ Meeting of holders of Class B Savings Shares met on 27 January 2015 and approved, to the extent of their respective powers, the resolution passed by the Extraordinary Shareholders’ Meeting of 26 January 2015 with regard to the Conversion, pursuant to Art. 146, paragraph 1, letter b) of Legislative Decree no. 58 of 24 February 1998.
With the measure issued on 5 March 2015, pursuant to Art. 196 of Legislative Decree 209 of 7 September 2005 and IVASS Regulation no. 14/2008, IVASS authorised the statutory amendments arising from the Conversion (“IVASS Authorisation”). After the IVASS Authorisation was obtained, the Company recorded the shareholders’ meeting resolutions at the Bologna Register of Companies on 12 March 2015, from which date the 15-day period started - still in progress on the date of this Report - by when the holders of Class A Savings Shares and the holders of Class B Savings Shares who contributed toward the approval of the Conversion may exercise withdrawal pursuant and consequent to Art. 2437, paragraph 1, letter g) of the Civil Code.
The redemption value of any Savings Shares withdrawn was calculated at €228.272 for each Class A Savings Share and at €2.238 for each Class B Savings Share. The Conversion will take effect subject to the circumstance that the total value of the shares for which the right of withdrawal is exercised does not exceed €30m separately for the Class A Savings Shares and for the Class B Savings Shares. If the amount of withdrawals does not exceed the thresholds stated above at the end of the period for exercising the right of withdrawal (i.e. the Company has waived this condition), the shares subject to withdrawal will be offered in rights issue and right of pre-emption to all other UnipolSai shareholders, regardless of their share category, and then, if they remain unsold, they will be placed in a stock market offering. It is also envisaged that the Conversion shall become final after the ex-dividend date relating to the year ending 31 December 2014 which - without prejudice to the above in reference to shares subject to withdrawal - will be distributed to each share category in compliance with current provisions of the By-Laws.
73

Transfer of 20% interest of UnipolSai Investimenti SGR from UnipolSai to the company Immobiliare Grande Distribuzione - IGD
Following an investment agreement signed on 7 August 2014 by UnipolSai and Immobiliare Grande Distribuzione - Società di Investimento Immobiliare Quotata SpA (“IGD”) covering, among other things, a planned partnership to achieve common business objectives, on 28 January 2015 UnipolSai transferred 20% interest of the share capital of UnipolSai Investimenti SGR (100% held by UnipolSai) to IGD. The Bank of Italy authorised the transfer with a Measure dated 2 December 2014.
“Porta Nuova” area - Milan - real estate project
With reference to the investment in the real estate project to develop the area called “Porta Nuova” (the “Project”), note that on 27 February 2015 Hines SGR, a closed type of speculative real estate investment mutual funds management company (the “Funds”), which owns the areas and relevant properties forming the Project, informally announced that the institutional investor Qatar Holding (“QIA”) should purchase 100% of the shares of the Funds that it does not already own. To this regard, please be reminded that in June 2013 QIA had already subscribed newly issued shares of the Garibaldi and Isola Funds for an amount equal to about 40% of them. The closing of the transaction is subject to the approval of some banks financing the Funds. At this time the Group is waiting to learn the details of the transaction, with particular reference to the possible effects on the investments made, for the most part consisting of the subscription of financial instruments issued by the companies established under Luxembourg law that indirectly control the Funds.
74

Business outlook
In the period that followed the end of 2014, the macroeconomic scenario in Italy improved slightly and many of the monitors forecast a recovery in the national economy this year, aided by the low oil prices and the reduced value of the Euro. There has been new political tension but, also as a result of ECB intervention with the launch of Quantitative Easing, the financial markets’ confidence in Italy was further consolidated, as confirmed by a narrowing of the BTP-Bund spread to around 100 points despite the renewed fears regarding the Greek public deficit.
Group business in 2015 will be focused on completing the integration of the sales networks and business management IT systems, as outlined in the Business Plan, with a view to achieving cost synergies. Subject to approval from the appropriate authorities, additional corporate streamlining will be studied with a view to further simplifying the Group structure and pursue cost savings.
The reference context and the competitive trend continued to affect premiums in the first two months of 2015 to varying degrees in the business classes.
In the Non-Life sector, premiums declined in the first few months of 2015, as also expected during the rest of the year, feeling the full effects of the business unit transfer to Allianz with related transfer of the portfolio from the start of the year. Premium volumes also continue to be affected by a steady competitive trend reflected in the average premium. The Group is continuing with the sales initiatives targeted at reinvigorating its product lines, such as the development of new network and customer relationship models, and the launch in February of the new UnipolSai advertising campaign that aims to consolidate its success in the sale of policies with monthly payments, in synergy with the Group’s banking segment. The technical trend was positive, in the wake of the trends recorded in 2014.
Again in the first few months of 2015, the favourable spell for the Life sector was confirmed in a market context characterised by a continued fall in interest rates which increases the appeal of the traditional insurance products with returns linked to separately managed accounts. Premiums increased in February, despite comparison with a strong, steady performance recorded in the same period last year.
The consolidated operating result, excluding unforeseeable events also connected with the reference context, is expected to be positive also for the current year.
Bologna, 19 March 2015
The Board of Directors
75


Consolidated Financial Statements: Statement of financial position Income statement and comprehensive income statement Statement of changes in shareholders’ equity Statement of cash flows

Consolidated Statement of Financial Position - AssetsValori in Milioni di Euro
31/12/2014 31/12/2013
1 INTANGIBLE ASSETS 804.8 523.9
1.1 Goodwill 306.7 0.0
1.2 Other intangible assets 498.1 523.92 PROPERTY, PLANT AND EQUIPMENT 1,196.4 522.3
2.1 Property 1,072.0 456.8
2.2 Other tangible assets 124.4 65.63 TECHNICAL PROVISIONS - REINSURERS' SHARE 960.2 741.7
4 INVESTMENTS 61,122.0 34,303.6
4.1 Investment property 2,824.2 2,584.5
4.2 Investments in subsidiaries, associates and interests in joint ventures 608.4 159.4
4.3 Held-to-maturity investments 1,420.0 626.5
4.4 Loans and receivables 5,169.5 2,746.5
4.5 Available-for-sale financial assets 42,113.7 22,656.2
4.6 Financial assets at fair value through profit or loss 8,986.2 5,530.55 SUNDRY RECEIVABLES 3,395.1 1,900.9
5.1 Receivables relating to direct insurance business 1,630.8 1,081.7
5.2 Receivables relating to reinsurance business 89.8 98.4
5.3 Other receivables 1,674.6 720.86 OTHER ASSETS 813.9 1,843.3
6.1 Non-current assets or assets of a disposal group held for sale 23.6 138.9
6.2 Deferred acquisition costs 75.5 63.3
6.3 Deferred tax assets 221.8 1,189.1
6.4 Current tax assets 97.5 217.0
6.5 Other assets 395.6 234.97 CASH AND CASH EQUIVALENTS 684.0 598.5
TOTAL ASSETS 68,976.5 40,434.2
Amounts in €m
78

Consolidated Statement of Financial Position - Shareholders' Equity and LiabilitiesValori in Milioni di Euro
31/12/2014 31/12/2013
1 SHAREHOLDERS' EQUITY 6,634.9 3,066.2
1.1 attributable to the owners of the Parent 6,295.2 2,325.2
1.1.1 Share capital 1,996.1 1,194.6
1.1.2 Other equity instruments 110.1 0.0
1.1.3 Capital reserves 247.8 198.9
1.1.4 Income-related and other equity reserves 2,062.8 115.6
1.1.5 (Treasury shares) -49.5 -0.1
1.1.6 Reserve for foreign currency translation differences 3.8 4.7
1.1.7 Gains or losses on available-for-sale financial assets 1,169.3 496.9
1.1.8 Other gains or losses recognised directly in equity 15.2 26.3
1.1.9 Profit (loss) for the year attributable to the owners of the Parent 739.5 288.41.2 attributable to non-controlling interests 339.7 741.0
1.2.1 Share capital and reserves attributable to non-controlling interests 261.5 521.0
1.2.2 Gains or losses recognised directly in equity 34.4 122.9
1.2.3 Profit (loss) for the year attributable to non-controlling interests 43.8 97.22 PROVISIONS 619.9 319.9
3 TECHNICAL PROVISIONS 56,228.5 32,800.0
4 FINANCIAL LIABILITIES 3,812.7 2,226.3
4.1 Financial liabilities at fair value through profit or loss 1,365.4 554.1
4.2 Other financial liabilities 2,447.3 1,672.25 PAYABLES 818.9 655.4
5.1 Payables arising from direct insurance business 143.7 94.8
5.2 Payables arising from reinsurance business 40.9 73.4
5.3 Other payables 634.4 487.16 OTHER LIABILITIES 861.6 1,366.4
6.1 Liabilities associated with disposal groups 2.6 74.2
6.2 Deferred tax liabilities 86.3 827.4
6.3 Current tax liabilities 15.7 67.0
6.4 Other liabilities 757.0 397.9TOTAL SHAREHOLDERS’ EQUITY AND LIABILITIES 68,976.5 40,434.2
Amounts in €m
79

Consolidated Income StatementValori in Milioni di Euro
31/12/2014 31/12/2013
1.1 Net premiums 15,960.6 9,650.1
1.1.1 Gross premiums earned 16,414.6 9,978.5
1.1.2 Earned premiums ceded to reinsurers -454.0 -328.4
1.2 Commission income 14.9 8.0
1.3 Gains and losses on financial instruments at fair value through profit or loss 71.8 159.7
1.4 Gains on investments in subsidiaries, associates and interests in joint ventures 6.9 7.8
1.5 Gains on other financial instruments and investment property 2,817.6 1,489.0
1.5.1 Interest income 1,593.2 972.9
1.5.2 Other income 186.7 109.2
1.5.3 Realised gains 767.1 406.4
1.5.4 Unrealised gains 270.6 0.5
1.6 Other revenue 868.7 465.71 TOTAL REVENUE AND INCOME 19,740.5 11,780.4
2.1 Net charges relating to claims -14,312.8 -8,332.2
2.1.1 Amounts paid and changes in technical provisions -14,571.6 -8,508.9
2.1.2 Reinsurers' share 258.7 176.7
2.2 Commission expense -13.7 -6.3
2.3 Losses on investments in subsidiaries, associates and interests in joint ventures -26.0 -2.1
2.4 Losses on other financial instruments and investment property -665.7 -298.9
2.4.1 Interest expense -97.5 -64.4
2.4.2 Other charges -96.3 -68.1
2.4.3 Realised losses -286.7 -39.6
2.4.4 Unrealised losses -185.2 -126.7
2.5 Operating expenses -2,645.9 -1,609.4
2.5.1 Commissions and other acquisition costs -1,982.3 -1,173.5
2.5.2 Investment management expenses -98.2 -23.9
2.5.3 Other administrative expenses -565.5 -411.9
2.6 Other costs -934.4 -866.02 TOTAL COSTS AND EXPENSES -18,598.5 -11,114.9
PRE-TAX PROFIT (LOSS) FOR THE YEAR 1,142.0 665.5
3 Income tax -354.5 -278.5PROFIT (LOSS) FOR THE YEAR AFTER TAXES 787.5 387.0
4 PROFIT (LOSS) FROM DISCONTINUED OPERATIONS -4.1 -1.4CONSOLIDATED PROFIT (LOSS) 783.4 385.6
of which attributable to the owners of the Parent 739.5 288.4
of which attributable to non-controlling interests 43.8 97.2
Amounts in €m
80
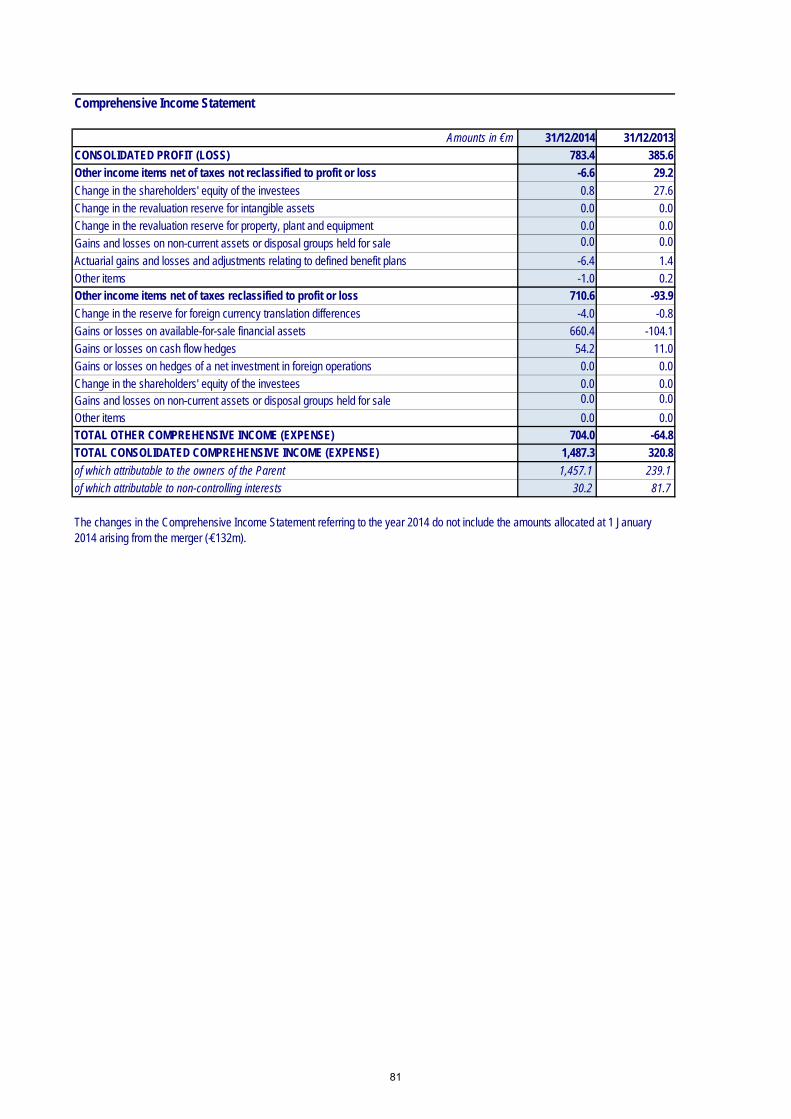
Comprehensive Income Statement
Amounts in €m 31/12/2014 31/12/2013
CONSOLIDATED PROFIT (LOSS) 783.4 385.6
Other income items net of taxes not reclassified to profit or loss -6.6 29.2
Change in the shareholders' equity of the investees 0.8 27.6
Change in the revaluation reserve for intangible assets 0.0 0.0
Change in the revaluation reserve for property, plant and equipment 0.0 0.0
Gains and losses on non-current assets or disposal groups held for sale 0.0 0.0
Actuarial gains and losses and adjustments relating to defined benefit plans -6.4 1.4
Other items -1.0 0.2Other income items net of taxes reclassified to profit or loss 710.6 -93.9
Change in the reserve for foreign currency translation differences -4.0 -0.8
Gains or losses on available-for-sale financial assets 660.4 -104.1
Gains or losses on cash flow hedges 54.2 11.0
Gains or losses on hedges of a net investment in foreign operations 0.0 0.0
Change in the shareholders' equity of the investees 0.0 0.0Gains and losses on non-current assets or disposal groups held for sale 0.0 0.0
Other items 0.0 0.0TOTAL OTHER COMPREHENSIVE INCOME (EXPENSE) 704.0 -64.8
TOTAL CONSOLIDATED COMPREHENSIVE INCOME (EXPENSE) 1,487.3 320.8
of which attributable to the owners of the Parent 1,457.1 239.1
of which attributable to non-controlling interests 30.2 81.7
The changes in the Comprehensive Income Statement referring to the year 2014 do not include the amounts allocated at 1 January 2014 arising from the merger (-€132m).
81

Consolidated Statement of Changes in Shareholders' Equity0
Balance at Balance at
Amounts in €m
31/12/2012 31/12/2013
1,194.6 0.0 0.0 0.0 1,194.6
0.0 0.0 0.0 0.0 0.0
669.6 0.0 -470.8 0.0 198.9
-465.5 0.0 581.0 0.0 115.6
0.0 0.0 -0.1 0.0 -0.1
112.7 0.0 175.7 0.0 288.4
577.2 0.0 62.2 -111.5 0.0 527.9
2,088.6 0.0 348.1 -111.5 0.0 0.0 2,325.2
508.1 0.0 12.9 0.0 521.063.0 0.0 84.1 -49.8 97.2
138.4 0.0 17.4 -32.9 0.0 122.9
709.4 0.0 114.4 -32.9 -49.8 0.0 741.0
Total 2,798.0 0.0 462.5 -144.4 -49.8 0.0 3,066.2
Balance at Balance at31/12/2013 31/12/2014
1,194.6 0.0 801.6 0.0 1,996.1
0.0 0.0 110.1 0.0 110.1
198.9 0.0 48.9 0.0 247.8
115.6 0.0 2,333.3 -386.0 2,062.8
-0.1 0.0 -49.4 0.0 -49.5
288.4 0.0 629.7 -178.5 739.5
527.9 0.0 724.8 -64.3 0.0 1,188.4
2,325.2 0.0 4,598.8 -64.3 -564.5 0.0 6,295.2
521.0 0.0 -259.5 0.0 261.597.2 0.0 -1.0 -52.3 43.8
122.9 0.0 -71.4 -17.1 0.0 34.4
741.0 0.0 -332.0 -17.1 -52.3 0.0 339.7
Total 3,066.2 0.0 4,266.9 -81.4 -616.8 0.0 6,634.9
Changes in investments
Changes in investments
Changes to closing balances
Amounts allocatedAdjustments from
reclassificationto profit or loss
Transfers
Changes to closing balances
Amounts allocated
Adjustments from reclassificationto profit or loss
Transfers
Shareholders' Equity
attributable to the owners of
the Parent
Share capital
Other equity instruments
Capital reserves
Income-related and other equity reserves
(Treasury shares)
Profit (loss) for the year
Other comprehensive income (expense)
Total attributable to the owners of the Parent
Shareholders' Equity
attributable tonon-controlling
interests
Share capital and reserves attributable to non-controlling interestsProfit (loss) for the year
Other comprehensive income (expense)
Total attributable to non-controlling interests
Shareholders' Equity
attributable tonon-controlling
interests
Share capital and reserves attributable to non-controlling interestsProfit (loss) for the year
Other comprehensive income (expense)
Total attributable to non-controlling interests
Shareholders' Equity
attributable to the owners of
the Parent
Share capital
Other equity instruments
Capital reserves
Income-related and other equity reserves
(Treasury shares)
Profit (loss) for the year
Other comprehensive income (expense)
Total attributable to the owners of the Parent
82

Amounts in €m 31/12/2014 31/12/2013
Pre-tax profit (loss) for the year 1,142.0 665.5
Change in non-monetary items 862.2 -1,174.1
Change in Non-Life premium provision -608.2 -276.8
Change in claims provision and other Non-Life technical provisions -338.2 -569.8
Change in mathematical provisions and other Life technical provisions 2,677.6 -231.8
Change in deferred acquisition costs 2.3 -11.5
Change in provisions 89.1 35.1
Non-monetary gains and losses on financial instruments, investment property and investments -526.2 -262.7
Other changes -434.3 143.6
Change in receivables and payables generated by operating activities 162.6 198.7
Change in receivables and payables relating to direct insurance and reinsurance 88.2 52.8
Change in other receivables and payables 74.4 145.9
Paid taxes -380.2 -75.3
Net cash flows generated by/used for monetary items from investing and financing activities -110.9 977.6
Liabilities from financial contracts issued by insurance companies -5.5 22.6
Payables to bank and interbank customers 0.0 -2.7
Loans and receivables from banks and interbank customers 0.0 60.8
Other financial instruments at fair value through profit or loss -105.4 896.9TOTAL NET CASH FLOW FROM OPERATING ACTIVITIES 1,675.7 592.4
Net cash flow generated by/used for investment property 10.6 -4.2
Net cash flow generated by/used for investments in subsidiaries, associates and interests in joint ventur -34.5 -12.6
Net cash flow generated by/used for loans and receivables 904.6 -121.4
Net cash flow generated by/used for held-to-maturity investments 686.6 128.5
Net cash flow generated by/used for available-for-sale financial assets -3,317.4 -408.5
Net cash flow generated by/used for property, plant and equipment and intangible assets -61.0 -9.2
Other net cash flows generated by/used for investing activities 68.8 0.0
TOTAL NET CASH FLOW GENERATED BY/USED FOR INVESTING ACTIVITIES -1,742.2 -427.4
Net cash flow generated by/used for equity instruments attributable to the owners of the Parent 172.7 0.0
Net cash flow generated by/used for treasury shares 0.0 0.0
Dividends distributed attributable to the owners of the Parent -564.5
Net cash flow generated by/used for share capital and reserves attributable to non-controlling interests -77.3 -49.8
Net cash flow generated by/used for subordinated liabilities and equity instruments 14.4
Net cash flow generated by/used for other financial liabilities -443.9 -52.8
TOTAL NET CASH FLOW GENERATED BY/USED FOR FINANCING ACTIVITIES ……….. -898.7 -102.7
Effect of exchange rate gains/losses on cash and cash equivalents -1.6 -0.6
CASH AND CASH EQUIVALENTS AT 1 JANUARY (*) 1,651.7 560.2
INCREASE (DECREASE) IN CASH AND CASH EQUIVALENTS -966.8 61.7
CASH AND CASH EQUIVALENTS AT THE END OF THE PERIOD (**) 684.9 621.9
STATEMENT OF CASH FLOWS (indirect method)
(*) Cash and cash equivalents at 1 January 2014 correspond to the cash and cash equivalents at 31 December 2013 increased by €1,029.8m due to the merger. They also include the cash and cash equivalents of non-current assets or assets of a disposal group held for sale (€23.4m).
(**) Cash and cash equivalents at the end of the year include the cash and cash equivalents of non-current assets or assets of a disposal group held for sale (€0.9m at 31/12/2014, €23.4m at 31/12/2013).
83


Notes to the Financial Statements


NOTES TO THE FINANCIAL STATEMENTS
1. BASIS OF PRESENTATION
The UnipolSai Group, consisting of UnipolSai Assicurazioni (“UnipolSai”) and its subsidiaries, operates in all Non-Life and Life insurance and reinsurance and capitalisation business; it may issue investment contracts and may set up and manage open-ended pension funds, in compliance with the provisions of Art. 9 of Legislative Decree 124 of 21 April 1993 and subsequent amendments. It also carries out real estate, and to a lesser extent, hotel, agricultural and healthcare activities.
UnipolSai is a joint-stock company, has its registered office in Bologna (Italy) and is listed on the Milan Stock Exchange.
UnipolSai’s Consolidated Financial Statements were drawn up in accordance with Art. 154-ter of Legislative Decree 58/1998 (Consolidated Law on Finance) and of ISVAP Regulation 7 of 13 July 2007, as amended. They conform to the IFRS issued by the IASB and endorsed by the European Union, along with the interpretations issued by IFRIC, in accordance with the provisions of EC Regulation 1606/2002 in force on the date the financial statements closed.
The Consolidated Financial Statements are made up of: Statement of financial position; Income statement and comprehensive income statement; Statement of changes in shareholders’ equity; Statement of cash flows; Notes to the financial statements; Tables appended to the Notes to the financial statements.
The layout conforms to the provisions of ISVAP Regulation 7 of 13 July 2007, Part III as amended, relating to the layout of the Consolidated Financial Statements of insurance and reinsurance companies that must adopt IFRS.
IVASS Measure no. 29 of 27 January 2015 amended ISVAP Regulation no. 7/2007 in order to implement the changes that went into effect starting from the 2014 financial statements regarding quantitative disclosure required by the new IFRS 12. In particular, the Statement of Changes in Shareholders’ Equity has been amended to add a new column (Changes in investments), which illustrates the consequences of changes in investments in subsidiaries that do not involve loss of control (IFRS 12.18), and separate indication in the statement of Consolidation Scope of the registered office and the operating office. Furthermore, two new statements were introduced: one being the “Consolidation scope: interests in entities with material non-controlling interests”, including information on subsidiaries with significant non-controlling interests (IFRS 12.12), the other being “Interests in unconsolidated structured entities” to add information of this nature (IFRS 12.27-29). Since the case does not apply to the group, this latter statement was not published.
The information requested in CONSOB Communications DEM/6064293 of 28 July 2006 and DEM/11070007 of 5 August 2011 is also provided.
The Consolidated Financial Statements are drawn up on the assumption that the company will continue as a going concern, in application of the principles of accrual accounting, relevance and reliability of accounting
87

information, in order to provide a true and fair view of the equity-financial position and economic result, in compliance with the principle of the prevalence of the economic substance of transactions of their legal form. The going concern assumption is considered to be confirmed with reasonable certainty given that companies belonging to the UnipolSai Group have sufficient resources to ensure that they will continue to operate for the foreseeable future. In addition, the liquidity risk is deemed to be very remote.
The layout of the financial statements offers a comparison with the figures of the previous year. Where necessary, in the event of a change to the accounting standards, measurement or classification criteria, the comparative data are re-stated and reclassified to in order to provide homogeneous and consistent information.
The presentation currency is the euro and all the amounts shown in the financial statements and these notes are in €m, except when specifically indicated, rounded to one decimal place; therefore the sum of the individual amounts is not always identical to the total.
The Consolidated financial statements of UnipolSai Assicurazioni SpA are subject to an audit by independent auditors PricewaterhouseCoopers SpA (PwC), the company tasked with performing the legally-required audit of the consolidated financial statements for the 2013/2021 period. ________________________________________________________________________________________
Consolidation scope
The UnipolSai Group's consolidated financial statements at 31 December 2014 have been drawn up by combining the figures of UnipolSai and those for the 53 direct and indirect subsidiaries (IFRS 10). At 31 December 2013, a total of 71 companies were consolidated on a line-by-line basis. Subsidiaries deemed to be too small to be of relevance are excluded from the consolidated financial statements.
There are no jointly-controlled interests.
Associates (31 companies), in which the investment percentage ranges between 20% and 50%, and subsidiaries considered immaterial (5 companies), are measured using the equity method (IAS 28) or maintained at the carrying amount. At 31 December 2013, a total of 23 associates and subsidiaries were considered immaterial.
Investments consolidated on a line-by-line basis and those measured using the equity method are listed in the tables showing the Consolidation scope and Details of unconsolidated investments, respectively, which are appended to these Notes.
Changes in the consolidation scope compared with 31 December 2013 and other transactions
Changes in the consolidation scope: - on 14 January 2014 the company Scontofin Sa in Liquidation with offices in Luxembourg, held by
Finadin SpA (incorporated on 23 December 2014 into UnipolSai Finance SpA, formerly Smallpart SpA) and Sailux Sa, 70% and 19% respectively, was deleted from the Business Register;
- the company Dominion Insurance Holdings Limited, with offices in London and a 100% subsidiary of Finsai International Sa, was cancelled from the Register of Companies on 14 October 2014;
- on 3 November 2014 the merger of Banca Sai SpA (a 100% subsidiary of UnipolSai and fully consolidated at 31/12/2013) into the investee Unipol Banca SpA also became effective (accounting and tax effects backdated to 1 January 2014), as resolved by the respective shareholders on 3 October 2014. Based on the swap transaction agreed in the merger plan, UnipolSai received
88

132,428,578 new Unipol Banca SpA shares (equal to a €132m increase in share capital in service of the merger), increasing the interest held from 32.25% to 42.25%. It should be remembered that an agreement with the holding company Unipol Gruppo Finanziario is in effect covering the 246,726,761 shares UnipolSai holds in Unipol Banca SpA (32.25% of the pre-merger share capital of Banca Sai SpA). It provides that UnipolSai has a put option to be exercised on expiry of the fifth year after the statutory effective date of the Merger between the former Fondiaria-SAI, Unipol Assicurazioni, Milano Assicurazioni and Premafin that took place on 6 January 2014, at a price equal to the present carrying amount of said interest, and a call option for Unipol Gruppo Finanziario at the same price, but with the possibility of exercising the option for the entire period running between 6 January 2014 and the expiry of the fifth year after said date. The interest in Unipol Banca SpA covered by said agreement dropped from 32.25% to 27.49% after Banca Sai SpA was merged into Unipol Banca SpA. As a result of what is explained above, the value of Unipol Banca SpA stated in the 2014 Consolidated Financial Statements of UnipolSai is the carrying amount of the pre-merger interest of Banca Sai SpA in addition to the 14.76% of shareholders’ equity of Unipol Banca SpA;
- the merger by incorporation of Covent Garden BO Srl and Comsider Srl into Midi Srl became effective on 1 December 2014, with accounting and tax effects backdated to 1 January 2014;
- the merger by incorporation of Eurosai Srl, Finadin SpA and Saifin Saifinanziaria SpA into Smallpart SpA took effect on 23 December 2014 (taking the name of UnipolSai Finance SpA starting from 31 December 2014), with accounting and tax effects backdated to 1 January 2014;
- the merger by incorporation of the subsidiaries Bramante Srl, Campo Carlo Magno SpA, Cascine Trenno Srl, Immobiliare Litorella Srl, Immobiliare Milano Assicurazioni Srl, Iniziative Valorizzazioni Edili – IN.V.ED. – Srl, Insediamenti Avanzati nel Territorio I.A.T. – SpA, International Strategy Srl, Meridiano Aurora Srl, Meridiano Bellarmino Srl, Meridiano Bruzzano Srl, Mizar Srl, Ristrutturazioni Edili Moderne – R.EDIL.MO. – Srl, Sintesi Seconda Srl, Stimma Srl, Trenno Ovest Srl, Unifimm Srl and UnipolSai Servizi Immobiliari SpA in Immobiliare Fondiaria-Sai Srl took effect on 31 December 2014, and at the same time took the name of UnipolSai Real Estate Srl). Accounting and tax effects of the transaction were backdated to 1 January 2014.
Transactions carried out on capital that did not modify the consolidation scope: - on 5 February 2014 the Extraordinary Shareholders’ Meeting of the subsidiary Atahotels voted to
reduce share capital because of losses to €37.8m (registered in the Register of Companies on 19 April 2014). On 25 February 2014, UnipolSai subscribed and paid a capital increase in the subsidiary Atahotels in the amount of €45.6m;
- on 31 March 2014 share capital was increased in favour of the associate Funivie del Piccolo San Bernardo SpA amounting to €2.5m. Immobiliare Fondiaria-SAI Srl (now UnipolSai Real Estate Srl) did not participate in the share capital increase; the percentage of interest dropped from 27.38% to 23.55%;
- on 1 May 2014 UnipolSai purchased 100% interest in Fondiaria-SAI Servizi Tecnologici SpA, which on 30 September 2014 took the name of UnipolSai Servizi Tecnologici SpA (USST);
- on 25 June 2014, a share capital increase was carried out in favour of the associate Unipol Banca SpA of €100m following which the ownership structure of the bank remained as follows: Unipol Gruppo Finanziario SpA 67.75% and UnipolSai 32.25%;
- on 17 July 2014 the entire interest held by the company Donatello Day Surgery Srl in liquidation in the company Città della Salute Scrl was transferred to Centro Oncologico Fiorentino Casa di Cura Villanova Srl. Interest in the company Città della Salute Scrl is held as follows: 50% by the company Casa di Cura Villa Donatello - SpA, 47.5% by the company Centro Oncologico Fiorentino Casa di Cura Villanova Srl, 2.5% by the company Florence Centro di Chirurgia Ambulatoriale Srl;
89

- on 22 December 2014 the entire interest held by the company Sailux Sa en liquidation and the company Sainternational Sa en liquidation in Finsai International Sa was transferred, respectively, to the company Saifin Saifinanziaria SpA (now UnipolSai Finance SpA) and to UnipolSai. Interest in the company Finsai International Sa is held as follows: 63.85% by UnipolSai and 36.15% by Saifin Saifinanziaria SpA (afterwards merged into UnipolSai Finance SpA).
It should also be noted that: - 13 February 2014. The company Donatello Day Surgery Srl was placed in liquidation; - 26 March 2014. The company name of Saiagricola SpA - Società Agricola was changed to Tenute del
Cerro SpA - Società Agricola; - 24 April 2014. The company name of Immobiliare Lombarda SpA was changed to UnipolSai Servizi
Immobiliari SpA, merged into UnipolSai Real Estate Srl on 31 December 2014; - 9 May 2014. The company name of Sai Investimenti SGR SpA was changed to UnipolSai
Investimenti SGR SpA; - 13 June 2014. Saint George Capital Management SA was placed in liquidation. - 30 September 2014. The company name of Fondiaria-Sai Servizi Tecnologici SpA was changed to
UnipolSai Servizi Tecnologici SpA; - 6 October 2014. The company name of The Lawrence Re Limited was changed to UnipolRe Limited; - 10 October 2014. The company name of Fondiaria-Sai Nederland BV was changed to UnipolSai
Nederland BV; - 4 December 2014. Atavalue Srl was placed in liquidation and cancelled from the Register of
Companies on 8 January 2015; - 17 December 2014. Euresa Holding Sa was placed in liquidation. - 23 December 2014. The company name of Smallpart SpA was changed to UnipolSai Finance SpA; - 31 December 2014. The company name of Immobiliare Fondiaria-Sai Srl was changed to UnipolSai
Real Estate Srl.
Reporting date
The reporting date of the Consolidated Financial Statements is 31 December 2014, the date the separate financial statements of the UnipolSai closed. All the consolidated companies closed their financial statements at 31 December with the exception of the associate Pegaso Finanziaria SpA, which closed its latest financial statements at 30 June and for which interim financial statements up to the date of the Consolidated Financial Statements have been used, and of the associate Fin.Priv Srl, which closed its latest financial statements on 30 November. With the exception of the companies subject to supervision by the Bank of Italy, the consolidated financial statements were drawn up using restatements of the individual financial statements of the consolidated companies adjusted to comply with the IAS/IFRS, as applied by UnipolSai and approved by the Boards of Directors of the companies concerned.
90

Basis of consolidation Companies consolidated on a line-by-line basis This method provides for the consolidation on a line-by-line basis of the assets, liabilities, income and charges of the consolidated companies as from the date they were acquired, with the carrying amount of the investment eliminated being offset against the corresponding amount of shareholders’ equity of each individual subsidiary and, in the case of investments not wholly owned, the separate recognition of the amount of the shareholders’ equity and the profit or loss for the year attributable to non-controlling interests. The amount of equity attributable to non-controlling interests is recognised under shareholders’ equity as “Share capital and reserves attributable to non-controlling interests”, whilst the relevant amount of the consolidated profit or loss is shown under “Profit (loss) for the year attributable to non-controlling interests”. The financial statements of the subsidiaries are consolidated on a line-by-line basis with the exception of those that are so small that the equity method is used. Goodwill If the cost of acquiring investments in subsidiaries and associates exceeds the fair value of the identifiable assets, liabilities and contingent liabilities, the excess amount is recognised as goodwill under intangible assets. This goodwill represents a payment made in the expectation of future economic benefits arising from assets that cannot be identified individually and recognised separately. In the years following the year of acquisition, goodwill is measured at cost, net of any impairment losses accumulated. The ancillary costs of acquisition operations have been recognised in profit or loss during the year in which they are incurred or the services provided. Under IAS 10.23 changes in an investment in a subsidiary that do not lead to loss of control are recognised as equity transactions. Any difference between the proportion of shareholders’ equity acquired in the subsidiary and the fair value of the price paid or received is recognised directly in shareholders’ equity and allocated to the members of the holding company. Companies consolidated on a proportionate basis There were no jointly-controlled interests at 31 December 2014. Companies measured using the equity method When this method is used the carrying amounts of the investment is adjusted according to the relevant portion of shareholders’ equity, including the profit/loss for the year and all the adjustments made when consolidation is on a line-by-line basis. Any difference between the portion of shareholders' equity acquired and the fair value of the price paid (goodwill) is recognised in the carrying amount of the investment. Elimination of intercompany transactions When the consolidated financial statements are drawn up the amounts receivable and payable between companies included in the consolidation scope, the income and charges relating to transactions carried out between these companies and the profits and losses resulting from transactions carried out between these companies and not yet realised with parties external to the Group are eliminated.
91

Segment information
Segment reporting is carried out in accordance with IFRS 8 and is based on the major types of business in which the Group operates: - Non-Life business - Life business - Real Estate business - Other businesses.
Segment reporting is carried out through the separate consolidation of the accounting figures relating to the individual subsidiaries and associates belonging to each of the sectors identified, by eliminating the intragroup balances between companies in the same sector and cancelling, where applicable, the carrying amount of the investments in respect of the corresponding portion of shareholders’ equity. In the column “Intersegment eliminations”, the intragroup balances between companies in different sectors are eliminated.
The following are an exception of the above rule: investment relations between companies in different sectors given that the elimination of the investment
takes place directly in the sector of the company that holds the investment, while any consolidation difference is attributed to the sector of the investee;
dividends collected, eliminated in the sector of the company that collects the dividend; profits and expenses realised given that the elimination takes place directly in the sector of the company
that realises the capital gain or loss.
No segment reporting based on geographical areas has been produced since the Group operates mainly on a national level and there appears to be no significant difference in the risks and benefits, according to the type of business activity carried out, that can be correlated with the economic situation in the individual regions.
The layout of segment reporting conforms to the provisions of ISVAP Regulation no. 7/2007.
92

2. MAIN ACCOUNTING STANDARDS
New accounting standards
IFRS 10, 11, 12, amendments to IAS 27 and to IAS 28
On 12 May 2011, the IASB published the standards: − IFRS 10 “Consolidated Financial Statements”, which replaced IAS 27 concerning the part on the consolidated financial statements, and the interpretation SIC12; − IFRS 11 “Joint Arrangements” which replaced IAS 31; − IFRS 12 “Disclosure of Interests in Other Entities” which contains accounting disclosure requirements for IFRS 10 and 11; − IAS 27 “Separate Financial Statements”; − IAS 28 “Investments in Associates and Joint Ventures”.
According to IFRS 10, an investor has control over another company when it jointly has: − decision-making power to direct the ‘relevant activities’ (which affect returns); − exposure or rights to variable returns from its involvement with the investee; − the ability to affect those returns through its power over the investee.
IFRS 11 defines a joint arrangement as an arrangement of which two or more parties have joint control. It distinguishes between a joint operation and a joint venture: − a joint operation is a joint arrangement whereby the parties that have joint control of the arrangement have rights to the assets, and obligations for the liabilities, relating to the arrangement. For accounting purposes, assets and liabilities forming part of the arrangement are reflected in the financial statements using the reference accounting standard; − a joint venture is a joint arrangement whereby the parties that have joint control of the arrangement have rights to the net assets of the arrangement. These parties are defined as joint venturers. For accounting purposes, joint ventures are consolidated using the equity method.
The objective of IFRS 12 is to require entities to disclose information that enables users of financial statements to evaluate: − the nature of, and risks associated with, its interests in other entities; − the effects of those interests on its financial position, financial performance and cash flows.
The new IAS 27 “Separate Financial Statements” has the objective of setting standards to be applied in accounting for investments in subsidiaries, associates and interests in joint ventures in separate financial statements.
The objective of the new IAS 28 “Investments in Associates and Joint Ventures” is to prescribe the accounting for investments in associates and to set out the requirements for the application of the equity method when accounting for investments in associates and joint ventures.
IFRS 10, 11, 12, IAS 27 and IAS 28 were endorsed with Regulation (EU) no. 1254 of 11 December 2012 and entered into force on 1 January 2014.
93

IAS 32 Financial Instruments - Presentation
Regulation 1256/2012 of the European Commission of 13 December 2012, published in the Official Journal of the European Union L 360 of 29 December 2012, made amendments to IAS 32, with reference to the necessary requirements for offsetting financial assets and liabilities. The amendments have been in force since 1 January 2014.
Amendments to IFRS 10 and 12, and to IAS 27 - Investment Entities
On 31 October 2012 the IASB published the document “Investment Entities”, containing amendments to IFRS 10 “Consolidated Financial Statements”, to IFRS 12 “Disclosure of Interests in Other Entities” and to IAS 27 “Separate Financial Statements”; the aforesaid document amends IFRS 10 to require investment entities to measure their subsidiaries at fair value through profit or loss rather than consolidating them, better to represent their business model. Following this logic, IFRS 12 was amended to impose, if the exception to consolidation is applied, specific disclosure about the significant judgements and assumptions made by the entity in determining whether it is an investment entity. Consequently, IAS 27 was amended to provide an exception from the requirements of consolidation for “investment entities”, which instead are required to file their own separate financial statements as the sole financial statements and that, if they must nonetheless prepare the consolidated financial statements, they shall account for their investment in a subsidiary as a net investment measured at fair value through profit or loss in the consolidated financial statements in the same way as in the separate financial statements. The aforesaid amendments were endorsed with Regulation (EU) no. 1174 of 20 November 2013 and they have been in force since 1 January 2014.
Amendments to IFRS 10, 11 and 12 - Transition Guidance
Commission Regulation (EU) no. 313/2013 published in the Official Journal of the European Union, L 95 of 5 April 2013 endorses the amendments introduced by the document published by the IASB on 28 June 2012, limiting the requirement to provide adjusted comparative information to only the preceding comparative period in case of consolidation, as a result of the first application of IFRS 10, of previously unconsolidated investments (this transition relief is also extended to the transitional provisions of IFRS 11 and 12). The amendments have been in force since 1 January 2014.
Amendment to IAS 36 – Recoverable amount disclosures for non-financial assets
On 29 May 2013 the IASB published amendments to IAS 36 “Impairment of Assets”, to clarify that the disclosures required about the recoverable amount of the assets, when said amount is based on fair value less costs of disposal, pertain only to assets for which the entity has recognised an impairment loss during the reporting period. These amendments were endorsed with Regulation (EU) no. 1374 of 19 December 2013 and they have been in force since 1 January 2014.
Amendment to IAS 39 - Novation of OTC derivatives and continuing designation for hedge accounting
On 27 June 2013 the IASB published several amendments to its international accounting standard IAS 39 that set out to regulate the situations in which a derivative designated as a hedging instrument is novated from one counterparty to a central counterparty where that novation is required by legislation or regulation. In this way hedge accounting can continue regardless of the novation, which otherwise would not have been allowed without the amendment.
94

The amendments were endorsed with Regulation (EU) no. 1375 of 19 December 2013 and they have been in force since 1 January 2014.
Application of the new accounting standards described had no significant impact on the result and financial position of the Group.
IFRIC 21 - Levies
The IFRIC 21 interpretation was published on 20 May 2013. It was issued to identify the method and time of recognition and accounting of levies (other than income tax) imposed by a government entity for which the entity does not receive specific goods or services. The interpretation deals with both tax liabilities falling within the field of application of IAS 37 and tax liabilities whose timing and amounts are certain. The interpretation, approved with Regulation (EU) no. 634/2014 and published in the Official Journal L 175 of 14 June 2014, is applied starting from financial years beginning on 17 June 2014.
The amendments were endorsed with Regulation (EU) no. 1375 of 19 December 2013 and they have been in force since 1 January 2014.
New accounting standards which have still not entered into force
The accounting documents published by the International Accounting Standard Board are also outlined below, which could be significant for the Group, but which are still not applicable since they are still not approved by the European Union by EFRAG or are still not applicable.
IFRS 9 – Financial instruments
In late July IASB issued the final version of IFRS 9 “Financial Instruments”, the standard aimed at replacing the previous versions published in 2009 and 2010. The new standard winds up a process to reform the current IAS 39 in steps. It consists of the revision of the “classification and measurement”, “impairment” and “hedge accounting” rules (rules on macro hedging is still in the definition stage). Specifically with regard to financial assets, the new standard uses a single approach based on the financial instrument management methods and on the characteristics of the contractual cash flows of the assets themselves in order to determine the measurement criterion; the new impairment model, based on a concept of expected loss, is aimed at guaranteeing a more immediate recognition of losses compared to the current IAS 39 “incurred loss” model, while the rules concerning hedging relations sets out to ensure greater alignment between accounting representation of the hedges and the risk management policies. As of today the date the standard is scheduled to go into effect is 1 January 2018.
Amendments to IAS 16 and IAS 38 - Clarifications on the acceptable amortisation, depreciation and write-down methods
The amendments introduced to the two accounting standards set out to clarify that methods for calculating amortisation/depreciation based on revenues cannot be used because revenues reflect the methods for generating future economic benefits arising from the asset of the company of which the goods subject to amortisation/depreciation belong and on the other hand do not reflect the methods of consumption of the expected future economic benefits of the goods.
95

IAS 38 was amended with the introduction of a simple assumption based on which the methods for determining the amortisation of intangible fixed assets, based on revenues, are inappropriate for the same reasons explained with reference to IAS 16. The amendments to IAS 16 and IAS 38 will come into force starting from 1 January 2016.
Amendments to IFRS 11 - Accounting for acquisitions of interests in joint operations
The document provides clarifications on the subject of accounting for acquisitions of interests in joint operations, establishing that the purchaser of an interest in a joint operation formed by a company as defined by IFRS 3 must apply all business combination accounting rules established by IFRS 3 (a query was put to the IFRS Interpretations Committee, in which it was asked whether the purchaser of such an interest has to apply the standards set out by IFRS 3 “Business combinations” upon initial recognition of the purchase or if it should instead account for the purchase as a set of assets). The amendments introduced to IFRS 11 will come into force starting from 1 January 2016.
Amendments to IAS 27 - Equity method in separate financial statements
The document introduces the option to use the equity method to recognise interests in subsidiaries, joint operations and associates in the separate financial statements of an entity. As a result, an entity can recognise these interests in its separate financial statements alternatively to the cost, or according to the provisions of IFRS 9 (or IFRS 39), or by using the equity method. The date the amendments are scheduled to go into effect is 1 January 2016.
Amendments to IFRS 10 and IAS 28 - Sale or contribution of assets between an investor and its associate or joint venture
IFRS 10 was amended to establish that the gains or losses arising from the sale or contribution of a subsidiary that does not constitute a business to an associate or joint venture, measured according to the equity method, are recognised only within the limits of the third-party interest. IAS 28 was amended in order to establish that the gains or losses arising from a sale or contribution of a business by an investor to its associate or joint venture are to be totally recorded. The date the amendments are scheduled to go into effect is 1 January 2016.
Amendments to IAS 19 - Defined benefit plans: employee contributions
The amendments introduced to IAS 19 allow companies to present the contributions made by employees or third parties to defined benefit plans to reduce the service cost of the year in which the contributions are paid. The right is allowed for contributions that are independent from the number of years of service, so they do not related to the services the employee has rendered in the year the contributions are paid. The date the amendments are scheduled to go into effect is expected to start from the date the first financial year beginning on or after 1 February 2015 starts.
IFRS 15 - Revenue from contracts with customers
IFRS 15 replaces IAS 18 “Revenue”, IAS 11 “Construction contracts”, SIC 31 “Revenue - Barter transactions involving advertising services”, IFRIC 13 “Customer loyalty programmes”, and IFRIC 15 “Agreements for the construction of real estate”. The new revenue recognition model applies to all contracts with customers, except for contracts falling within the field of application of IAS 17 “Leasing”, insurance contracts and for financial instruments.
96

IFRS 15 identifies a five-step process for defining the timing and amount of revenues to recognise (1. Identify the contract(s) with a customer; 2. Identify the separate performance obligations in the contract; 3. Determine the transaction price; 4. Allocate the transaction price to the separate performance obligations; 5. Recognize revenue when (or as) the entity satisfies a performance obligation). The date the standard is scheduled to go into effect is 1 January 2017. ________________________________________________________________________________________
The accounting standards and the most significant criteria used in drawing up the consolidated financial statements are set out below. The paragraph numbers are the same as those of the corresponding items in the Statement of Financial Position and Income Statement, which are laid out in accordance with ISVAP Regulation 7/2007. Statement of financial position Assets 1 Intangible assets – IAS 38 In accordance with the provisions of IAS 38 only intangible assets that can be identified and controlled by the company, from which the company will derive financial benefits in future, can be capitalised. The following assets are recognised as intangible assets with a finite life:
- goodwill paid for the acquisition of Life portfolios: the value of the policies acquired is determined by estimating the present value of the future cash flows of the existing policies. The Group amortises this value throughout the expected average residual life. This valuation is reviewed annually;
- costs incurred for the acquisition of software licences, amortised over three years; - costs incurred for consultancy on major projects for developing and implementing IT systems, including
personalisation of the relative software, amortised over five or ten years according to their estimated useful life.
Projects under development are not amortised until the year in which they are first used. Goodwill paid when companies are acquired or merged is also included among intangible assets, as already mentioned in the paragraph Basis of consolidation (also provisionally, determined on the basis of IFRS 3). As this goodwill has an indefinite useful life it is not amortised but is tested for impairment at least once a year, or each time there is any indication of impairment; impairment losses are recognised in the income statement and cannot be reversed in subsequent years. 2 Property, plant and equipment – IAS 16 and 17 This item includes property used for corporate business, plant, other machinery and equipment. For recognising and measuring this category of assets the Group has adopted the cost model, which systematically depreciates the asset's depreciable amount over its useful life. Depreciation, which is carried out each year on a straight-line basis, begins when the asset is available and ready for use and ends when the asset has come to the end of its useful life (which in the case of buildings is estimated at 33.4 years). In the case of wholly-owned properties (land and buildings) depreciation is carried out only on the building.
97

Consolidated real estate companies include in the carrying amount the borrowing costs incurred for loans specifically for acquiring and renovating property, if this can be justified. The costs of improvements and conversions are capitalised if they result in an increase in the useful life or the carrying amount of the assets. Assets that suffer impairment losses are written down. The carrying amount of property acquired as a result of business combinations is reassessed on the basis of the current value on the date of acquisition. Financial leases relating to movables (company cars, IT equipment and miscellaneous equipment) are recognised in accordance with the provisions of IAS 17 under which, in the case of financial lease agreements, the cost of the items leased is recognised as property, plant and equipment, whereas the principal and end-of-lease purchasing payments are recognised as financial payables. 3 Technical provisions – Reinsurers’ share – IFRS 4 This item includes reinsurers' liabilities arising from reinsurance contracts governed by IFRS 4. 4 Investments 4.1 Investment Property – IAS 40 This item includes property held either to earn rental income or for capital appreciation or for both. Investment property is recognised by applying the cost method, as allowed by IAS 40 (an alternative to the fair value method). If the final recoverable amount of property is estimated to be less than the carrying amount (or zero) it is depreciated annually on a straight-line basis, based on the recoverable amount and the estimated useful life (33.4 years). This generally relates to instrumental properties by nature, such as hotels, shopping centres, office buildings. If the recoverable amount of the property is estimated to exceed the carrying amount no depreciation is applied. In the case of the Group this applies to residential property. In the case of wholly-owned properties (land and buildings) depreciation is carried out only on the building. The costs of improvements and conversions are capitalised if they result in an increase in the carrying amount, the useful life or the profitability of the assets. Assets that suffer impairment losses are depreciated. The market value is determined at least once a year by means of expert appraisals conducted by outside companies. The carrying amount of property acquired as a result of business combinations is reassessed on the basis of the current value on the date of acquisition. 4.2 Investments in subsidiaries, associates and interests in joint ventures – IAS 28 This item includes investments in associates as defined in IAS 28 and investments in subsidiaries that because of their size are considered immaterial, which are measured using the equity method or at cost.
98

Financial assets – IAS 32 and 39 – IFRS 7 – IFRS 13 IAS 39 provides that debt and equity instruments, receivables, payables and derivatives must be classified according to the purposes for which they are held. The following categories are provided for: - Held-to-maturity investments - Loans and receivables - Available-for-sale financial assets - Financial assets at fair value through profit or loss. There is a specific criterion for recognising and measuring each of these categories. It should be mentioned that the Group recognises financial transactions on the date they are measured. 4.3 Held-to-maturity investments Investments in securities held to maturity are recognised at amortised cost, net of any impairment losses. This category includes bonds that the Group intends and is in a financial position to hold to maturity, for example most of the fixed-yield bonds acquired to match special Life tariffs. If a substantial number of securities in this category are sold early (or reclassified), all the remaining securities must be reclassified as Available-for-sale financial assets and may not be used for the next two financial years. 4.4 Loans and receivables Receivables in this category consist of contracts for which the Group holds a right to the cash flows arising from the loan agreement. They are characterised by fixed or determinable payments and are not listed on an active market. This category also includes mortgages and loans provided to the insurance companies, reinsurers' deposits, loan repurchase agreements, term deposits exceeding 15 days, receivables for agents' reimbursements, unlisted debt securities not held for sale which the Group intends to hold for the foreseeable future, including bonds reclassified following application of IAS 39 paragraphs 50D and 50E. In accordance with the provisions of IAS 39, loans and receivables must be initially recognised at their fair value, which corresponds to the amount granted including the transaction costs and the commissions and fees chargeable directly. Following the initial recognition receivables are measured at the amortised cost, which is represented by the initial carrying amount net of repayments, plus or minus any difference between the initial amount and the amount on maturity because of depreciation calculated in accordance with the criterion of effective interest method and less any impairment loss or reduction due to non-recoverability. Applying the effective interest method enables the financial effect of a loan transaction to be spread evenly over its expected life, which makes financial sense. In fact, the effective interest rate is the rate that discounts all the future cash flows of the loan and establishes a present value corresponding to the amount granted including all the transaction costs and income pertaining to it. When the cash flows and the contractual term of the loan are being estimated, all the contractual terms that can affect the amounts and the maturity dates (for instance, early repayments and the various options that may be exercised) are taken into account but not the losses expected on the loan. Following initial recognition, for the whole life of the loan the amortised cost is determined by continuing to apply the effective interest rate fixed at the start of the transaction (original interest rate). This original interest rate does not vary over time and is also used in the case of any contractual
99
amendments to the interest rate or events which have made the loan non-interest bearing (for instance, due to insolvency proceedings). The amortised cost method is applied only to loan contracts with an original term of at least eighteen months, on the assumption that in the case of shorter contracts applying this method does not involve significant changes to the financial effect. Loans with a term of less than eighteen months and those that have no fixed maturity date or are revocable are therefore measured at their historical cost. On the reporting date for each set of financial statements or interim financial statements the loans are checked in order to identify those for which there is objective evidence of impairment owing to events that have occurred after they were initially recognised. The original value of the loans is reinstated in subsequent years only in the event that the reasons that led to the impairment in question no longer exist. Impairment losses can be reversed up to an amount not exceeding the carrying amount that it would have had if the amortised cost had been applied without prior impairment. 4.5 Available-for-sale financial assets Investments classified as available-for-sale financial assets are measured at fair value. The differences compared with the carrying amount must be recognised in shareholders’ equity in a specific reserve for unrealised gains/losses (net of tax). In the event of sale or impairment losses established as a result of impairment testing, unrealised gains or losses accumulated in shareholders’ equity until that time are transferred to the income statement. Information on how the fair value is determined is provided in the section “Fair value measurement criteria – IFRS 13”. The amortised cost of the debt securities in this category calculated according to the effective rate of return is recognised in profit or loss. The comparison with the fair value is made after the proportion of the amortised cost for the year has been recognised. This category includes debt securities, equity securities and UCITS units, investments deemed to be of strategic importance (less than 20% of the share capital, of commercial or company strategic importance). Impairment policy for financial assets adopted by the Group IAS 39, paragraph 58, provides that on each reporting date companies must check whether there is any objective evidence that a financial asset or a group of financial assets is impaired. In order to determine whether a financial asset or a group of financial assets shows signs of impairment it must be periodically tested for impairment. Indicators of a possible impairment are, for instance, the issuer's significant financial difficulties, failure to pay the full amount of interest or principal, the possibility of the beneficiary becoming bankrupt or entering into another insolvency proceeding and the disappearance of an active market for the asset. Pursuant to paragraph 61 of IAS 39, a “significant or prolonged” decline in the fair value of an equity instrument below its cost must be considered to be “objective evidence of impairment”. IAS 39 does not define the two terms “significant” and “prolonged” but implies, partly on the basis of an IFRIC guideline, that their meaning should be left to the directors whenever they have to draw up annual or interim financial statements under IFRS, provided that the meaning is determined in a reasonable manner and complies with paragraph 61 of IAS 39.
100

The Group defined as significant a reduction in the market value of equity instruments classified as Available-for-sale financial assets of 50% compared with the initial recognition and deemed as prolonged a market value remaining below the initially recognised amount for more than 36 months. Therefore, in the case of equity instruments the impairment test is carried out by selecting all the instruments to which at least one of the following conditions applies: a) the market price has remained below the initially recognised amount for the last 36 months; b) the impairment loss on the reporting date is more than 50% of the initial recognition amount. The impairment of these instruments is deemed to be confirmed and the total variation in fair value is recognised in profit or loss, with elimination of gains or losses on the underlying available-for-sale financial assets. In the case of debt securities, whenever payment of a coupon or repayment of principal is late or missed and this is confirmed by the custodian bank, the Group General Finance Area Department immediately notifies the relevant Risk Management Department of the need to recognise any impairment losses on these instruments. 4.6 Financial assets at fair value through profit or loss Investments in this category are recognised at fair value and the differences (positive or negative) between fair value and carrying amount are recognised through profit or loss. Information on how the fair value is determined is provided in the section “Fair value measurement criteria – IFRS 13”. There are two further subitems: - Held-for-trading financial assets, which includes debt and equity instruments, mainly listed, asset items in
derivative agreements and structured financial instruments where the embedded derivative would have to be separated if they were classified in a different category;
- Financial assets to be recognised at fair value through profit or loss, mainly consisting of assets linked to financial liabilities at fair value such as investments relating to policies issued by insurance companies where the investment risk is borne by the policyholders and those arising from pension fund management.
Derivatives Derivatives are initially recognised at the purchase cost representing the fair value and subsequently measured at fair value. Information on how the fair value is determined is provided in the section “Fair value measurement criteria – IFRS 13”. Derivatives may be acquired for “trading” or “hedging” purposes. In the case of hedging transactions IAS 39 provides for cumbersome and complex rules for drawing up appropriate documentation to be used to check the effectiveness of the hedge from the time it is activated and throughout its entire term (hedge accounting). Transactions on both fair value hedges and cash flow hedges were in existence at 31 December 2014. All financial instruments are classified in the category “Financial assets at fair value through profit or loss”.
101

Reclassifications of financial assets In the event that an available-for-sale financial asset is transferred to the category of held-to-maturity investments, the fair value recognised on the date of transfer becomes its new cost or amortisable cost. Any previous gain or loss on this asset that has been recognised directly in shareholders’ equity is recognised through profit or loss throughout the remaining useful life of the investment held to maturity using the effective interest method. If a financial asset is no longer held for sale or repurchased in the short term (although the financial asset may have been acquired or held mainly for sale or repurchase in the short term), it may be transferred from fair value through profit or loss if the following requirements are met: - the circumstances must be very unusual (IAS 39, paragraph 50B), or - the asset to be reclassified would have come under “loans and receivables” (if the financial asset had not
had to be classified as held for trading when initially recognised) and the entity has the intention and the ability to hold the financial asset for the foreseeable future or to maturity (IAS 39, paragraph 50D).
A financial asset classified as available for sale that would have come under loans and receivables (if it had not been designated as available for sale) may be transferred from “available for sale” to “loans and receivables” if the entity has the intention and the ability to hold the financial asset for the foreseeable future or to maturity (IAS 39, paragraph 50E). If an entity reclassifies a financial asset from fair value through profit or loss or from “available for sale” it must reclassify the financial asset at its fair value on the date of reclassification and the gain or loss already recognised in the income statement must not be reversed. The fair value of the financial asset on the date of reclassification becomes its new cost or amortised cost (IAS 39, paragraphs 50C and 50F). In the case of a financial asset reclassified from “available for sale”, the previous gain or loss on the asset recognised directly in shareholders’ equity must be amortised in the income statement throughout the asset’s remaining useful life using the effective interest method. If the entity has reclassified a financial asset from fair value through profit or loss or from “available for sale”, the following is some of the information that must be provided (IFRS 7): - the amount reclassified from and to each category; - for each year until it is derecognised, the carrying amount and the fair value of all financial assets
reclassified during the current and preceding year; - whether a financial asset was reclassified in accordance with paragraph 50B of IAS 39, however unusual
the situation, and the facts and the circumstances of the unusual situation; - for the financial year in which the financial asset was reclassified, the fair value gain or loss on the
financial asset; - for each year following reclassification (including the year in which the financial asset was reclassified)
until the financial asset is derecognised, the fair value gain or loss that would have been recognised if the financial asset had not been reclassified.
Accounting of structured bonds issued by special purpose vehicles (SPVs) The Group invests in notes issued by SPVs with rather similar purposes and management methods as those that characterise investments in structured and unstructured bonds, made as part of the ordinary financial management of resources derived from normal business. This financial management, in relation to the Group’s business sector, is especially complex which makes it necessary, in certain circumstances, for the subscription
102

of financial assets with specific characteristics (e.g. in terms of maturity, creditworthiness and payoff), which are not always easy to find on financial markets. The investment opportunities offered via SPVs also make it possible, owing to their specific nature, to expand the range of financial investments available.
The Group classifies and records the bonds issued by SPVs based on the instructions provided in IAS 39, deeming the circumstance that they have been issued by SPVs irrelevant, in consideration of the fact that the SPV is, in fact, considered merely a technical instrument through which to structure complex financial instruments whose risk/return profile is essentially evaluated by jointly taking into consideration the contracts that govern the notes issued by the SPV, the associated derivative contracts (generally swap agreements) and any other contractual clauses such as financial guarantee or similar clauses, or yet other “ancillary” clauses which may, in theory, make provision, when given conditions are satisfied, for the liquidation of the securities. The SPVs whose bonds are held by the Group in fact, consistently replicate, with the arranger, the positions they assume with noteholders, as the risks or returns of the transaction cannot be retained within it.
As regards the above, investments in notes issued by SPVs are accounted for on the basis of IAS 39, with the same criteria applied for the investments in structured and unstructured bonds, with particular regard to the presence of embedded derivatives and valuations regarding any segregation. In fact, pursuant to IAS 10, paragraphs 6 and 7, an entity must only consolidate an SPV in the event the entity exercises control over it.
The Group, in relation to bonds issued by SPVs in the portfolio at 31 December 2014, does not exercise any form of control over the SPVs, in the sense that it is not able to govern the management process of the SPVs (which, in fact, is defined by the arrangers of the investment transaction in which the Group participates by subscribing the notes and other relevant contracts) and does not obtain any benefits from the SPVs other than those strictly dependent on the formally subscribed financial instrument. The Group holds the notes issued by the SPV and can only dispose of them autonomously, given it has no power to dispose of the financial instruments held by the vehicle. It is reasonable to deduce, from these considerations, that the Group holds no form of control of the SPVs in accordance with IFRS 10.
In cases where, through the SPV internal segments, which segregate the risks and benefits of issues, the majority of said risks and benefits are transferred to the Group, in essence, the consolidation of the segments would lead to the need to replace the debt securities issued by the SPV and subscribed by the Group with a financial asset which, in terms of the associated risks and returns, exactly replicates the financial profile of the notes cancelled due to the consolidation. In fact, the segments consistently replicate, with the arranger, the positions the latter assume with noteholders, as the risks or benefits of the transaction cannot be retained within it. The result is that the financial asset to be recognised due to the consolidation of the segments would have, substantively speaking and therefore for the purposes of classification and measurement pursuant to IAS 39, identical characteristics to those of the notes cancelled due to the consolidation of said segment; the result being that, in the case of consolidation of segments in which the risks/benefits of the asset pertain fully to the Group, there would be no substantive effects on the accounting representation of the transaction, essentially confirming the fact that, in effect, the SPVs are technical instruments for realising an investment in financial assets with characteristics which are, for all intents and purposes, equivalent to those of the notes issued by the SPV itself and segregated in the segment.
5 Sundry receivables
Sundry receivables are recognised at their nominal value and subsequently assessed at their estimated realisable value.
103

The item Sundry receivables includes receivables due within twelve months, in particular Receivables relating to direct insurance business, Receivables relating to reinsurance business and Other receivables, such as trade receivables and tax receivables.
6 Other assets
6.1 Non-current assets or assets of a disposal group held for sale – IFRS 5
This item includes Non-current assets held for sale and any discontinued operations as defined by IFRS 5.
Assets held for sale are recognised at the carrying amount or fair value, whichever is the lower, less costs to sell. If an investment in a subsidiary consolidated using the line-by-line method is to be sold within the time limit laid down by IFRS 5, all the assets of the company to be sold are reclassified as “Non-current assets or assets of a disposal group held for sale” in the consolidated statement of financial position (item 6.1 of the Assets) and the liabilities are similarly reclassified under the single item “Liabilities associated with disposal groups” (item 6.1 of the Liabilities). Both items appear in the consolidated financial statements net of intercompany transactions with the company to be sold.
If the group continues to operate in the business of the company to be sold, income statement items relating to the assets held for sale or disposal groups are recognised in accordance with the normal rules of consolidation on a line-by-line basis.
6.2 Deferred acquisition costs
This item includes acquisition costs for multiyear insurance contracts, paid in advance and amortised on a straight-line basis over the maximum life of the contracts.
6.3 Deferred tax assets – IAS 12
This item includes Deferred tax assets based on the deductible temporary differences between the carrying amounts and the amounts for tax purposes of the assets and liabilities of the individual consolidated companies and on the consolidation adjustments. If there are any tax losses, deferred tax assets are also recognised provided there is a probability that taxable income for which they can be used will be available in future. Deferred taxes are based on the tax rates ruling at the end of the year or on the rates that are expected to be applied in future based on information available at the end of the financial year.
If assets are revalued solely for tax purposes and relate neither to a revaluation of the carrying amount for a previous year nor to one that is to be carried out in a subsequent year, the tax effects of the adjustment for tax purposes must be recognised in the income statement.
From 2014 deferred tax assets and liabilities, distinguished by type of tax on the single Group company level or at consolidated level, are offset.
6.4 Current tax assets – IAS 12
This item includes assets relating to current taxation.
104

6.5 Other assets Among other things, this item includes prepayments and accrued income and deferred commission expense relating to investment contracts with no discretionary participation feature, since they are additional costs incurred to acquire the contract and are amortised on a straight-line basis over the whole life of the contract. 7 Cash and cash equivalents – IAS 7 Cash and cash equivalents include cash on hand, cash in current accounts available on demand and term deposits for periods not exceeding 15 days. Liabilities 1. Shareholders’ Equity – IAS 32 1.1.1 Share capital The item includes the share capital of the ultimate parent. 1.1.2 Other equity instruments The item comprises the component attributable to equity instruments representative of the Convertible Loan issued by UnipolSai (IAS 32.15). 1.1.3 Capital reserves This item includes in particular the Share premium reserve of the company that carries out the consolidation. It includes the direct costs of issuing equity instruments, net of tax, and any commission income, net of tax, received for the sale of option rights not exercised by shareholders. 1.1.4 Income-related and other equity reserves In particular this item includes gains or losses arising from the first-time application of IAS/IFRS (IFRS 1), gains or losses resulting from changes in accounting standards or accounting estimates (IAS 8), equalisation and catastrophe provisions eliminated under IFRS 4, provisions arising from equity-settled share-based payment transactions (IFRS 2) and the consolidation reserves. 1.1.5 Treasury shares This item includes the equity instruments of the undertaking that draws up the consolidated financial statements owned by the undertaking itself and the consolidated companies. The item was negative. The gains or losses resulting from their subsequent sale are recognised as changes in shareholders’ equity. 1.1.6 Reserve for foreign currency translation differences The item includes the exchange rate differences to charge to shareholders’ equity pursuant to IAS 21, whether they arise from transactions in foreign currency or from conversion into the currency of presentation of the financial statements stated in foreign currency.
105
1.1.7 Gains or losses on available-for-sale financial assets This item includes gains or losses on available-for-sale financial assets, net of tax and amounts pertaining to policyholders as a result of the application of shadow accounting. 1.1.8 Other gains or losses recognised directly in equity This item includes, inter alia, gains or losses on cash flow hedges and the revaluation reserves of property, plant and equipment and intangible assets. 2 Provisions – IAS 37 Provisions are made for risks and charges only when they are deemed necessary to meet an obligation arising from a past event and when it is likely that the amount of resources required can be reliably estimated. 3 Technical provisions – IFRS 4 Classification of insurance contracts According to IFRS 4 insurance contracts are contracts that transfer significant insurance risks. Such contracts may also transfer financial risks. An insurance risk is significant if, and only if, there is a reasonable possibility that the occurrence of the insured event will cause a significant change in the current value of the insurer's net cash flows. Investment contracts are contracts that transfer financial risks but involve no significant insurance risks. Some insurance and investment contracts may include discretionary participation features. All the policies in the Non-Life portfolio at 31 December 2014 were classified as insurance contracts. As regards the Life segment, the principal criteria used for classifying Life products as insurance policies were: the presence of a significant insurance risk, i.e. the reasonable possibility that the occurrence of the
insured event would give rise to the payment of significant “additional benefits” compared with those that would have been payable if the insured event had not taken place. The criteria for identifying the presence of significant insurance risk are structured as follows: o above 10% the contract is insurance o under 5% the contract is financial o between 5% and 10% specific product analyses are carried out
the presence of options or guarantees, such as the coefficient of conversion into a guaranteed rate annuity.
Some contracts provide for discretionary participation features (DPF) i.e. the policyholder's right to receive a benefit in addition to the guaranteed minimum. The benefit must fulfil specific contractual terms and represent a significant part of the total payments. In particular, contracts subject to revaluation and linked to segregated accounts were classified as investment products with DPF and were therefore measured and recognised as insurance contracts. A contract classified as an insurance contract remains an insurance contract until it is terminated, whereas under certain circumstances an investment contract may be subsequently classified as an insurance contract.
106

However, the following types of contract were classified as investment contracts with no DPFs. For this reason, according to paragraph 3 of IFRS 4, contracts of this type do not produce premiums but are measured and recognised in accordance with IAS 39: index-linked, where the sum insured in the event of death corresponds to the value of the asset plus a
small percentage; unit-linked, where the sum insured in the event of death corresponds to the NAV plus a small percentage; mixed, where funding is specific and the technical rate is zero; capital redemption, where funding is specific and the technical rate is zero; pension funds with guaranteed benefit when the policy matures or when certain events occur. In the case of unit-linked products the loading and the acquisition commissions for the asset management service are recognised and amortised separately over the life of the contract. In the case of index-linked policies, which are not managed over time but only administered, these deferments are not necessary. Non-Life business technical provisions Premium provision The direct insurance premium provision is established analytically for each policy using the pro rata temporis method, on the basis of the gross premiums written less acquisition commissions and the other acquisition costs that are chargeable directly. In the case of long-term contracts the amount of amortisation for the year is deducted. Under certain conditions the premium provision also includes the premium provision for unexpired risks, calculated in accordance with the simplified method laid down in Article 10 of ISVAP Regulation 16 of 4 March 2008, which is based on the expected loss ratio for the year, adjusted on a prospective basis. In the case of Credit insurance the flat-rate procedure provided for by the Ministerial Decree of 23 May 1981 was applied to premiums received before 1992, whilst the pro rata temporis method has been applied to contracts issued from 1992 onwards. In the case of Bond insurance the premium provision has been calculated using the pro rata temporis method combined with the criteria laid down by ISVAP Regulation 16. The total amount allocated to this provision is sufficient to meet costs arising from the portion of risk pertaining to subsequent years. The reinsurers’ share of the premium provisions is calculated by applying to the premiums ceded the same criteria as those used for calculating the premiums for direct insurance business provision. Ageing provision The ageing provision is calculated at a flat rate of 10% on Health policies in the portfolio that have the features provided for by Art. 46 of ISVAP Regulation no. 16 (multiyear health policies when the premium is not based on increasing age). Claims provision The claims provision is ascertained analytically by estimating the presumed cost of all the claims outstanding at the end of the year and on the basis of prudent technical valuations carried out with reference to objective elements, in order to ensure that the total amount set aside is enough to meet the claims to be settled and the relative direct expenses and settlement expenses. The figures ascertained in this way are analysed and checked by Head Office. Subsequently, in order to take account of all reasonably foreseeable future charges, actuarial-statistical methods are used to determine the
107

final level of the claims provision. The claims provision also includes the amounts set aside for claims incurred but not reported, based on past experience of IBNR for previous years. The reinsurers' share of the claims provision reflects the sums recovered from them to meet the reserves, the amounts being laid down in the individual policies or in the contracts. Provision arising from the adequacy test for Non-Life technical provisions The Non-Life technical provisions have been subjected to the test provided for by IFRS 4 (Liability Adequacy Test – LAT). In order to monitor the adequacy of the premium provision the supplementary provision for Unexpired Risks is calculated for each individual company and class of business using the simplified method provided for in ISVAP Regulation no. 16, Art. 11. As claims for the year are measured at final cost and not discounted, future payment flows can be deemed to have implicitly taken place (LAT on the claims provision). Life business technical provisions The amount recognised is calculated in accordance with the provisions of Art. 36 of Legislative Decree 209 of 7 September 2005 (Insurance Code) and ISVAP Regulation 21 of 28 March 2008 as amended. Mathematical provisions The mathematical provision for direct assurance is calculated analytically for each contract on the basis of pure premiums, with no deductions for policy acquisition costs, and by reference to the actuarial assumptions (technical interest rates, demographic models of death or disability) used to calculate the premiums on existing contracts. The mathematical provision includes the portion of pure premiums in relation to the premiums accrued during the year. It also includes all the revaluations made under the terms of the policy and is never less than the surrender value. In accordance with the provisions of Art. 38 of Legislative Decree 173/1997, technical provisions, which are set up to cover liabilities deriving from insurance policies where the yield is based on investments or indices for which the policyholder bears the risk, and provisions arising from pension fund management, are calculated by reference to commitments made under these policies and to the provisions of Art. 41 of Legislative Decree 209 of 7 September 2005. In the case of index-linked policies in particular the mathematical provisions are calculated on the basis of the price of the underlying securities, whilst in the case of unit-linked policies the mathematical provisions are calculated by multiplying the number of units by the price of the funds concerned on the date they are calculated. In the case of Pension Funds, and particularly, policies that offer a guaranteed minimum return on payments when the policy matures or on retirement, death or disability, the mathematical provision may be increased by a further provision required to cover the risk of including the value of the underlying assets. This supplement is calculated by taking into account any differences between the guaranteed minimum values and the values of the underlying assets during the guarantee period estimated stochastically and by discounting the result on the date the provisions are calculated. The mathematical provisions are calculated analytically for each individual contract taking into account the policies outstanding at the reporting date, their respective start dates and all the liabilities assumed under the policies. As laid down in Art. 36, paragraph 3, of Legislative Decree 209 of 7 September 2005, the provision for amounts payable includes the total amount needed to cover payment of benefits that have fallen due but not
108

so far been paid, surrendered policies and claims not yet paid. The provision for profit participation and reversal was set up to cover the Group's commitment to allocate to certain contracts on a temporary group tariff in the event of death and/or disability sums accrued during the year as technical profits arising from the yield on individual contracts. Other technical provisions consist almost entirely of amounts set aside for operating expenses and are calculated on the basis of the provisions of Articles 31 and 34 of ISVAP Regulation 21. In accordance with specific provisions issued by the Supervisory Authority the mathematical provisions are supplemented by the following additional provisions: Supplementary provisions based on demographics (Article 50 of ISVAP Regulation no. 21) An additional provision has been set up to supplement the provision held as a hedge against liabilities to policyholders whose benefit is in the form of a life annuity or in the form of a lump sum with guaranteed coefficients of conversion into an annuity. This supplementary provision is calculated by the companies in the Group comparing the demographics used in the tariff with the latest demographic tables such as the RG48, which shows details of both sexes separately, the IPS55 for men and the SIMPS71. Coefficients that reflect each individual company’s propensity to choose the annuity offered are applied to the levels of provision obtained in this way. Additional provisions Under Art. 38, paragraph 3, of Legislative Decree 173/1997, the mathematical provision includes provisions set up to hedge the risk of mortality in insurance contracts in Class III (as laid down in Art. 2, paragraph 1, of Legislative Decree 209 of 7/9/2005), which provide a benefit should the insured party die during the term of the contract. In the case of insurance contracts in Class III and Class VI the mathematical provision also includes the provisions set up to fund guaranteed benefits on maturity or when certain events occur (as laid down in Art. 2, paragraph 1, of Legislative Decree 209 of 7/9/2005). Provision for expenses In the case of policies with a premium payment period shorter than the term of the insurance (single premium, low annual premium, reduced) a provision is set aside for expenses calculated on the basis of the operating loadings held as a hedge against future operating expenses. In the case of index-linked tariffs the provision for operating expenses has been set up using the difference between the value of the net premium and the initial value of the policy less the initial marketing cost incurred by the company. This amount, which remains valid throughout the life of the contract, has been set aside for the remaining period of each individual contract. Additional provisions for temporary mismatching (Article 37 of ISVAP Regulation no. 21) These provisions are used as a hedge against the financial effects of fluctuations in the returns on separately managed accounts and take account of the part of the return to be retroceded to the policies that because of the temporary mismatch is not covered by the return on the investments and that is expected to be obtained during the same period. This provision is important in the case of separately managed accounts that provide for only one annual rate of return, retroceded/paid to policyholders for each subsequent period of twelve months. Additional provision for financial risks (Articles 47 and 48 of ISVAP Regulation 21) The mathematical provisions are combined with an item held as a hedge against a possible discrepancy between the expected rates of return on the assets held as a hedge against the technical provisions linked to separately managed accounts and commitments by way of levels of financial guarantees and adjustments made to the benefits provided under the policies.
109

The liability adequacy test was also carried out in accordance with IFRS 4, to verify that the technical provisions were adequate to cover the present value of future cash flows relating to insurance contracts. The test was performed by projecting the cash flows and taking into account the following elements: services guaranteed broken down by guarantee line, projected on the basis of contractual conditions; trend in the existing portfolio relating to recurring payment aspects, expiry of contracts, policyholder
mortality and propensity to redemption; costs and revenue associated with portfolio management and liquidation. Provision for shadow accounting The shadow accounting technique set out in IFRS 4 enables the unrealised losses and/or gains on the underlying assets to be recognised as technical provisions for insurance or investment contracts that offer discretionary participation features as if they had been realised. This adjustment is recognised in shareholders’ equity or in the income statement depending on whether the losses or gains in question are recognised in shareholders’ equity or in the income statement. Net losses are recognised in the provision for deferred financial liabilities to policyholders only after the guaranteed minimum has been reached, otherwise the company continues to bear them in full. Losses are quantified using a financial prospective method in line with Chapter I of ISVAP Regulation no. 21. Applying shadow accounting enables the value mismatch between technical provisions and related assets to be mitigated and is therefore deemed to be more representative of the economic substance of the transactions in question. 4 Financial liabilities – IAS 39 This item includes the financial liabilities at fair value through profit or loss and the financial liabilities measured at amortised cost. 4.1 Financial liabilities at fair value through profit or loss The financial liabilities in this category are subdivided into two further subitems: - held-for-trading financial liabilities which include negative items on derivatives; - financial liabilities to be measured at fair value through profit or loss, which include the financial liabilities
relating to contracts issued by insurance companies where the investment risk is borne by the policyholders, when the insurance risk is not significant, and where there is no discretionary participation feature.
4.2 Financial liabilities at amortised cost This item includes interbank payables and payables to bank customers, deposits received from reinsurers, debt securities issued, other loans obtained and liabilities on Life policies with a financial content where the insurance risk is not significant and there is no discretionary participation feature (some types of product matched by specific funding). 5 Payables Payables includes Payables arising from direct insurance business, Payables arising from reinsurance business and Other payables, such as trade payables, payables for policyholders' tax due, payables for post-employment benefits, sundry tax payables and social security charges payable.
110

Payables are recognised at their nominal value.
Employee benefits – IAS 19 The post-employment benefits accrued by 31 December 2006 that have not been transferred to external bodies in accordance with the provisions of Legislative Decree 252/05 relating to supplementary pension schemes comes under the category of employee benefits classified as a defined benefits plan. The amount due to employees is therefore calculated using actuarial techniques and discounted at the reporting date, using the “Projected unit credit method” (a method based on benefits accrued in proportion to length of employment). The same method is used to determine the effects of other defined benefits for employees post-employment.
Actuarial gains and losses relating to obligations deriving from defined benefit plans are recorded under Other comprehensive income (expense). Future cash flows are discounted on the basis of the market return curve, recorded at the end of the year, of corporate bonds issued by issuers of high credit standing.
The service cost and net interest are recognised in the separate income statement.
Net interest is calculated by applying to the net value of liabilities for defined benefits existing at the start of the year the one-year interest rate taken from the return curve used to discount the liability at the end of the previous year.
6 Other liabilities
6.1 Liabilities associated with disposal groups – IFRS 5
Please see above for the corresponding asset item.
6.2 Deferred tax liabilities – IAS 12
Deferred tax liabilities are recognised whenever there is a taxable temporary difference, except in the cases provided for in paragraph 15 of IAS 12. Deferred tax liabilities must be measured using the tax rates that are expected to apply during the year in which the tax liability will be paid off, based on the ruling tax rates (and tax legislation) or those in force at the reporting date. If tax rates change, despite being prior year items, the deferred taxes recalculated in accordance with the new rates are recognised under Income tax in the income statement or under equity reserves to which the temporary variations in question apply.
As regards deferred tax assets and liabilities, please refer to the foregoing paragraph “6.3 Deferred tax assets - IAS 12” included in the section concerning Assets.
6.3 Current tax liabilities
This item includes current Tax payables.
111

6.4 Other liabilities
This item includes, inter alia, accrued expense and deferred income, accruals for commissions on premiums under collection and deferred commission income relating to investment contracts with no discretionary participation feature required in advance for the contract-administration service or for the investment-management service, amortised on a straight-line basis over the life of the contract or, in the case of whole-Life contracts, over the “expected” life of the contract.
Income Statement
1 Revenue and income
1.1 Net premiums
This item includes earned premiums relating to insurance contracts and financial instruments that include discretionary participation features, net of reinsurance. Premiums are recognised at the time they are due. The total for the year is obtained by adding the premium provision.
1.2 Commission income
This item includes commission income for financial services provided. It includes commission income arising from banking business and loadings pertaining to the year, relating to Life assurance contracts classified as financial liabilities. In the case of unit-linked policies, in particular, the acquisition loadings relating to the asset management service provided have been recognised and deferred throughout the term of the contract.
1.3 Net gains on financial instruments at fair value through profit or loss
This item includes realised gains and losses, interest, dividends, charges and positive and negative changes in value of financial assets and liabilities at fair value through profit or loss.
1.4 Gains on investments in subsidiaries, associates and interests in joint ventures
This item includes investments in subsidiaries, associates and interests in joint ventures recognised in the corresponding asset item.
1.5 Gains on financial instruments and other investments
This item includes gains on investments that do not come under the previous two categories. Mainly included are interest income on “Loans and receivables” and on securities classified as available-for-sale financial assets and held to maturity, other investment income, including dividends and rental income from investment property, and realised gains on the sale of financial assets or liabilities and investment property.
1.6 Other revenue
This item includes income arising from the sale of goods, the provision of services other than those of a financial nature and the use by third parties of the company's property, plant and equipment and other assets. It also includes other net technical income on insurance contracts, exchange rate differences allocated to the
112

income statement as per IAS 21, realised gains and reversals of impairment losses on property, plant and equipment and other assets.
2 Costs and charges
2.1 Net charges relating to claims
This item includes the amounts paid out during the year for claims, matured policies and surrendered policies and the amount of changes in the technical provisions relating to contracts that fall within the scope of IFRS 4, net of amounts recovered and of outwards reinsurance.
2.2 Commission expense
This item includes commission expense for financial services received. It includes commission expense arising from banking business and commissions on Life assurance contracts classified as financial liabilities. In particular, acquisition commissions paid for the placement of unit-linked policies are amortised throughout the term of the contract to meet deferred acquisition loadings.
2.3 Losses on investments in subsidiaries, associates and interests in joint ventures
This item includes losses on investments in subsidiaries, associates and interests in joint ventures recognised in the corresponding asset item.
2.4 Losses on other financial instruments and investment property
This item includes losses on investment property and financial instruments other than investments and financial instruments classified as “Assets at fair value through profit or loss”. It mainly includes interest expense on financial liabilities, other investment expense, costs relating to investment property such as condominium expenses and maintenance expenses that do not increase the value of the investment property, losses realised as a result of the derecognition of financial assets or liabilities and investment property, depreciation and impairment losses.
2.5 Operating expenses
This item includes commissions and other acquisition costs relating to insurance contracts, investment management expenses, other administrative expenses and depreciation (overheads and personnel expenses that are not allocated to losses relating to claims, insurance contract acquisition expenses or investment management expenses). 2.6 Other costs
This item mainly includes other net technical charges relating to insurance contracts, additional amounts set aside during the year, exchange rate differences to be allocated to the income statement under IAS 21, realised losses and depreciation and amortisation relating to property, plant and equipment, investment property and intangible assets, not allocated to other cost items.
3 Income tax
For the 2014 tax period, UnipolSai acts as consolidating company for tax purposes for the subsidiaries that fulfil the requirements, pursuant to Art. 117 et seq. of Presidential Decree 917/86 and Ministerial Decree 9 June 2004.
113

UnipolSai signed an agreement with the respective consolidated companies regulating the financial and procedural aspects governing the option in question.
Charges/income linked to the transfer to the ultimate parent of the IRES tax result/tax loss are calculated in accordance with legislation, taking into account the relevant exemptions and the tax credits due, and the terms of the respective agreements with the ultimate parent and are recognised under Income tax in the income statement. IRAP for the year is also recognised under Income tax. The item also includes deferred tax assets and liabilities, based on the temporary differences (that have arisen or been deducted during the year) between the profit (loss) for the year and the taxable income and on the consolidation adjustments. In respect of tax losses prior to the applicable period of tax consolidation, deferred tax assets are recognised to the extent in which said losses can be reasonably used against future IRES income. Foreign currency transactions – IAS 21 Items expressed in foreign currencies are dealt with in accordance with the principles of multicurrency accounting. Monetary elements in foreign currency (units of currency owned and assets or liabilities that must be received or paid in a fixed or ascertainable number of units of currency) are translated using the exchange rate applicable at the end of the year. Non-monetary elements measured at historical cost in foreign currency are translated using the exchange rate applicable on the date of the transaction. Non-monetary elements measured at fair value in a foreign currency are translated using the exchange rates applicable on the date on which the fair value is determined. Exchange rate differences arising from the settlement of monetary elements are recognised in the income statement. Exchange rate differences arising when non-monetary elements are measured are allocated to the profit (or loss) for the year or to other comprehensive income (expense) depending on whether the profit (or loss) to which they relate is recognised in the profit (loss) for the year or in other comprehensive income (expense), respectively. Earnings per share – IAS 33 Basic earnings per share are calculated by dividing the profit allocated to holders of ordinary shares in UnipolSai by the weighted average number of ordinary shares outstanding during the year. Diluted earnings per share are calculated by dividing the profit allocated to holders of ordinary shares in UnipolSai by the weighted average number of any additional ordinary shares that would be outstanding if all the potential ordinary shares with dilutive effect were converted. If the result is negative, the loss (basic and diluted) per share is calculated. Use of estimates The application of certain accounting standards implies significant elements of judgment based on estimates and assumptions which are uncertain at the time they are formulated. As regards the 2014 financial statements, it is believed that the assumptions made are appropriate and, subsequently, that the financial statements have been drafted with clarity and give a true and fair view of the equity-financial position and economic result. In order to formulate reliable estimates and assumptions, reference has been made to past experience, and to other factors considered reasonable for the case in question, based on all information available. However, we
114

cannot exclude the fact that changes in these estimates and assumptions may have significant effects on the equity and economic position and on the assets and liabilities reported in the financial statements for disclosure purposes, if different judgment elements emerge with respect to those expressed in due course.
The estimates mainly concern: technical Life and Non-Life provisions; the assets and liabilities designated at fair value (particularly for level 2 and 3 financial instruments); the analyses targeted at identifying any impairment of intangible assets (e.g. goodwill) booked to the
financial statements (impairment test); the quantification of provisions for risks and charges and provisions for employee benefits.
For information on the methods used to determine the items in question and the main risk factors, please refer to the sections containing a description of the measurement criteria.
IFRS 13 – Fair value measurement criteria
IFRS 13 provides a guide on how to measure the fair value of financial instruments and non-financial assets and liabilities already required or permitted by other accounting standards (IFRS) This standard: a) defines the fair value;b) groups into a single accounting standard the rules for measuring fair value;c) enriches financial statement information.
The standard defines fair value as the sale price of an asset based on an ordinary transaction or the transfer price of a liability between market participants at the measurement date and under market conditions (exit price). The fair value is a market measurement and not an entity-specific measurement; as such, the valuations must be made on the basis of the assumptions and models mainly used by market participants, including assumptions about the risk of the asset or liability being measured. When a market price is not observable, the measurement methods which maximise the use of observable parameters and minimise the use of non-observable parameters must mainly be used.
IFRS 13 defines a fair value hierarchy based on the level of observability of the inputs contained in measurement techniques used to measure fair value.
IFRS 13 governs the fair value measurement and the associated disclosure also for assets and liabilities not measured at fair value on a recurring basis in the statement of financial position. For these assets and liabilities, fair value is calculated for financial statement disclosure purposes. It should also be noted that since said assets and liabilities are not generally exchanged, the determination of their fair value is based primarily on the use of internal parameters not directly observable on the market, with the sole exception of listed securities classified in the category “Held-to-maturity investments”.
115

Fair value measurement criteria
The table below shows the possible methods for determining the fair value for the different categories of assets and liabilities.
Mark to Market Mark to Model and otherCBBT contributor - Bloomberg Mark to Model
Other contributor - Bloomberg Counterparty valuation
Listed shares and investments, ETFs Reference market
Unlisted shares and investments
DCF
DDM
Multiples
Listed derivatives Reference marketOTC derivatives Mark to ModelUCITS
ReceivablesTrade receivables (Mark to Model)
Other receivables (carry ing amount)
Property Appraisal value
FAIR VALUE MEASUREMENT METHOD
Financial
Instruments
Bonds
Net Asset Value
In compliance with IFRS 13, in order to determine the fair value of financial instruments, in the presence of instruments handled in liquid and active markets, the market price is used (Mark to Market).
“Liquid and active market” means: a) the regulated market in which the instrument subject to measurement is traded and regularly listed;b) the multilateral trading system (MTF) in which the instrument subject to measurement is traded and
regularly listed;c) quotations and transactions performed on a regular basis by an authorised intermediary (hereinafter
“contributor”).
Mark to Market valuations
With reference to shares, listed investments, UCITS units and listed derivatives, the Mark to Market valuation corresponds to the official valuation price of the market. In relation to bonds, the sources used for the Mark to Market valuation of financial assets and liabilities are as follows: a) the primary source is represented by the CBBT price provided by data provider Bloomberg;b) where the price referred to point a) is unavailable, an internal scoring model validated by Risk
Management is used, which makes it possible to select liquid and active contributors on the basis ofcertain defined parameters. The parameters used are represented by: number of prices available in the last 10 business trading days; price volatility; bid/ask spread;
standard deviation of prices with respect to the average of the other contributors available.
116
Mark to Model valuations
The Group uses valuation methods (Mark to Model) in line with the methods generally used by the market. With reference to bonds in cases in which, also on the basis of the results of the Scoring Model, it is not possible to measure an instrument using the Mark to Market method, the fair value is attributed on the basis of Mark to Model type valuations. The valuation of OTC type derivative contracts makes provision for the use of models consistent with the risk factor underlying said contract. The fair value of interest rate derivatives and inflation-linked contracts is determined on the basis of Mark to Model type valuations, acknowledging the rules set forth in IFRS 13. For derivatives on which a collateralisation agreement is provided (Credit Support Annex) between the companies of the UnipolSai Group and the authorised market counterparties, provision is made for use of the EONIA discount curve (Euro OverNight Index Average). In the event of uncollateralised derivatives, provision is made for the use of CVA (Credit Valuation Adjustment) and DVA (Debit Valuation Adjustment) adjustments. It should be noted that, at 31 December 2014, almost all derivative positions related to collateralised contracts for which CSA agreements are in place with the counterparties involved in the trading.
The objective of the models for calculating the fair value is to obtain a value for the financial instrument consistent with the assumptions that market participants would use to formulate a price, assumptions that also concern the risk inherent in a particular valuation technique and/or in the inputs used. For the proper Mark to Model valuation of each category of instrument, adequate and consistent pricing models must be defined beforehand as well as the market parameters.
The list of the main models used within the UnipolSai Group for Mark to Model pricing is shown below:
Securities and interest rate derivatives Discounted cash flows; Black ; Black-Derman-Toy; Hull & White 1,2 factors; Libor Market Model; Longstaff & Schwartz; Kirk.
Securities and inflation derivatives Discounted cash flows; Jarrow-Yildirim.
Securities and share, index and exchange rate derivatives Discounted cash flows; Black - Scholes.
Securities and credit derivatives Discounted cash flows; Hazard rate models.
The main observable market parameters used to perform the Mark to Model valuations are as follows: interest rate curves for reference currency; interest rate volatility surface for reference currency; CDS spread or Asset Swap spread curves of the issuer;
117

inflation curves for reference currency; reference exchange rates; exchange rate volatility surface; share or index volatility surface; share reference prices; reference inflation curves.
The main observable market parameters used to perform the Mark to Model valuations are as follows: correlation matrices between change of risk factors; historical volatility; benchmark spread curves constructed to assess bonds of issuers for which the prices of the bonds issued or CDS curves are
unavailable; credit risk parameters such as the recovery rate; delinquency or default rates and prepayment curves for ABS type financial instruments.
With reference to the bonds in those cases, also on the basis of the results of the Scoring Model, in which it is not possible to measure an instrument using the Mark to Market method, the fair value is attributed according to Mark to Model valuations. Depending on the characteristics of the tool used, different valuation models specified above are used.
With reference to the OTC type derivative contracts, models consistent with the risk factor underlying the contract are used. The fair value of the OTC interest rate derivative contracts and OTC inflation-linked derivative contracts is determined based on the Mark to Model type of valuations while implementing the IFRS 13 rules. As regards the OTC derivative contracts on which there is a securitisation agreement (Credit Support Annex) between the Unipol Group companies and the authorised market counterparties, use of the Euro OverNight Index Average (EONIA) discount curve is required. In the event of uncollateralised derivatives, provision is made for the use of CVA (Credit Valuation Adjustment) and DVA (Debit Valuation Adjustment) adjustments. Note that almost all derivative positions at 31 December 2014 related to collateralised contracts for which CSA agreements are in place with the counterparties involved in the trading.
With reference to unlisted shares and investments for which a market price or appraisal drafted by an independent expert is not available, the valuations are performed primarily on the basis of (i) equity type methods, (ii) methods which consider the discounting of future profit or cash flows, i.e. Discounted Cash Flow (DCF) or Dividend Discount Model (DDM), (the so-called “excess capital” version) (iii) applicable methods based on market multiples.
In relation to unlisted UCITS units, Private Equity Funds and Hedge Funds, the fair value is expressed as the Net Asset Value at the financial statement date provided directly by the fund administrators.
With reference to properties, the fair value is measured on the basis of the appraisal value determined by independent experts consistent with the provisions of the applicable legislation.
118
Counterparty valuations
Financial assets and liabilities which do not fall within the scope of instruments valued on a Mark to Market basis and for which there are no consistent and validated valuation models available for the purposes of measuring fair value, are valued on the basis of the prices provided by the counterparty.
Unique characteristics of the fair value measurement for structured bonds and structured SPV type bonds
Bond issues that incorporate a derivative contract which modifies the cash flows generated by the host contract are considered structured bonds. The measurement of structured bonds requires the representation and separate valuation of the host contract and of embedded derivative contracts. The measurement of structured bonds makes provision for the use of models consistent with the breakdown into elementary components (host contract and embedded derivatives) and the risk factor underlying said contract.
For structured bonds the valuation of elementary components adheres to the criteria defined previously for the determination of the fair value, which makes provision for use of the Mark to Market valuation if available, or the Mark to Model approach or the counterparty price in the case in which the Mark to Market type price is not available. Bonds issued by a Special Purpose Vehicle secured by collateral and whose flows paid are generated by an interest rate swap contract in place between the vehicle and the swap counterparty (usually the transaction arranger) are considered structured SPV type bonds. The measurement of structured SPV type bonds requires the representation and separate valuation of the following elements: collateral issue of the vehicle; interest rate swap agreement between the vehicle and arranger; any other optional components or CDS agreements included in the vehicle.
For SPV type structured bonds the valuation of collateral adheres to the criteria defined previously for the determination of the fair value, which makes provision for use of the Mark to Market approach if available, or the Mark to Model approach or the counterparty price in the case in which the Mark to Market type price is not available. The valuation of the interest rate swap agreement provides for the discounting of future cash flows on the basis of the different discount curves, based on the existence or not of a collateralisation agreement (Credit Support Annex) between the vehicle and swap counterparty. In particular, if the derivative contract is collateralised using available securities included in the SPV’s assets, the future cash flows of the interest rate swap agreement are discounted using the EONIA discount curve; while in the event there is no collateralisation agreement, a discount curve will be used, adjusted for the credit rating of the swap counterparty.
Criteria for determining the fair value hierarchies
Assets and liabilities valued at fair value are classified on the basis of the hierarchy defined by IFRS 13. This classification aims to establish a fair value hierarchy based on the degree of discretionary power used, giving priority to the use of observable market parameters given capable of reproducing the assumptions that market participants would use in the pricing of assets and liabilities.
Assets and liabilities are classified on the basis of the criterion used to determine fair value (Mark to Market, Mark to Model, Counterparty) and on the basis of the observability of the parameters used, in the case of the Mark to Model valuation.
119
Level 1: this category includes assets and liabilities valued on a Mark to Market basis, with CBBT pricesource and with contributor prices that meet the minimum requirements able to ensure that these pricescan be applied to active markets;
Level 2: this category includes assets and liabilities valued on a Mark to Market basis, but which cannotbe classified in the previous category and assets whose fair value is determined by a consistent pricingmodel with observable market parameter inputs;
Level 3: this category includes assets and liabilities for which the variability of the estimate of the pricingmodel may be significant due to the complexity of the pay-off or, in the event a consistent and validatedmodel is available, the parameters needed for the valuation are not observable. This category alsoincludes bond securities which do not meet the requirements defined in the scoring test (see theparagraph “Mark to Market valuations”) and for which a Mark to Model valuation is not possible. Lastly,this category also includes loans and investment property.
Fair value measurement on a recurring basis
Process for fair value measurement on a recurring basis
The measurement of financial instruments is a preliminary activity for risk monitoring, integrated asset and liability management and the drafting of the financial statements for the year. The fair value measurement of financial instruments on a recurring basis is structured into different phases and is carried out, in compliance with the principles of separateness, independence and responsibility of the departments, at the same time, and independently, by the Finance Department and Risk Management Department of Unipol Gruppo Finanziario, based on the measurement criteria defined in the previous paragraph. When the independent valuations of financial assets and liabilities have been carried out by the two Departments involved in the pricing process, a check is performed for significant deviations, which refer to deviations of more than 3% in terms of absolute value. In the event of deviations of more than 3% the reasons for the differences identified are analysed and, when the outcomes of the comparison are known, the price to be used for financial statement valuation purposes is determined.
Fair value measurement on a recurring basis through non-observable parameters (Level 3)
The classification of financial assets and liabilities at Level 3 adheres to a prudential approach; this category mainly includes the following types of financial instruments: unlisted equity instruments or investments for which a market price or an appraisal drafted by an
independent expert is not available; valuations are performed on the basis of the methods indicated previously;
shares in private equity funds, hedge funds and unlisted OEIC units for which information on the financial instruments held in the relative portfolios is not available and which could, as such, include financial instruments valued on a Mark to Model basis using non-observable parameters;
bond securities valued on a Mark to Model basis using non-observable parameters (correlations, benchmark spread curves, recovery rate);
bond securities valued with a counterparty price on a Mark to Model basis using non-observable parameters;
ABS type bond securities for which a Mark to Market valuation is not available; derivative instruments valued on a Mark to Model basis using non-observable parameters (correlations,
volatility, dividend estimates); bond securities which do not meet the requirements defined in the scoring test (see the paragraph “Mark
to Market valuations”) and for which a Mark to Model valuation is not possible.
120

Fair value measurement on a non-recurring basis in compliance with the disclosure requirements of other standards
Consistent with the provisions of IFRS 13, fair value is measured also for assets and liabilities not measured at fair value on a recurring basis in the statement of financial position and when the disclosure on fair value has to be provided in the notes to the financial statements in compliance with other international accounting standards. Since said assets and liabilities are not generally exchanged, the determination of their fair value is based primarily on the use of internal parameters not directly observable on the market. This category mainly includes the following types of financial instruments: bond issues valued on a Mark to Market basis (level 1); bond issues and loans valued on a Mark to Model basis using non-observable parameters (benchmark
spread curves) (level 3); short-term payables with a duration of less than 18 months and Certificates of Deposit at amortised cost
(level 3); loans to bank customers valued according to the following principles (level 3):
loans with a duration of more than 18 months (medium/long-term loans) valued on a Mark to Modelbasis with a cash flow discounting method for the principal component and interest. For medium/long-term loans, the discount rate used is based on the risk-free rate plus a risk premium determined onthe transaction through the Probability of Default (PD) and Loss Given Default (LGD) parameters.These parameters were taken from the Cedacri Credit Rating System (CRS) application and wereestimated on a consortium basis. The Cumulative Probability of Default is calculated through theapplication of a Markov process to the one-year transition matrixes, while the LGD is consideredconstant for the entire time period;
impaired loans measured at amortised cost net of analytical valuations; short-term loans with a duration of less than 18 months valued at amortised cost;
other receivables valued at carrying amount (level 3); investment property valued on the basis of the appraisal value determined by independent experts
consistent with the provisions of the applicable legislation. The approach to assigning appraisal mandates makes provision for the non-exclusive assignment of assets and normally a three-year rotation in the assignment of experts.
121

3. NOTES TO THE STATEMENT OF FINANCIAL POSITION
Comments and further information on the items in the statement of financial position and the changes that took place compared to balances at 31 December of the previous year are given below (the numbering of the notes relates to the mandatory layout for the preparation of the statement of financial position).
In application of IFRS 5, assets and liabilities held for disposal are shown respectively under items 6.1 in Assets and 6.1 under Liabilities. As regards Non-current assets or assets of a disposal group, please refer to Chapter 5 Other information, paragraph 5.5, for more information on their composition and measurement criteria.
For a better understanding of the changes that occurred with respect to the previous year, the tables below also show, in the appropriate columns, the changes compared to the values on a like-for-like basis, recalculated as explained in the Preamble of the Management Report. ________________________________________________________________________________________
ASSETS
1. Intangible assets
Amounts in €m 31/12/2014 31/12/2013variation in
amount
variation on
a like-for-like
basis
Goodwill 306.7 0.0 306.7 0.0
resulting from business combinations 306.7 0.0 306.7 0.0
Other intangible assets 498.1 523.9 -25.8 -90.7
portfolios acquired as a result of business combinations 381.0 488.3 -107.3 -107.3
software and user licences 104.4 6.3 98.1 36.9
other intangible assets 12.7 29.3 -16.6 -20.3
Total intangible assets 804.8 523.9 280.9 -90.7
1.1 Goodwill
The item, which amounted to €306.7m, consists of the goodwill generated following the Unipol Assicurazioni, Milano Assicurazioni, Premafin Finanziaria in Fondiaria-SAI (now UnipolSai) integration transaction. It refers to €177.0m for the Non-Life segment and to €129.7m for the Life segment.Goodwill with an indefinite useful life recorded in the financial statements was tested for impairment in accordance with the procedure specifically approved by UnipolSai’s Board of Directors. For information on the criteria used for the tests, please refer to paragraph 5.11 of chapter 5 of this document, Other information.
1.2 Other intangible assets
The item, totalling €498.1m (€523.9m in 2013, and €588.8m on a like-for-like basis), is composed primarily of the value of the Life and Non-Life portfolios acquired for €381.0m (€488.3m in 2013 on a like-for-like basis), and costs incurred for purchasing software, licences, consultancy and the customisation of software programs for €104.4m (€6.3m in 2013, €67.4m on a like-for-like basis).
122

2. Property, plant and equipment
At 31 December 2014 property, plant and equipment, net of accumulated depreciation, amounted to €1,196.4m (€522.3m in 2013, €879.1m on a like-for-like basis), €1,072.0m of which was properties for own use (€456.8m in 2013, €781.2m on a like-for-like basis) and €124.4m was other tangible assets (€65.6m in 2013, and €97.9m on a like-for-like basis). Properties for own use
Amounts in €m
Gross
carrying amount
Accumulated
depreciation
Net carrying
amount
Balance at 31/12/2013 479.3 -22.5 456.8
Increases 776.8 776.8
Decreases -37.0 -37.0
Depreciation for the year -27.4 -27.4
Other changes in prov isions -97.3 -97.3
Balance at 31/12/2014 1,219.2 -147.2 1,072.0 The Increases item comprised €593.6m relating to real estate held by the former Unipol Assicurazioni and its subsidiaries; the other changes in provisions item included the relevant accumulated depreciation (-€100.4m). Increases also comprised €183.6m relating to the reclassification of real estate amongst the properties for own use, investment property and non-current assets; the other changes in provisions item included the relevant accumulated depreciation totalling -€16.9m. The Decreases item included €30.5m in write-downs effected on the basis of the updated appraisals drafted by independent experts. The current value of properties for own use amounted to €1,181.7m. Other tangible assets
Amounts in €m
Office furniture and
machines
Movable assets entered
in public registers
Plant and
equipment
Total
Balance at 31/12/2013 104.0 5.2 101.0 210.2
Increases 179.4 0.8 60.4 240.7
Decreases -18.8 -0.8 -6.7 -26.2
Balance at 31/12/2014 264.7 5.3 154.7 424.7
Accumulated depreciation at 31/12/2013 65.5 4.2 75.0 144.7
Increases 135.1 0.5 42.8 178.4
Decreases -17.3 -0.6 -4.9 -22.8
Accumulated depreciation at 31/12/2014 183.3 4.0 112.9 300.3
Net amount at 31/12/2013 38.6 1.0 26.0 65.6
Net amount at 31/12/2014 81.3 1.3 41.9 124.4 The Increases item comprised the assets held by the former Unipol Assicurazioni and its subsidiaries (gross value €160.5m, accumulated depreciation €128.3m). The Decreases item included the assets held by the former Banca Sai, merged into the associate Unipol Banca measured at equity, and by its subsidiary Finitalia (gross value -€8.8m, accumulated depreciation -€8.6m).
123
3. Technical provisions – Reinsurers' share
The balance of this item was €960.2m, an increase of €218.5m compared with 2013 (-€54.5m on a like-for-like basis). Details are set out in the appropriate appendix.
4. Investments
The total of Investments (Investment property, Investments and Financial assets) at 31 December 2014 amounted to €61,122.0m (€34,303.6m in 2013, €56,254.2m on a like-for-like basis).
Amounts in €m31/12/2014 % comp. 31/12/2013 % comp. % var.
% var. on a
like-for-like
basis
Investment property 2,824.2 4.6 2,584.5 7.5 9.3 -13.1
Investments in subsidiaries, associates and interests in joint
ventures 608.4 1.0 159.4 0.5 n.s. 26.7
Financial assets (excluding those at fair value through profit or loss) 49,050.7 80.3 26,130.6 76.2 87.7 11.1
Held-to-maturity investments 1,420.0 2.3 626.5 1.8 n.s. -32.8
Loans and receivables 5,169.5 8.5 2,746.5 8.0 88.2 -23.1
Available-for-sale financial assets 42,113.7 68.9 22,656.2 66.0 85.9 20.7
Held-for-trading financial assets 347.5 0.6 101.3 0.3 n.s. -10.6
Financial assets at fair value through profit or loss 8,638.7 14.1 5,429.2 15.8 59.1 3.0
Total Investments 61,122.0 100.0 34,303.6 100.0 78.2 8.7
4.1 Investment property
Amounts in €m
Gross carrying
amount
Accumulated
depreciation
Net carrying
amount
Balance at 31/12/2013 2,680.9 -96.4 2,584.5
Increases 712.4 712.4
Decreases -395.8 -395.8
Depreciation for the year -45.8 -45.8
Other changes in prov isions -31.1 -31.1
Balance at 31/12/2014 2,997.4 -173.2 2,824.2
The Increases item comprised €550.2m relating to real estate held by the former Unipol Assicurazioni and its subsidiaries; the other changes in provisions item included the relevant accumulated depreciation (-€51.9m). Increases included €100.7m relating to properties purchased following the homologation by the Court of Milan on 17 November 2014 of the bankruptcy agreement regarding the company Im.Co. The main effects of the relevant decree included transferring to UnipolSai the real estate complex in Milan, Via De Castillia and to UnipolSai Real Estate the real estate complex in Parma, Località San Pancrazio Parmense, for the purchase of which advances totalling €100.7m were paid on a date prior to the bankruptcy. With regard to these advances, payment from liquidation assets was requested and obtained; the receivables pertaining to the properties purchased were recorded in the financial statements at 31 December 2013 for the total amount of €33.3m, net of their write-down. The value of the properties was recognised to the extent corresponding the advances paid, prior to the reversal of receivables for €67.4m, and was then aligned to the current appraisal values, recognising write-downs in the income statement for a total of €44.7m. For more information, reference should be made to comments under Liabilities, paragraph 2. Provisions, ongoing disputes and contingent
124

liabilities. The Decreases item comprised -€193.0m relating to the reclassification of real estate amongst the properties for own use, investment property and non-current assets; the other changes in provisions item included the relevant accumulated depreciation totalling €16.0m. The Decreases item also included €113.4m in write-downs effected on the basis of the updated appraisals drafted by independent experts. The current value of Investment property, €2,903.5m, was based on independent expert appraisals. 4.2 Investments in subsidiaries, associates and interests in joint ventures At 31 December 2014, investments in subsidiaries, associates and interests in joint ventures amounted to €608.4m (€159.4m in 2013, and €480.2m on a like-for-like basis). Please refer to the relevant annex for the breakdown of the item. The change is mainly due to the merger of Banca Sai into Unipol Banca. Financial assets - items 4.3, 4.4, 4.5 and 4.6 (excluding Financial assets at fair value through profit or loss).
Amounts in €m31/12/2014
%
comp.31/12/2013
%
comp. % var.
% var. on a
like-for-like
basisHeld-to-maturity investments 1,420.0 2.9 626.5 2.4 126.7 -32.8
Listed debt securities 1,107.5 511.0 116.7 -31.2
Unlisted debt securities 312.4 115.5 170.5 -38.1
Loans and receivables 5,169.5 10.5 2,746.5 10.5 88.2 -23.1
Unlisted debt securities 4,215.0 1,637.4 157.4 -17.3
Loans and receivables from bank customers 0.0 460.2 -100.0 -100.0
Interbank loans and receivables 0.0 0.5 n.s. n.s.
Deposits with ceding companies 30.9 19.1 61.6 -12.8
Other loans and receivables 923.6 600.1 53.9 -16.2
Other financial investments 0.0 29.2 -100.0 -100.0
Available-for-sale financial assets 42,113.7 85.9 22,656.2 86.7 85.9 20.7
Equity instruments at cost 40.2 0.0 0.0 -22.1
Listed equity instruments at fair value 780.8 429.8 81.7 -20.4
Unlisted equity instruments at fair value 283.0 235.2 20.3 -4.4
Listed debt securities 38,815.6 21,486.9 80.6 21.6
Unlisted debt securities 1,133.5 57.9 n.s. 7.0
UCITS units 1,060.5 446.4 137.6 74.8
Held-for-trading financial assets 347.5 0.7 101.3 0.4 n.s. -10.6
Listed equity instruments at fair value 12.5 0.0 n.s. n.s.
Listed debt securities 122.5 40.2 n.s. -2.9
Unlisted debt securities 62.1 47.0 32.1 -48.0
UCITS units 45.6 0.0 n.s. -24.5
Derivatives 104.8 14.1 n.s. 52.5
Total financial assets 49,050.7 100.0 26,130.6 100.0 87.7 11.1
125

Details of Financial assets at fair value through profit or loss by investment type:
Amounts in €m31/12/2014
%
comp.31/12/2013
%
comp. % var.
% var. on a
like-for-like
basisFinancial assets at fair value through profit or loss 8,638.7 100.0 5,429.2 100.0 59.1 3.0
Listed equity instruments at fair value 158.3 1.8 59.1 1.1 167.7 56.4
Listed debt securities 3,635.6 42.1 658.8 12.1 n.s. 9.7
Unlisted debt securities 1,640.5 19.0 2,843.4 52.4 -42.3 -42.6
UCITS units 3,051.9 35.3 1,769.6 32.6 72.5 54.8
Derivatives 18.3 0.2 53.5 1.0 -65.9 -65.9
Other financial assets 134.1 1.6 44.7 0.8 n.s. 46.4
Reference is made to paragraph 5.7 of these notes to the financial statements for information on the fair value.
5. Sundry receivables
Amounts in €m
31/12/2014 % comp. 31/12/2013 % comp. % var.
% var. on a
like-for-like
basis
Receivables relating to direct insurance business 1,630.8 48.0 1,081.7 56.9 50.8 -9.2
Receivables relating to reinsurance business 89.8 2.6 98.4 5.2 -8.7 -30.6
Other receivables 1,674.6 49.3 720.8 37.9 132.3 42.9
Total sundry receivables 3,395.1 100.0 1,900.9 100.0 78.6 9.6 Other receivables included: - tax receivables amounting to €532.7m; - payments made as cash collateral to safeguard derivatives totalling €384.6m; - receivables due from Allianz deriving from the business unit transfer financial situation for €174.4m; - trade receivables amounting to €153.4m; - substitute tax receivables on the mathematical provisions totalling €120.0m. 6. Other assets
Amounts in €m
31/12/2014 % comp. 31/12/2013 % comp. % var.
% var. on a
like-for-like
basis
Non-current assets or assets of a disposal group held for sale 23.6 2.9 138.9 7.5 -83.0 -83.0
Deferred acquisition costs 75.5 9.3 63.3 3.4 19.3 -2.3
Deferred tax assets 221.8 27.2 1,189.1 64.5 -81.4 -85.0
Current tax assets 97.5 12.0 217.0 11.8 -55.1 -56.0
Other assets 395.6 48.6 234.9 12.7 68.4 12.9
Total other assets 813.9 100.0 1,843.3 100.0 -55.8 -64.0 Non-current assets or assets of a disposal group held for sale consisted of the assets of the companies UnipolSai Investimenti SGR and Saint George Capital Management SA in liquidation in addition to several properties held by Group companies; the figure at 31 December 2013 included €114.1m relating to the assets
126

connected with the perimeter disposed of in compliance with Antitrust Authority Measure dated 19 June 2012. For details please refer to paragraph 5.5 of these Notes to the financial statements.
Deferred tax assets is shown net of the compensation carried out, pursuant to IAS 12, with the corresponding taxes (IRES or IRAP) recorded in Deferred tax liabilities. Offsetting between tax assets and liabilities is performed starting from financial year 2014, as explained in Chapter 2 Main accounting standards.
The item “Other assets” includes, inter alia, deferred commission expense, prepayments and accrued income and miscellaneous items to be settled.
7. Cash and cash equivalents
At 31 December 2014, Cash and cash equivalents amounted to €684.0m (€598.5 at 31/12/2013, and €1,628.3m on a like-for-like basis). An amount of €0.9m was reclassified in application of IFRS 5.
127

LIABILITIES 1. Shareholders' equity
1.1. Shareholders' Equity attributable to the owners of the Parent Shareholders’ Equity, excluding non-controlling interests, is composed as follows:
Amounts in €m
31/12/2014 31/12/2013variation in
amount
variation in
amount on a
like-for-like
basis
Share capital 1,996.1 1,194.6 801.6
Other equity instruments 110.1 0.0 110.1
Capital reserves 247.8 198.9 48.9
Income-related and other equity reserves 2,062.8 115.6 1,947.3
(Treasury shares) -49.5 -0.1 -49.4
Reserve for foreign currency translation differences 3.8 4.7 -0.9
Gains/losses on available-for-sale financial assets 1,169.3 496.9 672.4
Other gains and losses recognised directly in equity 15.2 26.3 -11.1
Profit (loss) for the year 739.5 288.4 451.1
Total shareholders' equity attributable to the owners of the Parent 6,295.2 2,325.2 3,970.0 1,085.5 At 31 December 2014 UnipolSai’s share capital, fully paid-up, was €1,996.1m and was made up of 2,654,102,017 shares, 2,275,632,026 of which were ordinary shares, 1,276,836 Class A savings shares and 377,193,155 Class B savings shares. Movements in shareholders’ equity recognised during the year with respect to 31 December 2013 are set out in the attached statement of changes in shareholders’ equity. The main changes in the year in Shareholders' equity attributable to the owners of the Parent, on a like-for-like basis, were as follows: decrease due to dividend distribution for €564.5m; an increase as a result of the increase in the provision for gains and losses on available-for-sale financial
assets, net of both the related tax liabilities and the part attributable to the policyholders and charged to insurance liabilities for €673.9m;
an increase of €187.2m deriving from the combined effect of the component attributable to equity instrument of the convertible loan issued by UnipolSai and the subsequent conversion on 5 May of 675 bonds subscribed by UGF;
change of €739.5m for Group profit of the period. Shareholders’ Equity attributable to non-controlling interests amounted to €339.7m (€741.0m at 31/12/2013, €358.9m on a like-for-like basis). Treasury shares or quotas At 31 December 2014, UnipolSai held a total of 53,549,686 ordinary treasury shares, of which 725,620 directly and 52,824,066 indirectly through the subsidiaries UnipolSai Finance (38,454,775), UnipolSai Nederland
128

(9,443,258), SAI Holding (3,225,720), Sainternational (1,254,300), Pronto Assistance (344,313) and Popolare Vita (101,700). 2. Provisions
The item “Provisions” totalled €619.9m at 31 December 2014 (€319.9m at 31/12/2013, and €515.7m on a like-for-like basis) and mainly consisted of provisions for litigation, disputes with agencies and other charges relating to the sales network, provisions for salary policies and employee leaving incentives.
Ongoing disputes and contingent liabilities Relations with the Tax Authorities UnipolSai (former Unipol Assicurazioni) As a result of the transfer of the former Aurora business unit to the former Unipol Assicurazioni, in 2014 the former Unipol Assicurazioni was served an assessment notice for the 2009 tax period similar to the one that arrived in 2013 for the 2008 tax period (and those Unipol received for the 2005-2007 periods). In January and September 2014 the Ipec requests for the years 2008 and 2009 were presented through the consolidating entity Finsoe, deducting the irregularities from the previous tax losses available, and at the same the assessment notice was contested by appealing to the provincial tax commission of Bologna. Amounts deemed sufficient for facing the risks consequent to development of the litigation have been allocated to the financial statements reserves. UnipolSai (former Fondiaria-SAI) The competent Regional Tax Authority of Piedmont started an investigation on the years 2009 to 2012 with regard to fees paid to Mr. Salvatore Ligresti for consultancy assignments, on the fees paid to several directors, including the chairman Jonella Ligresti and the Chief Executive Officer Fausto Marchionni, and on some sponsorship costs. The in-depth investigations originated from the report of the Regional Tax Authority of Tuscany that had already carried out similar research for the previous years, of the report that the ad acta Commissioner prepared as part of his assigned responsibility from IVASS, and from the Board of Statutory Auditors Reports pursuant to Art. 2408 of the Civil Code. Specifically, bearing in mind similar cases already settled by the company for the tax periods from 2004 to 2008, there is a special allocation to a reserve set aside in previous years sufficient to meet the risks pertaining to the years still potentially subject to criticism. Furthermore, in connection with an assessment notice regarding IRPEG and ILOR for the year 1991 concerning the merged Fondiaria Assicurazioni, the Tuscan Regional Tax Authority upheld the appeal to reinstate presented by the Tax Authorities with its ruling filed in July 2014, which follows a ruling of the Court of Cassation based on abuse of right against two judgements as to the merits that had upheld and confirmed the appeal of the merged company. The Company has submitted another appeal to the Court of Cassation. Potential liabilities in the event the case is lost are fully covered by a special fund. Atahotels In May 2014 the Company was notified a report on findings bearing objections on the amount of some lease instalments considered excessive and on the failure to charge back certain advertising costs. The objections were raised for IRES, IRAP and VAT reasons, and cover a time span ranging from 2009 to 2013. In face of these objections and following a thorough discussion with the offices of the Regional Tax Authority of Lombardy, the company has already settled the year 2009. The company and the consolidating entity UnipolSai allocated risk provisions deemed sufficient to meet the additional costs that may arise from these disputes in their financial statements.
129

Auto Presto & Bene The Company was notified a report on findings claiming insufficiency of charges made to the group company for services rendered in 2009 relating to IRES, IRAP and VAT. After presenting briefs and on the basis of comparisons with the competent Provincial Tax Authority of Turin, the company settled the dispute with renouncement of the IRES and IRAP objections and containing the area of the VAT charge. The case in point contested was repeated in the years 2010, 2011 and 2012 as well, and for this reason the company and the consolidating entity UnipolSai allocated risk provisions deemed sufficient to meet any potential costs. Proceedings in progress with the Antitrust Authority By means of Measure dated 14 November 2012, the Italian Antitrust Authority started preliminary proceedings no. I/744 against Unipol Assicurazioni and Fondiaria-SAI (now UnipolSai), and Assicurazioni Generali and INA Assitalia, to ascertain the existence of alleged violations of Art. 2 of Law 287/1990 and/or Art. 101 of the Treaty on the Functioning of the European Union, in the assumption of coordination between said insurance companies aimed at limiting the competition between said parties in participation in tenders called by certain Local Public Transport Companies regarding MV TPL insurance coverage services for vehicles that are used to provide said transportation service. UnipolSai, deeming that it acted in full compliance with legality and correctness, retained its lawyers for the protection of its rights. The preliminary investigation stage ended on 28 January 2015 with the final hearing of the parties. The deadline for closing the proceedings was then extended to 31 March 2015. Should the Antitrust Authority establish the charged infringement, it will set the deadline for eliminating the infringement and, considering its gravity and duration, may also order application of a pecuniary administrative penalty. Writs of summons by shareholders of La Fondiaria Assicurazioni (Tender Offer legal cases) From 2003 onwards, a number of La Fondiaria Assicurazioni (“Fondiaria”) shareholders have initiated a series of legal proceedings claiming, albeit on different legal grounds and justifications, compensation for damages allegedly suffered due to failure to launch the takeover bid on Fondiaria shares by SAI Società Assicuratrice Industriale SpA (“SAI”) in 2002. On the whole, 16 proceedings were brought against the Company, and 12 were pending at 31 December 2014, with UnipolSai and Mediobanca Banca di Credito Finanziario (“Mediobanca”) the co-respondents. With regard to the pending proceedings, the breakdown is as follows: three proceedings are pending in first instance before the Court of Milan; four proceedings are pending before the Milan Court of Appeal, three of which adjourned; five proceedings are pending before the Supreme Court. With regard to the contents of the judgments, it should be emphasised that: all the judgments (except those pronounced by the Court of Florence in favour of the defendant
companies, and the one pronounced in August 2013 by the Court of Milan which confirmed legal time-barring of the proceedings) have, with different reasons as to why, accepted the plaintiff claims and ordered the defendants to pay significant amounts by way of compensation for damages. All decisions issued by the Milan Court of Appeal accepted the appeals proposed by the defendant companies;
in the three judgments filed in August 2012, and in the one filed in September 2013, the Court of Cassation upheld the appeals, reversed the second instance ruling and adjourned the cases to the Milan Court of Appeal in order for it to re-examine the merits of them and also provide for the costs of the legitimacy judgment.
130
The four Supreme Court judgments pronounced in 2012 and 2013 indicate a different legal stance adopted by the Supreme Court with respect to the positions of the defendant companies, which even now are constantly agreed by Appeals Court case law. In fact, the four Supreme Court judgments confirmed the legal principle that, in the event of violation of mandatory takeover bid regulations by those who - after acquisitions - become holders of more than 30% of the share capital, it is the responsibility of the shareholders which should be the target of the takeover bid to claim the right to compensation for damages if they can demonstrate potential loss of earnings. Therefore, as confirmation of the complexity of the issue in question, it should be remember that in 2013, after the aforementioned Supreme Court judgments of 2012, the Florence Court of Appeal rejected the appeals brought by a number of Fondiaria-SAI shareholders against the first instance judgment in favour of the defendants and the Milan Court of Appeal accepted the appeal brought by Premafin, rejecting the opposing party claims.
Bankruptcy of Im.Co. SpA in liquidation and Sinergia Holding di Partecipazioni SpA in liquidation By means of judgment issued on 14 June 2012, the companies belonging to the Sinergia Holding di Partecipazioni SpA Group in liquidation (“Sinergia”), including the subsidiary Immobiliare Costruzioni Im.Co. SpA in liquidation (“Im.Co.”), were declared bankrupt by the second civil section of the Court of Milan. Europrogetti Srl was also declared bankrupt on 14 December 2012. Note that the receivables due to the Unipol Group from Sinergia or Im.Co., or from entities associated with them, for the most part consist of payments on account paid by Fondiaria-SAI and Milano Assicurazioni to Im.Co. or Sinergia, or their subsidiaries, pursuant to purchase contracts for future real estate asset purchases for the following amounts:
- €101.7m for advances paid by Milano Assicurazioni to Avvenimenti e Sviluppo Alberghiero Srl (“ASA”), a wholly-owned subsidiary of Im.Co., relating to the purchase of a property complex in Rome, Via Fiorentini. The carrying amount of this receivable at 31 December 2014 came to €52.9m net of write-down;
- €77.4m for advances paid by Milano Assicurazioni to Im.Co., relating to the purchase of a property complex in Milan, Via De Castillia. The receivable, recognised in the financial statements at 31 December 2013 for the net amount of €25.5m, was settled in 2014 with the transfer of the real estate complex purchased, as explained below;
- €23.3m due to Immobiliare Fondiaria-SAI (now UnipolSai Real Estate) from Im.Co., relating to the purchase of a property complex in Parma, Località San Pancrazio Parmense. The receivable, recognised in the financial statements at 31 December 2013 of Immobiliare Fondiaria-SAI for the net amount of €7.8m, was settled in 2014 with the transfer of the real estate complex purchased;
Also worthy of note is an exposure of €5.3m, net of the reinsurance effect, to surety policies to guarantee the commitments assumed by companies in the Im.Co. – Sinergia Group. Lastly, the following receivables due from other Group subsidiaries, entirely written down in previous years, are reported: - advances on design works for €7.2m, due to Nuove Iniziative Toscane from Europrogetti Srl; - receivables due to Banca Sai (now merged into Unipol Banca) from the Im.Co. – Sinergia Group
amounting to €21.4m, €10.7m of which represented by unsecured credit positions. On 14 June 2012, in disclosing the Sinergia and Im.Co. credit positions to the market after they were declared insolvent, Fondiaria-SAI and Milano Assicurazioni declared (i) their acknowledgment of the judgment of insolvency pronounced against Im.Co. and Sinergia and that creditor claims for payment from liquidation assets would be filed, and (ii) they reserved the right to take further action, including liability action, as necessary or appropriate, also in reference to inquiries made by the Board of Statutory Auditors of Fondiaria-
131

SAI following the claim pursuant to Art. 2408 of the Civil Code filed by the shareholder Amber Capital Investment Management. In relation to the above receivables (with the exception of the receivable of €101.7m due from ASA, since that company is presently in a performing position), applications were presented for the proof of debts of the Im.Co. and Sinergia bankruptcies for a total of €151m, €111.4m of which was recognised as debts, in the form of unsecured loans, at 31 December 2014. In relation to the liability actions subsequently launched by the acting Commissioner of Fondiaria-SAI, late applications were filed for proof of debts of the Im.Co. and Sinergia bankruptcies totalling €392.7m. These claims were rejected by the bankruptcy court and the companies involved have challenged the related rejections. According to the information disclosed to the market, based on an initiative of the main bank creditors of the bankrupt companies, Unicredit and Banca Popolare di Milano incorporated the company Visconti Srl, with the objective of proposing a bankruptcy agreement to settle the insolvency of the companies Im.Co. and Sinergia. On 3 October 2013, the Unipol Group signed an agreement with Visconti Srl regarding the settlement, also as a compromise, of the receivables due to Unipol Group companies from Im.Co. and Sinergia and their subsidiary ASA, as part of the bankruptcy agreement applications of said parties Im.Co. and Sinergia. The effectiveness of this agreement is subject to certain conditions, including the approval by final order of the arrangements with creditors of Im.Co. and Sinergia. Visconti Srl filed appeals against the bankruptcy agreement applications of Im.Co. and Sinergia, on 7 and 31 October 2013 respectively. Following the above-mentioned filing, Visconti had to acknowledge the note of the Municipality of Milan dated 5 February 2014, with which the deadline of the Integrated Intervention Programme concerning the construction and localisation of Centro Europeo di Ricerca Biomedica Avanzata was declared “past due to all intents and purposes”, and therefore, it had to acknowledge that “the premises and guidelines of the composition plan had significantly diverged, and to such an extent as to render it impracticable as it had originally been presented”. In view of the above, Visconti has discussed with the creditor banks and with the Companies of the Unipol Group the possibility of implementing a new composition plan. On 16 May 2014, Visconti and the Companies of the Unipol Group executed a new agreement, replacing the first agreement signed on 3 October 2013, which provides, inter alia: (i) that all the assets and liabilities of the bankrupt companies (with the sole exception of the properties, which shall be transferred directly from the Im.Co. Bankruptcy to UnipolSai and to UnipolSai Real Estate) shall be transferred to Visconti; (ii) a new division of the creditor classes; (iii) the need for participating banks to remove a portion of their own receivables from the bankrupt companies before the receivables are taken over by Visconti. On the basis of the new composition plan, Visconti filed the deeds amending the composition proposals of Im.Co. and Sinergia. On 17 November 2014 the Court of Milan approved the bankruptcy agreement regarding Im.Co that had been put forward by Visconti. The main effects of the relevant decree included transfer of the real estate complex mentioned above in Milan at Via De Castillia to UnipolSai, and the mentioned real estate complex in Parma, Località San Pancrazio Parmense, to UnipolSai Real Estate. The transfer entailed closing the receivables due to the companies UnipolSai and UnipolSai Real Estate and the total recognition on the income statement of the relevant bad debt provision (amounting to €51.9m and €15.5m, respectively).
132

The properties were initially recognised for a value corresponding to the advances paid (€77.4m for UnipolSai and €23.3m for UnipolSai Real Estate, respectively), then were written down for adjustment to the appraisal values, therefore at the same time recognising a value adjustment of €29.0m for UnipolSai and €15.7m for UnipolSai Real Estate. On 5 December 2014 the bankruptcy agreement regarding Sinergia was also approved. The Court of Milan declared the Im.Co. bankruptcy closed with its ruling of 5 February 2015. The agreement with Visconti will be totally executed during the year. With regard to the former Premafin, please be reminded that the only significant relations between this company and those declared insolvent is that relating to statements guaranteeing non-liability released by Im.Co. and its subsidiaries in relation to potential charges/liability arising from the commitment to sell sites located in the Municipality of Milan to third parties. Please refer to the following paragraph for more information. Dispute with the Municipality of Milan UnipolSai is involved in a dispute with the Municipality of Milan relating to a commitment for the transfer of areas at pre-established prices, entered into by the absorbed company Premafin Finanziaria. In May 2008, the Court of Appeal partially reversed the first instance judgment which had sentenced Premafin to compensate the damages caused by the failure to acquire the areas, recognising, in only two of the executed deeds, the nature of a genuine preliminary sales agreement for the respective areas at the centre of the dispute and confirming the criterion for the quantification of the damages, to be settled in separate proceedings. In this regard, in 2008, Premafin had therefore proceeded, within the prescribed terms, to lodge an appeal before the Court of Cassation. On 29 September 2014 the Court of Cassation definitively confirmed the appeal ruling that considered the agreement for two of the three areas at the centre of the dispute finalised. Having said that - considering that the judgement of the Court of Appeal is provisionally enforceable - in October 2012, the Municipality of Milan summoned Premafin to the Court of Milan for the quantification and settlement of the damages incurred. During said proceedings, a court-appointed expert witness was arranged and the case was adjourned to the hearing on 4 February 2016 for the statement of final pleas. In respect of a claim for around €37m, Protos SpA (company appointed by Premafin in 2012) performed an estimate of the potential damages incurred by the Municipality of Milan, quantifying the amount at approximately €13.2m. Following the bankruptcy of the company Im.Co., which had issued declarations of indemnity in favour of Premafin, the company lodged an appeal for the proof of debt and, subsequently, owing to the dismissal of the application, filed an opposition appeal to the bankruptcy claim condition pursuant to Art. 98 of Bankruptcy Law. The first hearing set for the appearance of the parties was held on 9 May 2013 and conciliation was attempted; it was not possible to reach an agreement and the judge set the hearing for final pleas on 6 May 2014 (subsequently postponed to 20 May), with terms for the filing of briefs and replies. At the hearing of 20 May 2014, the Receivers told the judge that the arrangement with creditors, which comprises UnipolSai’s (which took over from Premafin) waiver of the guarantee for which the proceedings are brought, was about to be defined. The judge deferred to the hearing of 17 March 2015, the date on which closure was filed in the Im.Co. bankruptcy proceedings (see foregoing paragraph “Bankruptcy of Im.Co and Sinergia”), with the subsequent declaration of suspension of the claim for proof of debt brought by the Company.
133

Following endorsement of the Im.Co. bankruptcy, it will be possible to free up the disputed real estate areas in order to reach an amicable settlement of the dispute still pending with the Municipality of Milan.
Consob sanction proceedings
By means of communications dated 19 April 2013, Consob commenced two separate penalty proceedings against Fondiaria-SAI and Milano Assicurazioni for charges relating to their respective 2010 Consolidated financial statements. Pursuant to Art. 187-septies, paragraph 1 of the Consolidated Law on Finance, Consob notified Ms. Jonella Ligresti and Mr. Emanuele Erbetta, for the offices held in Fondiaria-SAI at the time of the events, of the violation set forth in Art. 187-ter, paragraph 1, of the Consolidated Law on Finance. Fondiaria-SAI is also charged with this violation as a party bearing joint and several liability; Fondiaria-SAI is also charged with the offence set forth in Art. 187-quinquies, paragraph 1, letter a), of the Consolidated Law on Finance for the aforementioned violation of Art. 187-ter, paragraph 1 of the Consolidated Law on Finance by Ms. Jonella Ligresti and Mr. Emanuele Erbetta, acting in the abovementioned capacities.
Consob also made the same charge against Milano Assicurazioni. In this regard, pursuant to Art. 187-septies, paragraph 1 of the Consolidated Law on Finance, the Commission charged Mr. Emanuele Erbetta, for the role he held in the subsidiary at the time of the events, with the violation established in Art. 187-ter, paragraph 1 of the Consolidated Law on Finance. Milano Assicurazioni is also charged with this violation as a party bearing joint and several liability; Milano Assicurazioni is also charged with the offence set forth in Art. 187-quinquies, paragraph 1, letter a), of the Consolidated Law on Finance for the aforementioned violation of Art. 187-ter, paragraph 1 of the Consolidated Law on Finance by Mr. Emanuele Erbetta, acting in the abovementioned capacity.
Fondiaria-SAI and Milano Assicurazioni (currently UnipolSai), assisted by their lawyers, presented their conclusions, asking that the administrative penalties set out in Articles 187-ter, 187-quinquies and 187-septies of the Consolidated Law on Finance not be imposed on the companies. On 20 March 2014 the CONSOB issued a resolution whereby, not deeming that the parties’ defences deserved to be accepted, it ordered: - Jonella Ligresti to pay €250,000 and to be disqualified from office for four months; - Emanuele Erbetta to pay €400,000 and to be disqualified from office for eight months; - UnipolSai to pay €650,000.
The Company duly challenged the decision before the Court of Appeal of Bologna, which rejected the appeal on 6 March 2015. The Company will decide with its lawyers whether or not to contest the measure when the grounds, still not filed, are read.
IVASS assessments
On 2 July 2014, IVASS sent to UnipolSai the order of sanctions at the end of the proceeding started in 2012 against Unipol Assicurazioni on the matter of the measurement of the claims provisions of the MV TPL and Boats classes. The imposed penalty amounted to €27,500. Since UnipolSai does not deem the conclusions of the Institute to be acceptable in any way, it appealed against this decision before the Regional Administrative Court (TAR).
134

Corporate liability action against certain former directors and statutory auditors decided by the Shareholders’ Meetings of Fondiaria-SAI and Milano Assicurazioni
On 17 October 2011, Amber Capital LP, fund manager of Amber Global Opportunities Master Fund Ltd, a Fondiaria-SAI shareholder, in accordance with Art. 2408 of the Civil Code, informed the Board of Statutory Auditors of Fondiaria-SAI of various transactions carried out by companies in the Fondiaria-SAI Group with “related” companies attributable to the Ligresti family, criticising the “non-market” conditions and “anomalies” of said transactions.
On 16 March 2012 the Board of Statutory Auditors of Fondiaria-SAI issued an initial response in its “Report pursuant to Art. 2408, paragraph 2 of the Civil Code”, after which by letter dated 26 March 2012 the shareholder Amber Capital requested further investigation.
The Board of Statutory Auditors therefore performed further controls and investigations. On 15 June 2012 IVASS served Provision no. 2985 upon Fondiaria-SAI by which the Authority defined the proceedings launched pursuant to Art. 238 of the Private Insurance Code, and through IVASS Communication prot. no. 32-12-000057 of the same date charged Fondiaria-SAI with significant irregularities pursuant to Art. 229 of the Private Insurance Code, with particular reference to a number of transactions implemented by Fondiaria-SAI and its subsidiaries with counterparties qualifying as related parties of Fondiaria-SAI, and assigning a fifteen-day deadline for the effects of these transactions to be permanently removed. IVASS considered that the actions proposed or implemented by the Company were not suitable to correct the situation which led to the charges cited in the notice of 15 June 2012, prolonging – according to the Institute – the inability of Fondiaria-SAI to remedy the violations and the relative effects. Therefore by Provision no. 3001 of 12 September 2012 (the “IVASS Provision”), IVASS appointed Prof. Matteo Caratozzolo as ad acta commissioner of Fondiaria-SAI (the “Commissioner”) and of the parent, considering the requirements of Art. 229, Legislative Decree no. 209 of 7 September 2005 to be met. In particular, with regard to the disputed transactions considered not only on an individual basis but as a whole, IVASS tasked the Commissioner with (i) specifically identifying the individuals responsible for the transactions carried out to the detriment of Fondiaria-SAI SpA and its subsidiaries; (ii) determining the damage suffered by the same; (iii) promoting or encouraging the promotion of all necessary initiatives, including judicial, at Fondiaria-SAI SpA and its subsidiaries, suitable, in relation to the disputed transactions, to safeguard and reintegrate the assets of Fondiaria-SAI SpA and its subsidiaries; (iv) exercising the powers held by Fondiaria-SAI SpA as parent and as a shareholder in the shareholders’ meetings of the subsidiaries.
Following the in-depth examinations conducted regarding the above-mentioned transactions, entered into by the Fondiaria-SAI Group primarily in the property segment in the 2003-2011 period, which directly involved members of the Ligresti family and certain SPVs attributable to said family, the Commissioner asked the Boards of Directors of Fondiaria-SAI and Milano Assicurazioni to call the respective shareholders’ meetings, placing on the agenda the proposed corporate liability action, pursuant to Articles 2392 and 2393 of the Civil Code, against some directors and statutory auditors of the companies (jointly with other parties).
On 5 February 2013, the Boards of Directors of Fondiaria-SAI and Milano Assicurazioni, having examined the respective reports drafted by the Commissioner in accordance with Art. 125-ter of the Consolidated Law on Finance, resolved, following the aforementioned request, to call the shareholders’ meetings of the two companies for 13 and 14 March 2013, on first and second call respectively. The Shareholders’ Meetings, held on second call on 14 March 2013, resolved to promote corporate liability action against the persons indicated in the reports prepared for the Meetings by the Commissioner and made these resolutions public in accordance with law.
135

As a result of the aforementioned resolutions, the ad acta Commissioner appointed his own lawyers who arranged for civil proceedings to be brought before the Court of Milan against the parties identified as responsible for the transactions described above. The proceedings are currently at preliminary investigation stage. In relation to the aforementioned transactions, the companies requested and, on 20 December 2013, obtained a seizure order from the Court of Milan against some of the defendants in the above proceedings. The Company made arrangements to enforce the attachment through the parties concerned and through third parties, and the related enforcement proceedings are still in progress. The attachment was challenged by the counterparties and on 24 March 2014 the Court of Milan, sitting en banc, confirmed the precautionary provision, rejecting all complaints filed by the counterparties. Furthermore, with reference to the other transactions involved in the complaint from Amber Capital LP, not included in the Commissioner’s mandate (“Minor Transactions”), on the invitation of the Board of Statutory Auditors of Fondiaria-SAI pursuant to Art. 2408 of the Civil Code, the Boards of Directors of Fondiaria-SAI and Milano Assicurazioni conducted investigations and checks, which showed that Minor Transactions were also carried out by companies in the Fondiaria-SAI Group with ‘related’ companies attributable to the Ligresti family with various breaches of directors’ and statutory auditors’ duties. In particular, the investigations and checks highlighted both breaches of directors’ and statutory auditors’ duties and damages to the company assets of the Fondiaria-SAI Group. The persons who, as a result of the checks performed by the Boards of Directors, were deemed responsible for the Minor Transactions are (i) members of the Ligresti family, who exercised control over the Fondiaria-SAI Group companies involved, and who would have pursued their own personal interests to the detriment of said companies in violation of Articles 2391 and 2391-bis of the Civil Code and the procedure governing “related party” transactions; (ii) the former “executive” directors, who would have proposed and implemented the transactions in question, and the administrators on the internal control committees of Fondiaria-SAI and Milano Assicurazioni, who would also have been responsible for the violation of said regulations and procedures; (iii) the statutory auditors who would have also been responsible for the damages suffered by the companies in the Fondiaria-SAI Group due to the violation of Articles 2403 and 2407 of the Civil Code and Art. 149 of the Consolidated Law on Finance. The liability of members of the Ligresti family in relation to the transaction in question (as with the transactions already involved in the liability actions of the Commissioner) would derive not only from the violation of their duties of the offices of director formally held in Fondiaria-SAI and Milano Assicurazioni but also (aa) from the “unitary management” they would have illegitimately exercised over companies in the Fondiaria-SAI Group by helping to approve and implement the transactions constituting a “conflict of interests” and “in violation of the principles of correct corporate and business management” (pursuant to Art. 2497 of the Civil Code); (bb) the de facto interference (in particular from Mr. Salvatore Ligresti) in the administration of the companies in the Fondiaria-SAI Group (in accordance with Art. 2392 of the Civil Code). Consequently, on 30 July 2013 the ordinary Shareholders’ Meetings of Fondiaria-SAI and Milano Assicurazioni resolved to promote corporate liability action pursuant to Articles 2392 and 2393 of the Civil Code and, to the extent they may apply, Articles 2043 and 2497 of the Civil Code, against certain former de facto and official directors of Fondiaria-SAI and Milano Assicurazioni, regardless of their particular offices held and even if no formal office was held; certain former directors of Fondiaria-SAI and Milano Assicurazioni and, pursuant to Art. 2407 of the Civil Code, against certain members of the Board of Statutory Auditors of Fondiaria-SAI and Milano Assicurazioni. In connection with the resolutions mentioned above, UnipolSai (formerly Fondiaria-SAI, which on 6 January 2014 merged Milano Assicurazioni, among others) served the writ of summons and the first hearing before the Court of Milan is set for 6 October 2015.
136
Castello Area
On 6 March 2013, the Court of Florence acquitted Fondiaria-SAI on all counts (because the fact does not exist) in the criminal proceedings concerning the urbanisation of the Castello area (Florence). In this regard, it should be noted that the company was accused, in the criminal proceedings launched in 2008 by the Public Prosecutor’s Office of Florence, of the crime of corruption, which involved other defendants that included some representatives of Fondiaria-SAI, certain professionals and some public administrators. Fondiaria-SAI was accused of unlawful administration set forth in Articles 5 and 25 of Legislative Decree 231/2001 in relation to the offence set out in Articles 319 and 321 of the criminal code, which punishes the crime of corruption by a public official. The Court also arranged for the release from seizure and return of the Castello area which had been subject to a precautionary seizure order in November 2008. The Public Prosecutor’s Office filed an appeal against the ruling before the Florence Court of Appeal. The next hearing is set for 16 April 2015.
Other ongoing criminal proceedings
With reference to facts attributable to the previous management of Fondiaria-SAI and Milano Assicurazioni, on the reporting date, compensation applications have been submitted to the civil court by two parties (the “Civil Cases”) and the criminal court in proceedings Gen. Criminal Records Reg. 21713/13 and Gen. Criminal Records Reg. 24630/2013 (the “Criminal Cases”) by various investors who had acquired shares of Fondiaria-SAI, Milano Assicurazioni and Premafin as well as by various “entities representing widespread interests”, numbering approximately 2,788 parties.
In the Civil Proceedings, the plaintiffs summarily stated that they had purchased and subscribed Fondiaria-SAI shares as they were prompted by the information in the information prospectuses published by Fondiaria-SAI on 24 June 2011 and 12 July 2012 in relation to the increases in share capital under option resolved by the company on 14 May 2011, 22 June 2011 and 19 March 2012 respectively. UnipolSai (now Fondiaria-SAI) appeared at both Civil Proceedings and disputed the plaintiffs’ claims. The Civil Proceedings are at the preliminary phase.
The following Criminal Cases are currently pending:
(a) Criminal Case (Gen. Criminal Records Reg. 21713/13) pending before the Court of Turin against defendants Salvatore Ligresti, Jonella Ligresti, Antonio Talarico, Fausto Marchionni, Emanuele Erbetta, Ambrogio Virgilio and Riccardo Ottaviani, accused of the offences of false corporate communications (Art. 2622 of the Italian Civil Code) and market manipulation (Art. 185 of the Consolidated Law on Finance) owing to the alleged falsification of the “claims provision” item recorded in the 2010 financial statements of Fondiaria-SAI SpA. About 2,788 parties brought civil action in these proceedings in order to demand compensation for damages caused by the offences. After being admitted by the Court, around 2,780 civil claimants requested summons requests of the civilly liable party UnipolSai (formerly Fondiaria-SAI SpA). With its decree of 26 May 2014 the Court of Turin upheld the requests put forward by the civil claimants and ordered the summons of UnipolSai for the hearing of 18 July 2014. UnipolSai received approximately 2,766 summons and appeared before the court as civilly liable at the hearing of 18 July 2014. A preliminary and summary analysis of the records shows that the parties appearing as civil claimants lodged compensation applications, in many cases without quantifying the alleged damages, whereby they affirmed, in brief: (i) in some cases that they were “investors in securities of Fondiaria -SAI” and “Milano Assicurazioni” and “injured parties” in the Criminal Cases; (ii) in other cases, that they had
137
acquired Fondiaria-SAI and Milano Assicurazioni shares because they were “induced” by the allegedly “misleading” Fondiaria-SAI 2010 financial statements; (iii) that they were entitled to compensation for damages.
(b) Criminal Case (Gen. Criminal Records Reg. 24630/2013) with ordinary trial, originally with the defendants Gioacchino Paolo Ligresti, Pier Giorgio Bedogni, Fulvio Gismondi, Benito Giovanni Marino, Marco Spadacini, Antonino D’Ambrosio, Riccardo Ottaviani and Ambrogio Virgilio accused of false corporate communications (Art. 2622 of the Civil Code) and, with regard to Gioacchino Paolo Ligresti, Pier Giorgio Bedogni and Fulvio Gismondi, also accused of market manipulation (Art. 185 of the Consolidated Law on Finance) and, for Fulvio Gismondi only, false official statement in certificates (Art. 481 of the Italian Criminal Code) and UnipolSai as allegedly liable pursuant to Legislative Decree no. 231/2001 in relation to the offence of market manipulation offence against the former Company senior managers. The positions of Gioacchino Paolo Ligresti, Pier Giorgio Bedogni and Fulvio Gismondi, and of UnipolSai, were removed from these proceedings after the Judge of Preliminary Hearings, with judgement of 18 March 2014, declared his lack of territorial jurisdiction in favour of the Court of Milan, deeming that the more serious offence, market manipulation, was committed in Milan. It ensues that the proceedings (Gen. Criminal Records Reg. no. 14442/14) before the Public Prosecutor’s Office at the Court of Milan against the above-listed defendants and UnipolSai is presently pending in the investigations stage. With regard to the positions of Riccardo Ottaviani and Ambrogio Virgilio, the proceedings are following standard procedure. After committal for trial, their positions were pooled together with the main proceedings (Gen. Criminal Records Reg. no. 21713/13). As for the positions of Benito Giovanni Marino, Marco Spadacini and Antonio D'Ambrosio, statutory auditors of Fondiaria-SAI, their request to proceed with summary procedure was sustained. With judgement dated 10 November 2014, the Judge of Preliminary Hearings acquitted the three defendants with the wording “for not having committed the offence”.
It is also reminded that in the criminal proceedings in question, during the investigation phase, by means of Decree dated 10 August 2013, the Preliminary Investigations Judge ordered a preventive seizure, targeted at the confiscation of assets of up to a value of €251,600,000, against Salvatore, Jonella, Gioacchino Paolo and Giulia Maria Ligresti, Antonio Talarico, Emanuele Erbetta, Fausto Marchionni, and against the company in relation to the accusation set out in Art. 25-sexies of Legislative Decree 231/2001 and Articles 19 and 53 of Legislative Decree 231/2001. On 12 September 2013, the Company filed a review request against said provision at the Court of Turin, deeming the precautionary initiative to be groundless and unjust, in particular charging that a Company profit could be identified equal to the change in the value of the security as a result of the stock market manipulation contested. The Court of review of Turin issued an order on 1 October 2013 accepting the request for review because of the very aspect claimed by the Company’s defence team. The Public Prosecutor’s Office lodged an appeal before the Supreme Court against that measure on 10 October 2013. The Supreme Court, Fifth Criminal Division rejected the appeal on 3 April 2014.
(c) The Criminal Case (Gen. Criminal Records Reg. 48356/2013) pending while preparing the writs for trial before the Court of Milan, First Criminal Section, against Salvatore Ligresti, Giancarlo De Filippo and Niccolò Lucchini, charged with the offences set forth in Art. 110 of the Italian Criminal Code and Art. 185 of the Consolidated Law on Finance, as part of which UnipolSai was summoned and appeared before the court as civilly liable for the actions of the defendants.
Taking into account the status of the proceedings described above and the knowledge acquired by the Company thus far, also on the basis of legal opinions and information obtained, it is not currently necessary to recognise provisions for risks and charges in relation to any requirement to pay compensation that could arise
138

for UnipolSai in the hypothetical case that it were found guilty in the Civil and Criminal Cases. In fact, on the basis of international accounting standards (IAS 37), a provision should be recognised for an obligation if “it is probable (i.e. the event is more likely than not to occur) that an outflow of resources embodying economic benefits will be required to settle the obligation” and, furthermore, if “a reliable estimate can be made of the amount of the obligation”. In the case in question, these conditions are not met, in that, because of multiple reasons and assessments, including legal ones, currently: (i) the risk that UnipolSai will be ordered to pay the damages claimed by the counterparties, both in the
Civil and Criminal Cases, is not deemed “likely”; (ii) it is not possible to estimate with “sufficient reliability” the extent of the damage that UnipolSai may be
ordered to pay to investors in case of adverse outcome of the Civil and Criminal Cases. 3. Technical provisions
Amounts in €m
31/12/2014 comp. % 31/12/2013 % comp. % var.
% var. on a
like-for-like
basis
Non-Life premium provisions 2,878.3 17.1 2,203.7 19.0
Non-Life claims prov isions 13,978.8 82.9 9,392.1 80.9
Other Non-Life technical prov isions 9.0 0.1 6.8 0.1
Total Non-Life provisions 16,866.1 100.0 11,602.6 100.0 45.4 -5.4
Life mathematical provisions 28,556.3 72.5 15,572.5 73.5
Provisions for amounts payable (Life business) 379.6 1.0 285.4 1.3
Technical provisions where the investment risk is borne by
policyholders and arising from pension fund management 7,854.4 20.0 4,926.2 23.2
Other Life technical provisions 2,572.1 6.5 413.4 2.0
Total Life provisions 39,362.4 100.0 21,197.5 100.0 85.7 12.9
Total technical provisions 56,228.5 32,800.0 71.4 6.7 4. Financial liabilities Financial liabilities amounted to €3,812.7m (€2,226.3m at 31/12/2013 and €4,439.8m on a like-for-like basis). 4.1 Financial liabilities at fair value through profit or loss The item, which amounted to €1,365.4m (€554.1m at 31/12/2013 and €1,162.6m on a like-for-like basis), is broken down as follows: - Financial liabilities held for trading totalled €579.9m (€48.3m at 31/12/2013 and €409.5m on a like-for-like
basis); - Financial liabilities designated at fair value through profit or loss totalled €785.5m (€505.8m at 31/12/2013
and €753.1m on a like-for-like basis). This category included investment contracts issued by insurance companies where the investment risk was borne by the policyholders and the insurance risk borne by the Group did not exceed 10% (some types of Class III, Class V and Class VI contracts).
139

4.2 Other financial liabilities
Amounts in €m
31/12/2014 comp. % 31/12/2013 % comp. % var.
% var. on a
like-for-like
basis
Subordinated liabilities 2,033.7 83.1 1,028.8 61.5 97.7 2.5
Deposits received from reinsurers 284.1 11.6 135.0 8.1 110.4 7.4
Debt securities issued 0.0 0.0 18.4 1.1 -100.0 -100.0
Payables to bank customers 0.0 0.0 164.5 9.8 -100.0 -100.0
Other loans obtained 129.4 5.3 122.8 7.3 5.4 -0.1
Sundry financial liabilities 0.2 0.0 202.7 12.1 -99.9 -100.0
Total other financial liabilities 2,447.3 100.0 1,672.2 100.0 46.4 -25.3
Details of Subordinated liabilities are shown in the table below:
IssuerNominal amount
outstanding
Subordination
levelYear of maturity Call Rate L/NL
UnipolSai €300.0m tier II 2021 every 3 months 3M Euribor + 250 b.p. L
UnipolSai €261.7m tier II 2023 every 3 months 3M Euribor + 250 b.p. L
UnipolSai €400.0m tier I restricted 2023 every 6 months 6M Euribor + 251.5 b.p. (****) NL
UnipolSai €100.0m tier II 2025 every 6 months from 30/12/2015 6M Euribor + 251.5 b.p. (*) (****) NL
UnipolSai €150.0m tier II 2026 every 6 months from 14/07/2016 6M Euribor + 251.5 b.p. (*) (****) NL
UnipolSai €50.0m tier II 2026 every 6 months from 14/07/2016 6M Euribor + 251.5 b.p. (*) (****) NL
UnipolSai €750.0m tier I restricted in perpetuity every 3 months from 18/06/2024 fixed rate 5.75% (**) L
UnipolSai €134.0m tier I restricted 2015 (***) fixed rate 6.971% NL
(*) Loans hedged by IRS with maturity equal to the call date (these instruments transform the rate from floating to fixed). (**) From June 2024 floating rate of 3M Euribor + 518 b.p. (***) Bondholders have the option of converting the bonds at any time in the period from 24 April 2014 to 22 December 2015. (****) Including additional Mediobanca spreads.
UnipolSai - Issue of subordinated bond securities with an indefinite maturity and early repayment of subordinated loans with indefinite maturity
On 18 June 2014, UnipolSai issues a subordinated bond with indefinite maturity for a total nominal amount of €750m, with the simultaneous early repayment of subordinated loans with indefinite maturity disbursed in the past from Mediobanca to Fondiaria-SAI (now UnipolSai) and to merged entities Milano Assicurazioni and Unipol Assicurazioni for a total amount of €750m. In addition, the derivatives hedging the interest rate risk (IRS), which transformed the rate from variable to fixed, activated on the aforesaid loans, were interrupted.
These securities meet the requirements for being included in the elements of the available Solvency margin of the company up to a maximum limit of 50%, given UnipolSai has obtained the necessary regulatory authorisations in this regard.
In application of the contractual clauses, on 11 September 2014 UnipolSai and Mediobanca signed an agreement to amend some Loan Agreements covering medium-term subordinated loans amounting to €700m. This agreement provides for the amendment of several economic terms, including payment by way of compromise, of an annual indemnity equal to €71.5 basis points, in addition to the previous spread (thereby
140

raising the total spread from 1.80 to 2.515 basis points) provided for in the Loan Agreements. Please note that this additional cost for 2014 amounted to €5m.
The issues and the subsequent repayment not only diversify the sources of financing and lengthen the average duration of UnipolSai’s subordinated debt, make it possible to comply with the relevant measures prescribed by the Antitrust Authority at the time of authorisation of the transaction involving the acquisition of control of the former Premafin/Fondiaria-SAI Group, which made provision for the reduction of existing debt with Mediobanca for a total amount of €350m by 2015.
Following the transaction, the incidence of subordinated loans granted by Mediobanca on total subordinated debt fell from 72% to 35%.
UnipolSai - Issue of a Convertible Loan
On 24 April 2014 UnipolSai issued the Convertible Loan, represented by 2,018 bonds with a unit nominal value of €100,000, for a total of €201.8m. The bond loan was subscribed as follows: (i) €134.3m by the lending banks that had approved the debt restructuring agreement of the former Premafin,
excluding GE Capital Interbanca SpA, which - due to the merger by incorporation of Premafin, Unipol Assicurazioni and Milano Assicurazioni into UnipolSai - became lenders of UnipolSai, and
(ii) €67.5m by the parent Unipol.
The bonds issued are bearer bonds, which cannot be split up, and are freely transferable as well as included in the Monte Titoli SpA centralised management system for dematerialised securities. They constitute direct - not guaranteed or subordinated - obligations, accrue gross annual interest (which cannot be capitalised) of 6.971%, calculated on the unit nominal value, with deferred payment every six months, with the first coupon scheduled for 31 May 2014. The conversion ratio, equal to 36,630.037 newly issued ordinary UnipolSai shares for each bond held, is calculated as the ratio of (a) the unit nominal value of the bonds to (b) the initial conversion price (€2.730 per share). Therefore, the maximum number of shares to be issued to serve the Convertible Loan is 73,919,409.
Bondholders have the option to convert the bonds at any time during the period from 24 April 2014 to 22 December 2015 and, in any event, shall be automatically converted into shares on 31 December 2015 (expiry date of the Convertible Loan). On 22 May 2014 all 675 bonds held by the parent Unipol had been converted. Therefore, at 31 December 2014, the UnipolSai Convertible Loan amounted to €134m, of which, in accordance with IAS 32.15, the item “Other financial liabilities” includes only the component classifiable as financial liability. The component attributable to equity instruments was recognised as an increase in Shareholders’ Equity.
Reduction of the debt is mainly due to the following transactions:
- extinction for €379.3m of the former Premafin loan concerning the “Amended Post-Integration Loan Agreement” (€340.2m), the “GE Capital Agreement” (€39.2m), transactions planned from the start as part of the Merger and included in the rescheduling plan for Premafin debt entered into with the lending banks, subject to the effectiveness of the Merger. Specifically: on 24 April 2014 €201.8m were repaid, with the concomitant issue of a convertible loan of the same
amount; on 7 August 2014 the other €177.6m were extinguished in advance (of which €138.4m were to fall
due in 2018 and €39.2m in 2020);- expiry of the loan repurchase agreement of the former Unipol Assicurazioni for approximately €103.6m;
141

- repayment by Marina di Loano of the loan agreement entered into with Intesa Sanpaolo as Agent Bank for about €48m;
- repayment by the former Finadin, today incorporated in UnipolSai Finance (formerly Smallpart) of the two loan agreements entered into with Banca Popolare di Milano and Banco Popolare for a total carrying amount of about €12.4m.
5. Payables
Amounts in €m
31/12/2014 % comp. 31/12/2013 % comp. % var.
% var. on a
like-for-like
basis
Payables arising from direct insurance business 143.7 17.5 94.8 14.5 51.5 -5.1
Payables arising from reinsurance business 40.9 5.0 73.4 11.2 -44.4 -51.0
Other payables 634.4 77.5 487.1 74.3 30.2 -20.5
Policyholders' tax due 172.8 21.1 80.3 12.2 115.3 11.7
Sundry tax payables 94.3 11.5 82.9 12.7 n.s. n.s.
Trade payables 171.8 21.0 229.9 35.1 -25.3 -34.4
Post-employment benefits 77.0 9.4 52.1 7.9 47.8 -7.7
Social security charges payable 33.8 4.1 18.2 2.8 85.5 12.6
Sundry payables 84.7 10.3 23.7 3.6 n.s. -51.2
Total payables 818.9 100.0 655.4 100.0 25.0 -20.7
6. Other liabilities
Amounts in €m
31/12/2014 % comp. 31/12/2013 % comp. % var.
% var. on a
like-for-like
basis
Current tax liabilities 15.7 1.8 67.0 4.9 -76.5 -86.1
Deferred tax liabilities 86.3 10.0 827.4 60.6 -89.6 -90.6
Liabilities associated with disposal groups 2.6 0.3 74.2 5.4 -96.4 -96.4
Commissions on premiums under collection 109.4 12.7 88.7 6.5 23.3 -19.1
Deferred commission income 0.8 0.1 0.0 0.0 n.s. -36.5
Accrued expense and deferred income 0.8 0.1 0.0 0.0 0.0 17.4
Other liabilities 646.0 75.0 309.1 22.6 109.0 19.0
Total other liabilities 861.6 100.0 1,366.4 100.0 -36.9 -51.6
Deferred tax liabilities is shown net of the compensation carried out, pursuant to IAS 12, with the corresponding taxes (IRES or IRAP) recorded in Deferred tax assets. Offsetting between deferred tax assets and liabilities is performed starting from financial year 2014, as explained in Chapter 2 Main accounting standards.
Liabilities associated with disposal groups consisted of the liabilities of the companies UnipolSai Investimenti SGR and Saint George Capital Management SA in liquidation in addition to several properties held by Group companies; the figure at 31 December 2013 included €72.8m relating to the assets connected with the perimeter disposed of in compliance with Antitrust Authority Measure dated 19 June 2012. For details please refer to paragraph 5.5 of these Notes to the financial statements.
142

4. NOTES TO THE INCOME STATEMENT
Comments and further information on the items in the income statement and the variations that took place compared with the previous year are given below (the numbering of the notes relates to the mandatory layout for the preparation of the income statement). ________________________________________________________________________________________
REVENUE
1.1 Net premiums
Amounts in €m
31/12/2014 31/12/2013 % var.
% var. on a
like-for-like
basis
Non-Life earned premiums 8,878.4 6,063.6 46.4 -7.9
Non-Life written premiums 8,451.4 5,792.2 45.9 -9.1
Changes in Non-Life premium prov ision 427.0 271.4 57.4 25.0
Life written premiums 7,536.2 3,915.0 92.5 24.0
Non-Life and Life gross earned premiums 16,414.6 9,978.5 64.5 4.5
Non-Life earned premiums ceded to reinsurers -439.9 -320.9 37.1 7.2
Non-Life premiums ceded to reinsurers -420.2 -319.4 31.6 2.5
Changes in Non-Life premium prov ision - reinsurers' share -19.6 -1.5 1236.7 4586.5
Life premiums ceded to reinsurers -14.1 -7.5 87.6 -7.1
Non-Life and Life earned premiums ceded to reinsurers -454.0 -328.4 38.2 6.7
Total net premiums 15,960.6 9,650.1 65.4 4.4
1.2 Commission income
Amounts in €m
31/12/2014 31/12/2013 % var.% var. on a
like-for-like
basis
Commission income from banking business 5.0 6.9 -27.6 -27.6
Commission income from investment contracts 0.5 1.1 -54.1 -56.4
Other commission income 9.4 0.0 0.0 -12.7
Total commission income 14.9 8.0 86.0 -20.9
143

1.3 Gains and losses on financial instruments at fair value through profit or loss
Amounts in €m
31/12/2014 31/12/2013 % var.
% var. on a
like-for-like
basis
on held-for trading financial assets -356.0 -37.6
on held-for trading financial liabilities 7.0 0.3
on financial assets/liabilities at fair value through profit or loss 420.8 197.0
Total net gains/losses 71.8 159.7 -55.0 -78.7
Included among the gains and losses on held-for-trading financial assets were capital losses for €267.6m from the measurement of derivatives, part-settled, to hedge positive changes in fair value of bonds classified under Available-for-sale assets, for which hedge efficiency testing was carried out with positive results. The positive €270.3m change in the fair value of the underlying bonds was classified under item 1.5 Gains on other financial instruments and investment property (Unrealised gains on available-for-sale financial assets).
1.4 Gains on investments in subsidiaries, associates and interests in joint ventures
These amounted to €6.9m (€7.8m in 2013, €11.3m on a like-for-like basis).
144

1.5 Gains on other financial instruments and investment property
Amounts in €m
31/12/2014 31/12/2013 % var.
% var. on a
like-for-like
basis
Interest 1,593.2 972.9 63.8 1.9
on held-to-maturity investments 65.4 17.1 283.7
on loans and receivables 207.3 107.8 92.3
on available-for-sale financial assets 1,309.1 829.0 57.9
on sundry receivables 4.8 9.5 -49.3
on cash and cash equivalents 6.6 9.5 -31.0
Other income 186.7 109.2 70.9 11.5
from investment property 111.0 76.2 45.6
from available-for-sale financial assets 75.7 33.0 129.4
Realised gains 767.1 406.4 88.7 17.9
on investment property 4.7 6.7 -29.7
on held-to-maturity investments 2.7 0.0 0.0
on loans and receivables 54.5 0.1 52976.3
on available-for-sale financial assets 703.3 399.6 76.0
on other financial liabilities 1.8 0.0 28633.0
Unrealised gains and reversals of impairment losses 270.6 0.5 n.s. n.s.
on available-for-sale financial assets 270.4 0.0 0.0
on other financial assets and liabilities 0.2 0.5 -59.8
Total item 1.5 2,817.6 1,489.0 89.2 18.3 The unrealised gains on available-for-sale financial assets for €270.3m related to positive changes in fair value of the bonds subject to fair value hedging derivatives for which hedge efficiency testing was carried out with positive results. The negative change of €267.6m in the fair value of derivatives was recognised under item 1.3 Gains and losses on financial instruments at fair value through profit or loss (Gains and losses on held-for-trading financial assets). 1.6 Other revenue
Amounts in €m
31/12/2014 31/12/2013 % var.
% var. on a
like-for-like
basis
Income from non-current assets held for sale 332.9 0.0 n.s. n.s.
Sundry technical income 95.1 67.9 40.0 6.2
Exchange rate differences 26.7 0.9 n.s. n.s.
Extraordinary gains 41.8 28.8 45.0 29.8
Other income 372.2 368.1 1.1 -7.4
Total other revenue 868.7 465.7 86.5 64.3
145

COSTS
2.1 Net charges relating to claims
Amounts in €m
31/12/2014 31/12/2013 % var.
% var. on a
like-for-like
basis
Net charges relating to claims - direct and indirect business 14,571.6 8,508.9 71.3 9.8
Non-Life business 5,955.0 4,246.1 40.2 -7.4
Non-Life amounts paid 6,472.8 4,988.8
changes in Non-Life claims prov ision -376.0 -626.4
changes in Non-Life recoveries -141.8 -116.2
changes in other Non-Life technical prov isions 0.0 -0.1
Life business 8,616.6 4,262.8 102.1 26.1
Life amounts paid 6,148.7 4,596.7
changes in Life amounts payable -22.0 41.2
changes in mathematical prov isions 2,129.0 605.8
changes in other Life technical prov isions 119.1 -44.5
changes in prov isions where the investment risk is borne by
policyholders and arising from pension fund management 241.8 -936.5
Charges relating to claims - reinsurers' share -258.7 -176.7 46.5 47.5
Non-Life business -246.2 -169.4 45.3 50.7
Non-Life amounts paid -278.1 -228.2
changes in Non-Life claims prov ision 25.5 56.6
changes in Non-Life recoveries 6.4 2.2
Life business -12.6 -7.2 73.6 4.0
Life amounts paid -34.6 -18.5
changes in Life amounts payable 1.2 -1.3
changes in mathematical prov isions 20.9 12.6
Total net charges relating to claims 14,312.8 8,332.2 71.8 9.3
2.2 Commission expense
Amounts in €m31/12/2014 31/12/2013 % var.
% var. on a
like-for-like
basis
Commission expense from banking business 3.7 0.0 0.0 -33.9
Commission expense from investment contracts 1.1 0.7 60.1 31.0
Other commission expense 8.8 5.6 57.5 -8.6
Total commission expense 13.7 6.3 116.2 -15.2
146

2.3 Losses on investments in subsidiaries, associates and interests in joint ventures
These amounted to €26.0m (€2.1m in 2013, €4.5m on a like-for-like basis), of which €13.6m relating to the pro-rata result of Unipol Banca SpA (regarding the part not covered by option) and €7.4m relating to the write-down of Euromilano SpA now classified under Available-for-sale assets.
2.4 Losses on other financial instruments and investment property
Amounts in €m
31/12/2014 31/12/2013 % var.% var. on a
like-for-like
basis
Interest: 97,5 64,4 51,3 -9,0
on other financial liabilities 94,2 59,6 58,0 0,0
on payables 3,3 4,8 -30,8 0,0
Other charges: 96,3 68,1 41,4 25,7
from investment property 48,6 59,4 -18,1 0,0
from loans and receivables 0,0 0,1 -100,0 0,0
from available-for-sale financial assets 4,6 7,9 -42,0 0,0
from cash and cash equivalents 0,4 0,4 13,1 0,0
from other financial liabilities 42,6 0,4 10990,7 0,0
from sundry payables 0,1 0,0 3545,3 0,0
Realised losses: 286,7 39,6 n.s. n.s.
on investment property 2,9 0,2 1162,3 0,0
from held-to-maturity investments 0,7 0,0 0,0 0,0
on loans and receivables 123,7 0,0 0,0 0,0
on available-for-sale financial assets 159,3 39,3 305,2 0,0
Unrealised losses and impairment losses: 185,2 126,7 46,1 -24,6
on investment property 159,2 99,7 59,6 0,0
on loans and receivables 7,9 6,8 16,0 0,0
on available-for-sale financial assets 15,1 20,2 -24,9 0,0
on other financial liabilities 2,9 0,0 0,0 0,0
Total item 2.4 665,7 298,9 122,8 23,2
The Unrealised losses and impairment losses relating to investment property included amortisation that totalled €45.8m (€44.2m at 31/12/2013 and €61.2m on a like-for-like basis) and write-downs amounting to €113.4m (€55.5m at 31/12/2013, €58.9m on a like-for-like basis), carried out on the basis of updated valuations performed by independent experts.
147

2.5 Operating expenses
Amounts in €m
31/12/2014 31/12/2013 % var.
% var. on a
like-for-like
basis
Insurance sector 2,610.9 1,537.1 69.9 1.8
Other Businesses Sector 66.1 313.3 -78.9 -79.3
Real Estate Sector 9.9 0.2 n.s. 25.1
Intersegment eliminations -41.0 -241.1 -83.0 -83.0
Total operating expenses 2,645.9 1,609.4 64.4 -0.2 Below are details of Operating expenses in the Insurance business:
% var. % var. % var.
% var. on a
like-for-like
basis
Amounts in €m Dec-14 Dec-13 Dec-14 Dec-13 Dec-14 Dec-13
Acquisition commissions 1,319.7 803.0 64.3 155.7 96.3 61.8 1,475.3 899.2 64.1 -2.5
Other acquisition costs 411.7 222.3 85.2 43.4 25.9 67.4 455.0 248.2 83.4 7.6
Changes in deferred acquisition costs 0.7 -8.3 n.s. 0.9 -3.2 n.s. 1.6 -11.5 n.s. n.s.
Collection commissions 177.8 125.0 42.2 10.5 6.1 70.8 188.3 131.2 43.6 -9.2Profit sharing and other commissions from
reinsurers -112.5 -78.6 43.2 -2.0 -1.1 78.3 -114.5 -79.7 43.7 9.3
Investment management expenses 60.0 10.8 n.s. 38.2 13.1 n.s. 98.2 23.9 n.s. 67.9
Other administrative expenses 397.6 260.3 52.7 109.3 65.5 67.0 506.9 325.8 55.6 5.8
Total operating expenses 2,254.9 1,334.5 69.0 356.0 202.6 75.7 2,610.9 1,537.1 69.9 1.8
NON-LIFE LIFE TOTAL
2.6 Other costs
Amounts in €m
31/12/2014 31/12/2013 % var.% var. on a
like-for-like
basis
Other technical charges 190.5 200.7 -5.1 -21.2
Impairment losses on receivables 17.6 49.6 -64.5 -67.0
Other charges 726.2 615.7 17.9 -8.5
Total other costs 934.4 866.0 7.9 -14.2 3. Income tax In accordance with the provisions of IAS 12 the following table shows, at consolidated level, the deferred taxes utilised and accrued.
148

31/12/2014 31/12/2013
Amounts in €m IRES IRAP Total IRES IRAP Total
Current taxes -378.3 -98.3 -476.7 -89.8 -61.1 -151.0
Deferred tax assets and liabilities: 94.8 27.3 122.1 -125.8 -1.7 -127.5
Use of deferred tax assets -112.9 -5.0 -117.9 -237.5 -8.9 -246.3
Use of deferred tax liabilities 20.1 11.3 31.4 85.5 20.5 106.0
Prov isions for deferred tax assets 286.2 43.6 329.8 114.7 7.7 122.4
Prov isions for deferred tax liabilities -98.6 -22.6 -121.2 -88.6 -21.0 -109.6
Total -283.5 -71.0 -354.5 -215.7 -62.8 -278.5
Against pre-tax income of €1,142.0m, taxes pertaining to the year of €354.5m were recorded, corresponding to a tax rate of 31.0% (41.8% at 31/12/2013, and 40.6% on a like-for-like basis), in particular penalised by the 8.5% IRES surcharge on financial/insurance companies).
The following table shows the breakdown of deferred tax assets and liabilities following the compensation transaction, carried out starting from 2014, showing the major differences for taxation purposes:
Amounts in €m 31/12/2014
DEFERRED TAX ASSETS
Intangible assets and property, plant and equipment 56.1
Investment property 80.7
Financial instruments -400.0
Sundry receivables and other assets 136.9
Provisions 189.0
Technical prov isions 297.3
Financial liabilities -1.5
Payables and other liabilities -1.8
Other deferred tax assets -134.9
Total deferred tax assets 221.8
DEFERRED TAX LIABILITIES
Intangible assets and property, plant and equipment -63.1
Technical prov isions – Reinsurers' share -9.4
Investment property 35.3
Financial instruments 980.5
Sundry receivables and other assets -4.4
Provisions -13.8
Technical prov isions -700.7
Financial liabilities 2.7
Payables and other liabilities -9.7
Other deferred tax liabilities -131.1
Total deferred tax liabilities 86.3
Net tax assets are deemed to be recoverable on the basis of the provisional plans of Group companies.
149

5. OTHER INFORMATION
5.1 Hedge Accounting
Fair value hedging concerns fixed-rate bonds, transformed to a floating rate via Interest Rate Swaps and government bonds for which the price of sale was set through bond forwards. At year end there were also outstanding forward sales of Italian government securities maturing in January 2015.
Fair value hedges
UnipolSai Assicurazioni: the financial instruments designated as hedging instruments were:
- Interest Rate Swaps: with regard to the hedges through Interest Rate Swaps, note that two contracts were partially closed during the year, while the hedging of positions still open continued. The overall change in the fair value (regarding both closed and open positions) of the bonds hedged classified under Available-for-sale assets was a positive €142.4m, whilst the total change in fair value of the IRSs, including realised losses on part-settlement of the hedging instrument, was €139.7m. At 31 December 2014 hedging was effective since the ratios between the respective variations in fair value were still within the range 80%-125%, with a positive net economic effect of €2.7m.
- Bond Forwards, whose fair value at 31 December 2014 was negative for €127.9m, recorded a change in fair value since the start date of the current hedges of €127.9m. The change in the fair value of the bonds hedged classified under Available-for-sale assets, recognised in the hedge validity period, was a positive €127.9m. At 31 December 2014 hedging was effective since the ratios between the respective variations in fair value were still within the range 80%-125%. The economic effects pertaining to 2014 amounted to a positive €127.9m as regards the change in fair value of the underlying assets and a negative €127.9m as regards the change in the fair value of the Bond Forwards, and hence with an immaterial net economic effect.
Cash flow hedges
The objective of the existing hedges is to transform the interest rate on financial liabilities from a floating rate to a fixed rate, stabilising the cash flows.
UnipolSai Assicurazioni - cash flow hedges on hybrid perpetual loans through IRSs for a notional value of €300m: the cumulative negative effect on Shareholders’ Equity, in the Hedging reserve, for gains or losses on cash flow hedges was €11m (€7.2m net of tax). At 31 December 2013, the figure for the former Unipol Assicurazioni was a negative €44.8m (€29.4m net of tax) and it pertained to hybrid perpetual loans for a nominal amount of €400m. During the year, said hybrid perpetual loans were closed along with the related connected IRSs with equal nominal value. At 31 December 2013, the figure for the former Fondiaria-SAI was a positive €4.1m (€3m net of tax) and it pertained to subordinated loans for a nominal amount of €500m. During the year, said hybrid perpetual loans for the nominal amount of €250m were closed along with the related connected IRSs with equal nominal value. At 31 December 2013, the figure for the former Milano Assicurazioni was a positive €0.4m (€0.2m net of tax) and it pertained to subordinated loans for a nominal amount of €150m. During the year, the hybrid perpetual loan for a nominal amount of €100m was closed along with the related IRS with equal nominal value.
UnipolSai Assicurazioni - cash flow hedges on bond securities recorded in the Available-for-sale asset portfolio through the sale of IRSs for a notional value of €839.3m.
150

The cumulative positive effect on Shareholders’ Equity, in the Hedging reserve, for gains or losses on cash flow hedges was €31.6m (€20.7m net of tax). At 31 December 2013, the effect, pertaining only to the former Unipol Assicurazioni for a nominal amount of €327m of bond securities, was a positive €0.5m (€0.3m net of tax).
Marina di Loano - cash flow hedges on debt exposures to banks: the loan disbursed by Intesa Sanpaolo was repaid and the related IRS closed for a notional €20m.
Tikal - cash flow hedges on debt exposures to banks through IRSs for a notional €55m (€55m in 2013): at 31 December 2014 the cumulative positive effect on Shareholders’ Equity, in the Hedging reserve, for gains or losses on cash flow hedges was €1.5m (€0.9m at 31/12/2013).
5.2 Information relating to the actual or potential effects of netting agreements
In order to allow an evaluation of the actual or potential effects of netting agreements on the UnipolSai Group, the information relating to the financial instruments involved in master netting arrangements are reported below. The transactions shown in the tables below concern:
- derivatives - repurchase agreements.
With reference to derivatives, the agreements contained in the ISDA Master agreements which regulate transactions in said instruments, make provision, in the cases of the insolvency of one of the contractual parties, for the offsetting between receivables and payables including any cash deposits or financial instruments pledged as guarantee.
In relation to repurchase agreements, the set-off clause, applicable in the case of the insolvency of the forward purchaser, is intrinsically constituted by the collateral pledged on the financial securities forming the object of the forward purchase.
Financial assets (Amounts in €m)
Financial instruments
(D)
Cash deposits received as
guarantees (E) Derivative transactions (1) 563.4 563.4 536.5 26.9
Repurchase agreements
Securities lending
Other
Total 563.4 563.4 536.5 26.9
Financial liabilities (Amounts in €m)
Financial instruments
(D)
Cash deposits given as
guarantees (E)
Derivative transactions (1) 578.4 578.4 167.1 369.4 41.9
Repurchase agreements
Securities lending
Other
Total 578.4 578.4 167.1 369.4 41.9
Type
Type
Gross amount (A)
Total financial liabilities offset in
the financial statements (B)
Net total financial assets recognised
in the financial statements
(C)= (A) - (B)
Related amounts not subject to offsetting in the financial statements
Net total (F)=(C )-(D)-(E)
Gross amount (A)
Total financial assets offset in the
financial statements (B)
Net total financial liabilities
recognised in the financial
statements(C)= (A) - (B)
Related amounts not subject to offsetting in the financial statements
Net total (F)=(C )-(D)-(E)
(1) The amounts indicated include the fair value in the financial statements of the derivatives involved in the netting agreements and any cash deposits given or received as guarantee.
151

5.3 Earnings (loss) per share
Basic
31/12/2014 31/12/2013
Profit/loss allocated to ordinary shares (€m) 640.4 188.2
Weighted average of ordinary shares outstanding during the year (no./m) 2,248.2 920.4
Basic earnings (loss) per share (€ per share) 0.28 0.20
Diluted
31/12/2014 31/12/2013
Profit/loss allocated to ordinary shares (€m) 640.4 188.2
Weighted average of ordinary shares outstanding during the year (no./m) 2,248.2 920.4
Diluted earnings (loss) per share (€ per share) 0.28 0.20
Pursuant to IAS 33.23, the ordinary shares that will be issued when the Convertible Loan is converted are included in the calculation of the basic EPS from the date when the contract was signed.
5.4 Dividends
In view of the profit for the year made by UnipolSai SpA at 31 December 2013 (as shown in the financial statements drawn up in accordance with Italian GAAP), the Shareholders’ Meeting of UnipolSai SpA held on 30 April 2014, resolved the distribution of dividends totalling €550.0m, €25.1m of which to Class “A” Savings Shares, €84.8m to Class “B” Savings Shares and €440.1m to Ordinary Shares, corresponding to €19.64133 per Class “A” Savings Share, €0.22497 per Class “B” Savings Share and €0.19559 per Ordinary Share. Following the partial conversion on 5 May 2014 of the 675 bonds issued by UnipolSai and subscribed by the holding company Unipol Gruppo Finanziario SpA, dividends paid on ordinary shares were further increased by €4.8m: as a result, they amount to €554.9m, of which €444.9m attributed to ordinary shares.
The Shareholders’ Meeting also set the dividend payment start date for 22 May 2014 (coupon detachment 19 May 2014).
In compliance with the conditions set forth in the Convertible Loan regulations, €9.6m were also paid to holders of the bonds not yet converted as a Manufactured Dividend.
The financial statements at 31 December 2014 of UnipolSai, drawn up in accordance with Italian GAAP, posted a profit of €751.6m. The Board of Directors of UnipolSai proposes that the Ordinary Shareholders’ Meeting allocate as dividends €0.17500 per Ordinary Share, €6.5 per Class “A” Savings Share and €0.20438 per Class “B” Savings Share considering 725,620 Ordinary Treasury Shares in portfolio. The total amount allocated to dividends amounts to €483.5m.
5.5 Non-current assets or assets of a disposal group held for sale
The other reclassifications made in application of IFRS 5 regard the assets (€14.2m) and liabilities (€2.6m) of UnipolSai Investimenti SGR SpA (direct 100% subsidiary), the assets (€0.9m) and liabilities (€0.1m) of Saint George Capital Management SA (indirect 100% subsidiary of UnipolSai Finance SpA) and certain properties for which the relative preliminary sales contracts have already been signed (€8.5m).
152

The tables below show the details of the reclassified assets and liabilities. Non-current assets or assets of a disposal group held for sale
Amounts in €m
31/12/2014 31/12/2013 31/12/2014 31/12/2013 31/12/2014 31/12/2013 31/12/2014 31/12/2013 31/12/2014 31/12/2013
1 INTANGIBLE ASSETS - 62.8 - - 0.0 - - 0.0 0.0 62.9
1.1 Goodw ill - - - - - - - - - -1.2 Other intangible assets - 62.8 - - 0.0 - - 0.0 0.0 62.9
2 PROPERTY, PLANT AND EQUIPMENT - 0.1 - - - - - 0.2 - 0.2
2.1 Property - - - - - - - - - -2.2 Other tangible assets - 0.1 - - - - - 0.2 - 0.2
3 TECHNICAL PROVISIONS - REINSURERS' SHARE - - - - - - - - - -
4 INVESTMENTS - 0.9 8.5 21.4 13.7 - - 0.1 22.2 22.4
4.1 Inv estment property - - 8.5 21.4 - - - - 8.5 21.4 4.2 Inv estments in subsidiaries, associates and interests in joint v enture - - - - - - - - - -4.3 Held-to-maturity inv estments - - - - - - - - - -4.4 Loans and receiv ables - 0.9 - - - - - - - 0.9 4.5 Av ailable-for-sale financial assets - - - - 13.7 - - 0.1 13.7 0.1 4.6 Financial assets at fair v alue through profit or loss - - - - - - - - - -
5 SUNDRY RECEIVABLES - 26.5 - - - - - 0.0 - 26.5
5.1 Receiv ables relating to direct insurance business - 26.5 - - - - - - - 26.5 5.2 Receiv ables relating to reinsurance business - - - - - - - - - - 5.3 Other receiv ables - 0.0 - - - - - 0.0 - 0.0
6 OTHER ASSETS - 3.1 - - 0.5 - 0.0 0.4 0.5 3.5
6.2 Deferred acquisition costs - 0.5 - - - - - - - 0.5 6.3 Deferred tax assets - - - - 0.0 - - - 0.0 -6.4 Current tax assets - - - - 0.2 - 0.0 - 0.2 -6.5 Other assets - 2.6 - - 0.3 - 0.0 0.4 0.3 3.0
7 CASH AND CASH EQUIVALENTS - 20.7 - - 0.0 - 0.9 2.7 0.9 23.4
TOTAL NON-CURRENT ASSETS OR DISPOSAL GROUPS - 114.1 8.5 21.4 14.2 - 0.9 3.4 23.6 138.9
Total
reclassifications
disposals
ex Ruling AGCM
Saint George Capital
ManagementReal Estate
UnipolSai Investimenti
SGR
Liabilities associated with disposal groups
31/12/2014 31/12/2013 31/12/2014 31/12/2013 31/12/2014 31/12/2013 31/12/2014 31/12/2013 31/12/2014 31/12/2013
2 PROVISIONS - 15.1 - - 0.0 - - - 0.0 15.1
3 TECHNICAL PROVISIONS - 18.7 - - - - - - - 18.7
4 FINANCIAL LIABILITIES - - - - - - - - - -
4.1 Financial liabilities at fair v alue through profit or loss - - - - - - - - - -4.2 Other financial liabilities - - - - - - - - - -
5 PAYABLES - 5.2 - - 2.2 - 0.1 1.2 2.2 6.4
5.1 Pay ables arising from direct insurance business - 0.6 - - - - - - - 0.6 5.2 Pay ables arising from reinsurance business - - - - - - - - - -5.3 Other pay ables - 4.6 - - 2.2 - 0.1 1.2 2.2 5.8
6 OTHER LIABILITIES - 33.8 - - 0.4 - - 0.1 0.4 33.9
6.2 Deferred tax liabilities - 21.6 - - 0.2 - - - 0.2 21.6 6.3 Current tax liabilities - - - - 0.2 - - 0.0 0.2 0.0 6.4 Other liabilities - 12.3 - - - - - 0.1 - 12.4
TOTAL LIABILITIES OF A DISPOSAL GROUP - 72.8 - - 2.6 - 0.1 1.3 2.6 74.2
disposals
ex Ruling AGCM
Saint George Capital
Management
Total
reclassifications
Amounts in €m
Real Estate
UnipolSai Investimenti
SGR
153

Consolidated Income Statement
31/12/2014 31/12/2013 31/12/2014 31/12/2013 31/12/2014 31/12/2013 31/12/2014 31/12/2013 31/12/2014 31/12/2013
1.2 Commission income - - - - - - 0.0 2.6 0.0 2.6
1.5 Gains on other financial instruments and inv estment property - - - - 0.7 - 0.1 0.0 0.8 0.0
1.5.1 Interest income - - - - 0.4 - - 0.0 0.4 0.0
1.5.3 Realised gains - - - - 0.2 - 0.1 - 0.4 -
1.6 Other rev enue - - - - 0.1 - 0.1 0.1 0.1 0.1
1 TOTAL REVENUE AND INCOME - - - - 0.7 - 0.2 2.6 0.9 2.6
2.4 Losses on other financial instruments and inv estment property - - 1.0- 0.3- 0.0- - 0.0- 0.0- 1.0- 0.3-
2.4.4 Unrealised losses - - 1.0- 0.3- - - - - 1.0- 0.3-
2.5 Operating ex penses - - - - 0.9- - 0.7- 3.0- 1.6- 3.0-
2.5.3 Other administrative expenses - - - - 0.9- - 0.7- 3.0- 1.6- 3.0-
2.6 Other costs - - - - 0.9- - 0.8- 0.7- 1.6- 0.7-
2 TOTAL COSTS AND EXPENSES - - 1.0- 0.3- 1.8- - 1.4- 3.8- 4.2- 4.0- PRE-TAX PROFIT (LOSS) FOR THE YEAR - - 1.0- 0.3- 1.1- - 1.2- 1.1- 3.3- 1.4-
3 Income tax - - - - 0.8- - 0.0- 0.0- 0.8- 0.0- PROFIT (LOSS) FOR THE YEAR AFTER TAXES - - 1.0- 0.3- 1.9- - 1.2- 1.1- 4.1- 1.4-
Saint George Capital
Management
reclassifications
IFRS 5(amounts in €)
Amounts in €m
disposals
ex Ruling AGCM Real Estate
UnipolSai Investimenti
SGR
5.6 Transactions with related parties
Since the start of 2014, most service contracts have been centralised into UnipolSai.
Since 6 January 2014, the service contracts previously entered into by Unipol Gruppo Finanziario were transferred to UnipolSai.
UnipolSai Assicurazioni provided services relating to the following areas: - Governance (services supporting internal control, risk management and compliance); - Anti-money laundering and Anti-terrorism; - Finance; - Communications; - Assessment of Investments; - Human Resources and Organisation (external selection, training, development, remuneration policies and
systems, personnel management, industrial relations and disputes, safety, organisation, personnel administration);
- Claims Settlement; - Insurance (distribution regulations and insurance processes, tariffs and auto portfolio management,
reinsurance, marketing, economic contractual management of the network); - Life (procedures applications and regulatory, products, settlements and bancassurance); - Legal (corporate affairs, Group legal, anti-fraud, legal insurance advice, privacy, general legal and
disputes, corporate legal, complaints and specialist assistance to customers, management of equity investments, institutional relations);
- IT services; - Administrative (accounting, tax, administrative and financial statements services, insurance and economic
management control, purchases and general services); - Real estate (logistics, asset and investment management and banking portfolio).
Unisalute, a Unipol Gruppo Finanziario subsidiary, provides the following services for the other companies in the Group:
154

Managing addressing services, providing medical advice and assistance by telephone, making bookings, managing and settling claims relating to specific guarantees/products on behalf of UnipolSai and Linear;
Support services for employee training and learning on behalf of Unipol, UnipolSai, Linear and Linear Life; Policyholder record updating services and administrative services associated with the payment of health
policy claims.
SIAT performs the following services in favour of UnipolSai: Technical assistance in the negotiation and stipulation of agreements in the transport sector; Portfolio management for agreements in the transport sector; Claims investigation, management and settlement; Administrative management in the transport sector.
Europa Tutela Giudiziaria performs the following services in favour of a number of Group companies: - Investigation, management and settlement of claims relating to the Legal Expenses portfolio; - Technical and commercial support for Legal Expenses business contracts.
Systema provides Incontra with services of an administrative nature associated with bancassurance activities (monitoring of processes, customer services and claims support).
In 2014 the Gruppo Fondiaria-SAI Servizi consortium continued to manage only certain supply and service agreements: - Information Technology; - Procurement; - Logistic and organisational services; - Claims BPO (Business Process Outsourcing); - Assistance to agency networks; - General services.
None of the above transactions are atypical or unusual.
Fees are based mainly on external costs incurred, for example for products and services acquired from suppliers, and on the costs arising from the activities of the companies themselves, i.e. generated by their own staff, and taking account of: the performance objectives that provision of the service to the Company must achieve; the strategic investments to be implemented in order to ensure the agreed levels of service. The following elements are specifically taken into consideration: personnel costs; operating costs (logistics, etc.); general costs (IT, consultancy, etc.).
The amounts for financing activities are calculating by applying a fee on managed volumes. The services provided by Unisalute and SIAT involve fixed prices.
Unipol Gruppo Finanziario, UnipolSai and Unipol Banca second staff to the Group companies in order to optimise synergies within the Group.
Financial and commercial transactions between the companies in the Unipol Banca Group and the other companies in the Group were the usual types of transaction carried out by a complex group and related to
155

services, deposit accounts or corporate financing and finance lease agreements. Agreements were also entered into for the sale and/or management of banking, financial and insurance products and services and for the provision of auxiliary banking services in general. The financial effects of these transactions were governed by the market terms applied to major customers. Merger of Banca Sai into Unipol Banca On 3 November 2014 the merger of Banca Sai (a 100% subsidiary of UnipolSai) into the investee Unipol Banca also became effective (accounting and tax effects backdated to 1 January 2014), as resolved by the respective shareholders on 3 October 2014. Based on the swap transaction agreed in the merger plan, UnipolSai received 132,428,578 new Unipol Banca shares (equal to a €132m increase in share capital in service of the merger), increasing the interest held from 32.25% to 42.25%. ________________________________________________________________________________________ The following table shows transactions with related parties (holding company, associates, affiliates and others) carried out during 2014, as laid down in IAS 24 and in CONSOB Communication DEM/6064293/2006. Transactions with subsidiaries have not been recognised since in drawing up the consolidated financial statements transactions among Group companies consolidated using the line-by-line method have been eliminated as part of the normal consolidation process. Information on transactions with related parties
Amounts in €m
Holding
company
Indirect
holding
company
Associates Affiliates Total
inc.
%
(1)
inc.
%
(2)
Technical prov isions – Reinsurers' share 0.0 0.0 0.0 1.4 1.4 0.0 0.0
Loans and receivables 267.9 0.0 212.1 0.0 480.0 0.7 2.6
Sundry receivables 0.1 0.3 65.6 14.6 80.6 0.1 0.4
Other assets 0.0 0.0 47.8 0.0 47.8 0.1 0.3
Cash and cash equivalents 0.0 0.0 350.0 0.0 350.0 0.5 1.9
TOTAL ASSETS 268.0 0.3 675.6 16.0 959.9 1.4 5.2
Other financial liabilities 0.0 0.0 7.2 0.0 7.2 0.0 0.0
Sundry payables 6.5 0.2 20.6 19.2 46.4 0.1 0.2
Other liabilities 0.0 0.0 0.0 0.0 0.1 0.0 0.0
TOTAL LIABILITIES 6.5 0.2 27.8 19.2 53.7 0.1 0.3
Net premiums 0.0 0.0 0.0 -20.6 -20.6 -2.6 -0.1
Commission income 0.0 0.0 6.5 0.0 6.5 0.8 0.0
Gains on other financial instruments and investment property 3.3 0.0 2.4 6.2 11.9 1.5 0.1
Other revenue 4.3 0.1 3.0 9.5 17.0 2.2 0.1
TOTAL REVENUE AND INCOME 7.7 0.1 11.9 -4.9 14.8 1.9 0.1
Net charges relating to claims 0.0 0.0 0.0 -7.5 -7.5 -1.0 0.0
Losses on other financial instruments and investment property 0.0 0.0 0.2 0.0 0.2 0.0 0.0
Operating expenses 0.3 0.8 156.4 -2.5 155.0 19.8 0.8
Other costs 15.4 0.1 4.8 1.0 21.3 2.7 0.1
TOTAL COSTS AND EXPENSES 15.8 1.0 161.3 -9.1 169.0 21.6 0.9
(1) Percentage based on total assets in the consolidated statement of financial position recognised under Shareholders’ Equity, and based on the net consolidated profit (loss) for the year for income statement items. (2) The percentage on total net cash flow from operating activities mentioned in the statement of cash flows. Loans and receivables due from the holding company relate to two loan agreements between the former Unipol Assicurazioni and the holding company Unipol Gruppo Finanziario executed during 2009 after
156
UnipolSai Assicurazioni’s takeover of the role of issuer for the UGF 7% and UGF 5.66% subordinated bond loans issued by UGF. Loans and receivables from associates comprise €159.0m of time deposits of more than 15 days, held by the Group companies at Unipol Banca, €43.0m of bonds issued by Unipol Banca and subscribed by UnipolSai Assicurazioni and €9.9m of interest-free loans disbursed by UnipolSai Real Estate (to Borsetto Srl., €8.1m, and to Pentadomus SpA, €1.8m). The item Sundry receivables from associates included €37.7m in receivables due from insurance brokerage agencies for commissions and €20.3m in receivables due from Finitalia for premiums it had collected for the service concerning the split payment of policies. The item Sundry receivables from affiliates included receivables for seconded staff and services supplied by UnipolSai. Other assets related to current accounts, temporarily unavailable, that UnipolSai Assicurazioni has opened at Unipol Banca. Cash and cash equivalents included the balances of current accounts opened by Group companies at the associate Unipol Banca. The item Other financial liabilities due to associates referred to mortgages provided by Unipol Banca to UnipolSai Assicurazioni. Sundry payables included: - as for relations with the holding company, the payable for Unipol Gruppo Finanziario staff seconded to
Group companies; - as for relations with associates, the payable due for interest to Finitalia for the split payment of policies; - as for relations with the affiliates, the payables for reinsurance and coinsurance transactions. The items Net premiums and Net charges for claims regard the reinsurance business of UnipolSai Assicurazioni at Unipol Gruppo Finanziario companies. Commission income and expense refer to the bank relations between the Group companies and the associate Unipol Banca. Gains on other financial instruments and investment property include: - as for relations with the holding company, the interest income on loans provided by UnipolSai Assicurazioni
to Unipol Gruppo Finanziario; - as for relations with associates, the interest income on bank deposits held by the Group companies at
Unipol Banca; - as for relations with the affiliates, rents paid to UnipolSai Real Estate by the affiliates Unisalute and Linear. Other revenue due from the holding company and from the affiliates mainly include income for staff secondment; other revenue due from associates relate to relations of the Group companies with Unipol Banca and Finitalia for banking services and policy premium instalments. Operating expenses due to associates included costs on commissions paid to insurance brokerage agencies (€87.0m), costs paid to Finitalia for instalments of policies issued by the Group companies (€34.0m) and bank relations operating costs (€30.7m). The Other costs item primarily relates to staff secondment.
Remuneration payable for 2014 to the UnipolSai Directors, Statutory Auditors and Key Managers for carrying out their duties within the company and in other consolidated companies amounted to €4.4m, details of which are as follows (in €m):
- Directors and General Manager 2.5 - Statutory auditors 0.4 - Other key managers 1.6 (*)
(*) amount mainly includes income from employment.
The remuneration of the Key Managers relating to benefits granted under the share-based plans (performance shares) are appropriately illustrated in the Remuneration Report prepared pursuant to Art. 123-ter of the
157
Consolidated Law on Finance and published on the Company’s website in accordance with current regulations.
During 2014 the companies in the Group paid UnipolSai the sum of €47.5k as remuneration for the posts held in them by the Key Managers.
5.7 Fair value measurements – IFRS 13
Regulation no. 1255/2012 ratified IFRS 13 – Fair value measurement, which took effect on 1 January 2013. IFRS 13, to be applied prospectively, has not extended the scope of application to fair value measurement, but provides a guide on how to measure the fair value of financial instruments and non-financial assets and liabilities already required or permitted by other accounting standards (IFRS).
In 2013, the Unipol Group adjusted itself into line with the requirements of the new accounting standard IFRS 13 relating to fair value measurement. This standard: a) defines the fair value;b) groups into a single accounting standard the rules for measuring fair value;c) enriches financial statement information.
The standard defines fair value as the sale price of an asset based on an ordinary transaction or the transfer price of a liability in an ordinary transaction on the main reference market at terms applicable at the measurement date (exit price). Fair value measurement assumes that the transaction relating to the sale of assets or transfer of liabilities can take place:
on the main listing market; if there is no listing market, on the market most advantageous for the assets and liabilities to be
measured.
When a market price is not observable, the measurement methods which maximise the use of observable parameters and minimise the use of non-observable parameters must mainly be used.
IFRS 13 also defines a fair value hierarchy based on the level of observability of the inputs contained in measurement techniques used to measure fair value.
Chapter 2, Main accounting standards, outlines the fair value measurement policies and criteria adopted by the UnipolSai Group.
Fair value measurement on a recurring and non-recurring basis
The table below shows a comparison between the assets and liabilities measured at fair value at 31 December 2014 and 31 December 2013, broken down based on fair value hierarchy level.
158

Assets and liabilities at fair value on a recurring and non-recurring basis: breakdown by fair value level
Amounts in €m 31/12/2014 31/12/2013 31/12/2014 31/12/2013 31/12/2014 31/12/2013 31/12/2014 31/12/2013
Assets and liabilities at fair value on a recurring basis
Av ailable-for-sale financial assets 40,236.2 21,994.2 620.9 38.7 1,256.6 623.4 42,113.7 22,656.2
Financial assets at fair v alue through profit or loss:
- held for trading 137.7 40.2 110.2 34.1 99.6 27.0 347.5 101.3
- at fair v alue through profit or loss 6,923.6 2,465.5 158.7 1,085.8 1,556.4 1,877.9 8,638.7 5,429.2
Inv estment property 0.0 0.0 0.0 0.0 0.0 0.0 0.0 0.0
Property , plant and equipment 0.0 0.0 0.0 0.0 0.0 0.0 0.0 0.0
Intangible assets 0.0 0.0 0.0 0.0 0.0 0.0 0.0 0.0
Total assets at fair value on a recurring basis 47,297.5 24,499.9 889.9 1,158.6 2,912.5 2,528.3 51,099.9 28,186.7
Financial liabilities at fair v alue through profit or loss:
- held for trading 52.7 0.0 525.0 48.3 2.2 0.0 579.9 48.3
- at fair v alue through profit or loss 0.0 0.0 0.0 505.8 785.5 0.0 785.5 505.8
Total liabilities at fair value on a recurring basis 52.7 0.0 525.0 554.1 787.7 0.0 1,365.4 554.1
Assets and liabilities at fair value on a non-recurring basis
Non-current assets or assets of a disposal group held for sale 0.0 0.0 0.0 0.0 0.0 0.0 0.0 0.0
Liabilities associated w ith disposal groups 0.0 0.0 0.0 0.0 0.0 0.0 0.0 0.0
Level 1 Level 2 Level 3 Total
The amount of financial instruments classified in Level 3 at 31 December 2014 stood at €2,912.5m.
Details of changes in Level 3 financial assets and liabilities in the same period are shown below.
Details of changes in level 3 financial assets and liabilities at fair value on a recurring basis
Amounts in €m
held for
trading
at fair v alue
through profit
or loss
held for
trading
at fair v alue
through profit
or loss
Opening balance 623.4 27.0 1,877.9 0.0 0.0 0.0 0.0 0.0
Acquisitions/Issues 43.7 1.9 0.0 0.0 0.0 0.0 0.0 0.0
Sales/Repurchases -2.4 -2.3 -280.0 0.0 0.0 0.0 0.0 0.0
Repay ments -0.1 -1.0 -64.0 0.0 0.0 0.0 0.0 0.0
Gains or losses recognised through profit or loss 0.0 8.7 -0.6 0.0 0.0 0.0 0.0 0.0
- of w hich unrealised gains/losses 0.0 8.7 -0.6 0.0 0.0 0.0 0.0 0.0
Gains or losses recognised in the statement of other comprehensiv e income 79.5 0.0 0.0 0.0 0.0 0.0 0.0 0.0
Transfers to lev el 3 15.6 0.0 121.4 0.0 0.0 0.0 0.0 0.0
Transfers to other lev els -0.1 0.0 0.0 0.0 0.0 0.0 0.0 0.0
Other changes 496.9 65.2 -98.2 0.0 0.0 0.0 2.2 785.5
Closing balance 1,256.6 99.6 1,556.4 0.0 0.0 0.0 2.2 785.5
Financial liabilities at fair
v alue through profit or lossAv ailable-for-
sale financial
assets
Financial assets at fair v alue
through profit or lossInv estment
property
Property ,
plant and
equipment
Intangible
assets
The transfers from Level 1 to Level 2 which occurred during the reference period were insignificant.
159

Analysis and stress testing of non-observable parameters (Level 3) The table below shows, for level 3 financial assets and liabilities measured at fair value, the effects of the change in the non-observable parameters used in the fair value measurement. With reference to “assets measured at fair value on a recurring basis” and belonging to Level 3, the stress test of non-observable parameters is performed with reference to financial instruments valued on a Mark to Model basis and on which the measurement is carried out through one or more non-observable parameters. The portion of securities subject to analysis has a market value of €446.0m at 31 December 2014. The non-observable parameters subject to a shock are as follows: benchmark spread curves constructed to assess bonds of issuers for which the prices of the bonds issued
or CDS curves are unavailable; credit risk parameters such as the recovery rate and probability of default. The following table shows the results of the shocks:
Amounts in €m
Fair value
Shock +10 bps -10 bps +50 bps -50 bps +10 bps -10 bps +50 bps -50 bps
Fair Value delta -0.08 0.08 -0.41 0.43 3.38 -3.21 18.74 -14.62
Fair Value delta % -0.46% 0.47% -2.28% 2.38% 0.79% -0.75% 4.38% -3.41%
Curve Spread Recovery Rate
Fair value measurements in compliance with the disclosure requirements of other standards IFRS 13 also governs the fair value measurement of assets and liabilities not measured at fair value in the statement of financial position, but for which a fair value disclosure is required in the notes to the financial statements in compliance with other international accounting standards. Furthermore, since these assets and liabilities are not typically traded, their fair value is largely based on the use of internal parameters that cannot be directly observed in the market, with the sole exception of listed securities classified as Held-to-maturity investments.
Assets and liabilities not measured at fair value: breakdown by fair value level
Amounts in €m 31/12/2014 31/12/2013 31/12/2014 31/12/2013 31/12/2014 31/12/2013 31/12/2014 31/12/2013 31/12/2014 31/12/2013
1,420.0 626.5 1,258.0 509.8 324.1 136.4 0.0 0.0 1,582.1 646.2
5,169.5 2,746.5 2.9 0.0 3,866.7 1,748.4 1,471.4 1,143.4 5,341.1 2,891.8
608.4 159.4 0.0 0.0 0.0 0.0 608.4 159.4 608.4 159.4
2,824.2 2,584.5 0.0 0.0 0.0 0.0 2,903.5 2,638.6 2,903.5 2,638.6
1,196.4 522.3 0.0 0.0 0.0 0.0 1,306.2 532.1 1,306.2 532.1
11,218.5 6,639.2 1,260.9 509.8 4,190.8 1,884.8 6,289.5 4,473.5 11,741.2 6,868.1
2,447.3 1,672.2 1,290.4 0.0 0.0 0.0 1,081.9 1,672.2 2,372.3 1,672.2
Carrying amountFair value
Level 1 Level 2 Level 3 Total
Total assets
Liabilities
Other financial liabilities
Assets
Held-to-maturity investments
Loans and receivables
Investments in subsidiaries, associates and interests in joint ventures
Investment property
Property , plant and equipment
160

5.8 Information on personnel
Share-based compensation plans
The UnipolSai Group pays additional benefits to senior executives under closed share-based compensation plans under which Unipol Ordinary shares are granted if specific targets are achieved (performance shares).
On 29 April 2013, the shareholders’ meeting of the former Fondiaria-SAI (now UnipolSai) approved the 2013-2015 compensation plan based on financial instruments (performance share type), intended for the members of the senior management and Company executives, later amended by the shareholders’ meeting of 29 April 2014. Similar resolutions were adopted in 2013 by the Corporate Bodies of the main Group companies.
The Plan is for three years, ending in 2015, and provides for benefits to be paid if the following targets are met: overall growth in consolidated gross profit for the three-year period 2013-2015; increase in the value of Unipol Ordinary securities over the three years; an indicator of financial stability. It is also dependent on individual short-term targets being met.
The compensation Plan based on financial instruments for the period 2010-2012, intended only for the executives of the former Unipol Assicurazioni, terminated on 31 December 2012 and the first tranche of 68,122 shares were paid to those entitled on 1 July 2014. A further two tranches are due on 1 July 2015 and 1 July 2016.
The cost recorded with a contra-item in shareholders’ equity for 2014 came to €5.1m (€4.5m at 31/12/2013).
Access to the Solidarity Fund for the insurance sector - Trade union agreement of 29 December 2014
After lengthy negotiations, on 29 December 2014, UnipolSai and the trade unions FISAC/CGIL, FIBA/CISL and UILCA/UIL signed a trade union agreement to supplement the trade union agreement of 18 December 2013 regarding the merger, in which the parties had identified suitable rules, methods, timing and tools effective for achieving the objective of workforce downsizing and resulting labour cost containment associated with the post-merger surplus, in particular through access to the Solidarity Fund for the insurance sector
In fact, in the agreement of 18 December 2013, it was specifically agreed that the objectives of the Business Plan could also be pursued through voluntary access to the extraordinary part of the Solidarity Fund for personnel (amount equal to roughly 900 staff) who were less than 5 years from meeting the pension requirements, to ensure that - at the end of membership of the aforementioned Fund managed by INPS (National Social Security Institute) - personnel could immediately receive their pensions. Membership of the Solidarity Fund involves the termination of the employment relationship, but allows the worker to obtain the annual equivalent treatment as his/her future pension, until this is effectively accrued, plus the payment of the related INPS contribution correlated with the period of membership of the Fund. In order to offset the difference between the current salary and solidarity allowance, the agreement made provision for a series of economic supplements (to be paid on termination of the employment contract together with the post-employment benefits) in relation to the period of membership of the Fund. For the aforementioned period of membership of the Solidarity Fund it was also established that the personnel concerned would retain the same healthcare assistance and supplementary pension allowances provided for personnel in service.
161

The agreement of 18 December 2013 also envisaged that the parties would hold special meetings to verify the number of applications for termination of employment and subsequently assess the degree to which labour cost containment objectives had been achieved. For this purpose, on 8 October 2014 UnipolSai reported - on completion of the initial phase (voluntary) of access to the Solidarity Fund and also in the light of final figures for the other contractual measures referred to in Art. 8 of the merger agreement of 18 December 2013 (exit incentives for personnel meeting the pension requirements envisaged by the Assicurazione Generale Obbligatoria - AGO (compulsory general insurance) - that 321 employees meeting the requirements had not applied and consequently the objectives indicated in the aforementioned merger agreement had not been reached.
Therefore under the terms of the agreement of 29 December 2014 the parties again confirmed the use of access to the insurance sector Solidarity Fund and the call for retirement on the basis of the following criteria for identification of the surplus 321 employees: personnel already meeting the pension requirements at 31 December 2014 or due to meet them by
30 June 2015; 90% of personnel due to meet the pension requirements between 1 July 2015 and 31 December 2019.
The following exclusions are also envisaged: - personnel registered for mandatory placement; - personnel reaching pension age with less than 35 years’ contributions at 30 June 2015; - personnel due a pension of less than €1,500 net per month for 13 months.
As part of the agreements, specific accompanying payments to the Solidarity Fund or pension were defined for personnel submitting applications by 15 February 2015 for voluntary termination of their employment contracts, similar to that already envisaged in the agreement of 18 December 2013. In this respect, note that the treatment envisaged for persons accessing the Solidarity Fund remains essentially the same, except as regards the non-recognition of the 4-month “prompt application” bonus, whilst incentives planned for those already meeting pension requirements are slightly lower than those defined in the agreement of 18 December 2013.
At 31 December 2014, applications to the Solidarity Fund totalled 526 (added to which were 104 responses to the call for retirement).
For 2015, access to the Solidarity Fund should involve 184 employees meeting the requirements, plus a possible 132 workers meeting the AGO requirements for retirement.
It should be noted that UnipolSai is the first company in the insurance market to make use of the Solidarity Fund. This instrument, in respect of the need to manage the surplus staff deriving from restructuring operations, presents undoubted advantages in terms of having a low social impact and represents a solution for dealing with the repercussions of the Fornero reform on pensions, which extended the possibility for employees to keep working until the age of 70.
Training
At 31 December 2014 the training activities for UnipolSai Group companies recorded a total number of 12,752 man-days (102,012 man-hours), 10,684 man-days (85,466 man-hours) of which in the classroom and 2,068 man-days (16,546 man-hours) distance learning by using the Group e-learning Unipol Web Academy platform. The training activities mostly involved UnipolSai Assicurazioni with 11,572 man-days (92,574 man-hours).
162

The training activities with most involvement in the UnipolSai Group were those of a technical and specialist nature. The same was true for the insurance companies and the real estate and diversified companies. Of note among the key projects in the insurance area were the training to disseminate awareness of the functions of the new claims system, “Liquido”, targeted training to expand awareness of the Essig, SAS, SAP and AHD management systems, basic IT training and sales training. As for the real estate area, it is reminded that, in the same way, the introductory course to the new real estate cost accounting process was launched. Projects aimed at boosting behavioural and relational skills were not lacking. By way of example, they included “Cultura del Servizio, Orientamento al Cliente e Comunicazione Trasparente” dedicated to SAP operators, “Tecniche di vendita, ascolto e negoziazione” for the Linear call centres and “Condividere Conoscenze (trainer training)” for new in-house trainers on classroom management techniques, which aimed at offering them methods and techniques to manage the classroom, and “Sviluppo competenze trasversali”, designed for Tenute del Cerro employees. The year 2014 was also marked by regulatory fulfilments, including training associated with the entry into force of the “Foreign Account Tax Compliance Act” Directive (FATCA), courses reserved for Safety officers and again the modules dedicated to Legislative Decree 231/2001, Privacy regulations and the prevention of insurance fraud.
5.9 Non-recurring significant transactions and events
The non-recurring significant transactions carried out during the period, all extensively illustrated in the Management Report, to which reference should be made, are summarised below.
On 6 January 2014, following the recognition of the associated deed at the competent offices of the Register of Companies, on 2 January 2014, the merger by incorporation of Unipol Assicurazioni, Milano Assicurazioni and Premafin into Fondiaria-SAI took effect, with accounting and tax effects backdated to 1 January 2014. The resulting company simultaneously took the name of UnipolSai Assicurazioni SpA or UnipolSai SpA.
On 24 April 2014 UnipolSai issued a Convertible Loan, represented by 2,018 bonds with a unit nominal value of €100,000, for a total of €201.8m, of which 675 bonds were subscribed by Unipol, converted on 5 May 2014. Bondholders have the option to convert the bonds at any time during the period from 24 April 2014 to 22 December 2015 and, in any event, shall be automatically converted into shares on 31 December 2015.
On 11 June 2014, UnipolSai, within the scope of the Medium Term Issue Programme (EMTN) for a total nominal amount of €3bn, successfully placed subordinated bond securities with indefinite maturity for a total nominal amount of €750m. The proceeds of the issue were used for the early repayment of subordinated loans with indefinite maturity disbursed in the past from Mediobanca to Fondiaria-SAI (now UnipolSai) and to merged entities Milano Assicurazioni and Unipol Assicurazioni for a total amount of €750m.
On 19 December 2014 UnipolSai completed the disposal to Allianz of the insurance assets of the former Milano Assicurazioni, performed as part of the Disposals planned in compliance with the Antitrust Measure dated 19 June 2012. The total amount collected by UnipolSai was €379m, against which a realised capital gain of €325m and costs incurred for €34m were recorded.
5.10 Atypical and/or unusual positions or transactions
In 2014 there were no atypical and/or unusual transactions that, because of their significance, importance, nature of the counterparties involved in the transaction, transfer pricing procedures, or occurrence close to the end of the year, could give rise to doubts relating to: the accuracy and completeness of the information in
163

these consolidated financial statements, a conflict of interest, the safeguarding of the company’s assets or the protection of non-controlling shareholders.
5.11 Criteria to determine the recoverable amount of goodwill with an indefinite useful life (impairment test)
In accordance with IAS 36.10, the impairment test was carried out on the goodwill recognised in the Consolidated Financial Statements of UnipolSai Assicurazioni.
The weakness of the overall economic scenario and uncertainty that will characterise the growth prospects for the economy over the coming years, determined the need to continue to use conservative criteria in determining the measurement parameters used.
Appropriate Sensitivity Analyses were also developed to test the stability of the recoverable amounts of goodwill if there was a variation in the main parameters used in the tests.
Owing to the Merger by incorporation of Unipol Assicurazioni SpA, Milano Assicurazioni SpA and Premafin HP SpA into Fondiaria-SAI SpA, which took on the name of UnipolSai Assicurazioni SpA effective starting from 6 January 2014, the UnipolSai Group incorporated the assets and liabilities of the former Premafin Group other than those of the former Fondiaria-Sai Group, and the assets and liabilities of Unipol Assicurazioni and its subsidiaries.
The assets and liabilities acquired by incorporation were recognised at the same values assigned to them in the consolidated financial statements at 31 December 2013 of the common holding company UGF, with accounting effect starting on 1 January 2014.
Following the above-mentioned merger, goodwill regarding the former Fondiaria-SAI Consolidated Financial Statements (€970m at 31/12/2013) was eliminated since UGF recalculated the goodwill on the basis of the PPA pursuant to IFRS 3 after UGF’s acquisition.
The goodwill generated after this integration transaction amounted to €306.7m. It refers to €177.0m for the Non-Life business and to €129.7m for the Life business.
Following what has been explained, the Cash Generating Units to which the afore-mentioned goodwill was attributed were consistently redefined. At 31 December 2014 they are the following:
Non-Life CGU UnipolSai Assicurazioni - Non-Life
Life CGU UnipolSai Assicurazioni - Life
In relation to the measurement methods and benchmarks adopted to estimate the recoverable value of goodwill, note that, as specified below, the same measurement criteria were adopted as for the previous year for the Non-Life and Life segments, with benchmark updating arranged at the end of 2014.
The impairment testing of the Non-Life CGUs was performed as follows: with regard to UnipolSai Assicurazioni - Non-Life the recoverable value of the goodwill was determined by using an excess capital version of a Dividend Discount Model (DDM): taking into account final pro-forma 2014 figures, note in particular that the data relating to the 2015 Budget were used, and for the years 2016-2019 a net result deriving from the average 2013-2014-2015 results was considered;
164

The results obtained from application of the impairment procedure show that there is no need to make any adjustments to the goodwill of the Non-Life CGUs recorded in the Consolidated Financial Statements at 31 December 2014.
The impairment testing of the Life CGUs was performed as follows: in relation to UnipolSai Assicurazioni - Life, the recoverable amount of goodwill was calculated by considering the value of the existing portfolio (Value of in Force) and the value of the portfolio of new products (Value of New Business), based on the discounting of future cash flows relating to the same, as derived from the in-house actuarial model;
The results obtained from application of the impairment procedure show that there is no need to make any adjustments to the goodwill of the Life CGUs recorded in the consolidated financial statements at 31 December 2014.
Non-Life CGU Valuation method used
The method used was an excess capital type of DDM (Dividend Discount Model) and focused on the future cash flows theoretically available for shareholders, without drawing on the assets needed to support the expected growth and in accordance with the capital requirements imposed by the Supervisory Authority. According to this method the value of the economic capital is the sum of the current value of potential future cash flows and the current terminal value.
Net profits used The above net profits were considered Projection period Five prospective flows were considered. Rate of discounting When the rates of discounting were determined account was taken of the country risk
implied in the risk-free rate. A rate of discounting of 7.39% was used, broken down as follows: risk-free rate: 2.92% beta coefficient: 0.90 risk premium: 5% The average figure for the 10-year Long-Term Treasury Bond for the period January – December 2014 was used for the risk-free rate. A 5-year adjusted Beta coefficient for a sample of companies listed on the European market and deemed to be comparable was used. The Premium at risk was deemed to be 5%, in accordance with common practice among financial analysts and the professional practices.
Long term growth rate (g factor)
Several significant growth indicators relating to the reference market and to the macroeconomic situation were taken into account. In particular, the annual average rate of growth of the insurance market for 2015-2019 was expected to be 2.4%. The average variation in GDP was expected to be 2.6% in nominal terms. The average consumer price index was expected to be approximately 0.9%. In view of this it was deemed appropriate to use a g factor of 2%, in line with the professional practices used.
Life CGU Goodwill recoverable amount
In relation to UnipolSai Assicurazioni - Life, the recoverable amount of goodwill was calculated by considering the value of the existing portfolio (Value of in Force) and the value of the portfolio of new products (Value of New Business), based on the discounting of future cash flows relating to the same, as derived from the in-house actuarial model.
165

On the basis of the simulations performed, and based on the parameters pointed out above, it is unnecessary to adjust the goodwill recorded in the financial statements at 31 December 2014.
Amounts in €mAllocation of
goodwillRecoverable
amount Excess
Non-Life CGU 177 3,652 3,475
Life CGU 130 967 837
Total 307 4,619 4,312
Parameters used Non-Life
Risk Free 2.92%
Beta 0.90
Risk premium 5%
Short-term discounting rate 7.39%
Range 6.39%-8.39%
Pass 0.5%
g factor 2%
Range 1%-3%
Pass 0.5%
Amounts in €m
CGU
Recoverable
Amount -
Goodwill Delta
Amount g ke Amount g ke
UnipolSai - Non-Life 3.475 2.252 1% 8,39% 6.065 3% 6,39%
Sensitivity (Value range)
Min Max
Amounts in €m
CGU
Recoverable
Amount -
Goodwill Delta
RET - 50 bps RET + 50 bps RDR - 50 bps RDR + 50 bps
UnipolSai - Life 837 723 888 936 705
Sensitivity (Value range)
166

5.12 Notes on Non-Life business
Procedural note on fixing the level of provisions and assumptions made
The process that leads to making the assumptions is carried out in such a way as to make a neutral valuation (i.e. neither optimistic nor prudent) of the liabilities with the intention of coming up with an estimate that is as realistic as possible. The source of the figures is internal and the trends are based on annual statistics and monitored monthly throughout the year. As far as possible assumptions are checked against market statistics. If any information is missing, incomplete or unreliable the estimate of the final cost is based on prudent assumptions. The very nature of insurance business makes it very difficult to predict the cost of settling a claim with any certainty. The provision for each claim reported is set by an adjuster and is based on the information in his possession and on experience gained in similar cases. The forecasts fed into the system are periodically updated on the basis of new information about the claim. The final cost may vary as the claim proceeds (for example deterioration in the condition in the event of injury) or in the event of natural disasters. Estimating the final cost appears to be very difficult and the various elements that make it so complex vary depending on the class in question. As the Group's work is concentrated in Italy the major exposure to catastrophe risks is represented by natural disasters such as Earthquake and Flood. Reinsurance cover is taken out to cover this type of risk, at different levels with respect to one’s own portfolio of the companies in the Group. These thresholds were judged sufficiently prudent, being calculated using statistical models that simulate the company’s exposures in detail.
The provisions for claims are estimated using the inventory method and the adjusters' estimates are also combined, where application conditions are satisfied, with the results of statistical methods such as the Chain Ladder, the Bornhuetter Ferguson and the ACPC (Average Cost Per Claim) and with valuations based on the average costs for the year (for similar groups covering a sufficiently large number of claims). In certain cases, it is considered necessary to segment claims based on cost, applying actuarial methods to claims below the threshold and confirming the claims handlers’ provision for claims with a cost higher than the threshold. These methods were applied after consistency of the underlying data had been verified using the model assumptions. In particular, for the Fondiaria-SAI/Milano Assicurazioni component, only the CHL Paid model was used.
The Chain Ladder method is applied to the amount paid out and the loading. The method is based on historical analysis of the factors that affect the trend in claims. The selection of these factors is based on the figures for the accumulated amounts paid out, which produces an estimate of the final cost per year of occurrence if the claims for that year have not been paid in full. The Chain Ladder method is suitable for sectors in which the figures are stable and is therefore not suitable in cases in which there are no significantly stable previous periods and in cases of significant changes in the settlement rate. The Bornhuetter Ferguson method uses a combination of a benchmark, or estimates of the ratio of losses to ‘a priori’ premium and an estimate based on claims incurred (Chain Ladder). The two estimates are combined using a formula that gives greater weight to experience. This technique is used in situations in which the figures are not suitable for making projections (recent years and new classes of risk).
167
The ACPC method is based on a projection of the number of claims to be paid and the respective average costs. This method is based on three fundamental assumptions: settlement rate, basic average costs and exogenous and endogenous inflation.
These methods extrapolate the final cost according to the year in which the claim is incurred and according to similar groups of risk on the basis of the trends in claims recognised in the past. Should there be a reason for deeming the trends recognised to be invalid some of the factors were modified and the projection adapted to fit the information currently in our possession. Some examples of what affects the trends could be:
changes in the claims handling procedures involving different approaches to settlement/makingallocations to provisions;
market trends showing increases higher than inflation (may be linked to the economic situation or topolitical, legal or social developments);
random fluctuations including the impact of “major” claims
Claims incurred but not yet reported are estimated on the basis of the historical trends within the company, with the number and the average costs of the claims being estimated separately.
As provided for during the transitional period, the provisions were not discounted.
Trend in claims
The following analyses refer to the companies in the UnipolSai Group, excluding the companies whose values are immaterial for the Group’s valuations. The companies particularly involved are Incontra, Europa, Dialogo, Systema, Pronto Assistance and DDOR. The incidence of the amount of provisions of excluded companies on the Group total stands at 1%.
The tables below, which illustrate the trend in claims, show the estimated first-year costs for each year in which claims were incurred from 2005 until 2014 and the adjustments made in subsequent years as a result of the claim being settled or the budget being adjusted as a result of more information about the claim being received. The line showing the variation compared with the first-year provision must be considered separately since subsequent adjustments may already have been incorporated into the provisions figures for later years. Maximum caution must be exercised when extrapolating from the figures in the following tables for the purpose of ascertaining the adequacy or inadequacy of provisions.
The Group considers the provisions for claims reported or yet to be reported incurred by 31 December 2014 to be adequate in the light of information currently available. Of course, as they are estimates there is no absolute certainty that the provisions are in fact adequate.
168
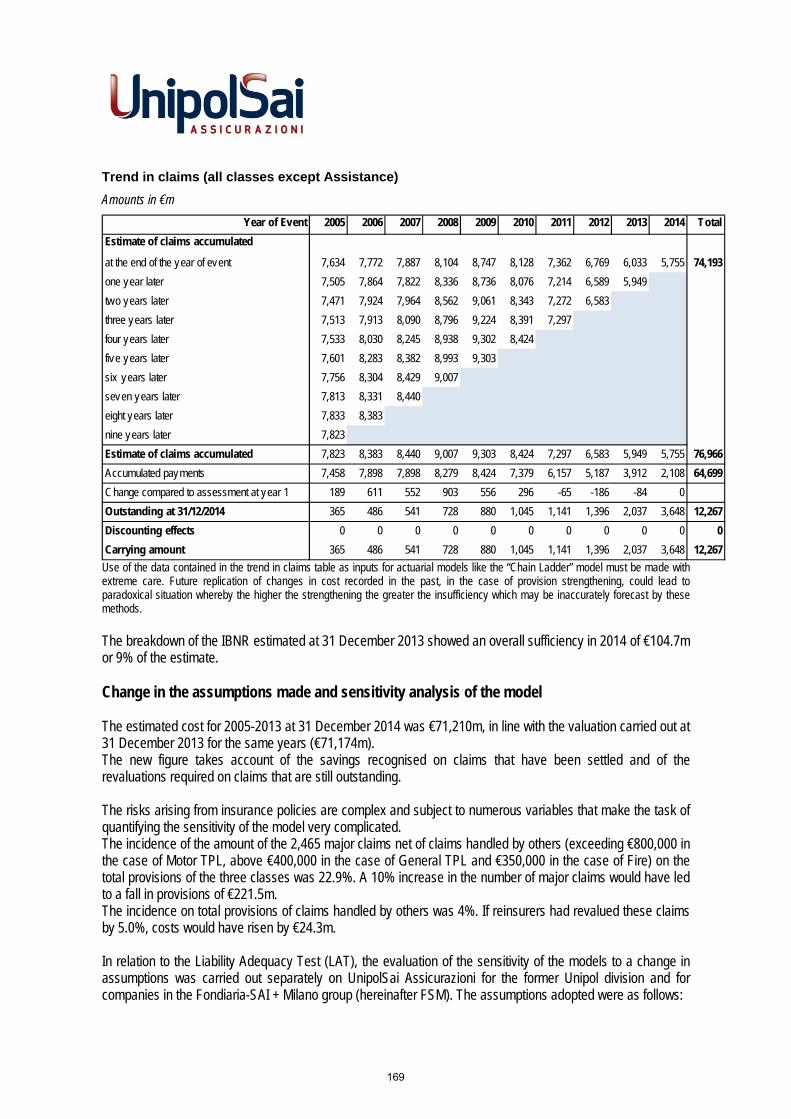
Trend in claims (all classes except Assistance)
Amounts in €m
Year of Event 2005 2006 2007 2008 2009 2010 2011 2012 2013 2014 Total
Estimate of claims accumulated
at the end of the year of event 7,634 7,772 7,887 8,104 8,747 8,128 7,362 6,769 6,033 5,755 74,193
one year later 7,505 7,864 7,822 8,336 8,736 8,076 7,214 6,589 5,949
two years later 7,471 7,924 7,964 8,562 9,061 8,343 7,272 6,583
three years later 7,513 7,913 8,090 8,796 9,224 8,391 7,297
four years later 7,533 8,030 8,245 8,938 9,302 8,424
five years later 7,601 8,283 8,382 8,993 9,303
six years later 7,756 8,304 8,429 9,007
seven years later 7,813 8,331 8,440
eight years later 7,833 8,383
nine years later 7,823
Estimate of claims accumulated 7,823 8,383 8,440 9,007 9,303 8,424 7,297 6,583 5,949 5,755 76,966
Accumulated payments 7,458 7,898 7,898 8,279 8,424 7,379 6,157 5,187 3,912 2,108 64,699
Change compared to assessment at year 1 189 611 552 903 556 296 -65 -186 -84 0
Outstanding at 31/12/2014 365 486 541 728 880 1,045 1,141 1,396 2,037 3,648 12,267
Discounting effects 0 0 0 0 0 0 0 0 0 0 0
Carrying amount 365 486 541 728 880 1,045 1,141 1,396 2,037 3,648 12,267
Use of the data contained in the trend in claims table as inputs for actuarial models like the “Chain Ladder” model must be made with extreme care. Future replication of changes in cost recorded in the past, in the case of provision strengthening, could lead to paradoxical situation whereby the higher the strengthening the greater the insufficiency which may be inaccurately forecast by these methods.
The breakdown of the IBNR estimated at 31 December 2013 showed an overall sufficiency in 2014 of €104.7m or 9% of the estimate.
Change in the assumptions made and sensitivity analysis of the model
The estimated cost for 2005-2013 at 31 December 2014 was €71,210m, in line with the valuation carried out at 31 December 2013 for the same years (€71,174m). The new figure takes account of the savings recognised on claims that have been settled and of the revaluations required on claims that are still outstanding.
The risks arising from insurance policies are complex and subject to numerous variables that make the task of quantifying the sensitivity of the model very complicated. The incidence of the amount of the 2,465 major claims net of claims handled by others (exceeding €800,000 in the case of Motor TPL, above €400,000 in the case of General TPL and €350,000 in the case of Fire) on the total provisions of the three classes was 22.9%. A 10% increase in the number of major claims would have led to a fall in provisions of €221.5m. The incidence on total provisions of claims handled by others was 4%. If reinsurers had revalued these claims by 5.0%, costs would have risen by €24.3m.
In relation to the Liability Adequacy Test (LAT), the evaluation of the sensitivity of the models to a change in assumptions was carried out separately on UnipolSai Assicurazioni for the former Unipol division and for companies in the Fondiaria-SAI + Milano group (hereinafter FSM). The assumptions adopted were as follows:
169

former Unipol: 0.5% increase/decrease in the rate of adjustment of average claim costs (used in theACPC method) of the MV TPL and General TPL classes and a 10% increase/decrease in theadvance assumptions made on claims/premiums ratios (used in the B-F method);
former FSM:a) CHL Paid full: 10% increase/decrease in the tail estimation for MV TPL and General TPL
claimsb) CHL Paid below the €100k threshold
1) 10% increase/decrease in the tail estimation2) 5% increase/decrease in the cost for MV TPL and General TPL claims with
thresholds over €100k (for which the claims handlers’ provision was confirmed).The following table shows the LAT’s numbers. in €m
Pre 2003 2003-2014 Total Delta %Provision requirements 897 12,781 13,678Unfavourable LAT assumption 897 12,565 13,462 -1.58%Favourable LAT assumption 897 12,997 13,894 1.58%
In assessing the results of these variations, note that these analyses are of the deterministic type and no account is taken of any correlations.
5.13 Notes on Life business
Breakdown of the insurance portfolio
Consolidated (direct) Life premiums generated €7,584.4m in 2014 (insurance and investment products). The Life direct premiums of the Group came from both the traditional channel and bancassurance companies (Popolare Vita Group and BIM Vita).
The Life direct premiums of the UnipolSai Group at 31 December 2014 are broken down as follows:
Consolidated Life direct premium income
UnipolSai
AssicurazioniBIM Vita Liguria Vita
DDOR Novi
SadPopolare Vita
The Lawrence
LifeTotal
Amounts in €m
Insurance premiums (IFRS4) 3,653.2 185.7 27.1 5.6 2,981.4 681.9 7,534.8
% var. 8.0% 40.7% 24.9% 6.4% 88.3% -28.3% 24.0%
Investment products (IAS39) 43.2 5.9 0.0 0.0 0.4 0.0 49.6
% var. -20.0% -5.6% 0.0% 0.0% -5.6% -20.0% -18.4%
Total Life business premium income 3,696.5 191.6 27.1 5.6 2,981.9 681.9 7,584.4
% var. 7.5% 38.6% 24.9% 6.4% 88.3% -28.3% 23.6%
Breakdown:
Insurance premiums (IFRS4) 98.8% 96.9% 100.0% 100.0% 100.0% 100.0% 99.3%
Investment products (IAS39) 1.2% 3.1% 0.0% 0.0% 0.0% 0.0% 0.7%
Group Life direct premiums (insurance products and investment products) amounted to €7,584.4m at 31 December 2014, an increase of +23.6% compared with last year on a like-for-like basis. Direct premiums recorded by the company UnipolSai Assicurazioni amounted to €3,696.5m (48.7% of the Total) whilst direct premiums achieved by the Popolare Group amounted to €3,663.7m (48.3% of the Total).
170

Insurance premiums amounted to 99.3% of total premiums, a slight rise compared to the figure of the previous year (98.9%).
Direct insurance premiums: income type
UnipolSai
AssicurazioniBIM Vita Liguria Vita
DDOR Novi
SadPopolare Vita
The Lawrence
LifeTotal
Amounts in €m
Traditional premiums 3,182.8 100.9 27.1 5.6 2,276.7 0.0 5,592.9
Financial premiums 1.2 84.8 0.0 0.0 704.8 681.9 1,472.7
Pension funds 469.2 0.0 0.0 0.0 0.0 0.0 469.2
Insurance premiums (IFRS4) 3,653.2 185.7 27.1 5.6 2,981.4 681.9 7,534.8
of which investments with DPF 2,535.5 100.8 0.0 0.0 2,231.6 0.0 4,867.9
% investment with DPF 69.4% 54.3% 0.0% 0.0% 74.8% 0.0% 64.6%
The insurance premiums of the Group were composed primarily of traditional policies, which account for 74.2% of total consolidated premiums, compared to 19.6% represented by financial premiums and, finally, 6.2% by pension funds.
5.14 Risk Report
The purpose of the Risk Report is to provide additional supporting information to allow stakeholders to make an assessment of the Group’s equity and financial situation in the perspective of a Risk Management that operates in accordance with the general principles contained in ISVAP Regulation no. 20/2008 and in the Solvency II regulation due to enter into force from 1 January 2016 onwards. In this respect, with a view to achieving complete and prompt preparation for the new Solvency II regime, on 15 April 2014 IVASS issued a Letter to the Market: “Solvency II - application of EIOPA guidelines regarding governance systems, forward-looking risk assessment (based on ORSA principles), transmission of information to the national competent authorities and pre-application for internal models”.
Activities by the competent corporate organisations of the Group were carried out in 2014, and are still in progress, to make corporate processes compliant with the Solvency II regulations and with the new IVASS supervisory provisions.
Internal Control and Risk Management System
The Unipol Group and the UnipolSai Group’s Risk Management structure and process are part of the wider internal control and risk management system which operates on several levels: line controls (so-called “first-level controls”), aimed at ensuring transactions are carried out correctly. These
are performed by the same operating structures (e.g. hierarchical, systematic and sample controls), also through the different units which report to the managers of the operating structures, or carried out as part of back office activities; as far as possible, they are incorporated in IT procedure. The operating structures are the primary bodies responsible for the risk management process and must ensure compliance with the adopted procedures for implementing the process and compliance with the established risk tolerance level;
risk and compliance controls (so-called “second-level controls”), which aim to ensure, among other things: the correct implementation of the risk management process; the implementation of activities assigned to them by the risk management process; the observance of the operating limits assigned to the various departments; the compliance of company operations with the regulations.
171
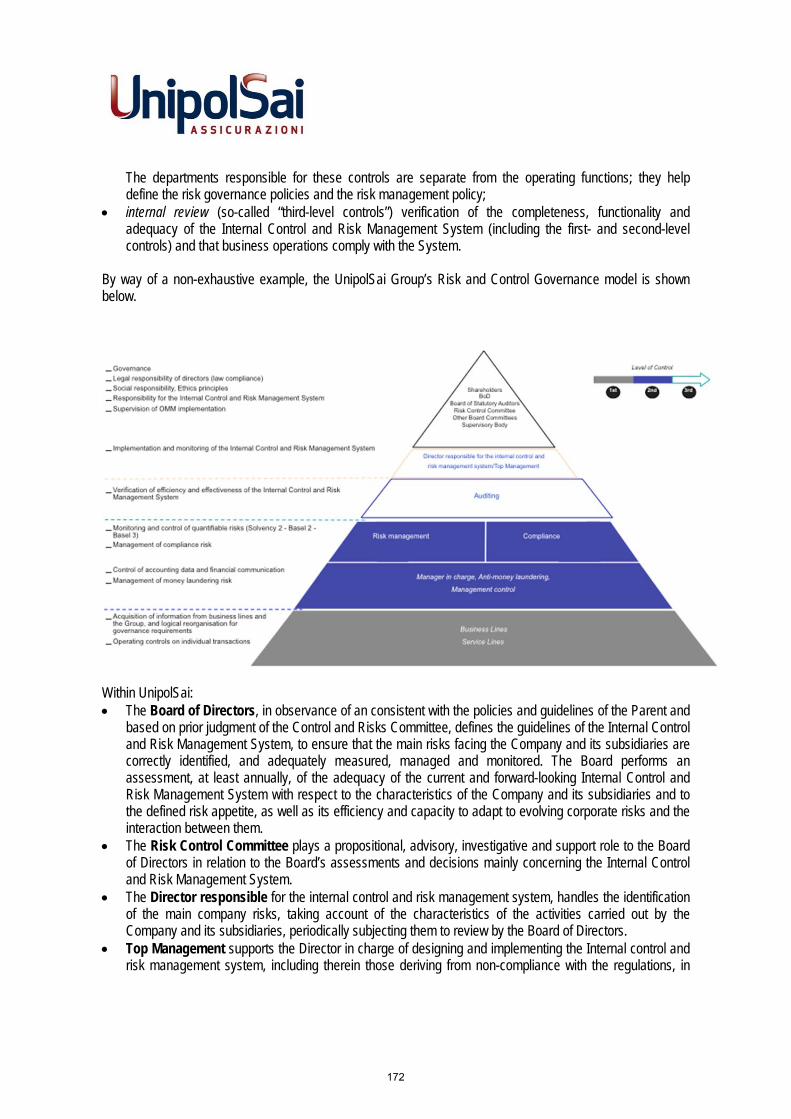
The departments responsible for these controls are separate from the operating functions; they help define the risk governance policies and the risk management policy;
internal review (so-called “third-level controls”) verification of the completeness, functionality andadequacy of the Internal Control and Risk Management System (including the first- and second-levelcontrols) and that business operations comply with the System.
By way of a non-exhaustive example, the UnipolSai Group’s Risk and Control Governance model is shown below.
Within UnipolSai: The Board of Directors, in observance of an consistent with the policies and guidelines of the Parent and
based on prior judgment of the Control and Risks Committee, defines the guidelines of the Internal Controland Risk Management System, to ensure that the main risks facing the Company and its subsidiaries arecorrectly identified, and adequately measured, managed and monitored. The Board performs anassessment, at least annually, of the adequacy of the current and forward-looking Internal Control andRisk Management System with respect to the characteristics of the Company and its subsidiaries and tothe defined risk appetite, as well as its efficiency and capacity to adapt to evolving corporate risks and theinteraction between them.
The Risk Control Committee plays a propositional, advisory, investigative and support role to the Boardof Directors in relation to the Board’s assessments and decisions mainly concerning the Internal Controland Risk Management System.
The Director responsible for the internal control and risk management system, handles the identificationof the main company risks, taking account of the characteristics of the activities carried out by theCompany and its subsidiaries, periodically subjecting them to review by the Board of Directors.
Top Management supports the Director in charge of designing and implementing the Internal control andrisk management system, including therein those deriving from non-compliance with the regulations, in
172

line with the directives and the risk governance policies defined by the Administrative Body and with the guidelines provided by the Parent.
The Governance Control Functions: consistent with the organisational structure of the Group,UnipolSai’s organisational structure requires that the Governance Control Functions (Audit, RiskManagement and Compliance) report directly to the Board of Directors and operate under the coordinationof the Director responsible for the internal control and risk management system.The “Risk Management” and “Compliance and Anti-money laundering” functions report hierarchically tothe “Chief Risk Officer” (who reports to the Board of Directors), whose task is to guarantee that the risksare fully monitored.
The Risk Management Department supports the Board of Directors, the Director responsible for theinternal control and risk management system and Top Management in the evaluation of the structure andeffectiveness of the Risk Management System and reports its conclusions to said bodies, highlighting anydeficiencies and suggesting ways of resolving them. Risk Management carries out this work, ensuring thatthe work carried out by the various company departments dealing with risk management is coordinated, inline with best market practices and in accordance with regulations imposed by the Supervisory Authorities.This does not exempt the individual operating departments from their specific responsibilities formanaging the risks relating to their own work since the departments themselves must have the necessarytools and expertise.In exercising its role, the Risk Management Department is responsible for the design, implementation,maintenance and development of tools necessary for risk measurement.In this respect, Risk Management also contributes to the dissemination of a risk culture extended to theentire Group.
Monitoring Procedures: Company committees
Special company committees have been set up at UnipolSai under the internal control and risk management system so that the various positions and roles have the possibility to communicate and debate with each other.
Risk Management System
In 2014 the directives regarding the Internal Control and Risk Management System were updated to fully adapt to the new supervisory provisions. The most recent update was approved by the UnipolSai Board of Directors in December 2014. With regard to Risk Management Policy (an integral part of the aforementioned directives), note that their contents were incorporated into the following documents: (i) the Risk Management Department regulations, defining responsibilities, duties and operating methods of this function, (ii) the “Current and forward-looking risk assessment policy” and (iii) the “Risk Management Policy”.
The principles and general characteristics of the Risk Management System are included in the Risk Management Policy (approved by the UnipolSai Board of Directors in December 2014). Also an integral part of this System are the management policies for the more important specific risks which, to the extent of respective responsibilities, establish guidelines for their assessment. The risk identification, assessment and monitoring processes are performed on an ongoing basis, to take into account any changes in their nature, business volumes and market context, and any insurgence of new risks or changes in existing risks. These processes are carried out using methods that guarantee an integrated approach at Group level. The Parent ensures that the risk management policy is implemented consistently and continuously within the entire Group, taking into account the risks of each company in the scope of additional supervision and their mutual interdependencies.
173

The risk management process
The risk management process involves the following steps: - risk identification; - current and forward-looking assessment of risk exposure; - risk monitoring and reporting; - risk mitigation. The process is performed in compliance with the Risk Appetite Framework.
Risk identification
Risk identification consists in identifying the risks considered significant, i.e. those with consequences capable of compromising the solvency or reputation of the Group and its companies, or constitute a serious obstacle to achieving strategic objectives. These risks are classified according to a taxonomy that takes into consideration the Group structure and the specific nature of the types of business managed by the various operating companies. The categories of risk identified are as follows: - Technical-Insurance risks (Non-Life and Health); - Technical-Insurance risks (Life); - Market risk - Credit risk; - Liquidity and ALM risk; - Operational risk; - Strategic risk and emerging risks; - Reputational risk; - Other risks.
This identification and its constant updating are the result of meticulous and continuous activity performed through: − continuous monitoring of business operations; − continuous monitoring of the reference regulatory framework; − the exercise of profit and loss attribution that compares profit and loss recorded at year end with those
estimated by the Internal Model, in order to verify whether it correctly represents all risk factors. An assessment is performed at least annually to verify that the risks identified actually represent the risk profile of the Group and its companies.
Current and forward-looking assessment of risk exposure
At least annually and in any event every time circumstances arise that could significantly alter the risk profile, the Group assesses the risks to which the Group and the individual companies are exposed, at present and prospectively, documenting the methods used and the related results. In the Current and Forward-looking Risk Assessment Policy, the process for the current and forward-looking assessment of risks is also defined, including risks deriving from companies included in the scope of additional supervision and taking into account the risk interdependencies. The current and forward-looking assessment also includes stress testing to verify the company’s vulnerability to extreme but plausible events.
174

Current assessment of risks The current assessment of risks identified is performed through methods envisaged in regulations and best practices as regards risks for which measurement is not regulated or defined by high-level principles. Forward-looking assessment of risks The Own Risk Solvency Assessment (ORSA) is used to support strategic business decisions.
Risk monitoring and reporting
In order to ensure prompt and constant monitoring of the evolution of the Risk Profile and compliance at the different levels of company responsibility with the defined Risk Appetite, a reporting system was implemented based on the principles of completeness, promptness and disclosure efficiency. This system guarantees that the quality and quantity of information provided is commensurate with the needs of the various recipients and with the complexity of the business managed, in order for it to be used as a strategic and operating tool in assessing the potential impact of decisions on the company’s risk profile and solvency. In relation to the recipients, reporting is divided into “internal” and “external”. Internal reporting is addressed to the bodies and internal structures of the Group and its companies, with the aim of steering strategic and business decisions and verifying sustainability over time. External reporting is directed to Supervisory Authorities and the market and meets the disclosure and transparency requirements of regulations in force. With regard to internal reporting, in consideration of the recipients of the various requirements and uses, two types of reporting are provided: − Strategic reporting on risk management, containing information important in supporting strategic
decisions; − Operational reporting on risk management with an adequate granularity in supporting business
operations. As part of the strategic reporting, the following are provided to the Board of Directors, the Control and Risk Committee, Top Management and the Group Risk Committee: annually, a proposal for approval of the Risk Appetite (Risk Appetite Statement)1; quarterly, a report with the results of controls performed on observance of the Risk Appetite for the
current year (Risk Appetite Monitoring); quarterly, a report with the results of controls performed on observance of the operational risk limits
defined in the Specific Risk Management Policies; at least annually, the results of stress testing.
Risk escalation and mitigation process
With regard to Risk Appetite monitoring, detection of any of the defined thresholds being exceeded triggers the escalation process described below: - if the Risk Appetite is exceeded, within the Risk Tolerance threshold, the Board of Directors is informed
at the first available board meeting. The Board of Directors assesses whether the approval of a new Risk Appetite level is appropriate or defines action to be taken to restore the Risk Appetite level;
- if the Risk Tolerance or Risk Capacity is exceeded, where defined, based on the seriousness of the situation reported, the Chief Executive Officer assesses the need to call an extraordinary meeting of the Board of Directors. At the extraordinary Board of Directors meeting, or at the next available meeting, the Board of Directors defines the action to be taken.
If the Risk Appetite and/or Risk Tolerance and/or Risk Capacity of individual companies is exceeded, the Parent Board of Directors is informed, indicating any corrective action taken.
1 In reference to the Parent, at consolidated level and at individual company level.
175

In order to mitigate existing or prospective levels of risk not in line with the defined risk objectives, the following measures can be adopted: a) Financial hedges: these measures may take the form of hedging transactions on the market using
financial derivatives. Group Investment Policy defines the principles for the use and management ofhedging instruments.;
b) Reinsurance: transfers part of the underwriting risk outside the Group, providing more possibility forbusiness growth, both by proportionally reducing the amounts at risk (e.g. proportional treaties) andby limiting even further the amounts of major claims (e.g. non-proportional treaties). The“Reinsurance and Other Risk Mitigation Techniques Policy” defines the guidelines on reinsurancecover management.
c) Guarantees held as a hedge against credit risks: the main type of guarantee available onexposures to reinsurers is represented by deposits with the Group for the risks ceded and retrocededthat are generally moved (placed and repaid) annually or half-yearly. Their duration largely depend onthe specific nature of the underlying insurance benefits and on the actual duration of the reinsuranceagreements, which are renegotiated at the end of each year. For exposures to reinsurers the Groupalso makes use of a limited number of guarantees consisting mainly of Letters of credit andSecurities. Collateral deposited by the counterparties for operating in derivatives under CSA-type(Credit Support Annex) agreements is also used as guarantees on credit risks.2. If the Internal Modelfor measuring risks includes mitigation techniques, their compatibility and constant updating in linewith performance must be guaranteed.
d) Management action: corrective action to be applied if certain events occur, such as the restructuringof assets and/or liabilities under management or the disposal of assets and/or liabilities (positionclosures).
e) Operational risk mitigation action: mitigation plans with the aim of preventing or mitigating theeffects should a risk event occur. The implementation of mitigation plans is based on decisions madeon a continual basis during the entire operational risk monitoring stage.
f) Emergency and contingency plans: extraordinary ex-ante measures to be activated if certaincatastrophic or emergency events should occur, such as those envisaged in the Business ContinuityPlan and Disaster Recovery Plan which govern operating procedures for declaring a crisis situationarising from catastrophes and managing the effects.
In 2014 the Group has carried out the necessary activities to activate, on the basis of the new consolidation scope, the pre-application phase with respect to the process for the approval, by IVASS, of the Partial Internal Model (the “Internal Model”) directed, inter alia, to calculation of the minimum solvency capital requirement.
Under the Internal Model each risk is calculated using suitable metrics and appropriate instruments and their subsequent aggregation process. In this respect, the Value at Risk method is used to measure the risk profile of the insurance companies, calculated over a 1-year time period and with a confidence interval of 99.5%.
Below is a summary of how each risk is calculated, whilst the subsequent paragraphs provide additional information on the calculation procedure and the principal results for each risk.
Non-Life underwriting and provisions risk is measured using a partial internal model, consistent with the new standards set out by Solvency II legislation, characterised by internal model components (catastrophe and earthquake risk), using specific Group benchmarks (Premium and Reserving) and Formula Standard components.
2The CSA envisages the consignment of collateral when the value of the contract exceeds a given limit.
176
Life underwriting and provisions risk is measured using a partial internal model based on an ALM-type stochastic approach in line with the new standards laid down in Solvency II, which allow an integrated “fair value” measurement of assets and liabilities. This approach uses the Least Square Monte Carlo method.
Market risk is measured using an internal model that adopts a Monte Carlo VaR approach. As part of the internal market model, Life liabilities are replicated through cash flows with a maturity equivalent to the breakdown of Life provisions and polynomial functions (the Least Square Monte Carlo approach) to represent the Future Discretionary Benefits component. In accordance with IFRS the table in the following paragraph analyses the main sensitivities to market risk factors.
With reference to credit risk, the internal model used to measure risk is the CreditRisk+ framework. This model makes it possible to measure the risk of default relating to insurance or reinsurance counterparties concerning exposures deriving from cash available at banks, financial risk mitigation operations through derivative contracts and technical risk mitigation operations through reinsurance treaties. Furthermore, the model allows the risk of default deriving from exposures to intermediaries and policyholders to be measured.
As regards operational risk, in order to ensure a complete analysis of company risks, the Unipol Group has drafted an Operational Risk Management framework to identify, measure, monitor and manage Operational Risk. Based on this framework, relations and reciprocal impacts between operational and other risks are also considered, with the objective of understanding the direct and indirect effects of events linked to operational risk. At present, the capital requirement measurement method according to the Internal Model for operational risk is being finalised, also taking into account regulatory and best market practice developments. The Internal Model results are compared with those of the Formula Standard and are used for internal analysis and to support the decision-making process. The monitoring of strategic risk and emerging risks began through the project to set up a specific monitor, the “Reputational and Emerging Risks Monitor” to create the management framework, which will be formalised once the target process is completed and consolidated. The monitoring of reputational risk began through the project to set up a specific monitor to create the management framework, which will be formalised once the target process is completed and consolidated.
Financial Risks
The Group’s Investment Policy establishes the criteria forming the basis of the investment policy, the types of activities considered correct to invest in, the breakdown of the portfolio of medium/long-term investments and fixes the limits on the underwriting and monitoring of market risk in such a way as to ascertain total exposure, in line with the “risk appetite” expressed in the Group’s strategic objectives, guaranteeing an adequate portfolio diversification.
Market risk
Market risks refer to the risk of losses as a result of changes in interest rates, share prices, real estate prices, exchange rates and credit spreads. Therefore, the following types are considered: Interest rate risk, or the risk of a possible variation in the value of a financial asset in the portfolio as a
consequence of unfavourable movements in interest rates; Share price risk, or the risk linked to losses due to unfavourable movements in share prices; Real estate risk, or the risk linked to losses due to unfavourable movements in real estate prices;
177

Currency risk, or the risk of possible losses on currency items in the portfolio as a result of an unfavourable trend in exchange rates;
Credit spread risk, or the risk that the value of the portfolio that is sensitive to credit may fall owing to the deterioration of the issuer's credit quality.
The Value at Risk method is used to measure the market risk, calculated over a 1-year time period and with a confidence interval of 99.5%. In addition, sensitivity and stress test measurements are determined for each risk factor.
Interest rate risk for ALM purposes is quantified in terms of duration mismatch. The duration mismatches at 31 December 2014 relating to the UnipolSai Group are shown below. The assets falling under the calculation of the duration mismatch include securities, property funds and investments, cash, receivables and properties; the liabilities include the financial liabilities and technical provisions. The gap is then calculated as the weighted difference for the market value of assets, financial liabilities and best estimates of the technical provisions, by considering the corrective effect of derivatives. For the UnipolSai Group, the duration mismatch for the Life segment stood at -0.82, and 0.49 for the Non-Life segment.
Equity risk is the risk connected with a potential variation in the value of share assets, as a result of market volatility of the reference indexes.
Real estate risk is the risk connected with the occurrence of losses as a result of unfavourable movements in the prices of real estate assets. The assets falling under the calculation of real estate risk include property funds, directly-owned properties and direct and indirect investments in real estate projects. In particular, with reference to directly-owned properties, the value used to calculate the risk (fair value) is that deriving from the estimate made by independent experts.
Currency risk for ALM purposes is defined as the risk of a possible variation in the value of financial statement assets and liabilities and the Net Asset Value as a result of unfavourable changes in exchange rates or in exchange rate volatility. Based on the Group’s Investment Policy, the total exposure to non-Euro currencies, net of currency hedging, must be limited to 3% of total investments. The UnipolSai Group's exposure to currency risk was not significant at 31 December 2014.
Credit spread risk is the risk connected with a variation in the value of bond assets following a change in spreads representing the credit rating of individual issuers.
The level of sensitivity of the UnipolSai Group's portfolios of financial assets to the main market risk factors is shown below. Sensitivity is calculated as a variation in the market value of the assets following a: parallel change in the interest rate curve of +10 bps; -20% change in the share prices; +10 bps change in the credit spread.
178
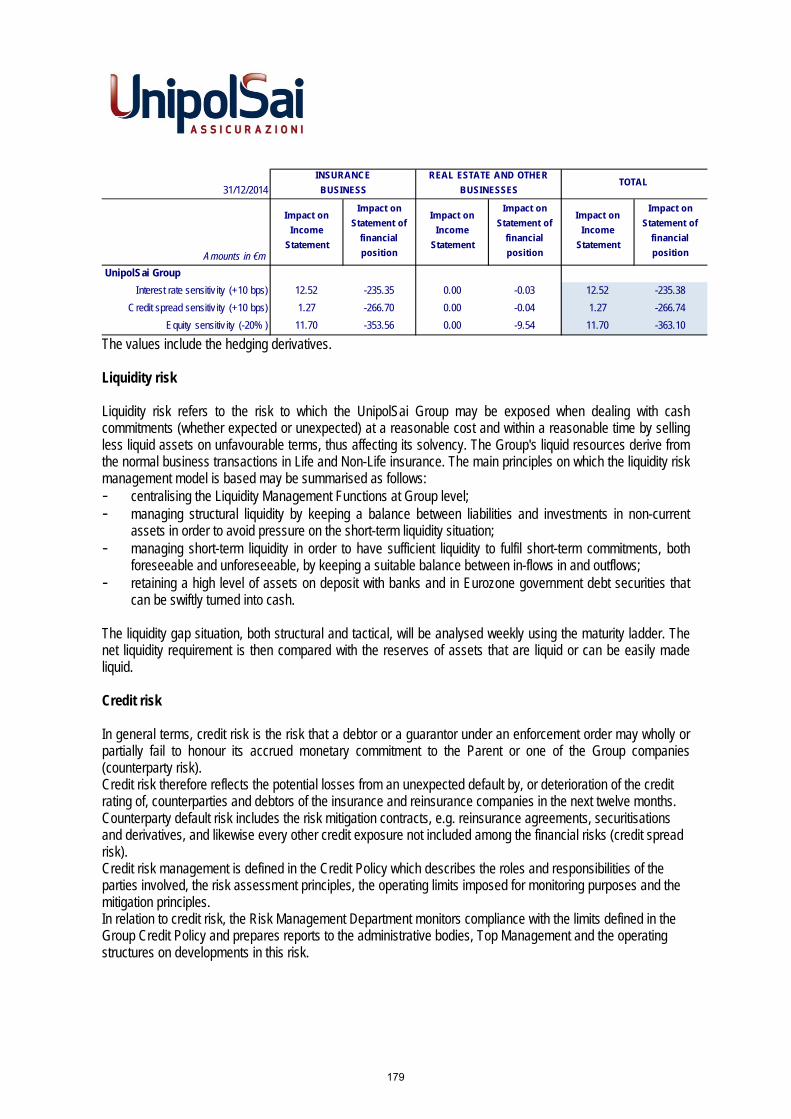
31/12/2014
Amounts in €m
Impact on
Income
Statement
Impact on
Statement of
financial
position
Impact on
Income
Statement
Impact on
Statement of
financial
position
Impact on
Income
Statement
Impact on
Statement of
financial
position
UnipolSai Group
Interest rate sensitiv ity (+10 bps) 12.52 -235.35 0.00 -0.03 12.52 -235.38
Credit spread sensitiv ity (+10 bps) 1.27 -266.70 0.00 -0.04 1.27 -266.74
Equity sensitiv ity (-20% ) 11.70 -353.56 0.00 -9.54 11.70 -363.10
INSURANCE
BUSINESS
REAL ESTATE AND OTHER
BUSINESSESTOTAL
The values include the hedging derivatives.
Liquidity risk
Liquidity risk refers to the risk to which the UnipolSai Group may be exposed when dealing with cash commitments (whether expected or unexpected) at a reasonable cost and within a reasonable time by selling less liquid assets on unfavourable terms, thus affecting its solvency. The Group's liquid resources derive from the normal business transactions in Life and Non-Life insurance. The main principles on which the liquidity risk management model is based may be summarised as follows: - centralising the Liquidity Management Functions at Group level; - managing structural liquidity by keeping a balance between liabilities and investments in non-current
assets in order to avoid pressure on the short-term liquidity situation; - managing short-term liquidity in order to have sufficient liquidity to fulfil short-term commitments, both
foreseeable and unforeseeable, by keeping a suitable balance between in-flows in and outflows; - retaining a high level of assets on deposit with banks and in Eurozone government debt securities that
can be swiftly turned into cash.
The liquidity gap situation, both structural and tactical, will be analysed weekly using the maturity ladder. The net liquidity requirement is then compared with the reserves of assets that are liquid or can be easily made liquid.
Credit risk
In general terms, credit risk is the risk that a debtor or a guarantor under an enforcement order may wholly or partially fail to honour its accrued monetary commitment to the Parent or one of the Group companies (counterparty risk). Credit risk therefore reflects the potential losses from an unexpected default by, or deterioration of the credit rating of, counterparties and debtors of the insurance and reinsurance companies in the next twelve months. Counterparty default risk includes the risk mitigation contracts, e.g. reinsurance agreements, securitisations and derivatives, and likewise every other credit exposure not included among the financial risks (credit spread risk). Credit risk management is defined in the Credit Policy which describes the roles and responsibilities of the parties involved, the risk assessment principles, the operating limits imposed for monitoring purposes and the mitigation principles. In relation to credit risk, the Risk Management Department monitors compliance with the limits defined in the Group Credit Policy and prepares reports to the administrative bodies, Top Management and the operating structures on developments in this risk.
179

Within the UnipolSai Group perimeter the credit risk is mainly in the insurance and outwards reinsurance areas.
Bond classes of the insurance companies in the Group This risk is calculated as a technical insurance risk (see relevant section) and monitored by the Group Credit Risk Committee.
Outwards reinsurance In this area, the existing exposure to credit risk is divided into: liquid receivables already due arising out of the bordereaux sent to the reinsurer listing the balances on
each policy during the period and those still outstanding; potential estimated receivables for the provisions borne by the reinsurer (which will become due at the
time of the payment to the policyholder and for the relative amounts). The exposure for provisions is always deemed to be net of any deposits retained or other collateral guarantees (e.g. Banking LOC, commitment of the Parent, of the reinsurer, etc.).
The following table shows the distribution of UnipolSai Group receivables from reinsurers and provisions for claims borne by them, broken down by rating class, recognised at 31 December 2014 (amounts in €m, net of intragroup reinsurance).
‐
50
100
150
200
250
300
350
AA A BBB BB B not rated
€m
Receivables
Provisions
180

Debt security Issuer Risk The credit risk of debt securities is monitored within market risk based on credit spread volatility, and within credit risk on the basis of the probability of issuer default and associated loss given default. The following table shows the distribution of the UnipolSai Group’s bonds portfolio, Insurance business and Real Estate and Other businesses, broken down by rating class (figures at 31/12/2014).
0.00%
10.00%
20.00%
30.00%
40.00%
50.00%
60.00%
70.00%
80.00%
90.00%
AAA AA A BBB <BBB‐ NA
Breakdown of debt securities by rating class
Information relating to exposure to sovereign debt securities referred to in Consob Communication DEM/11070007 of 5 August 2011
In accordance with Consob Communication DEM/11070007 of 5 August 2011 and ESMA document 2011/397 of 25 November 2011, relating to information to be provided in annual and interim financial reports on listed companies' exposures to Sovereign debt securities and current trends in international markets, details are provided of Sovereign exposures (i.e. bonds issued by central and local governments and by government organisations and loans granted to them) held by the UnipolSai Group at 31 December 2014, broken down by type of portfolio, nominal value, carrying amount and fair value.
181

Amounts in €m Nominal value Carrying amount Market value
Italy 31,969.6 33,967.4 34,278.9
Available-for-sale financial assets 28,255.6 30,410.6 30,410.6
Financial assets at fair value through profit or loss 69.4 57.6 57.6
Held-to-maturity investments 927.2 917.7 1,063.7
Loans and receivables 2,717.4 2,581.4 2,747.0
Spain 940.4 887.4 890.7
Available-for-sale financial assets 834.6 800.7 800.7
Held-to-maturity investments 56.0 56.6 61.8
Loans and receivables 49.8 30.1 28.2
Germany 249.4 262.4 266.1
Available-for-sale financial assets 69.4 80.2 80.2
Held-to-maturity investments 180.0 182.2 185.9
Portugal 120.0 131.2 138.3
Available-for-sale financial assets 67.0 78.1 78.1
Held-to-maturity investments 53.0 53.1 60.2
Ireland 108.5 119.5 119.8
Available-for-sale financial assets 98.5 109.2 109.2
Loans and receivables 10.0 10.3 10.6
France 84.2 85.0 86.6
Available-for-sale financial assets 34.2 35.1 35.1
Held-to-maturity investments 50.0 49.9 51.5
Greece 92.0 76.2 76.2
Available-for-sale financial assets 92.0 76.2 76.2
Canada 66.2 72.1 72.1
Available-for-sale financial assets 66.2 72.1 72.1
Belgium 52.5 54.6 56.4
Available-for-sale financial assets 27.5 29.8 29.8
Held-to-maturity investments 25.0 24.8 26.6
Serbia 8.7 41.6 41.6
Available-for-sale financial assets 1.8 1.7 1.7
Financial assets at fair value through profit or loss 6.8 6.6 6.6
Held-to-maturity investments 0.1 23.7 23.7
Loans and receivables 0.1 9.6 9.6
Balance at 31 December 2014
182
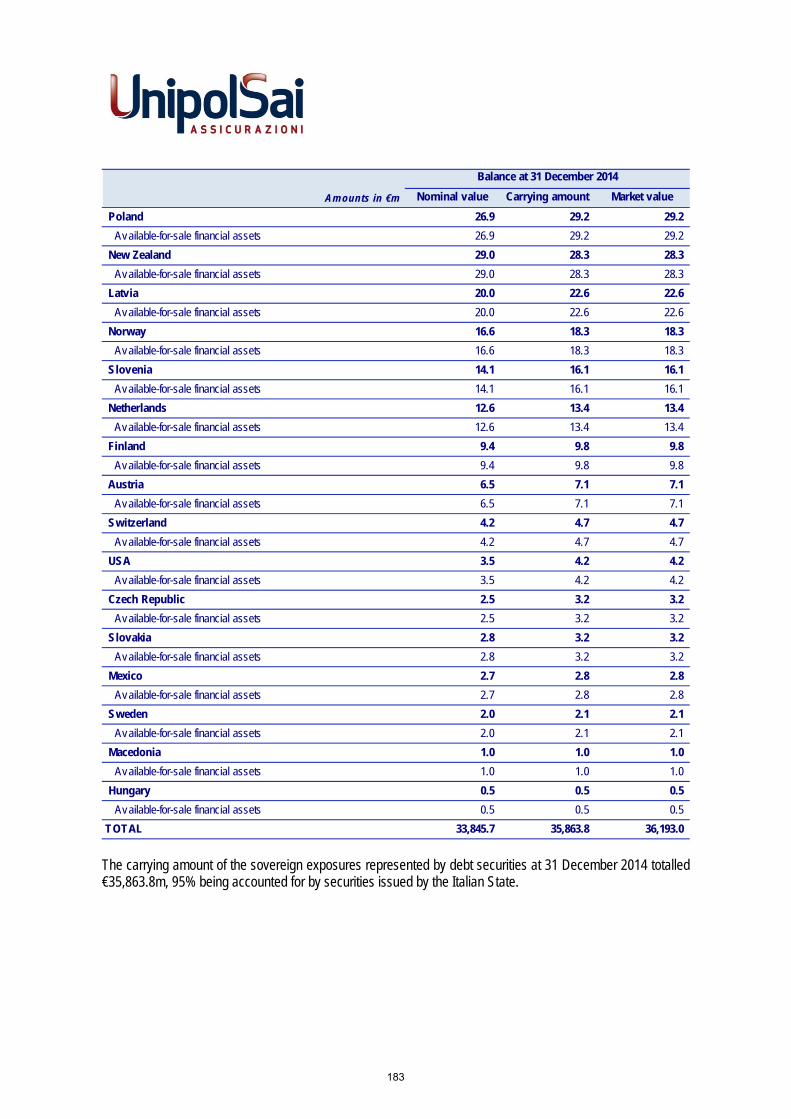
Amounts in €m Nominal value Carrying amount Market value
Poland 26.9 29.2 29.2
Available-for-sale financial assets 26.9 29.2 29.2
New Zealand 29.0 28.3 28.3
Available-for-sale financial assets 29.0 28.3 28.3
Latvia 20.0 22.6 22.6
Available-for-sale financial assets 20.0 22.6 22.6
Norway 16.6 18.3 18.3
Available-for-sale financial assets 16.6 18.3 18.3
Slovenia 14.1 16.1 16.1
Available-for-sale financial assets 14.1 16.1 16.1
Netherlands 12.6 13.4 13.4
Available-for-sale financial assets 12.6 13.4 13.4
Finland 9.4 9.8 9.8
Available-for-sale financial assets 9.4 9.8 9.8
Austria 6.5 7.1 7.1
Available-for-sale financial assets 6.5 7.1 7.1
Switzerland 4.2 4.7 4.7
Available-for-sale financial assets 4.2 4.7 4.7
USA 3.5 4.2 4.2
Available-for-sale financial assets 3.5 4.2 4.2
Czech Republic 2.5 3.2 3.2
Available-for-sale financial assets 2.5 3.2 3.2
Slovakia 2.8 3.2 3.2
Available-for-sale financial assets 2.8 3.2 3.2
Mexico 2.7 2.8 2.8
Available-for-sale financial assets 2.7 2.8 2.8
Sweden 2.0 2.1 2.1
Available-for-sale financial assets 2.0 2.1 2.1
Macedonia 1.0 1.0 1.0
Available-for-sale financial assets 1.0 1.0 1.0
Hungary 0.5 0.5 0.5
Available-for-sale financial assets 0.5 0.5 0.5
TOTAL 33,845.7 35,863.8 36,193.0
Balance at 31 December 2014
The carrying amount of the sovereign exposures represented by debt securities at 31 December 2014 totalled €35,863.8m, 95% being accounted for by securities issued by the Italian State.
183

Technical-insurance risks
Risks relating to Life portfolios
2014 saw the adoption of the “Underwriting Policy of the Life Business” and “Provisions Policy of the Life Business”, approved by the UnipolSai Board of Directors in November 2014.
The Underwriting Policy defines the guidelines addressing underwriting activities and the related risk management, governing the assumption principles and logic of UnipolSai Group insurance companies based in Italy and operating in the Life business.
The Provisions Policy defines the guidelines addressing provisioning activities for direct business and the related risk management, governing the provisioning principles and logic of UnipolSai Group insurance companies based in Italy and operating in the Life business, in compliance with national and international accounting standards and the new Solvency II prudential supervisory system.
Life risks are estimated using a stochastic type internal model which measures all assets and liabilities at fair value by considering the risks and correlation between these. This model is consistent with the new standards set out by Solvency II. In particular, the impacts were assessed in terms of risk capital absorption.
The results of the internal Life model were validated by means of a stress test approach, using quantitative prospective analyses obtained by varying the most significant sources of risk with respect to the basic scenario values.
Technical-insurance risks relating to Life business underwriting are divided into: mortality risk: associated with an unfavourable change in demographic bases resulting from experience
(higher death rate) compared to those used in determining the tariff; longevity risk: associated with an unfavourable change in demographic bases resulting from experience
(lower death rate) compared to those used in determining the tariff; disability/morbidity risk: associated with an unfavourable change in disability/morbidity bases resulting
from experience compared to those used in determining the tariff; surrender risk: associated with adverse changes in the level or volatility of the incidence of surrenders,
withdrawals, early settlements and terminations in premium payments; expense risk: associated with adverse changes in the value of expense linked to policies compared to the
values used to determine the tariff; catastrophe risk: deriving from an unforeseeable event, the consequence of which is to affect multiple
individuals at the same time, generating a number of claims for amounts significantly higher than expected.
The assumption process generates not only technical risks, but also risks of a financial nature such as: market risk: the risk that, as a result of market trends, the value of the underlying assets of technical
provisions is not sufficient to meeting commitments to contracting parties. This is due to the minimum guarantees and services implicit in the products offered (savings or investment) and associated with the contractual terms defined in the technical sheet;
credit risk: the risk that a debtor or guarantor under an enforcement order may wholly or partially fail tohonour its accrued monetary commitment to the Parent or one of the Group companies (counterparty risk);
184

liquidity risk: the risk of not having a sufficient level of liquidity available to satisfy contractual commitmentsto those entitled, and consequently the need to sell part of the less liquid assets held at unfair terms that,as a result, affect the company’s solvency.
The guaranteed minimum rate offered on products marketed has gradually reduced over the last few years. Many tariffs present a method of consolidation of return guarantees at a pre-established maturity instead of an annual consolidation. The average guaranteed minimum rate on the existing portfolio is less than that recognised in the previous year. For UnipolSai, 46.2% of provisions of the separately managed accounts has a guaranteed minimum of between 1% and 2%.
The options included in the tariffs that can affect the assessment of risks present in the portfolio are monitored. The most significant of these are illustrated below.
Surrender Excluding the pure-risk tariffs and returns currently being distributed, the option of surrendering the contract and receiving the surrender value is always granted to the customer. Depending on the contract type, more or less significant penalties can be applied, often based on claim seniority.
Conversion to annuity In individual products where the benefit is express in the form of capital, there is often the option to accept disbursement as an annuity. Among the individual portfolio there are products for which the conversion ratios are determined at the time of issue of the contract and others, the majority of which - generally those issued during this century - with the amount of the annuity determined only at the time of the option. In this case the demographic risk is considerably mitigated. In the supplementary pensions segment, especially collective, the ratios are often associated with each sum paid in, but the risk is mitigated by the frequency at which the offer conditions can be reviewed.
Maturity deferment In individual term life products (not whole-life) there is often the option to extend the validity of the contract after its original maturity date. During maturity deferment the payment of further premiums is not normally allowed. The conditions applied during deferment vary according to the contractual terms, and continuation of the contract’s financial guarantees or the application of those used at the time of the option can be granted. Depending on the conditions, even the duration of the maturity deferment can be determined or extended year by year.
The impact on the portfolio of exercising the maturity deferment option is not particularly significant.
185

Risks relating to Non-Life portfolios
2014 saw the adoption of the “Underwriting Policy - Non-Life Business” and “Provisions Policy - Non-Life Business”, approved by the UnipolSai Board of Directors in November 2014.
The Underwriting Policy defines the guidelines addressing underwriting activities and the related risk management, governing the assumption principles and logic of UnipolSai Group insurance companies based in Italy and operating in the Non-Life business.
The Provisions Policy defines the guidelines addressing provisioning activities and the related risk management, governing the provisioning principles and logic of UnipolSai Group insurance companies based in Italy and operating in the Non-Life business, in compliance with national and international accounting standards and the new Solvency II prudential supervisory system.
During 2014 the Non-Life technical-insurance risks were calculated using the Non-Life Partial Internal Model, consistent with the standards of Solvency II.
With regard to the assessment of Life and Non-Life underwriting and provision risks, in the initial transition phase it was decided to adopt the use of parameters calculated by Undertaking-Specific Parameter methods (USP) for the high-volume business lines, in place of market parameters. These methods allow a more accurate representation of the Group’s risk characteristics, which have specific features in terms of dimension, business type and reference market, that cannot be captured by average estimates performed on the European market.
With reference to Earthquake risk, in 2014 the Group adopted one of the main global models for the analytical evaluation of such risk. This tool is made up of three modules:
Hazard, which assesses the uncertainty associated with the possibility of an earthquake occurring ina given area (frequency) and the uncertainty relating to its magnitude (intensity). The followingchance variables are modelled in this module:
• Location (uncertainty associated with determining the possible point of origin of the event)• Frequency (period of recurrence of the events)• Intensity (the severity of the event in terms of energy released)
• Vulnerability, which assess the seismic vulnerability of different types of insurable assets to a seismicevent of a given intensity. The assessment is based on specific parameters such as the type ofbuilding (residential, commercial, etc.), the construction quality, the number of floors in the buildingand the type of assets present.
• Financial, which identifies the economic loss to the insurance company (in terms of deductibles, thesum insured, reinsurance cover, etc.).
In addition to helping to calculate risk capital, in 2014 this tool also provided support to the Group in the Underwriting and Tariff-setting processes and in defining the reinsurance strategy.
With reference to Catastrophe Risks, the assessments were performed using the standardised scenario approach proposed by EIOPA, in which the following events are taken into consideration: - natural disasters such as earthquake, flood and hail; - man-made disasters such as large-scale fires and acts of terrorism; - “health” risks, such as the risk of a pandemic.
186

The Risk management department continued to collaborate with the Non-Life Technical Area to define tariffs on a risk-adjusted basis which ensures not only the proper coverage of expected costs but the return on the capital absorbed in line with the risk profile and the Group's performance objectives.
Operational risks
The Framework of Operational Risk Management
In order to ensure a complete analysis of company risks, the UnipolSai Group has drafted an Operational Risk Management framework to identify, measure, monitor and manage Operational Risk. This term means “the risk of losses deriving from the inadequacy or malfunctioning of processes, human resources and internal systems, or from external events”. Based on the Operational Risk Management framework, relations and reciprocal impacts between operational and other risks are also considered, with the objective of understanding the direct and indirect effects of events linked to operational risk. In particular, the analysis schemes adopted are aimed at understanding, based on a causal approach, the risk factors, events and effects, both financial and non-financial, and the impacts these can have on the Group’s solvency and on the achievement of the objectives set.
Within the Group governance structure, the monitoring of Operational Risks is entrusted to the Operational Risks function of the Risk Management Department. The objectives assigned to this unit, within the internal control system, are aimed at ensuring the Group’s assets are safeguarded, at adequate risk control and at improving the efficiency and effectiveness of company processes.
Operational risk identification consists in gathering as much information as possible about the risk event, its possible causes and effects with a view to increasing awareness of the specific exposure of the various company areas. In addition, this activity also aims to assess the adequacy of controls and identify the best management solutions for any critical situations. The data collected refers to: - internal events that have actually happened, generating a negative impact on income statement. This data
gathering process is known as Loss Data Collection; - potential internal events that could happen within the context of a process and which are assessed using
the Risk Self-Assessment method based mainly on expert judgement. The data collected in this respect include an estimate of the average and maximum impact on income statement of the risk event and an estimate of the expected frequency of the event on an annual basis.
The organisational model for operational risk governance and control envisages a network of analysts in a number of UnipolSai Assicurazioni SpA Divisions which, after following a specific training course on operational risk management, provide support to the Risk Management Department in identifying operational risk and monitoring this risk within their own areas of operations. Operational risk assessment is performed annually by the main Group Companies.
187

Capital allocation policies Risk Appetite and Risk Appetite Framework The Risk Appetite can be established as a fixed target or as a range of possible values and is broken down into quantitative and qualitative elements. In quantitative terms, the Group’s Risk Appetite is determined on the basis of the following elements: - Capital at risk - Capital adequacy - Liquidity/ALM ratios. Quality objectives are defined in reference to compliance, strategic, reputational, emerging and operational risks. The Risk Appetite is formalised in the Risk Appetite Statement, which indicates the risks that the Group and/or individual company intends to assume or avoid, sets the quantitative limits and the qualitative criteria to be taken into account for the management of unquantified risks. The Risk Appetite forms part of a reference framework - the Risk Appetite Framework (RAF). The RAF is defined in strict compliance and prompt reconciliation with the business model, the strategic plan, the ORSA process, the budget, company organisation and the internal control system. The RAF defines the Risk Appetite and other components ensuring its management, both in normal and stress conditions. These components are: - Risk Capacity; - Risk Tolerance; - Risk Limits (or the operational risk limits); - Risk Profile. The activity to define RAF components is dynamic and progressive, and reflects the risk management objectives associated with the objectives of the Strategic Plan. Verification is performed annually as part of the process of assigning Budget objectives. Further analyses for preventive control of the Risk Appetite, and capital adequacy in particular, are performed when studying extraordinary transactions (mergers, acquisitions, disposals, etc.). The RAF is broken down into several analysis macro areas with the aim of guaranteeing continuous monitoring of risk trends. The main analysis macro areas are: risk type, group, subgroup and individual company. The ORSA process The Group, as already mentioned, has adopted the “Current and Forward-looking Risk Assessment Policy”, approved by the UnipolSai Board of Directors in December 2014. This policy defines the guidelines for the assessment of risks to which the UnipolSai Group and the consolidated insurance companies are exposed, from current and prospective points of view. Under their own risk management systems the companies that fall within the scope use the following to assess current and forward-looking risks: ORSA. The key objective of the tool is to support the company in defining its Risk Appetite, in compliance with the objective of safeguarding assets. This evaluation covers at least the overall solvency requirement and takes account of the specific risk profile, in current and forward-looking terms. For this purpose the Group defines and implements procedures that are commensurate with the nature, scope and complexity of its work and enable it to identify and assess accurately the risks to which the Group or individual company is or could be exposed in the short and long term.
188

At least the following are covered by the ORSA Report: i) the legislative framework; ii) the economic background; iii) the scope of analysis; iv) the roles and responsibilities of the Bodies and Departments involved in the process; v) the procedures for identifying, assessing and mitigating the risk; vi) the links between assessing the risk and the procedure for allocating the capital, and the discrepancies in respect of the risk appetite over the period concerned laid down in the Business Plan; vii) the procedures for obtaining any additional funds; viii) the management actions used to evaluate and describe their impact; ix) the in-house report and the report to the Supervisory Authority.
5.15 Information requested by Consob pursuant to Art. 114, paragraph 5, of Legislative Decree 58/1998
In conformity with the requests Consob put forward with it communication of 19 February 2015 (the “Consob Request”), a description is provided below:
1) of the progress status of initiatives launched following issue of Guidelines by the EuropeanInsurance and Occupational Pensions Authority (“EIOPA”) on 31 October 2013 (the “EIOPAGuidelines”) and their subsequent transposition to regulatory legislation by IVASS, for thepreparatory phase for the introduction of Solvency II, with particular reference to the governancesystem, forward-looking risk assessment, reporting and the pre-application of internal models forcalculation of the new capital requirements;
2) any action taken or planned following application of the stress tests disseminated by the EIOPA on30 November 2014, also taking into account any IVASS requests in line with the EIOPArecommendations issued on 27 November 2014.
Progress of initiatives launched to prepare for the preparatory phase for the introduction of Solvency II
As regards the initiatives launched or planned by the Unipol Group in readiness for Solvency II, note that starting in 2009 the Company has launched a project to adapt to the new Solvency II system (the “Solvency II Project”) and that on 26 July 2010 the Group submitted a request to IVASS for launch of the pre-application phase relating to the approval process for its internal model, considered more suited to representing the Group’s risk profile (the “Internal Model“).
The pre-application phase, interrupted following the launch of the project to acquire and integrate the Premafin/Fondiaria-SAI Group, was subsequently relaunched and discussions are currently in progress with IVASS preliminary to submission of the request for application, which constitutes the process for approval from the insurance Supervisory Authority for use of the Internal Model. As part of the Solvency II Project, the Unipol Group has gradually developed and fine-tuned its Solvency Capital Requirement (SCR) and Own Funds (OF) calculation models, based on the versions as released, where progressively implemented in the applications and calculation processes used for the Internal Model and for the standard formula.
In addition, as part of the activities preparatory to the entry into force of the new Solvency II prudential supervision system, the Unipol Group - based on EIOPA Guidelines requirements and on IVASS’ Letter to the Market published on 15 April 2014 - completed the Forward-Looking Assessment of Own Risks (“FLAOR”), which contains the current and forward-looking risk assessments and capital adequacy of the Unipol Group and every member company of the Group.
For the FLAOR, the assessments were performed using the standard formula and the version of the Internal Model available at that date. These assessments, as required by the regulations, were submitted to IVASS on 31 October 2014 and brought to the attention of the Boards of Directors of Unipol, UnipolSai and the other
189
Companies involved.
Also note that in 2014 the internal model was upgraded to include the regulatory requirements, in particular reference to calculation of the Probability Distribution Forecast.
As regards the governance system, some time ago the Group began planning for the preparation of new company policies and the review of policies existing as required by the new IVASS Measure no. 17/2014, in compliance with EIOPA Guidelines for adaptation to the Solvency II Directive.
The policies were drafted and/or reviewed with the involvement of company structures affected with a view to ensuring a clear definition and shared objectives, roles and responsibilities. These were approved by the Unipol Board of Directors as part of their management and coordination duties, then later by the Boards of Directors of the Company and of the other Companies concerned.
In particular, amongst others, the following policies were approved and/or updated: Directives on the Internal Control and Risk Management Systems3, Current and Forward-looking Risk Assessment Policy, Risk Management Policy, Underwriting Policy - Life Business, Provisions Policy - Life Business, Underwriting Policy - Non-Life Business, Provisions Policy - Non-Life Business, Reinsurance and Other Risk Mitigation Techniques Policy, Operational Risk Management Policy, Outsourcing Policy, Policy on Satisfaction of Requirements to Hold Office, IVASS Reporting Policy, Data Quality Management Policy and Business Continuity Management Policy. It is also expected in the near future that the Boards of Directors of Unipol and of the Companies concerned will approve the update to the Group Investment Policy and the Credit Policy. Lastly, this year the preparation of documents envisaged in IVASS’ Letter to the Market of 15 April 2014 will be completed, concluding the action for implementation of the aforementioned EIOPA Guidelines.
With regard to reporting, note that IVASS has adopted the EIOPA Guidelines on narrative public disclosure and supervisory reporting. Specifically, on 4 December 2014 IVASS published a Letter to the Market on “Solvency II Reporting - Preparatory phase. Instructions on submitting reports to IVASS”.
During the preparatory or ad interim phase preceding the entry into force of the new prudential regime on 1 January 2016, supervisory reporting based on Solvency II metrics will operate alongside - but will not yet replace - that required under the current Solvency I system. The deadlines envisaged for the first submission of narrative reporting are as follows: the first separate annual reporting (at 31 December 2014) must be submitted to IVASS by 3 June 2015, whilst the first separate quarterly reporting (at 30 September 2015) must be submitted to IVASS by 25 November 2015. With regard to groups, the aforementioned deadlines are postponed by 6 weeks (annual reporting by 15 July 2015 and quarterly reporting by 7 January 2016).
This being stated, note that in 2014 activities continued in relation to the “Quantitative Reporting Templates - QRTs - Implementation Project” (the “Project”), which began in 2013 and aim to automatically produce supervisory reports. This Project, which has a considerable impact on the organisation and on the IT systems, involves various company structures. The functional analysis of reports was completed in 2014, as envisaged for the preparatory phase and, based on evidence gathered in the functional analysis phase, the technical analysis began which aims to map the data required for QRT input in the individual company applications. The implementation of process support software solutions identified from 2013 onwards is now at an advanced stage, and verification of the IT processes and procedures for the production of supervisory reports envisaged ad interim for 2015 is nearing completion. Finally, it is reported that the Group started the first preliminary
3 The Directives on the Internal Control and Risk Management Systems include the Audit Department Regulations, Risk Management Department Regulations, Compliance Department Regulations - adding further information and details on the duties and operating methods of these Departments - and the Document on information flows, coordination and cooperation between structures operating under the Internal Control and Risk Management System in compliance with Art. 5, paragraph 2, letter j) of ISVAP Regulation no. 20 of 26 March 2008.
190

activities to meet the requirements set out in EU Regulation no. 1374/2014 of 28 November 2014 of the European Central Bank (ECB), which introduces further statistical reporting obligations for insurance companies.
EIOPA Insurance Stress Test 2014
On 30 April 2014, in collaboration with the European Systemic Risk Board, EIOPA began a stress testing exercise (the “EIOPA Stress Test” or the “Stress Test”) whose purpose is to assess the overall resilience of the European insurance sector and identify its main vulnerabilities. The results of the EIOPA Stress Test were announced on 30 November 2014 with the report “EIOPA Insurance Stress Test 2014” (the “Stress Test Report”). The results allowed the EIOPA and the national Supervisory Authorities to perform an initial assessment of the impact of the new prudential supervisory system for the European insurance sector. For the Stress Test Exercise conducted on a sample of European insurance companies and qualified as the result of a best effort, the EIOPA published a special version of the specific approaches to be used for this exercise, which differ significantly (also in terms of scope of application) from the regulatory system to be implemented on the entry into force of the Solvency II system.
The exercise was aimed first and foremost to assess systemic stability, based on Solvency II metrics, which gave an initial measurement of the overall impact of the new regulations. In addition, the Stress Test Exercise allowed the EIOPA and the national Supervisory Authorities to identify potential areas of risk for further study and to identify possible responses. In fact, on issue of the Stress Test Report, the EIOPA also published a series of recommendations4 (the “EIOPA Recommendations”) targeting the national Supervisory Authorities, with the aim of correcting any problem areas discovered during the Stress Test Exercise, applicable in the phase preparatory to the entry into force of Solvency II.
That being said, it is clarified that following publication of the EIOPA Recommendations the Unipol Group did not launch any particular action and continued its adaptation and preparation for the new prudential supervisory system. No request was made to this regard by IVASS.
Bologna, 19 March 2015
The Board of Directors
4 EIOPA-BoS-14/209 27 November 2014 Recommendations under Article 21(2)(b) of the EIOPA Regulation and Information Request under Article 35 of the EIOPA Regulation, EIOPA Stress Test 2014
191


Tables appended to the Notes to the Financial Statements

Con
solid
atio
n sc
ope
Nam
eR
egis
tere
d of
fice
Ope
ratin
g of
fice
Met
hod
(1)
Ass
ets
(2)
%D
irect
hol
ding
%To
tal p
artic
ipat
ing
inte
rest
(3)
%Vo
tes
avai
labl
e at
O
rdin
ary
Gen
eral
M
eetin
g(4
)
%C
onso
lidat
ion
Cou
ntry
of r
egis
tere
d of
fice
%In
dire
ct h
oldi
ng
Cou
ntry
of
oper
atio
ns(5
)
Uni
polS
ai A
ssicu
razio
ni S
pa08
6Ita
lyBo
logn
aG
110
0.00
%
Pron
to A
ssist
ance
Spa
086
Italy
Turin
G1
100.
00%
100.
00%
100.
00%
Siat
-Soc
ietà
Ital
iana
Ass
icura
zioni
e R
iass
icura
zioni
- pe
r Azio
ni08
6Ita
lyG
enoa
G1
94.6
9%Sa
i Hol
ding
Ital
ia S
pa94
.69%
100.
00%
Bim
Vita
Spa
086
Italy
Turin
G1
50.0
0%50
.00%
100.
00%
Fins
ai In
tern
atio
nal S
a09
2Lu
xem
bour
gLu
xem
bour
gG
1163
.85%
100.
00%
100.
00%
Fins
ai In
tern
atio
nal S
a09
2Lu
xem
bour
gLu
xem
bour
gG
1136
.15%
Uni
polS
ai F
inan
ce S
pA10
0.00
%10
0.00
%
Tenu
te d
el C
erro
Spa
- S
ocie
tà A
grico
la08
6Ita
lyBo
logn
aG
1198
.81%
100.
00%
100.
00%
Tenu
te d
el C
erro
Spa
- S
ocie
tà A
grico
la08
6Ita
lyBo
logn
aG
111.
19%
Pron
to A
ssist
ance
Spa
100.
00%
100.
00%
Sain
tern
atio
nal S
a en
Liq
uida
tion
092
Luxe
mbo
urg
Luxe
mbo
urg
G11
100.
00%
100.
00%
100.
00%
Sai H
oldi
ng It
alia
Spa
086
Italy
Turin
G11
100.
00%
100.
00%
100.
00%
Sailu
x Sa
en
Liqu
idat
ion
092
Luxe
mbo
urg
Luxe
mbo
urg
G11
100.
00%
Uni
polS
ai F
inan
ce S
pA10
0.00
%10
0.00
%
Sim
Eto
ile S
as02
9Fr
ance
Paris
G10
100.
00%
100.
00%
100.
00%
Srp
Serv
ices
Sa07
1Sw
itzer
land
Luga
no (C
H)
G11
100.
00%
Sain
tern
atio
nal S
a en
Liq
uida
tion
100.
00%
100.
00%
Con
sorz
io C
aste
llo08
6Ita
lyFl
oren
ceG
1099
.57%
Nuo
ve In
iziat
ive T
osca
ne -
Socie
tà a
Res
pons
abilit
à Li
mita
ta99
.57%
100.
00%
Dia
logo
Ass
icura
zioni
Spa
086
Italy
Mila
nG
199
.85%
99.8
5%10
0.00
%
Euro
pa T
utel
a G
iudi
ziaria
- C
ompa
gnia
di A
ssicu
razio
ni S
pa08
6Ita
lyM
ilan
G1
100.
00%
100.
00%
100.
00%
Uni
polS
ai N
eder
land
Bv
050
Net
herla
nds
Amst
erda
m (N
L)G
1110
0.00
%10
0.00
%10
0.00
%
Serv
ice G
rupp
o Fo
ndia
ria -
Sai S
rl08
6Ita
lyFl
oren
ceG
1110
0.00
%10
0.00
%10
0.00
%
Nuo
ve In
iziat
ive T
osca
ne -
Socie
tà a
Res
pons
abilit
à Li
mita
ta08
6Ita
lyFl
oren
ceG
1010
0.00
%10
0.00
%10
0.00
%
Syst
ema
Com
pagn
ia d
i Ass
icura
zioni
Spa
086
Italy
Mila
nG
110
0.00
%10
0.00
%10
0.00
%
Uni
polR
e Li
mite
d04
0Ire
land
Dub
lin (I
rela
nd)
G5
100.
00%
Uni
polS
ai N
eder
land
Bv
100.
00%
100.
00%
The
Law
renc
e Li
fe A
ssur
ance
Com
pany
Ltd
040
Irela
ndD
ublin
(Ire
land
)G
210
0.00
%Po
pola
re V
ita S
pa50
.00%
100.
00%
Gru
ppo
Fond
iaria
-Sai
Ser
vizi S
ocie
tà C
onso
rtile
a R
espo
nsab
ilità
Lim
itata
086
Italy
Mila
nG
1198
.37%
99.9
3%10
0.00
%
Gru
ppo
Fond
iaria
-Sai
Ser
vizi S
ocie
tà C
onso
rtile
a R
espo
nsab
ilità
Lim
itata
086
Italy
Mila
nG
110.
90%
Pron
to A
ssist
ance
Spa
99.9
3%10
0.00
%
Gru
ppo
Fond
iaria
-Sai
Ser
vizi S
ocie
tà C
onso
rtile
a R
espo
nsab
ilità
Lim
itata
086
Italy
Mila
nG
110.
11%
Siat
-Soc
ietà
Ital
iana
Ass
icura
zioni
e R
iass
icura
zioni
- pe
r Azio
ni99
.93%
100.
00%
Gru
ppo
Fond
iaria
-Sai
Ser
vizi S
ocie
tà C
onso
rtile
a R
espo
nsab
ilità
Lim
itata
086
Italy
Mila
nG
110.
02%
Bim
Vita
Spa
99.9
3%10
0.00
%
Gru
ppo
Fond
iaria
-Sai
Ser
vizi S
ocie
tà C
onso
rtile
a R
espo
nsab
ilità
Lim
itata
086
Italy
Mila
nG
110.
20%
Dia
logo
Ass
icura
zioni
Spa
99.9
3%10
0.00
%
Gru
ppo
Fond
iaria
-Sai
Ser
vizi S
ocie
tà C
onso
rtile
a R
espo
nsab
ilità
Lim
itata
086
Italy
Mila
nG
110.
02%
Euro
pa T
utel
a G
iudi
ziaria
- C
ompa
gnia
di A
ssicu
razio
ni S
pa99
.93%
100.
00%
Gru
ppo
Fond
iaria
-Sai
Ser
vizi S
ocie
tà C
onso
rtile
a R
espo
nsab
ilità
Lim
itata
086
Italy
Mila
nG
110.
18%
Syst
ema
Com
pagn
ia d
i Ass
icura
zioni
Spa
99.9
3%10
0.00
%
Gru
ppo
Fond
iaria
-Sai
Ser
vizi S
ocie
tà C
onso
rtile
a R
espo
nsab
ilità
Lim
itata
086
Italy
Mila
nG
110.
02%
Uni
polR
e Li
mite
d99
.93%
100.
00%
Gru
ppo
Fond
iaria
-Sai
Ser
vizi S
ocie
tà C
onso
rtile
a R
espo
nsab
ilità
Lim
itata
086
Italy
Mila
nG
110.
02%
Pron
to A
ssist
ance
Ser
vizi S
carl
99.9
3%10
0.00
%
Gru
ppo
Fond
iaria
-Sai
Ser
vizi S
ocie
tà C
onso
rtile
a R
espo
nsab
ilità
Lim
itata
086
Italy
Mila
nG
110.
02%
Sai M
erca
ti M
obilia
ri - S
ocie
tà d
i Inte
rmed
iazio
ne M
obilia
re S
pa99
.93%
100.
00%
Gru
ppo
Fond
iaria
-Sai
Ser
vizi S
ocie
tà C
onso
rtile
a R
espo
nsab
ilità
Lim
itata
086
Italy
Mila
nG
110.
02%
Ligu
ria -
Socie
tà d
i Ass
icura
zioni
- Sp
a99
.93%
100.
00%
Gru
ppo
Fond
iaria
-Sai
Ser
vizi S
ocie
tà C
onso
rtile
a R
espo
nsab
ilità
Lim
itata
086
Italy
Mila
nG
110.
02%
Ligu
ria V
ita S
pa99
.93%
100.
00%
Gru
ppo
Fond
iaria
-Sai
Ser
vizi S
ocie
tà C
onso
rtile
a R
espo
nsab
ilità
Lim
itata
086
Italy
Mila
nG
110.
02%
Inco
ntra
Ass
icura
zioni
Spa
99.9
3%10
0.00
%
Gru
ppo
Fond
iaria
-Sai
Ser
vizi S
ocie
tà C
onso
rtile
a R
espo
nsab
ilità
Lim
itata
086
Italy
Mila
nG
110.
02%
Auto
Pre
sto
& Be
ne S
pa99
.93%
100.
00%
Gru
ppo
Fond
iaria
-Sai
Ser
vizi S
ocie
tà C
onso
rtile
a R
espo
nsab
ilità
Lim
itata
086
Italy
Mila
nG
110.
02%
Uni
polS
ai R
eal E
stat
e Sr
l99
.93%
100.
00%
Villa
Rag
ioni
eri S
rl08
6Ita
lyFl
oren
ceG
1010
0.00
%10
0.00
%10
0.00
%
Mer
idia
no S
econ
do S
rl08
6Ita
lyTu
rinG
1010
0.00
%U
nipo
lSai
Rea
l Est
ate
Srl
100.
00%
100.
00%
Cas
a di
Cur
a Vi
lla D
onat
ello
- Sp
a08
6Ita
lyFl
oren
ceG
1110
0.00
%10
0.00
%10
0.00
%
Cen
tro O
ncol
ogico
Fio
rent
ino
Cas
a di
Cur
a Vi
llano
va S
rl08
6Ita
lySe
sto
Fior
entin
o (F
I)G
1110
0.00
%10
0.00
%10
0.00
%
Apb
Car
Ser
vice
Srl
086
Italy
Turin
G11
70.0
0%Au
to P
rest
o &
Bene
Spa
70.0
0%10
0.00
%
Atav
alue
Srl
in L
iqui
dazio
ne08
6Ita
lyTu
rinG
1110
0.00
%Sa
i Hol
ding
Ital
ia S
pa10
0.00
%10
0.00
%
194

Con
solid
atio
n sc
ope
Nam
eR
egis
tere
d of
fice
Ope
ratin
g of
fice
Met
hod
(1)
Ass
ets
(2)
%D
irect
hol
ding
%To
tal p
artic
ipat
ing
inte
rest
(3)
%Vo
tes
avai
labl
e at
O
rdin
ary
Gen
eral
M
eetin
g(4
)
%C
onso
lidat
ion
Cou
ntry
of r
egis
tere
d of
fice
%In
dire
ct h
oldi
ng
Cou
ntry
of
oper
atio
ns(5
)
Mar
ina
di L
oano
Spa
086
Italy
Mila
nG
1010
0.00
%U
nipo
lSai
Rea
l Est
ate
Srl
100.
00%
100.
00%
Prog
etto
Bico
cca
la P
iazz
a Sr
l in L
iqui
dazio
ne08
6Ita
lyM
ilan
G10
74.0
0%U
nipo
lSai
Rea
l Est
ate
Srl
74.0
0%10
0.00
%
Pron
to A
ssist
ance
Ser
vizi S
carl
086
Italy
Turin
G11
65.4
0%99
.79%
100.
00%
Pron
to A
ssist
ance
Ser
vizi S
carl
086
Italy
Turin
G11
7.70
%Pr
onto
Ass
istan
ce S
pa99
.79%
100.
00%
Pron
to A
ssist
ance
Ser
vizi S
carl
086
Italy
Turin
G11
24.0
0%D
ialo
go A
ssicu
razio
ni S
pa99
.79%
100.
00%
Pron
to A
ssist
ance
Ser
vizi S
carl
086
Italy
Turin
G11
0.35
%Sy
stem
a C
ompa
gnia
di A
ssicu
razio
ni S
pa99
.79%
100.
00%
Pron
to A
ssist
ance
Ser
vizi S
carl
086
Italy
Turin
G11
0.10
%G
rupp
o Fo
ndia
ria-S
ai S
erviz
i Soc
ietà
Con
sorti
le a
Res
pons
abilit
à Li
mita
ta99
.79%
100.
00%
Pron
to A
ssist
ance
Ser
vizi S
carl
086
Italy
Turin
G11
2.20
%Li
guria
- So
cietà
di A
ssicu
razio
ni -
Spa
99.7
9%10
0.00
%
Pron
to A
ssist
ance
Ser
vizi S
carl
086
Italy
Turin
G11
0.15
%In
cont
ra A
ssicu
razio
ni S
pa99
.79%
100.
00%
Uni
polS
ai In
vest
imen
ti Sg
r Spa
086
Italy
Turin
G8
100.
00%
100.
00%
100.
00%
Sai M
erca
ti M
obilia
ri - S
ocie
tà d
i Inte
rmed
iazio
ne M
obilia
re S
pa08
6Ita
lyM
ilan
G11
100.
00%
100.
00%
100.
00%
Soge
int S
ocie
tà a
Res
pons
abilit
à Li
mita
ta08
6Ita
lyM
ilan
G11
100.
00%
100.
00%
100.
00%
Tika
l R.E
. Fun
d08
6Ita
lyG
1095
.00%
95.0
0%10
0.00
%
Flor
ence
Cen
tro d
i Chi
rurg
ia A
mbu
lato
riale
Srl
086
Italy
Flor
ence
G11
100.
00%
Cen
tro O
ncol
ogico
Fio
rent
ino
Cas
a di
Cur
a Vi
llano
va S
rl10
0.00
%10
0.00
%
Ligu
ria -
Socie
tà d
i Ass
icura
zioni
- Sp
a08
6Ita
lyM
ilan
G1
99.9
7%99
.97%
100.
00%
Ligu
ria V
ita S
pa08
6Ita
lyM
ilan
G1
100.
00%
Ligu
ria -
Socie
tà d
i Ass
icura
zioni
- Sp
a99
.97%
100.
00%
Inco
ntra
Ass
icura
zioni
Spa
086
Italy
Mila
nG
151
.00%
51.0
0%10
0.00
%
Popo
lare
Vita
Spa
086
Italy
Vero
naG
124
.39%
50.0
0%10
0.00
%
Popo
lare
Vita
Spa
086
Italy
Vero
naG
125
.61%
Sai H
oldi
ng It
alia
Spa
50.0
0%10
0.00
%
Socie
tà E
diliz
ia Im
mob
iliare
Sar
da -
S.E.
I.S. S
ocie
tà p
er A
zioni
086
Italy
Mila
nG
1051
.67%
Uni
polS
ai R
eal E
stat
e Sr
l51
.67%
100.
00%
Ddo
r Nov
i Sad
289
Serb
iaN
ovi S
ad (S
erbi
a)G
399
.99%
99.9
9%10
0.00
%
Auto
Pre
sto
& Be
ne S
pa08
6Ita
lyTu
rinG
1110
0.00
%10
0.00
%10
0.00
%
Sain
t Geo
rge
Cap
ital M
anag
emen
t Sa
in L
iqui
dazio
ne07
1Sw
itzer
land
Luga
no (C
H)
G11
100.
00%
Uni
polS
ai F
inan
ce S
pA10
0.00
%10
0.00
%
Uni
polS
ai R
eal E
stat
e Sr
l08
6Ita
lyBo
logn
aG
1010
0.00
%10
0.00
%10
0.00
%
Atah
otel
s - C
ompa
gnia
Ital
iana
Azie
nde
Turis
tiche
Alb
ergh
iere
Spa
086
Italy
Mila
nG
1110
0.00
%10
0.00
%10
0.00
%
Athe
ns R
.E. F
und
086
Italy
G10
100.
00%
100.
00%
100.
00%
Don
atel
lo D
ay S
urge
ry S
rl in
Liq
uida
zione
086
Italy
Flor
ence
G11
100.
00%
Cen
tro O
ncol
ogico
Fio
rent
ino
Cas
a di
Cur
a Vi
llano
va S
rl10
0.00
%10
0.00
%
Citt
à de
lla S
alut
e Sc
rl08
6Ita
lyFl
oren
ceG
1150
.00%
Cas
a di
Cur
a Vi
lla D
onat
ello
- Sp
a10
0.00
%10
0.00
%
Citt
à de
lla S
alut
e Sc
rl08
6Ita
lyFl
oren
ceG
1147
.50%
Cen
tro O
ncol
ogico
Fio
rent
ino
Cas
a di
Cur
a Vi
llano
va S
rl10
0.00
%10
0.00
%
Citt
à de
lla S
alut
e Sc
rl08
6Ita
lyFl
oren
ceG
112.
50%
Flor
ence
Cen
tro d
i Chi
rurg
ia A
mbu
lato
riale
Srl
100.
00%
100.
00%
Ddo
r Re
289
Serb
iaN
ovi S
ad (S
erbi
a)G
610
0.00
%U
nipo
lRe
Lim
ited
100.
00%
100.
00%
Ddo
r Re
289
Serb
iaN
ovi S
ad (S
erbi
a)G
60.
00%
Ddo
r Nov
i Sad
100.
00%
100.
00%
Italre
siden
ce S
rl08
6Ita
lyPi
eve
Eman
uele
(MI)
G11
100.
00%
Atah
otel
s - C
ompa
gnia
Ital
iana
Azie
nde
Turis
tiche
Alb
ergh
iere
Spa
100.
00%
100.
00%
Uni
polS
ai S
erviz
i Tec
nolo
gici
Spa
086
Italy
Bolo
gna
G11
100.
00%
100.
00%
100.
00%
Uni
polS
ai F
inan
ce S
pA08
6Ita
lyBo
logn
aG
910
0.00
%10
0.00
%10
0.00
%
Mid
i Srl
086
Italy
Bolo
gna
G10
100.
00%
100.
00%
100.
00%
Punt
a di
Fer
ro s
rl08
6Ita
lyBo
logn
aG
1010
0.00
%10
0.00
%10
0.00
%
(1) C
onso
lidat
ion
met
hod:
G=o
n a
line-
by-li
ne b
asis;
P=p
ropo
rtion
al=P
; U=o
n a
line-
by-li
ne b
asis
as p
er u
nita
ry m
anag
emen
t
(2) 1
=Ita
lian
insu
rers
; 2=E
U in
sure
rs; 3
=non
-EU
insu
rers
; 4=i
nsur
ance
hol
ding
s; 4
.1=m
ixed
finan
cial h
oldi
ng c
ompa
nies
; 5=E
U re
insu
rers
; 6=n
on-E
U re
insu
rers
; 7=b
anks
; 8=a
sset
man
agem
ent c
ompa
nies
; 9=o
ther
hol
ding
s; 1
0=re
al e
stat
e co
mpa
nies
; 11=
othe
r
(3) t
he p
rodu
ct o
f inv
estm
ent r
elat
ions
con
cern
ing
all c
ompa
nies
whi
ch, p
ositio
ned
in a
n in
vest
men
t cha
in, m
ay b
e be
twee
n th
e co
mpa
ny re
spon
sible
for t
he c
onso
lidat
ed fi
nanc
ial s
tate
men
ts a
nd th
e co
mpa
ny in
que
stio
n. If
the
latte
r is
a di
rect
inve
stee
of m
ultip
le s
ubsid
iarie
s, a
dd to
geth
er th
e in
divid
ual p
rodu
cts
first
(4) t
otal
% a
vaila
bility
of v
otes
at o
rdin
ary
gene
ral m
eetin
gs if
diff
eren
t fro
m th
e di
rect
or i
ndire
ct in
vest
men
t
(5) t
his
disc
losu
re is
requ
ired
only
if th
e co
untry
of o
pera
tions
is d
iffer
ent f
rom
the
coun
try o
f the
regi
ster
ed o
ffice
195

Con
solid
atio
n sc
ope:
inte
rest
s in
ent
ities
with
mat
eria
l non
-con
trol
ling
inte
rest
s
Nam
e%
non
-con
trol
ling
inte
rest
s
%
Vote
s av
aila
ble
at
Ord
inar
y G
ener
al M
eetin
gs to
no
n-co
ntro
lling
in
tere
sts
Con
solid
ated
pro
fit
(loss
) attr
ibut
able
to
non-
cont
rolli
ng
inte
rest
s
Shar
ehol
ders
' Eq
uity
at
trib
utab
le to
no
n-co
ntro
lling
in
tere
sts
Tota
l ass
ets
Inve
stm
ents
Tech
nica
l pr
ovis
ions
Fina
ncia
l lia
bilit
ies
Shar
ehol
ders
' eq
uity
Prof
it (lo
ss) f
or
the
year
Div
iden
ds
dist
ribut
ed to
no
n-co
ntro
lling
in
tere
sts
Gro
ss
prem
ium
s w
ritte
n
Popo
lare
Vita
Spa
50.0
0%50
.00%
42.9
274.
88,
395.
28,
248.
97,
744.
941
.354
9.5
85.8
51.2
2,98
1.5
The
Law
renc
e Li
fe A
ssur
ance
Com
pany
Ltd
50.0
0%0.
00%
0.0
0.0
3,26
4.3
3,16
8.5
3,15
2.5
2.2
83.7
11.8
0.0
681.
9
Sum
mar
y in
com
e an
d fin
anci
al p
ositi
on d
ata
196

Det
ails
of u
ncon
solid
ated
inve
stm
ents
Nam
eR
egis
tere
d of
fice
Ope
ratin
g of
fice
Ass
ets
(1)
Type (2)
%D
irect
hol
ding
%To
tal p
artic
ipat
ing
inte
rest
(3)
%
Vote
s av
aila
ble
at
Ord
inar
y G
ener
al
Mee
ting
(4)
Car
ryin
g am
ount
(€m
)
Cou
ntry
of r
egis
tere
d of
fice
%In
dire
ct h
oldi
ng
Cou
ntry
of
oper
atio
ns(5
)
Uni
pol B
anca
Spa
086
Italy
Bolo
gna
7b
42.2
5%42
.25%
438.
1
Hot
el V
illagg
io C
ittà
del M
are
Spa
in L
iqui
dazi
one
086
Italy
Terra
sini
(PA)
11
b49
.00%
49.0
0%
Eure
sa H
oldi
ng S
A en
Liq
uida
tion
092
Luxe
mbo
urg
Luxe
mbo
urg
4b
25.0
0%25
.00%
0.1
Assi
coop
Mod
ena
& Fe
rrara
Spa
086
Italy
Mod
ena
11b
43.7
5%U
nipo
lSai
Fin
ance
SpA
43.7
5%5.
9
Assi
coop
Bol
ogna
Spa
086
Italy
Bolo
gna
11b
40.2
1%U
nipo
lSai
Fin
ance
SpA
40.2
1%3.
2
Assi
coop
Sie
na S
pa08
6Ita
lySi
ena
11b
49.0
0%U
nipo
lSai
Fin
ance
SpA
49.0
0%0.
4
ZIS
Fier
a 2
086
Italy
Bolo
gna
11b
31.7
2%M
idi S
rl31
.72%
0.3
Fond
azio
ne U
nipo
lis08
6Ita
lyBo
logn
a11
a10
0.00
%10
0.00
%0.
3
Uci
- U
ffici
o C
entra
le It
alia
no08
6Ita
lyM
ilan
11b
37.8
7%38
.25%
0.3
Uci
- U
ffici
o C
entra
le It
alia
no08
6Ita
lyM
ilan
11b
0.00
%D
ialo
go A
ssic
uraz
ioni
Spa
38.2
5%0.
3
Uci
- U
ffici
o C
entra
le It
alia
no08
6Ita
lyM
ilan
11b
0.00
%In
cont
ra A
ssic
uraz
ioni
Spa
38.2
5%0.
3
Uci
- U
ffici
o C
entra
le It
alia
no08
6Ita
lyM
ilan
11b
0.30
%Li
guria
- So
ciet
à di
Ass
icur
azio
ni -
Spa
38.2
5%0.
3
Uci
- U
ffici
o C
entra
le It
alia
no08
6Ita
lyM
ilan
11b
0.09
%Si
at-S
ocie
tà It
alia
na A
ssic
uraz
ioni
e R
iass
icur
azio
ni -
per A
zion
i38
.25%
0.3
Uci
- U
ffici
o C
entra
le It
alia
no08
6Ita
lyM
ilan
11b
0.00
%Sy
stem
a C
ompa
gnia
di A
ssic
uraz
ioni
Spa
38.2
5%0.
3
Assi
coop
Imol
a Sp
a08
6Ita
lyIm
ola
(BO
)11
b47
.33%
Uni
polS
ai F
inan
ce S
pA47
.33%
2.7
Sofig
ea S
ocie
tà F
inan
ziar
ia p
er G
estio
ni A
ssic
urat
ive
Srl i
n Li
quid
azio
ne08
6Ita
lyR
ome
11b
35.3
2%35
.32%
0.0
Assi
coop
Fire
nze
- Spa
086
Italy
Flor
ence
11b
44.0
0%U
nipo
lSai
Fin
ance
SpA
44.0
0%0.
7Pe
gaso
Fin
anzi
aria
Spa
086
Italy
Bolo
gna
9b
45.0
0%U
nipo
lSai
Fin
ance
SpA
45.0
0%5.
2As
sico
op G
ross
eto
Soci
età
per A
zion
i08
6Ita
lyG
ross
eto
11b
50.0
0%U
nipo
lSai
Fin
ance
SpA
50.0
0%0.
8As
sico
op E
milia
Nor
d Sr
l08
6Ita
lyPa
rma
11b
50.0
0%U
nipo
lSai
Fin
ance
SpA
50.0
0%6.
0As
sico
op R
omag
na F
utur
a Sr
l08
6Ita
lyR
aven
na
11b
50.0
0%U
nipo
lSai
Fin
ance
SpA
50.0
0%5.
6G
arib
aldi
Sca
092
Luxe
mbo
urg
Luxe
mbo
urg
11b
32.0
0%32
.00%
75.3
Isol
a Sc
a09
2Lu
xem
bour
gLu
xem
bour
g11
b29
.56%
29.5
6%20
.0Fi
n.Pr
iv. S
rl08
6Ita
lyM
ilan
11b
28.5
7%28
.57%
28.2
Con
sule
nza
Azie
ndal
e pe
r l'In
form
atic
a Sc
ai S
ocie
tà p
er A
zion
i08
6Ita
lyTu
rin11
b30
.07%
30.0
7%1.
5D
dor A
uto
- Lim
ited
Liab
ility
Com
pany
289
Serb
iaN
ovi S
ad (S
erbi
a)3
a10
0.00
%D
dor N
ovi S
ad99
.99%
0.0
Soai
mpi
anti
- Org
anis
mi d
i Atte
staz
ione
Srl
in L
iqui
dazi
one
086
Italy
Mon
za11
b21
.64%
21.6
4%Fu
nivi
e de
l Pic
colo
San
Ber
nard
o Sp
a08
6Ita
lyLa
Thu
ile (A
O)
11b
23.5
5%U
nipo
lSai
Rea
l Est
ate
Srl
23.5
5%2.
3D
dor G
aran
t28
9Se
rbia
Belg
rade
(Ser
bia)
11b
32.4
6%D
dor N
ovi S
ad40
.00%
0.5
Ddo
r Gar
ant
289
Serb
iaBe
lgra
de (S
erbi
a)11
b7.
54%
Ddo
r Re
40.0
0%0.
5H
otel
Ter
me
di S
aint
Vin
cent
- Sr
l08
6Ita
lyLa
Thu
ile (A
O)
11a
100.
00%
Atah
otel
s - C
ompa
gnia
Ital
iana
Azi
ende
Tur
istic
he A
lber
ghie
re S
pa10
0.00
%0.
1Ita
l H&R
Srl
086
Italy
Piev
e Em
anue
le (M
I)11
a10
0.00
%Ita
lresi
denc
e Sr
l10
0.00
%0.
0To
ur E
xecu
tive
Srl i
n Li
quid
azio
ne08
6Ita
lyM
ilan
11a
100.
00%
Atah
otel
s - C
ompa
gnia
Ital
iana
Azi
ende
Tur
istic
he A
lber
ghie
re S
pa10
0.00
%A7
Srl
in L
iqui
dazi
one
086
Italy
Mila
n10
b20
.00%
Uni
polS
ai R
eal E
stat
e Sr
l20
.00%
0.1
Bors
etto
Srl
086
Italy
Turin
10b
44.9
3%U
nipo
lSai
Rea
l Est
ate
Srl
44.9
3%1.
6Bu
tterfl
y Am
Sàr
l09
2Lu
xem
bour
g L
uxem
bour
g11
b28
.57%
Uni
polS
ai R
eal E
stat
e Sr
l28
.57%
5.7
Serv
izi I
mm
obilia
ri M
artin
elli
Spa
086
Italy
Cin
isel
lo B
alsa
mo
(MI)
10b
20.0
0%U
nipo
lSai
Rea
l Est
ate
Srl
20.0
0%0.
2Sv
ilupp
o C
entro
Est
Srl
in L
iqui
dazi
one
086
Italy
Rom
e10
b40
.00%
Uni
polS
ai R
eal E
stat
e Sr
l40
.00%
Met
ropo
lis S
pa -
in L
iqui
dazi
one
086
Italy
Mila
n10
b29
.71%
Uni
polS
ai R
eal E
stat
e Sr
l29
.71%
Pent
a D
omus
Spa
086
Italy
Turin
10b
24.6
6%U
nipo
lSai
Rea
l Est
ate
Srl
24.6
6%2.
9V
alor
e Im
mob
iliare
Srl
in L
iqui
dazi
one
086
Italy
Trie
ste
10b
50.0
0%50
.00%
0.5
CO
NO
RO
MA
- Soc
ietà
a R
espo
nsab
ilità
Lim
itata
in L
iqui
dazi
one
086
Italy
Rom
e11
b50
.00%
Uni
polS
ai F
inan
ce S
pA50
.00%
(1) 1
=Ita
lian
insu
rers
; 2=E
U in
sure
rs; 3
=non
-EU
insu
rers
; 4=i
nsur
ance
hol
ding
s; 4
.1=m
ixed
fina
ncia
l hol
ding
com
pani
es; 5
=EU
rein
sure
rs; 6
=non
-EU
rein
sure
rs; 7
=ban
ks; 8
=ass
et m
anag
emen
t com
pani
es; 9
=oth
er h
oldi
ngs;
10=
real
est
ate
com
pani
es; 1
1=ot
her
(2) a
=sub
sidi
arie
s (IF
RS1
0); b
= as
soci
ates
(IAS
28);
c=jo
int v
entu
res
(IFR
S11)
. Ple
ase
mar
k w
ith a
n as
teris
k (*
) any
com
pani
es c
lass
ified
as
held
for s
ale
purs
uant
to IF
RS
5 an
d ad
d th
e ke
y be
low
the
stat
emen
t(3
) the
pro
duct
of i
nves
tmen
t rel
atio
ns c
once
rnin
g al
l com
pani
es w
hich
, pos
ition
ed in
an
inve
stm
ent c
hain
, may
be
betw
een
the
com
pany
resp
onsi
ble
for t
he c
onso
lidat
ed fi
nanc
ial s
tate
men
ts a
nd th
e co
mpa
ny in
que
stio
n. If
the
latte
r is
a di
rect
inve
stee
of m
ultip
le s
ubsi
diar
ies,
add
toge
ther
the
indi
vidu
al p
rodu
cts
first
.(4
) tot
al %
ava
ilabi
lity
of v
otes
at o
rdin
ary
gene
ral m
eetin
gs if
diff
eren
t fro
m th
e di
rect
or i
ndire
ct in
vest
men
t(5
) thi
s di
sclo
sure
is re
quire
d on
ly if
the
coun
try o
f ope
ratio
ns is
diff
eren
t fro
m th
e co
untry
of t
he re
gist
ered
offi
ce
197

Stat
emen
t of f
inan
cial
pos
ition
by
busi
ness
seg
men
tVa
lori
in M
ilioni
di E
uro
Amou
nts
in €
m31
/12/
2014
31/1
2/20
1331
/12/
2014
31/1
2/20
1331
/12/
2014
31/1
2/20
1331
/12/
2014
31/1
2/20
1331
/12/
2014
31/1
2/20
1331
/12/
2014
31/1
2/20
13
1IN
TAN
GIB
LE A
SSET
S 47
8.9
274.
431
4.6
218.
510
.730
.50.
60.
580
4.8
523.
9
2PR
OPE
RTY
, PLA
NT
AN
D E
QU
IPM
ENT
649.
412
0.8
6.0
9.9
162.
817
4.6
378.
221
6.9
1,19
6.4
522.
3
3TE
CH
NIC
AL
PRO
VISI
ON
S - R
EIN
SUR
ERS'
SH
AR
E85
6.3
674.
810
3.9
66.9
960.
274
1.7
4IN
VEST
MEN
TS17
,099
.69,
833.
542
,662
.222
,419
.328
2.0
1,19
8.6
1,38
2.6
1,16
5.3
-304
.5-3
13.0
61,1
22.0
34,3
03.6
4.1
Inve
stm
ent p
rope
rty1,
492.
71,
471.
110
.411
.245
.045
.21,
276.
11,
057.
02,
824.
22,
584.
5
4.2
Inve
stm
ents
in s
ubsi
diar
ies,
ass
ocia
tes
and
inte
rest
s in
join
t ven
ture
s35
3.9
31.9
241.
391
.80.
220
.313
.115
.460
8.4
159.
4
4.3
Hel
d-to
-mat
urity
inve
stm
ents
639.
578
0.5
628.
7-2
.21,
420.
062
6.5
4.4
Loan
s an
d re
ceiv
able
s2,
073.
579
0.2
3,12
8.3
1,24
5.5
236.
199
1.1
36.1
30.1
-304
.5-3
10.4
5,16
9.5
2,74
6.5
4.5
Avai
labl
e-fo
r-sal
e fin
anci
al a
sset
s12
,409
.47,
498.
529
,646
.214
,964
.00.
813
1.1
57.4
62.8
-0.2
42,1
13.7
22,6
56.2
4.6
Fina
ncia
l ass
ets
at fa
ir va
lue
thro
ugh
prof
it or
loss
130.
641
.88,
855.
55,
478.
110
.90.
0-0
.28,
986.
25,
530.
5
5SU
ND
RY
REC
EIVA
BLE
S2,
744.
01,
836.
268
1.6
270.
874
.730
3.6
36.6
66.5
-141
.9-5
76.2
3,39
5.1
1,90
0.9
6O
THER
ASS
ETS
698.
61,
085.
918
9.9
759.
937
.467
.124
.524
.6-1
36.5
-94.
281
3.9
1,84
3.3
6.1
Def
erre
d ac
quis
ition
cos
ts27
.227
.248
.336
.175
.563
.3
6.2
Oth
er a
sset
s67
1.4
1,05
8.7
141.
672
3.8
37.4
67.1
24.5
24.6
-136
.5-9
4.2
738.
41,
780.
0
7C
ASH
AN
D C
ASH
EQ
UIV
ALE
NTS
180.
827
4.5
319.
258
6.6
73.0
188.
311
1.1
67.4
-518
.368
4.0
598.
5
TOTA
L A
SSET
S22
,707
.714
,100
.144
,277
.424
,331
.964
0.6
1,96
2.8
1,93
3.7
1,54
1.3
-582
.9-1
,501
.868
,976
.540
,434
.2
1SH
AR
EHO
LDER
S' E
QU
ITY
1,99
1.6
-252
.82,
524.
21,
478.
142
8.8
571.
81,
690.
31,
269.
10.
06,
634.
93,
066.
2
2PR
OVI
SIO
NS
556.
223
9.5
24.0
37.2
17.3
23.0
22.4
20.2
619.
931
9.9
3TE
CH
NIC
AL
PRO
VISI
ON
S 16
,866
.111
,602
.639
,362
.421
,197
.556
,228
.532
,800
.0
4FI
NA
NC
IAL
LIA
BIL
ITIE
S1,
819.
31,
044.
61,
956.
291
4.8
93.5
914.
516
4.0
172.
4-2
20.3
-820
.13,
812.
72,
226.
3
4.1
Fina
ncia
l lia
bilit
ies
at fa
ir va
lue
thro
ugh
prof
it or
loss
184.
230
.01,
177.
951
9.7
0.3
3.3
4.0
1,36
5.4
554.
1
4.2
Oth
er fi
nanc
ial l
iabi
litie
s1,
635.
11,
014.
677
8.3
395.
193
.591
4.2
160.
716
8.4
-220
.3-8
20.1
2,44
7.3
1,67
2.2
5PA
YAB
LES
752.
962
9.5
153.
914
7.5
78.9
414.
255
.447
.9-2
22.2
-583
.781
8.9
655.
4
6O
THER
LIA
BIL
ITIE
S72
1.5
836.
625
6.7
557.
022
.139
.21.
731
.7-1
40.4
-98.
086
1.6
1,36
6.4
TOTA
L SH
AR
EHO
LDER
S' E
QU
ITY
AN
D L
IAB
ILIT
IES
22,7
07.7
14,1
00.1
44,2
77.4
24,3
31.9
640.
61,
962.
81,
933.
71,
541.
3-5
82.9
-1,5
01.8
68,9
76.5
40,4
34.2
Tota
lIn
ters
egm
ent e
limin
atio
nsN
on-L
ife b
usin
ess
Life
bus
ines
sO
ther
Bus
ines
ses
Rea
l Est
ate
198

Inco
me
stat
emen
t by
busi
ness
seg
men
tVa
lori
in M
ilioni
di E
uro
Amou
nts
in €
m31
/12/
2014
31/1
2/20
1331
/12/
2014
31/1
2/20
1331
/12/
2014
31/1
2/20
1331
/12/
2014
31/1
2/20
1331
/12/
2014
31/1
2/20
1331
/12/
2014
31/1
2/20
13
1.1
Net
pre
miu
ms
8,43
8.5
5,74
2.7
7,52
2.1
3,90
7.5
15,9
60.6
9,65
0.1
1.1.
1G
ross
pre
miu
ms
earn
ed8,
878.
46,
063.
67,
536.
23,
915.
016
,414
.69,
978.
5
1.1.
2Ea
rned
pre
miu
ms
cede
d to
rein
sure
rs-4
39.9
-320
.9-1
4.1
-7.5
-454
.0-3
28.4
1.2
Com
mis
sion
inco
me
6.5
3.4
1.1
11.2
18.7
-6.2
-11.
914
.98.
0
1.3
Gai
ns a
nd lo
sses
on
finan
cial
inst
rum
ents
at f
air v
alue
thro
ugh
prof
it or
loss
-157
.8-3
1.9
230.
319
2.5
0.2
0.6
-0.9
-1.6
71.8
159.
7
1.4
Gai
ns o
n in
vest
men
ts in
sub
sidi
arie
s, a
ssoc
iate
s an
d in
tere
sts
in jo
int v
entu
res
4.3
0.2
2.6
7.6
0.0
0.0
0.0
6.9
7.8
1.5
Gai
ns o
n ot
her f
inan
cial
inst
rum
ents
and
inve
stm
ent p
rope
rty1,
005.
651
1.4
1,74
0.5
910.
956
.763
.975
.348
.7-6
0.5
-46.
02,
817.
61,
489.
0
1.6
Oth
er re
venu
e59
8.8
445.
779
.449
.830
6.8
634.
540
.621
.8-1
56.9
-686
.086
8.7
465.
7
TOTA
L R
EVEN
UE
AN
D IN
CO
ME
9,89
5.9
6,66
8.2
9,57
8.3
5,06
9.4
374.
971
7.7
115.
068
.9-2
23.6
-743
.819
,740
.511
,780
.4
2.1
Net
cha
rges
rela
ting
to c
laim
s-5
,708
.8-4
,076
.7-8
,604
.0-4
,255
.5-1
4,31
2.8
-8,3
32.2
2.1.
1Am
ount
s pa
id a
nd c
hang
es in
tech
nica
l pro
visi
ons
-5,9
55.0
-4,2
46.1
-8,6
16.6
-4,2
62.8
-14,
571.
6-8
,508
.9
2.1.
2R
eins
urer
s' sh
are
246.
216
9.4
12.6
7.2
258.
717
6.7
2.2
Com
mis
sion
exp
ense
-6.7
-3.2
-0.7
-3.7
-5.6
0.0
-13.
7-6
.3
2.3
Loss
es o
n in
vest
men
ts in
sub
sidi
arie
s, a
ssoc
iate
s an
d in
tere
sts
in jo
int v
entu
res
-19.
4-0
.3-3
.90.
0-0
.1-1
.7-2
.6-0
.2-2
6.0
-2.1
2.4
Loss
es o
n ot
her f
inan
cial
inst
rum
ents
and
inve
stm
ent p
rope
rty-3
36.0
-179
.7-2
20.1
-31.
3-1
3.6
-20.
6-1
06.0
-76.
89.
99.
6-6
65.7
-298
.9
2.5
Ope
ratin
g ex
pens
es-2
,254
.9-1
,334
.5-3
56.0
-202
.6-6
6.1
-313
.3-9
.9-0
.241
.024
1.1
-2,6
45.9
-1,6
09.4
2.6
Oth
er c
osts
-616
.0-7
42.7
-136
.7-1
46.4
-287
.7-4
26.7
-70.
3-4
3.2
176.
449
2.9
-934
.4-8
66.0
2TO
TAL
CO
STS
AN
D E
XPEN
SES
-8,9
41.9
-6,3
33.8
-9,3
23.9
-4,6
36.5
-371
.3-7
67.8
-188
.8-1
20.4
227.
374
3.6
-18,
598.
5-1
1,11
4.9
PRE-
TAX
PRO
FIT
(LO
SS) F
OR
TH
E YE
AR
954.
033
4.3
254.
443
2.9
3.6
-50.
1-7
3.9
-51.
43.
8-0
.21,
142.
066
5.5
Non
-Life
bus
ines
sIn
ters
egm
ent e
limin
atio
nsTo
tal
Life
bus
ines
sO
ther
Bus
ines
ses
Rea
l Est
ate
199

Det
ails
of p
rope
rty,
pla
nt a
nd e
quip
men
t and
inta
ngib
le a
sset
sVa
lori
in M
ilioni
di E
uro
Amou
nts
in €
mA
t cos
tA
t res
tate
d or
fair
valu
eTo
tal c
arry
ing
amou
ntIn
vest
men
t pro
perty
2,82
4.2
2,82
4.2
Oth
er p
rope
rty1,
072.
01,
072.
0
Oth
er ta
ngib
le a
sset
s12
4.4
124.
4
Oth
er in
tang
ible
ass
ets
498.
149
8.1
200
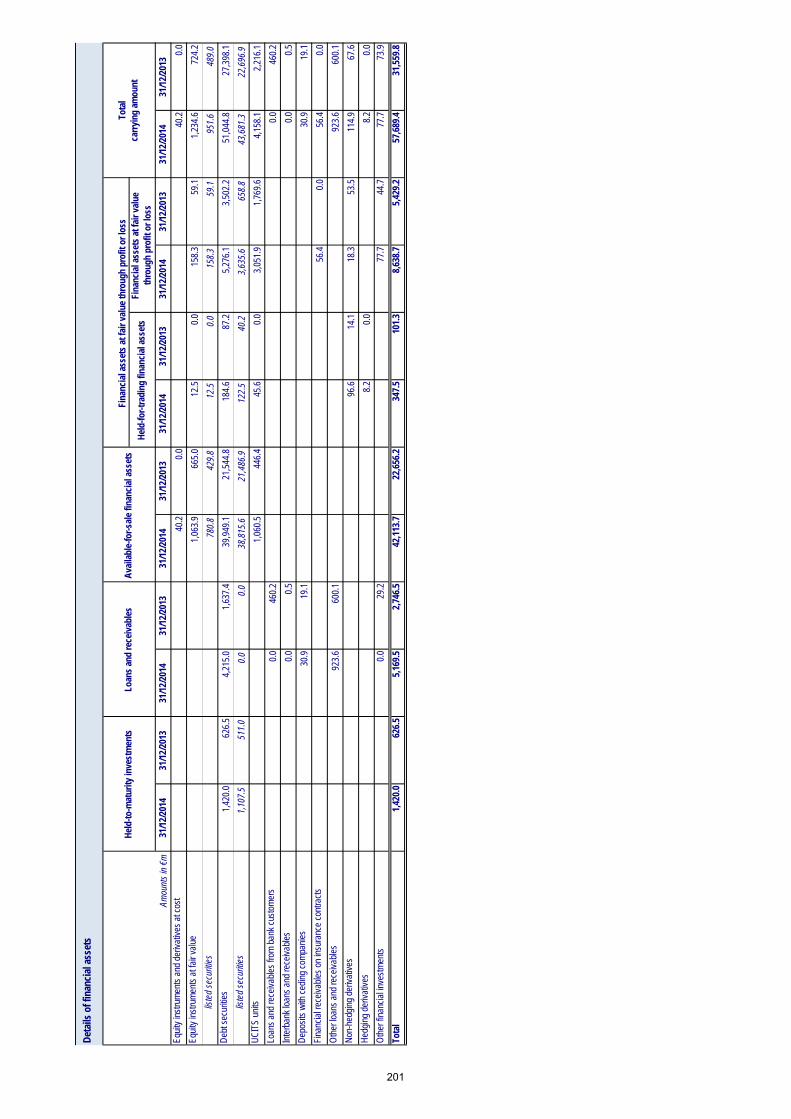
Det
ails
of f
inan
cial
ass
ets
Valo
ri in
Milio
ni d
i Eur
o
Amou
nts
in €
m31
/12/
2014
31/1
2/20
1331
/12/
2014
31/1
2/20
1331
/12/
2014
31/1
2/20
1331
/12/
2014
31/1
2/20
1331
/12/
2014
31/1
2/20
1331
/12/
2014
31/1
2/20
13
Equi
ty in
stru
men
ts a
nd d
eriv
ativ
es a
t cos
t40
.20.
00.
00.
00.
00.
040
.20.
0Eq
uity
inst
rum
ents
at f
air v
alue
1,06
3.9
665.
012
.50.
015
8.3
59.1
1,23
4.6
724.
2
liste
d se
curit
ies
780.
842
9.8
12.5
0.0
158.
359
.195
1.6
489.
0D
ebt s
ecur
ities
1,42
0.0
626.
54,
215.
01,
637.
439
,949
.121
,544
.818
4.6
87.2
5,27
6.1
3,50
2.2
51,0
44.8
27,3
98.1
liste
d se
curit
ies
1,10
7.5
511.
00.
00.
038
,815
.621
,486
.912
2.5
40.2
3,63
5.6
658.
843
,681
.322
,696
.9U
CIT
S un
its1,
060.
544
6.4
45.6
0.0
3,05
1.9
1,76
9.6
4,15
8.1
2,21
6.1
Loan
s an
d re
ceiv
able
s fro
m b
ank
cust
omer
s0.
046
0.2
0.0
460.
2In
terb
ank
loan
s an
d re
ceiv
able
s0.
00.
50.
00.
5D
epos
its w
ith c
edin
g co
mpa
nies
30.9
19.1
30.9
19.1
Fina
ncia
l rec
eiva
bles
on
insu
ranc
e co
ntra
cts
56.4
0.0
56.4
0.0
Oth
er lo
ans
and
rece
ivab
les
923.
660
0.1
923.
660
0.1
Non
-hed
ging
der
ivat
ives
96.6
14.1
18.3
53.5
114.
967
.6H
edgi
ng d
eriv
ativ
es8.
20.
00.
00.
08.
20.
0O
ther
fina
ncia
l inv
estm
ents
0.0
29.2
77.7
44.7
77.7
73.9
Tota
l1,
420.
062
6.5
5,16
9.5
2,74
6.5
42,1
13.7
22,6
56.2
347.
510
1.3
8,63
8.7
5,42
9.2
57,6
89.4
31,5
59.8
Hel
d-to
-mat
urity
inve
stm
ents
Loan
s an
d re
ceiv
able
sA
vaila
ble-
for-
sale
fina
ncia
l ass
ets
Fina
ncia
l ass
ets
at fa
ir va
lue
thro
ugh
prof
it or
loss
Tota
lca
rryi
ng a
mou
ntH
eld-
for-
trad
ing
finan
cial
ass
ets
Fina
ncia
l ass
ets
at fa
ir va
lue
thro
ugh
prof
it or
loss
201

Valo
ri in
Milio
ni d
i Eur
o
Amou
nts
in €
m31
/12/
2014
31/1
2/20
1331
/12/
2014
31/1
2/20
1331
/12/
2014
31/1
2/20
13
Rec
ogni
sed
asse
ts5,
166.
85,
076.
43,
471.
935
2.8
8,63
8.7
5,42
9.2
Intra
grou
p as
sets
*0.
00.
20.
00.
00.
00.
2To
tal A
sset
s5,
166.
85,
076.
63,
471.
935
2.8
8,63
8.7
5,42
9.3
Rec
ogni
sed
finan
cial
liab
ilitie
s25
3.2
150.
152
6.9
352.
878
0.0
502.
9
Rec
ogni
sed
tech
nica
l pro
visi
ons
4,90
9.4
4,92
6.2
2,94
5.0
0.0
7,85
4.4
4,92
6.2
Intra
grou
p lia
bilit
ies
*0.
00.
00.
00.
00.
00.
0To
tal l
iabi
litie
s5,
162.
55,
076.
33,
471.
935
2.8
8,63
4.4
5,42
9.1
*Ass
ets
and
liabi
litie
s el
imin
ated
on
cons
olid
atio
n
Det
ails
of a
sset
s an
d lia
bilit
ies
rela
ting
to in
sura
nce
cont
ract
s w
here
the
inve
stm
ent r
isk
is b
orne
by
polic
yhol
ders
and
aris
ing
from
pen
sion
fund
man
agem
ent
Ben
efits
link
ed to
inve
stm
ent f
unds
and
m
arke
t ind
ices
Ben
efits
link
ed to
pen
sion
fund
man
agem
ent
Tota
l
202

Det
ails
of t
echn
ical
pro
visi
ons
– re
insu
rers
' sha
reVa
lori
in M
ilioni
di E
uro
Amou
nts
in €
m31
/12/
2014
31/1
2/20
1331
/12/
2014
31/1
2/20
1331
/12/
2014
31/1
2/20
13
Non
-Life
pro
visi
ons
767.
063
5.4
89.3
39.4
856.
367
4.8
Prem
ium
pro
visi
ons
193.
015
4.7
2.4
1.9
195.
315
6.6
Cla
ims
prov
isio
n57
4.0
480.
787
.037
.566
1.0
518.
2
Oth
er re
serv
es0.
00.
00.
00.
00.
00.
0
Life
pro
visi
ons
93.0
29.5
10.9
37.4
103.
966
.9
Prov
isio
n fo
r am
ount
s pa
yabl
e5.
41.
51.
31.
86.
73.
3
Mat
hem
atic
al p
rovi
sion
s 87
.628
.09.
635
.697
.263
.6
Tech
nica
l pro
visi
ons
whe
re th
e in
vest
men
t ris
k is
bor
ne b
y po
licyh
olde
rs a
nd p
rovi
sion
s ar
isin
g fro
m p
ensi
on fu
nd m
anag
emen
t0.
00.
00.
00.
00.
00.
0
Oth
er re
serv
es0.
00.
00.
00.
00.
00.
0
Tota
l tec
hnic
al p
rovi
sion
s - r
eins
urer
s' s
hare
860.
066
4.9
100.
276
.896
0.2
741.
7
Dire
ct b
usin
ess
Indi
rect
bus
ines
s To
tal c
arry
ing
amou
nt
203

Det
ails
of t
echn
ical
pro
visi
ons
Valo
ri in
Milio
ni d
i Eur
o
Amou
nts
in €
m31
/12/
2014
31/1
2/20
1331
/12/
2014
31/1
2/20
1331
/12/
2014
31/1
2/20
13
Non
-Life
pro
visi
ons
16,7
12.8
11,4
96.5
153.
310
6.1
16,8
66.1
11,6
02.6
Prem
ium
pro
visi
on
2,87
4.5
2,20
2.9
3.7
0.8
2,87
8.3
2,20
3.7
Cla
ims
prov
isio
n 13
,829
.39,
286.
914
9.5
105.
213
,978
.89,
392.
1
Oth
er re
serv
es9.
06.
80.
00.
09.
06.
8in
clud
ing
prov
isio
ns a
lloca
ted
as a
resu
lt of
the
liabi
lity
adeq
uacy
tes t
0.0
0.0
0.0
0.0
Life
pro
visi
ons
39,3
40.5
21,1
83.2
21.9
14.2
39,3
62.4
21,1
97.5
Prov
isio
n fo
r am
ount
s pa
yabl
e37
6.4
284.
33.
31.
037
9.6
285.
4
Mat
hem
atic
al p
rovi
sion
s28
,537
.715
,559
.318
.613
.228
,556
.315
,572
.5
Tech
nica
l pro
visi
ons
whe
re th
e in
vest
men
t ris
k is
bor
ne b
y po
licyh
olde
rs a
nd p
rovi
sion
s ar
isin
g fro
m p
ensi
on fu
nd m
anag
emen
t7,
854.
44,
926.
20.
00.
07,
854.
44,
926.
2
Oth
er re
serv
es2,
572.
141
3.4
0.0
0.0
2,57
2.1
413.
4in
clud
ing
prov
isio
ns a
lloca
ted
as a
resu
lt of
the
liabi
lity
adeq
uacy
tes t
0.0
0.0
incl
udin
g de
ferre
d lia
bilit
ies
to p
olic
yhol
ders
2,45
8.2
347.
52,
458.
234
7.5
Tota
l tec
hnic
al p
rovi
sion
s56
,053
.332
,679
.817
5.2
120.
356
,228
.532
,800
.0
Dire
ct b
usin
ess
Indi
rect
bus
ines
s To
tal c
arry
ing
amou
nt
204

Det
ails
of f
inan
cial
liab
ilitie
sVa
lori
in M
ilioni
di E
uro
Amou
nts
in €
m31
/12/
2014
31/1
2/20
1331
/12/
2014
31/1
2/20
1331
/12/
2014
31/1
2/20
1331
/12/
2014
31/1
2/20
13
Equi
ty in
stru
men
ts0.
00.
00.
00.
00.
00.
00.
00.
0
Subo
rdin
ated
liab
ilitie
s0.
00.
00.
00.
02,
033.
71,
028.
82,
033.
71,
028.
8Li
abilit
ies
from
fina
ncia
l con
tract
s is
sued
by
insu
ranc
e co
mpa
nies
785.
550
2.9
0.0
0.0
785.
550
2.9
Aris
ing
from
con
tract
s w
here
the
inve
stm
ent r
isk
is b
orne
by
polic
yhol
ders
257.
415
0.1
257.
415
0.1
Aris
ing
from
pen
sion
fund
man
agem
ent
528.
135
2.8
528.
135
2.8
Aris
ing
from
oth
er c
ontra
cts
0.0
0.0
0.0
0.0
0.0
0.0
Dep
osits
rece
ived
from
rein
sure
rs28
4.1
135.
028
4.1
135.
0
Fina
ncia
l ite
ms
paya
ble
on in
sura
nce
cont
ract
s0.
00.
00.
00.
0
Deb
t sec
uriti
es is
sued
0.0
0.0
0.0
0.0
0.0
18.4
0.0
18.4
Paya
bles
to b
ank
cust
omer
s0.
016
4.5
0.0
164.
5
Inte
rban
k pa
yabl
es0.
00.
00.
00.
0
Oth
er lo
ans
obta
ined
0.0
0.0
0.0
0.0
129.
412
2.8
129.
412
2.8
Non
-hed
ging
der
ivat
ives
101.
10.
00.
00.
010
1.1
0.0
Hed
ging
der
ivat
ives
478.
848
.30.
00.
347
8.8
48.6
Sund
ry fi
nanc
ial l
iabi
litie
s0.
00.
00.
02.
60.
220
2.7
0.2
205.
3To
tal
579.
948
.378
5.5
505.
82,
447.
31,
672.
23,
812.
72,
226.
3
Hel
d-fo
r-tr
adin
g fin
anci
al li
abili
ties
Fina
ncia
l lia
bilit
ies
at fa
ir va
lue
thro
ugh
prof
it or
loss
Fina
ncia
l lia
bilit
ies
at fa
ir va
lue
thro
ugh
prof
it or
loss
Oth
er fi
nanc
ial l
iabi
litie
s To
tal
carr
ying
am
ount
205

Det
ails
of t
echn
ical
insu
ranc
e ite
ms
Valo
ri in
Milio
ni d
i Eur
o
Amou
nts
in €
mG
ross
am
ount
Rei
nsur
ers'
sha
reN
et a
mou
ntG
ross
am
ount
Rei
nsur
ers'
sha
reN
et a
mou
nt
8,87
8.4
-439
.98,
438.
56,
063.
6-3
20.9
5,74
2.7
aW
ritte
n pr
emiu
ms
8,45
1.4
-420
.28,
031.
15,
792.
2-3
19.4
5,47
2.8
bC
hang
e in
pre
miu
m p
rovi
sion
427.
0-1
9.6
407.
427
1.4
-1.5
269.
9
-5,9
55.0
246.
2-5
,708
.8-4
,246
.116
9.4
-4,0
76.7
aAm
ount
s pa
id-6
,472
.827
8.1
-6,1
94.6
-4,9
88.8
228.
2-4
,760
.6
bC
hang
e in
cla
ims
prov
isio
n37
6.0
-25.
535
0.4
626.
4-5
6.6
569.
8
cC
hang
e in
reco
verie
s14
1.8
-6.4
135.
411
6.2
-2.2
114.
0
dC
hang
e in
oth
er te
chni
cal p
rovi
sion
s0.
00.
00.
00.
10.
00.
1
7,53
6.2
-14.
17,
522.
13,
915.
0-7
.53,
907.
5
-8,6
16.6
12.6
-8,6
04.0
-4,2
62.8
7.2
-4,2
55.5
aAm
ount
s pa
id-6
,148
.734
.6-6
,114
.0-4
,596
.718
.5-4
,578
.2
bC
hang
e in
pro
visi
on fo
r am
ount
s pa
yabl
e22
.0-1
.220
.8-4
1.2
1.3
-39.
9
cC
hang
e in
mat
hem
atic
al p
rovi
sion
s-2
,129
.0-2
0.9
-2,1
49.9
-605
.8-1
2.6
-618
.4
dC
hang
e in
tech
nica
l pro
visi
ons
whe
re th
e in
vest
men
t ris
k is
bor
ne b
y po
licyh
olde
rs a
nd
aris
ing
from
pen
sion
fund
man
agem
ent
-241
.80.
0-2
41.8
936.
50.
093
6.5
eC
hang
e in
oth
er te
chni
cal p
rovi
sion
s-1
19.1
0.0
-119
.144
.50.
044
.5
NET
PR
EMIU
MS
NET
CH
AR
GES
REL
ATI
NG
TO
CLA
IMS
NET
CH
AR
GES
REL
ATI
NG
TO
CLA
IMS
Life
bus
ines
s
NET
PR
EMIU
MS
31/1
2/20
14
Non
-Life
bus
ines
s
31/1
2/20
13
206

Inve
stm
ent i
ncom
e an
d ch
arge
s
Valo
ri in
Milio
ni d
i Eur
o
Tota
l gai
ns a
nd
loss
esTo
tal g
ains
and
lo
sses
Amou
nts
in €
mU
nrea
lised
ca
pita
l gai
nsW
rite-
back
sU
nrea
lised
ca
pita
l los
ses
Impa
irmen
t31
/12/
2014
31/1
2/20
13
Bal
ance
on
inve
stm
ents
1,71
0.0
341.
5-1
97.1
881.
3-4
13.6
2,32
2.1
569.
80.
2-3
81.5
-144
.843
.72,
365.
81,
401.
5
aAr
isin
g fro
m in
vest
men
t pro
perty
111.
0-4
8.6
4.7
-2.9
64.2
0.0
0.0
-45.
8-1
13.4
-159
.2-9
5.1
-76.
1
bAr
isin
g fro
m in
vest
men
ts in
sub
sidi
arie
s, a
ssoc
iate
s an
d in
tere
sts
in jo
int
vent
ures
6.9
-17.
70.
00.
0-1
0.8
0.0
0.0
-8.3
-8.3
-19.
15.
7
cAr
isin
g fro
m h
eld-
to-m
atur
ity in
vest
men
ts65
.40.
00.
02.
7-0
.767
.40.
00.
00.
00.
00.
067
.417
.1
dAr
isin
g fro
m lo
ans
and
rece
ivab
les
207.
30.
00.
054
.5-1
23.7
138.
00.
00.
20.
0-7
.9-7
.713
0.3
101.
2
eAr
isin
g fro
m a
vaila
ble-
for-s
ale
finan
cial
ass
ets
1,30
9.1
75.7
-4.6
703.
3-1
59.3
1,92
4.3
270.
40.
00.
0-1
5.1
255.
22,
179.
51,
194.
3
fAr
isin
g fro
m h
eld-
for-t
radi
ng fi
nanc
ial a
sset
s7.
131
.6-6
5.8
16.9
-104
.4-1
14.6
30.2
-271
.6-2
41.4
-356
.0-3
7.6
gAr
isin
g fro
m fi
nanc
ial a
sset
s at
fair
valu
e th
roug
h pr
ofit
or lo
ss12
1.1
116.
3-6
0.4
99.1
-22.
425
3.6
269.
1-6
4.1
205.
145
8.7
197.
0
Bal
ance
on
sund
ry re
ceiv
able
s4.
80.
00.
00.
04.
80.
04.
89.
4
Bal
ance
on
cash
and
cas
h eq
uiva
lent
s6.
60.
0-0
.40.
06.
10.
06.
19.
1
Bal
ance
on
finan
cial
liab
ilitie
s-9
4.2
0.0
-42.
613
.10.
0-1
23.6
0.0
0.0
-45.
10.
0-4
5.1
-168
.7-5
9.7
aAr
isin
g fro
m h
eld-
for-t
radi
ng fi
nanc
ial l
iabi
litie
s0.
00.
00.
011
.30.
011
.30.
0-4
.4-4
.47.
00.
3
bAr
isin
g fro
m fi
nanc
ial l
iabi
litie
s at
fair
valu
e th
roug
h pr
ofit
or lo
ss0.
00.
00.
00.
00.
00.
00.
0-3
7.9
-37.
9-3
7.9
0.0
cAr
isin
g fro
m o
ther
fina
ncia
l lia
bilit
ies
-94.
2-4
2.6
1.8
0.0
-135
.00.
00.
0-2
.9-2
.9-1
37.8
-60.
0
-3.3
-0.1
0.0
-3.4
0.0
0.0
-3.4
-4.8
1,62
3.8
341.
5-2
40.2
894.
4-4
13.6
2,20
6.0
569.
80.
2-4
26.6
-144
.8-1
.42,
204.
61,
355.
5
Bal
ance
on
paya
bles
Tota
l
Inte
rest
Oth
er
inco
me
Oth
er
char
ges
Rea
lised
ga
ins
Rea
lised
lo
sses
Tota
l rea
lised
ga
ins
and
loss
es
Unr
ealis
ed g
ains
Unr
ealis
ed lo
sses
Tota
l un
real
ised
ga
ins
and
loss
es
207
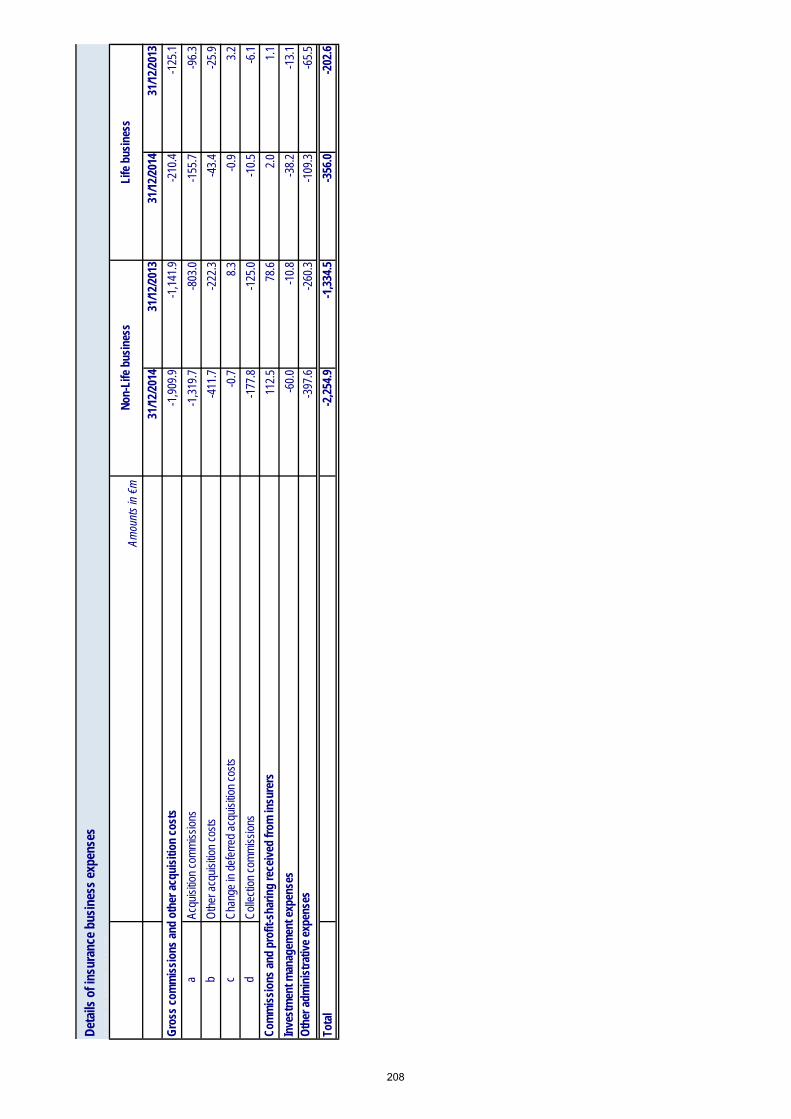
Det
ails
of i
nsur
ance
bus
ines
s ex
pens
esVa
lori
in M
ilioni
di E
uro
Amou
nts
in €
m
31/1
2/20
1431
/12/
2013
31/1
2/20
1431
/12/
2013
Gro
ss c
omm
issi
ons
and
othe
r acq
uisi
tion
cost
s-1
,909
.9-1
,141
.9-2
10.4
-125
.1
aAc
quis
ition
com
mis
sion
s -1
,319
.7-8
03.0
-155
.7-9
6.3
bO
ther
acq
uisi
tion
cost
s -4
11.7
-222
.3-4
3.4
-25.
9
cC
hang
e in
def
erre
d ac
quis
ition
cos
ts
-0.7
8.3
-0.9
3.2
dC
olle
ctio
n co
mm
issi
ons
-177
.8-1
25.0
-10.
5-6
.1
Com
mis
sion
s an
d pr
ofit-
shar
ing
rece
ived
from
insu
rers
112.
578
.62.
01.
1
Inve
stm
ent m
anag
emen
t exp
ense
s -6
0.0
-10.
8-3
8.2
-13.
1O
ther
adm
inis
trat
ive
expe
nses
-397
.6-2
60.3
-109
.3-6
5.5
Tota
l-2
,254
.9-1
,334
.5-3
56.0
-202
.6
Non
-Life
bus
ines
s Li
fe b
usin
ess
208

Det
ails
of o
ther
con
solid
ated
com
preh
ensi
ve in
com
e
Amou
nts
in €
m31
/12/
2014
31/1
2/20
1331
/12/
2014
31/1
2/20
1331
/12/
2014
31/1
2/20
1331
/12/
2014
31/1
2/20
1331
/12/
2014
31/1
2/20
1331
/12/
2014
31/1
2/20
13
Oth
er in
com
e ite
ms
not r
ecla
ssifi
ed to
pro
fit o
r los
s-3
5.7
29.1
0.0
0.0
0.0
0.0
-35.
729
.17.
9-0
.6-1
4.2
21.5
Res
erve
der
ivin
g fro
m c
hang
es in
the
shar
ehol
ders
' equ
ity o
f the
inve
stee
s-2
0.7
27.6
0.0
0.0
0.0
-20.
727
.60.
70.
06.
927
.6
Rev
alua
tion
rese
rve
for i
ntan
gibl
e as
sets
0.0
0.0
0.0
0.0
0.0
0.0
0.0
0.0
0.0
0.0
Rev
alua
tion
rese
rve
for p
rope
rty, p
lant
and
equ
ipm
ent
0.0
0.0
0.0
0.0
0.0
0.0
0.0
0.0
0.0
0.0
0.0
Gai
ns a
nd lo
sses
on
non-
curre
nt a
sset
s or
dis
posa
l gro
ups
held
for s
ale
0.0
0.0
0.0
0.0
0.0
0.0
0.0
0.0
0.0
0.0
Actu
aria
l gai
ns a
nd lo
sses
and
adj
ustm
ents
rela
ting
to d
efin
ed b
enef
it pl
ans
-14.
01.
40.
00.
00.
0-1
4.0
1.4
7.1
-0.6
-21.
0-7
.1
Oth
er it
ems
-1.0
0.2
0.0
0.0
0.0
-1.0
0.2
0.0
0.0
0.0
1.0
Oth
er in
com
e ite
ms
recl
assi
fied
to p
rofit
or l
oss
689.
050
.4-8
1.4
-144
.40.
00.
060
7.6
-93.
9-2
81.4
-28.
11,
236.
962
9.3
Res
erve
for f
orei
gn c
urre
ncy
trans
latio
n di
ffere
nces
-0.9
-0.8
0.0
0.0
0.0
0.0
-0.9
-0.8
0.0
0.0
3.8
4.7
Gai
ns o
r los
ses
on a
vaila
ble-
for-s
ale
finan
cial
ass
ets
664.
840
.2-8
1.4
-144
.40.
00.
058
3.4
-104
.1-2
68.4
-23.
71,
203.
662
0.2
Gai
ns o
r los
ses
on c
ash
flow
hed
ges
25.1
11.0
0.0
0.0
0.0
0.0
25.1
11.0
-13.
1-4
.429
.54.
4
Gai
ns o
r los
ses
on h
edge
s of
a n
et in
vest
men
t in
fore
ign
oper
atio
ns0.
00.
00.
00.
00.
00.
00.
00.
00.
00.
00.
0
Res
erve
der
ivin
g fro
m c
hang
es in
the
shar
ehol
ders
' equ
ity o
f the
inve
stee
s0.
00.
00.
00.
00.
00.
00.
00.
00.
00.
00.
0
Gai
ns a
nd lo
sses
on
non-
curre
nt a
sset
s or
dis
posa
l gro
ups
held
for s
ale
0.0
0.0
0.0
0.0
0.0
0.0
0.0
0.0
0.0
0.0
0.0
Oth
er it
ems
0.0
0.0
0.0
0.0
0.0
0.0
0.0
0.0
0.0
0.0
0.0
TOTA
L O
THER
CO
MPR
EHEN
SIVE
INC
OM
E (E
XPEN
SE)
653.
379
.6-8
1.4
-144
.40.
00.
057
2.0
-64.
8-2
73.6
-28.
71,
222.
865
0.8
The
colu
mn
“Am
ount
s al
loca
ted”
refe
rring
to th
e ye
ar 2
014
incl
udes
the
amou
nts
allo
cate
d at
1 J
anua
ry 2
014
aris
ing
from
the
mer
ger (
€-
132m
).
Bal
ance
Am
ount
s al
loca
ted
Adj
ustm
ents
from
re
clas
sific
atio
nto
pro
fit o
r los
sO
ther
cha
nges
Tota
l cha
nges
Inco
me
tax
209
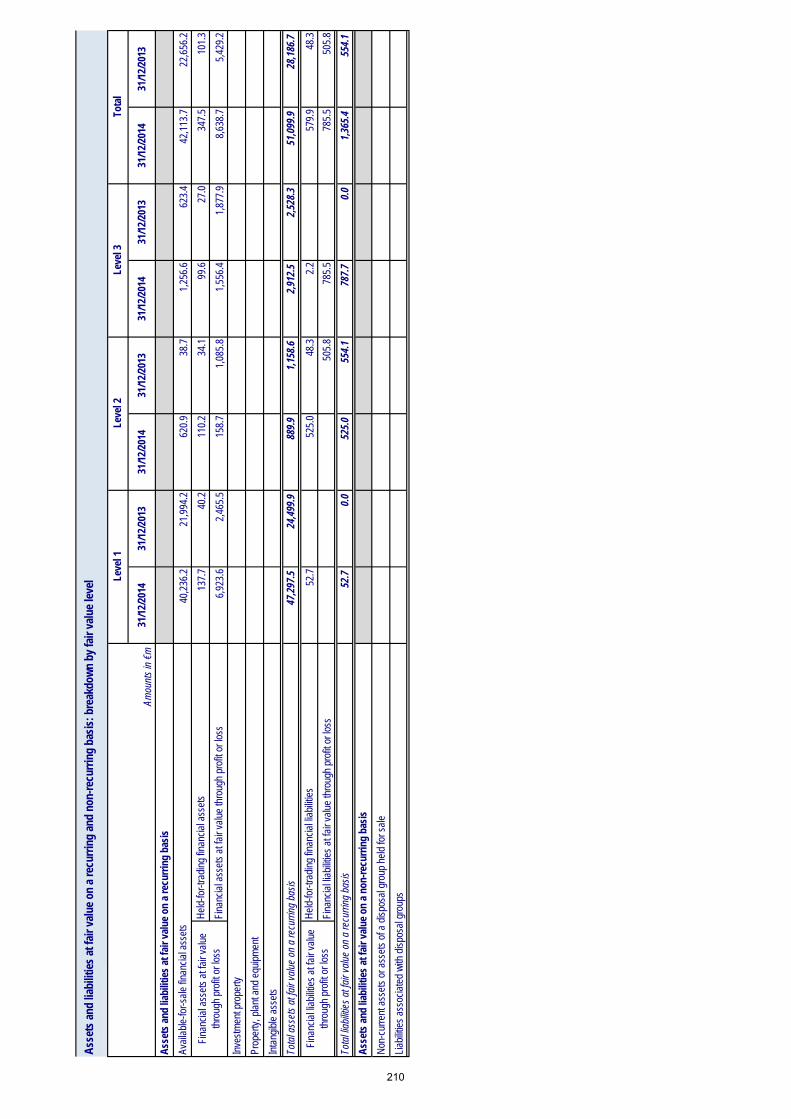
Ass
ets
and
liabi
litie
s at
fair
valu
e on
a re
curr
ing
and
non-
recu
rrin
g ba
sis:
bre
akdo
wn
by fa
ir va
lue
leve
lVa
lori
in M
ilioni
di E
uro
Amou
nts
in €
m31
/12/
2014
31/1
2/20
1331
/12/
2014
31/1
2/20
1331
/12/
2014
31/1
2/20
1331
/12/
2014
31/1
2/20
13
Ass
ets
and
liabi
litie
s at
fair
valu
e on
a re
curr
ing
basi
s
Avai
labl
e-fo
r-sal
e fin
anci
al a
sset
s40
,236
.221
,994
.262
0.9
38.7
1,25
6.6
623.
442
,113
.722
,656
.2
Hel
d-fo
r-tra
ding
fina
ncia
l ass
ets
137.
740
.211
0.2
34.1
99.6
27.0
347.
510
1.3
Fina
ncia
l ass
ets
at fa
ir va
lue
thro
ugh
prof
it or
loss
6,92
3.6
2,46
5.5
158.
71,
085.
81,
556.
41,
877.
98,
638.
75,
429.
2
Inve
stm
ent p
rope
rty
Prop
erty
, pla
nt a
nd e
quip
men
t
Inta
ngib
le a
sset
s
Tota
l ass
ets
at fa
ir va
lue
on a
recu
rring
bas
is47
,297
.524
,499
.988
9.9
1,15
8.6
2,91
2.5
2,52
8.3
51,0
99.9
28,1
86.7
Hel
d-fo
r-tra
ding
fina
ncia
l lia
bilit
ies
52.7
525.
048
.32.
257
9.9
48.3
Fina
ncia
l lia
bilit
ies
at fa
ir va
lue
thro
ugh
prof
it or
loss
505.
878
5.5
785.
550
5.8
Tota
l lia
bilit
ies
at fa
ir va
lue
on a
recu
rring
bas
is52
.70.
052
5.0
554.
178
7.7
0.0
1,36
5.4
554.
1
Ass
ets
and
liabi
litie
s at
fair
valu
e on
a n
on-r
ecur
ring
basi
s
Non
-cur
rent
ass
ets
or a
sset
s of
a d
ispo
sal g
roup
hel
d fo
r sal
e
Liab
ilitie
s as
soci
ated
with
dis
posa
l gro
ups
Leve
l 2Le
vel 3
Tota
l
Fina
ncia
l lia
bilit
ies
at fa
ir va
lue
thro
ugh
prof
it or
loss
Fina
ncia
l ass
ets
at fa
ir va
lue
thro
ugh
prof
it or
loss
Leve
l 1
210

Det
ails
of c
hang
es in
leve
l 3 a
sset
s an
d lia
bilit
ies
at fa
ir va
lue
on a
recu
rrin
g ba
sis
Valo
ri in
Milio
ni d
i Eur
o
Amou
nts
in €
m
Hel
d-fo
r-tr
adin
g fin
anci
al a
sset
s
Fina
ncia
l ass
ets
at
fair
valu
e th
roug
h pr
ofit
or lo
ss
Hel
d-fo
r-tr
adin
g fin
anci
al li
abili
ties
Fina
ncia
l lia
bilit
ies
at
fair
valu
e th
roug
h pr
ofit
or lo
ss
Ope
ning
bal
ance
623.
427
.01,
877.
9
Acqu
isiti
ons/
Issu
es43
.71.
9
Sale
s/R
epur
chas
es-2
.4-2
.3-2
80.0
Rep
aym
ents
-0.1
-1.0
-64.
0
Gai
ns o
r los
ses
reco
gnis
ed th
roug
h pr
ofit
or lo
ss8.
7-0
.6
- of
whi
ch u
nrea
lised
gai
ns/lo
sses
8.7
-0.6
Gai
ns o
r los
ses
reco
gnis
ed in
the
stat
emen
t of o
ther
com
preh
ensi
ve in
com
e79
.50.
0
Tran
sfer
s to
leve
l 315
.612
1.4
Tran
sfer
s to
oth
er le
vels
-0.1
Oth
er c
hang
es49
6.9
65.2
-98.
22.
278
5.5
Clo
sing
bal
ance
1,25
6.6
99.6
1,55
6.4
2.2
785.
5
Ava
ilabl
e-fo
r-sa
le
finan
cial
ass
ets
Fina
ncia
l ass
ets
at fa
ir va
lue
thro
ugh
prof
it or
loss
Inve
stm
ent p
rope
rty
Prop
erty
, pla
nt a
nd
equi
pmen
tIn
tang
ible
ass
ets
Fina
ncia
l lia
bilit
ies
at fa
ir va
lue
thro
ugh
prof
it or
loss
211

Ass
ets
and
liabi
litie
s no
t mea
sure
d at
fair
valu
e: b
reak
dow
n by
fair
valu
e le
vel
Amou
nts
in €
m31
/12/
2014
31/1
2/20
1331
/12/
2014
31/1
2/20
1331
/12/
2014
31/1
2/20
1331
/12/
2014
31/1
2/20
1331
/12/
2014
31/1
2/20
13
Ass
ets
Hel
d-to
-mat
urity
inve
stm
ents
1,42
0.0
626.
51,
258.
050
9.8
324.
113
6.4
1,58
2.1
646.
2
Loan
s an
d re
ceiv
able
s5,
169.
52,
746.
52.
93,
866.
71,
748.
41,
471.
41,
143.
45,
341.
12,
891.
8
Inve
stm
ents
in s
ubsi
diar
ies,
ass
ocia
tes
and
inte
rest
s in
join
t ven
ture
s60
8.4
159.
460
8.4
159.
460
8.4
159.
4
Inve
stm
ent p
rope
rty2,
824.
22,
584.
52,
903.
52,
638.
62,
903.
52,
638.
6
Prop
erty
, pla
nt a
nd e
quip
men
t1,
196.
452
2.3
1,30
6.2
532.
11,
306.
253
2.1
Tota
l ass
ets
11,2
18.5
6,63
9.2
1,26
0.9
509.
84,
190.
81,
884.
86,
289.
54,
473.
511
,741
.26,
868.
1
Liab
ilitie
s
Oth
er fi
nanc
ial l
iabi
litie
s2,
447.
31,
672.
21,
290.
41,
081.
91,
672.
22,
372.
31,
672.
2
Car
ryin
g am
ount
Fair
valu
e
Leve
l 1Le
vel 2
Leve
l 3To
tal
212

Statement on the Consolidated Financial Statements (in accordance with art. 81-ter, Consob Regulation No. 11971/1999)


STATEMENT ON THE CONSOLIDATED FINANCIAL STATEMENTS IN ACCORDANCE WITH ART. 81-ter, CONSOB REGULATION NO. 11971 OF 14
MAY 1999 AND SUBSEQUENT AMENDMENTS AND ADDITIONS
1. The undersigned, Carlo Cimbri, as Chief Executive Officer, and Maurizio Castellina, as Managerin charge of financial reporting of UnipolSai Assicurazioni S.p.A., hereby certify, also taking intoaccount the provisions of Art. 154-bis, paragraphs 3 and 4 of Legislative Decree 58 of24 February 1998:
the adequacy in relation to the characteristics of the company and
the effective application,
of the administrative and accounting procedures for preparation of the consolidated financial statements for the period 1 January - 31 December 2014.
2. The assessment of the adequacy of the administrative and accounting procedures for preparingthe consolidated financial statements for the year ended 31 December 2014 is based on aprocess defined by Unipol Gruppo Finanziario S.p.A., inspired by the COSO Framework (InternalControl – Integrated Framework, issued by the Committee of Sponsoring Organisations of theTreadway Commission and, as regards the IT component, by the COBIT Framework (ControlOBjectives for IT and related technology), internationally recognised as the reference standardsfor the implementation and evaluation of internal control systems.
3. It is also certified that:
3.1. the consolidated financial statements at 31 December 2014:
were prepared in compliance with the applicable International Accounting Standards recognised in the European Community in accordance with EC Regulation no. 1606/2002 of the European Parliament and Council of 19 July 2002;
correspond to the book results and accounting records;
are suitable to provide a true and fair view of the equity, economic and financial situation of the issuer and of the consolidated companies;
3.2. the management report includes a reliable analysis of the performance and of the operating result, and of the situation of the issuer and the group of consolidated companies, together with a description of the main risks and uncertainties to which they are exposed.
Bologna, 19 March 2015
The Chief Executive Officer
Carlo Cimbri
The Manager in charge
of financial reporting
Maurizio Castellina
215


Summary of fees for services provided by the Independent Auditors

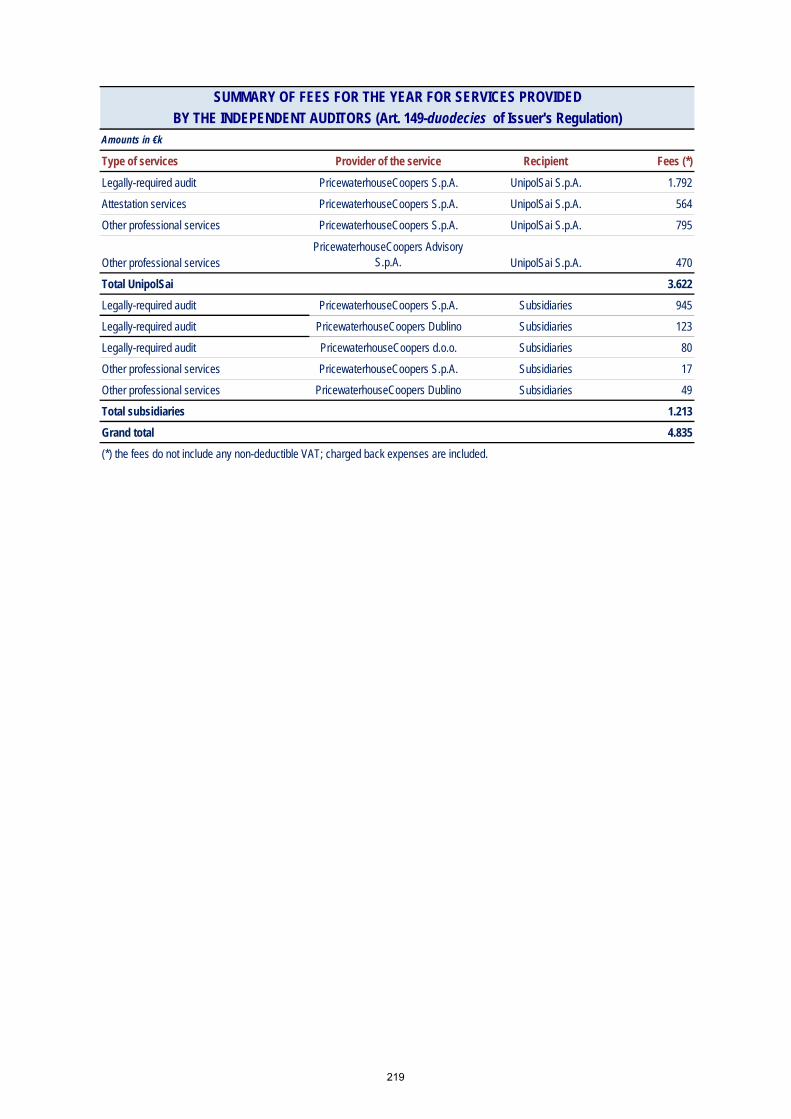
Amounts in €k
Type of services Provider of the service Recipient Fees (*)
Legally-required audit PricewaterhouseCoopers S.p.A. UnipolSai S.p.A. 1.792
Attestation services PricewaterhouseCoopers S.p.A. UnipolSai S.p.A. 564
Other professional services PricewaterhouseCoopers S.p.A. UnipolSai S.p.A. 795
Other professional servicesPricewaterhouseCoopers Advisory
S.p.A. UnipolSai S.p.A. 470
Total UnipolSai 3.622
Legally-required audit PricewaterhouseCoopers S.p.A. Subsidiaries 945
Legally-required audit PricewaterhouseCoopers Dublino Subsidiaries 123
Legally-required audit PricewaterhouseCoopers d.o.o. Subsidiaries 80
Other professional services PricewaterhouseCoopers S.p.A. Subsidiaries 17
Other professional services PricewaterhouseCoopers Dublino Subsidiaries 49
Total subsidiaries 1.213
Grand total 4.835
(*) the fees do not include any non-deductible VAT; charged back expenses are included.
SUMMARY OF FEES FOR THE YEAR FOR SERVICES PROVIDED
BY THE INDEPENDENT AUDITORS (Art. 149-duodecies of Issuer's Regulation)
219


Additional information on the significant events occurred after approval of the Consolidated Financial Statements at 31 December 2014


Additional information on the significant events occurred after approval of the Consolidated Financial Statements at 31 December 2014 Proceedings in progress with the Antitrust Authority On 26 March 2015 the Antitrust Authority notified a penalty provision with which UnipolSai Assicurazioni was ordered to pay an administrative penalty of €16,930,031 on the assumption according to which Fondiaria-SAI and Unipol Assicurazioni were allegedly party to, along with the Generali Group, an agreement restricting competition that was aimed at misrepresenting the competition in the local public transport MV TPL policy sector in the years 2010-2014. This is the order issued at the end of preliminary proceedings no. I/744 that had been brought by the Antitrust Authority to ascertain the existence of presumed infringements of Art. 2 of Law 287/1990 and/or Art. 101 of the Treaty on the Functioning of the European Union, about which information was provided in the notes to these Consolidated Financial Statements in chapter 3, Notes to the Statement of Financial Position and paragraph 2 Provisions - Ongoing disputes and contingent liabilities. It is the opinion of the Antitrust Authority that the agreement consisted of the non-participation in a given number of tenders called by several Local Public transport Companies to assign MV TPL insurance services for the purpose of preventing a competitive comparison and retaining the historically served customers through bilateral negotiations. As UnipolSai considers the order entirely groundless, it gave its legal counsel a mandate to file an appeal before the Regional Administrative Court of Lazio.
223


Board of Statutory Auditors’ Report

Board of Statutory Auditors’ Report to the Consolidated Financial Statements of UnipolSai Assicurazioni S.p.A. for the year ending 31 December 2014 Dear Shareholders, your Company prepared the Consolidated Financial Statements for the year ending on 31 December 2014 by applying the IFRS issued by the IASB and endorsed by the European Union, in accordance with EC Regulation no. 1606 of 19 July 2002 and Legislative Decree no. 58/1998, Legislative Decree no. 209/2005 and subsequent amendments and additions. The Financial Statements and the Notes to the Financial Statements were prepared according to the layout required by IVASS Regulation no. 7/2007 and subsequent amendments. The Consolidated Financial Statements comprise the statement of financial position; the income statement and the comprehensive income statement; the statement of changes in shareholders’ equity; the statement of cash flows; the notes and the tables appended to the notes. Having specified that IFRS 10, 11, 12 and the amendments to IAS 27 and IAS 28, endorsed with EU Regulation no. 1254 of 11 December 2012, came into force on 1 January 2014, based on a check carried out by the Company, the application of the new standards did not imply substantial changes to the measurements and presentation of the figures in the financial statements. Moreover, IVASS Measure no. 29 of 27 January 2015 amended IVASS Regulation no. 7/2007 in order to implement the changes that went into effect starting from the 2014 financial statements regarding quantitative disclosure required by the new IFRS 12. The Board of Statutory Auditors deems it appropriate to state that the Consolidated Financial Statements at 31 December 2014 were drawn up following the principle of value continuity with the Consolidated Financial Statements of the holding company Unipol Gruppo Finanziario S.p.A. (“UGF”), confirming the effects of the accounting allocation process already carried out at the time of UGF acquiring control of the Premafin/Fondiaria-Sai Group. These effects, as IFRS 3 allows, were measured at the end of the measurement period, i.e. one year from the date of acquisition, and were reported in the UGF condensed Consolidated Financial Statements at 30 June 2013. This led to discontinuity of values compared to the Consolidated Financial Statements of UnipolSai Assicurazioni S.p.A. (“UnipolSai”) at 31 December 2013, approved by the Board of Directors on 20 March 2014 and referring to the pre-Merger Group perimeter. The 2013 figures, shown as comparative data in the 2014 Financial Statements of UnipolSai, were thus restated in consistency with the accounting criteria adopted for the business combination. As a consequence, in order to better report the changes occurred in comparison to the previous year, the figures of 2014 were compared with the 2013 values on a like-for-like basis, determined through the aggregation of the figures provided, as highlighted above, with the 2013 figures that represent the contribution of the former Unipol Assicurazioni Group to the Consolidated Financial Statements of UGF. The Consolidated Financial Statements and the Management Report contain exhaustive and detailed information on the operating performance of the Company and the consolidated companies, on the main business sectors of the UnipolSai Group (Life and Non-Life business, real estate and other businesses), the asset and financial management, the pending disputes, the significant events after the end of the year and the business outlook.
227

The information requested in CONSOB Communications DEM/6064293 of 28 July 2006 and DEM/11070007 of 5 August 2011 is also provided. The Consolidated Financial Statements, drawn up in thousands of euros, show a Group’s profit for the year and shareholders’ equity of €739.5m and €6,295.2m, respectively. The Report issued by the Independent Auditors PricewaterhouseCoopers S.p.A. on the Consolidated Financial Statements for the year ended 31 December 2014 of UnipolSai dated 10 April 2015 does not contain any remarks or information requests. In conclusion we certify that the structure of the Consolidated Financial Statements of UnipolSai at 31 December 2014 is deemed correct and in compliance with the specific regulations. Bologna, 10 April 2015
Board of Statutory Auditors
Signed by Giuseppe ANGIOLINI
Signed by Giorgio LOLI
Signed by Sergio LAMONICA
228

Independent Auditor’s Report


PricewaterhouseCoopers SpA
Sede legale e amministrativa: Milano 20149 Via Monte Rosa 91 Tel. 0277851 Fax 027785240 Cap. Soc. Euro 6.890.000,00 i.v., C .F. e P.IVA eReg. Imp. Milano 12979880155 Iscritta al n° 119644 del Registro dei Revisori Legali - Altri Uffici: Ancona 60131 Via Sandro Totti 1 Tel.0712132311 - Bari 70124 Via Don Luigi Guanella 17 Tel. 0805640211 - Bologna 40126 Via Angelo Finelli 8 Tel. 0516186211 - Brescia 25123 ViaBorgo Pietro Wuhrer 23 Tel. 0303697501 - Catania 95129 Corso Italia 302 Tel. 0957532311 - Firenze 50121 Viale Gramsci 15 Tel. 0552482811 -Genova 16121 Piazza Dante 7 Tel. 01029041 - Napoli 80121 Piazza dei Martiri 58 Tel. 08136181 - Padova 35138 Via Vicenza 4 Tel. 049873481- Palermo 90141 Via Marchese Ugo 60 Tel. 091349737 - Parma 43100 Viale Tanara 20/A Tel. 0521275911 - Roma 00154 Largo Fochetti 29Tel. 06570251 - Torino 10122 Corso Palestro 10 Tel. 011556771 - Trento 38122 Via Grazioli 73 Tel. 0461237004 - Treviso 31100 Viale Felissent90 Tel. 0422696911 - Trieste 34125 Via Cesare Battisti 18 Tel. 0403480781 - Udine 33100 Via Poscolle 43 Tel. 043225789 - Verona 37135 ViaFrancia 21/C Tel.0458263001
www.pwc.com/it
AUDITOR’S REPORT IN ACCORDANCE WITH ARTICLES 14 AND 16 OF LEGISLATIVEDECREE 39 of 27 JANUARY 2010 AND WITH ARTICLE 102 OF LEGISLATIVE DECREE209 of 7 SEPTEMBER 2005
To the Shareholders ofUnipolSai Assicurazioni SpA
CONSOLIDATED FINANCIAL STATEMENTS AS AT 31 DECEMBER 2014
1 We have audited the consolidated financial statements, which comprise the statement offinancial position, the income statement, the comprehensive income statement, the statementof changes in shareholders’ equity, the statement of cash flows and the related notes ofUnipolSai Assicurazioni SpA and its subsidiaries (“UnipolSai Group”) for the year ended 31December 2014. The directors of UnipolSai Assicurazioni SpA are responsible for thepreparation of these financial statements in accordance with the International FinancialReporting Standards as adopted by the European Union, as well as with the regulation issuedto implement Article 90 of Legislative Decree 209 of 2005. Our responsibility is to express anopinion on these consolidated financial statements based on our audit.
2 We conducted our audit in accordance with the auditing standards and criteria recommendedby CONSOB (the Italian Commission for listed Companies and the Stock Exchange). Inaccordance with those standards and criteria, the audit has been planned and performed toobtain reasonable assurance about whether the consolidated financial statements are free ofmaterial misstatements and whether they are fairly presented, when considered as a whole. Anaudit includes examining, on a test basis, evidence supporting the amounts and disclosures inthe financial statements, as well as assessing the accounting principles used and thereasonableness of estimates made by the directors. We believe that our audit provides areasonable basis for our opinion.
The consolidated financial statements include comparative information in relation to theconsolidated financial statements of the previous year. As explained in the managementreport, paragraph “Recognition of the business combination and re-statement of the figures ofthe previous year comparative data”, the directors have restated certain comparativeinformation as at 31 December 2013, when compared to the information that had been auditedby us with report issued on 7 April 2014. The procedures applied in restating the comparativeinformation and the related disclosure included in the management report have beenexamined by us for the purpose of our audit on the consolidated financial statements as at 31December 2014.
3 In our opinion, the consolidated financial statements of UnipolSai Assicurazioni SpA as at 31December 2014 are in accordance with the International Financial Reporting Standards as
231

2 di 2
adopted by the European Union, as well as with the regulation issued to implement Article 90of Legislative Decree 209 of 2005; accordingly, they have been prepared clearly and they give atrue and fair view of the consolidated financial position, the consolidated financialperformance and the consolidated cash flows of UnipolSai Group for the year then ended.
4 The directors of UnipolSai Assicurazioni SpA are responsible for the preparation of themanagement report and of the report on corporate governance and ownership structuresavailable in UnipolSai Assicurazioni SpA web-site section “Governance”, in accordance withthe applicable laws and regulations. Our responsibility is to express an opinion on theconsistency of the management report and of the information required by paragraph 1, sub-paragraphs c), d), f), l), m) and by paragraph 2, sub-paragraph b) of Article 123-bis of theLegislative Decree 58 of 1998, contained in the report on corporate governance and ownershipstructures, with the consolidated financial statements, as required by law. For this purpose, wehave performed the procedures required under Auditing Standard No. 001 issued by theItalian Accounting Profession (CNDCEC) and recommended by CONSOB. In our opinion themanagement report and the information required by paragraph 1, sub-paragraphs c), d), f), l),m) and by paragraph 2, sub-paragraph b) of Article 123-bis of Legislative Decree 58 of 1998,contained in the report on corporate governance and ownership structures are consistent withthe consolidated financial statements of UnipolSai Assicurazioni SpA as at 31 December 2014.
Milan, 10 April 2015
PricewaterhouseCoopers SpA
Signed by
Angelo Giudici(Partner)
This report has been translated into the English language from the original, which wasissued in Italian and in accordance with Italian law, solely for the convenience ofinternational readers.
232

UnipolSai Assicurazioni S.p.A.
Registered officeVia Stalingrado, 45
40128 Bologna (Italy)Tel.: +39 051 5077111
Fax: +39 051 375349
Share capital€1,996,129,451.62 fully paid-up
Bologna Register of CompaniesTax and VAT No. 00818570012
R.E.A. No. 511469
A company subject to management and coordination
by Unipol Gruppo Finanziario S.p.A.,entered in Section I of the Insurance
and Reinsurance Companies Listat No. 1.00006
and a member of theUnipol Insurance Group,
entered in the Register of Insurance Groups – No. 046
www.unipolsai.com www.unipolsai.it

UnipolSai Assicurazioni S.p.A.Registered officeVia Stalingrado, 4540128 Bologna (Italy)
www.unipolsai.comwww.unipolsai.it