Embed Size (px)
Citation preview
ConocoPhillips test results and data analysis
Brian J. Anderson Associate Professor, Chemical Engineering, West Virginia University
Methane Hydrate Advisory Committee Meeting, Thursday, June 06, 2013

• North Slope reservoir‐scale field trial to evaluate CO2/CH4 exchange
• Short‐term test to demonstrate concepts at larger‐than‐lab scale
• Validate exchange mechanism results from laboratory work – Confirm injectivity into naturally occurring methane
hydrates
– Confirm methane release without production of water or sand
– Obtain reaction rate data to facilitate reservoir‐scale modeling
• Demonstrate stable production of natural gas hydrates by depressurization
Overall Iġnik Sikumi Project Goals
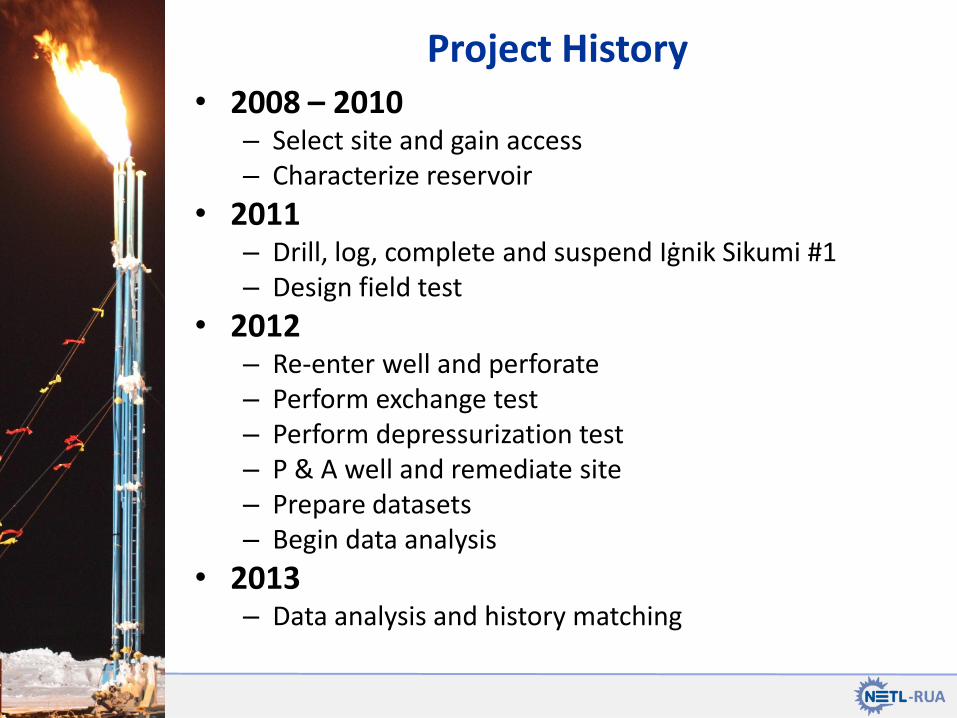
• 2008 – 2010 – Select site and gain access – Characterize reservoir
• 2011 – Drill, log, complete and suspend Iġnik Sikumi #1 – Design field test
• 2012 – Re-enter well and perforate – Perform exchange test – Perform depressurization test – P & A well and remediate site – Prepare datasets – Begin data analysis
• 2013 – Data analysis and history matching
Project History

• Data Correction/Reconsolidation in Progress – Outliers/spikes removed – Time stamps for each source corrected – GC data reprocessed – Three DTS data sets obtained
• Un‐normalized and 2 types of normalization
– Created 1 and 5 min time average datasets – Adding corrections for dead volumes/wellbore storage
• Path Forward – Perform material balance of test – Injectivity analysis, using simulation
• Infer hydrate saturation changes
– Production analysis using cell‐to‐cell model • Gas phase composition history match
– Issue final database and report – DOE workshop
July 2012 Status

Capillary-bound water
Clay-bound water
Movable water
39% Φavg
“C” Sand
25% SWavg
41% movable

Tem
per
atu
re
Tem
per
atu
re c
han
ge si
nce
6F
eb2
01
2
Initial Period before any well work Temperature linear with geothermal gradient (~1.79oF/100ft), Temperature change ~0
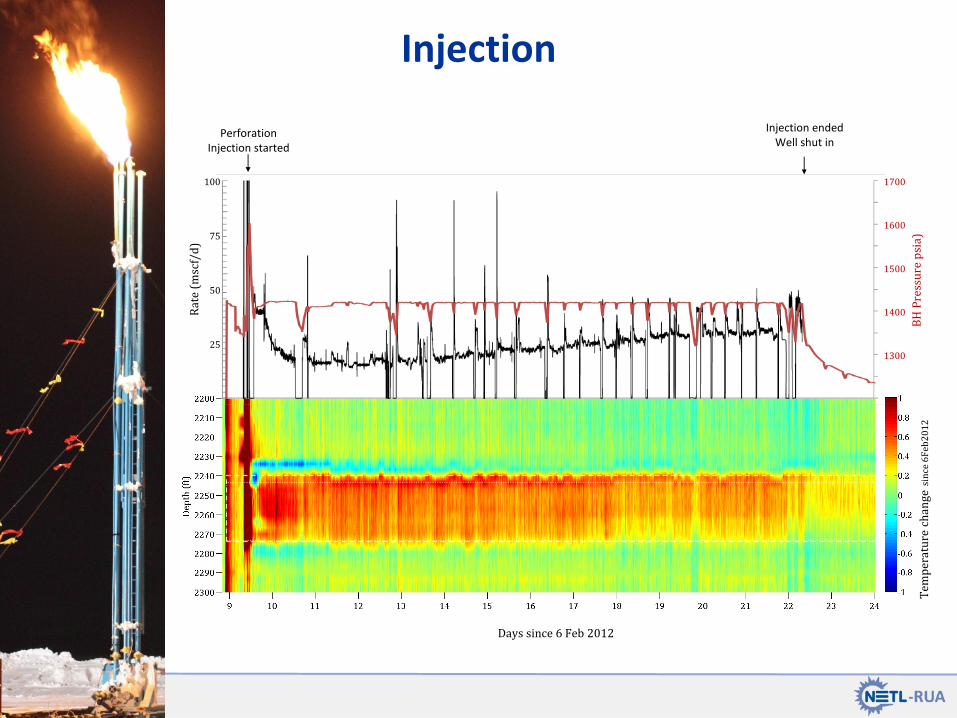
Injection
Tem
per
atu
re c
han
gesi
nce
6F
eb2
01
2
Days since 6 Feb 2012
100
75
50
25
Rat
e (m
scf/
d)
PerforationInjection started
Injection endedWell shut in
1700
1300
1500
1600
1400
BH
Pre
ssu
re p
sia)

Overall Production – Gas rates, Pressure, and Temperature

Ignik Sikumi #1 Production

Flowback - Production Period #1
Days since 6 Feb 2012
Tem
per
atu
re c
han
gesi
nce
6F
eb2
01
2
100
50
Rat
e (m
scf/
d)
700
900
1000
800
BH
Pre
ssu
re p
sia)
600
1100150
Well openedUnassisted flow
Well shut-inJet pump installed
Well shut-inReplace sep. valve
Well shut-inFlare line freeze
Well shut-inReplace jet pump
Well shut-inReplace sep. valve

Tem
per
atu
re c
han
gesi
nce
6F
eb2
01
2T
emp
erat
ure
ch
ange
sin
ce 6
Feb
20
12
Days since 6 Feb 2012
50
25
Rat
e (m
scf/
d)
Well openedJet pump #2
Shut-inGlycol injected below jet pump End of production procedure started
800
300
400
600
700
500
BH
Pre
ssu
re p
sia)
Flowback - Production Period #2

Successful injection of CO2 mixture into hydrate reservoir
Methane produced both above / below CH4-stability
pressure CO2 was retained in the reservoir compared with N2
Indicates the possibility of CO2 exchange
Depressurization sustained below CH4-stability pressure Steady increase in production rate Over 850 mscf (24,000 scm) of CH4 produced in total Low BHP achieved (~250 psi)
Solids production significant
Evidence for heterogeneous injection / production
Summary Observations
12

• Diagrams of the operations included – PI&D’s + dead volumes of surface equipment and well
• Master Variable List – Where to go for complete info on any recorded variable
• e.g., what instrument recorded the data, calibration, etc
• Supporting Data Document – Where to go for notes on calculations and data corrections
• Operation Event Log – Where to go to see what was happening at every step of the
test
• All raw data in MySQL and CSV format
• All final data available in MS SQL database format, CSV, Matlab – Clean, 1 min averaged, and 5 min averaged data
Database Summary
13
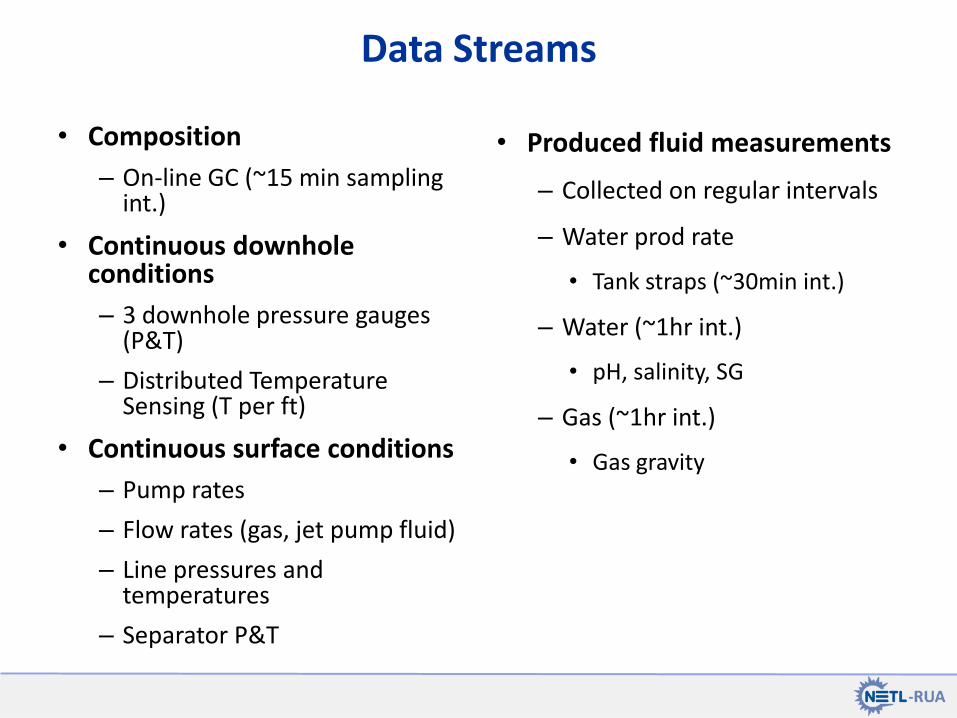
Data Streams
• Composition
– On-line GC (~15 min sampling int.)
• Continuous downhole conditions
– 3 downhole pressure gauges (P&T)
– Distributed Temperature Sensing (T per ft)
• Continuous surface conditions
– Pump rates
– Flow rates (gas, jet pump fluid)
– Line pressures and temperatures
– Separator P&T
• Produced fluid measurements
– Collected on regular intervals
– Water prod rate
• Tank straps (~30min int.)
– Water (~1hr int.)
• pH, salinity, SG
– Gas (~1hr int.)
• Gas gravity

Database Folder
15

• Adiabatic CTC Model (ConocoPhillips)
– Cell Volume (3.5 ft), SH = 65%, Pi = 1000 psi, Ti = 40.5 F
• Solids production
• Heterogeneous production
• History-match simulations of the Iġnik Sikumi field test with newly-developed Mix3HRS software
• Complex pressure, temperature, and composition history
– CO2+N2 injected into a CH4 reservoir with all 3 gases produced
– Competing thermodynamics for hydrate formation and dissociation in the reservoir
Modeling and Simulation Efforts
Hydrate
Saturation
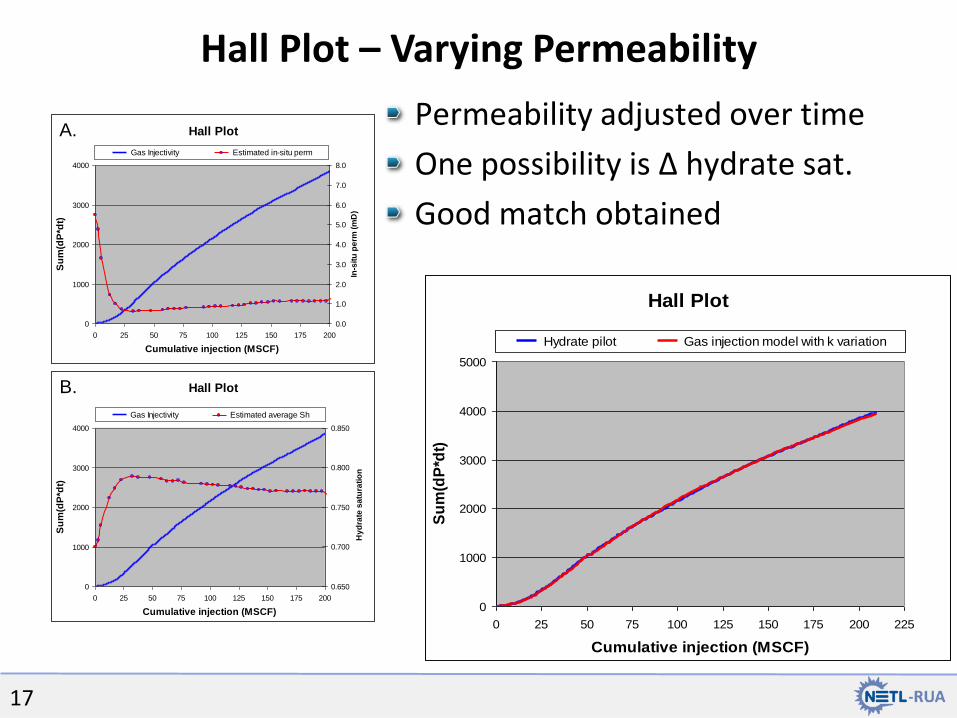
Hall Plot – Varying Permeability
17
Hall Plot
0
1000
2000
3000
4000
5000
0 25 50 75 100 125 150 175 200 225
Cumulative injection (MSCF)
Su
m(d
P*d
t)
Hydrate pilot Gas injection model with k variation
Hall Plot
0
1000
2000
3000
4000
0 25 50 75 100 125 150 175 200
Cumulative injection (MSCF)
Su
m(d
P*d
t)
0.0
1.0
2.0
3.0
4.0
5.0
6.0
7.0
8.0
In-s
itu
pe
rm (
mD
)
Gas Injectivity Estimated in-situ perm
Hall Plot
0
1000
2000
3000
4000
0 25 50 75 100 125 150 175 200
Cumulative injection (MSCF)
Su
m(d
P*d
t)
0.650
0.700
0.750
0.800
0.850
Hy
dra
te s
atu
rati
on
Gas Injectivity Estimated average Sh
A.
B.
Permeability adjusted over time
One possibility is Δ hydrate sat.
Good match obtained
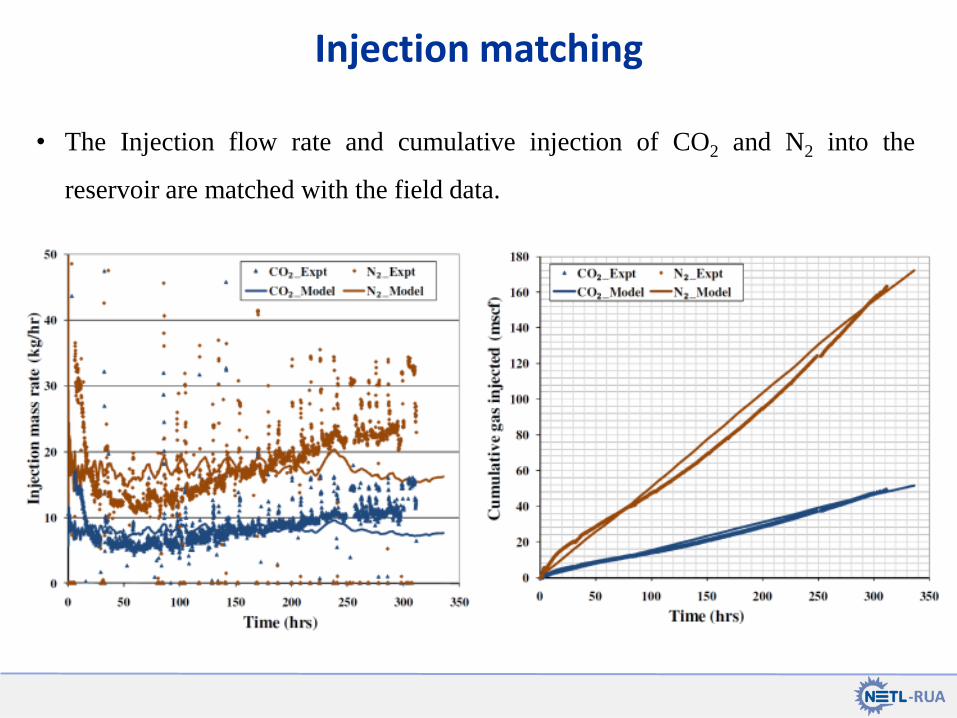
• The Injection flow rate and cumulative injection of CO2 and N2 into the
reservoir are matched with the field data.
Injection matching

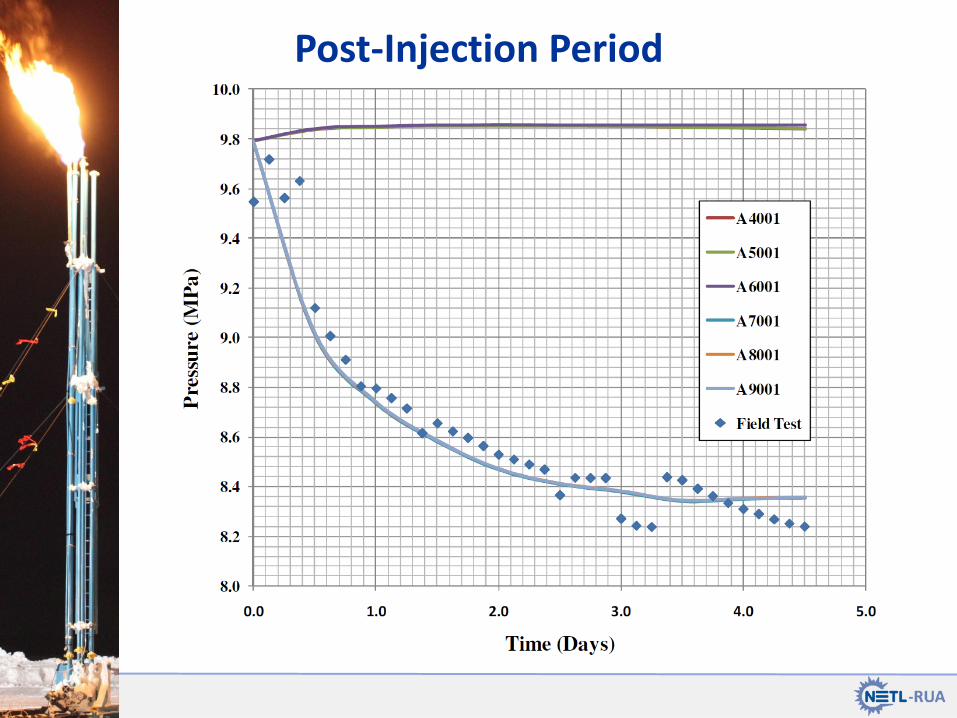
Post-Injection Period
Tem
per
atu
re c
han
ge si
nce
6F
eb2
01
2
Days since 6 Feb 2012
BH
Pre
ssu
re p
sia)
1340
1220
1300
1260
Post-Injection Period

Production
0
200
400
600
800
1000
1200
1400
0
200
400
600
800
1000
1200
1400
4-Mar 8-Mar 12-Mar 16-Mar 20-Mar 24-Mar 28-Mar 1-Apr 5-Apr 9-Apr
Cu
mu
lati
ve P
rod
uce
d G
as (m
scf)
an
d W
ate
r (b
bl)
Do
wn
ho
le P
ress
ure
(p
sia)
Unassisted Flowback
4-Mar 14:00 – 6-Mar 00:00
Jet-Pump Flowback #1
7-Mar 04:00 – 13-Mar 23:30
Jet-Pump Flowback #2
15-Mar 18:52 – 18-Mar 10:40
Jet-Pump Flowback #3
23-Mar 06:20 – 11-Apr 00:00
CH4 Hydrate Stability P
(based on downhole T)
0
200
400
600
800
1000
1200
1400
0
200
400
600
800
1000
1200
1400
4-Mar 8-Mar 12-Mar 16-Mar 20-Mar 24-Mar 28-Mar 1-Apr 5-Apr 9-Apr
Cu
mu
lati
ve P
rod
uce
d G
as (m
scf)
an
d W
ate
r (b
bl)
Do
wn
ho
le P
ress
ure
(p
sia)
Unassisted Flowback
4-Mar 14:00 – 6-Mar 00:00
Jet-Pump Flowback #1
7-Mar 04:00 – 13-Mar 23:30
Jet-Pump Flowback #2
15-Mar 18:52 – 18-Mar 10:40
Jet-Pump Flowback #3
23-Mar 06:20 – 11-Apr 00:00
CH4 Hydrate Stability P
(based on downhole T)
First 200 mscf produced above CH4 Hydrate stability conditions
Cumulative Gas
Cumulative
Water

More CH4 produced than Equilibrium Model predicts.
CH4 composition in produced gas
0
20
40
60
80
100
0 100 200 300 400 500 600 700 800 900
Cumulative produced gas (MSCF)
CH
4 c
om
po
sit
ion
Pilot 3.5 ft tank
Model predicts exchange significantly depletes CH4 from the near well region.
Pi = 1000 psia Shi = 65 % Ti = 40.5 F
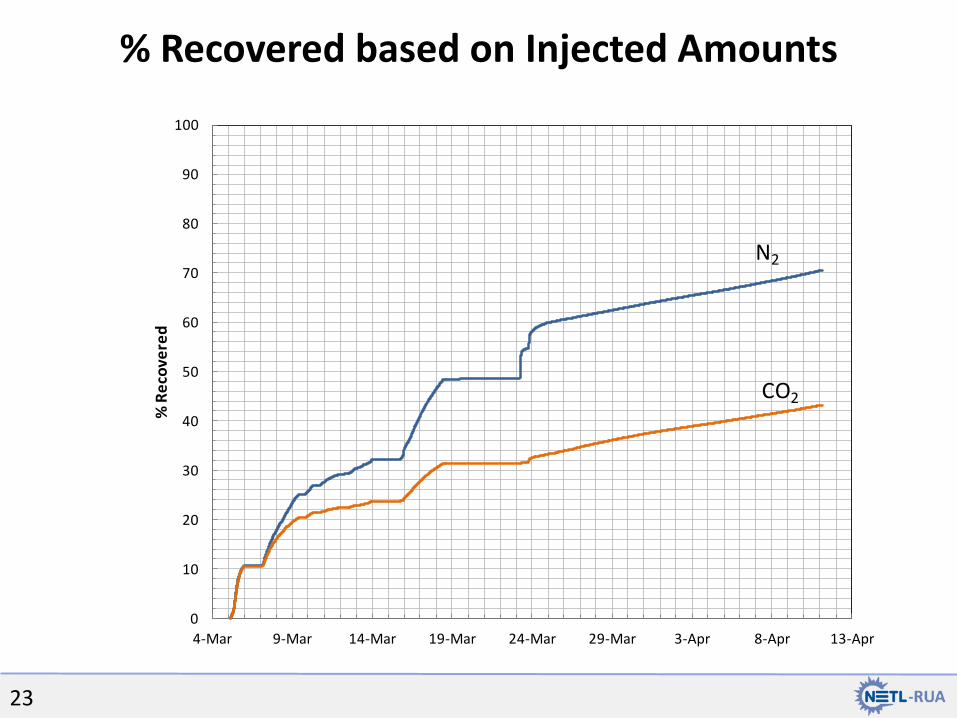
% Recovered based on Injected Amounts
23
0
10
20
30
40
50
60
70
80
90
100
4-Mar 9-Mar 14-Mar 19-Mar 24-Mar 29-Mar 3-Apr 8-Apr 13-Apr
% R
eco
vere
d
N2
CO2
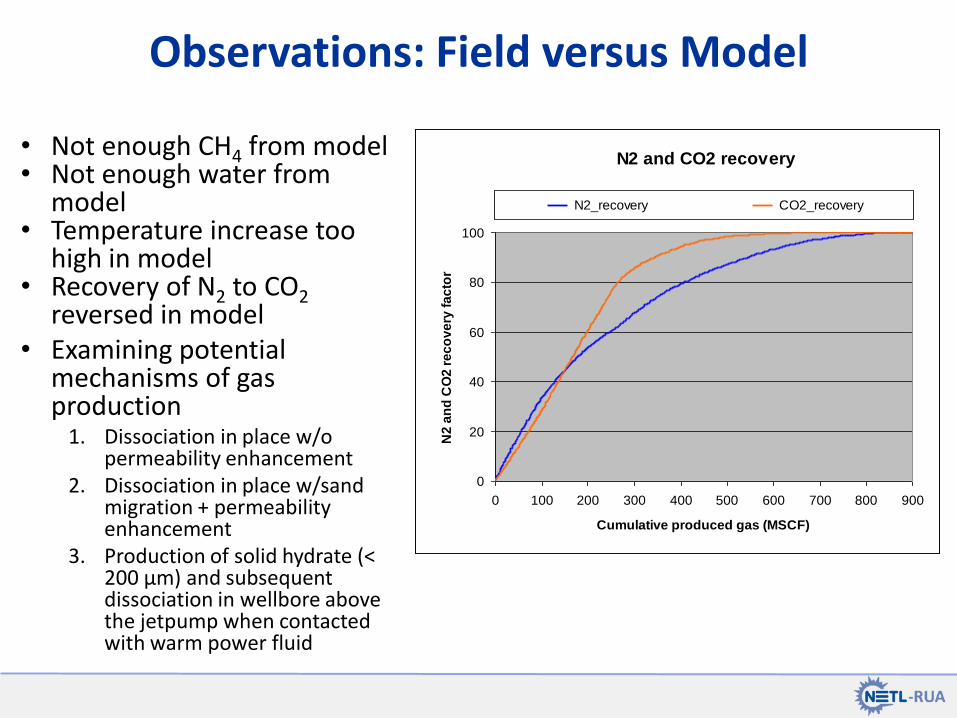
Observations: Field versus Model
• Not enough CH4 from model • Not enough water from
model • Temperature increase too
high in model • Recovery of N2 to CO2
reversed in model • Examining potential
mechanisms of gas production
1. Dissociation in place w/o permeability enhancement
2. Dissociation in place w/sand migration + permeability enhancement
3. Production of solid hydrate (< 200 μm) and subsequent dissociation in wellbore above the jetpump when contacted with warm power fluid
N2 and CO2 recovery
0
20
40
60
80
100
0 100 200 300 400 500 600 700 800 900
Cumulative produced gas (MSCF)
N2
an
d C
O2
re
co
ve
ry f
ac
tor
N2_recovery CO2_recovery

Sand Production
25
0
10
20
30
40
50
60
70
5-Mar 10-Mar 15-Mar 20-Mar 25-Mar 30-Mar 4-Apr 9-Apr
Esti
mat
ed
San
d P
rod
uct
ion
(bb
l)
Jet-Pump Flowback #1
7-Mar 04:00 – 13-Mar 23:30
Jet-Pump Flowback #2
15-Mar 18:52 – 18-Mar 10:40
Jet-Pump Flowback #3
23-Mar 06:20 – 11-Apr 00:00

From: Kurihara, et al., Proceedings of the 7th International Conference on Gas Hydrates (ICGH 2011), Edinburgh, Scotland,
United Kingdom, July 17-21, 2011
Figure 17 Schemata of reservoir performances through 2007 and 2008 tests inferred from history matching simulation
Mechanism 2 – Experience at Mallik

Mechanism 2
From: Kurihara, et al., Proceedings of the 7th International Conference on Gas Hydrates (ICGH 2011),
Edinburgh, Scotland, United Kingdom, July 17-21, 2011
Figure 11 Concept expressing overall grid block permeability as a function of MH saturation with
growth of high permeability conduits
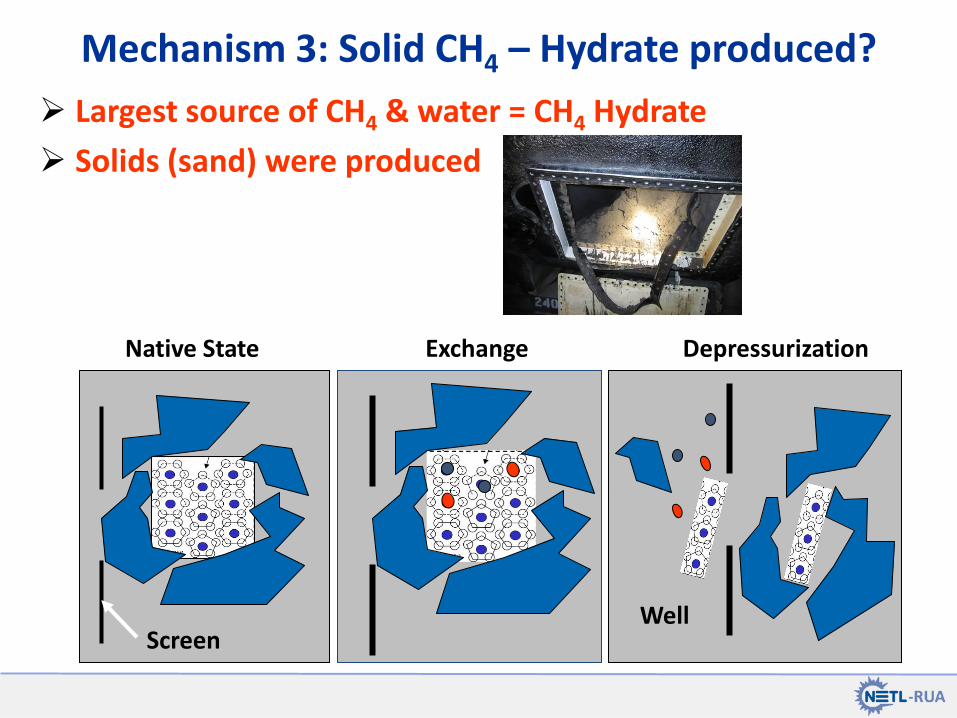
Mechanism 3: Solid CH4 – Hydrate produced?
CH4 Hydrate - CO2(l)
contact
Local
disassociation of
CH4 Hydrate
Reformation of
mixed CO2-CH4
Hydrate
CH4 Hydrate - CO2(l)
contact
Local
disassociation of
CH4 Hydrate
Reformation of
mixed CO2-CH4
Hydrate CH4 Hydrate - CO2(l)
contact
Local
disassociation of
CH4 Hydrate
Reformation of
mixed CO2-CH4
Hydrate
CH4 Hydrate - CO2(l)
contact
Local
disassociation of
CH4 Hydrate
Reformation of
mixed CO2-CH4
Hydrate
CH4 Hydrate - CO
2(l) contactLocal disassociation of CH
4 Hydrate
Reformation of mixed CO2-CH
4Hydrate
CH4 Hydrate - CO
2(l) contactLocal disassociation of CH
4 Hydrate
Reformation of mixed CO2-CH
4Hydrate
CH4 Hydrate - CO
2(l) contactLocal disassociation of CH
4 Hydrate
Reformation of mixed CO2-CH
4Hydrate
CH4 Hydrate - CO
2(l) contactLocal disassociation of CH
4 Hydrate
Reformation of mixed CO2-CH
4Hydrate
Native State Exchange Depressurization
Well Screen
Largest source of CH4 & water = CH4 Hydrate
Solids (sand) were produced

Mechanism 3: CTC Model Solids Recombination – CH4 Match
CH4 composition in produced gas
0
20
40
60
80
100
0 100 200 300 400 500 600 700 800 900
Cumulative produced gas (MSCF)
CH
4 c
om
po
sit
ion
Field data Hypothesis

Mechanism 3: CTC Model Solids Recombination – Recovery
CO2 and N2 recovery factor
0
20
40
60
80
100
0 100 200 300 400 500 600 700 800 900
Cumulative produced gas (MSCF)
CO
2 a
nd
N2
re
co
ve
ry f
ac
tor
N2 CO2

Mechanism 3 • Method
– Use EXPRO water rate and %Sed measurements
– Scale sediment rates to match observed cumulative sand production
• Worst-case Assumptions
– All sand produced had associated CH4 hydrate that was produced
– SH values from CMR log
• Gives upper limit to CH4 from solids
0
50
100
150
200
250
300
350
400
450
500
550
0 100 200 300 400 500 600
Cu
m. C
H4
gas
pro
du
ced
(m
scf)
Time (Hours since 3/4/2012 14:00)
Measured Cumulative CH₄ Production (mcf)
Max Cumulative CH₄ Prod by solids
0
4
8
% S
edim
ent
0
500
1000
1500
2000
Wat
er R
ate
(bb
l/d
ay)

• Mechanism 2
– Dissociation in place w/sand migration + permeability enhancement
• Mechanism 3
– Production of solid hydrate (< 200 μm) and subsequent dissociation in wellbore above the jetpump when contacted with warm power fluid
• Reservoir heterogeneity
Field trial likely a combination of mechanisms
CH4 Hydrate - CO
2(l) contactLocal disassociation of CH
4 Hydrate
Reformation of mixed CO2-CH
4Hydrate
CH4 Hydrate - CO
2(l) contactLocal disassociation of CH
4 Hydrate
Reformation of mixed CO2-CH
4Hydrate
CH4 Hydrate - CO
2(l) contactLocal disassociation of CH
4 Hydrate
Reformation of mixed CO2-CH
4Hydrate
CH4 Hydrate - CO
2(l) contactLocal disassociation of CH
4 Hydrate
Reformation of mixed CO2-CH
4Hydrate
Well

Tracer … Argument for Heterogeneity?
0
10
20
30
40
50
60
70
80
90
4-Mar 9-Mar 14-Mar 19-Mar 24-Mar 29-Mar 3-Apr 8-Apr 13-Apr
% T
race
r R
eco
very
R114
SF6
Jet-Pump Flowback #1
7-Mar 04:00 – 13-Mar 23:30
Jet-Pump Flowback #2
15-Mar 18:52 – 18-Mar 10:40
Jet-Pump Flowback #3
23-Mar 06:20 – 11-Apr 00:00
Unassisted Flowback
4-Mar 14:00 – 6-Mar 00:00
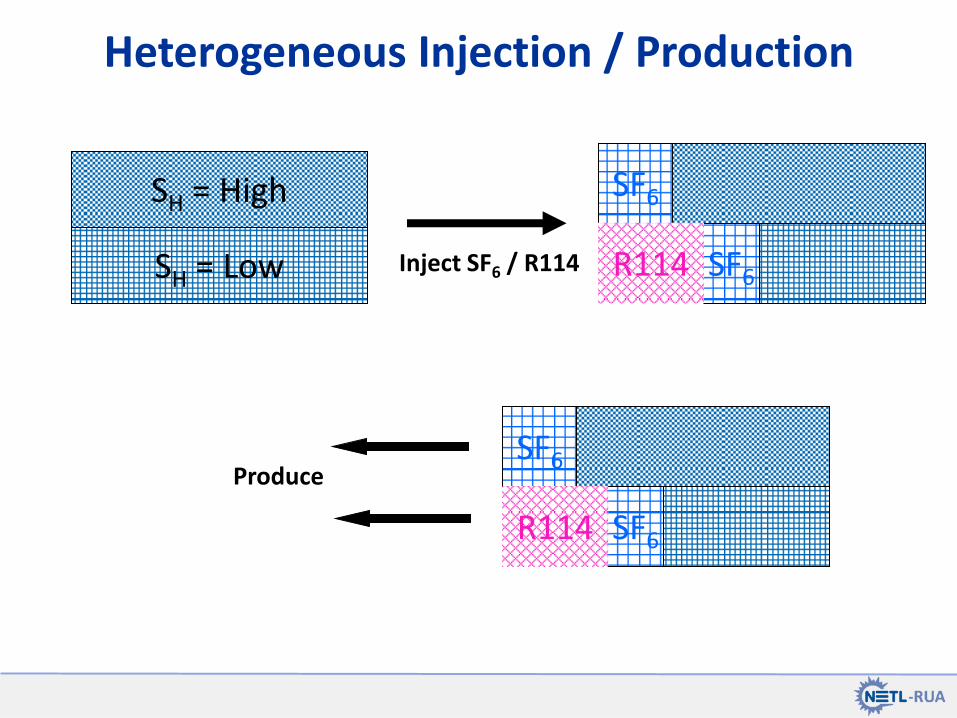
Heterogeneous Injection / Production
SH = High
SH = Low
SF6
SF6 R114 Inject SF6 / R114
SF6
SF6 R114
Produce

Tem
per
atu
re c
han
gesi
nce
6F
eb2
01
2
Days since 6 Feb 2012
100
75
50
25
Rat
e (m
scf/
d)
PerforationInjection started
1700
1300
1500
1600
1400
BH
Pre
ssu
re p
sia)
0.0 0.2 0.4 0.6 0.8 1.0
Saturation (v/v)
CMR Free FluidBound FluidNPORHydrate Saturation
Heterogeneous Injection

Tem
per
atu
re c
han
gesi
nce
6F
eb2
01
2
Days since 6 Feb 2012
Tem
per
atu
re c
han
gesi
nce
6F
eb2
01
2
150
100
50Rat
e (m
scf/
d)
1100
700
900
1000
800
BH
Pre
ssu
re p
sia)
600
Flowback - Production Period #1
0.0 0.5 1.0Hydrate Saturation
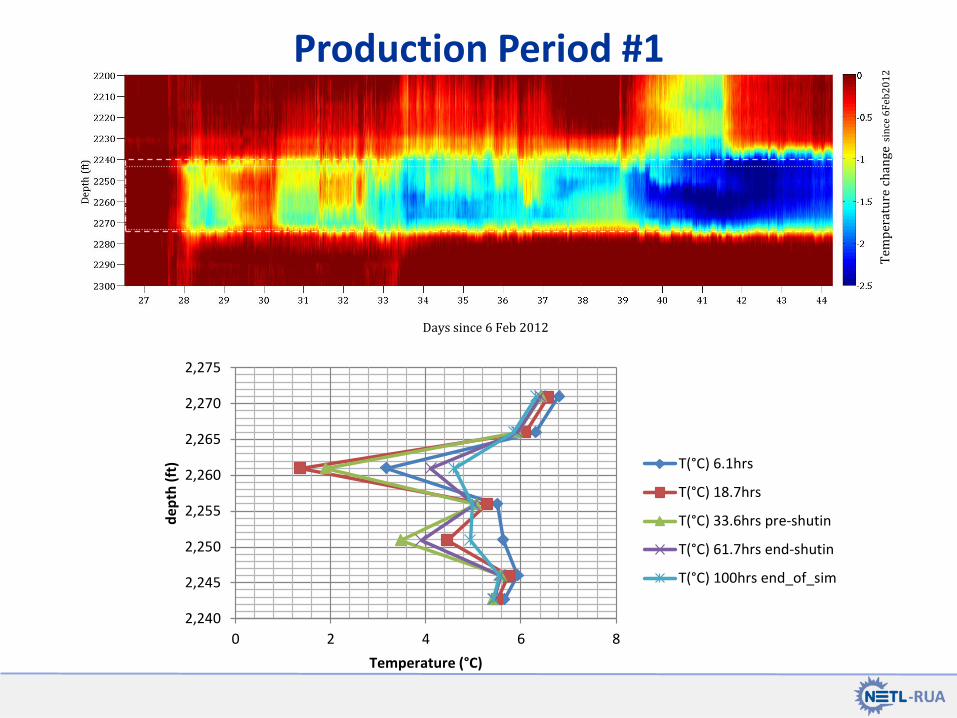
Days since 6 Feb 2012
Tem
per
atu
re c
han
ge si
nce
6F
eb2
01
2
2,240
2,245
2,250
2,255
2,260
2,265
2,270
2,275
0 2 4 6 8
de
pth
(ft
)
Temperature (°C)
T(°C) 6.1hrs
T(°C) 18.7hrs
T(°C) 33.6hrs pre-shutin
T(°C) 61.7hrs end-shutin
T(°C) 100hrs end_of_sim
Production Period #1
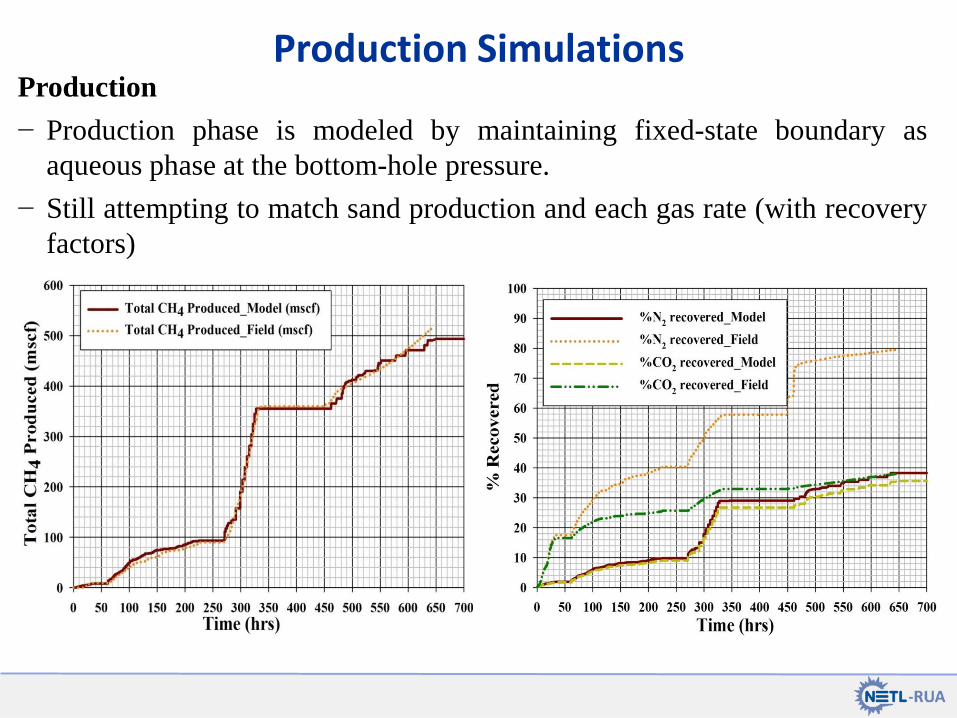
Production Simulations Production
− Production phase is modeled by maintaining fixed-state boundary as
aqueous phase at the bottom-hole pressure.
− Still attempting to match sand production and each gas rate (with recovery
factors)
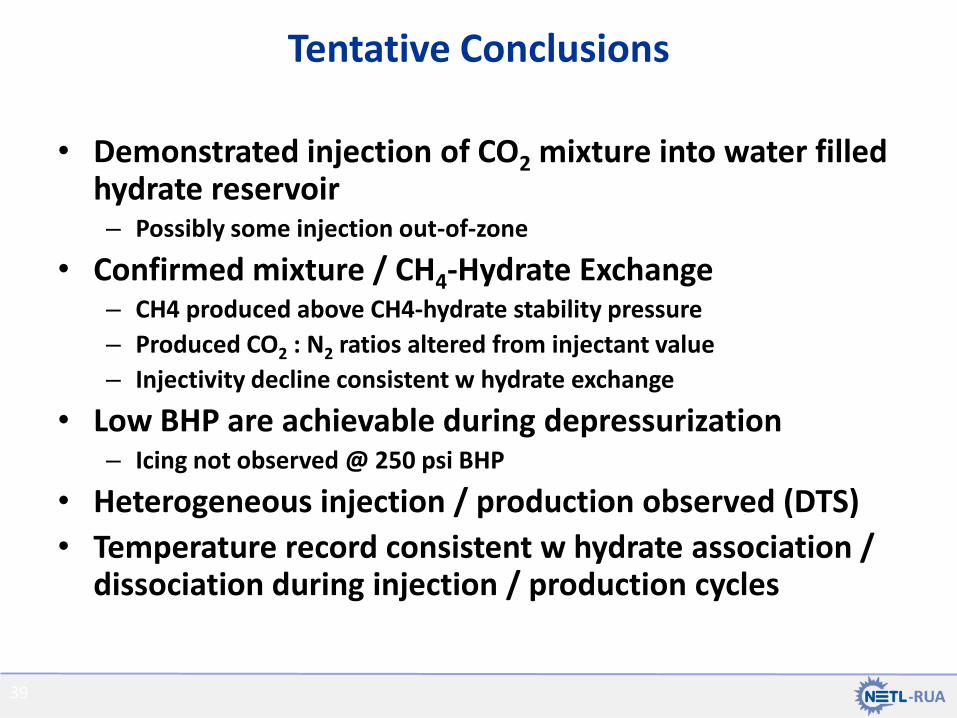
• Demonstrated injection of CO2 mixture into water filled hydrate reservoir – Possibly some injection out-of-zone
• Confirmed mixture / CH4-Hydrate Exchange – CH4 produced above CH4-hydrate stability pressure
– Produced CO2 : N2 ratios altered from injectant value
– Injectivity decline consistent w hydrate exchange
• Low BHP are achievable during depressurization – Icing not observed @ 250 psi BHP
• Heterogeneous injection / production observed (DTS)
• Temperature record consistent w hydrate association / dissociation during injection / production cycles
Tentative Conclusions
39

• Datasets and ConocoPhillips project reports can be downloaded from the NETL website.
– http://www.netl.doe.gov/technologies/oil-gas/FutureSupply/MethaneHydrates/rd-program/ANSWell/co2_ch4exchange.html
– google “ignik sikumi” or see the announcement in the latest Fire in the Ice
• Organizing a problem for the Code Comparison Project on the Ignik Sikumi Results
• DOE has previously facilitated creation of Special Volumes in peer-reviewed journals to consolidate reporting
Going Forward

Questions?

Backup Slides – do not print

CPAI - Iġnik Sikumi #1 and PBU L-pad

“E sand:” 31ft hydrate
Sagavanirktok “F Sand:” Ice-filled
Target: Upper C Sand
base permafrost
“D sand:” 49ft hydrate
“C sand:” 67ft hydrate
Iġnik Sikumi #1
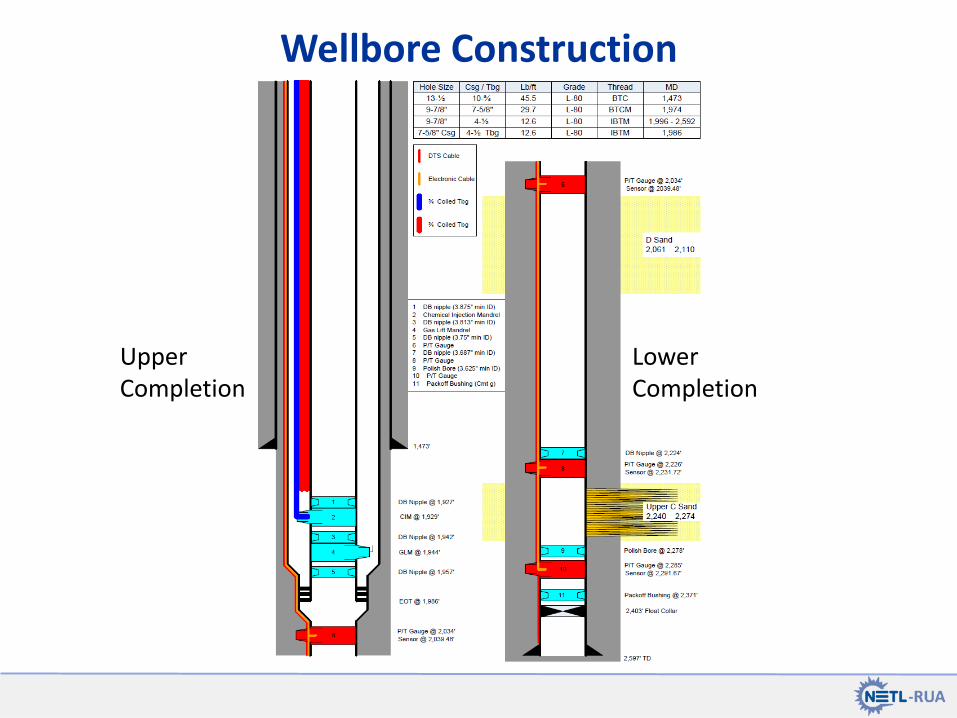
Wellbore Construction
Upper Completion
Lower Completion

Tem
per
atu
re c
han
gesi
nce
6F
eb2
01
2
Days since 6 Feb 2012
Tem
per
atu
re c
han
gesi
nce
6F
eb2
01
2
150
100
50Rat
e (m
scf/
d)
1100
700
900
1000
800
BH
Pre
ssu
re p
sia)
600
Flowback - Production Period #1

− Two data files are incorporated into
Teq = f(P,y1,y2) and Peq = f(T,y1,y2)
where T is temperature ( C), P is
pressure (MPa), y1 is CH4 composition
in gas phase and y2 is CO2 composition
in gas phase (yN2 is not independent)
• Two new primary variables for each phase
state and two governing equations are added
for the binary (CO2) and ternary (N2) gases
• Gas-Hydrate (GsH) system was added to
consider the possibility of converting all
available free water to form hydrate with
injected gas
• The phase equilibrium data for a three-component (CH4-CO2-N2) gas hydrate are incorporated
using tri-linear interpolation, where in the code can interpolate data from a table containing
stability pressure, temperature and composition of the hydrate phase
– Based on predictions using our statistical mechanics model that has been validated against
experimental data for 1-, 2-, and 3-component gas mixtures with low error
Prediction of stability pressure for the CH4-CO2 mixed hydrate
system
Ternary Hydrate Modeling