Embed Size (px)
Citation preview

Connecting the Candidates:Consultant Networks and the Diffusion of Campaign
Strategy in American Congressional Elections
Brendan NyhanDept. of GovernmentDartmouth College
Jacob M. MontgomeryDept. of Political Science
Washington University in St. [email protected]
June 9, 2014
ABSTRACT
Modern American political campaigns are typically conceptualized as “candidate-centered” and treated as conditionally independent in quantitative analyses. Inreality, however, these campaigns are linked by professional consulting firms,who are important agents of campaign strategy diffusion within the extendedparty networks of the contemporary era. To test our hypothesis that consultantsdisseminate campaign strategies among their clients, we analyze new data onU.S. House elections derived from Federal Election Commission records. Usingspatial autoregressive models, we find that candidates who share consultants aremore likely to use similar campaign strategies than we would otherwise expectconditional on numerous explanatory variables. These results, which largelywithstand an extensive series of robustness and falsification tests, suggest thatconsultants play a key role in diffusing strategies among Congressional cam-paigns.
Authors are listed in reverse alphabetic order. We thank Tessa Baizer, Jeremy Kreisberg, Callie Lambert, BorisLitvin, and Joy Wilke for exceptional research assistance; Michael Heaney for providing support for their work;the editor, the anonymous reviewers, Sean Cain, Rick Hall, Michael Heaney, Russell Funk, Hans Hassell, JustinKirkland, Seth Masket, Jon Rogowski, and audiences at the Political Networks conference, the University ofMichigan, Dartmouth College, and the MIT American Politics conference for helpful comments; and AdamBonica, James N. Druckman, Martin J. Kifer, Michael Parkin, Gary Jacobson, and the Center for ResponsivePolitics for generously sharing their data. Replication data and code will be made available upon publicationin the AJPS Dataverse Archive (http://thedata.harvard.edu/dvn/dv/ajps).

1. INTRODUCTION
Contemporary American political campaigns are typically conceptualized as “candidate-
centered.” Most quantitative analyses treat campaigns as conditionally independent and
identically distributed (i.i.d.) events (e.g., Canes-Wrone, Brady and Cogan 2002), implic-
itly assuming that what happens in one electoral district has no effect on the others. In this
framework, election outcomes, campaign strategies, and candidate positions are assumed to
be determined by candidate- and district-specific characteristics in isolation and the role of
party organizations, allies, and co-partisan candidates is largely ignored (beyond, perhaps, a
control variable for party affiliation).
It is true, of course, that formal party organizations play a more limited role in U.S.
campaigns than in many advanced democracies, but this stylized fact should not blind us
to the influence of what Koger, Masket and Noel (2009) refer to as the “extended party
network.” Numerous actors and institutions ranging from campaign staff to independent
expenditure groups advance party goals in the electoral arena, marshaling support from co-
partisans, transmitting information and ideas across districts, and generally supporting the
party in its central task of electing party-affiliated candidates (Aldrich 2011).
In this article, we break with the traditional approach to researching campaign behavior
and focus on a key component of these party networks — professional campaign consult-
ing firms. While scholars have long recognized that consulting firms are central players in
contemporary U.S. campaigns, their broader role in the political system remains poorly un-
derstood. With a few notable exceptions (e.g., Lathrop 2003; Herrnson 2009; Johnson 2011),
scholarship on consultants has not advanced far since Thurber (1998) labeled it “a subfield
in search of a theory.” Studies have provided descriptive analyses of consultant practices
or examined the correlates of consultant use at the campaign level, but few have produced
general insights into the function of consultants in parties or elections.
We argue that consultants are important agents of campaign strategy diffusion within
1
the extended party network, playing a key role in the process of “organized trial and error”
by which ideas and approaches are developed and spread within parties (Schlesinger 1984,
390). While party organizations like the House and Senate campaign committees provide
assistance in this process, their influence is limited by logistical obstacles and legal restric-
tions on fundraising and coordination. In the absence of party-directed campaigns, we argue
that political consultants function as a mechanism for the diffusion and coordination of cam-
paign strategies among a party’s candidates. By proposing strategies that have worked for
one or more of their candidates to other clients, they create a more unified and effective
communication strategy and brand image in a relatively decentralized fashion.
We provide support for these claims by analyzing a uniquely detailed dataset of campaign
expenditures by U.S. House of Representatives candidates on consulting services, which al-
lows us to construct party networks of candidates who share one or more consultants and esti-
mate a series of spatial autoregressive models. Using the most prominent measures of general
campaign strategy available (Druckman, Kifer and Parkin 2009), we find that the strategies
of candidates who share consultants are more similar than we would otherwise expect condi-
tional on numerous relevant explanatory variables, especially amongst non-incumbents and
plausible candidates in unfavorable districts. These results, which are generally robust to
multiple model specifications and falsification tests, suggest that consultants play a key role
in diffusing strategies among Congressional campaigns.
2. THE ROLE OF CONSULTANTS IN U.S. PARTIES
Contemporary American political parties face a difficult organizational dilemma. Each affil-
iated candidate must independently organize what is essentially a medium-sized business in
the months leading up to Election Day and successfully carry out a series of complex logisti-
cal, organizational, and strategic tasks. To be competitive, campaigns must raise hundreds of
thousands (or millions) of dollars; conduct polls; develop a message; field mail, TV, and/or
2

radio ads; and much more. Executing these tasks successfully requires not only financial
resources, but also experience, technical expertise, and an understanding of campaign strat-
egy that is beyond the capacities of most candidates and their campaign staff. Moreover,
parties have strong political incentives for affiliated candidates to maintain some level of
message and strategy coordination. How can parties help candidates overcome these orga-
nizational obstacles and win election to public office while facilitating enough coordination
across districts to maintain an effective party brand?
2.1. Consultants as agents of intra-party strategy diffusion
One approach to this dilemma is to organize parties like hierarchically structured firms. For
instance, the House and Senate campaign committees of the major parties recruit candidates
in certain races and conduct independent expenditures on their behalf. However, the intense
time pressures of modern campaigns and the difficulty of coordinating activity across hun-
dreds of House and Senate races have precluded the widespread adoption of such a top-down
approach.1 These obstacles are exacerbated by campaign finance laws specifically aimed at
curtailing centrally-directed party campaigns. Thus, although formal party organizations
exist, their influence and capacity has lagged behind the demands of the contemporary cam-
paign environment (Gibson et al. 1983; Aldrich 2000).
In response to the growing demand for organizational capacity in the face of these insti-
tutional and legal barriers, American parties have instead evolved alternative mechanisms to
aid party-affiliated candidates, relying on actors at the edges of the formal party organiza-
tions to provide strategic advice, services, and expertise to candidates while facilitating some
limited degree of coordination (Schlesinger 1984). In particular, formal party organizations
guide candidates to reputable consulting firms and then provide financial support rather than
providing those services directly (Herrnson 1986; Kolodny 2000; Dulio 2004). As Aldrich1The parties also employ consultants, but these are outside the scope of our study (Magleby 2010).
3

(2011, 272) writes, “Parties have come to believe in the mantra, ‘Hire enough professionals
... and provide them with millions of dollars, and they will find a dazzling array of ways to
employ their expertise and money.”’ As a result, consulting firms now play a significant role
in almost every credible campaign (Thurber and Nelson 1995; Johnson 2001, 2002).
In addition to providing technical expertise and advice, consultants are especially valu-
able in spreading new ideas and approaches from one candidate or campaign to another. It is
useful to think of consultants as bridging structural holes in the flow of information among
campaigns within a party (Burt 1992). Informally, structural holes exist when information is
not fully shared between disconnected individuals or groups in a network. Consultants act as
information brokers, taking the best ideas from one candidate or campaign and bringing them
to another in the same way as the most effective corporate managers or other leaders (Burt
2004). Rather than passing through formalized channels, strategic insights instead spread
between campaigns through networks of candidate-consultant relationships.2 This process
helps the party maintain a relatively unified brand and communication strategy while allow-
ing for innovations to surface from within.
Our approach differs from prior research on consultants in two respects. First, previ-
ous studies have focused on exploring the circumstances under which individual campaigns
and candidates adopt specific tactics such as negative advertising (e.g., Francia and Herrnson
2007; Grossman 2012). We take a more general approach, focusing on the role of consultants
in formulating broad campaign strategies. Consultants help decide whether, for instance, to
focus on issues that are “owned” by their party (Petrocik 1996), whether to prime certain
issues or positions rather than others (Miller and Krosnick 1996), and whether to introduce
additional dimensions of conflict (Riker 1986). These choices in turn influence public per-
ceptions of and voter support for client candidates at the district level as well as the issue
positions that those candidates adopt, which will (cumulatively) help to shape party reputa-
tions and platforms at the national level. Our findings therefore have broad implications for2Unfortunately, we cannot directly test for structural holes in our empirical analysis because we study a
projected network of candidates with links representing shared consultant ties (e.g., Opsahl 2013).
4

scholarly understanding of campaigns, political communication, and party competition.
Second, the literature on consultants has not tested whether strategies diffuse between
campaigns who employ the same firm(s). We do so by identifying a set of relationships
(consultants) that link the units in our data (Congressional candidates) to construct a network.
However, we go beyond just describing the network’s properties and instead test whether the
behavior of interest (campaign strategy) diffuses via those ties.
2.2. Consultants and parties
Our view of consultants and their role in campaign strategy diffusion is consistent with a
growing body of theoretical and empirical research on informal ties among members of con-
temporary parties and their allies.3 However, the premise that consulting firms are influential
players in parties sharply contrasts with several past studies arguing that the growing use
of consultants is either a worrying symptom or significant cause of candidate-centered elec-
tions, weak party organization, and the increasing influence of “party-rivaling” organizations
such as PACs (Sabato 1981; Shea 1996; see also Magleby, Patterson and Thurber 2000). We
believe that this account takes too narrow a view of party strength. Contemporary parties
may be using a less hierarchical approach because it is more effective (Powell 1990; Jung
and Lake 2011), not because the parties themselves are weak. Such arrangements can reduce
transactions costs and facilitate coordination and cooperation in the absence of centralized
control, which is in any case largely precluded by campaign finance laws.
The close ties between parties and consulting firms are most obvious in the consultant
selection process. For example, the parties may provide certain campaigns or candidates
with lists of reputable consultants (Kolodny and Logan 1998). However, the party’s role in
the matching process is necessarily limited by logistical constraints given the massive size3See, for instance, Schwartz (1990), Monroe (2001), Bernstein (2003), Dominguez (2005), Doherty
(2006), Heaney and Rojas (2007), Koger, Masket and Noel (2009), Herrnson (2009), Grossman and Dominguez(2009), Masket et al. (2009), Koger, Masket and Noel (2010), Bawn et al. (2012), Cain (2012a,b), and Des-marais, La Raja and Kowal (2014).
5

of the marketplace (hundreds of races per cycle) and the timing of the hiring process (before
party funding is available or primaries are resolved). As a result, campaigns are not typically
constrained to hire specific firms chosen by the party, nor are consultants required to accept
those campaigns as clients or to adopt particular issue positions or strategies. Instead, parties
help create incentives for candidates to use firms “known” by the parties (Cain 2011, 2013).
This process results in a loosely organized network of candidate-consultant relationships
centered on a set of party-aligned firms rather than a set of strictly-organized relationships
and strategies dictated by central party committees (Nyhan and Montgomery N.d.).
After they are hired, consultants function largely autonomously, providing strategic ad-
vice and organizational capacity to candidates without centralized control from formal party
organizations. While it is possible that this organizational approach could lead to significant
agency loss (Walton and Walter 2009; Martin and Peskowitz N.d.), there are several reasons
to believe that consultants will select and disseminate strategies in a manner that generally
serves the interests of parties and their candidates. First, many consultants previously worked
for the parties and are likely to be partisan loyalists (Dulio 2004). Second, firms have strong
incentives to maintain good relations with party organizations, which help direct candidates
to consultants (Kolodny and Logan 1998) and also contract directly for consulting services
(Kolodny and Dulio 2003; Cain 2013). Most importantly, market incentives should help en-
sure that party and consultant incentives are aligned. Like party organizations, consulting
firms are primarily motivated by one goal – winning elections. Losses hurt a firm’s bottom
line by eliminating repeat customers and reducing the likelihood of attracting new clients.
Conversely, consulting firms with strong track records attract new clients and become more
central to the party consultant network over time (Nyhan and Montgomery N.d.).
6
3. THEORETICAL EXPECTATIONS
Our theoretical perspective on the role of consultants in facilitating party goals suggests
three empirical expectations. First, we predict that almost all campaign consulting firms are
highly partisan. If campaign consulting firms are truly part of the extended party network,
they cannot cross party lines. Thus, our theory requires that consultants work with clients of
only one major party. This prediction, which is consistent with past research (e.g., Kolodny
and Logan 1998), is important primarily to establish the basic premise for our study.
Hypothesis 1: Almost all consulting firms work exclusively with Congressional
campaigns from only one of the major parties.
Second, given their key role in contemporary campaigns, consultants have substantial
latitude to influence the strategic choices of the candidates they advise. Indeed, consultants
were already being criticized for having “helped homogenize American politics” by the early
1980s (Sabato 1981, 7). Subsequent studies found evidence of apparent consultant influ-
ence on the adoption of negative advertising (e.g., Swint 1998; Francia and Herrnson 2007;
Grossman 2012), fundraising (Herrnson 1992; Dulio 2004; Cain 2012a), electoral outcomes
(Medvic and Lenart 1997; Medvic 1998; Dabelko and Herrnson 1997; Dulio 2004; Cain
2012b), and the adoption of specific messages (Johnson 2001).
We therefore expect that consulting firms are likely to help spread favored strategies
among their clients and to apply new approaches and strategies that seem to work for one
client for others. These strategies may in turn be adopted and disseminated by collaborating
firms who are jointly employed by the clients who have adopted the strategy. In this way,
consultants can serve as an important broker for the dissemination of effective strategies.
To operationalize this theory of consultant diffusion of campaign strategy, it is necessary
to account for the complex structure of the candidate-consultant network. Many campaigns
employ multiple consultants who each have their own client lists. To account for this, we
propose the following hypothesis:
7

Hypothesis 2: The similarity of candidates’ campaign strategies will increase as
the consultant ties between them become stronger.
An extreme example of the effects that consultants can have on campaign messaging
was observed in the 2010 election cycle when a consultant named Tommy Hopper admitted
to having “borrowed” a message he first used in a Kansas Congressional race for clients
running for Congress in Tennessee and agriculture commissioner in Alabama (Weigel 2010;
Clarkin 2010; see Katz 2010 and Ralston 2010 for other recent examples). Of course, the
similarities between campaigns that share consulting firms will typically be more subtle.
However, surveys and in-depth interviews of campaign professionals reveal that there is a
great deal of practical wisdom traded and debated within the parties about the strategies that
should be used in various electoral scenarios (e.g., Johnson 2011). The spatial statistical
methods we employ below allow us to systematically test for the diffusion of these strategies
among campaigns linked via shared consulting firms.
In particular, our expectation is that consultants’ strategic influence will be strongest
among candidates who require the most assistance to win – non-incumbents and candidates
running in districts that are unfavorable to their party. In the House, incumbent re-election
rates are typically extremely high, including during the 2002–2006 period we study (Center
for Responsive Politics N.d.). Thus, though incumbents are more likely to employ consul-
tants due to their greater financial resources, they face weaker incentives to adopt consultant-
recommended strategies from other races. By contrast, open seat candidates and those chal-
lengers who can afford to hire consultants typically have some chance of winning but are
much more likely to face difficult races and should thus be more open to following con-
sultant advice to maximize their chances of victory.4 In addition, incumbents typically are
constrained by their extensive public record and rely on messages of experience that empha-
size their past accomplishments in office. Just as incumbent legislators are well-known to
“die in their ideological boots” (Poole 2007), incumbent campaigns are more likely to stick4Some open seat candidates and challengers face extremely long odds and may therefore feel little pressure
to follow consultant advice, but very few have the funds to hire consultants in the first place.
8
with established strategies (Druckman, Kifer and Parkin 2009), which reduces the scope for
consultants to exert an independent influence. Non-incumbents will conversely be less likely
to have an established record and campaign strategy than incumbents, which increases the
scope for consultant influence on their strategic choices.
Similarly, major-party candidates running in districts that tend to favor the other party
face a more difficult path to victory than candidates in districts that favor their own party.
There are accordingly stronger incentives for these disadvantaged candidates to adopt rec-
ommended campaign strategies from consultants than for those candidates who are fighting
the election on more favorable terrain. We formalize these hypotheses as follows:
Hypothesis 3a: The relationship between shared consultants and the similarity
of campaign strategy should be stronger for non-incumbents than incumbents.
Hypothesis 3b: The relationship between shared consultants and the similarity
of campaign strategy should be stronger for candidates in unfavorable districts
than for candidates in favorable districts.
4. DATA AND METHODS
Our goal is to determine whether campaigns are more likely to adopt strategies that are
also being used by other campaigns with which they share consultants (rather than being
independent across districts as traditional statistical analyses would assume). In this section,
we describe the data and statistical approach that we use to test this hypothesis.
4.1. Dependent variable: Campaign strategy
Unfortunately, there is surprisingly little systematic data available on campaign strategy,
especially for challengers. One reason is that many campaigns, especially non-competitive
races or those distant from major media markets, provide little direct evidence by which
9
their activities can be evaluated. They receive low levels of media coverage and do not
advertise on television. The most comprehensive effort to date to assemble information on
campaign strategy is provided by Druckman, Kifer and Parkin (2009, 2010),5 who collected
information from the websites of a random sample of major-party candidates for the House
of Representatives in the ten days preceding the 2002, 2004, and 2006 general elections.6
Druckman, Kifer, and Parkin (hereafter DKP) evaluate campaigns along numerous di-
mensions. Here, we focus specifically on the broadest and richest measures of general
strategy in the DKP dataset, which they term “risk-taking” and “issue ownership.” The
risk-taking scale, which ranges from -3 to 8, is calculated as the number of observed behav-
iors that DKP perceive to have uncertain consequences minus the number of strategies used
that they view as safe.7 The result is an index in which higher values are associated with
risky strategies and lower values are associated with safe strategies—precisely the sorts of
decisions over which consultants are likely to influence candidates.
Our second campaign strategy measure is DKP’s measure of issue ownership, which
ranges from -20 to 26 and takes higher values for candidates who focus their message on
issues “owned” by their party (2009, 348). It captures the degree to which campaigns em-
phasize policy areas in which the candidates’ party has a reputational advantage in national
polls. Like risk-taking, this variable is also an excellent indicator of campaign strategy for
our purposes since issue emphasis is a strategic choice that past research suggests consultants
are especially likely to influence (Medvic 2001b, 433; Johnson 2011). In particular, while
candidates are often unwilling to change their issue positions, they may be more willing to
change which issues are emphasized in response to district conditions or polling results.5Since most campaigns had websites during this period, the potential for selection bias is lower than com-
parable television advertising data (e.g., Goldstein and Rivlin 2007).6DKP’s data are structured as a rolling cross-section. They also collected data from the websites of all
major-party Senate candidates, but the lack of Federal Election Commission data on Senate campaign expen-ditures precludes its use in this study (see below).
7Risky strategies were coded as providing negative information about opponents, emphasizing one’s partylabel, providing numerous issue positions or endorsements, focusing on issues more advantageous to the op-posing party, allowing public participation on the website, providing statements about the candidate’s vision oragenda, and mentioning prior non-elected positions. Safe strategies were coded as mentioning the candidate’sexperience as an elected official, roots in the community, and role in obtaining constituent benefits.
10

DKP provide a thorough evaluation of these variables as well as a great deal of evidence
that they capture fundamental elements of campaign strategy. For instance, they show that
challengers and candidates in open seat districts disproportionately adopt riskier strategies
(Druckman, Kifer and Parkin 2009, 352–354). However, these data are still noisy measures
of overall campaign strategy, which should inflate the standard errors of our models and
bias our results toward a null finding. In this sense, positive results should be interpreted as
substantial evidence in favor of our theoretical predictions.
4.2. Consultant-candidate data
We study the random sample of major party House candidates (including open seat candi-
dates and challengers as well as incumbents) in the 2002, 2004, and 2006 general elections
whose campaign strategies were coded by DKP. To determine which consulting firms were
employed by these candidates, we used expenditure data provided by House campaigns to
the Federal Election Commission (FEC) and made available in an accessible format by the
Center for Responsive Politics (2012a; 2012b; 2012c; see also Martin and Peskowitz N.d.).8
Our goal was to identify payments from campaigns to consultants and consulting firms.
Because payments to consulting firms are not clearly labeled in the FEC data and campaigns
are inconsistent in how they describe payment recipients, it was necessary to create a list of
consulting firms to search for in the expenditure data. Given our interest in overall campaign
strategy, we restrict our analysis to firms that self-identified as providing general, media,
and/or polling consulting in scorecards published in the industry trade magazine Campaigns
& Elections (henceforth, C&E) between 1990 and 2009 or a 2008 compendium in the insider
publication The Hotline. From this list, we developed a library of terms that were used to
identify payments made to a listed consulting firm.
This processing step resulted in a list of expenditures that trained research assistants8Itemized expenditure data for Senate campaigns are not available in electronic format for this period and
are thus excluded.
11

coded for matches to our list of strategy, media, and polling firms generated from the C&E
scorecards. Ambiguous cases were further cross-checked against the C&E Political Pages,
an annual directory of consulting firms and consultants published in the magazine, for the
2002, 2004, and 2006 election cycles. Only payments to firms in our sample of media,
strategy, and polling firms or to individuals clearly listed as employed by those firms were
retained. The result of this process was a list of 7,526 campaign-consultant payments totaling
more than $168 million between 1,194 unique campaign-consultant dyads. Finally, we sum
these payments for each campaign-consultant dyad to create a total expenditure value for the
cycle. Additional details are provided in the Supporting Information (SI).
4.3. Creating the candidate-candidate network
Before testing our hypotheses, we must convert our candidate-consultant networks into single-
mode networks of candidates linked by edges weighted by the number of shared consultants.
This process is known as projection and is a standard practice in the social networks liter-
ature. For instance, we can represent a two-mode network of i = 1, . . . , n candidates and
j = 1, . . . ,m consultants as an n⇥m adjacency matrix A. In this case, we have binary edges
indicating whether total expenditures e on a consulting firm in a given election cycle were
$25,000 or greater, a plausible minimal threshold indicating that the candidate employed the
consulting firm for significant duties.9
The existence of a tie between candidate i and consultant j is thus represented in the9As we discuss below, our results are largely robust to two alternative approaches that do not rely on
a specific cutoff value — using either the product of logged spending on shared consultants to represent thestrength of ties between campaigns or a binary measure of whether two candidates each spent $1 or more on anyshared consultant. However, we prefer the approach presented above, which focuses on the number of sharedconsultants who played a significant role in both campaigns without assuming that influence is increasing inspending, which may vary by firm type (e.g., media firms often receive the largest payments because theypurchase advertising for clients, but are not necessarily most influential).
12
adjacency matrix A as
Ai,j =
(1 if ei,j � $25,000
0 if ei,j < $25,000.(1)
To convert this two-mode network into a one-mode network of candidates linked by consul-
tant edges, we post-multiply the adjacency matrix A by its transpose (AAT), which gener-
ates a one-mode n ⇥ n candidate adjacency matrix W. In the projected candidate network
W, the edge weight between candidate c and candidate d is simply the number of consultants
among the set j = 1, . . . , s on whom both spent $25,000 or more in a given election cycle
(where I(.) represents the indicator function):
Wc,d =
sX
j=1
I(ec,j � $25,000)⇥ I(ed,j � $25,000) (2)
Substantively, the edge weights in the projected matrix represent the extent to which candi-
dates have an increasingly similar team of consultants.
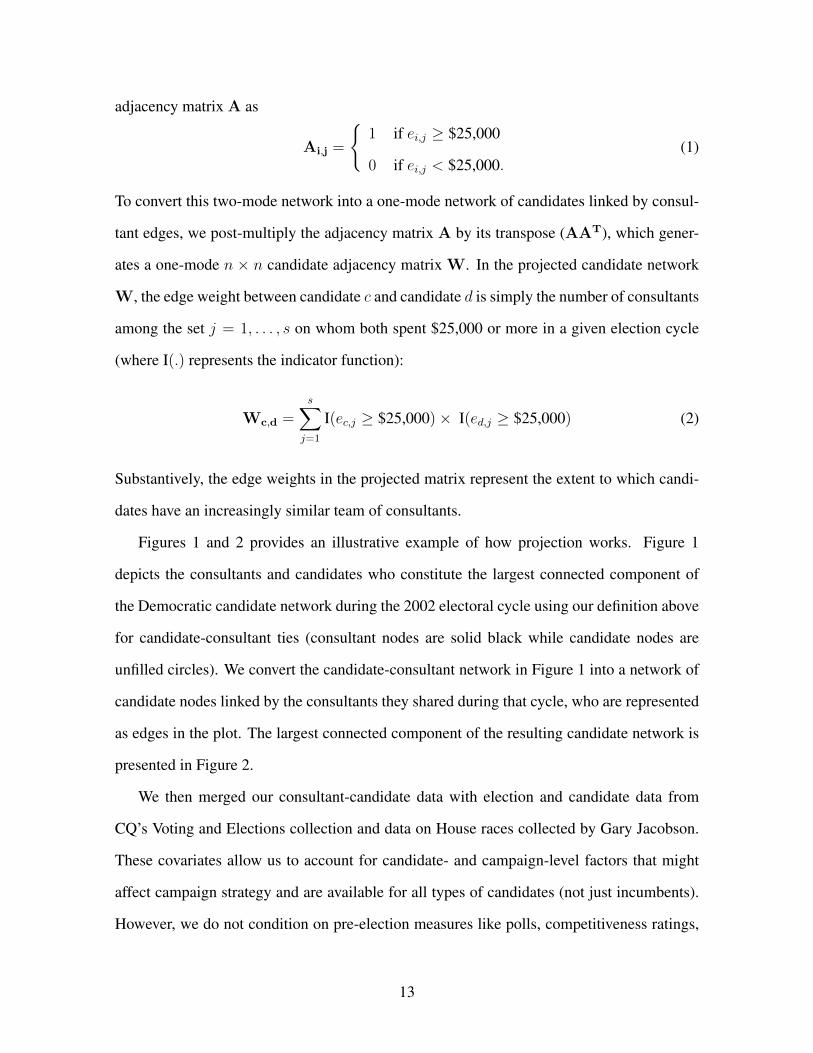
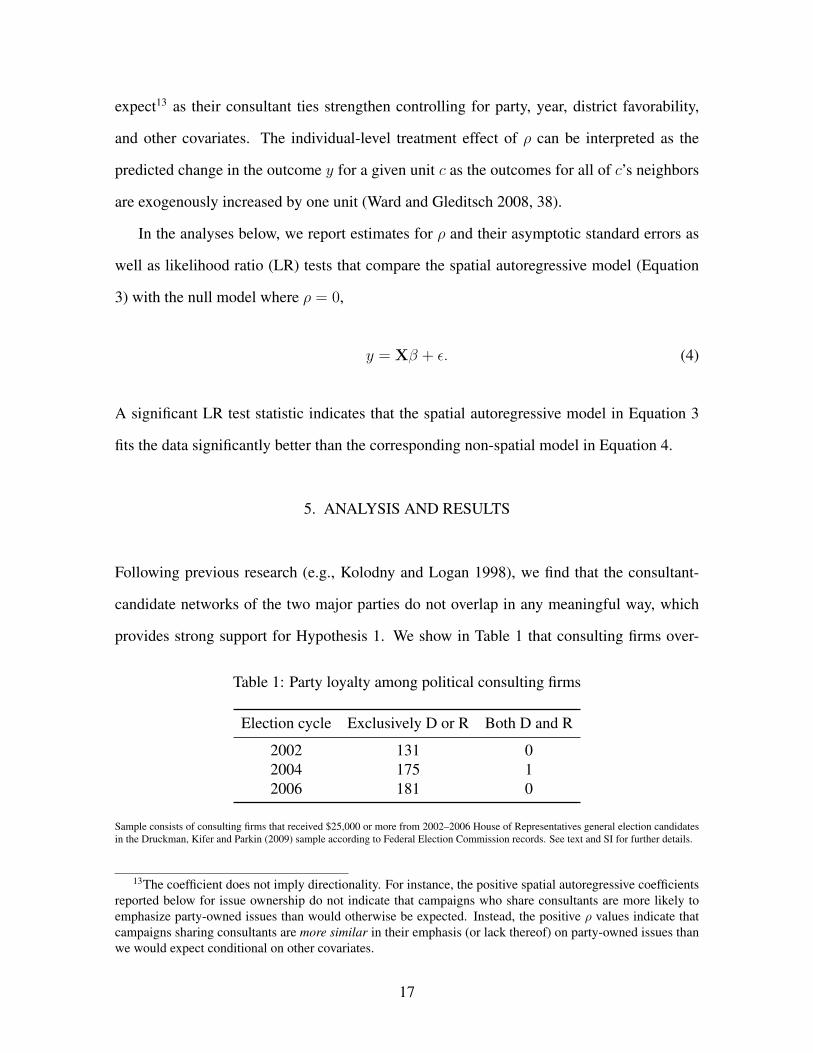
Figures 1 and 2 provides an illustrative example of how projection works. Figure 1
depicts the consultants and candidates who constitute the largest connected component of
the Democratic candidate network during the 2002 electoral cycle using our definition above
for candidate-consultant ties (consultant nodes are solid black while candidate nodes are
unfilled circles). We convert the candidate-consultant network in Figure 1 into a network of
candidate nodes linked by the consultants they shared during that cycle, who are represented
as edges in the plot. The largest connected component of the resulting candidate network is
presented in Figure 2.
We then merged our consultant-candidate data with election and candidate data from
CQ’s Voting and Elections collection and data on House races collected by Gary Jacobson.
These covariates allow us to account for candidate- and campaign-level factors that might
affect campaign strategy and are available for all types of candidates (not just incumbents).
However, we do not condition on pre-election measures like polls, competitiveness ratings,
13

Figure 1: The 2002 Democratic candidate-consultant network
Bennett
Cmpgn Rsrc
Cmpgn Strat
Compass
Cooper
Craft
Decision
Fairbank
Fenn
FraioliLaguens
Lone
Media StratMSR
Mellman
Murphy
Hart
StrubleSutter's
Feldman STMBell Conway
Davis
Degette
Etheridge
Herseth
Hill
Holden
Langevin
Marshall
Michaud
Moore
Moran
Norris
Obey
Romero
Thomas
Plot depicts the candidates and consultants in the largest component of the projected 2002 Democratic candidatenetwork constructed from the Druckman, Kifer and Parkin (2009) House of Representatives candidate sampleand FEC data (see text for details). Consultant nodes are solid circles; candidate nodes are unfilled circles.
or fundraising totals that could be affected by consultant choice and therefore induce post-
treatment bias (King and Zeng 2006; see, e.g., Cain 2012a).
4.4. Spatial autoregressive models
To test our diffusion hypotheses (Hypothesis 2 and Hypotheses 3a/3b), we estimate spatial
autoregressive models to examine whether sharing consultants is associated with the use of
similar campaign strategies. The spatial relationships that we model are thus ties within
the candidate-consultant network rather than, say, geographic proximity.10 Specifically, we10This approach is frequently employed in the social networks literature. For recent examples, see Mizruchi,
Stearns and Marquis (2006) and Papachristos (2009).
14

Figure 2: The 2002 Democratic candidate network
BellConway
Davis
Degette
Etheridge
Herseth
Hill
Holden
Langevin
Marshall
Michaud
MooreMoran
Norris
Obey
Romero
Thomas
Plot depicts the largest connected component in the network of 2002 Democratic House candidates in theDruckman, Kifer and Parkin (2009) sample; edges represent shared consultant ties identified in FEC data.
estimate spatial autoregressive models with covariates (see, e.g., LeSage and Pace 2009).11
For some continuous outcome y, the model assumes
y = X� + ⇢Wy + ✏, (3)
where ✏ ⇠ N(0, �2In), n is the number of observations, X is an n⇥ p covariate matrix with
p covariates, and W is an n⇥ n weight matrix with zeros along the diagonal.12
We construct the weight matrix W by row-standardizing the matrix Wc,d defined in11All analyses were conducted in R using the lagsarlm function in spdep.12This model assumes that we have a continuous outcome, while our main outcomes of interest are cate-
gorical. The risk-taking variable has 11 categories ranging from -3 to 8 and the issue ownership variable has46. However, we are aware of no software routines for estimating ordered categorical spatial autoregressivemodels. Moreover, it is common to treat dependent variables with large number of categories as continuousin practice. For instance, ordered probit and ordinary least squares regression typically provide substantivelyidentical results for dependent variables with ten or more categories.
15

Equation 2, which represents the number of consultants to whom candidates c and d both
paid $25,000 or more in a given election cycle. This procedure, which is standard in spatial
econometrics and political science (e.g., Ward and Gleditsch 2008; LeSage and Pace 2009),
normalizes the total effects of shared consultants to be equal across candidates. We perform
this step so that our inferences are not distorted by substantial differences in the number of
shared consultants per candidate. Specifically, the weight Wc,d representing the strength of
the association between candidates c and d is standardized by the total number of shared
consultants per candidate such thatP
d Wc,d = 1 for all candidates c = 1, . . . , n who have
one or more shared consultant (P
d Wc,d = 0 for candidates with no shared consultants).
Substantively, this approach assumes that a candidate will be less likely to use a strat-
egy like the one used by a candidate with whom she shares consultants as the number of
consultants she shares with other candidates increases (because those other relationships
presumably would also influence her strategy). Conversely, this procedure assumes that the
similarity between campaigns will be greatest when no competing influences are present —
namely, when two candidates share consultants only with each other.
Within this framework, the spatial autocorrelation coefficient ⇢ represents the influence
of a weighted average of the strategies used by other candidates with whom a candidate
shares consultants, capturing the tendency of candidates who are “closer” to each other in
the network to employ similar campaign strategies (Ward and Gleditsch 2008). In other
words, it captures the general tendency for strategies to covary among campaigns who share
consultants. If we constrain ⇢ to be equal to zero, the model is identical to standard linear
regression, which implicitly assumes that strategies are conditionally independent across
campaigns. For instance, under the null model where ⇢ = 0, we are assuming that incumbent
Republicans facing similar electoral environments would employ similar campaign strategies
regardless of which consultants they are using. Our theory, on the other hand, suggests that
⇢ > 0. A positive and statistically significant spatial autocorrelation coefficient indicates that
campaign strategies will be more similar between two campaigns than we would otherwise
16
expect13 as their consultant ties strengthen controlling for party, year, district favorability,
and other covariates. The individual-level treatment effect of ⇢ can be interpreted as the
predicted change in the outcome y for a given unit c as the outcomes for all of c’s neighbors
are exogenously increased by one unit (Ward and Gleditsch 2008, 38).
In the analyses below, we report estimates for ⇢ and their asymptotic standard errors as
well as likelihood ratio (LR) tests that compare the spatial autoregressive model (Equation
3) with the null model where ⇢ = 0,
y = X� + ✏. (4)
A significant LR test statistic indicates that the spatial autoregressive model in Equation 3
fits the data significantly better than the corresponding non-spatial model in Equation 4.
5. ANALYSIS AND RESULTS
Following previous research (e.g., Kolodny and Logan 1998), we find that the consultant-
candidate networks of the two major parties do not overlap in any meaningful way, which
provides strong support for Hypothesis 1. We show in Table 1 that consulting firms over-
Table 1: Party loyalty among political consulting firms
Election cycle Exclusively D or R Both D and R
2002 131 02004 175 12006 181 0
Sample consists of consulting firms that received $25,000 or more from 2002–2006 House of Representatives general election candidatesin the Druckman, Kifer and Parkin (2009) sample according to Federal Election Commission records. See text and SI for further details.
13The coefficient does not imply directionality. For instance, the positive spatial autoregressive coefficientsreported below for issue ownership do not indicate that campaigns who share consultants are more likely toemphasize party-owned issues than would otherwise be expected. Instead, the positive ⇢ values indicate thatcampaigns sharing consultants are more similar in their emphasis (or lack thereof) on party-owned issues thanwe would expect conditional on other covariates.
17

whelmingly work only with candidates from only one party. Across three election cycles,
we only observe one case in which a general, media, or polling consulting firm contracted
with campaigns in both major parties in the same cycle — a tiny fraction of all consultant-
candidate dyads in our data. This strict segmentation of the consulting market was also
observed by Martin and Peskowitz (N.d.), who found only one of 1250 consultants listed in
Campaigns & Elections during the 2002–2010 period did not affiliate with one party. Their
behavior reflects a combination of party loyalty by consultants and intense market pressure
from clients to remain loyal to a single party (e.g., Hamby 2009; Halperin 2010).
5.1. Spatial autoregression results
Turning to our regression results, we follow DKP by including members of both parties and
pooling across the 2002, 2004, and 2006 elections in our analyses. In addition to the spa-
tial weight matrix constructed from our data on shared consultant ties between campaigns,
we include a number of relevant covariates in the models that are available for the full set
of candidates in our data (which include many non-incumbents). In each of the analyses
below, we include fixed effects for party and year (Republicans and 2002 are the reference
categories, respectively); indicators for incumbents and open seat candidates (challengers
are the reference category); and indicators for district favorability based on a quartile split
of the two-party vote received by their party’s presidential candidate in their district in 2000
(for the 2002 election) or 2004 (for the 2004/2006 elections).14 This variable allows us to
account for the competitiveness and partisan orientation of the district. One additional po-
tential concern is that consultant ties may act as proxies for regional differences in campaign
style. Democrats in the South may campaign differently than those in the Northeast, for
instance, and use consultants who specialize in their region. We therefore include regional14These indicators, which allow for possible non-linearities in the relationship between district favorability
and campaign strategy, represent the following values in the data: 9–42% of the two-party presidential vote(the bottom quartile), 43%–51% (the second quartile), 52%–59% (the third quartile), and 60%–91% (the fourthquartile). The first (least favorable) quartile is the omitted category in the results below.
18

fixed effects (the Northeast is the reference category). Finally, we follow DKP in including
their measure of “issue salience” as a control in models of issue ownership. After dropping
observations due to missingness in the covariates, we are left with 545 observations.15
Table 2 presents the results of our spatial autoregressive models of DKP’s campaign strat-
egy measures of risk-taking and issue ownership. Our primary interest is not in the control
variables (which we do not discuss further for space reasons but are largely consistent with
expectations) but on estimates of the spatial autocorrelation coefficient ⇢ and the likelihood-
ratio tests, which determine if there is a statistically significant improvement in model fit over
a standard linear regression. A positive, statistically significant likelihood ratio test indicates
that campaign strategies are more similar among candidates who share consultants than we
would expect by chance (conditional on covariates).
The first column of Table 2 confirms our expectation that campaign strategies should be
more similar among candidates who share consultants than we would otherwise expect. The
spatial autocorrelation coefficient is positive and statistically distinct from zero (⇢ = 0.105,
s.e.=0.048) and we can reject the null hypothesis that the spatial autoregressive model does
not fit better than a standard linear regression (LR statistic = 5.111, p < .05).16 The third
column of Table 2 finds an even stronger positive association between the number of shared
consultants and issue ownership scores (⇢ = 0.346, s.e.=0.046) and we can again reject the
null of no improved fit versus a standard linear regression (LR statistic = 49.066, p < .01).17
One potential concern is that our results are confounded by unobserved similarities in
candidate ideology. We therefore utilize the innovative Bonica (N.d.) estimates of candidate
ideal point derived from campaign finance records, which he calls CFscores. These estimates15Only 15% of the unique candidates appear in the dataset more than once (12% in two cycles and 3% in all
three cycles). We therefore cannot include candidate-level fixed effects (though descriptive statistics suggestthese candidates are adjusting their strategies between cycles as our hypothesis predicts; results available uponrequest). Our candidates are only linked by consultant ties within a given cycle so this choice should not causespurious spatial autocorrelation.
16The autocorrelation term is already on the same scale as the dependent variable, facilitating interpretation.This result indicates that a one standard deviation increase in risk-taking by all of unit c’s neighbors results ina roughly 0.105 standard deviation increase in risk-taking for unit c.
17Substantively, a one standard deviation increase in issue ownership by all of unit c’s neighbors results ina roughly 0.346 standard deviation increase in emphasizing party-owned issues.
19

Table 2: Autoregressive models of risk-taking and issue ownership in House campaigns
Risk-taking Issue ownership(1) (2) (3) (4)
Intercept -0.397 -0.358 -5.940 -3.897(0.334) (0.363) (1.486) (1.635)
2004 0.119 -0.019 -1.809 -1.715(0.185) (0.193) (0.764) (0.795)
2006 0.335 0.296 -1.576 -1.670(0.179) (0.186) (0.739) (0.767)
Democrat 1.211 1.152 11.154 7.286(0.141) (0.336) (0.658) (1.443)
Open seat 1.602 1.620 -0.273 -0.190(0.224) (0.226) (0.939) (0.944)
Challenger 2.717 2.814 1.452 1.528(0.173) (0.178) (0.714) (0.737)
District favorability: 2nd quartile 0.066 0.052 0.405 0.119(0.192) (0.205) (0.789) (0.840)
District favorability: 3rd quartile -0.086 0.008 2.304 2.184(0.209) (0.220) (0.865) (0.911)
District favorability: 4th quartile -0.117 -0.095 2.040 1.852(0.232) (0.240) (0.968) (0.998)
Mid-Atlantic 0.198 0.352 -2.096 -2.168(0.311) (0.322) (1.296) (1.340)
Midwest 0.729 0.689 -0.265 0.266(0.289) (0.293) (1.201) (1.220)
Plains 0.473 0.477 0.811 1.230(0.328) (0.328) (1.371) (1.371)
South 0.446 0.581 -0.783 -0.112(0.277) (0.281) (1.148) (1.162)
Border 0.452 0.572 -0.118 0.143(0.307) (0.312) (1.277) (1.300)
Mountain West 0.685 0.702 -1.150 -1.023(0.300) (0.299) (1.236) (1.230)
West 0.488 0.363 -1.529 -0.842(0.350) (0.363) (1.445) (1.491)
Conservatism (CFscore) -0.080 -2.102(0.164) (0.681)
Issue salience 9.091 8.322(1.960) (2.069)
Number of shared consultants (spatial autocorrelation)⇢ 0.105 0.078 0.346 0.350
(0.048) (0.048) (0.046) (0.047)
Nested model test for shared consultant dependenceLR statistic 5.111 2.762 49.066 49.075
p-value 0.024 0.097 0.000 0.000
N 524 486 532 493
Models predict the Druckman, Kifer and Parkin (2009) campaign strategy measures of risk-taking and issue ownership among 2002–2006House of Representatives general election candidates in their sample with no missing data on covariates. Edge weights represent thenumber of consulting firms that received $25,000 or more from both candidates according to Federal Election Commission records; theresulting adjacency matrix is then row-standardized. Indicators for district favorability represent quartiles for the party presidential voteby district (the least favorable quartile is the omitted category; see footnote 14 for details). Estimated using the lagsarlm function in thespdep package for R. 20

allow us to map incumbents and non-incumbents into a common ideological space, which
is otherwise impossible given the lack of comparable legislative voting or survey data for
most non-incumbents. When we control for the CFscore estimates of candidate ideal points
in the second and fourth columns of Table 2, our results for ⇢ are largely unchanged and the
likelihood ratio statistics testing the autoregressive models against standard linear regressions
remain statistically significant for both risk-taking (p < .10) and issue ownership (p < .01).18
Hypotheses 3a and 3b predict that the relationship between campaign strategy and shared
consultants will be strongest among non-incumbents and candidates in unfavorable districts
due to the increased competitive pressures that they face. We therefore disaggregate our data
by incumbency status and district type and estimate separate models in Tables 3 and 4. The
first two columns of each table contrast results for incumbent and non-incumbent candidates,
respectively, while the third and fourth columns divide the data by district favorability using
a median split on presidential vote.19
Again, our focus is not on the regression coefficients themselves, but on the estimates of
⇢ and the likelihood ratio tests at the bottom of the tables. The risk-taking models in Table
3 provide statistically significant evidence of an association between campaign strategy and
shared consultants that is consistent with Hypotheses 3a and 3b. Specifically, likelihood ratio
tests indicate find that accounting for shared consultant ties produces a positive and statis-
tically significant increase in model fit for both non-incumbents and those in unfavorable
districts (p < .10 and p < .05, respectively; see the first and third columns of Table 3). This
difference is not observed among incumbents or candidates in favorable districts (the second
and fourth columns of Table 3).20
By contrast, the issue ownership models in Table 4, while consistent with Hypothesis 2,18We lose 38 cases by including this covariate due to candidates who do not receive a sufficient number of
contributions and/or do not file reports with the FEC.19Districts in which the presidential nominee from the candidate’s party received less than 51% of the vote
in the previous election district are classified as unfavorable.20While the evidence against the null hypothesis within each model is consistent with both Hypotheses 3a
and 3b, we do not know of a valid test for differences in spatial autocorrelation between non-nested spatialautoregressive models. We therefore cannot formally reject the null hypotheses of no difference in ⇢ betweenincumbents and non-incumbents and between candidates in favorable and unfavorable districts.
21

Table 3: Autoregressive models of risk-taking by incumbency and district favorability
Incumbency District favorabilityNon-incumbent Incumbent Unfavorable Favorable
Intercept 1.106 0.414 -1.166 0.734(0.417) (0.640) (0.443) (0.440)
2004 0.464 -0.320 0.496 -0.237(0.260) (0.255) (0.264) (0.248)
2006 0.641 -0.097 0.629 0.022(0.251) (0.248) (0.258) (0.238)
Democrat 1.139 1.415 1.250 0.959(0.207) (0.216) (0.220) (0.226)
Open seat 2.211 1.185(0.343) (0.294)
Challenger 1.005 2.688 2.869(0.247) (0.251) (0.260)
District favorability: 2nd quartile 0.169 -0.609 -0.001(0.223) (0.480) (0.198)
District favorability: 3rd quartile -0.033 -0.603(0.276) (0.475)
District favorability: 4th quartile -0.506 -0.637 -0.020(0.398) (0.468) (0.194)
Mid-Atlantic 0.055 0.314 0.423 -0.229(0.451) (0.430) (0.440) (0.433)
Midwest 0.684 0.763 1.217 -0.098(0.410) (0.412) (0.423) (0.426)
Plains 0.747 -0.036 0.857 -0.320(0.454) (0.489) (0.480) (0.489)
South 0.250 0.680 0.986 -0.477(0.400) (0.397) (0.419) (0.412)
Border 0.284 0.695 0.815 -0.201(0.427) (0.443) (0.453) (0.434)
Mountain West 0.696 0.746 1.182 -0.231(0.431) (0.437) (0.448) (0.438)
West 0.514 0.342 1.233 -0.441(0.500) (0.475) (0.480) (0.494)
Number of shared consultants (spatial autocorrelation)⇢ 0.103 0.042 0.151 -0.006
(0.055) (0.087) (0.061) (0.065
Nested model test for shared consultant dependenceLR statistic 3.521 0.234 6.283 0.009
p-value 0.061 0.629 0.012 0.924
N 286 238 271 253
Models predict the Druckman, Kifer and Parkin (2009) campaign strategy measure of risk-taking among 2002–2006 House of Representa-tives general election candidates in their sample with no missing data on covariates. Edge weights represent the number of consulting firmsthat received $25,000 or more from both candidates according to Federal Election Commission records; the resulting adjacency matrix isthen row-standardized. Favorable districts are defined as those where the presidential nominee of the candidate’s party received 51% ofthe vote or more (the median value in the data); unfavorable districts are those in which the presidential nominee of the candidate’s partyreceived less than 51% of the vote. Indicators for district favorability represent quartiles for the party presidential vote by district (seefootnote 14 for details). Estimated using the lagsarlm function in the spdep package for R.
22

Table 4: Autoregressive models of issue ownership by incumbency and district favorability
Incumbency District favorabilityNon-incumbent Incumbent Unfavorable Favorable
Intercept -8.080 -0.423 -8.908 -0.667(1.937) (2.812) (2.003) (1.982)
2004 -1.145 -3.023 -0.566 -3.256(1.084) (1.093) (1.116) (1.075)
2006 -1.004 -2.436 -0.338 -2.749(1.033) (1.058) (1.075) (1.029)
Democrat 10.514 11.028 10.795 10.366(0.889) (1.038) (0.956) (1.076)
Open seat 1.083 -0.730(1.456) (1.251)
Challenger 1.305 1.667 1.770(1.024) (1.046) (1.112)
District favorability: 2nd quartile 0.874 -3.195 0.493(0.922) (2.045) (0.835)
District favorability: 3rd quartile 2.513 -0.546(1.137) (2.024)
District favorability: 4th quartile 0.126 -0.558 -0.265(1.642) (1.994) (0.829)
Mid-Atlantic -1.616 -2.545 -0.514 -3.342(1.879) (1.819) (1.864) (1.866)
Midwest 1.720 -1.982 2.212 -2.597(1.717) (1.739) (1.797) (1.826)
Plains 2.010 0.218 4.359 -2.607(1.901) (2.065) (2.034) (2.109)
South 0.389 -1.957 1.106 -2.677(1.666) (1.676) (1.775) (1.760)
Border 1.899 -2.246 1.760 -2.136(1.780) (1.873) (1.915) (1.862)
Mountain West 1.764 -3.575 1.174 -3.323(1.798) (1.845) (1.901) (1.879)
West -2.816 0.368 -1.382 -0.390(2.081) (2.004) (2.034) (2.111)
Issue salience 11.754 6.685 9.495 9.285(2.707) (2.857) (2.630) (2.972)
Number of shared consultants (spatial autocorrelation)⇢ 0.264 0.344 0.287 0.339
(0.071) (0.060) (0.071) (0.057)
Nested model test for shared consultant dependenceLR statistic 12.454 27.905 15.856 28.704
p-value 0.000 0.000 0.000 0.000N 286 238 271 253
Models predict the Druckman, Kifer and Parkin (2009) campaign strategy measure of issue ownership among 2002–2006 House of Repre-sentatives general election candidates in their sample with no missing data on covariates. Edge weights represent the number of consultingfirms that received $25,000 or more from both candidates according to Federal Election Commission records; the resulting adjacencymatrix is then row-standardized. Favorable districts are defined as those where the presidential nominee of the candidate’s party received51% of the vote or more (the median value in the data); unfavorable districts are those in which the presidential nominee of the candidate’sparty received less than 51% of the vote. Indicators for district favorability represent quartiles for the party presidential vote by district(see footnote 14 for details). Estimated using the lagsarlm function in the spdep package for R.
23

do not support Hypotheses 3a and 3b—the spatial autocorrelations are statistically signifi-
cant and of comparable magnitude for incumbents and non-incumbents (the first and sec-
ond columns) and for candidates in favorable or unfavorable districts (the third and fourth
columns). In other words, consultant ties appear to play a similarly important role for all of
these subsets of candidates. This result suggests that the influence of consultants on issue
positioning is more universal, while their effects on risk-taking are more context-dependent.
In general, our findings support the hypothesis that consultants have come to play an
important role in disseminating overall campaign strategy among Congressional candidates.
Despite our reliance on dependent variables that are likely to be measured imprecisely, the
strategies of campaigns who share consultants are more similar than we would expect by
chance even after controlling for factors such as incumbency, year, party, and district favora-
bility (Hypothesis 2). In addition, shared consultant relationships are most closely related to
candidate risk-taking among non-incumbents (Hypothesis 3a) and candidates in unfavorable
districts (Hypothesis 3b)—precisely those who most likely to need consultant advice.21
5.2. Robustness and falsification tests
Though the results above are largely supportive of our hypotheses, we further investigate the
robustness of our results to alternative parameterizations of the spatial weights matrix and
conduct falsification tests to assess other threats to the validity of our findings.
First, one possible concern is that these results may be sensitive to measuring network
ties as the number of shared consultants on whom both candidates spent at least $25,000
in a given election cycle. As a robustness check, we re-estimate the models for risk-taking
and issue-ownership among non-incumbents and candidates in unfavorable districts (specifi-
cally: the first and third columns of Tables 3 and 4) in the Supporting Information (SI) using21The differences in results that we observe by incumbency status above do not appear to be the result of
differences in shared consultant usage. While incumbents are unsurprisingly more likely to employ a consul-tant than non-incumbents (90% versus 51%, respectively), the proportion of candidates who have one moreconsultants and share consultants with other candidates is virtually identical (89% versus 92%).
24

two alternative parameterizations of the spatial weight matrix W: the log product of joint
expenditures on a consultant (which avoids the use of a threshold value indicating the pres-
ence of a candidate-consultant tie) and binary edge weights indicating that both candidates
spent any funds at all or more on one or more of the same consultants (these weights are then
row-standardized in both cases; see SI for further details).
The results are largely consistent with the findings above: both the risk-taking and issue
ownership measures are significantly associated among candidates when we operational-
ize shared consultant ties using the log product of joint consultant expenditures or a binary
indicator for having at least one shared consultant who received any payment from both
candidates (p < .10 and p < .01, respectively). However, the results for risk-taking among
non-incumbents, while only somewhat diminished in the magnitude (i.e., the estimated value
of the spatial autocorrelation coefficient ⇢), show that accounting for shared consultants us-
ing either alternate spatial weight specification does not significantly improve model fit in
likelihood ratio tests (p < .24 in both cases). Given their greater sensitivity to our modeling
choices above, these results should be interpreted with more caution.22
One additional concern is that the spatial autocorrelations reported above may be spuri-
ous due to an unobserved candidate characteristic that is correlated with consultant selection.
It is possible, for instance, that two similar candidates may be more likely to run similar
campaigns and to hire the same consultants, which could induce a spurious correlation be-
tween shared consultant usage and campaign strategy similarity. We therefore conducted an
extensive series of falsification tests described in the Supplementary Information in which
we divided the data into groups of similar candidates and randomly shuffled consultant ties
amongst candidates within those groups. The three partitions were candidate type (e.g., Re-
publicans contesting open seats in 2002), district type (e.g., Democrats in the least favorable22The Supporting Information also contains results for two narrower campaign strategy measures from
Druckman, Kifer and Parkin (2009): number of positions taken and use of negativity. The results for thesemeasures are broadly consistent with those above (i.e., positive spatial autocorrelations) but the statistical sig-nificance varies across the various spatial weight specifications. Given that these results are less robust and thestrategy measures are more limited, we do not discuss them further.
25

third of districts in 2004), and region (e.g., a Republican candidate in the Northeast in 2006).
If we observe comparable levels of spatial autocorrelation in candidate strategy using these
permuted consultant ties, it would suggest that our results are the spurious result of clustering
in consultant selection among similar candidates. By contrast, a lack of significant spatial
autocorrelation would increase our confidence in the results we report above.
Reassuringly, we find that observed LR statistic for risk-taking is greater than 95% of
simulated LR statistics generated using the candidate and district type permutations and 97%
of those from the region permutations. Similarly, the observed LR statistic from Table 2
exceeds 96% of the LR statistics from the candidate type permutations and 99% of those
from the district type and region permutations. These findings suggest that our results are
not the result of spurious clustering in consultant selection among similar candidates.
6. CONCLUSION
Traditional analyses interpret modern American political campaigns as “candidate-centered,”
neglecting the many party actors and institutions that connect co-partisans and transmit in-
formation and learning across electoral districts. In this paper, we deviate from this approach
and instead explore how the activities of campaigns diffuse across districts via the extended
party networks of the contemporary era. In particular, professional political consultants of-
ten serve as brokers, bridging informational gaps between campaigns and bringing ideas
and approaches to new settings. While some agency loss is likely in any principal-agent
relationship (Walton and Walter 2009; Martin and Peskowitz N.d.), consultants have strong
reputational and financial incentives to win elections, which is also the principal goal of
the party organizations. At the aggregate level, their work helps parties respond to chang-
ing electoral circumstances and diffuse campaign strategy in a decentralized manner, which
should contribute to a more unified party image and communication strategy.
To test this theory, we assemble the most comprehensive dataset of consultant-candidate
26

relationships constructed to date and provide substantial evidence that Congressional candi-
dates who share consultants are more likely to use similar strategies than we would otherwise
expect conditional on a series of covariates. These results, which largely withstand numerous
robustness and falsification tests, provide the first quantitative evidence that consultants play
an important role in diffusing general campaign strategies between campaigns, especially
for candidates who are likely to face longer odds in their campaigns and are more open to
influence by their consultants — non-incumbents and candidates in unfavorable districts.
Before concluding, it is important to note the limitations of the present study. First, avail-
able measures of campaign strategy that do not suffer from severe selection bias are noisy and
infrequently measured. Second, we cannot fully rule out the possibility that candidates adopt
similar strategies in part due to party influence in the consultant selection process. Unfortu-
nately, there is no way to directly observe which consultants are recommended to candidates
by parties or measure which are most closely aligned with party campaign committees. Fu-
ture research should consider alternative measures of campaign activity and investigate the
party role in the consultant selection process and develop new approaches to estimating its
independent effects on campaign strategy.23 Finally, it is difficult to entirely rule out the pos-
sibility that candidates are selecting consulting firms based on the strategies they advocate.
The robustness and falsification tests presented above increase our confidence that the spatial
autocorrelations we find are not spurious, but candidates may select firms partly as a result of
the strategies that firms typically advocate (or vice versa). Future research should investigate
this relationship further and test the robustness of the relationship that we find.
Despite these limitations, we believe this research provides a new view of consultants as
playing a crucial role in linking Congressional candidates and campaigns within the parties.
While the normative consequences of this shift can be debated, the importance of consul-23One approach to measuring party/consultant ties would be to use payments from parties directly to specific
firms (Kolodny and Dulio 2003; Magleby 2010; Cain 2013). However, direct financial payments for party-related activities are not necessarily meaningful indicators of the degree to which specific consultants may berecommended to campaigns. Legal prohibitions against candidate-party coordination may encourage parties toavoid forming formal ties with some favored consulting firms.
27

tants to contemporary campaigns and parties can no longer be ignored. Indeed, these results
suggest several paths forward for future research. First, we should analyze the dynamic evo-
lution of the consultant-candidate network over time (Nyhan and Montgomery N.d., e.g.,).
With more fine-grained data, it should be possible to track the spread of new campaign inno-
vations through the campaign-consultant network both within and between campaign cycles.
A second extension should build on Walton and Walter (2009) and Martin and Peskowitz
(N.d.) and investigate the extent of the agency loss parties experience in relying on consul-
tants to set campaign strategy. In some cases, consultants may disseminate strategies that
harm the party’s interests or prioritize profits over client or party interests, but the extent of
this problem is not clear. Finally, our findings contribute to the development of social net-
work and diffusion research in political science. Rather than simply providing a descriptive
account of a network or characterizing a general pattern of diffusion, we test theoretical hy-
potheses about consultant-driven strategic diffusion among Congressional campaigns using
network data and conduct falsification tests to address concerns about spurious relation-
ships. This approach could be extended to examine other types of consultants (e.g., donors
and fundraising consultants; see Cain 2012a) as well as other non-party actors who link
contemporary campaigns or elected officials.
28

References
Aldrich, John H. 2000. “Southern Parties in State and Nation.” Journal of Politics 62(3):643–670.
Aldrich, John H. 2011. Why Parties?: A Second Look. Chicago: University of ChicagoPress.
Bawn, Kathleen, Marty Cohen, David Karol, Seth E. Masket, Hans Noel and John R. Za-ller. 2012. “A Theory of Political Parties: Gropus, Policy Demands and Nominations inAmerican Politics.” Perspectives on Politics 10(3):571–597.
Bernstein, Jonathan. 2003. “Candidates and Candidacies in the Expanded Party.” PS: Politi-cal Science and Politics 36(2):165–170.
Bonica, Adam. N.d. “Mapping the Ideological Marketplace.” American Journal of PoliticalScience, forthcoming.
Burt, Ronald S. 1992. Structural holes: The social structure of competition. Harvard Uni-versity Press.
Burt, Ronald S. 2004. “Structural holes and good ideas.” American Journal of Sociology110(2):349–399.
Cain, Sean A. 2011. “An Elite Theory of Political Consulting and Its Implications for U.S.House Election Competition.” Political Behavior 33(3):375–405.
Cain, Sean A. 2012a. “Fundraising Consultants and the Representation of National andLocal Campaign Donor Bases in U.S. House Election Campaigns.” Paper prepared fordelivery at the 2012 annual meeting of the American Political Science Association, August30–September 2, 2012, New Orleans, LA.
Cain, Sean A. 2012b. “Knowing the Territory: Pollsters, Population Change, Political Rep-resentation, and the 2010 U.S. House Elections.” Paper prepared for delivery at the 2012annual meeting of the American Political Science Association, August 30–September 2,2012, New Orleans, LA.
Cain, Sean A. 2013. “Political Consultants and Party-Centered Campaigning: Evidence fromthe 2010 US House Primary Election Campaigns.” Election Law Journal 12(1):3–17.
Canes-Wrone, Brandice, David W. Brady and John F. Cogan. 2002. “Out of Step, Out ofOffice: Electoral Accountability and House Members’ Voting.” The American PoliticalScience Review 96:127–140.
Center for Responsive Politics. 2012a. “Expenditures Data: 2002 Cycle.” OpenSecrets.org.
Center for Responsive Politics. 2012b. “Expenditures Data: 2004 Cycle.” OpenSecrets.org.
Center for Responsive Politics. 2012c. “Expenditures Data: 2006 Cycle.” OpenSecrets.org.
29

Center for Responsive Politics. N.d. “Reelection Rates Over the Years.” Downloaded Oc-tober 29, 2012 from http://www.opensecrets.org/bigpicture/reelect.
php.
Clarkin, Mary. 2010. “Motto Pops Up in a Few Campaigns.” The Hutchinson News,June 9. http://www.hutchnews.com/Todaystop/mann-and-slogan--2
(accessed January 25, 2011).
Dabelko, Krisen la Cour. and Paul S. Herrnson. 1997. “Women’s and Men’s Campaigns forthe U.S. House of Representatives.” Political Research Quarterly 50(1):121–35.
Desmarais, Bruce A., Raymond J. La Raja and Michael S. Kowal. 2014. “The Fates ofChallengers in US House Elections: The Role of Extended Party Networks in SupportingCandidates and Shaping Electoral Outcomes.” American Journal of Political Science .
Doherty, Joseph W. 2006. The Candidate-Consultant Network in California Legislative Cam-paigns: A Social Network Analysis of Informal Party Organization PhD thesis Universityof California, Los Angeles.
Dominguez, Casey B.K. 2005. “Groups and the Party Coalitions: A Network Analysisof Overlapping Donor Lists.” Paper presented at the Annual Meeting of the AmericanPolitical Science Association, Washington, DC.
Druckman, James N., Martin J. Kifer and Michael Parkin. 2009. “Campaign Communica-tions in US Congressional Elections.” American Political Science Review 103(3):343–366.
Druckman, James N., Martin J. Kifer and Michael Parkin. 2010. “Timeless Strategy MeetsNew Medium: Going Negative on Congressional Campaign Web Sites, 2002–2006.” Po-litical Communication 27(1):88–103.
Dulio, David A. 2004. For Better or Worse? How Political Consultants are ChangingElections in the United States. Albany: State University of New York Press.
Francia, Peter L. and Paul S. Herrnson. 2007. “Keeping it Professional: The Influence ofPolitical Consultants on Candidate Attitudes toward Negative Campaigning.” Politics &Policy 35(2):246–272.
Gibson, James L., Cornelius P. Cotter, John F. Bibby and Robert J. Huckshorn. 1983. “As-sessing Party Organizational Strength.” American Journal of Political Science 27(2):193–222.
Goldstein, Kenneth and Joel Rivlin. 2007. “Congressional and Gubernatorial Advertis-ing, 2003–2004.” Combined File [dataset]. Final release. Madison, WI: The Universityof Wisconsin Advertising Project, The Department of Political Science at The Universityof Wisconsin-Madison.
Grossman, Matt. 2012. “What (or Who) Makes Campaigns Negative?” American Review ofPolitics 33(1):1–22.
30

Grossman, Matt and Casey B.K. Dominguez. 2009. “Party Coalitions and Interest GroupNetworks.” American Politics Research 37(5):767–800.
Halperin, Mark. 2010. “Statement: Public Opinion Strategieson Crist.” The Page, May 20. http://thepage.time.com/
statement-public-opinion-strategies-on-crist/ (accessed May20, 2010).
Hamby, Peter. 2009. “Specter’s GOP polling firm quits campaign.” CNN.com,April 28. http://politicalticker.blogs.cnn.com/2009/04/28/
specters-gop-polling-firm-quits-campaign/ (accessed July 30, 2011).
Heaney, Michael and Fabio Rojas. 2007. “Partisans, Nonpartisans, and the Antiwar Move-ment in the United States.” American Politics Research 34(4):431–464.
Herrnson, Paul S. 1986. “Do Parties Make a Difference? The Role of Party Organizations inCongressional Elections.” Journal of Politics 48(3):589–615.
Herrnson, Paul S. 1992. “Campaign Professionalism and Fundraising in Congressional Elec-tions.” Journal of Politics 54(03):859–870.
Herrnson, Paul S. 2009. “The Roles of Party Organizations, Party-Connected Committees,and Party Allies in Elections.” Journal of Politics 71(4):1207–1224.
Johnson, Dennis W. 2001. No Place for Amateurs: How Political Consultants are ReshapingAmerican Democracy. New York: Routledge.
Johnson, Dennis W. 2002. “Perspectives on Political Consulting.” Journal of Political Mar-keting 1(1):7–21.
Johnson, Jason. 2011. Political Consultants and Campaigns: One Day to Sell. Boulder, CO:Westview Press.
Jung, Danielle F. and David A. Lake. 2011. “Markets, Hierarchies, and Networks: An Agent-Based Organizational Ecology.” American Journal of Political Science 55:972–990.
Katz, Celeste. 2010. “Air Kathleen Rice: No “Pushover” - Updated.” New York Daily News,August 17. http://www.nydailynews.com/blogs/dailypolitics/2010/08/air-kathleen-rice-no-pushover.html (accessed July 29, 2011).
King, Gary and Langche Zeng. 2006. “The dangers of extreme counterfactuals.” PoliticalAnalysis 14(2):131–159.
Koger, Gregory, Seth Masket and Hans Noel. 2009. “Partisan Webs: Information Exchangeand Party Networks.” British Journal of Political Science 39(3):633–653.
Koger, Gregory, Seth Masket and Hans Noel. 2010. “Cooperative Party Factions in AmericanPolitics.” American Politics Research 38:33–53.
31

Kolodny, Robin. 2000. Electoral Partnerships: Political Consultants and Political Parties. InCampaign Warriors: Political Consultants in Elections, ed. James A. Thurber and Can-dace J. Nelson. Washington, DC: Brookings Institution Press.
Kolodny, Robin and Angela Logan. 1998. “Political Consultants and the Extension of PartyGoals.” PS: Political Science and Politics 31(2):155–159.
Kolodny, Robin and David A. Dulio. 2003. “Political Party Adaptation in U.S. CongressionalCampaigns.” Party Politics 9(6):729–746.
Lathrop, Douglas A. 2003. The Campaign Continues: How Political Consultants and Cam-paign Tactics Affect Public Policy. Westport, CT: Praeger Publishers.
LeSage, James P. and R. Kelley Pace. 2009. Introduction to Spatial Econometrics. BocaRaton, FL: Chapman & Hall/CRC.
Magleby, David B. 2010. Political Parties and Consultants. In The Oxford Handbook ofAmerican Political Parties and Interest Groups, ed. L. Sandy Maisel and Jeffrey M. Berry.New York: Oxford University Press pp. 303–322.
Magleby, David B., Kelly D. Patterson and James A. Thurber. 2000. “Campaign Consul-tants and Responsible Party Government.” Paper presented at the annual meeting of theAmerican Political Science Association, Washington, DC.
Martin, Gregory J. and Zachary Peskowitz. N.d. “Parties and Electoral Performance in theMarket for Political Consultants.” Unpublished manuscript.
Masket, Seth E., Michael T. Heaney, Joanne M. Miller and Dara Z. Strolovitch. 2009. “Net-working the Parties: A Comparative Study of Democratic and Republican National Con-vention Delegates in 2008.” Paper presented at the Annual Meeting of the American Po-litical Science Association, Toronto.
Medvic, Stephen K. 1998. “The Effectiveness of the Political Consultant as a CampaignResource.” PS: political Science and Politics 31(2):153–154.
Medvic, Stephen K. 2001a. “The impact of party financial support on the electoral successof US house candidates.” Party Politics 7(2):191–212.
Medvic, Stephen K. 2001b. Political Consultants in U.S. Congressional Elections. Colum-bus: Ohio University Press.
Medvic, Stephen K. and Silvo Lenart. 1997. “The Influence of Political Consultants in the1992 Congressional Elections.” Legislative Studies Quarterly 22(1):61–77.
Miller, Joanne M. and Jon A. Krosnick. 1996. News media impact on the ingredients of pres-idential evaluations: A program of research on the priming hypothesis. In Political Per-suasion and Attitude Change, ed. Diana Carole Mutz, Paul M. Sniderman and Richard A.Brody. University of Michigan Press Ann Arbor pp. 79–100.
32

Mizruchi, Mark S., Linda Brewster Stearns and Christopher Marquis. 2006. “The Condi-tional Nature of Embeddedness: A Study of Borrowing by Large U.S. Firms, 1973–1994.”American Sociological Review 71(2):310–333.
Monroe, J.P. 2001. The Political Party Matrix: The Persistence of Organization. Albany:State Univ of New York Press.
Nyhan, Brendan and Jacob M. Montgomery. N.d. “The Party Edge: Consultant-CandidateNetworks in American Political Parties.” Unpublished manuscript.
Opsahl, Tore. 2013. “Triadic closure in two-mode networks: Redefining the global and localclustering coefficients.” Social Networks 35(2):159–167.
Papachristos, Andrew V. 2009. “Murder by Structure: Dominance Relations and the SocialStructure of Gang Homicide in Chicago.” American Journal of Sociology 115(1):74–128.
Petrocik, John R. 1996. “Issue ownership in presidential elections, with a 1980 case study.”American Journal of Political Science 40(3):825–850.
Poole, Keith T. 2007. “Public Choice.” Changing Minds? Not in Congress! 131(3-4):435–451.
Powell, Walter W. 1990. “Neither Market nor Hierarchy: Network Forms of Organization.”Research in Organizational Behavior 12:295–336.
Ralston, Jon. 2010. “Candidates with Identical — and I Mean Iden-tical — Mail Pieces.” LasVegasSun.com, May 17, 2010. http://
www.lasvegassun.com/blogs/ralstons-flash/2010/may/17/
candidates-identical----and-i-mean-identical----ma/ (accessedJanuary 25, 2011).
Riker, William H. 1986. The art of political manipulation. Yale University Press.
Sabato, Larry. 1981. The Rise of Political Consultants: New Ways of Winning Elections.New York: Basic Books.
Schlesinger, Joseph A. 1984. “On the Theory.” Journal of Politics 46(2):369–400.
Schwartz, Mildred A. 1990. The Party Network: The Robust Organization of Illinois Repub-licans. Madison: University of Wisconsin Press.
Shea, Daniel M. 1996. Campaign Craft: The Strategies, Tactics, and Art of Political Cam-paign Management. Westport, CT: Praeger Publishers.
Swint, Kerwin C. 1998. Political Consultants and Negative Campaigning: The Secrets ofthe Pros. Lanham, MD: University Press of America.
Thurber, James A. 1998. “The Study of Campaign Consultants: A Subfield in Search ofTheory.” PS: Political Science and Politics 31(2):145–149.
33

Thurber, James and Candice J. Nelson. 1995. Campaigns and Elections: American Style.Boulder: Westview Press.
Vogel, Kenneth P. 2007. “Romney spent 300 on makeup ‘consulting’.” July 16.
Walton, Nina and Nicholas Walter. 2009. “Moral Hazard in Campaigns: Do Political Candi-dates Keep Hiring Their Consultants?” Social Science Research Network working paper.
Ward, Michael D. and Kristian Skrede Gleditsch. 2008. Spatial Regression Models. LosAngeles: Sage Publications, Inc.
Weigel, Dave. 2010. “Tennessee, Alabama GOP Candidates Co-Star in CopycatAds.” WashingtonPost.com, May 26. http://voices.washingtonpost.
com/right-now/2010/05/tennessee_alabama_gop_candidat.html
(accessed January 25, 2011).
34

SUPPORTING INFORMATION
This Supporting Information (SI) first provides additional details on the process by which weidentified payments to consulting firms from FEC records. It then presents results of spatialautoregressive models of candidate strategy using alternative parameterizations of the edgeweights between candidates as well as alternate measures of campaign strategy. Finally, wepresent technical details on the falsification tests summarized in the main text.
CONSULTANT-CANDIDATE DATA
Our goal was to find direct payments from campaigns to consultants and consulting firmsrecorded in the expenditure data provided by House campaigns to the Federal Election Com-mission (FEC) and made available in an accessible format by the Center for ResponsivePolitics (2012a; 2012b; 2012c).1
CRP did not report expenditures for 70 campaigns in the DKP sample that spent lessthan $50,000 (further details available upon request). Broadly speaking, these were sym-bolic candidates that did not wage competitive campaigns. For instance, there were 227 totalcampaigns in the sample in the 2006 cycle. Of those, 28 were not included in the Open Se-crets expenditure data. The relevant candidates and their overall spending totals (as reportedby Opensecrets.org) are reported in Table SI-1. As can be seen, most of these campaignsspent only enough money to run a minimal campaign, including nine who spent so little thatthey did not file a FEC report.
Given their extremely low levels of spending, it is very unlikely that these campaignscontracted with a professional consulting firm (let alone one that had another client in ourdata). However, as a further check, we examined the Campaigns & Elections scorecards foreach cycle (see below). No campaign excluded from the Open Secrets dataset was listed ashaving worked with any firm on the scorecard. As a result of these additional checks, wefeel safe in assuming that these campaigns had no relationships with the firms in our list.
The combined set of available Open Secrets expenditure files for the campaigns in theDKP sample consisted of 4,410,732 reported expenditures. Our procedure for identifyingrelevant expenditures from this universe is described below.
1. We first eliminated all expenditures that were obviously not payments to consultingfirms. These included, for instance, contributions to candidates, political action com-mittees, and party committees; expenditures clearly labeled with irrelevant terms suchas “auto fuel”; and payments made to recognizable firms not on the consulting list suchas Verizon. The complete library of search terms used to eliminate these expenditureswill be archived online with our replication files at the time of this article’s publication.This step left us with 106,653 expenditures by campaigns in our sample.
2. Payments to consulting firms are not clearly labeled in the FEC data and campaignsare inconsistent in how they list recipients of outgoing payments. Firm names areduplicated both within the consulting sector and across areas of business operations
1See also Martin and Peskowitz (N.d.), who use FEC data to analyze the political consulting market.
SI: 1
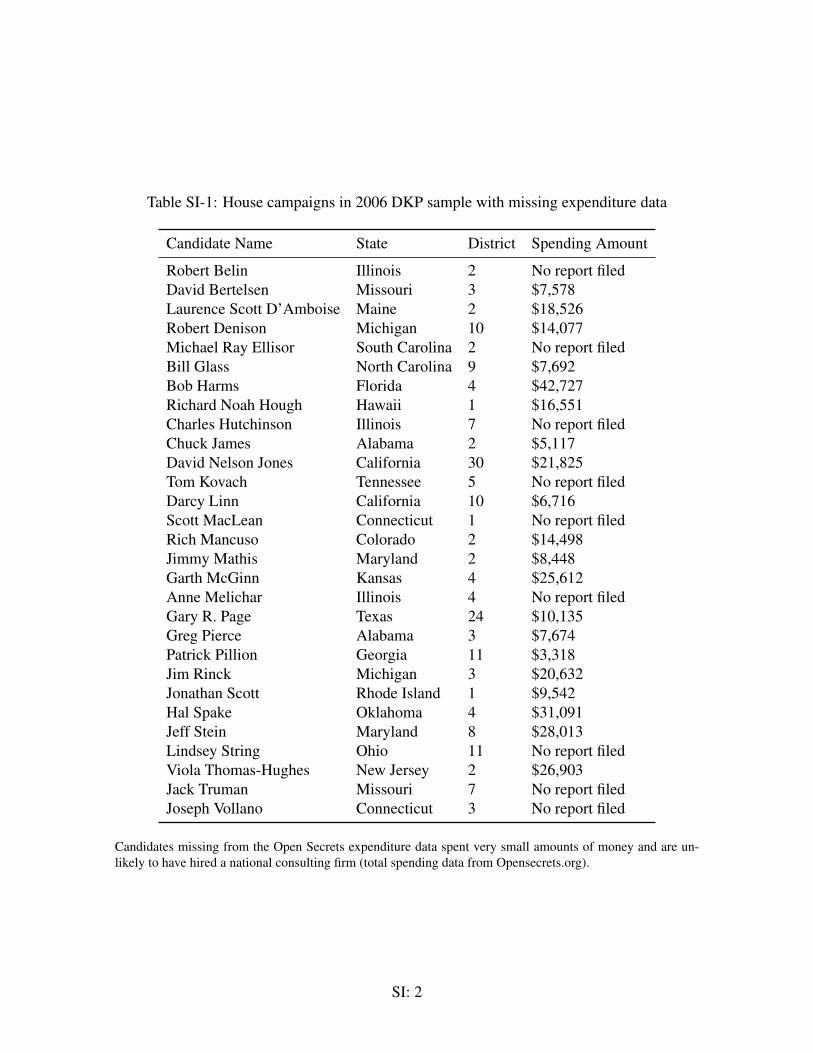
Table SI-1: House campaigns in 2006 DKP sample with missing expenditure data
Candidate Name State District Spending Amount
Robert Belin Illinois 2 No report filedDavid Bertelsen Missouri 3 $7,578Laurence Scott D’Amboise Maine 2 $18,526Robert Denison Michigan 10 $14,077Michael Ray Ellisor South Carolina 2 No report filedBill Glass North Carolina 9 $7,692Bob Harms Florida 4 $42,727Richard Noah Hough Hawaii 1 $16,551Charles Hutchinson Illinois 7 No report filedChuck James Alabama 2 $5,117David Nelson Jones California 30 $21,825Tom Kovach Tennessee 5 No report filedDarcy Linn California 10 $6,716Scott MacLean Connecticut 1 No report filedRich Mancuso Colorado 2 $14,498Jimmy Mathis Maryland 2 $8,448Garth McGinn Kansas 4 $25,612Anne Melichar Illinois 4 No report filedGary R. Page Texas 24 $10,135Greg Pierce Alabama 3 $7,674Patrick Pillion Georgia 11 $3,318Jim Rinck Michigan 3 $20,632Jonathan Scott Rhode Island 1 $9,542Hal Spake Oklahoma 4 $31,091Jeff Stein Maryland 8 $28,013Lindsey String Ohio 11 No report filedViola Thomas-Hughes New Jersey 2 $26,903Jack Truman Missouri 7 No report filedJoseph Vollano Connecticut 3 No report filed
Candidates missing from the Open Secrets expenditure data spent very small amounts of money and are un-likely to have hired a national consulting firm (total spending data from Opensecrets.org).
SI: 2

(e.g., “Advantage, Inc.”). Campaigns regularly report expenditures using vague de-scriptions, incorrect names, or both. Consulting firms may be identified by the nameof the firm, the name of the primary consultant, some combination of these, or neither.Further, examining the data shows that expenditures described using the term “con-sult” (or some variant) could indicate actual political consulting but may also indicatemeetings with a law firm, IT support, and much more. For instance, Mitt Romney’scampaign for the 2008 Republican presidential nomination described expenditures forcandidate makeup as “communications consulting” (Vogel 2007).
Given these difficulties, it was not possible to code the remaining 106,653 recordsby hand and accurately identify all expenditures to consulting firms. Instead, we usescorecards published between 1990 and 2009 cycles in the industry trade magazineCampaigns & Elections (henceforth C&E) as well as a 2008 compendium in the in-sider publication The Hotline to create a list of consulting firms we could search forin the remaining records.2 C&E allows each consulting firm to identify the kinds ofconsulting services they provide, which enables us to cast a wide net for potentiallyinfluential consulting relationships (many firms provide multiple descriptors for theservices they provide).
Our focus is on consultants that might plausibly play a role in developing broad mes-saging strategies and campaign themes (Medvic 2001b, 49-51). We therefore restrictour analysis to firms who self-identified as providing general, media, and/or pollingconsulting using the following coding scheme to classify firms:
• General consulting: “advisory,” “campaign management,” “campaign manage-ment and strategy,” “consulting,” “full service campaign firm,” “general,” “gen-eral consulting,” “general strategy,” “government affairs,” “issue advocacy,” “po-litical,” “political campaign management,” “strategic,” “strategic and organiza-tional planning,” “strategic planning”
• Media consulting: “advertising,” “media,” “media buying,” “media relations,”“media strategy and buying,” “radio,” “Spanish language media,” “television,”“television and radio advertising”
• Polling consulting: “polling”
In using this approach, we sought to cast as broad a net as possible in searching forqualifying expenditures in the FEC data while maintaining our focus on consultingfirms that were most likely to influence the general campaign strategies we measure.All firms that provided general, media, or polling consulting services to any candidatein any cycle in the 1990–2009 period were included by this procedure (C&E does notspecify which services were provided to specific campaigns). For instance, if the firmwas listed as “Direct mail” in 2002 but also “General” in 1994, the firm was codedas “General” under our scheme. Thus, only firms that never identified themselvesas being involved in general, media, or polling consulting over the entire 1990–2009time period were excluded. These excluded firms can be thought of as carrying out
2Martin and Peskowitz (N.d.) employ a similar approach.
SI: 3

campaign strategies or delivering pre-determined messages. They were typically spe-cialists in discrete functions such as fundraising, research, or list vendors. (Alternativeapproaches to identifying categories of relevant consultants are possible — see, e.g.,Herrnson 1992; Medvic and Lenart 1997.)
Finally, we developed a library of 1,101 terms that were used to identify payments inthe larger dataset that may pertain to a firm on our list. For instance, the firm Anzalone-Liszt Research provided the keywords “anzalone” and “liszt.” All payments made toany recipient whose name included those terms was flagged for further investigation.This processing step narrowed the data to a list of 47,441 expenditures.
3. Trained undergraduate research assistants coded for matches to our list of strategy,media, and polling firms generated from the C&E scorecards. Coders were also in-structed to indicate ambiguous expenditures (e.g., payments to Michael Fraioli, thefounder of Fraioli & Associates). The two coders reached identical conclusions for98% of expenditures. A few disagreements concerned ratings of expenditures as am-biguous or not; only 1.9% of cases were true disagreements. We arbitrated betweencoders in these cases, generating a set of 7,716 potential payments to consulting firmson our list.
4. We generated a list of all payment recipients from these data corresponding to our mas-ter list of firms that provided general, media, or polling consulting services during the1990–2009 period or to individuals clearly listed as employed by those firms.3 In am-biguous cases, we cross-checked payment recipients against the C&E Political Pages,an annual directory of consulting firms and consultants published in the magazine,for the 2002, 2004, and 2006 election cycles. The result of this process was a list of7,526 campaign-consultant payments totaling more than $168 million between 1,194unique campaign-consultant dyads in our sample. Finally, we sum these payments bycampaign-consultant dyad to create a total expenditure value for the cycle.
5. As a final check, we compared this list of candidate-consultant relationships in theFEC records with those reported in the scorecards published at the end of each cyclein Campaigns & Elections. The C&E scorecards, which are typically a combinationof self-reports by consulting firms and research by the magazine’s staff, are perhapsthe most comprehensive alternative source by which we can validate our data. C&Escorecards have been used as a source of data on candidate-consultant relationships innumerous published studies (Medvic and Lenart 1997; Medvic 1998, 2001a,b; Gross-man and Dominguez 2009; Cain 2011).
Table SI-2 shows the results of the comparison between FEC records and the C&Escorecards. We recover 86% (392) of the 455 candidate-consultant ties reported inC&E as well as 802 additional ties not disclosed in the magazine. In other words,roughly three times as many campaign-consultant relationships can be located in FECrecords than C&E—a level of omission that may reflect consulting firms selectively
3During this process, we eliminated alternative spellings of firm names as well as additional expendituresto firms that did not provide general, media, or polling consulting.
SI: 4

reporting from their list of clients. In addition, further research suggests that the re-lationships reported in C&E that were not also in the FEC records are false positives.Payments from these campaigns to the listed firms could not be found in the full FECexpenditures dataset. We therefore exclude dyads from C&E that could not be verifiedin the FEC data from our study.
Table SI-2: A comparison of FEC and Campaigns & Elections consultant data
Reported in C&E Not reported in C&E Total
Found in FEC data 392 802 1194Not found in FEC 63 – 63
Total 455 802 1257
ADDITIONAL RESULTS
In the main text, we measure network ties using the number of shared consultants—specifically,how many consulting firms received $25,000 or more from both candidates according to Fed-eral Election Commission expenditure records. Here, however, Tables SI-3 and SI-4 presentresults for the risk-taking and issue ownership measures of campaign strategy analyzed inthe main text using two alternative edge weight specifications—the log product of sharedconsultant expenditures and a binary indicator for having at least one consulting firm thatreceived any payment from both candidates (both are then row-standardized). Finally, TableSI-5 presents results for spatial autoregressive models of two alternate measures of campaignstrategy from Druckman, Kifer and Parkin (2009). In all cases, the spatial weight matriceswere row-standardized.
Log product of shared expenditures
We represent the two-mode network of i = 1, . . . , n candidates and j = 1, . . . ,m consultantsas an n ⇥ m adjacency matrix A where the edge weights are measured as the log of acandidate’s expenditures e on a consulting firm in a given election cycle. The edge weightbetween candidate i and consultant j is represented in the adjacency matrix A as
Ai,j =
(log(ei,j) if ei,j > 0
0 if ei,j = 0.(1)
To convert this two-mode network into a one-mode network of candidates linked by con-sultant edges, we post-multiply the adjacency matrix A by its transpose (AAT), whichgenerates a one-mode n ⇥ n candidate adjacency matrix W. In the projected candidatenetwork W, the edge weight between candidate c and candidate d is the log product of their
SI: 5

expenditures e on shared consultants among the set of consultants j = 1, . . . , s:
Wc,d =
sX
j=1
log(ec,j)⇥ log(ed,j) (2)
where ec,j represents spending by candidate c on firm j. The edge weights in the projectedmatrix thus represent the extent to which candidates spent heavily on the same consultants.
Binary ties (one or more shared consultants)
This spatial weight matrix is a binary measure indicating simply whether or not any pair ofcampaigns share a consulting firm. To convert the two-mode adjacency matrix describedin equation 3 in the main text into a one-mode network of candidates linked by consultantedges, we post-multiply the adjacency matrix A by its transpose (AAT), which generates aone-mode n⇥ n candidate adjacency matrix W. In the projected candidate network W, wethen test whether there exists at least one consultant among all consultants j = 1, . . . , s onwhom candidates c and d both spent $1 or more in a given election cycle:
Wc,d = max
s
⇣I(ec,j � $1)⇥ I(ed,j � $1)
⌘(3)
Alternate campaign strategy measures
In Table SI-5, we present results using all three adjacency matrix specifications for twoadditional measures of campaign strategy coded from campaign websites (Druckman, Kiferand Parkin 2009, 349):
• Number of positions (0–4): “the number of unambiguous issue positions (where acounter position is easily identified) offered by the candidate on the front page orissues part of the site”
• Negativity (0–1): “a dichotomous variable indicating whether a candidate includedmaterial on the site that was negative or critical of his or her opponent (in tone orexplicitly)”
The negativity measure is binary so the spatial autoregressive model we use to maintaincomparability with the other models reported above is technically a linear probability model.
FALSIFICATION TESTS
To implement these tests, we create three separate partitions of similar candidates usingmeasures available for all observations. The first partition, which we call candidate type,separately divides all the candidates by party, year, and race type (e.g., Republicans con-testing open seats in 2002). The second partition groups the candidates by district type,dividing them by tercile of district presidential vote, party, and year (e.g., Democrats in theleast favorable third of districts in 2004). Finally, the third partition divides the candidatesby region as well as party and year (e.g., Republican candidates in the Northeast in 2006).
SI: 6

Table SI-3: Autoregressive models of risk-taking (alternative adjacency matrices)
Logged dollars Binary tiesNon-incumbent Unfav. dist. Non-incumbent Unfav. dist.
Intercept 1.082 -1.215 1.083 -1.219(0.420) (0.447) (0.420) (0.446)
2004 0.457 0.505 0.456 0.503(0.262) (0.266) (0.262) (0.266)
2006 0.675 0.685 0.675 0.683(0.251) (0.257) (0.251) (0.257)
Democrat 1.183 1.288 1.182 1.286(0.207) (0.219) (0.207) (0.219)
Open seat 2.222 2.224(0.345) (0.345)
Challenger 0.986 2.678 0.986 2.681(0.249) (0.256) (0.249) (0.256)
District favorability: 2nd quartile 0.208 0.043 0.208 0.044(0.223) (0.199) (0.223) (0.199)
District favorability: 3rd quartile -0.001 -0.002(0.279) (0.279)
District favorability: 4th quartile -0.458 -0.458(0.404) (0.404)
Mid-Atlantic 0.060 0.423 0.060 0.425(0.454) (0.443) (0.454) (0.443)
Midwest 0.681 1.177 0.681 1.179(0.412) (0.425) (0.412) (0.425)
Plains 0.704 0.818 0.703 0.820(0.456) (0.483) (0.455) (0.483)
South 0.225 0.987 0.226 0.989(0.401) (0.422) (0.401) (0.422)
Border 0.281 0.761 0.281 0.763(0.429) (0.455) (0.429) (0.455)
Mountain West 0.677 1.176 0.676 1.174(0.434) (0.456) (0.434) (0.456)
West 0.452 1.175 0.451 1.175(0.503) (0.484) (0.503) (0.484)
Spatial autocorrelation⇢ 0.062 0.105 0.063 0.107
(0.053) (0.059) (0.053) (0.059)
Nested model testLR statistics 1.424 3.434 1.441 3.547
p-value 0.233 0.064 0.230 0.060
N 286 271 286 271
Models predict the Druckman, Kifer and Parkin (2009) campaign strategy measure of risk-taking among 2002–2006 House of Represen-tatives general election candidates in their sample with no missing data on covariates. Edge weights represent either the log product ofexpenditures to shared consulting firms or whether the candidates both paid $1 or more to the same consulting firm according to FederalElection Commission records; the resulting adjacency matrix is then row-standardized in either case. Favorable districts are defined asthose where the presidential nominee of the candidate’s party received 51% of the vote or more (the median value in the data); unfavorabledistricts are those in which the presidential nominee of the candidate’s party received less than 51% of the vote. Indicators for districtfavorability represent quartiles for the party presidential vote by district (see footnote 14 in the main text for details). Estimated using thelagsarlm function in the spdep package for R.
SI: 7

Table SI-4: Autoregressive models of issue ownership (alternative adjacency matrices)
Logged dollars Binary tiesNon-incumbent Unfav. dist. Non-incumbent Unfav. dist.
(Intercept) -8.255 -8.769 -8.262 -8.754(1.907) (1.977) (1.906) (1.975)
2004 -1.108 -0.559 -1.102 -0.560(1.066) (1.100) (1.065) (1.099)
2006 -0.837 -0.325 -0.832 -0.324(1.016) (1.058) (1.016) (1.057)
Democrat 9.880 10.313 9.862 10.293(0.934) (1.001) (0.934) (1.001)
Open seat 1.162 1.150(1.437) (1.435)
Challenger 1.310 1.744 1.316 1.730(1.007) (1.032) (1.006) (1.031)
District favorability: 2nd quartile 0.918 0.607 0.917 0.595(0.902) (0.824) (0.902) (0.823)
District favorability: 3rd quartile 2.295 2.290(1.113) (1.112)
District favorability: 4th quartile 0.078 0.085(1.614) (1.613)
Mid-Atlantic -1.008 -0.424 -1.006 -0.412(1.850) (1.839) (1.849) (1.837)
Midwest 2.097 2.017 2.107 2.021(1.691) (1.774) (1.690) (1.772)
Plains 2.229 4.028 2.235 4.000(1.874) (2.007) (1.873) (2.005)
South 0.839 1.220 0.857 1.223(1.643) (1.752) (1.642) (1.751)
Border 2.477 1.745 2.498 1.759(1.749) (1.891) (1.748) (1.888)
Mountain West 1.774 0.852 1.790 0.852(1.767) (1.877) (1.766) (1.874)
West -2.250 -0.829 -2.236 -0.815(2.051) (2.005) (2.050) (2.003)
Issue salience 11.225 9.279 11.214 9.297(2.658) (2.595) (2.657) (2.593)
Spatial autocorrelation⇢ 0.308 0.320 0.311 0.324
(0.067) (0.066) (0.067) (0.066)
Nested model testLR statistic 21.762 22.448 22.104 22.973
p-value 0.000 0.000 0.000 0.000
N 286 271 286 271
Models predict the Druckman, Kifer and Parkin (2009) campaign strategy measure of issue ownership among 2002–2006 House of Rep-resentatives general election candidates in their sample with no missing data on covariates. Edge weights represent either the log productof expenditures to shared consulting firms or whether the candidates both paid $1 or more to the same consulting firm according to FederalElection Commission records; the resulting adjacency matrix is then row-standardized in either case. Favorable districts are defined asthose where the presidential nominee of the candidate’s party received 51% of the vote or more (the median value in the data); unfavorabledistricts are those in which the presidential nominee of the candidate’s party received less than 51% of the vote. Indicators for districtfavorability represent quartiles for the party presidential vote by district (see footnote 14 in the main text for details). Estimated using thelagsarlm function in the spdep package for R.
SI: 8

Table SI-5: Autoregressive models of position-taking/negativity (all adjacency matrices)
Number of positions NegativityShared Logged Binary Shared Logged Binary
(Intercept) 1.122 1.068 1.069 0.157 0.159 0.160(0.205) (0.208) (0.208) (0.089) (0.089) (0.089)
2004 0.017 0.016 0.016 0.112 0.114 0.115(0.112) (0.112) (0.112) (0.049) (0.050) (0.050)
2006 0.142 0.141 0.141 0.195 0.205 0.207(0.109) (0.109) (0.109) (0.048) (0.049) (0.)049
Democrat 0.082 0.083 0.083 0.015 0.018 0.019(0.082) (0.082) (0.082) (0.036) (0.036) (0.036)
Open seat 0.533 0.530 0.530 0.260 0.262 0.263(0.138) (0.138) (0.138) (0.060) (0.060) (0.060)
Challenger 0.443 0.464 0.463 0.446 0.439 0.438(0.107) (0.107) (0.107) (0.046) (0.046) (0.046)
District favorability: 2nd quartile 0.046 0.033 0.033 -0.002 0.002 0.003(0.117) (0.117) (0.117) (0.051) (0.051) (0.051)
District favorability: 3rd quartile 0.211 0.191 0.192 -0.165 -0.157 -0.156(0.129) (0.129) (0.129) (0.056) (0.056) (0.056)
District favorability: 4th quartile 0.060 0.049 0.049 -0.195 -0.198 -0.197(0.142) (0.142) (0.142) (0.062) (0.062) (0.062)
Mid-Atlantic 0.323 0.338 0.338 -0.019 -0.017 -0.018(0.188) (0.188) (0.188) (0.082) (0.083) (0.083)
Midwest 0.156 0.162 0.162 -0.002 -0.003 -0.004(0.176) (0.176) (0.176) (0.077) (0.078) (0.078)
Plains 0.458 0.452 0.452 0.022 0.021 0.021(0.201) (0.200) (0.200) (0.088) (0.088) (0.088)
South 0.194 0.208 0.208 -0.046 -0.047 -0.048(0.169) (0.168) (0.168) (0.074) (0.074) (0.074)
Border 0.178 0.179 0.179 0.030 0.033 0.032(0.187) (0.187) (0.187) (0.082) (0.082) (0.082)
Mountain West 0.358 0.353 0.354 0.033 0.040 0.040(0.182) (0.182) (0.182) (0.080) (0.080) (0.080)
West 0.295 0.291 0.291 -0.019 -0.028 -0.028(0.212) (0.212) (0.212) (0.093) (0.093) (0.093)
Spatial autocorrelation⇢ 0.044 0.076 0.075 0.118 0.056 0.049
(0.041) (0.043) (0.043) (0.058) (0.063) (0.063)
Nested model testLR statistic 1.209 3.155 3.062 4.542 0.867 0.663
p-value 0.272 0.076 0.080 0.033 0.352 0.415
N 545 545 545 541 541 541
Models predict the Druckman, Kifer and Parkin (2009) campaign strategy measures of number of positions taken and negativity among2002–2006 House of Representatives general election candidates in their sample with no missing data on covariates. Edge weights repre-sent either the number of consulting firms that received $25,000 or more from both candidates according to Federal Election Commissionrecords; the log product of expenditures to shared consulting firms; or whether the candidates both paid $1 or more to the same consultingfirm. In all cases, the resulting adjacency matrix is then row-standardized. Indicators for district favorability represent quartiles for theparty presidential vote by district (the least favorable quartile is the omitted category; see footnote 14 for details). Estimated using thelagsarlm function in the spdep package for R.
SI: 9

We then randomly permute the consultant ties for candidates within each partition, creating500 permuted sets of consultant ties.4
Table SI-6: Illustration of falsification test procedure
Actual data
Murphy Axelrod Harrison Kiley . . .
Stephanie Herseth 2002 1 0 0 0Bob Etheridge 2002 1 0 0 0Rahm Emanuel 2002 0 1 0 0Patrick Kennedy 2002 0 1 1 1...
Randomly permuted data
Murphy Axelrod Harrison Kiley . . .
Stephanie Herseth 2002 0 1 1 1Bob Etheridge 2002 0 1 0 0Rahm Emanuel 2002 1 0 0 0Patrick Kennedy 2002 1 0 0 0...
Table SI-6 provides an example of how this process works using a group of four Demo-cratic incumbents from 2002 and a subset of the consultants they used in the cycle (MurphyPutnam Media, Axelrod & Associates, Harrison & Goldberg, and Kiley & Company). In theexample, the firms contracted by Bob Etheridge and Rahm Emanuel (highlighted in bold)are hypothetically switched, as are the consultants used by Stephanie Herseth and PatrickKennedy (who are indicated by italics).
After randomly permuting consultant ties among similar candidates in this way, we re-calculate our spatial weight matrix W and refit the models reported in the first and thirdcolumns of Table 2 for each of 500 randomly permuted adjacency matrices. The likelihoodratio statistics from these falsification tests, which are summarized in Figure SI-3, offer littleindication that our results are spurious. As noted in the main text, the observed likelihoodratio statistic exceeds 95% or more of the simulated values for each partition of the data onboth dependent variables, suggesting that our results are not driven by clustering in consul-tant selection among structurally similar candidates.
4More precisely, we permute the candidate-consultant adjacency matrix, shuffling the vectors representingconsultant ties within each group of similar candidates.
SI: 10

Figure SI-3: Falsification test results
0 2 4 6 8 10
0.0
0.1
0.2
0.3
0.4
0.5
0.6
Risk: Permutations by candidate type
Den
sity
50% 90% 95% 99%
Observed value
10 20 30 40 50 60
0.00
0.01
0.02
0.03
0.04
Issues: Permutations by candidate type
Observed value
50% 90% 95% 99%
0 2 4 6 8 10 12
0.0
0.1
0.2
0.3
0.4
0.5
Risk: Permutations by district type
Den
sity
50% 90% 95% 99%
Observed value
10 20 30 40 50
0.00
0.01
0.02
0.03
0.04
Issues: Permutations by district type
Observed value
50% 90% 95% 99%
0 2 4 6 8 10
0.0
0.1
0.2
0.3
0.4
0.5
0.6
0.7
Risk: Permutations by region
Likelihood ratio statistic (Monte Carlo)
Den
sity
Observed value
50% 90% 95% 99%
10 20 30 40 50 60
0.00
0.01
0.02
0.03
0.04
0.05
Issues: Permutations by region
Likelihood ratio statistic (Monte Carlo)
Observed value
50% 90% 95% 99%
The figures show the distribution of estimated likelihood ratio statistics as estimated using random permutationof the observed adjacency matrix. The vertical dashed lines show the observed LR statistic as estimated in thefirst and third columns of 2. Note that the observed value is larger than nearly all of the estimates generatedusing the random permutations, indicating a reduced risk that our results reflect a spurious relationship.
SI: 11