Embed Size (px)
Citation preview

Martina Martinello - on behalf of the FNAL SRF team
CEC-ICMC 2019, Superconducting RF Cavity Materials
23 July 2019
Connecting Cavity Performance to Physics
of the Surface

Outline
• Introduction
• N-doping: the treatment for high-Q
• N-infusion: the treatment for high-Q
at high-G
• Mild baking for high-G
• Conclusions
Martina Martinello | Connecting cavity performance to physics of the surface2

Martina Martinello | Connecting cavity performance to physics of the surface3
Introduction

Particle Acceleration via SRF Cavities
• Superconducting radiofrequency (SRF) cavities
• High quality EM resonators: Typical Q0 > 1010
• Large electric field generated along the cavity axis
• Particle beam gains energy as it passes through
Slowed down by factor of approximately 4x10⁹Input RF power at 1.3 GHz
~1 m Images from linearcollider.org, WIkipediaMartina Martinello | Connecting cavity performance to physics of the surface
Niobium
4
Slide courtesy of S. Posen

Martina Martinello | IPAC 2018, Vancouver
Superconducting RF Cavities
• Niobium (Tc=9.2 K), T operation 2 - 4.5 K
• RF surface resistance → fighting against nW
• Losses concentrate on the first ~100 nm of the inner surface
By(0)
λL~40 nm
𝐵𝑦 = 𝐵 0𝑒−𝑥/𝜆𝐿
RF field
He bath
Niobium
Nb2O5
Nb
Final surface treatment is
crucial to performance

Beam view, inside the cavity
Anna Grassellino - ICFA 2017
Extreme attention to surface treatments and surface cleanliness are mandatory
Slide courtesy of Anna Grassellino – IPAC 2017

Key to progress for superconducting RF cavities
• Cavity surface undergoes a series of delicate chemical and heat treatments
• Material science tools are essential to understand the surface nano-
structural changes that lead to dramatic changes in performance
Anna Grassellino - ICFA 2017
24
the baked Nb has a layered structurethat consists of
1. dirty Nb layer and
2. clean bulk Nb.
A. Romanenko et al., Appl. Phys. Lett. 104, 072601 (2014)
Dirty Nb Clean Nb
At the present day, we know
Copper&
Nb&layer&
N"#reconstruc, on# O"#reconstruc, on#
Slide courtesy of Anna Grassellino - IPAC 2017

Martina Martinello | Connecting cavity performance to physics of the surface
0 5 10 15 20 25 30 35 4010
9
1010
1011
Q0
Eacc
(MV/m)
T= 2K
Standard ILC cavity Q-factor (𝑄0):
𝑄0 =𝐺
𝑅𝑠=𝜔0𝑈
𝑃𝑑
High 𝑄0 → lower power consumption
Accelerating field (𝐸𝑎𝑐𝑐):
Determine the energy transferred tocharged particles
High 𝐸𝑎𝑐𝑐 → lower accelerator length
High Q at large gradient may reduce both capital and operational costs of accelerators
SRF Cavities Figure of Merits
𝑅𝑠 = 𝑅𝐵𝐶𝑆(𝑇) + 𝑅𝑟𝑒𝑠
High-Q
High-gradients
8

State-of-the-art treatments
Martina Martinello | Connecting cavity performance to physics of the surface9
High-Q0(e.g. LCLS-II)
High-Q0
High-Eacc(e.g. ILC)
High-Eacc(e.g. ILC)
Slide courtesy of Mattia Checchin – TTC Riken 2018

Martina Martinello | Connecting cavity performance to physics of the surface10
N-doping: the treatment for
high-Q
High-Q0 treatments
Martina Martinello | Connecting cavity performance to physics of the surface11
High-Q0(e.g. LCLS-II)
Slide courtesy of Mattia Checchin – TTC Riken 2018

N-doping treatment
Martina Martinello | Connecting cavity performance to physics of the surface12
800C UHV, 3 hours
800C N2
injection p=25mTorr
800C N2 2 minutes
800C UHV, 6 minutes
UHV cooling 5 um EP
Nb

N-doping treatment
Martina Martinello | Connecting cavity performance to physics of the surface13
800C UHV, 3 hours
800C N2
injection p=25mTorr
800C N2 2 minutes
800C UHV, 6 minutes
UHV cooling 5 um EP
N2
Nb

N-doping treatment (example: the “2/6 recipe”)
Martina Martinello | Connecting cavity performance to physics of the surface14
N2
N
Nb
800C UHV, 3 hours
800C N2
injection p=25mTorr
800C N2 2 minutes
800C UHV, 6 minutes
UHV cooling 5 um EP

N-doping treatment (example: the “2/6 recipe”)
Martina Martinello | Connecting cavity performance to physics of the surface15
Nb
N
N In
terstitial800C UHV, 3
hours
800C N2
injection p=25mTorr
800C N2 2 minutes
800C UHV, 6 minutes
UHV cooling 5 um EP

N-doping treatment (example: the “2/6 recipe”)
Martina Martinello | Connecting cavity performance to physics of the surface16
Nb
N
N In
terstitial800C UHV, 3
hours
800C N2
injection p=25mTorr
800C N2 2 minutes
800C UHV, 6 minutes
UHV cooling 5 um EP

N-doping treatment (example: the “2/6 recipe”)
17
Nb
N In
terstitial
N
NbxNy
~2 𝜇𝑚
Y. Trenikhina et al, Proc. of SRF 2015
800C UHV, 3 hours
800C N2
injection p=25mTorr
800C N2 2 minutes
800C UHV, 6 minutes
UHV cooling 5 um EP
Martina Martinello | Connecting cavity performance to physics of the surface

N-doping treatment (example: the “2/6 recipe”)
Martina Martinello | Connecting cavity performance to physics of the surface18
N
Nb
N In
terstitial
Final RF Surface
800C UHV, 3 hours
800C N2
injection p=25mTorr
800C N2 2 minutes
800C UHV, 6 minutes
UHV cooling 5 um EP

N-doping treatment (example: the “2/6 recipe”)
Martina Martinello | Connecting cavity performance to physics of the surface19
N
Nb
800C UHV, 3 hours
800C N2
injection p=25mTorr
800C N2 2 minutes
800C UHV, 6 minutes
UHV cooling 5 um EP
N In
terstitial
Only Nb from TEM/NED spectra:
N must be interstitial
Final RF Surface
Y. Trenikhina et Al, Proc. of SRF 2015

N-doping: reversal of BCS surface resistance
Martina Martinello | Connecting cavity performance to physics of the surface
2 4 6 8 10 12 14 16 184
6
8
10
standard treatment
standard treatment
nitrogen treatment
nitrogen treatment
R2K
BC
S (
nW
)
Eacc
(MV/m)
20
𝑅𝑠 𝑇 = 𝑅𝐵𝐶𝑆 𝑇 + 𝑅𝑟𝑒𝑠
A. Grassellino et al., Supercond. Sci. Technol. 26 102001 (2013) - Rapid Communications A. Romanenko and A. Grassellino, Appl. Phys. Lett. 102, 252603 (2013)M. Martinello et al., App. Phys. Lett. 109, 062601 (2016)
Anti-Q-slope emerges from the BCSsurface resistance decreasing withRF field

Qualitative description of the 𝑹𝑩𝑪𝑺 reversal
Martina Martinello | Connecting cavity performance to physics of the surface21
Equilibrium distribution of QPs
Non-equilibrium distribution of QPs
Smaller with non-equilibrium QPs distribution
QP are driven out-of-equilibrium by microwave absorption eventually reaching a steady state
𝑓 𝐸 − 𝑓(𝐸 + ℏ𝜔) 𝑓 𝐸 − 𝑓(𝐸 + ℏ𝜔)
M. Martinello et al., Phys. Rev. Lett. 121, 224801 (2018)
Strong “non-BCS” frequency dependence is observed
Slide courtesy of M. Checchin

Martina Martinello | Connecting cavity performance to physics of the surface22
N-infusion: the treatment for
high-Q at high-G

High-Eacc and high-Q0/high-Eacc treatments
Martina Martinello | Connecting cavity performance to physics of the surface23
High-Q0
High-Eacc(e.g. ILC)
High-Eacc(e.g. ILC)
Slide courtesy of Mattia Checchin – TTC Riken 2018

Example of N-infusion processing sequence
Martina Martinello | Connecting cavity performance to physics of the surface24
• Bulk electro-polishing
• High T furnace (with caps to avoid furnace contamination):
• 800C 3 hours HV
• 120C 48 hours with N2 (25 mTorr)
• NO chemistry post furnace
• HPR, VT assembly
Protective caps and foils areBCP’d prior to every furnacecycle and assembled in cleanroom, prior to transportingcavity to furnace areaA. Grassellino et al., arXiv:1305.2182
A. Grassellino et al 2017 Supercond. Sci. Technol. 30 094004
160 C
48 h 96 h
25 mTorr
10-5 mTorr

From N-doping to N-infusion
Martina Martinello | Connecting cavity performance to physics of the surface25
By N-doping Nb cavities at lower temperatures (N-infusion) we can tune the Q-factor:
⇒ strong effects on the BCS and residual resistance
A. Grassellino et al., Supercond. Sci. Technol. 30, 094004 (2017)
Slide courtesy of Mattia Checchin – TTC Riken 2018

0 20 40 60 80 100 120 140 160 180 2001E-4
0.001
0.01
0.1
1
10
100
1000
10000
No
rmal
ized
inte
nsi
ty
Sputter time (s)
EP + 120 C N-infused
Nb2O5-
NbN-
EP
Nb2O5-
NbN-
Impurity profiles in cavity cutouts by TOF-SIMS
Martina Martinello | Connecting cavity performance to physics of the surface26
Nitrogen diffuses within ~ 20 nm
Comparing EP cavity cutout with EP + 120 C 48h N-infused cavity cutout
Oxide
A. Romanenko et al., IPAC 2018M. Checchin et al., IPAC 2018
N-infused cavities are an example of layered superconductors• N-enriched layer in
the first ~ 20 nm
Slide courtesy of Mattia Checchin – TTC Riken 2018

Martina Martinello | Connecting cavity performance to physics of the surface
Comparison N-doped vs N-infusion
27
80
100
120
140
160
180
200
0 10 20 30 40 50
0.001
0.01
0.1
1
10
100
1000
HF
QS
onse
t (m
T)
EP + 120 C N-infused
aes010
aes015
Double exp. fit
HFQS onset for EP
oxide
layer
Inte
nsi
ty n
orm
to N
b-
Depth (nm)
EP + 120 C N-infused
NbN-
Nb2O5-
EP
NbN-
Nb2O5-
• N-doped N profiles
are up to ~ 50 𝜇𝑚deep
• N-infused N profiles
are ~ 20 𝑛𝑚 deep
N-doped
N-infusion
Slide courtesy of Mattia Checchin – TTC Riken 2018
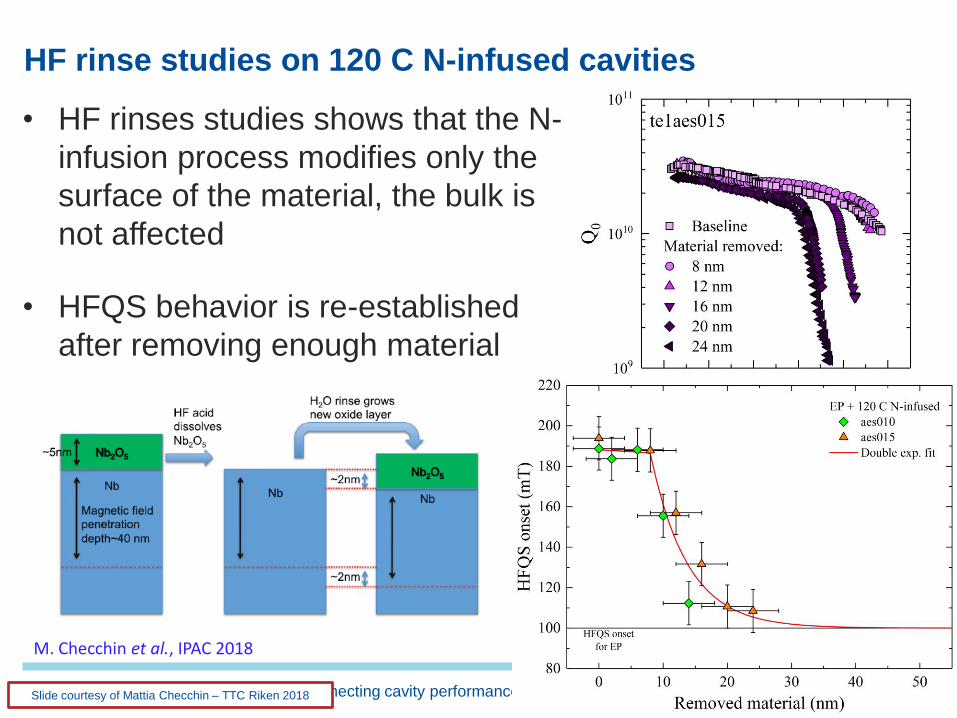
HF rinse studies on 120 C N-infused cavities
• HF rinses studies shows that the N-
infusion process modifies only the
surface of the material, the bulk is
not affected
• HFQS behavior is re-established
after removing enough material
Martina Martinello | Connecting cavity performance to physics of the surface28
M. Checchin et al., IPAC 2018
Slide courtesy of Mattia Checchin – TTC Riken 2018

RF and TOF-SIMS data comparison
Martina Martinello | Connecting cavity performance to physics of the surface29
• Onset of HFQS in 120C N-infused cavities inagreement with thediffusion profile ofnitrogen
• Oxygen and carbonare changing in a scalelength not relevant forHFQS
N-infusion performance dictated by the nitrogen profile
80
100
120
140
160
180
200
0 10 20 30 40 50
0.001
0.01
0.1
1
10
100
1000
HF
QS
on
set
(mT
)
EP + 120 C N-infused
aes010
aes015
Double exp. fit
HFQS onset for EP
oxide
layer
Inte
nsi
ty n
orm
to
Nb
-
Depth (nm)
EP + 120 C N-infused
NbN-
Nb2O5-
EP
NbN-
Nb2O5-
M. Checchin et al., IPAC 2018
Slide courtesy of Mattia Checchin – TTC Riken 2018
Martina Martinello | Connecting cavity performance to physics of the surface30
Mild baking for high-G

120 C modified
Martina Martinello | Connecting cavity performance to physics of the surface31 Slide courtesy of Yulia Trenikhina – SRF 2015

Martina Martinello | Connecting cavity performance to physics of the surface32
Hypothesis of HFQS and mild baking effect
• HFQS most likely due to nano-hydrides at the surface of EP and BCPcavities (A. Romanenko et.al., Supercond. Sci. Technol. 26, 035003 (2013))
• Mild T (120C) baking allows for vacancies precipitation -> creationof vacancy-hydrogen complexes rather than NbH precipitates (A.
Romanenko et.al., Appl. Phys. Lett. 10, 232601 (2013))
Normal conducting hydrides of size d
are superconducting by proximity effect
up to the breakdown field Hb ~ 1/dY. Trenikhina et al., Journ. of App. Phys. 117, 154507 (2015);

Martina Martinello | Connecting cavity performance to physics of the surface33
Hypothesis of HFQS and mild baking effect
Y. Trenikhina et al., Journ. of App. Phys. 117, 154507 (2015);
• Positron annihilation studies show
possible presence of vacancy-hydrogen
complexes in 120C bake cut-outs
• Low-energy uSR shows reduced mean-
free-path in the near surface region
• HFQS most likely due to nano-hydrides at the surface of EP and BCPcavities (A. Romanenko et.al., Supercond. Sci. Technol. 26, 035003 (2013))
• Mild T (120C) baking allows for vacancies precipitation -> creationof vacancy-hydrogen complexes rather than NbH precipitates (A.
Romanenko et.al., Appl. Phys. Lett. 10, 232601 (2013))

0 10 20 30 40 50109
1010
1011
120 C N-infused
aes015
pav007
120 C standard
acc003
acc005
120 C modified
aes009
1de3
Q0
Eacc (MV/m)
120 C modified
Martina Martinello | Connecting cavity performance to physics of the surface34
~1.3 times higher gradient
UP TO ~ 49 𝑀𝑉/𝑚
A. Grassellino et al., to be published (2018)
Slide courtesy of Mattia Checchin – TTC Riken 2018
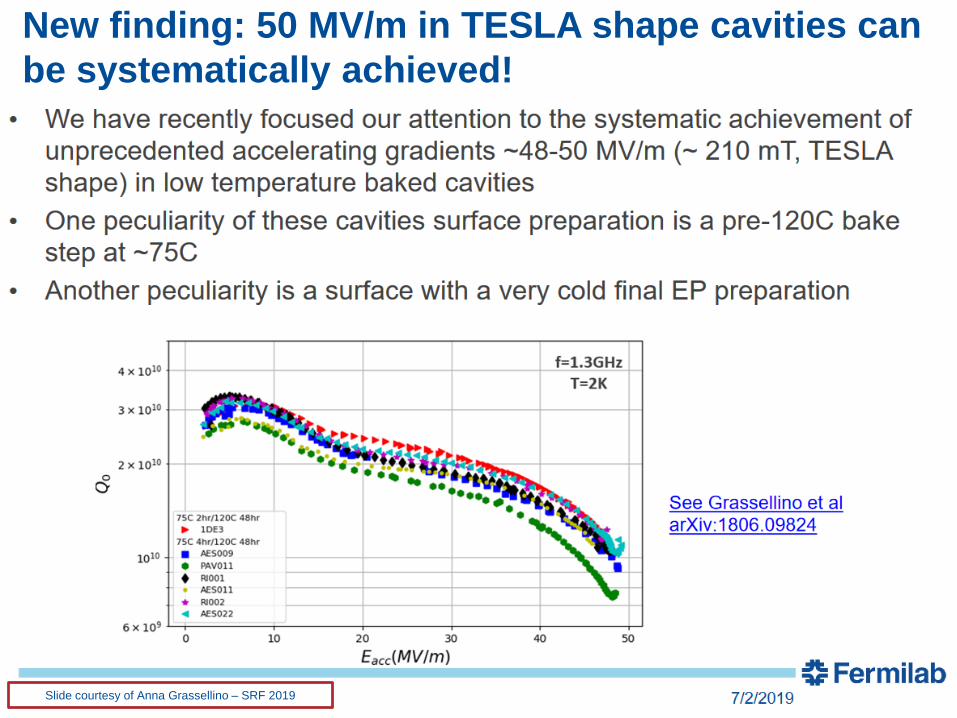
New finding: 50 MV/m in TESLA shape cavities can
be systematically achieved!
Martina Martinello | Connecting cavity performance to physics of the surface35 Slide courtesy of Anna Grassellino – SRF 2019

New finding: 50 MV/m in TESLA shape cavities can
be systematically achieved!
Martina Martinello | Connecting cavity performance to physics of the surface36 Slide courtesy of Anna Grassellino – SRF 2019

New finding: 50 MV/m in TESLA shape cavities can
be systematically achieved!
Martina Martinello | Connecting cavity performance to physics of the surface37
Switch in performance connected to different formation of NbH ?-> On-goingstudy by A. Grassellino and D. Bafia. See also Z. Sung (FNAL) talk
Slide courtesy of A. Grassellino
Slide courtesy of Anna Grassellino – SRF 2019

Summary material properties for high-gradient
Martina Martinello | Connecting cavity performance to physics of the surface38
• 120 C baking
• 120 C N-infusion• EP/BCP
• N-doped
High 𝜅layer
Low 𝜅bulk
Constant 𝜅 bulk
𝑱𝑅𝐹 𝑱𝑅𝐹
Material analysis suggest that cavities that leads to high-
gradients shows a high κ layer at the surface
Higher T infusion and modified 120 C baking are still being
investigated
Slide courtesy of Mattia Checchin – TTC Riken 2018

Theoretical explanation for quench field improvement
1. Calculations of the max field sustainable by the cavity in case of a layered
S-S structure (dirty superconductor on top of a clean bulk superconductor):
• W. Ngampruetikorn et al., TTC Workshop, Fermilab, USA (2017)• T. Kubo, TTC Workshop, CEA-Saclay, France (2016)• T. Kubo, Supercond. Sci. Technol. 30, 023001 (2017)• M. Checchin et al., to be published (2018)
Martina Martinello | Connecting cavity performance to physics of the surface39
In all these theories, layered S-Sstructures may either add an energybarrier or enhance the Bean-Livingstonbarrier depending on the thickness:
• Vortex penetration is less favorable
• Vortex nucleation is less sensitive todefects at the surface
2. New idea: Vortex nucleation is governed by the characteristic time scale oforder parameter changes, so-called τΔ. Presence of impurities may slower the e-phscattering time (A. Romanenko et. Al, IPAC 2018 and SRF 2019)

Martina Martinello | Connecting cavity performance to physics of the surface40
Conclusions

• Constant profile of N (and perhaps other impurities) within the
penetration depth of the SC allow to obtain the highest Q at
medium field
• Small dirty layer of N within first nanometers help to achieve
systematically 45 MV/m
• Presence of vacancies/hydrogen-vacancy complexes within
the first nanometers help to increase the maximum
achievable gradient up to 50 MV/m
• Characteristic of material within the first tens of nanometers is
crucial to determine cavity performance
• Material science is the key to make progress in SRF
Conclusions
Martina Martinello | Connecting cavity performance to physics of the surface41
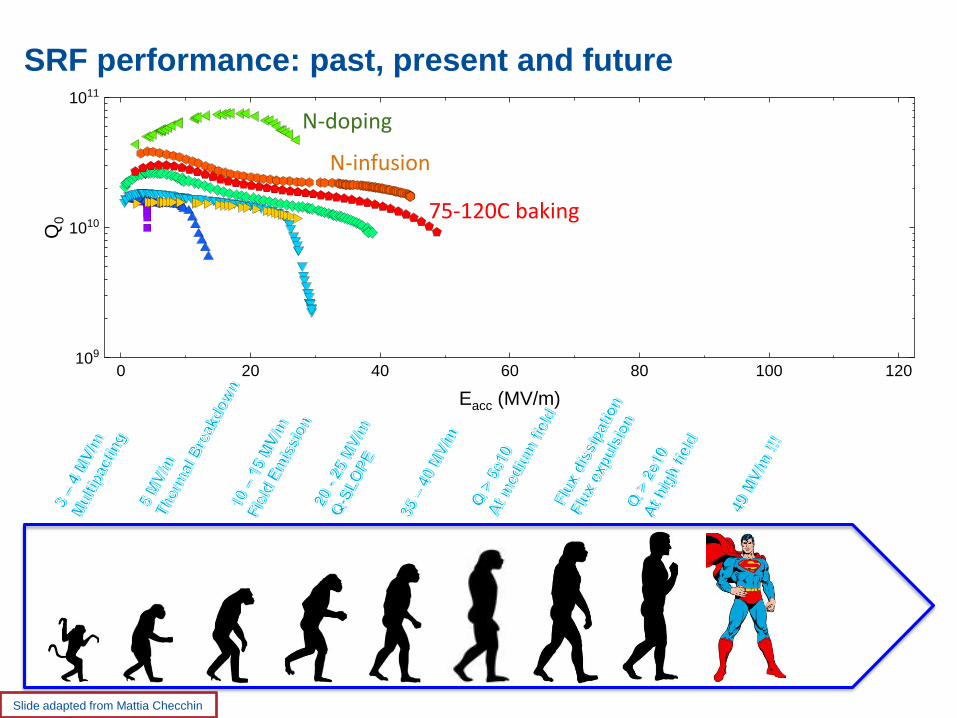
0 20 40 60 80 100 120109
1010
1011
Q0
Eacc (MV/m)
SRF performance: past, present and future
Slide adapted from Mattia Checchin
N-doping
N-infusion
75-120C baking

0 20 40 60 80 100 120109
1010
1011
Q0
Eacc (MV/m)
SRF performance: past, present and future
?
Enabling future efficient High Energy Machines
Slide adapted from Mattia Checchin

Acknowledgements
Martina Martinello | Connecting cavity performance to physics of the surface44
Thanks to Fermilab SRF
Measurement and Research
Department for contributions
with graphs, slides, etc.

Thank you for your
attention!


![DETAILED OBSERVATIONS ON A STARTING MECHANISM … · super-cavitation with clear cavity surface and cavity pressure near vapor one [14]. In the transition stage, namely from sub-](https://img.dokumen.tips/doc/110x75/5b4f640d7f8b9a346e8c3145/detailed-observations-on-a-starting-mechanism-super-cavitation-with-clear-cavity.jpg)