Embed Size (px)
Citation preview

1 July 2011
Connecticut Terrain Datasets
Table of Contents
Table of Contents .................................................................................................................................... 1
Introduction ............................................................................................................................................. 2
Terrain Dataset Structure and Components ............................................................................................ 2
Connecticut Terrain Dataset, version 1 ................................................................................................... 3
Connecticut Terrain Dataset, version 2 ................................................................................................... 3
How a Terrain Dataset Works................................................................................................................. 4
Advantages of Terrain Datasets .............................................................................................................. 4
Using Terrain Dataset Layer Files .......................................................................................................... 5 Performance ........................................................................................................................................ 6 Pyramids ............................................................................................................................................. 6 Properties: Display .............................................................................................................................. 7 Properties: Symbology ........................................................................................................................ 8 Properties: Analysis .......................................................................................................................... 10
Using the 3D Analyst Toolbar .............................................................................................................. 11
A Brief Explanation of Lidar ................................................................................................................ 13

2 July 2011
Introduction A terrain dataset is a relatively new tool in ArcGIS designed to help users store, display, and analyze elevation or bathymetry data. It is made to work well with very large data sources, such as lidar points. A terrain dataset can display many types of information including elevation, slope, aspect, and contour lines. It can be used to create derived products including digital elevation models (DEMs) and contour lines.
Terrain Dataset Structure and Components
Terrain datasets reside in a geodatabase, inside a feature dataset along with the feature classes that are used to construct them. Each component of the feature dataset is described below:
• Terrain surface: this is used to view the terrain. The surface is generated “on the fly” from the masspoints and boundary polygon data. This means that no actual data is stored in the terrain surface.
• Masspoints: a dataset (often very large in size) containing points that are often derived from lidar
data. These data are the source of the elevation information in the terrain.
• Boundary polygon: a polygon used to clip the terrain surface to a boundary. Without a boundary polygon, the algorithm that creates the terrain surface would connect the points around the exterior of the data area, generating erroneous information.
Terrain with no boundary polygon Same terrain with boundary polygon
• Breakline (optional): a line that represents a distinct interruption in the surface of a slope, such as a road or stream. These are often used to ensure that bodies of water are displayed accurately. Breaklines should have z-values (ie, they should be 3D features) to be effective in the terrain. Breaklines are often included with lidar data.
Boundary polygons
Masspoints
Terrain surface
Feature dataset Geodatabase

3 July 2011
Connecticut Terrain Dataset, version 1
The Connecticut Terrain Dataset version 1 (file name: CT_terrain_v1), includes two masspoints, listed above in the map legend. The USGS Topographic Map Points are being used to fill in gaps in Connecticut 2000 LiDAR. There are also two boundary polygons: Connecticut Boundary and Connecticut 1:125,000-scale Boundary. They are used as a boundary polygon at different scales because they differ in resolution – Connecticut Boundary shows a more detailed and accurate version of the coastline than Connecticut 1:250,000-scale Boundary, but at large scales this detail is not needed and the terrain draws more quickly when a simpler boundary polygon is used. There are no breaklines used in this terrain because none were included with the 2000 lidar data for Connecticut.
Connecticut Terrain Dataset, version 2
The Connecticut Terrain Dataset version 2 (file name: CT_terrain_v2) includes four masspoints, listed above in the map legend. Its purpose is to display the best available lidar data in all areas of the state; therefore, the level of detail varies depending on the underlying source data. As in version 1, the USGS Topographic Map Points are included to fill in gaps in the Connecticut 2000 LiDAR.

4 July 2011
The boundary polygon used in this terrain is Connecticut LiDAR Data Boundary, which delineates the areas covered by LiDAR data from either 2000, 2004, or 2006. This boundary polygon is used because it encompasses all the available LiDAR data points; if a state boundary polygon had been used it would have excluded data points that are just off the coast. There are no breaklines used in the terrain. Although the Connecticut Coastline 2006 LiDAR data included breaklines, they were not included because none of the other LiDAR data sources included breaklines.
How a Terrain Dataset Works The terrain surface is similar in many ways to a vector-based data structure called a TIN (triangulated irregular network). TINs and terrains both model an elevation surface by constructing contiguous, non-overlapping triangles using the source data points (lidar points) as vertices with x, y, and z coordinates. Terrains and TINs look nearly identical and can be used in similar ways. However, terrains are designed with large datasets such as lidar in mind. They do not have point limits like TINs and the surface is generated “on the fly” directly and relatively quickly from the lidar points. It uses pyramids to provide scale-dependent level of detail (see Pyramids).
Lidar points Triangulated edges Terrain surface
Advantages of Terrain Datasets
• Built-in ability to display the terrain as elevation, slope, aspect, contours, or other representations • Optimized for relatively quick display of large datasets based on the required level of detail and
area of interest. The resolution of the terrain changes as the user zooms in and out to prevent the drawing of unnecessary detail.
• Can be used to create digital elevation models (DEMs), contours, and other derived datasets. • Can be modified and updated over time by adding, removing, and editing the source feature
classes. • Can be used with various tools for tasks such as: visibility analysis, calculating surface area and
volume, creating profile graphs, and adding z-values to other feature classes

5 July 2011
Using Terrain Dataset Layer Files Group layer files are provided with the Connecticut terrain datasets. They contains four different layers: contours, elevation, slope, and aspect, which are all different representations of the same terrain dataset being derived “on the fly.” When the group layer files are opened in ArcMap, by default only the elevation layer will be displayed.
Elevation Slope
Contours Aspect

6 July 2011
Performance Because they draw upon large amounts of data, terrain datasets can be slow to display in ArcMap. Using a scale threshold may help with this problem. The scale threshold only allows the terrain dataset to display at certain map scales. This technique could be useful for users who will be zooming in and out frequently. A scale threshold can be set for a layer in ArcMap by opening its Layer Properties window and setting a scale range under the “General” tab.
Pyramids Like some other data layers, a terrain dataset contains pyramids. The pyramids improve the drawing speed of the terrain by only displaying the level of detail necessary at the current scale of the display. When zooming in and out of the map, the terrain layers sometimes re-draw to display more or less detail. The current pyramid level of the display is shown in the table of contents below the layer name (see below, on the left). A list of all the pyramid levels and the map scale at which they display can be found in the terrain properties window (see below, on the right), but only when accessed from ArcCatalog – the properties window contains different information in ArcMap and ArcCatalog.

7 July 2011
Properties: Display In ArcMap, the Layer Properties window of a terrain data layer contains a few elements that are different from other types of data. The main differences are in the Display, Symbology, and Analysis tabs. This window can be accessed by right-clicking the layer name in the table of contents and selecting “Properties.”
Most of the settings in the Display tab have to do with how the terrain data layer draws using pyramids. The default settings of the layer files are sufficient for most purposes. At the bottom of the window is the familiar option to set the layer’s transparency. Each of the settings is explained on the ArcGIS online help site on the “Terrain layer properties in ArcMap” page, located at http://help.arcgis.com/en/arcgisdesktop/10.0/help/index.html#/Terrain_layer_properties_in_ArcMap/005v00000017000000/.

8 July 2011
Properties: Symbology As in other layers, the Symbology tab allows users to select colors and set classification schemes for the layer. However, the terrain dataset symbology tab also allows the user to display different representations of the underlying terrain data – for example, slope or contour lines. Since the group layer file for this terrain dataset contains layers that display the more common representations (contour lines, elevation, slope, and aspect) most users will not need to delve into other representations. These steps describe how to add and symbolize a new representation, which is also called a symbology renderer:
1. In the Layer Properties window’s Symbology tab, select the Add button.
2. In the Add Renderer window, select the desired renderer (for instance, “nodes with the same symbol”, which will display all the data points used to construct the terrain) and select Add.
3. Select Dismiss.

9 July 2011
4. The new renderer will appear in the Show window on the left side of the Layer Properties
window, as shown above. Each of the renderers checked in the Show window will draw, one on top of another. It may be necessary to change the order (use the arrows below the Show window) or un-check one or more renderers.
5. To change the symbology of a renderer, make sure it is highlighted in the Show window and then use the symbology settings on the right. For example, the “Nodes” renderer is highlighted above.
6. Select OK after all the desired renderers have been added and symbolized.
Above: An example of a terrain dataset with two renderers drawn on top of each other (Nodes and Elevation). In most cases, having only one renderer turned on at a time will produce the best results.
Show window
10 July 2011
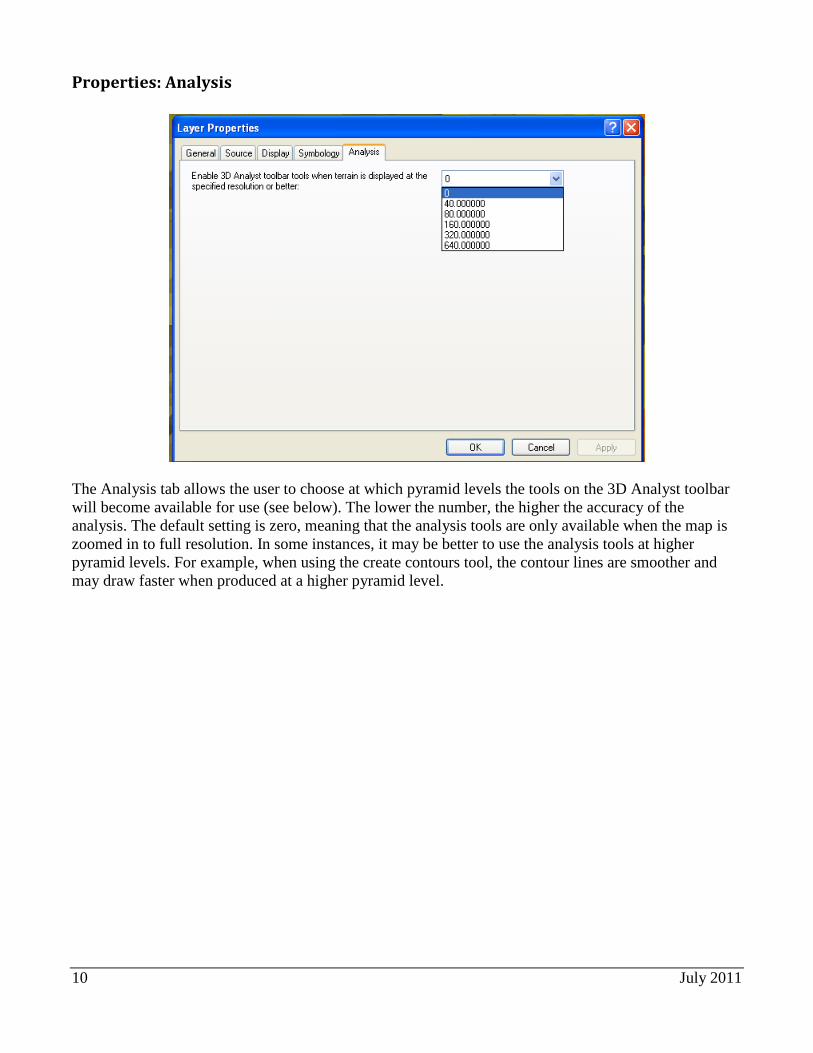
Properties: Analysis
The Analysis tab allows the user to choose at which pyramid levels the tools on the 3D Analyst toolbar will become available for use (see below). The lower the number, the higher the accuracy of the analysis. The default setting is zero, meaning that the analysis tools are only available when the map is zoomed in to full resolution. In some instances, it may be better to use the analysis tools at higher pyramid levels. For example, when using the create contours tool, the contour lines are smoother and may draw faster when produced at a higher pyramid level.

11 July 2011
Using the 3D Analyst Toolbar The 3D Analyst toolbar has tools that can be used on a 3D surface such as a terrain dataset to interpolate heights, create contour lines, draw a steepest path, draw a line of sight, or make a profile graph. To use the 3D Analyst toolbar, the 3D Analyst extension must be enabled. Go to the Customize menu and click Extensions. Check the box next to 3D Analyst to enable, then select Close. To open the 3D Analyst toolbar, right-click the space next to the menus at the top of the screen and a list of toolbars will pop up. Select 3D Analyst.

12 July 2011
On the toolbar, be sure that the drop-down menu next to the word Layer is set to the layer that will be used for the analysis.
Create contours: Click anywhere on the map to draw a single contour line that runs through all contiguous points with equal elevation.
Create steepest path: Calculates the direction a ball would take if released at a given point. Could be used to evaluate runoff patterns. The resulting line can be used to create a profile graph (see below).
Create line of sight: Creates a line between two points that shows where along the line the view is obstructed. The first click sets an observer point and the second click sets the target (what the observer is looking at). The resulting line will be green in areas that are visible from the observer point and red in areas that are not visible. The window that pops up allows the user to set an observer offset (for example, the height of a person from ground to eye) and a target offset (for example, the height of a proposed cell tower). The resulting line can be used to create a profile graph (see below).
Interpolate point: Creates a point with a z-value. The z-value is displayed in the lower left corner of the screen when the point is selected.
Interpolate line: Creates a line with z-values at each vertex. Can be used to create a profile graph (see below).
Interpolate polygon: Creates a polygon with z-values at each vertex.
Create profiles: When a line (created using the steepest path, line of sight, or interpolate line tools) is selected, the create profiles tool becomes available. In the drop-down menu, select Profile Graph to view a graph showing elevation values along the line. The Point Profile option becomes available if there is a point layer in the map, such as the masspoints used to create the terrain dataset. Finally, the Terrain Point Profile tool becomes available if the “terrain point elevation with graduated color ramp” display renderer is added.
Launch ArcScene: Opens ArcScene
Launch ArcGlobe: Opens ArcGlobe

13 July 2011
A Brief Explanation of Lidar Lidar (Light Detection and Ranging) is a method of collecting very dense and accurate elevation information. It is usually collected from planes equipped with a laser sensor. The laser sensor emits laser pulses (often more than 70,000 per second) and tracks the time it takes for the pulse to return after bouncing off the earth’s surface. This information, as well as the location and height of the plane and the angle at which the pulse was emitted, allows the location and elevation of each point that the laser pulses hit to be calculated. Most remote sensing techniques are not able to “see under trees” to acquire ground elevation values. However, lidar creates so many points that even if only a small percentage of them reach the ground in forested areas, it is usually enough to adequately represent the ground elevation. Many lidar systems are able to capture multiple “returns” from a single laser pulse – for example, the first return might have bounced off the top of a tree, the second return off a lower branch of the tree, and finally the third return off the ground. Lidar data that includes multiple return information is known as “full return” data, while lidar data containing only ground elevation points is referred to as “bare earth” data.
Example of a single laser pulse with multiple returns


![An Open Source CFD Study of Air Flow over Complex Terrain · evaluation of wind over complex terrain [14] based on a new dataset of measurements collected on the isolated presqu'ile](https://img.dokumen.tips/doc/110x75/5ed65a161f01621abd2d87bb/an-open-source-cfd-study-of-air-flow-over-complex-terrain-evaluation-of-wind-over.jpg)


![Stanford University · 3.1 Dataset SQuAD dataset is a machine comprehension dataset on Wikipedia articles with more than 100,000 questions [1]. The dataset is randomly partitioned](https://img.dokumen.tips/doc/110x75/602d75745c2a607275039f53/stanford-university-31-dataset-squad-dataset-is-a-machine-comprehension-dataset.jpg)