Embed Size (px)
Citation preview

Connecticut Mastery Test(CMT) and the Connecticut Academic Achievement Test (CAPT) Spring 2011
Presented to the Guilford Board of Education September 26, 2011
General Information
All Connecticut public school students in grades 3-8 and grade 10 participated in the statewide assessment in March. Students in grades 11 and 12 may retake any part of the CAPT if they did not reach goal in that part.
The tests measure skills that students are expected to master in reading, writing, science and mathematics.
Some special education students might have been eligible to participate in a Modified Assessment or a Skills Checklist.
District Reference Groups
District Reference Groups (DRGs) have been defined
based on characteristics such as income and
education level of parents because research indicates
that there is a strong link between test results and
socioeconomic factors.

Connecticut Mastery Test Components
Reading Mathematics Writing Science (grades 5 & 8)
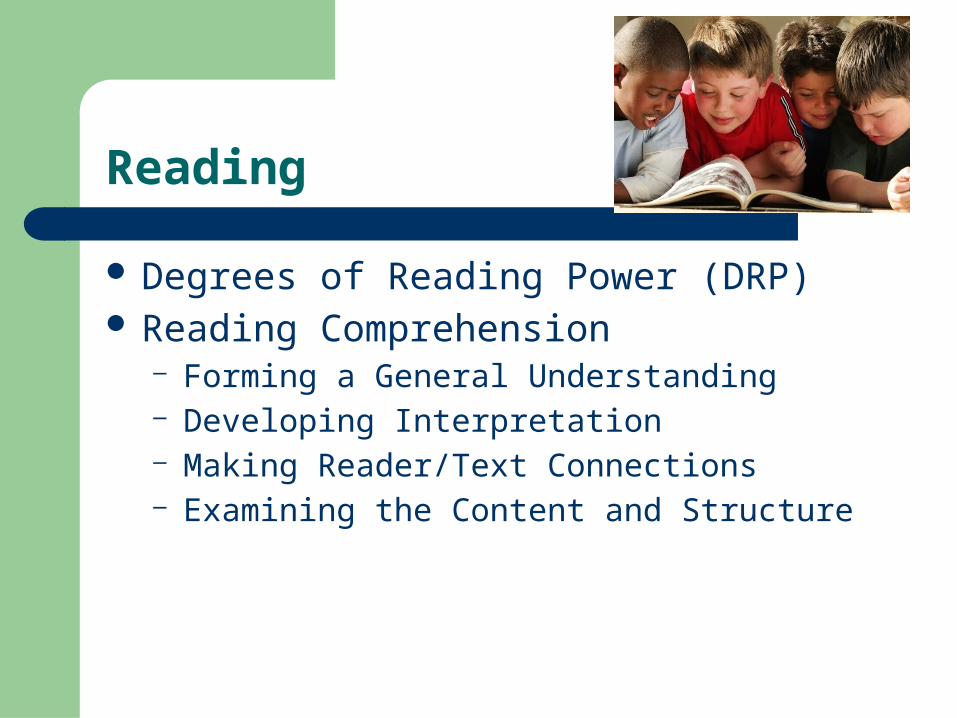
Reading
Degrees of Reading Power (DRP) Reading Comprehension
– Forming a General Understanding– Developing Interpretation– Making Reader/Text Connections– Examining the Content and Structure

Mathematics
Numerical and Proportional Reasoning Geometry and Measurement Data: Probability and Statistics Algebraic Reasoning Integrated Understandings
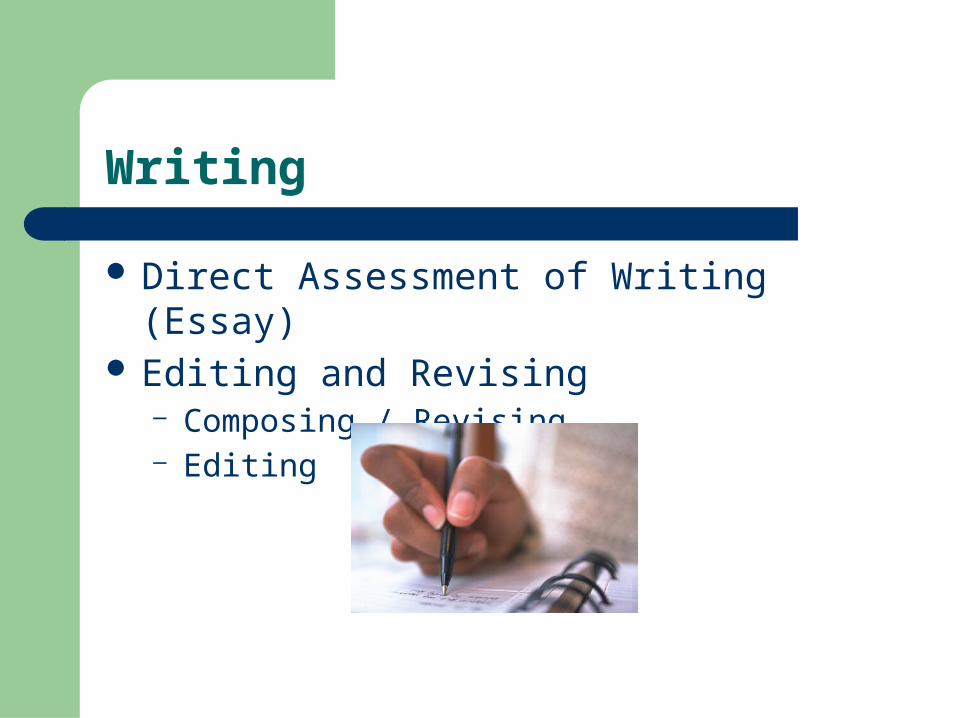
Writing
Direct Assessment of Writing (Essay) Editing and Revising
– Composing / Revising– Editing
CT Performance Level Scores
Advanced
Goal
Proficient
Basic
Below Basic

Grade 3
2007 2008 2009 2010 2011
Math 81.6 78.2 81.9 81.5 84.9
Writing 75.3 77.1 71.7 75 77.5
Reading 70.7 69.3 71.3 70 77.5
55
65
75
85
95
MathWritingReading
Guilford Public Schools CMT Generation 4
% At or Above Goal
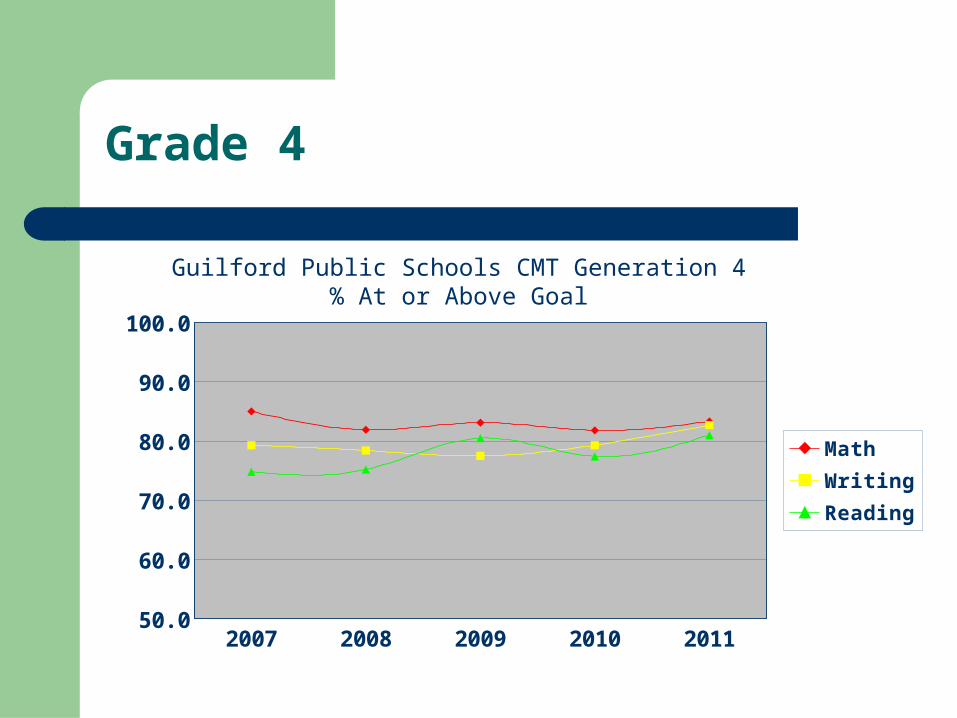
Grade 4
2007 2008 2009 2010 2011
Math 85 81.9 83.1 81.8 83.3
Writing 79.3 78.4 77.5 79.3 82.7
Reading 74.8 75.2 80.5 77.4 81
55.0
65.0
75.0
85.0
95.0
MathWritingReading
Guilford Public Schools CMT Generation 4% At or Above Goal

Grade 5
2007 2008 2009 2010 2011
Math 87.6 83.2 85.8 87 82.7
Writing 80.8 85.6 85.2 85.5 82.8
Reading 70.7 84.2 85 79.9 80.1
55
65
75
85
95
MathWritingReading
Guilford Public Schools CMT Generation 4% At or Above Goal

Grade 6
2007 2008 2009 2010 2011
Math 85.8 90.6 92.9 89.3 88.7
Writing 86.5 83.9 82.3 83.8 90.2
Reading 86.9 86.8 91.6 91.4 91.6
55
65
75
85
95
MathWritingReading
Guilford Public Schools CMT Generation 4% At or Above Goal

Grade 7
2007 2008 2009 2010 2011
Math 86.2 86.8 93.1 93.9 89.9
Writing 81.3 85.7 82.7 83.8 80.5
Reading 86.9 89.5 94 94.2 94.4
55
65
75
85
95
MathWritingReading
Guilford Public Schools CMT Generation 4% At or Above Goal

Grade 8
2007 2008 2009 2010 2011
Math 91.7 90.6 92.2 94.1 92.5
Writing 88.5 86 85.7 88.1 86.8
Reading 87.8 85.7 88.7 93.1 94.9
55
65
75
85
95
MathWritingReading
Guilford Public Schools CMT Generation 4% At or Above Goal
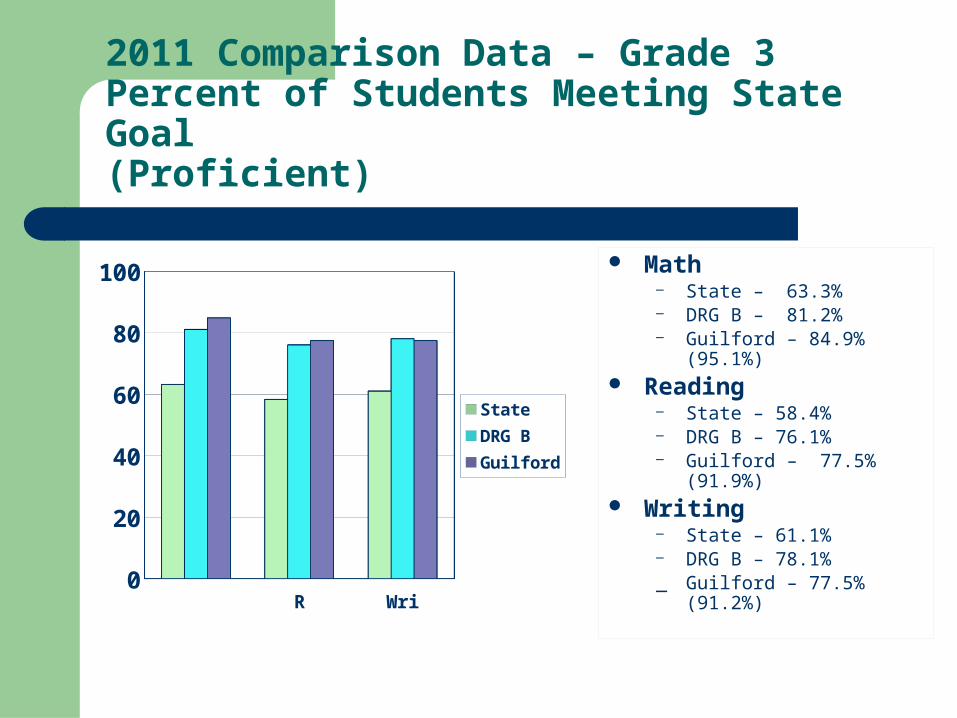
2011 Comparison Data – Grade 3Percent of Students Meeting State Goal(Proficient)
Math Read. Writing0
20
40
60
80
100
StateDRG BGuilford
Math– State – 63.3%– DRG B – 81.2%– Guilford – 84.9% (95.1%)
Reading– State – 58.4%– DRG B – 76.1%– Guilford – 77.5% (91.9%)
Writing– State – 61.1%– DRG B – 78.1%_ Guilford – 77.5% (91.2%)

2011 Comparison Data – Grade 4Percent of Students Meeting State Goal(Proficient)
Math Read. Writing0
20
40
60
80
100
StateDRG BGuilford
Math– State – 67.3%– DRG B – 85.4%– Guilford – 83.3% (94.8%)
Reading– State – 62.5%– DRG B – 81.2%– Guilford – 81.0% (88.8%)
Writing– State – 65.5%– DRG B – 82.8%– Guilford – 82.7% (94.9%)
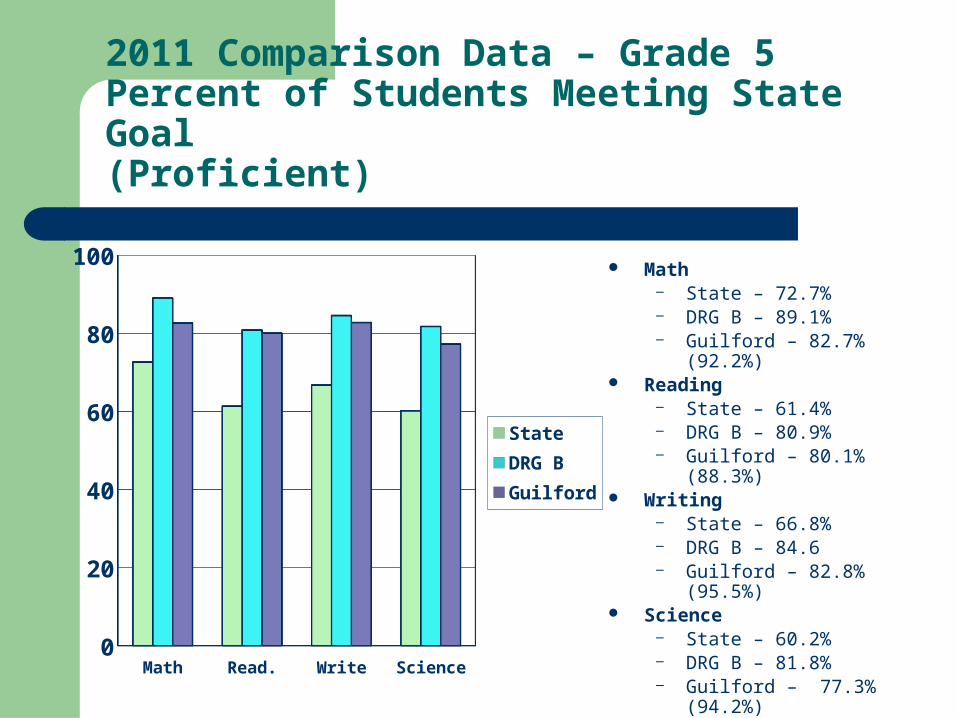
2011 Comparison Data – Grade 5Percent of Students Meeting State Goal(Proficient)
Math Read. Write Science0
20
40
60
80
100
StateDRG BGuilford
Math– State – 72.7%– DRG B – 89.1%– Guilford – 82.7% (92.2%)
Reading– State – 61.4%– DRG B – 80.9%– Guilford – 80.1% (88.3%)
Writing– State – 66.8%– DRG B – 84.6– Guilford – 82.8% (95.5%)
Science– State – 60.2%– DRG B – 81.8%– Guilford – 77.3% (94.2%)
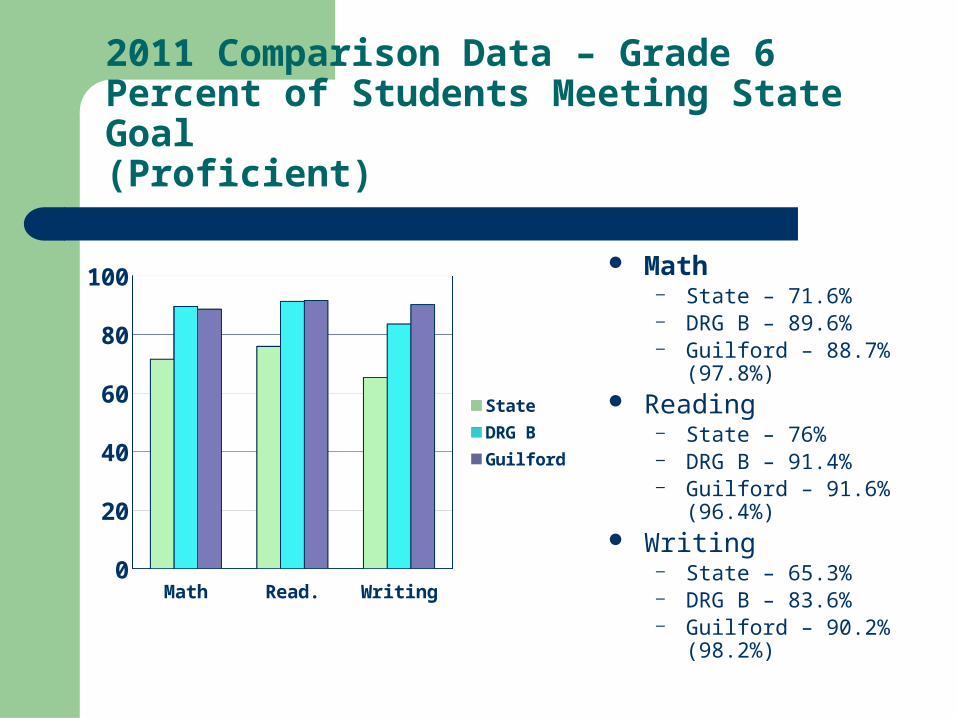
2011 Comparison Data – Grade 6Percent of Students Meeting State Goal(Proficient)
Math Read. Writing0
20
40
60
80
100
StateDRG BGuilford
Math– State – 71.6%– DRG B – 89.6%– Guilford – 88.7% (97.8%)
Reading– State – 76%– DRG B – 91.4%– Guilford – 91.6% (96.4%)
Writing– State – 65.3%– DRG B – 83.6%– Guilford – 90.2% (98.2%)

2011 Comparison Data – Grade 7Percent of Students Meeting State Goal
Math Read. Writing0
20
40
60
80
100
StateDRG BGuilford
Math– State – 68.7%– DRG B – 88.1%– Guilford – 89.9% (96.3%)
Reading– State – 77.8%– DRG B – 92.5%– Guilford – 94.4% (98.5%)
Writing– State – 58.9%– DRG B – 79.6%– Guilford – 80.5% (93.4%)

Math Read. Writing Science0
102030405060708090
100
StateDRG BGuilford
Math– State – 66.8%– DRG B – 88.0%– Guilford – 92.5% (99.7%)
Reading– State – 74.7%– DRG B – 90.4%– Guilford – 94.9% (98.6%)
Writing– State – 64.8%– DRG B – 83.7%– Guilford – 86.8% (97.3%)
Science– State – 63.3%– DRG B – 84.2%– Guilford – 86.4% (96.9%)
2011 Comparison Data – Grade 8Percent of Students Meeting State Goal(Proficient)

Connecticut Academic Performance Test (CAPT) Components
Mathematics Science Reading Across the Disciplines Writing Across the Disciplines
Reading Across the Disciplines
Response to Literature Reading for Information
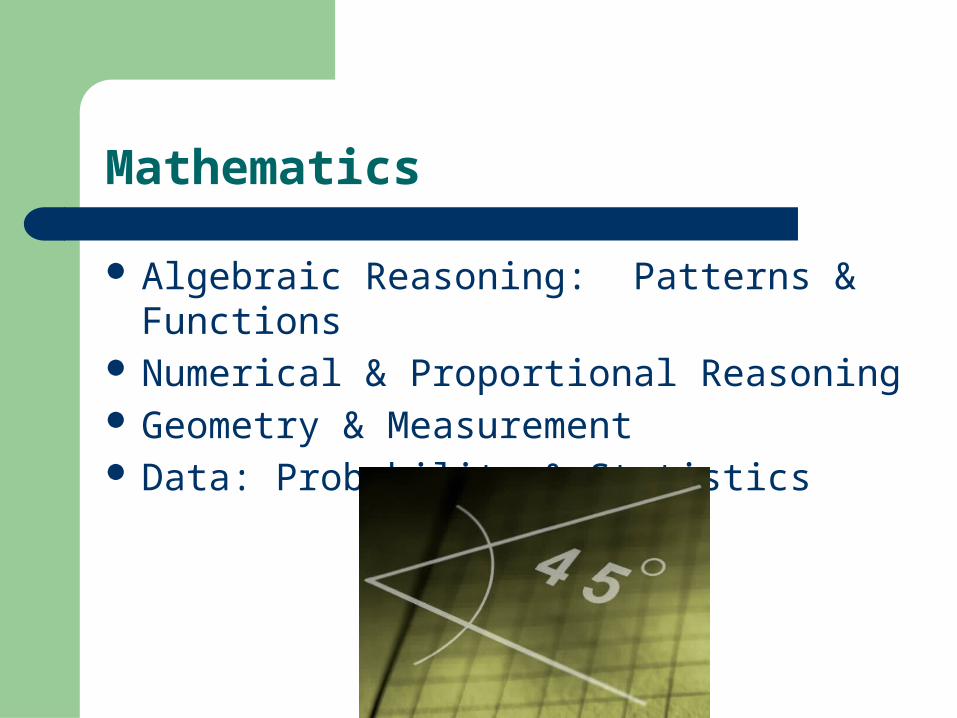
Mathematics
Algebraic Reasoning: Patterns & Functions Numerical & Proportional Reasoning Geometry & Measurement Data: Probability & Statistics
Writing Across the Disciplines
Interdisciplinary Writing (2 sessions) Editing and Revising
Science
Energy Transformations Chemical Structures & Properties Global Interdependence Cell Chemistry & Biotechnology Genetics, Evolution & Biodiversity
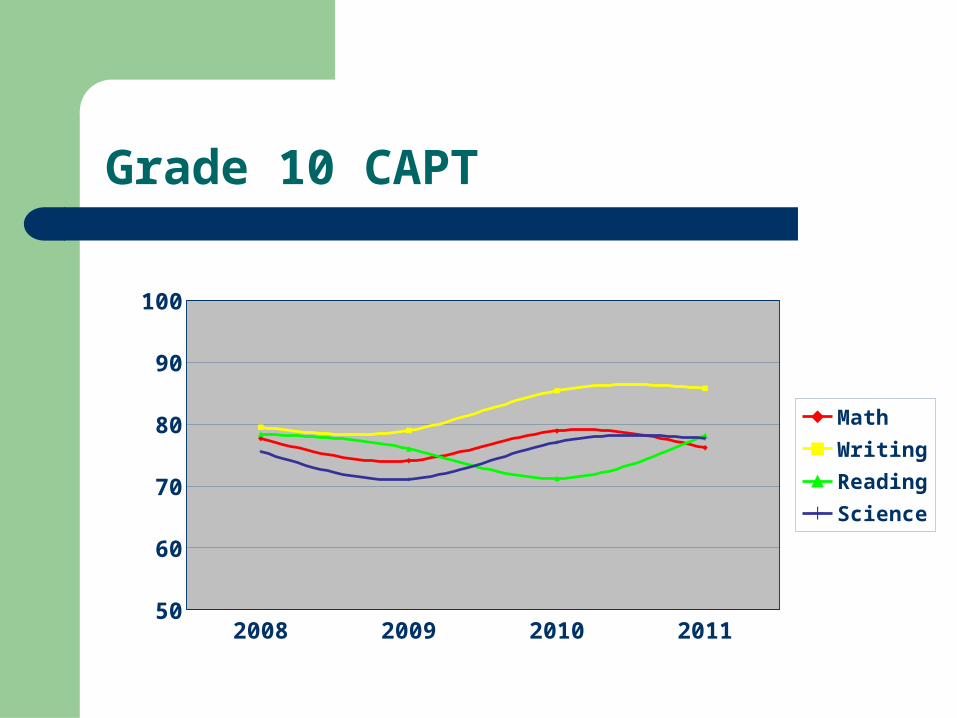
Grade 10 CAPT
2008 2009 2010 2011
Math 77.7 74.1 78.9 76.2
Writing 79.5 79 85.4 85.8
Reading 78.4 76 71.2 78.2
Science 75.6 71.1 77.1 77.7
55
65
75
85
95
MathWritingReadingScience
Math Read. Writing Science0
20
40
60
80
100
State
DRG B
Guilford
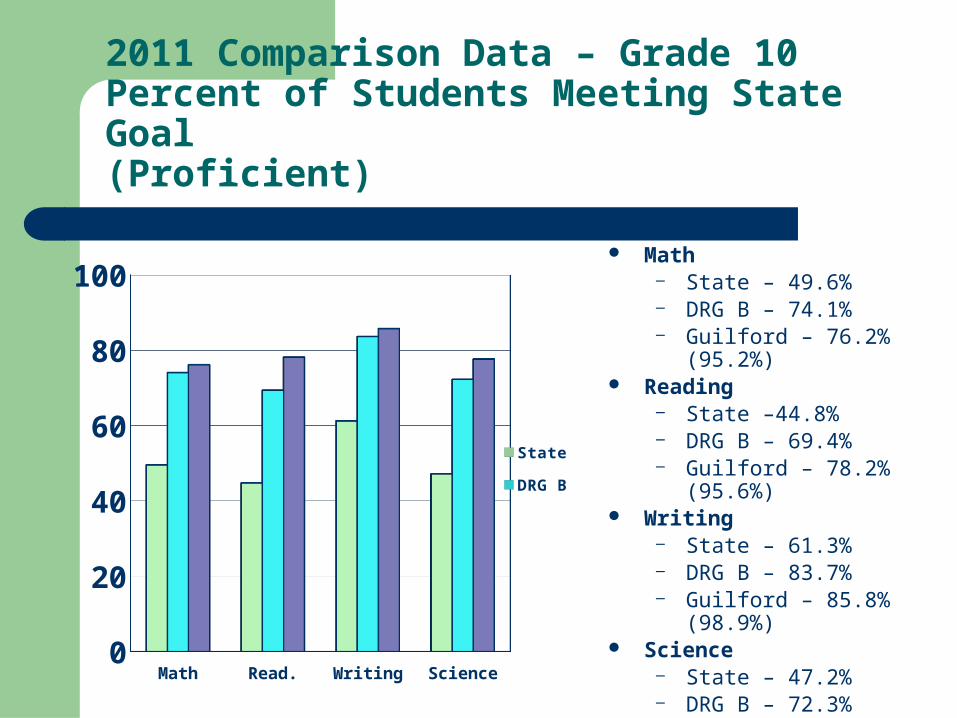
Math– State – 49.6%– DRG B – 74.1%– Guilford – 76.2% (95.2%)
Reading– State –44.8%– DRG B – 69.4%– Guilford – 78.2% (95.6%)
Writing– State – 61.3%– DRG B – 83.7%– Guilford – 85.8% (98.9%)
Science– State – 47.2%– DRG B – 72.3%– Guilford – 77.7% (96.3%)
2011 Comparison Data – Grade 10Percent of Students Meeting State Goal(Proficient)
Next Steps for Schools
Analyze data by subgroups. Analyze data by content
strands. Use analysis to inform
professional development plans and make curricular / instructional adjustments.
Monitor student progress.