Embed Size (px)
Citation preview

Evaluation Study Prepared for Connecticut Energy Efficiency Board (EEB)
Prepared by
120 Water St., Suite 350 North Andover, Massachusetts 01845
www.ers-inc.com
3934 NE Martin Luther King Jr. Blvd., Suite 300 Portland, Oregon 97212
www.researchintoaction.com
Connecticut EEB
SBEA Process Evaluation Final Report – Project C1639 June 30, 2017
Final Report
Small Business Energy Advantage (SBEA) Process Evaluation
March 10, 2017 Revised April 17, 2017 and May 31, 2017
Funded By:
The United Illuminating Company, Southern Connecticut Gas, Connecticut Natural Gas, and Eversource CT
Prepared By:
Energy & Resource Solutions, Inc. Research Into Action, Inc.

www.researchintoaction.com
PO Box 12312 Portland, OR 97212
3934 NE Martin Luther King Jr. Blvd., Suite 300 Portland, OR 97212
Phone: 503.287.9136 Fax: 503.281.7375
Contact: Jane S. Peters, President [email protected]
Small Business Energy Advantage (SBEA) Process Evaluation
Table of Contents | Page i
Table of Contents
Executive Summary .............................................................................................................. I Evaluation Background ............................................................................................................................ I
Evaluation Activities ................................................................................................................................ I
Key Findings ............................................................................................................................................ II
Conclusions and Recommendations ..................................................................................................... III
1. Introduction ................................................................................................................... 1
1.1. Program Description ...................................................................................................................... 1
1.2. Program Budget and Savings ......................................................................................................... 2
1.3. Evaluation Development ................................................................................................................ 3
1.4. Key Evaluation Objectives and Questions ...................................................................................... 4
2. The Evaluation Approach ............................................................................................... 6
2.1. Stakeholder Survey and Interviews ................................................................................................ 6
2.2. Contractor Survey ........................................................................................................................ 10
2.3. Customer Surveys ......................................................................................................................... 11 2.3.1. Participant Phone Survey .................................................................................................................. 11 2.3.2. Participant Onsite Survey ................................................................................................................. 12 2.3.3. Nonparticipant Survey ...................................................................................................................... 13
3. Evaluation Context: Stakeholder Feedback ................................................................. 16
3.1. Program Design and Customer Decision-Making......................................................................... 16 3.1.1. Financial Criteria and Program Strategies ........................................................................................ 16 3.1.2. Effect of Loan Cap ............................................................................................................................. 17 3.1.3. Cost of Capital and Restructuring Loan Terms .................................................................................. 17
3.2. The Importance of Various Program Elements ............................................................................ 18
3.3. Achieving Program Savings Goals ................................................................................................ 19
3.4. Program Marketing ...................................................................................................................... 21 3.4.1. Offering an Improved Narrative ....................................................................................................... 21 3.4.2. Segment-Specific Efforts ................................................................................................................... 21
3.5. Program Rules and Processes ...................................................................................................... 22 3.5.1. Program Eligibility ............................................................................................................................. 22 3.5.2. Qualification for Financing ................................................................................................................ 22

Small Business Energy Advantage (SBEA) Process Evaluation
Table of Contents | Page ii
3.5.3. Incentive Levels................................................................................................................................. 23 3.5.4. Program Delivery Challenges ............................................................................................................ 24
3.6. Interaction with Contractors ........................................................................................................ 24 3.6.1. Recruitment and Engagement .......................................................................................................... 24 3.6.2. Training Needs .................................................................................................................................. 25 3.6.3. Meeting Compliance Guidelines ....................................................................................................... 25 3.6.4. Communication................................................................................................................................. 27
3.7. Program Staffing........................................................................................................................... 27
3.8. The Effect of Program Interruption .............................................................................................. 28
4. Equipment Installed Through SBEA ............................................................................. 29
4.1. Equipment Installed by Phone Survey Participants ..................................................................... 29
4.2. Equipment Installed by Onsite Survey Participants ..................................................................... 31
4.3. Comparing Lighting and Non-Lighting Participants ...................................................................... 32
4.4. Distribution of Project Types Among SBEA Contractors .............................................................. 32
5. Selling (and Upselling) the Upgrades ........................................................................... 34
5.1. Scheduling the Audit .................................................................................................................... 34
5.2. Conducting the Audit and Presenting the Case ........................................................................... 36
5.3. Efforts to Get Non-Lighting Upgrades .......................................................................................... 38
5.4. Limits on Efforts to Sell Non-Lighting Upgrades .......................................................................... 41
5.5. Contractor Characteristics and Success ....................................................................................... 42
6. Financing the Upgrades ............................................................................................... 44
6.1. Zero-percent Financing ................................................................................................................ 44
6.2. The Financing Term ...................................................................................................................... 46
6.3. The Loan Cap ................................................................................................................................ 47
6.4. On-Bill Financing ........................................................................................................................... 48
7. Program Satisfaction .................................................................................................... 50
7.1. Participant Satisfaction ................................................................................................................ 50
7.2. Benefits of Equipment Upgrades ................................................................................................. 52
7.3. Contractors’ Satisfaction .............................................................................................................. 53
8. Potential for Future Program Participation ................................................................. 55
8.1. Existing Upgrade Opportunities ................................................................................................... 55
Small Business Energy Advantage (SBEA) Process Evaluation
Table of Contents | Page iii
8.2. Possible Barriers to Participation ................................................................................................. 56 8.2.1. Upgrade Cost, Payback, and Ownership Issues ................................................................................ 56 8.2.2. Limited Knowledge of Energy Costs and Potential Savings .............................................................. 57 8.2.3. Customer “Inertia” ............................................................................................................................ 58 8.2.4. Challenges Specific to Certain Customer Types ................................................................................ 58 8.2.5. Lack of Program Awareness .............................................................................................................. 59 8.2.6. Recent Equipment Replacement ...................................................................................................... 59
8.3. Sources of Influence in Upgrade Decisions .................................................................................. 61
8.4. Capacity to Expand Program Participation .................................................................................. 62 8.4.1. Suggested Program Changes ............................................................................................................ 62 8.4.2. Other Suggested Forms of Program Support .................................................................................... 63
9. Conclusions and Recommendations ............................................................................ 64
Appendix A. Data Collection Instruments .................................................................... A-1
A.1. Stakeholder Survey ..................................................................................................................... A-1
A.2. Staff In-Depth Interview Guide ................................................................................................. A-10
A.3. Contractors Interview ............................................................................................................... A-14
A.4. Participant Onsite Survey .......................................................................................................... A-17
A.5. Participant Phone Survey .......................................................................................................... A-21
A.6. Non-participant Survey ............................................................................................................. A-28
List of Figures Figure 1-1: SBEA Program Spend (2013-2016) and Budget .......................................................................... 2
Figure 1-2: SBEA Program Actual (2013-2016) and Projected Savings ......................................................... 3
Figure 3-1: Stakeholder Rated Importance of Program Elements .............................................................. 18
Figure 4-1 Equipment Installed – Phone Survey Self-Report Compared to Project Database ................... 29
Figure 4-2: Equipment Installed – Program Population and Phone Survey Respondents.......................... 31
Figure 4-3: Equipment Installed – Onsite Survey ........................................................................................ 31
Figure 4-4: Distribution of Non-Lighting and Comprehensive Projects Among SBEA Contractors ............ 33
Figure 5-1: Success Rate in Enrolling SBEA Participants – Contractors Who Did or Did Not Report Challenge Getting to Decision Maker ......................................................................................................... 35
Figure 5-2: Usefulness of Accompanying Contractor on Audit ................................................................... 37
Figure 6-1: What Participants Would Have Done at Two-Percent Financing ............................................. 44
Figure 6-2: What Lighting-only versus Non-lighting Participants Would Have Done at Two-percent Financing ..................................................................................................................................................... 45

Small Business Energy Advantage (SBEA) Process Evaluation
Table of Contents | Page iv
Figure 6-3: Nonparticipants’ Likelihood of Taking Zero- or Two-Percent Financing .................................. 46
Figure 6-4: Loan Term and Nonparticipant Likelihood of Financing Equipment Upgrades ........................ 47
Figure 6-5: Benefits of Having Loan Payment Part of Utility Bill................................................................. 48
Figure 6-6: Nonparticipants’ Ratings of On-Bill Financing Benefit Compared to Bank Financing .............. 49
Figure 7-1: Participant Satisfaction – Phone Survey Compared to Onsite Survey ...................................... 51
Figure 7-2: Benefits of the New or Upgraded Equipment – Phone Survey ................................................ 52
Figure 7-3: Benefits of the New or Upgraded Equipment – Lighting Only Participants Compared to Non-Lighting Participants ............................................................................................................................ 53
Figure 8-1: Surveyed Nonparticipants’ Plans to Upgrade Existing Equipment ........................................... 58
Figure 8-2: Other Equipment Replaced in Past Two Years – Onsite Survey ............................................... 60
Figure 8-3: Sources Participants Consulted in Making Upgrade Decisions through the Program ............. 61
List of Tables Table 1-1: Research Topics and Research Questions .................................................................................... 5
Table 2-1: Summary of Data Collection Activities ......................................................................................... 6
Table 2-2: Stakeholder Group Counts ........................................................................................................... 7
Table 2-3: Program Areas of Stakeholder Knowledge .................................................................................. 8
Table 2-4: Stakeholder Respondents, Role, and Program Experience ......................................................... 9
Table 2-5: Characteristics of Interviewed Contractors ............................................................................... 10
Table 2-6: Participant Population and Sample ........................................................................................... 12
Table 2-7: Characteristics of Respondents’ Organizations ......................................................................... 12
Table 2-8: Characteristics of Respondents’ Businesses .............................................................................. 13
Table 2-9: Target Sample by Stratum ......................................................................................................... 13
Table 2-10: Disposition Summary ............................................................................................................... 14
Table 2-11: Characteristics of Respondents’ Organizations ....................................................................... 15
Table 3-1: The Gap between the Likelihood and the Importance of Achieving Savings ............................ 20
Table 3-2: Frequency of Contractor Failure to Meet Compliance Guidelines Over Last Five Years ........... 27
Table 4-1: Non-lighting Measures Installed by Phone Survey Respondents .............................................. 30
Table 5-1: Indices of Contractors’ Levels of Activity in Selling SBEA Projects ............................................ 34
Table 5-2: Accompanying Contractors During the Audit – Participants Surveyed by Phone ..................... 36
Table 5-3: Contractor Requests to Accompany Audit and Contractor Characteristics .............................. 37
Table 5-4: Relationship of Contractor Strategies for Deeper Savings and Indices of Contractor Activity .. 40
Table 5-5: Contractor Success by Contractor Characteristic ...................................................................... 42

Small Business Energy Advantage (SBEA) Process Evaluation
Table of Contents | Page v
Table 8-1: Nonparticipants’ Report of Older Equipment ............................................................................ 55
Table 8-2: Plans for Replacing Equipment .................................................................................................. 56
Table 8-3: Comparison of Equipment Replaced Through and Outside of SBEA ......................................... 60

Small Business Energy Advantage (SBEA) Process Evaluation
Executive Summary | Page I
Executive Summary
This report presents the findings of a process evaluation of the Connecticut Small Business Energy Advantage (SBEA) program, which offers a free energy assessment, monetary incentives, zero-interest financing, and other services to encourage small businesses in Connecticut to invest in energy efficient equipment replacements or upgrades (hereafter collectively referred to as “upgrades”). The SBEA program is one of several programs and initiatives that the Connecticut Energy Efficiency Fund (CEEF) supports to advance energy efficiency. Connecticut Light & Power, doing business as Eversource Energy (Eversource), and United Illuminating (UI) administer the programs on their own behalf and that of Connecticut Natural Gas and Southern Connecticut Gas. This process evaluation was done in concert with an impact evaluation conducted by ERS staff.
Evaluation Background The program is open to Eversource and UI customers with an average 12-month peak demand between 10 and 200 kW and to natural gas customers of Eversource, Connecticut Natural Gas (CNG), or Southern Connecticut Gas (SCG). The program provides incentives for both lighting and non-lighting energy efficiency upgrades,1 such as refrigeration, cooling, heating, fans, motors, or custom measures.
From 2013 through 2016, the SBEA program achieved electric savings of more than 155,000 MWh and gas savings of more than 500,000 CCF. Reported electricity savings (kWh) increased from about 32,000 MWh in 2013 to about 43,700 MWh in 2016. Reported gas savings (CCF) increased from about 116,600 in 2013 to about 149,500 in 2016, with a slight dip in 2014.
In late 2015, the Connecticut Energy Efficiency Board’s (CT EEB) Evaluation Administrator Team, Skumatz Economic Research Associates (SERA), selected the team of Energy & Resource Solutions Inc. (ERS) and Research Into Action Inc. to conduct an impact and process evaluation of SBEA.
The objectives of the process evaluation were to: 1) identify the barriers to the implementation of more non-lighting projects and projects achieving deeper savings and the participant decision-making processes relevant to those barriers and to overcoming them; and 2) to make relevant recommendations pertaining to program design and implementation.
Evaluation Activities To address the above objectives, the evaluation team, in coordination with the CT EEB Evaluation Administrator Team, carried out the following research activities:
² Feedback from 21 program stakeholders involved in the development, administration, or oversight of the SBEA to clarify program goals and objectives and key aspects of program operations and implementation. The sources of feedback were an online survey completed by
1 Upgrade refers to changes made to equipment that improve the efficiency compared to the old existing equipment or compared to the
efficiency of the baseline or code equipment for new or normal replacement measures.

Small Business Energy Advantage (SBEA) Process Evaluation
Executive Summary | Page II
12 of the stakeholders, a webinar attended by eight of the stakeholders, and individual and group interviews with four utility staff and two EEB technical consultants.
² Interviews with 16 of the 24 active contractors who market and deliver the SBEA program to customers to discuss details on program delivery, the challenges that they face and their strategies for overcoming them, their perceptions of the importance of various program aspects, their satisfaction with the program, and their thoughts about how to increase participation and achieve deeper savings.
² A phone survey of 125 randomly selected program participants, to assess their experience with the program, their satisfaction with the incentives and loan paperwork, the importance of zero-percent financing, the benefits of on-bill financing, the impact of the loan cap, and the sources of influence on their decision-making regarding equipment upgrades.
² An onsite survey of 51 participants to provide further data on equipment selection, satisfaction, and the importance of zero-percent financing. The onsite survey was conducted with participants selected for the impact evaluation, with over-sampled non-lighting projects to provide an adequate sample for impact assessment.
² A phone survey of 27 nonparticipating SBEA-eligible utility customers to assess opportunities for equipment upgrades, program awareness and likelihood of participating, the value of zero-percent financing and perceived benefits of on-bill financing, and barriers to program participation.
Key Findings As program stakeholders noted, lighting dominates SBEA projects, with about three-quarters of projects having only lighting measures, accounting for just over half of program savings. Through the above activities, the evaluation team identified the several key findings relevant to getting more non-lighting and deeper-saving projects:
² Contractors varied considerably in the total number of projects done, their overall success at converting leads to projects, and in the percentage of projects that include non-lighting measures. Contractors’ overall success rate was positively related to their reported success at identifying the correct decision-makers but it was unrelated to other contractor characteristics or indices of success.
² All interviewed contractors were program-approved SBEA contractors and served as the lead contractor on all their projects, but they differed in the range of in-house energy-related capabilities they offered, and their ability to sell non-lighting projects was positively related to having a greater range of in-house energy-related capabilities.
² Although contractors reported always recommending a broad range of lighting and non-lighting upgrades, nearly all admitted they sometimes do not push hard for non-lighting upgrades, particularly when cost concerns are an issue. Customer concerns about upgrade costs and

Small Business Energy Advantage (SBEA) Process Evaluation
Executive Summary | Page III
length of payback are particular barriers to non-lighting upgrades among tenants, who appear to be under-represented in the program population.2
² In general, contractors’ ability to sell non-lighting projects was unrelated to the strategies they reported for getting deeper savings. However, one contractor who reported a strategy of trying to get landlords and tenants to share project costs was highly successful at selling non-lighting projects.
² Contractor responses suggested that the current maximum 48-month loan term and the current $100,000 loan cap may prevent some higher-cost, longer-payback projects; participant survey responses provided support for the limitation of the loan cap, particularly among larger program-qualifying customers, but not the financing term.
² Contractors universally agree that zero-percent financing is a key piece of the program that should not change. While participants also value the zero-percent financing, some, particularly those who did non-lighting projects, may be willing to accept a two-percent interest rate.
² Half of the participants with non-lighting projects identified non-energy benefits, such as improved reliability and decreased operations and maintenance (O&M) costs, as benefits of their new equipment, but contractors’ reported strategies for selling upgrades did not include discussion of those benefits.
The evaluation also generated the following findings on overall program potential:
² The nonparticipant survey results suggest that a large majority of eligible utility customers have equipment that offers opportunities for energy savings through the SBEA program, while awareness of the program among the SBEA-eligible population is moderate.
² All but one contractor said they could increase their program workload. The amount varied by contractor, but represented more than a 50% increase across the interviewed contractors. The primary contractor-identified limitations to increased were the number of leads provided and the population of people qualified to complete audits.
Conclusions and Recommendations The above key findings suggest the following conclusions and recommendations.
Conclusion 1: Contractors often deal with tenants who are not responsible for non-lighting equipment or may have a lease that is not long enough to make non-lighting upgrades economically feasible. To get maximum savings in tenant-occupied spaces may require getting the owners involved, as underscored by the success of the one contractor who reported generally trying to do so, but contractors often face challenges getting to the owners or getting them engaged. This may be seen in the fact that tenants appear to be under-represented among program participants.
2 A study by the National Federation of Independent Business (NFIB) found that building owners may make up just over half (57%) of all
small businesses. NFIB Small Business Facts, Volume 6, Issue 3, 2006. ISSN 1534-8326. Available at: http://www.411sbfacts.com/sbpoll-about.php?POLLID=0047. Last accessed March 7, 2017.

Small Business Energy Advantage (SBEA) Process Evaluation
Executive Summary | Page IV
Recommendation 1: The utilities should consider developing strategies for outreach to building owners, such as through commercial real estate agents or organizations such as the Building Owners and Managers Association (BOMA), or directly to the owners of tenant-occupied buildings to whom program contractors have marketed the program.
Conclusion 2: A higher percentage of projects that have non-lighting measures is related to the number of staff that contractors have doing SBEA-related work and to the contractors’ range of in-house energy-related capabilities. That is, contractors with more staff doing SBEA-related work and a wider range of in-house capabilities appear to have a greater capability to sell and install projects that include non-lighting measures. The utilities recognize the value of having contractors who are capable of doing a wide range of project types. Still, success at getting non-lighting projects varied even among contractors with broad in-house capabilities.
Recommendation 2a: The utilities should continue to try to recruit contractors with the ability to do a broad range of project types, in particular those who have the capabilities in house, and should consider providing sales training support to contractors to get more non-lighting projects.
Recommendation 2b: The utilities, together with the CT EEB, should consider increasing the incentives for non-lighting measures (or providing separate contractor incentives) to increase their installation, possibly paying for the increase by decreasing incentives on lighting.
Conclusion 3: The non-energy benefits of upgraded equipment, such as greater reliability and reduced O&M costs are important to program participants, yet contractors appear to focus on energy savings when trying to convince customers to do non-lighting upgrades. Including discussion of non-energy benefits in their presentations to customers may increase success in getting projects implemented.
Recommendation 3: As part of the recommended sales training support to the SBEA contractors (recommendation 2a), the utilities should include training on how to talk about the value of non-energy benefits with customers to get more non-lighting projects.
Conclusion 4: Some customers, particularly building owners, may do more extensive upgrades if they can extend the loan length or increase the loan amount, but doing so ties up the utilities’ loan funds longer or ties up a larger loan amount at no interest. Most contractors do not appear to promote financing outside the SBEA program.
Recommendation 4a: The utilities might consider offering alternative loan terms for building owners or tenants with long-term leases, such as: 1) an extension of the loan length or amount at a non-zero interest rate for the portion of the loan payback period that exceeds 48 months or the amount that exceeds $100,000, if the utilities can determine how that can be done at their current capital costs; or 2) a floating loan term set to ensure a positive cashflow.
Recommendation 4b: The utilities should continue to investigate how third-party financing, including Commercial Property Assessed Clean Energy (C-PACE) could be leveraged to help promote projects with longer paybacks or exceed the loan cap. As part of this, they should consider providing contractors with information on C-PACE and how to talk to building owners or tenants with long-term leases about using it.

Small Business Energy Advantage (SBEA) Process Evaluation
Introduction | Page 1
1. Introduction
This report documents and presents the findings of the 2016 process evaluation of the Small Business Energy Advantage program operating in Connecticut. This effort sought to assess efficiency of program processes and investigate opportunities to increase participation and achieve deeper savings. This process evaluation was completed in coordination and under the same contract with an impact evaluation of the program. The prime contractor, Energy & Resource Solutions, Inc., carried out the impact evaluation, the results of which are reported separately.
1.1. Program Description Eversource Energy (Eversource) and United Illuminating (UI), together with Energize Connecticut, Connecticut Natural Gas (CNG) and Southern Connecticut Gas (SCG), offer the Small Business Energy Advantage (SBEA) program, which provides the following services to small business owners in Connecticut:
² A free energy assessment and report that outlines all eligible energy efficiency measures, complete with material and installation costs and estimated savings.
² Incentives up to 35 percent of installed cost for lighting other than light-emitting diode (LED) and induction, up to 40 percent of installed cost for LED and induction lighting, and up to 50 percent of the installed cost for comprehensive projects (defined below).
² Zero-interest financing3 (payable on monthly electric bill).
² One-year warranty on contractors’ parts and labor.
Projects with measures representing at least two end-uses (e.g., lighting, refrigeration, heating, cooling) may be considered comprehensive by the program. This definition does not imply that any two measures representing different end-uses constitute a comprehensive project. The evaluation team’s analysis of the 2016 measure data for one of the two utility companies indicated that certain low-cost measures, such as water-saving measures, do not appear to be sufficient to qualify for the comprehensive incentive when combined with one other end-use. The types of measures that were most commonly associated with the comprehensive incentive were furnaces, air conditioning units, fans, boilers, air compressors, pumps, energy management systems, motors, and controls on motors and fans.
Eversource and UI customers with an average 12-month peak demand between 10 and 200 kW as well as natural gas customers of Eversource, CNG, or SCG are eligible to apply for the program.
The participation process involves several steps:
1. An SBEA-authorized contractor schedules a site visit to conduct an energy audit of the building.
3 Must qualify for financing.

Small Business Energy Advantage (SBEA) Process Evaluation
Introduction | Page 2
2. After the completion of the audit, the authorized contractor presents a proposal that includes energy-efficiency recommendations, the costs and estimated energy savings of the recommendations, and the SBEA incentive and financing options.
3. Once paperwork is signed, the project starts within 30 days.
Participating customers typically pursue lighting upgrades through the program.4 The program also provides incentives for non-lighting projects, such as refrigeration, cooling, heating, fans, motors, or custom measures. SBEA-approved contractors may carry out all equipment replacements for a given project or may use subcontractors. However, all approved contractors have the same role and responsibilities vis-à-vis the program, serving as lead contractor on all their projects.
1.2. Program Budget and Savings The SBEA program spend for electric measures rose steadily from 2013 through 2015, then leveled off in 2016. The 2017 and 2018 electric budgets are similar, both slightly above 2016 levels (Figure 1-1). By comparison, the spend for gas measures, did not show a consistent trend from 2013 through 2015, but the 2016 spend increased above previous levels, and the 2017 and 2018 budgets show continuing increases.
Figure 1-1: SBEA Program Spend (2013-2016) and Budget (2017-2018)*
* Source: 2016-2018 Electric and Natural Gas Conservation & Load Management Plan. Submitted by Eversource Energy, The United
Illuminating Company, Connecticut Natural Gas Corporation, and The Southern Connecticut Gas Company. Connecticut General Statutes-Section 16-245m(d). October 1, 2015.
4 Lighting projects were the most common projects in the program tracking database.
$15,734
$726
$18,574
$530
$19,075
$620
$20,964
$818
$20,629
$741
$22,828
$941
Electric GasSpend (2013-2015) or Budget (2016-2018) x1000
2013 2014 2015 2016 2017 2018
Small Business Energy Advantage (SBEA) Process Evaluation
Introduction | Page 3
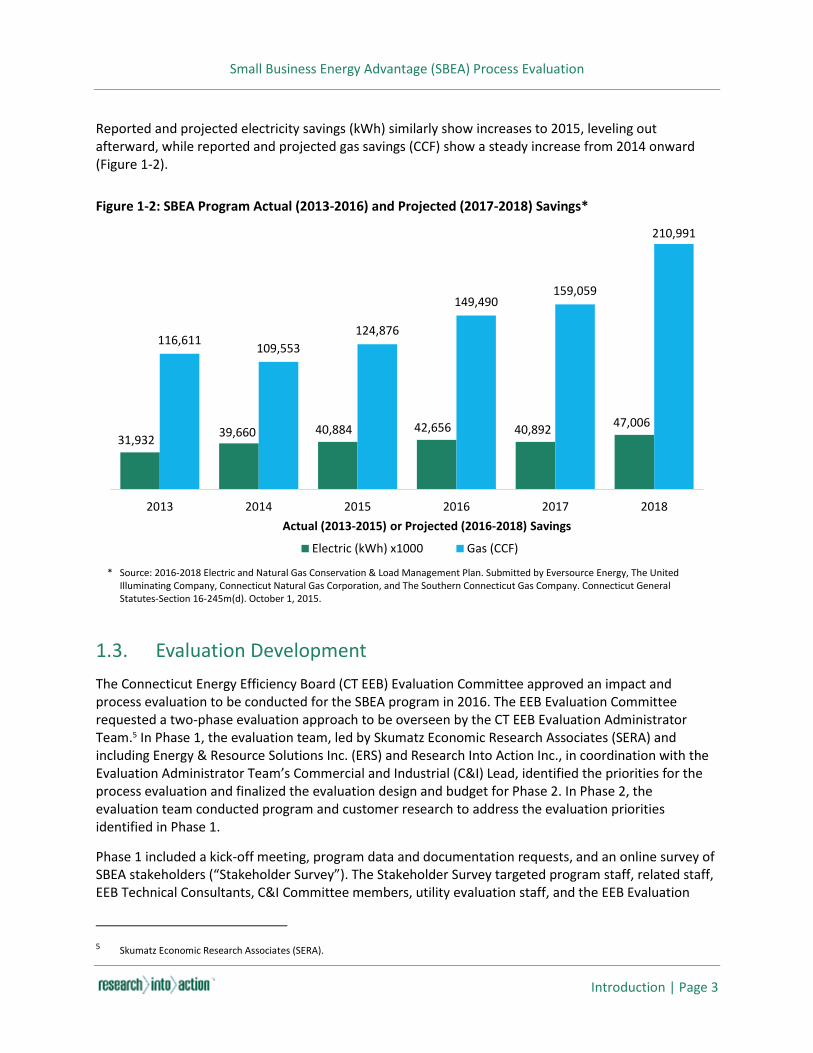
Reported and projected electricity savings (kWh) similarly show increases to 2015, leveling out afterward, while reported and projected gas savings (CCF) show a steady increase from 2014 onward (Figure 1-2).
Figure 1-2: SBEA Program Actual (2013-2016) and Projected (2017-2018) Savings*
* Source: 2016-2018 Electric and Natural Gas Conservation & Load Management Plan. Submitted by Eversource Energy, The United
Illuminating Company, Connecticut Natural Gas Corporation, and The Southern Connecticut Gas Company. Connecticut General Statutes-Section 16-245m(d). October 1, 2015.
1.3. Evaluation Development The Connecticut Energy Efficiency Board (CT EEB) Evaluation Committee approved an impact and process evaluation to be conducted for the SBEA program in 2016. The EEB Evaluation Committee requested a two-phase evaluation approach to be overseen by the CT EEB Evaluation Administrator Team.5 In Phase 1, the evaluation team, led by Skumatz Economic Research Associates (SERA) and including Energy & Resource Solutions Inc. (ERS) and Research Into Action Inc., in coordination with the Evaluation Administrator Team’s Commercial and Industrial (C&I) Lead, identified the priorities for the process evaluation and finalized the evaluation design and budget for Phase 2. In Phase 2, the evaluation team conducted program and customer research to address the evaluation priorities identified in Phase 1.
Phase 1 included a kick-off meeting, program data and documentation requests, and an online survey of SBEA stakeholders (“Stakeholder Survey”). The Stakeholder Survey targeted program staff, related staff, EEB Technical Consultants, C&I Committee members, utility evaluation staff, and the EEB Evaluation
5 Skumatz Economic Research Associates (SERA).
31,932 39,660 40,884 42,656 40,892 47,006
116,611 109,553124,876
149,490159,059
210,991
2013 2014 2015 2016 2017 2018Actual (2013-2015) or Projected (2016-2018) Savings
Electric (kWh) x1000 Gas (CCF)

Small Business Energy Advantage (SBEA) Process Evaluation
Introduction | Page 4
Committee members. The Stakeholder Survey inquired about the most important elements of the program, its tools, its operations, its implementation methods, and research issues of interest to the stakeholders. Following completion of the Stakeholder Survey, the evaluation team held a webinar on June 13, 2016 to discuss the survey findings with the stakeholders and refine the process evaluation research questions and objectives.
Following the webinar, the Evaluation Administrator Team sought and obtained approval from the EBB, Eversource and UI (on behalf of SCG and CNG) to proceed with Phase 2 of the process evaluation. The evaluation team then developed a Phase 2 plan, which consisted of in-depth interviews with utilities and SBEA technical consultants, as well as surveys with participants, nonparticipants, and program-affiliated contractors.
The evaluation team submitted the final (Phase 2) project summary to the Evaluation Administrator Team’s C&I Lead on July 20, 2016.
1.4. Key Evaluation Objectives and Questions The final Phase 2 project summary outlined the following objectives for the process evaluation:
1. Economically and transparently evaluate the SBEA program from both impact and process perspectives.
2. Conduct a process evaluation covering main program process elements, procedures, and tools.
3. Conduct the necessary research for identified process evaluation researchable questions surrounding potential areas/issues for program verification and improvement.
The priority process evaluation outcomes were the identification of:
1. Barriers to implementation of non-lighting projects and achieving deeper savings.
2. Decision-making processes relating to participants’ adoption of multiple measures.
3. The ability of program design and implementation to address the above process-related issues.
This this end, the evaluation team, together with the Evaluation Administrator Team and C&I Lead, identified the following research questions for Phase 2 (Table 1-1).

Small Business Energy Advantage (SBEA) Process Evaluation
Introduction | Page 5
Table 1-1: Research Topics and Research Questions
Research Topics Questions
What can be done to increase participation?
What proportion of nonparticipants that need external financing, would accept debt?
What other barriers exist to participation?
What financing options could increase participation?
Would the market tolerate more than 0% financing (to make current resources go further)?
How can the program get more activity from contractors?
What can be done to get deeper savings?
Are end-users aware of or interested in non-lighting opportunities?
What keeps participants from pursuing non-lighting measures and comprehensive projects?
What do contractors do to sell non-lighting measures and comprehensive projects?
What keeps contractors from pushing non-lighting or comprehensive projects?
Can end-users be induced to take larger loans to do larger, more comprehensive projects?
Any process issues to resolve?
Are participants and contractors satisfied with program? If not, why?
How do the program processes work, what could make it better?
Are there services not provided, that should be?
How does current staffing limit program success and how could added staff help?
This report presents findings on the above research questions.

Small Business Energy Advantage (SBEA) Process Evaluation
The Evaluation Approach | Page 6
2. The Evaluation Approach
Several data collection activities informed this process evaluation. A summary of the activities appears in Table 2-1. The appendices contain interview and survey instruments.
Table 2-1: Summary of Data Collection Activities
Target Group Population Method Stratification Sample C / P a
Phase 1
The SBEA Stakeholders - Utility Staff , Evaluation Committee, C&I EEB members, SERA team/EEB Technical Consultants
74 Web survey n/a 12 n/a
Webinar n/a 8 n/a
Either method n/a 18b n/a
Phase 2
Utility Staff n/a In-depth Interviews Utility 4 n/a
EEB Technical Consultants n/a In-depth Interviews n/a 2 n/a
Participating Contractors 42 Phone Survey Activity level 16 85/15
Participants ~ 1,100c Onsite survey Utility, fuel 51 85/10
Phone survey Utility & usage 125 90/10
Nonparticipants ~ 26,000 Phone Survey Utility & usage 25 85/15
a C / P = Confidence / Precision. b Two individuals participated in both the web survey and webinar. c 2016 SBEA participant population.
2.1. Stakeholder Survey and Interviews To gather feedback from people involved in the development, administration, and oversight of the SBEA, the evaluation team prepared and deployed a web survey for program stakeholders. Using Qualtrics online survey software, we deployed the survey on May 9, 2016, and sent two reminder emails, one on May 12th and the other on May 18th. We closed the survey to new responses on May 23rd.
During the survey implementation, key contacts for one utility indicated they would prepare a single response for the utility. Similarly, some other stakeholders indicated their colleagues had answered on their behalf. We did not send reminders to contacts whom we were told would therefore not be completing the survey.
We provided the survey to 74 contacts identified as SBEA stakeholders. Table 2-2 shows the distribution of all stakeholder groups and the number of completed surveys by group.

Small Business Energy Advantage (SBEA) Process Evaluation
The Evaluation Approach | Page 7
Table 2-2: Stakeholder Group Counts
Stakeholder Group Count (n=74) a Completed (n = 12)b
Utility Staff c 29 4
Evaluation Committee (EEB) 5 0
Commercial and Industrial Committee (EEB) 5 2
EEB Technical Consultants 6 2
Other d 32 5
a Three people each represented two stakeholder groups. Therefore, the counts for the various stakeholder groups do not sum to 74. b One person represented two stakeholder groups. Therefore, the counts for the various stakeholder groups do not sum to 12. c One survey represented the input of three staff. d A regulatory contact forwarded the survey to someone that appeared to be a participant representing state government buildings and
was not part of the original list of 74 stakeholders.
Most survey questions were close-ended, with scaled responses, but some were open-ended. We coded responses to open-ended questions as nominal-level responses, and we reported frequencies for both those and the close-ended responses.
The survey covered the program’s goals and objectives; the importance of key program elements; details of program operations and implementation (progress toward goals, eligibility, incentives, and interactions with contractors); program marketing; program staffing; and any program-related market research. Beginning with the section on operations and implementation, each survey section first asked respondents if they were sufficiently knowledgeable about that aspect of the program to answer questions about it. Respondents saw the pertinent questions only if they indicated familiarity; otherwise, they skipped to the next section. Overall, all respondents reported on the importance of various program elements. Subsets of respondents reported on program eligibility, progress towards goals, incentives, contractors, marketing, and staffing as shown in Table 2-3 below.

Small Business Energy Advantage (SBEA) Process Evaluation
The Evaluation Approach | Page 8
Table 2-3: Program Areas of Stakeholder Knowledge
ID Importance of Program Elements
Program Eligibility
Progress Towards
Goals Incentives Contractors Marketing Staffing
S1 9 9 9 9
S2 9 9 9 9 9 9 9
S3 9 9 9
S4 9
S5 9 9 9 9 9
S6 9 9 9 9 9 9
S7 9 9
S8 9 9 9 9 9 9 9
S9 9 9 9 9 9 9
S10 9 9 9 9 9 9
S11 9 9 9 9 9 9
S12 9
Sum 12 10 8 8 7 7 3
Respondents also characterized their role in the SBEA program as either a program participant (4), someone who administers and implements the program (3), a board member who provides direction to the program (3), someone involved in loan programs (1), and someone who refers customers to the program (1); see Table 2-4 below). They had varying degrees of experience with the SBEA program, from little or no program experience to multiple years of experience.6
6 Those with little experience in the program were listed as stakeholders for the following reasons: 1) one contact for Utility A represented
other utility programs and often refers customer participants to the SBEA program; 2) the bank contact recently became affiliated with program to assist with loans for program participants; and 3) one market representative represents a large architecture and engineering firm with offices in Connecticut and New York, which is a large player in a regional multifamily program.

Small Business Energy Advantage (SBEA) Process Evaluation
The Evaluation Approach | Page 9
Table 2-4: Stakeholder Respondents, Role, and Program Experience (n = 12)
Respondent a Stakeholder Group Stake in program Program Experience
(years)
A Utility A Experience with SBEA participants 0
B Utility A Administer and implement program 4.5
C Utility A Administer and implement program 12
D Utility B b Administer and implement program 16
E EEB Technical Consultant / C&I Committee
Board member provides program direction <1
F EEB Technical Consultant Board member provides program direction 6
G C&I Committee Board member provides program direction 10
H Bank SBEA loan administration 0
I Market representative Experience with SBEA participants <1
J Market representative Experience with SBEA participants 7
K Market representative Experience with SBEA participants 2.5
L Market representative Large architecture/engineering firm 0
a Respondents are identified differently (by letter) in this table than elsewhere (by number) to protect confidentiality. b Three staff members of one utility collaborated to complete this one survey. Throughout this memo, they are treated as one
respondent. It is not clear whether the reported 16 years of program experience represents the combined or maximum number of years of experience of the respondents.
To get a deeper understanding of the topics discussed in the Stakeholder Survey, the evaluation team conducted:
² A webinar with SBEA stakeholders to discuss findings from the Stakeholder Survey
² A group interview with UI staff involved with SBEA
² Two interviews with the SBEA Managers at Eversource
² Two interviews with technical consultants to EEB
These interviews sought to ensure the evaluation team understood how the program works and what the utilities would like to learn from this research, to confirm and refine research questions, and to clarify the data that the evaluators need from the utilities.

Small Business Energy Advantage (SBEA) Process Evaluation
The Evaluation Approach | Page 10
2.2. Contractor Survey A total of 24 contractors had completed at least one SBEA project in 2015 or 2016, of whom six were responsible for more than half the projects. The evaluation team surveyed 16 contractors to gather insights on:
² What program processes could be improved (e.g., audits, paperwork, incentives)?
² How contractors sell non-lighting and/or comprehensive projects?
² Why customers choose not to participate or apply for a loan?
² What changes to financing options could increase participation?
² What services could program staff provide to further engage contractors to generate more leads?
Respondents represented relatively small firms with either one (11) or two (5) locations in Connecticut, the majority (13) of whom had 20 or fewer employees. The majority completed more than 50 projects, rely on the SBEA program for a notable percentage of all their work, and serve the entire state. Table 2-5 provides an overview of respondent characteristics.
Table 2-5: Characteristics of Interviewed Contractors
Count Percent
Number of SBEA Projects in Last Year
Fewer than 50 projects 5 31%
50 to 100 projects 7 44%
More than 100 projects 4 25%
Percent of All Work That is SBEA
Fewer than one-third 3 19%
One-third to two-thirds 5 31%
More than two-thirds 7 44%
Don’t know 1 6%
Number of Business Locations
One 11 69%
Two 5 31%
Number of Employees
Fewer than 10 4 25%
10 to 20 9 56%
More than 20 3 19%

Small Business Energy Advantage (SBEA) Process Evaluation
The Evaluation Approach | Page 11
Count Percent
Locations Served
Whole State 10 63%
Not Southwest 4 25%
Northwest or Southwest 2 13%
The survey of contractors asked respondents about program processes, barriers to recruiting participants, barriers to non-lighting and comprehensive projects, financing, and satisfaction with the program. Respondents also provided thoughts on how to overcome barriers to participation and how to acquire more comprehensive projects.
2.3. Customer Surveys The Evaluation Team obtained customer feedback through a phone survey of 125 program participants, a briefer onsite survey of 51 participants sampled for the impact evaluation of the SBEA program (details below), and a phone survey of 27 utility customers who had not participated in the SBEA program.
The phone and onsite participant survey shared certain questions (e.g., equipment installed), but each also addressed one or more topics the other did not. Where feasible and appropriate, this report discusses combined data from the two surveys; at other times, the report presents data from one or the other survey.
2.3.1. Participant Phone Survey
The evaluation team surveyed 125 program participants by phone. We followed a stratified random sample approach, stratifying by customer size. We defined the strata by mean annual electricity usage, with each stratum representing about a third of customers:
² < 44,625 kWh (~35% of participants; categorized under stratum named “small”)
² 44,625 - 126,934 kWh (~32% of participants; categorized under stratum named “medium”)
² > 126,934 kWh (~32% of participants; categorized under stratum named “large”)
We randomly sampled within each stratum from among all 2016 program participants by either utility. We targeted a minimum of 41 survey completions for each stratum, which provided 80%/10% confidence/precision per stratum. The sample is representative of the population, proportionally representing each utilities’ participant populations (Table 2-6).

Small Business Energy Advantage (SBEA) Process Evaluation
The Evaluation Approach | Page 12
Table 2-6: Participant Population and Sample
Stratum SBEA Participant Population a Phone Survey Sample
N Percent n Percent
Large 344 32% 41 33%
Medium 344 32% 42 34%
Small 375 35% 42 34%
Total 1,063 100% 125 100%
a 2016 unique participant records with a phone number.
The surveyed organizations were largely businesses, owned their buildings, and had three or fewer work locations (Table 2-7). They varied in number of employees, from one to more than 50.
Table 2-7: Characteristics of Respondents’ Organizations (n = 125)
Organization Type Building Ownership Number of Locations Number of Employees
Privately owned 80% Own 74% 1 to 3 88% One to 10 50%
Franchise 5% Lease 26% 4 to 10 6% 11 to 50 40%
Government, nonprofit 15% 11 to 25 6% More than 50 10%
The survey instrument asked about experience with the program, any dissatisfaction with the incentives, loan paperwork, or other elements of the program, interest in non-lighting or deeper savings opportunities, and barriers to taking larger loans or pursuing non-lighting projects.
2.3.2. Participant Onsite Survey
The evaluation team conducted the onsite survey with participants selected for the impact evaluation sample. The impact evaluation sample was designed to provide a reliable estimate of energy savings for each equipment type, and therefore it over-sampled participants who installed non-lighting measures. It had two strata: 1) participants with only electric services from the utility companies; and 2) participants who received both electric and gas service (see Impact Report for a description of the sampling approach). Fifty-one participants agreed to complete the onsite survey.
The surveyed organizations largely were businesses, not government or non-profits, owned their buildings, and had three or fewer work locations (Table 2-8). They varied in number of employees, from one to 450.

Small Business Energy Advantage (SBEA) Process Evaluation
The Evaluation Approach | Page 13
Table 2-8: Characteristics of Respondents’ Businesses (n = 51)
Company Ownership Structure Building Ownership Number of Locations Number of Employees
Privately owned 69% Own 67% 1-3 63% One to 10 24%
Franchise 10% Lease 20% 4-10 18% 11 to 50 39%
Othera 16% Don’t know 4% 11-25 8% More than 50 25%
No response 6% No response 10% Not reported 12% Not reported 12%
a Government or not-for-profit.
The onsite survey asked about contractor and program satisfaction, reasons for not upgrading HVAC or other non-lighting measures, whether non-lighting upgrades were recommended, and reasons for using or not using the financing for the project.
2.3.3. Nonparticipant Survey
The team conducted a nonparticipant survey in January and February 2017 to gather feedback on two key research questions: 1) What could be done to increase participation in the program; and 2) what could be done to garner deeper savings? The team defined nonparticipants as utility customers who were eligible for the SBEA program but who had not participated in the program in the five years prior to the evaluation.7
The survey instrument asked about barriers to participation, attractiveness of SBEA loan terms, interest in non-lighting or deeper savings opportunities, and whether a contractor recommended any non-lighting or deeper savings opportunities if they had done any recent upgrades.
Like the participant sample, the evaluation team stratified the non-participant sample by customer size as defined by mean annual electricity usage and Utility service area, using the same stratum boundaries as used for the participant sample (see Section 2.3.2). The team randomly drew an equal-sized sample for each stratum, with three-quarters of each stratum sample coming from Eversource territory and one-quarter coming from UI/SCG/CNG territory. Projecting a 10% survey response rate, the team drew samples of 270 nonparticipant customers for each stratum (Table 2-9). The team then attempted to complete the survey with respondents in each stratum to achieve the target of 27 per stratum.
Table 2-9: Target Sample by Stratum
Count Percent
Large 270 33%
Medium 270 33%
Small 270 33%
Total 810 100%
7 That is, they had not participated in the years 2012 through 2016.
Small Business Energy Advantage (SBEA) Process Evaluation
The Evaluation Approach | Page 14
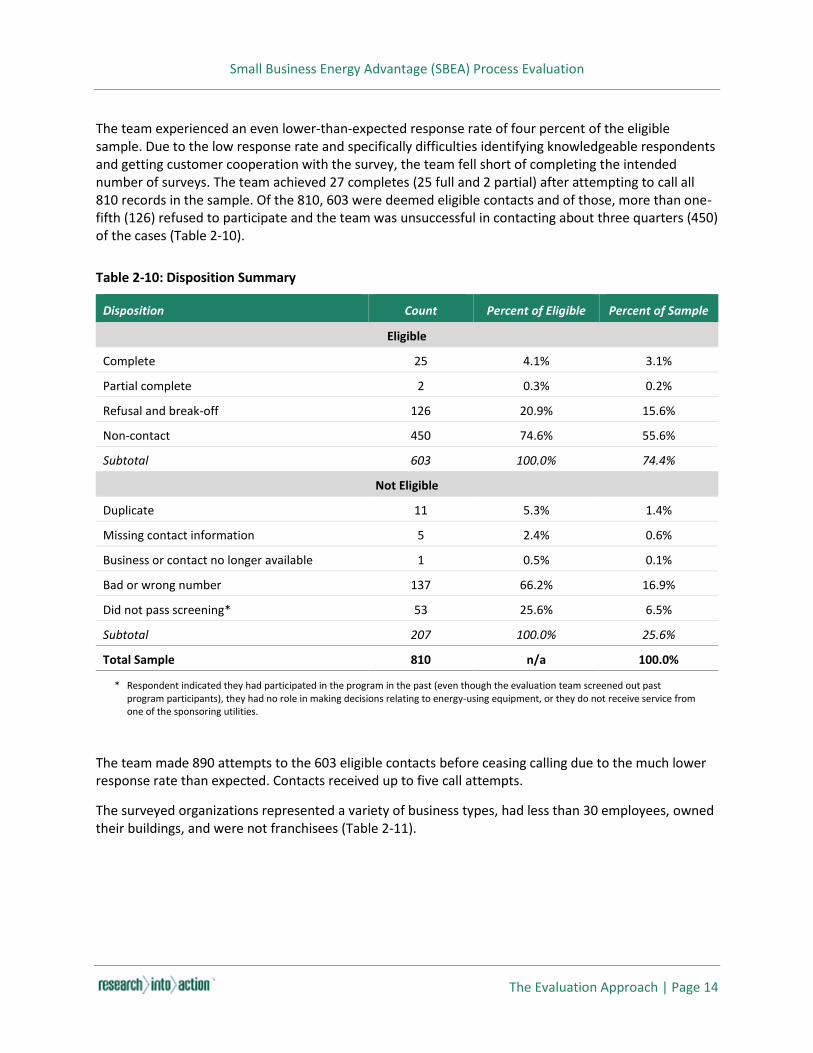
The team experienced an even lower-than-expected response rate of four percent of the eligible sample. Due to the low response rate and specifically difficulties identifying knowledgeable respondents and getting customer cooperation with the survey, the team fell short of completing the intended number of surveys. The team achieved 27 completes (25 full and 2 partial) after attempting to call all 810 records in the sample. Of the 810, 603 were deemed eligible contacts and of those, more than one-fifth (126) refused to participate and the team was unsuccessful in contacting about three quarters (450) of the cases (Table 2-10).
Table 2-10: Disposition Summary
Disposition Count Percent of Eligible Percent of Sample
Eligible
Complete 25 4.1% 3.1%
Partial complete 2 0.3% 0.2%
Refusal and break-off 126 20.9% 15.6%
Non-contact 450 74.6% 55.6%
Subtotal 603 100.0% 74.4%
Not Eligible
Duplicate 11 5.3% 1.4%
Missing contact information 5 2.4% 0.6%
Business or contact no longer available 1 0.5% 0.1%
Bad or wrong number 137 66.2% 16.9%
Did not pass screening* 53 25.6% 6.5%
Subtotal 207 100.0% 25.6%
Total Sample 810 n/a 100.0%
* Respondent indicated they had participated in the program in the past (even though the evaluation team screened out past program participants), they had no role in making decisions relating to energy-using equipment, or they do not receive service from one of the sponsoring utilities.
The team made 890 attempts to the 603 eligible contacts before ceasing calling due to the much lower response rate than expected. Contacts received up to five call attempts.
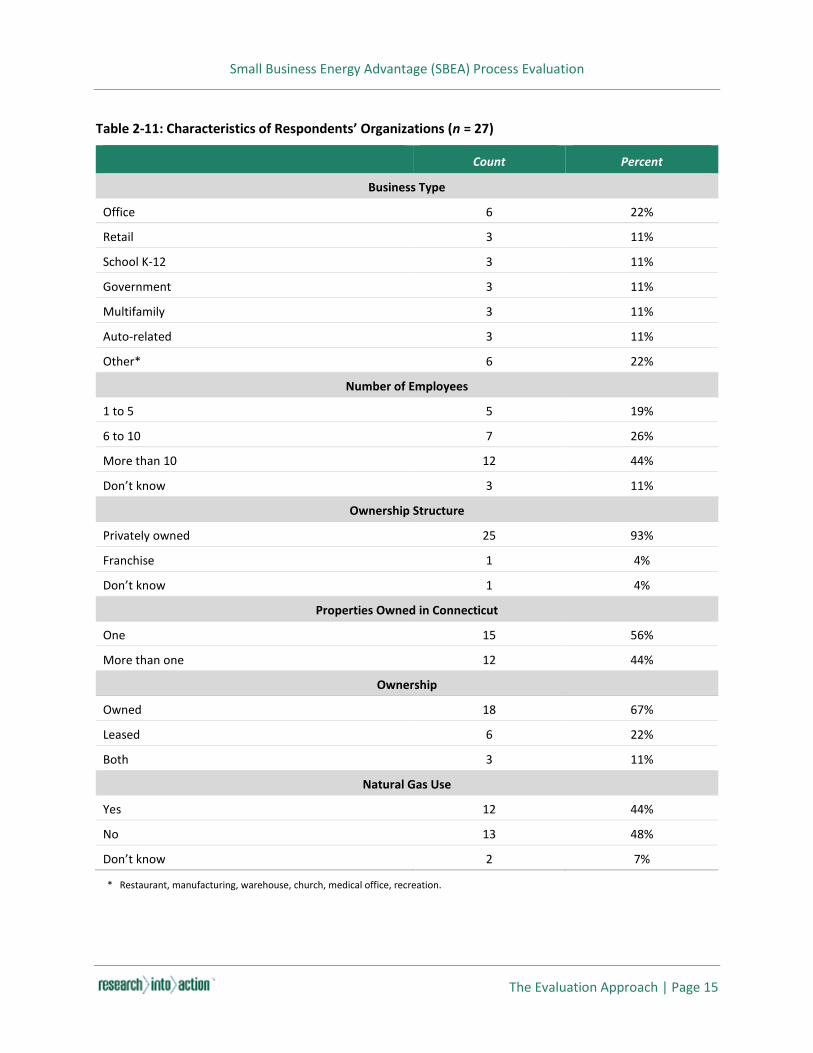
The surveyed organizations represented a variety of business types, had less than 30 employees, owned their buildings, and were not franchisees (Table 2-11).
Small Business Energy Advantage (SBEA) Process Evaluation
The Evaluation Approach | Page 15
Table 2-11: Characteristics of Respondents’ Organizations (n = 27)
Count Percent
Business Type
Office 6 22%
Retail 3 11%
School K-12 3 11%
Government 3 11%
Multifamily 3 11%
Auto-related 3 11%
Other* 6 22%
Number of Employees
1 to 5 5 19%
6 to 10 7 26%
More than 10 12 44%
Don’t know 3 11%
Ownership Structure
Privately owned 25 93%
Franchise 1 4%
Don’t know 1 4%
Properties Owned in Connecticut
One 15 56%
More than one 12 44%
Ownership
Owned 18 67%
Leased 6 22%
Both 3 11%
Natural Gas Use
Yes 12 44%
No 13 48%
Don’t know 2 7%
* Restaurant, manufacturing, warehouse, church, medical office, recreation.

Small Business Energy Advantage (SBEA) Process Evaluation
Evaluation Context: Stakeholder Feedback | Page 16
3. Evaluation Context: Stakeholder Feedback
This section presents a high-level summary of findings from the stakeholder survey, stakeholder webinar, and in-depth interviews with the utility staff and EEB technical consultants. As detailed in the following subsections, these interactions yielded several key findings:
Finding #1: There is general agreement that the SBEA program needs to implement more non-lighting and gas measures in the coming years, but there is some disagreement among stakeholders on whether the program will achieve the savings goals in those areas.
Finding #2: Stakeholders believe positive cash-flow financing is a key inducement for customers to complete a project through the program.
Finding #3: Current financing options may prohibit many small businesses from participating in SBEA. The program could do more to attract projects with longer-payback, such as non-lighting projects.
Finding #4: Some stakeholders are interested in whether the need or ability exists for the program to re-structure the SBEA financing, re-package the offerings, or optimize the program value proposition(s) to encourage participation.
Finding #5: Contractors often fail to meet program guidelines such as completing a certain number of comprehensive projects per month and may benefit from additional training about financing and marketing to specific businesses. Some contractors are less active than the guidelines suggest leading utility representatives spend time and resources helping contractors become more active.
3.1. Program Design and Customer Decision-Making Stakeholders discussed several issues related to how program design – particularly the incentive structure, loan cap, and loan term – relate to customer decision-making.
3.1.1. Financial Criteria and Program Strategies
During in-depth interviews, utility staff and EEB technical consultants described customer decision-making processes. They noted customers are likely to participate if a project is a cash-flow positive proposition, one utility contact even saying that, “Cash-flow situation is a stronger driver [of participation] than payback or amount paid over any period of time.”8
An EEB technical consultant explained how the program found the optimal incentive level to provide cash-flow positive projects when combined with on-bill financing. Originally, incentives covered 60% of project cost, which attracted participants but had an adverse effect on the program’s cost-effectiveness. When the program reduced incentives to about 30% of cost, participation dropped considerably, but
8 Cash positive refers to savings offsetting the loan payment amount.
Small Business Energy Advantage (SBEA) Process Evaluation
Evaluation Context: Stakeholder Feedback | Page 17
increasing the incentives to around 40% of the project cost generated nearly as much program participation as 60%.
During both the stakeholder webinar and their respective interviews, several stakeholders discussed whether the program should re-structure on-bill financing and incentives to make the program offerings attractive for longer payback measures, such as non-lighting equipment upgrades. The stakeholders noted three ways to restructure the offerings and associated challenges:
1. Extend the length of the SBEA loan (currently four years or less) to help make longer payback projects cash-flow positive.
x Stakeholders noted that the current loan terms may not be suitable if the length of the loan were to be extended. For example, if a customer moves out of the facility while the loan is in effect – which is an issue with longer term loans – should the loan stay with the property or move with the customer?
2. Raising the interest rate on the loan while re-structuring incentives and/or the loan length to ensure projects are cash-flow positive.
x Two stakeholders reported being wary about raising the interest rate. One stakeholder noted that the higher rate could lead to lower interest in participation, and it could reduce the number of businesses that qualify for the loan.
3. Providing bank financing.
x An EEB technical consultant explained that the Green Bank could attract private sector lenders to fund the SBEA loans. He also noted that the bank-financed loan will likely be perceived as debt, while on-bill financing might be perceived as a utility payment. From the accounting standpoint, it may be easier to get internal approval for a project if the loan is perceived as a utility payment, rather than as debt.
3.1.2. Effect of Loan Cap
One utility contact noted that the maximum loan limit of $100,000 can sometimes be a barrier to doing a deeper retrofit, especially if a customer is upgrading more expensive measures (for example, HVAC). This contact also noted that customers can apply for a Commercial Property Assessed Clean Energy (C-PACE)9 loan if the SBEA project financing exceeds the maximum loan amount.
3.1.3. Cost of Capital and Restructuring Loan Terms
Stakeholders noted that the cost of capital can hinder re-structuring the current SBEA loan terms, such as extending the loan length and/or increasing the loan cap. Such actions would require increased capital, which could come at an increased cost. The EEB technical consultant explained that both utilities currently are able to fund loans from the Connecticut Energy Efficiency Fund, which has a zero percent
9 C-PACE is a program that helps businesses access affordable, long-term loans for energy upgrades. C-PACE loan is secured by a lien on the
property.

Small Business Energy Advantage (SBEA) Process Evaluation
Evaluation Context: Stakeholder Feedback | Page 18
cost to the utilities. If utilities were to increase the total amount of financing provided through SBEA, they would need another source of funds.
One other source is the utility shareholder funds. The utility shareholders require a certain rate of return on shareholder funds, which, for both utilities, is equivalent to about a 6% post-tax return. Stakeholders noted there is an opportunity to substitute utility shareholders’ capital with a cheaper source of capital, which may help in restructuring the SBEA financing. Utility staff and EEB technical consultants reported that they are working with the Connecticut Green Bank to recruit lenders who could provide cheaper capital for the SBEA loans.
3.2. The Importance of Various Program Elements Twelve stakeholder survey respondents rated the importance of seven program elements: free audits, audits that cover lighting, audits that cover HVAC, audits, covered refrigeration equipment, on-bill payment, 35% incentives for most lighting, and 40% for high-performance lighting.10 The assigned importance ratings did not vary to a large degree among the various program elements. Eight of the 12 stakeholders assigned an importance rating of 4 or 5 to all seven elements. Figure 3-1 shows the pattern of importance ratings across the seven elements.
Figure 3-1: Stakeholder Rated Importance of Program Elements
10 Respondents rated the importance of each element on a scale of one to five, with one being not at all important and five being extremely
important.
2
2
1
1
1
1
3
4
2
3
2
9
9
7
7
9
9
10
1
1
0 2 4 6 8 10 12
High performance lighting incentives usually ~40% ofcost
Retrofit lighting incentives usually ~35% of installedcost
The audits cover refrigeration equipment
The audits cover HVAC
On-bill payment of equipment and installation costs
The audits cover lighting
The audits are free
Number of Stakeholders Assigning Each Rating (No Rating Below 3 Was Assigned)
3 4 5 DK

Small Business Energy Advantage (SBEA) Process Evaluation
Evaluation Context: Stakeholder Feedback | Page 19
Four of the 12 stakeholders each rated the importance of one or two program elements as a 3 – the midpoint on the scale:
² Two stakeholders, one market representative and one evaluation administrator, assigned the lower importance rating to lighting incentives because the market for lighting upgrades is largely saturated (one explicitly indicated this was a result of program efforts), and the program needs to push non-lighting savings.
² One stakeholder, a market representative, justified assigning less importance to audits that cover HVAC and refrigeration based on an apparently erroneous belief that Connecticut did not report savings from HVAC or refrigeration in the SBEA program, rendering the importance of any possible savings as unknown.
² The fourth stakeholder, a member of the commercial and industrial committee, assigned the lower importance rating to on-bill financing, saying it was unclear how much of a role financing plays in participant decision-making.
3.3. Achieving Program Savings Goals Nine stakeholder survey respondents reported sufficient knowledge about the program’s goals and achievements to answer further questions about that topic. Of those, eight could speak to trends in savings goals and budget spend since 2014. All eight pointed to the importance of gas savings in the coming years, seven of them specifically noting that the key opportunities for the program going forward are in natural gas savings.
Stakeholders are confident the program will achieve lighting savings but less confident the program will achieve HVAC, refrigeration, and gas savings goals in the coming years (see Section 1.2 for summary of program goals). Surveyed stakeholders rated both the importance11 of achieving various savings goals over the next three years and the likelihood12 that the goals will be achieved. For each measure category, the evaluation team constructed a single metric showing the relative importance of whether the goal will be achieved, by subtracting the importance rating from the likelihood rating. A positive number indicates the rated likelihood of achieving savings exceeds the rated importance, and a negative number means the rated importance exceeds the rated likelihood. Table 3-1 summarizes the results of this metric for the nine stakeholders who provided ratings.
11 On a scale of one to five, where one is not at all important and five is very important.
12 On a scale of one to five, where one is not at all likely and five is very likely.

Small Business Energy Advantage (SBEA) Process Evaluation
Evaluation Context: Stakeholder Feedback | Page 20
Table 3-1: The Gap between the Likelihood and the Importance of Achieving Savings*
N Years of Experience Role Lighting HVAC Refrigeration Natural Gas
2 <1 to 7 Market Rep. 1 1 1.5 0.5
4 0 to 16 Utility Staff -0.25 0.5 0 -1.25
1 10 C&I Committee 2 0 -1 -1
2 <1 to 6 EEB Tech. Consult. 1 -2.5 -2 -2.5
Mean Importance 4.3 4.0 4.2 4.7
Mean Likelihood 4.8 3.8 3.9 3.6
Mean Gap* .6 -.1 -.2 -1.1
* The gap is the rated likelihood minus the rated importance. A positive number (blue shading) indicates the likelihood exceeds the importance, a negative number (red shading) means the importance exceeds the likelihood, and zero means the importance and likelihood are balanced.
For lighting, the rated likelihood of achieving lighting savings generally exceeded the rated importance. By contrast, the rated importance of achieving savings goals for HVAC, refrigeration, and natural gas measures exceeded the rated likelihood, on average, suggesting concern about the ability of HVAC, refrigeration, and natural gas measures to contribute as needed to the program’s energy savings. Respondents with the most extreme negative gaps were utility staff and evaluation administrators (i.e., individuals who might be in a good position to gauge the gap).
Respondents offered additional comments on factors that have affected program performance or might do so in the future. Four commented on improvements in outreach efforts, including more targeted marketing; of those, three specifically stated these were key strategies being used to accomplish gas savings goals 13 and identified them as a reason why budget spend and savings achieved were greater in 2015 than 2014.14 Other reasons for the spend and savings increase, cited by one respondent each, were the increased participation of state government facilities and an increase in the completion of comprehensive projects.
One respondent indicated the program will be improving the list of eligible items and the amount of incentives for gas-saving items, which should help increase gas savings in the future. Another suggested increasing the number of contractors doing SBEA work as a way to achieve goals in 2016.
Two respondents provided feedback on what would keep the program from achieving any savings. Both suggested that gas savings are at risk because of the high capital costs, the relatively long life of gas equipment, and low budgets for gas saving work relative to electric budgets. One noted that HVAC savings are at risk because the program does not yet have an effective financing strategy, though the program is developing more effective financing strategies.
13 A fourth respondent directed the evaluation team to review the program strategies section of the two most recent Conservation and Load
Management Plans. This respondent did this in multiple places throughout survey.
14 Percentage of budget spent and savings achieved increased from 82% and 81%, respectively, in 2014, to 90% and 87% in 2015.

Small Business Energy Advantage (SBEA) Process Evaluation
Evaluation Context: Stakeholder Feedback | Page 21
3.4. Program Marketing Interviewed utility contacts noted that, in addition to the direct outreach performed by program contractors, the SBEA program is marketed in coordination with other C&I programs as well as through program-specific marketing activities and materials. The latter include radio, print, and television advertisements; Facebook and Twitter advertisements with links to the smallbiz.energizect.com website; and a brochure and flyers with case studies. In addition, contacts also reported having done outreach to trade organizations, worked with alliances (for example, manufacturers alliance), presented at trade meetings, or leveraged relationships with associations to better assess the needs of the SBEA market.
Surveyed and interviewed stakeholders identified three primary challenges to program success that the program marketing attempts to address:
² Skepticism about the program in the market. One utility contact reported that business owners are skeptical about program offerings, partly because they are often solicited about various products.
² Multiple types of management structure. To successfully communicate the value of the investment, the utility companies need to be sophisticated in dealing with organizations that have many different management structures. Some small businesses are individually operated – maybe a franchise, but not centrally operated – while other businesses are franchises or other remotely managed that are either very decentralized or tightly managed.
² Heterogeneity of small businesses. Contacts reported the utility companies have done a good job of segmenting the SBEA market and developing standardized program delivery approach to make best use of the resources, but to achieve increasing targets, the interviewed contacts said that program staff will need to more efficiently target many different types of small businesses.
The following subsections summarize two key aspects of program marketing that stakeholders identified for addressing the above challenges.
3.4.1. Offering an Improved Narrative
A utility contact reported the program addresses owners’ skepticism by providing them with the case studies of similar businesses participating in the program. An EEB technical consultant suggested the program could update the narrative in explaining the value of the program, such as emphasizing the positive cashflow. This EEB technical consultant reported that the program needs to sell “the value of the investment, not the incentives and interest rate [financing].”
3.4.2. Segment-Specific Efforts
Surveyed and interviewed stakeholders discussed segment-specific marketing efforts. Six stakeholder survey respondents reported that the utility companies carry out sector-targeted marketing, with one to two respondents each specifically mentioning restaurants, agriculture, nursing homes, medical offices, property managers, and grocery/convenience. Two contacts from one utility said they segment the

Small Business Energy Advantage (SBEA) Process Evaluation
Evaluation Context: Stakeholder Feedback | Page 22
market to identify big energy users; they reported focusing on four segments: manufacturing, restaurants, property management, and grocery stores.
One of the two contacts identified above also identified specific strategies they are using or considering: 1) working with trade organizations in each segment to promote contractors as trusted advisors to businesses; 2) considering incentives based on market segments; and 3) developing case studies for each segment. One of the contacts noted the utility uses outside consultants to find ways to approach high-energy usage customers in several sectors, including restaurants, manufacturing, and grocery or convenience stores.
One utility contact reported on tailored strategies designed to addresses cultural and/or language barriers specific to certain small business segments. Specifically, they have hired Spanish-speaking firm/staff to recruit businesses in Hispanic neighborhoods. They also have contacted Asian Business Associations to help them reach Asian businesses.
To more efficiently target many different types of small businesses, the EEB technical consultant suggested the program could start with likely-to-participate segments, such as government or public facilities. Program staff can leverage Memoranda of Understanding (MOU)15 with public organizations to recruit many public facilities into the program. Then, after these likely-to-participate organizations have been engaged, the consultant suggested using different strategies for reaching smaller, harder-to-reach segments. The EEB technical consultant also suggested using a customer engagement platform or an online tool that taps into customer data and provides tailored customer analytics.
3.5. Program Rules and Processes Surveyed and interviewed stakeholders provided valuable feedback on program eligibility, qualification for financing, and incentive levels.
3.5.1. Program Eligibility
We asked the ten stakeholder survey respondents reporting knowledge about some aspects of program eligibility about any changes in eligibility over the past five years, any challenges or difficulties relating to program eligibility, and any plans or discussions about changing eligibility requirements. Of those ten respondents, seven noted no significant changes to eligibility requirements and two were not aware of any changes. One respondent reported that the 200-kW peak demand ceiling had been removed in one utility territory for state government accounts. Two other respondents reported that program staff and stakeholders were discussing whether to change the 200-kW peak demand ceiling; however, they did not specify whether the discussions were to increase or decrease the ceiling.
3.5.2. Qualification for Financing
During in-depth interviews, a contact for one of the utilities noted that larger loans are vetted more thoroughly than smaller loans. The program must maintain a default rate of less than one percent. To
15 A MOU is an agreement between two or multiple parties. Organization can use MOUs to establish partnerships. MOUs are not legally
binding but they carry a degree of seriousness.

Small Business Energy Advantage (SBEA) Process Evaluation
Evaluation Context: Stakeholder Feedback | Page 23
maintain that rate, one of the utilities sends any loan over $45,000 to a third-party credit agency for review. However, a contact for another utility indicated that utility was able to maintain the target default rate without third-party review, which that contact suggested would slow the approval process.
Three Stakeholder Survey respondents noted there had been some challenges with qualifying customers for financing. Customers with poor credit and with unestablished bill payment histories are not eligible for loans, which can limit participation.16 As noted above, in explaining risks to achieving HVAC savings, another respondent reported that the program does not yet have an effective financing strategy, but is developing more effective financing strategies. That respondent did not elaborate further in this part of the survey.
During in-depth interviews, contacts for both electric utilities described efforts to address financing challenges relating to customer bill payment history. One contact noted that a few years ago, the program increased the number of participants who qualified for zero-percent financing by changing the definition of late bill payment. A history of paying the utility’s bills on time is a financing eligibility criterion. Initially, bills were considered “late” if they were paid more than 30 days past the due date. The utility changed that criterion so that, currently, bills are considered late if they are more than 39 days past due date. This change allowed staff to increase the pool of those who are eligible for the program by about 300 to 400 customers.
The other utility conducts a review of financing details for non-qualifying customers upon request and makes exceptions when they are judged to be prudent. If a payment history shows consistent payments and no payments more than 30 days late, the customer typically is approved.
Overall, most customers who apply do qualify for financing. One utility contact reported that, of all customers who apply, 95% qualify for financing. However, not all of those who qualify for financing decide to complete a project. Of those who qualify for financing for the contractor-proposed upgrades (see Section 5.2), about 42% do a project through the program; of those who do not qualify for financing, about 10% to 15% do a project without financing.
3.5.3. Incentive Levels
Eight stakeholder survey respondents reported sufficient knowledge about the program’s incentives to be able to answer questions about that topic. The only changes noted to the incentive structure in the past five years were the inclusion of gas incentives and an increase in incentives for comprehensive projects, each cited by one respondent. Three noted possible changes to incentives in the coming years, including offering more flexibility in the criteria for the comprehensive bonus, aligning incentives to better compare to other states, and aligning incentives to better attract comprehensive projects.
In reviewing program data files, the evaluation team noted that the incentives amount for some projects (as a percentage of project costs) exceeded the maximums identified in program documentation. The survey therefore asked why this might occur or, conversely, why a participant would get less than the maximum incentive. Responses indicated that projects could receive greater than the maximum identified in program documentation if the project was comprehensive (two respondents) or if it
16 A utility contact clarified that this is prevalent only when HVAC savings represent a very large portion of a project’s savings.
Small Business Energy Advantage (SBEA) Process Evaluation
Evaluation Context: Stakeholder Feedback | Page 24
contained prescriptive gas measures (one respondent).17 The only reason given for receiving less than the maximum allowed is that a project’s savings were not sufficient to justify the maximum incentive amount (four respondents).
3.5.4. Program Delivery Challenges
During in-depth interviews, stakeholders noted several additional program delivery challenges:
² A utility contact reported that tracking of project changes can be cumbersome. When a project changes based on customer feedback, staff must review that project as a new project instead of reviewing changes only. This can be time-consuming. This contact noted that the utility he represents is working on improving the tracking system, which will help resolve this issue.
² The same utility contact noted that contractors find their online application portal limiting in terms of what could be reported about a project and, at times, slow in processing the information.
² A utility contact also reported that occasionally existing code violations can affect a project. The program staff notifies customers that they must address any existing code violations prior to the inspection. Although fixing code violations can be included in the scope of the project, incentives cannot be used for that work, however, financing can be used for fixing existing code violations.
² Last, a utility contact reported that some customers who were primarily interested in non-lighting projects had done a lighting project only. Per this contact, about five percent of the time a lighting project is completed when a customer expresses interest in non-lighting upgrades. To minimize this issue, the utility contact reported that their staff: 1) have met with various contractors to communicate a need to recruit customers who are interested in comprehensive upgrades and 2) have required contractors to use a “comprehensive” check list to document that all options were reviewed with a customer. Note that a customer must sign the comprehensive checklist. The utility contact noted that using the check list minimized instances where customers interested in non-lighting upgrades completed only lighting upgrades.
3.6. Interaction with Contractors
3.6.1. Recruitment and Engagement
Both Eversource and UI (on behalf of SCG and CNG) issue a Request for Proposals (RFP) to recruit contractors who can perform comprehensive audit and installation services into the program. UI (on behalf of SCG and CNG) currently works with 16 contractors to generate leads for the SBEA program, and Eversource works with about 30 contractors. In an in-depth interview, a utility contact explained, “We have an adequate number [of contractors] to serve the marketplace; to go broader would probably dilute the value of the program to existing contractors and may not result in more business.” Another
17 Two respondents also indicated that a project might receive incentives from other agencies such as the United States Department of
Agriculture. Presumably that would not pertain to the incentive amount recorded in the program data files.
Small Business Energy Advantage (SBEA) Process Evaluation
Evaluation Context: Stakeholder Feedback | Page 25
utility contact explained that not all contractors want to target small business sector or be associated with the SBEA program.
Of the seven stakeholder survey respondents discussing contractor involvement in the program, three noted that program staff have done something to encourage less active contractors to become more active. One respondent, representing the C&I committee, indicated the CT EEB has encouraged the program to assign contractors to specific industries to build knowledge of specific business sectors, thus making it easier to sell the program to those sectors. On a similar note, one utility representative reported the program reaches out to small contractor firms because they are “critical” in addressing under-served areas. A second utility representative noted his utility works one-on-one with less active contractors to encourage greater participation.
Five stakeholder respondents also remarked on customers’ experience with contractors. All five expressed that most contractor feedback from customers has been positive, with only occasional customer service issues, such as a contractor not cleaning up a job site adequately. One of these five, a market representative, noted having heard from participants that a contractor reviewed only lighting, suggesting there was more room for other energy-saving work.
3.6.2. Training Needs
Of the seven stakeholder survey respondents who reported having knowledge of contractors in the program, five reported the program provides periodic training to contractors about financing options and methods to reach the various types of businesses that constitute the small business sector. According to one of these respondents, the contractors need better training in both areas to increase participation. This is in addition to the respondent, discussed above (Section Error! Reference source not found.), who said the program needs to increase the number of contractors.
When we asked utility staff about training, one contact noted a need for contractor training on energy-efficient products. He explained that contractors might not present customers with the best energy-saving solution due to lack of knowledge of new products available in the marketplace18 and the desire to sell the least expensive item. This contact also reported receiving positive feedback from contractors about program training offered through the program. Another utility contact noted their utility provides sales training to contractors to help them “close the sale,” as well as an auditor training program. Via the training, the utility staff teaches contractors that it is not just about saving energy, it is also about promoting customers’ products.
3.6.3. Meeting Compliance Guidelines
The SBEA program provides the following guidelines to contractors as a way for them to stay in compliance with the goals of the program.
² Must submit a minimum of twelve (12) customer leads per month
² Must develop/present a minimum of eight (8) projects per month
18 Staff was referring to primarily non-lighting products such as HVAC, motors, or refrigeration, and lighting controls.

Small Business Energy Advantage (SBEA) Process Evaluation
Evaluation Context: Stakeholder Feedback | Page 26
² Must convert 40% of leads into installed projects
² Of the installed projects, a minimum of one per month must be comprehensive.
² Of the installed projects, a minimum of one per month must contain a gas measure.
² Must designate one staff member as the “point of contact” and primary user of the SBEA web based program
² Must maintain an 80% or better Compliance Rate on all Pre- and Post-installation inspections.
² It is the expectation of Connecticut Light & Power (CL&P) that all contractors will build and complete projects in accordance with the time guidelines as outlined in the SBEA Program Implementation Manual. At the discretion of CL&P, written justification may be required if project completion exceeds the established time guidelines.
² Attendance at SBEA quarterly meetings by principal and staff (maximum of three attendees).19
These items provide contractors with parameters they should be considering when identifying customers and completing projects. Utility staff indicated that if a contractor fails to do many of these guidelines they can be removed from the program.
When asked about these guidelines, stakeholder survey respondents representing the two utilities reported that contractors sometimes failed to meet compliance guidelines in the past five years. Respondents identified the frequency with which contractors did not meet guidelines on a scale, where the maximum response was “five or more times.” The respondents from one utility said that contractors had failed at least five times in the past five years to meet all guidelines, and the respondent from the other utility reported the same failure incidence for all but two of the guidelines asked about: maintaining 80% compliance rate on inspections and installing at least one comprehensive project per month (Table 3-2).
Respondents noted that issues of noncompliance are managed through warnings to contractors and via quarterly evaluations of contractors. Typically, program staff treat noncompliance issues as a learning opportunity for contractors.
During in-depth interviews, one utility contact noted their utility is working on automating the reporting function of their program tracking database to ensure their SBEA staff are reviewing program metrics monthly, including whether contractors are in or close to compliance. This will allow them to be more proactive with contractors when they are not meeting their goals; better assess the accuracy of the data entered by contractors; communicate issues or concerns about a project to a contractor; and capture information, to the extent possible, on what contractors are presenting to the customers.
19 2016 SBEA Program Manual – Contractors Manual, p. 20.

Small Business Energy Advantage (SBEA) Process Evaluation
Evaluation Context: Stakeholder Feedback | Page 27
Table 3-2: Frequency of Contractor Failure to Meet Compliance Guidelines Over Last Five Years
Number of Times a Contractor Has Failed to Meet Compliance Guidelines
Utility Submit 12 Customer
Leads
Develop Eight
Projects per Month
Convert 40% of
Leads into Projects
Complete One Comprehen-sive Project Per Month
Install at Least One
Gas Project Per Month
Maintain 80%
Compliance Rate on
Inspections
Complete Projects
According to SBEA Time Guidelines
1 ≥ 5 ≥ 5 ≥ 5 3 to 4 ≥ 5 1 to 2 ≥ 5
2 ≥ 5 ≥ 5 ≥ 5 ≥ 5 ≥ 5 ≥ 5 ≥ 5
3.6.4. Communication
During in-depth interviews, one utility contact explained that their SBEA staff interacts with one or two contractors daily about project needs or getting information uploaded into their system. They also send program update(s) every couple of weeks to all their contractors. This contact suggested that it would be helpful to consolidate online and offline communications about the program.
Another utility contact noted they primarily use email to communicate with contractors. Their staff guide contractors to identify the transaction in the email subject line to prioritize which emails require a response. They also have quarterly meetings with contractors to review “what’s working, not working, new technologies, brands (companies) to give presentations [to], [and] review [utility] programs.” This contact explained that communication with their contractors could be improved in one area: gathering more detail from contractors on pre-existing condition of the replaced equipment (for example, whether the equipment was broken).
3.7. Program Staffing Three stakeholder survey respondents reported knowledge about utility staffing of the program. A respondent from the evaluation team indicated the utilities were under discussion to figure out the appropriate staffing needs for the program. Two utility respondents, from different utilities, provided additional detail. One reported an engineer and an administrative assistant were needed, while the other reported only that two additional full time equivalents (FTEs) were needed.
Several months after the stakeholder survey, we asked utility staff about their staffing needs. A utility respondent who said two additional FTE’s are needed hired one staff into one of the two FTE positions. A respondent who noted they needed an administrative assistant and an engineer hired both. Before hiring the engineer, the respondent noted that it might have taken them three to four weeks to review projects. Now, it takes them two to four days. Contractors have been pleased with this timeframe.

Small Business Energy Advantage (SBEA) Process Evaluation
Evaluation Context: Stakeholder Feedback | Page 28
3.8. The Effect of Program Interruption A final important comment was voiced by one utility contact, who noted that in the past the program had to shut down half way through the year due to lack of funds. It took program staff a year to recover customer and contractor trust in the program.

Small Business Energy Advantage (SBEA) Process Evaluation
Equipment Installed Through SBEA | Page 29
4. Equipment Installed Through SBEA
The energy efficient equipment installed through the SBEA program is dominated by lighting: all participants have upgraded lighting equipment, and for about three-quarters of them, lighting is the only equipment type they have upgraded. However, lighting-only projects generate just over half as much electricity savings as do projects that include non-lighting measures and account for just 60% of total electricity savings.20, 21
4.1. Equipment Installed by Phone Survey Participants The program participants surveyed by phone reported the types of equipment they upgraded through the program. It was necessary to collect self-reports because one of the two utility companies did not provide data on the measures installed by the 2016 participants. The fact that the other company did provide 2016 measure data allowed the evaluation team to check the self-reported data for that company, by comparing it with the measures identified in the program database.22 That comparison revealed that several surveyed participants under-reported non-lighting measures (Figure 4-1).
Figure 4-1 Equipment Installed – Phone Survey Self-Report Compared to Project Database (n = 94)*
* The data represented in this graphic are from the one utility company that provided 2016 measure data. ** “Other” upgrades were primarily the addition of controls to lighting or HVAC equipment.
20 The population figures are based on the most recent measure-level data available to the evaluation team at the time of the evaluation,
which consisted of 2015 participation data for one of the utility companies and 2016 data from January through October for the other company. The team weighted the latter data to provide a more accurate representation of what the full year’s data would have been and then combined the data from the two companies. The company that provided only 2015 data accounted for about one-quarter of all upgrades, and the distribution of upgraded equipment types was similar for the two companies, so any differences between the 2015 and 2016 upgrades done by the first company likely would have minimal impact on the overall picture.
21 With respect to the mix of lighting and nonlighting projects, it is difficult to compare SBEA to other small business programs that the evaluation team has evaluated, as small business programs vary significantly in design, implementation, and data tracking. Moreover, the objective of this evaluation is not to compare this program’s performance against that of other programs but to investigate how the program may achieve deeper savings through greater implementation of non-lighting projects (see Section 1.4).
22 See footnote 20.
13%3% 0% 1%
7%
26%
7% 7% 13% 14%
0%
25%
50%
75%
100%
Any non-lighting HVAC Hot water Refrigeration OtherNonlighting**
Perc
ent o
f Sur
vey
Resp
onde
nts
Phone Survey - Self-Reported Phone Survey - Project Database

Small Business Energy Advantage (SBEA) Process Evaluation
Equipment Installed Through SBEA | Page 30
Examination of the project data provided at least a partial explanation for why phone survey respondents under-reported non-lighting measures. Those who installed non-lighting measures but did not report doing so frequently installed low-cost, easy-to-install measures such as refrigeration controls, water-saving measures, and thermostats (Table 4-1). It is easily conceivable that participants did not think about such measures when responding to the survey. Only two of the 15 such participants installed motors, major HVAC equipment, or boilers, compared to five of the 11 surveyed participants who reported non-lighting measures.
Table 4-1: Non-lighting Measures Installed by Phone Survey Respondents
Non-lighting Measure
Number of Phone Survey Respondents
Reported Non-lighting Measures in Survey
Did not Report Non-lighting Measures in Survey
Refrigeration control (e.g., Vending Miser) 4 6
Faucet aerator or shower head 3 4
Thermostat 1 2
Motor or fan controls (e.g., variable frequency drives) 5 2
Insulation, pipe wrap, case doors, air sealing 3 1
Motors 3 1
HVAC equipment, furnace, boiler 3 1
Energy management system 1 0
When the evaluation team substituted available data on installed measures for those reported in the survey, the percentage of surveyed participants who installed non-lighting measures was about equal to that of the population (Figure 4-2Error! Reference source not found.). Note that the evaluation team could do this substitution only for the participants from one of the two utility companies. That company accounted for about three-quarters of the survey respondents, and so likely accounted for approximately that share of the under-reporting. It is possible that, if the evaluation team could substitute program data for self-reports for the other utility company, the comparison between the surveyed participants and the program population would be even closer.

Small Business Energy Advantage (SBEA) Process Evaluation
Equipment Installed Through SBEA | Page 31
Figure 4-2: Equipment Installed – Program Population and Phone Survey Respondents (n = 125)
* “Other” upgrades were primarily the addition of controls to lighting or HVAC equipment.
4.2. Equipment Installed by Onsite Survey Participants The onsite survey was conducted with participants sampled for the impact evaluation, which over-sampled participants who installed non-lighting equipment to ensure a reliable estimate of savings from such equipment (Figure 4-3).
Figure 4-3: Equipment Installed – Onsite Survey (n = 51)
99%
26%
8% 6%10% 14%
100%
27%
7% 8%15% 19%
0%
25%
50%
75%
100%
Any lighting Any non-lighting
HVAC Hot water Refrigeration OtherNonlighting*
Perc
ent o
f Sur
vey
Resp
onde
nts /
Po
pula
tion
Phone Survey - Project Database Population
64%
50%45%
9%5%
14%
100%
62%
21%
0%
38%
14%
0%
25%
50%
75%
100%
Lighting Any non-lighting
HVAC DHW Refrigeration Other
Perc
ent o
f Res
pond
ents
Electric Equipment
Gas Customers (n = 22) Electric Customers (n = 29)
5%
HVAC Hotwater
Other
Gas Equipment
95%
14%
Small Business Energy Advantage (SBEA) Process Evaluation
Equipment Installed Through SBEA | Page 32
4.3. Comparing Lighting and Non-Lighting Participants The onsite survey considerably increased the sample of participants who upgraded non-lighting equipment. This allowed the evaluators to compare such respondents with those who did only lighting upgrades, on responses to items common to the two surveys (e.g., satisfaction). This could provide information relating to barriers to doing non-lighting upgrades.
Such comparisons are somewhat complicated by the finding that some phone survey respondents under-reported installation of non-lighting equipment. Relying on self-reports to divide the sample into lighting-only and non-lighting results in misclassification of some respondents. However, since one utility company did not provide measure data, we could not consistently use project data to divide the sample. The analysis in Section 4.1 suggests that the under-reported non-lighting measures were largely low-cost measures, which may not be subject to the same barriers as higher-cost measures such as air conditioning units, furnaces, motors, boilers, and the like. As suggested above, the survey self-reports may better reflect the costlier (and higher-impact) measures. In that case, dividing the sample based on project data, rather than on self-report, may dilute the effects that the comparison seeks to illuminate. Therefore, the comparisons of lighting and non-lighting participants uses self-report, which provides a consistent criterion.
Together, the phone survey and onsite survey samples collected data from 176 participants. Of those, self-reports indicated that 113 had done only lighting upgrades and 63 had done non-lighting upgrades. Substituting project data for self-reports decreased the number of lighting-only participants to 101 and increased the number of non-lighting participants to 75. Note, however, that all but a handful of the surveyed participants who had done non-lighting upgrades also had done lighting upgrades.
4.4. Distribution of Project Types Among SBEA Contractors The project data files identify the contractor associated with each SBEA project. For each contractor, the evaluation team tabulated the number of projects identified as having lighting measures, the number with any non-lighting measures (“non-lighting projects”), and the number identified in the project database as “comprehensive” (see Section 1.1). While all 24 active SBEA contractors23 included lighting measures in nearly all or all of their projects,Error! Reference source not found. Figure 4-4 shows that those 24 contractors varied considerably in the percentage of non-lighting and comprehensive projects. The distribution is particularly skewed for contractors with comprehensive projects.
23 “Active” here refers to contractors that had done any SBEA projects in 2015 or 2016.
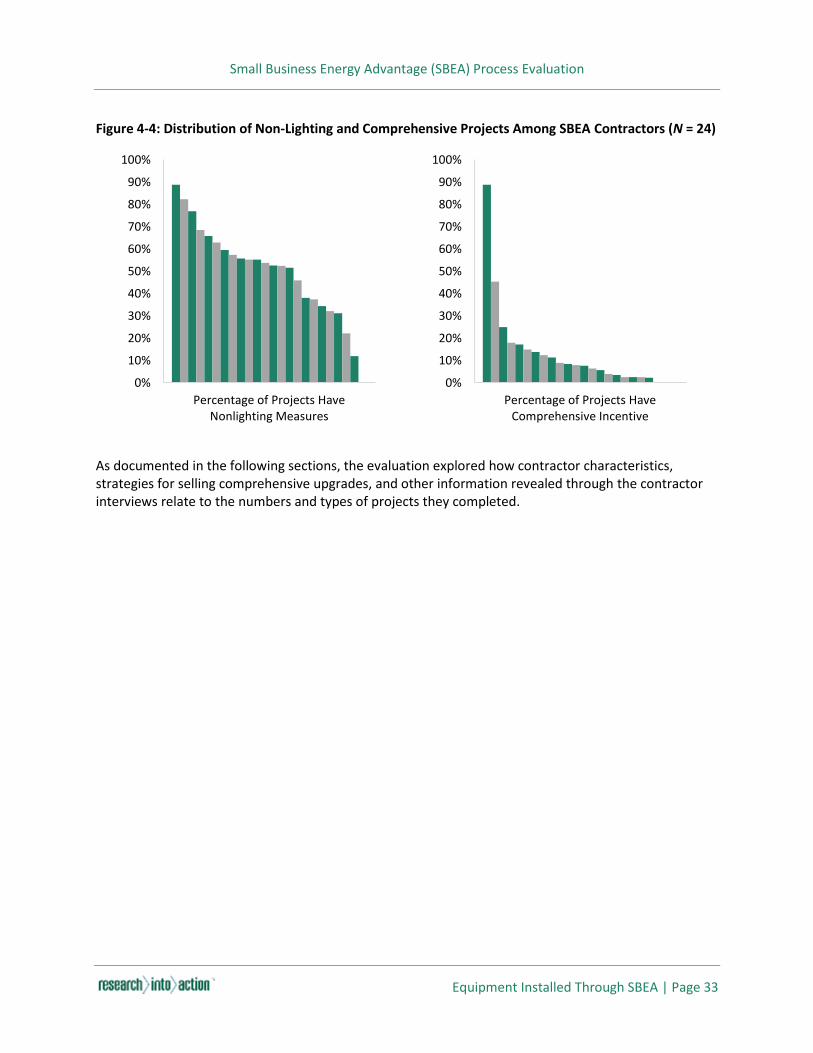
Small Business Energy Advantage (SBEA) Process Evaluation
Equipment Installed Through SBEA | Page 33
Figure 4-4: Distribution of Non-Lighting and Comprehensive Projects Among SBEA Contractors (N = 24)
As documented in the following sections, the evaluation explored how contractor characteristics, strategies for selling comprehensive upgrades, and other information revealed through the contractor interviews relate to the numbers and types of projects they completed.
0%
10%
20%
30%
40%
50%
60%
70%
80%
90%
100%
Percentage of Projects HaveNonlighting Measures
0%
10%
20%
30%
40%
50%
60%
70%
80%
90%
100%
Percentage of Projects HaveComprehensive Incentive

Small Business Energy Advantage (SBEA) Process Evaluation
Selling (and Upselling) the Upgrades | Page 34
5. Selling (and Upselling) the Upgrades
The interviewed contractors and the participants surveyed by phone provided information on how the contractors sell program-incented equipment upgrades. The following sections describe how the contractors set up and conduct audits, factors related to contractor success in convincing customers to do upgrades and, in particular, to do more than lighting upgrades, and factors that prevent them from pushing for more comprehensive upgrades.
The interviewed contractors varied widely in the number of SBEA projects they completed, in the number and percentage that were non-lighting and comprehensive,24 and in their reported levels of success in getting program participation from the customers they attempt to sell the program to (Table 5-1).25
Table 5-1: Indices of Contractors’ Levels of Activity in Selling SBEA Projects (n = 16)
Activity Index Mean Median Minimum Maximum
Percentage of leads converted to SBEA projects 36% 34% 5% 80%
Total number SBEA of projects 58 39 9 212
Number of non-lighting SBEA projects 30 21 3 98
Number of comprehensive SBEA projects 8 4 0 54
Percentage of SBEA projects with non-lighting measures 50% 53% 12% 89%
Percentage of projects with SBEA comprehensive incentive 10% 6% 0% 44%
The total number of SBEA projects they completed was unrelated to any other of the above indices of contractor activity level. Nor were any of the above indices related to the SBEA program’s reported share of their total work or their estimates of how many more SBEA jobs they could do. The following sections show, however, that some of the indices appear to be related to some aspects of the contractors’ experiences in and efforts to sell projects.
5.1. Scheduling the Audit All but one of the interviewed contractors reported using cold calling to generate business, but some also mentioned program leads, referrals from other customers, and contacts with previous customers.
24 As explained in Section 1.1, “comprehensive” upgrades are those that include at least two equipment end-uses. Typically, this entails
lighting and at least one non-lighting end-use. Based on analysis of the project database, the evaluation team believes that some low-cost non-lighting measures, such as water-saving measures, do not appear to be sufficient to qualify for the comprehensive incentive when combined with another end-use.
25 The project counts are based on the most recent measure-level data available to the evaluation team at the time of the evaluation, representing one year of contractor activity. As explained in Section 4, this consisted of 2015 participation data for one of the utility companies and 2016 data from January through October for the other company. See footnote 20.

Small Business Energy Advantage (SBEA) Process Evaluation
Selling (and Upselling) the Upgrades | Page 35
Equal numbers of respondents reported making initial phone contacts to schedule a meeting or doing door-to-door cold contacts. The methods that contractors reported for generating business were unrelated to any of the indices of program activity identified above.
Nearly half of the contractors (7 of 16) reported that getting to the correct decision maker is the first hurdle in recruiting customers and completing projects. This could have significant consequences for the program. Those who reported such challenges also reported lower success in enrolling customers in SBEA (mean = 27%) than those who reported no such challenges (mean = 42%; Figure 5-1Error! Reference source not found.).26
Figure 5-1: Success Rate in Enrolling SBEA Participants – Contractors Who Did (n = 7) or Did Not (n = 9) Report Challenge Getting to Decision Maker
Reporting challenges in getting to the correct decision maker was unrelated to the number or percentage of non-lighting or comprehensive projects completed, however. Nor was it related to the number of employees the contractor has doing SBEA-related work or to the range of energy-related services the contractor provides in house (see Section 5.5).
The evaluation team examined whether it might be related to the type of businesses the contractors try to recruit to the SBEA program. Interviewed contractors reported types of customers that posed the most challenges. All contractors identified at least one type of customer, with ten of them identifying churches and other limited-use facilities. However, contractors who mentioned those customer types were less likely, not more likely, to report challenges getting to the decision maker than contractors who did not mention them. No more than three contractors identified any other customer type as particularly challenging. Thus, there is insufficient information to conclude that reporting challenges in identifying the correct decision is related to type of customer targeted.
26 Despite the small sample, the difference was statistically significant by the Mann-Whitney test (z of -2.49, p ≈ 0.015), with the finite
population correction (fpc = .58) factor applied because the sample comprised most of the population (all registered SBEA contractors who had done at least one SBEA project; N = 24). The fpc adjusts the test statistic to account for the increased precision of samples that represent a large proportion of the population in question. (Source: Elzinga, Caryl L., Salzer, Daniel W., and Willoughby, John W. Measuring & Monitoring Plant Populations. Bureau of Land Management. BLM Technical Reference 1730-1. Last accessed on April 12, 2017 from https://www.blm.gov/nstc/library/pdf/MeasAndMon.pdf.)
0% 100% 50%
Did not report challenge (mean = 42%) Reported challenge getting to decision maker (mean = 27%)
Success Rate (Of all customers the contractor attempted to enroll in SBEA, percent that did so)
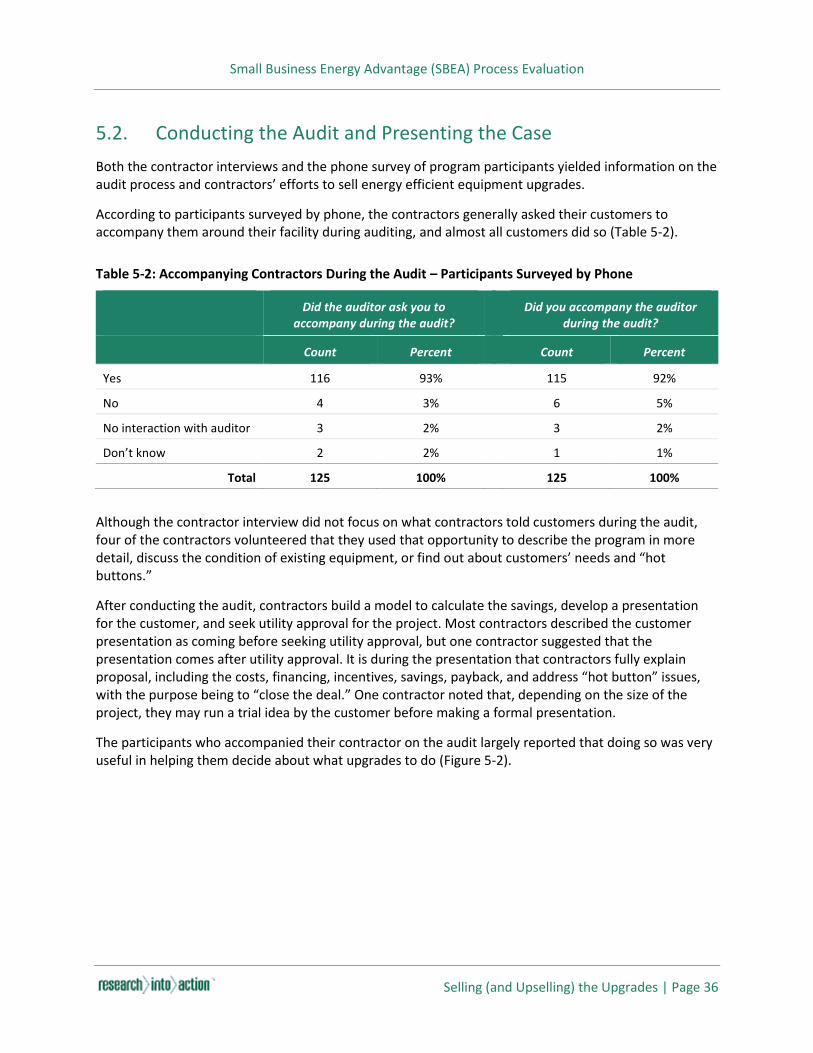
Small Business Energy Advantage (SBEA) Process Evaluation
Selling (and Upselling) the Upgrades | Page 36
5.2. Conducting the Audit and Presenting the Case Both the contractor interviews and the phone survey of program participants yielded information on the audit process and contractors’ efforts to sell energy efficient equipment upgrades.
According to participants surveyed by phone, the contractors generally asked their customers to accompany them around their facility during auditing, and almost all customers did so (Table 5-2).
Table 5-2: Accompanying Contractors During the Audit – Participants Surveyed by Phone
Did the auditor ask you to accompany during the audit?
Did you accompany the auditor during the audit?
Count Percent Count Percent
Yes 116 93% 115 92%
No 4 3% 6 5%
No interaction with auditor 3 2% 3 2%
Don’t know 2 2% 1 1%
Total 125 100% 125 100%
Although the contractor interview did not focus on what contractors told customers during the audit, four of the contractors volunteered that they used that opportunity to describe the program in more detail, discuss the condition of existing equipment, or find out about customers’ needs and “hot buttons.”
After conducting the audit, contractors build a model to calculate the savings, develop a presentation for the customer, and seek utility approval for the project. Most contractors described the customer presentation as coming before seeking utility approval, but one contractor suggested that the presentation comes after utility approval. It is during the presentation that contractors fully explain proposal, including the costs, financing, incentives, savings, payback, and address “hot button” issues, with the purpose being to “close the deal.” One contractor noted that, depending on the size of the project, they may run a trial idea by the customer before making a formal presentation.
The participants who accompanied their contractor on the audit largely reported that doing so was very useful in helping them decide about what upgrades to do (Figure 5-2).

Small Business Energy Advantage (SBEA) Process Evaluation
Selling (and Upselling) the Upgrades | Page 37
Figure 5-2: Usefulness of Accompanying Contractor on Audit
Given the value that the surveyed participants attributed to accompanying their contractor on the audit, the evaluation team examined whether failing to invite customers along on the audit might be related to indices of contractor activity. The four surveyed participants who reported the contractor did not invite them along on the audit were served by four different contractors: two were among the contractors with the fewest projects completed and two were among those with the most projects. As Table 5-3 shows, the two low-activity contractors, together, reportedly failed to invite three-quarters of their surveyed customers on the audit, while the comparable figure for the two high-activity contractors was about one-tenth of surveyed customers.
Table 5-3: Contractor Requests to Accompany Audit and Contractor Characteristics
# Surveyed Participants Contractor
Served
Participants Reported Contractor Did Not Invite Them on Audit Total #
2016 Projects
Estimated Percentage of 2016 Projects with
Non-lighting Measures* Count Percentage of Participants Served
Low-Activity Contractors Who Did Not Invite a Customer on the Audit (n = 2)
Mean 1.5 1 67% 19 65%
Range 1 - 2 1 50% - 100% 18 - 20 38% - 89%
High-Activity Contractors Who Did Not Invite a Customer on the Audit (n = 2)
Mean 10.5 1 9.5% 145 57%
Range 7 - 14 1 7% - 14% 124 - 166 38% - 82%
All Other Contractors (n = 18)
Mean 6 0 0% 75 50%
Range 1 - 14 0 0% 15 -251 12% - 77%
* The evaluation team had measure-level data only for the first 10 months of 2016 for one utility company, and so multiplied the counts of lighting and non-lighting projects by 6/5 to adjust for the partial 2016 data. The team had no access to 2016 measure-level data for the other utility and so used 2015 data as a proxy. For consistency, we used the proxy data in both the numerator and denominator. However, the team did have full 2016 project counts for both companies, and those are reported in this table.
10%
34%
57%
0%
25%
50%
75%
100%
5 to 7 8 to 9 10
Perc
ent o
f Res
pond
ents
Usefulness Rating: Scale of 0 (Not at All Useful) to 10 (Extremely Useful)

Small Business Energy Advantage (SBEA) Process Evaluation
Selling (and Upselling) the Upgrades | Page 38
This observation does not imply that inviting customers on the audit causes more completed projects. It may be, rather, that the most experienced contractors are more likely to invite their customers on the audit with them as they find it is a good way to explain the value of the recommended upgrades.
It was not possible to examine whether inviting customers on the audit was related to contractors’ self-reported success rate at converting leads to projects, as the four contractors who did not invite surveyed participants on the audit were not interviewed. However, the percentage of projects with non-lighting measures was available for all contractors, and inviting customers along on the audit does not appear to increase the percentage of non-lighting projects.
5.3. Efforts to Get Non-Lighting Upgrades The program administrators would like to achieve deeper savings from SBEA projects by increasing the number of non-lighting measures done. Therefore, the evaluators focused much of the contractor interviews on what contractors do to get customers to go beyond lighting measures in their SBEA projects.
All contractors reported that they always try to get a customer to make as many upgrades as possible – all but two either specifically reported what they do to get customers to go beyond lighting upgrades and/or made other comments relating to the importance of non-lighting projects.
The most commonly reported strategy to get customers to go beyond lighting upgrades, mentioned by nine contractors, was to focus on the long-term savings, including savings from improved operations and maintenance (O&M). Although this was the most commonly identified strategy, there is no evidence that it is particularly effective.
Eight contractors reported that they try to obtain deeper savings in projects by seeking some way to make the project more affordable for the customer. Of those, four reported that while they try to complete as many upgrades as possible at one time, when they are unable to do that, they will try to break a large project up into smaller pieces to make it easier for the customer to budget the project. Three of those four contractors specified that doing so usually involves doing lighting first and some other measure type later, with two noting that it may still be possible to get the comprehensive incentive in such cases if the additional measures are done within 30 days after the lighting. One indicated that there may be a longer interval between the phases, such as doing lighting in April and HVAC in October at a school. The contractors who mentioned breaking projects into phases indicated it may occur in 1% to 3% of projects.
Other ways in which contractors reported trying to make the project more affordable were by helping the customer identify external financing (three respondents) or, in one case each, incorporating HVAC controls equipment rather than doing a more complete HVAC upgrade and trying to get the landlord and tenant to split the costs. The respondent who identified this last strategy reported that it works about half the time.
Four contractors reported that they mention the comprehensive incentive as a strategy. It is interesting that, with one exception, each contractor said they talked about either long-term savings or the comprehensive bonus, but not both, and the comprehensive bonus was the less frequently mentioned sell point. It may be that some of the interviewed contractors assumed it was understood that they offered the bonus to their customers, but this is a point on which additional research may be warranted.

Small Business Energy Advantage (SBEA) Process Evaluation
Selling (and Upselling) the Upgrades | Page 39
Finally, one contractor each said they try to get deeper savings by enlisting the utility to talk to the customer and by focusing on the “green aspect of the project.”
The evaluators looked at whether mention of any of the above strategies was associated with greater or lower success, in terms of total number of projects, number of non-lighting or comprehensive projects, or percentage of projects that are non-lighting or comprehensive.27 The analyses indicate that some strategies may be more effective than others at producing deeper savings. On average, the eight contractors who reported efforts to make projects more affordable did more projects – non-lighting, comprehensive, and total – than those who did not make such efforts. However, closer analysis showed that these effects resulted entirely from two contractors. The one who reported efforts to get landlords and tenants to split the cost of projects did more non-lighting and comprehensive projects, and a higher percentage of comprehensive projects than did other contractors, on average (see additional discussion in Section 5.5).28 The contractor who incorporated HVAC controls instead of more complete HVAC upgrades did far more projects overall than the mean for other contractors; that contractor also did more non-lighting projects and comprehensive projects than the mean for others, but those differences were not statistically significant (see Table 5-4).
Only two other reported strategies were related to indices of contractor activity – in these cases, inversely related. The four contractors who reported they mention the comprehensive incentive as a sell point did fewer non-lighting projects than did others, as did the three who said they try to incorporate fast-payback measures to reduce overall payback time. There is no obvious reason why these two strategies would work against getting more non-lighting projects. The contractors who reported those strategies did not appear to differ from other contractors in any important way – for example, they had comparable numbers of employees working on SBEA projects.
Regarding the mention of comprehensive incentives, one possible interpretation is that the mention of the incentives to the customer does not actually have any adverse effect as, presumably, all contractors do so. Rather, the effect may come from the fact that the contractors who identified the comprehensive incentive as a strategy did not identify any other effective strategies.
The strategy of incorporating fast-payback measures into projects to reduce overall payback time may address the commonly cited barrier of long payback (see Section 8.2.1), but it does not necessarily address the barrier of overall project cost. Further, as with the “comprehensive incentives” strategy, contractors who identified this strategy did not identify any other effective strategies.
27 The project counts and percentages are estimates of one year of activity for each contractor based on the most recent data available to
the evaluation team at the time of the evaluation. See footnotes 20 in Section 4.
28 In cases where multiple contractors reported a specific strategy, the evaluators used the Mann-Whitney test of significance, incorporating the fpc factor because the sample constituted a larger percentage of the population. In the cases in which only one contractor reported a strategy, the evaluators assessed whether each index for that one contractor was at least 2.5 standard deviations different from the mean of the other contractors for those indices.

Small Business Energy Advantage (SBEA) Process Evaluation
Selling (and Upselling) the Upgrades | Page 40
Table 5-4: Relationship of Contractor Strategies for Deeper Savings and Indices of Contractor Activity (n = 16)*
Count of Contractors Total Number of Projects
Number of Non-lighting Projects
Number of Comprehensive
Projects
Percentage of Projects That Are Comprehensive
Strategies Did Report
Did not report
Did Report
Did not report
Did Report
Did not report
Did Report
Did not report
Did Report
Did not report
Focus on savings 9 7 69.1 43.3 34.1 23.7 10.3 5.7 9% 12%
Make project more affordable 8 12 75.5 40.1 40.1 19.0 13.1 3.5 13% 8%
Break project into parts 4 12 51.5 59.9 28.3 30.0 6.3 9.0 9% 11%
Financing outside of program 3 13 52.7 59.0 31.0 29.2 5.3 9.0 7% 11%
Get landlord & tenant to split 1 15 117.0 53.9 98.0 25.0 54.0 5.3 44% 8%
Use HVAC controls 1 15 212.0 47.5 73.0 26.7 18.0 7.7 7% 10%
Sell comprehensive incentive 4 12 33.5 65.9 15.8 34.2 4.5 9.6 14% 9%
Add fast-payback measure 3 13 45.7 60.6 21.0 31.5 1.3 9.9 2% 12%
Get utility to talk to customers 1 15 94.0 55.4 54.0 27.9 13.0 8.0 10% 10%
Focus on being “green” 1 15 89.0 55.7 56.0 27.8 8.0 8.3 6% 11%
* The project counts and percentages are an estimate of one year of activity for each contractor based on the most recent data available to the evaluation team at the time of the evaluation. See footnote 20 in Section 4. Shaded cells show statistically significant differences. In cases where multiple contractors reported a specific strategy, the evaluators used the Mann-Whitney test of significance, incorporating the fpc factor because the sample constituted a larger percentage of the population. In the two cases in which only one contractor reported a strategy, the evaluators assessed whether each index for that one contractor was at least 2.5 standard deviations different from the mean of the indices for the other contractors.

Small Business Energy Advantage (SBEA) Process Evaluation
Selling (and Upselling) the Upgrades | Page 41
5.4. Limits on Efforts to Sell Non-Lighting Upgrades Although all contractors reported that they always try to get a customer to make as many upgrades as possible, all but one also admitted there were times when they would not push for upgrades that include non-lighting measures. When asked what prevented them from doing so, seven mentioned cost issues, including the length of the payback or having cash-negative financing.
Six contractors cited the customer’s reaction to the proposal as the main reason for not pushing for more extensive upgrades. For example, one said that if they do not get a “good feeling” from the customer, they will not press the more extensive upgrade. Another mentioned paying attention to the customers’ “body language” and “behavior” in determining their willingness to spend money on many measures and subsequently whether to push for more extensive upgrades.
The customer reaction factor overlapped with the cost issue: three contractors identified both factors and explicitly linked them. For example, two contractors used the phrase “sticker shock.” However, the cost factor was not always an issue of the customer’s response, as one contractor referred to respecting customers’ “up-front budget limits.”
Two of the 16 interviewed contractors said the most common reason they did not press for more upgrades beyond lighting was that the customer in question had recently replaced or upgraded non-lighting equipment. Both contractors mentioned that issue specifically relating to HVAC, but both indicated that it encompassed other systems as well.
On average, contractors who reported that cost considerations prevented them from pushing for non-lighting upgrades did more SBEA projects overall (84.9 vs. 37.2) and did more non-lighting projects (44.7 vs. 17.8) than did other contractors,29 but they did not do a greater percentage of their projects as non-lighting. Thus, these contractors appear to get more non-lighting projects because they get more projects overall, not because their sensitivity to cost issues makes them more effective at selling non-lighting upgrades as part of a project. Moreover, these contractors did not have a higher overall success rate in converting leads to projects than did other contractors, but they pursued more leads, on average (352.8 vs. 169.9).30
The above findings may help explain a seeming inconsistency between what contractors said about their efforts to get customers to do non-lighting upgrades and what surveyed participants said about such efforts. A large majority (90%) of surveyed participants (n = 176) reported that their SBEA contractor had not recommended any equipment beyond what they upgraded through the program. About 73% of projects have only lighting equipment.31 If there were no other equipment recommendations in 90% of those projects, that would mean that there were no non-lighting equipment recommendations at all in about two-thirds of projects.
29 Both differences were statistically significant by Mann-Whitney, fpc-adjusted z ≥ -3.94, p ≤ .001 for both differences.
30 Statistically significant by Mann-Whitney, fpc-adjusted z = -2.84, p <.005.
31 Figure 4-1Error! Reference source not found., in Section 4.1, shows that 27% of projects have any non-lighting measures, and thus 73% are only lighting.

Small Business Energy Advantage (SBEA) Process Evaluation
Selling (and Upselling) the Upgrades | Page 42
There are two ways to view this seeming inconsistency with the contractors’ reports. It is possible that, up to a year after the project was completed, many SBEA participants simply do not recall what else their contractors recommended. Or perhaps this seeming inconsistency reflects a difference of perspective. Contractors may always, or nearly always, point out the non-lighting energy savings opportunities but, as seen above, many do not push their very hard to pursue those opportunities. The contractors may see the identification of such opportunities as an effort to get their customer to do as many upgrades as possible, but their efforts may not translate to actual “recommendations” to their customers.32
5.5. Contractor Characteristics and Success While all contractors have the same program responsibilities and serve as the lead contractor on their projects (see Section 1.1), some of the 16 interviewed contractors reported using subcontractors for certain types of measures, notably HVAC. The evaluation team examined whether the range of equipment-related services each contractor provides was related to their level of program activity, including the total number of non-lighting and comprehensive projects they completed, and those numbers as percentages of total project completions.
To accomplish this, the evaluators categorized the interviewed contractors as either “lighting,” “electrical” (including, but not limited to lighting measures), and “comprehensive” (electrical and gas measures) based on information in the contractors’ websites. The evaluators categorized 15 of the 16 interviewed contractors in this manner but could not find relevant online information for one contractor.
This analysis showed offering a broader range of energy-related services through in-house capabilities of was not related to the overall rate of success at converting leads to projects, but it was related to completing more projects, more non-lighting projects, and more comprehensive projects and to completing a higher percentage of total projects as non-lighting and comprehensive (Table 5-5).
Table 5-5: Contractor Success by Contractor Characteristic
Total # of
Projects
Overall Success
Rate
Number of Non-lighting Projects
Non-lighting
Projects % of Total
Number of Compre-hensive Projects
Compre-hensive
Projects % of Total
# SBEA Employees
Contractor Type by Index of Activity
Lighting (n = 3) 47.0 20% 10.3 30% 1.0 2% 8.3
Electrical (n = 5) 61.8 40% 19.0 48% 4.2 7% 9.4
Comprehensive (n = 7) 114.4 33% 48.4 56% 14.4 12% 14.9
L vs. E vs. C a < .05 Ns < .05 < .05 < .05 < .05 < .05
32 Unfortunately, it is not possible to compare responses from specific participants with the responses from the contractors who served
those participants, as half the interviewed contractors did not serve any of the surveyed participants, and those who did so, served more than one participant.
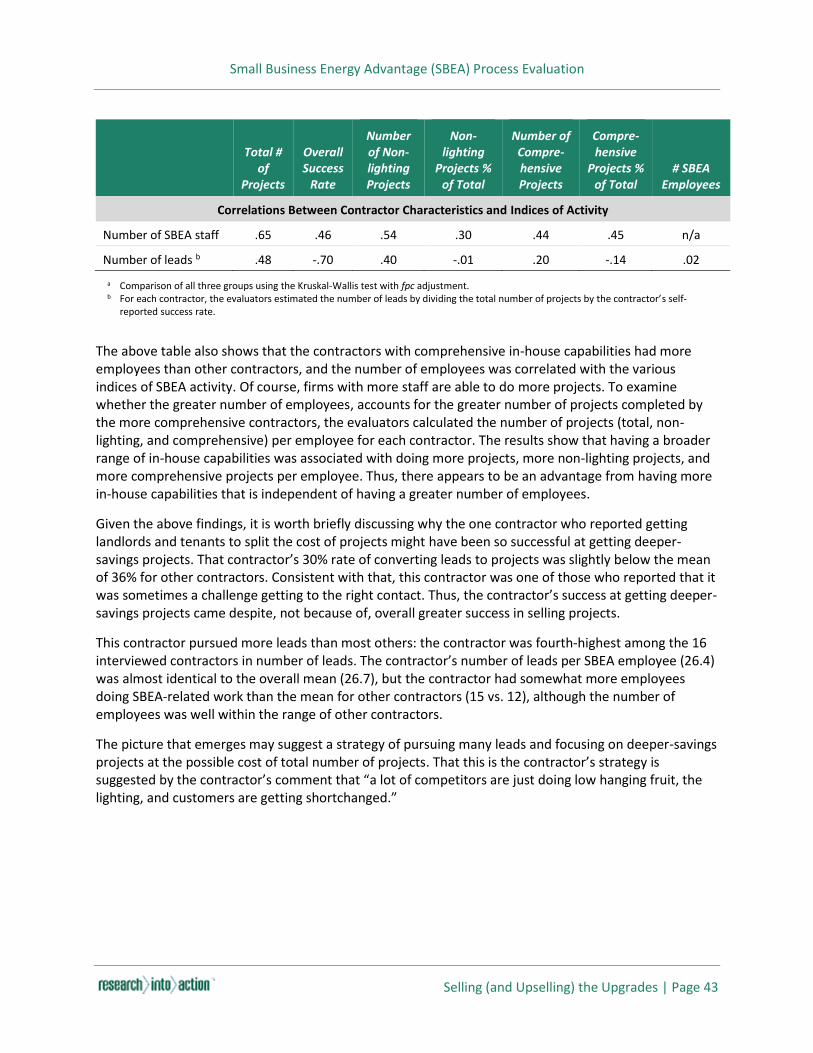
Small Business Energy Advantage (SBEA) Process Evaluation
Selling (and Upselling) the Upgrades | Page 43
Total # of
Projects
Overall Success
Rate
Number of Non-lighting Projects
Non-lighting
Projects % of Total
Number of Compre-hensive Projects
Compre-hensive
Projects % of Total
# SBEA Employees
Correlations Between Contractor Characteristics and Indices of Activity
Number of SBEA staff .65 .46 .54 .30 .44 .45 n/a
Number of leads b .48 -.70 .40 -.01 .20 -.14 .02
a Comparison of all three groups using the Kruskal-Wallis test with fpc adjustment. b For each contractor, the evaluators estimated the number of leads by dividing the total number of projects by the contractor’s self-
reported success rate.
The above table also shows that the contractors with comprehensive in-house capabilities had more employees than other contractors, and the number of employees was correlated with the various indices of SBEA activity. Of course, firms with more staff are able to do more projects. To examine whether the greater number of employees, accounts for the greater number of projects completed by the more comprehensive contractors, the evaluators calculated the number of projects (total, non-lighting, and comprehensive) per employee for each contractor. The results show that having a broader range of in-house capabilities was associated with doing more projects, more non-lighting projects, and more comprehensive projects per employee. Thus, there appears to be an advantage from having more in-house capabilities that is independent of having a greater number of employees.
Given the above findings, it is worth briefly discussing why the one contractor who reported getting landlords and tenants to split the cost of projects might have been so successful at getting deeper-savings projects. That contractor’s 30% rate of converting leads to projects was slightly below the mean of 36% for other contractors. Consistent with that, this contractor was one of those who reported that it was sometimes a challenge getting to the right contact. Thus, the contractor’s success at getting deeper-savings projects came despite, not because of, overall greater success in selling projects.
This contractor pursued more leads than most others: the contractor was fourth-highest among the 16 interviewed contractors in number of leads. The contractor’s number of leads per SBEA employee (26.4) was almost identical to the overall mean (26.7), but the contractor had somewhat more employees doing SBEA-related work than the mean for other contractors (15 vs. 12), although the number of employees was well within the range of other contractors.
The picture that emerges may suggest a strategy of pursuing many leads and focusing on deeper-savings projects at the possible cost of total number of projects. That this is the contractor’s strategy is suggested by the contractor’s comment that “a lot of competitors are just doing low hanging fruit, the lighting, and customers are getting shortchanged.”

Small Business Energy Advantage (SBEA) Process Evaluation
Financing the Upgrades | Page 44
6. Financing the Upgrades
More than 90% of the 176 surveyed participants received the program’s zero percent on-bill financing for their projects.33 The surveyed participants as well as the contractors provided feedback on the value of financing and the effects of the program’s financing cap and maximum financing term. The participants surveyed by phone also identified benefits of having the financing attached to their energy bills.
6.1. Zero-percent Financing The 16 interviewed contractors universally agreed that the zero-percent financing offer is a key piece of the program that should not change. As detailed below, the participant survey data also underscored the value of zero-percent financing, although the participant survey data suggests there may be circumstances for which a minimal interest rate may be worth considering.
Of the 125 participants surveyed by phone, 112 confirmed they had received the program’s zero-percent financing. Those 112 participants reported what they would have done if the program had offered two-percent financing instead of zero percent (Figure 6-1Error! Reference source not found.). About one-third said they would have done the same upgrades, while nearly as many said that a two-percent financing rate would have prevented them from doing any upgrades. A small percentage would have done something between those two extremes, such as doing the upgrades without financing or reducing the number of upgrades. Note that fully one-third were unsure of what they would have done.
Figure 6-1: What Participants Would Have Done at Two-Percent Financing (n = 112)
* “Other” included, in order of frequency: doing the same upgrades with no loan, financing fewer upgrades at 2%, seeking other
financing, or doing fewer upgrades with no loan.
33 Six of the 176 survey respondents did not know whether their organization had receiving financing. Of the remaining 170, 156 (92%)
reported they had received the financing. The percentage was slightly higher for the phone survey respondents (94%) than those surveyed on site (86%).
Finance the same upgrades at 2%, 34%
Do no upgrades, 28%
Don't know or no response, 34%
Other*, 4%
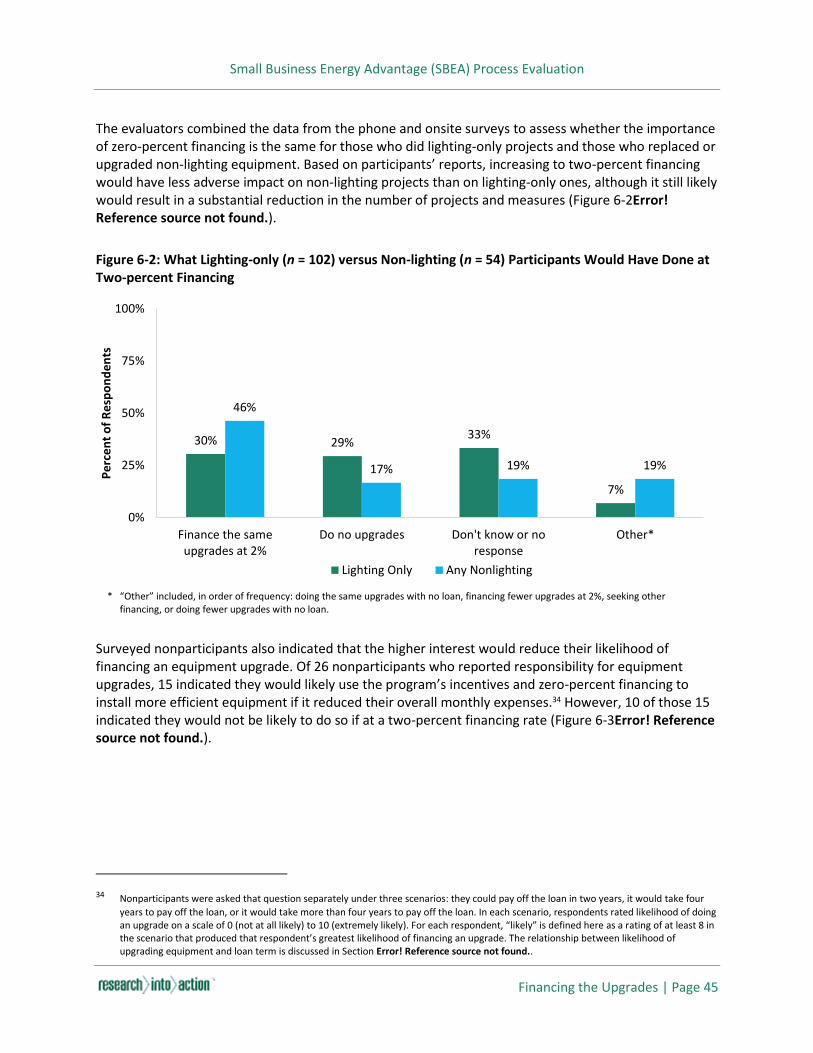
Small Business Energy Advantage (SBEA) Process Evaluation
Financing the Upgrades | Page 45
The evaluators combined the data from the phone and onsite surveys to assess whether the importance of zero-percent financing is the same for those who did lighting-only projects and those who replaced or upgraded non-lighting equipment. Based on participants’ reports, increasing to two-percent financing would have less adverse impact on non-lighting projects than on lighting-only ones, although it still likely would result in a substantial reduction in the number of projects and measures (Figure 6-2Error! Reference source not found.).
Figure 6-2: What Lighting-only (n = 102) versus Non-lighting (n = 54) Participants Would Have Done at Two-percent Financing
* “Other” included, in order of frequency: doing the same upgrades with no loan, financing fewer upgrades at 2%, seeking other
financing, or doing fewer upgrades with no loan.
Surveyed nonparticipants also indicated that the higher interest would reduce their likelihood of financing an equipment upgrade. Of 26 nonparticipants who reported responsibility for equipment upgrades, 15 indicated they would likely use the program’s incentives and zero-percent financing to install more efficient equipment if it reduced their overall monthly expenses.34 However, 10 of those 15 indicated they would not be likely to do so if at a two-percent financing rate (Figure 6-3Error! Reference source not found.).
34 Nonparticipants were asked that question separately under three scenarios: they could pay off the loan in two years, it would take four
years to pay off the loan, or it would take more than four years to pay off the loan. In each scenario, respondents rated likelihood of doing an upgrade on a scale of 0 (not at all likely) to 10 (extremely likely). For each respondent, “likely” is defined here as a rating of at least 8 in the scenario that produced that respondent’s greatest likelihood of financing an upgrade. The relationship between likelihood of upgrading equipment and loan term is discussed in Section Error! Reference source not found..
30% 29% 33%
7%
46%
17% 19% 19%
0%
25%
50%
75%
100%
Finance the sameupgrades at 2%
Do no upgrades Don't know or noresponse
Other*
Perc
ent o
f Res
pond
ents
Lighting Only Any Nonlighting

Small Business Energy Advantage (SBEA) Process Evaluation
Financing the Upgrades | Page 46
Figure 6-3: Nonparticipants’ Likelihood of Taking Zero- or Two-Percent Financing (n = 25)*
* “Might not upgrade at 0% financing” = rating of less than 8 on 0-to-10 scale on likelihood of doing upgrade at 0% financing, where 0 =
“not at all likely” and 10 = “extremely likely.” “Probably would upgrade at 0%” = rating of at least 8 on likelihood of upgrade at 0% financing. Might not/probably would upgrade at 2% similarly defined.
6.2. The Financing Term Six of the 16 interviewed contractors suggested increasing the maximum financing term, particularly for longer-payback projects such as those including HVAC and boilers, might make the program’s financing more attractive to small businesses or encourage them to take on more debt to do more extensive upgrades. The suggested maximum terms ranged from 60 months to eight years.
To get the participants’ perspective on the need to increase the financing term, the phone survey asked participants to rate the degree to which the 48-month financing term limited the upgrades they were willing to do. Of the 125 surveyed participants, 121 (97%) said the financing term did not limit their upgrades. Of those four participants who said it would limit their upgrades, and all indicated the limit was moderate or small (a rating of 5 or lower, on the 0-to-10 scale), three of the four were lighting-only participants, reflecting the greater proportion of lighting-only participants in the survey sample. These participant survey results to not appear to corroborate those contractors’ perceptions of the need for a longer financing term.
Responses from the 25 surveyed nonparticipants suggested a small impact of the loan term. Fewer of them said they would be likely to take the program’s zero-percent financing to upgrade equipment if it took more than four years to pay off the loan than if it took two or four years (Figure 6-4Error! Reference source not found.). However, the sample is small and the differences are not statistically significant. Moreover, most (15 of 25) of the surveyed nonparticipants reported the same likelihood of doing an upgrade with a 2-year or more-than-4-year loan term, and the rest were about equally divided between those for whom a longer loan term increased the likelihood of doing an upgrade and those for whom it decreased the likelihood. Specifically, five reported a decreased likelihood with the longer-term loan and four reported an increased likelihood the longer-term loan.
11 10
5
0
14
28
Might not upgrade at 0% financing Probably would upgrade at 0%
Num
ber o
f Sur
vey
Resp
onde
nts
Probably would upgrade at 2%
Might not upgrade at 2%

Small Business Energy Advantage (SBEA) Process Evaluation
Financing the Upgrades | Page 47
Figure 6-4: Loan Term and Nonparticipant Likelihood of Financing Equipment Upgrades (n = 25)
6.3. The Loan Cap Four of the 16 interviewed contractors suggested that the $100,000 financing cap may limit comprehensive projects with longer paybacks. To get the participants’ perspective on the need to raise the loan cap, the phone survey asked participants to rate the degree to which the loan cap limited the upgrades they were willing to do. As was the case regarding the finance term, 97% of respondents said the loan cap did not limit their upgrades.
Note, however, that three of the four surveyed participants who said the loan cap limited their upgrades had done non-lighting projects. Thus, while 1% of lighting-only participants said the loan cap limited their upgrades, 14% of those with non-lighting projects said so.35 Moreover, of the three non-lighting participants who said the loan cap limited their upgrades, two indicated it limited them to a large degree (ratings of 8 and 10, respectively, on a 0-to-10 scale). Both those participants had said they would have financed the same upgrades at 2% as they did with the program’s zero-percent financing. The other two participant who reported the loan cap limited them indicated it had done so to a small (rating of 2) or moderate (rating of 5) degree.
Further analysis revealed that three of the four participants for whom the loan cap was a limiting factor were above the sample median in annual energy consumption (64,454 kWh). In fact, those three participants had annual energy consumptions of more than 300,000 kWh – more than four times the median. By comparison, 14% of the participants for whom the loan cap was not a limiting factor had annual energy consumption of more than 300,000 kWh.
35 This difference is statistically significant by chi-square at p = .002.
6
5
4
4
5
4
11
12
14
4
3
3
0 1
More than 4 years
About 4 years
Less than 2 years
Likelihood of Using Incentives and Financing to Do Equipment Upgrade
Leng
th o
f Tim
e to
Pay
Off
Loan
Low (0-3 rating) Moderate (4-7 rating) High (8-10 rating) Don't know
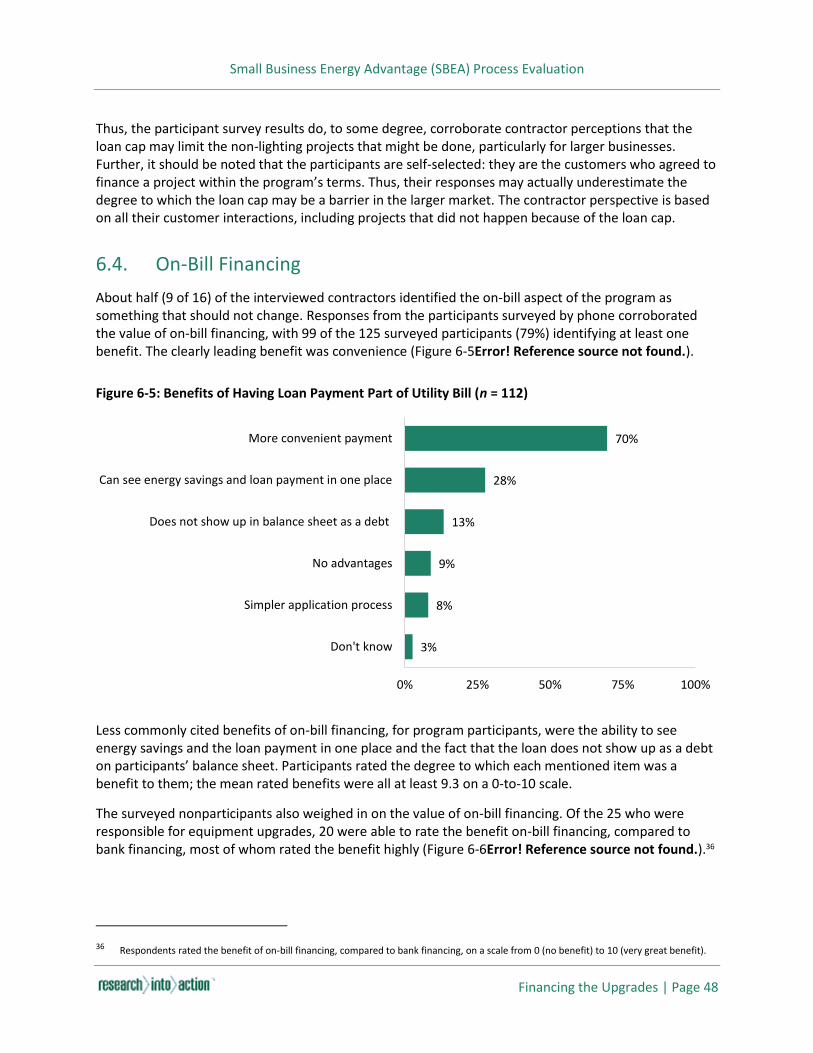
Small Business Energy Advantage (SBEA) Process Evaluation
Financing the Upgrades | Page 48
Thus, the participant survey results do, to some degree, corroborate contractor perceptions that the loan cap may limit the non-lighting projects that might be done, particularly for larger businesses. Further, it should be noted that the participants are self-selected: they are the customers who agreed to finance a project within the program’s terms. Thus, their responses may actually underestimate the degree to which the loan cap may be a barrier in the larger market. The contractor perspective is based on all their customer interactions, including projects that did not happen because of the loan cap.
6.4. On-Bill Financing About half (9 of 16) of the interviewed contractors identified the on-bill aspect of the program as something that should not change. Responses from the participants surveyed by phone corroborated the value of on-bill financing, with 99 of the 125 surveyed participants (79%) identifying at least one benefit. The clearly leading benefit was convenience (Figure 6-5Error! Reference source not found.).
Figure 6-5: Benefits of Having Loan Payment Part of Utility Bill (n = 112)
Less commonly cited benefits of on-bill financing, for program participants, were the ability to see energy savings and the loan payment in one place and the fact that the loan does not show up as a debt on participants’ balance sheet. Participants rated the degree to which each mentioned item was a benefit to them; the mean rated benefits were all at least 9.3 on a 0-to-10 scale.
The surveyed nonparticipants also weighed in on the value of on-bill financing. Of the 25 who were responsible for equipment upgrades, 20 were able to rate the benefit on-bill financing, compared to bank financing, most of whom rated the benefit highly (Figure 6-6Error! Reference source not found.).36
36 Respondents rated the benefit of on-bill financing, compared to bank financing, on a scale from 0 (no benefit) to 10 (very great benefit).
3%
8%
9%
13%
28%
70%
0% 25% 50% 75% 100%
Don't know
Simpler application process
No advantages
Does not show up in balance sheet as a debt
Can see energy savings and loan payment in one place
More convenient payment

Small Business Energy Advantage (SBEA) Process Evaluation
Financing the Upgrades | Page 49
Figure 6-6: Nonparticipants’ Ratings of On-Bill Financing Benefit Compared to Bank Financing (n = 25)
12
7
4
65
0
14
0 7 8 9 10 Don't know orno response
Num
ber o
f Sur
vey
Resp
onde
nts
Rated Benefit, from 0 (No Benefit) to 10 (Very Great Benefit)
Small Business Energy Advantage (SBEA) Process Evaluation
Program Satisfaction | Page 50
7. Program Satisfaction
Surveyed participants and interviewed contractors reported on their satisfaction with various program aspects.
7.1. Participant Satisfaction Participants in both the phone and onsite surveys reported satisfaction with the audit, the program processes, and equipment installation. The pattern of responses differed for the two surveys. In particular, participants in the onsite survey were more likely than those in the phone survey to answer “don’t know” or not provide a satisfaction rating (Figure 7-1; upper graphicError! Reference source not found.). This was particularly the case regarding the audit (“thoroughness in identifying opportunities”), the contractor’s explanation of financing, and the quality of the installation work.
When the evaluators excluded nonresponding respondents from the analysis, satisfaction levels for the two survey groups were much closer (Figure 7-1; lower graphic). Although the satisfaction levels were somewhat higher for the phone survey participants, the differences between the groups were not statistically significant. In general, the results indicate high satisfaction levels across all indices.
Respondents to the onsite survey did not explain why they were unable to provide a satisfaction rating. Further analysis showed that the participants with non-lighting projects were less likely than those with lighting-only projects to provide satisfaction ratings, although those with lighting-only projects were still somewhat less likely than phone survey respondents to give satisfaction ratings. This onsite survey was done as part of the on-site inspections for the impact evaluation. It is conceivable that, in some cases, the participant contacts who the impact evaluation team interacted with to get the appropriate information for the impact assessment – particularly for non-lighting projects – were not the ones who interacted with the contractor during the audit or the equipment installation.
Despite the generally high satisfaction, 22 of the 125 phone-surveyed participants identified sources of some dissatisfaction. (The onsite survey did not assess sources of dissatisfaction.) The most commonly identified sources of dissatisfaction were related to contractor behavior (10 participants), followed by equipment/installation-related issues (5), lack of energy savings (5), process-related issues (4), the incentive amount (1), and the loan term (1).
Ten respondents noted 17 issues with contractors. Seven participants identified issues related to contractors’ audits and recommendations: specifically, the contractor did not follow up on potential HVAC upgrades, failed to identify needed lighting upgrades, failed to install lights that were supposed to have been installed, identified fixtures for upgrades that already had LEDs, did not replace fixtures, failed to let the participant know that the participant would have to replace switches for light installations, and presented the proposed job “as is,” with no options. Five indicated their contractor took too long, was not prompt, or presented other timing or scheduling issues; two of those further indicated the contractor had not returned calls or was “hard to work with and tough to reach.” Two additional concerns, noted by one participant each, were a language barrier and the fact that a contractor would not honor a 3-year warranty.

Small Business Energy Advantage (SBEA) Process Evaluation
Program Satisfaction | Page 51
Figure 7-1: Participant Satisfaction – Phone Survey Compared to Onsite Survey*
“Don’t Know” and “No Response” Included
“Don’t Know” and “No Response” Excluded
* Satisfaction was rated on a 0-to-10 scale, from “not at all satisfied” to “extremely satisfied.” Percentages lower than 5% are not
labeled. Onsite survey participants were not asked about the loan application paperwork. Percentages lower than 5% are not labeled.
10%
6%
8%
10%
12%
5%
6%
10%
10%
12%
6%
7%
6%
5%
5%
5%
65%
61%
57%
73%
71%
83%
89%
90%
92%
93%
94%
20%
29%
25%
8%
6%
10%
0% 25% 50% 75% 100%
Contractor explanation of financing
Quality of installation work
Thoroughness in identifying opportunities
Steps required for participation
Quality of equipment
Loan application paperwork
Contractor explanation of financing
Quality of installation work
Thoroughness in identifying opportunities
Steps required for participation
Quality of equipment
Ons
ite (n
= 5
1)Ph
one
(n =
125
)
Low: 0 to 3 Moderate: 4 to 7 High: 8 to 10 Don't know or no response
8%
11%
12%
11%
13%
5%
6%
11%
7%
13%
13%
6%
7%
6%
5%
5%
5%
86%
79%
80%
76%
75%
93%
90%
90%
92%
94%
94%
0% 25% 50% 75% 100%
Contractor explanation of financing
Quality of installation work
Thoroughness in identifying opportunities
Steps required for participation
Quality of equipment
Loan application paperwork
Contractor explanation of financing
Quality of installation work
Thoroughness in identifying opportunities
Steps required for participation
Quality of equipment
Ons
ite (n
= 3
6 to
48)
Phon
e (n
= 1
23 to
125
)
Low: 0 to 3 Moderate: 4 to 7 High: 8 to 10

Small Business Energy Advantage (SBEA) Process Evaluation
Program Satisfaction | Page 52
Five participants identified dissatisfaction relating to the equipment or its installation. One complained of mismatched light colors at one facility. One said that the installed motion sensors were bad. One reported that in a suspended ceiling project, the initial installer was unable to install the lighting correctly (but that the contractor then sent someone who could do the installation). Two simply reported unspecified “workmanship issues” or said the installer was “not qualified.”
Five participants said they had not yet seen the promised energy savings. Two specifically reported that either their energy usage or energy bills had increased. In one case, it was not clear whether the respondent really meant that the energy bill per se had increased or that the energy bill combined with the finance charge was higher than the bill previously had been.
Of the four participants who voiced dissatisfaction with program processes, two said the paperwork was redundant, one commented that program staff had to return three times to do the inspection, and one remarked on the time-frame required for the first phase of their project. The latter two respondents did not offer additional details.
Finally, one participant indicated that both greater incentive amounts and a longer loan term would be valuable for machine shops.
7.2. Benefits of Equipment Upgrades The phone-surveyed participants identified the benefits of the equipment replacements or upgrades. Improved lighting quality in the work space was by far the most commonly mentioned benefit, followed by cost or energy savings and improved reliability or decreased maintenance (Figure 7-2Error! Reference source not found.).
Figure 7-2: Benefits of the New or Upgraded Equipment – Phone Survey (n = 125)
* Other benefits were environmental benefits (5 mentions), improved comfort (4), reduced noise level (1), and increased floor space (1).
It is not surprising that improved lighting was most frequently mentioned, as all projects had lighting upgrades. Many fewer projects included non-lighting upgrades, for which other factors may have
1%
6%
8%
36%
46%
86%
0% 25% 50% 75% 100%
Don't know
None
Other*
Reliability / decreased maintenance
Reduced energy cost / saving money
Better lighting

Small Business Energy Advantage (SBEA) Process Evaluation
Program Satisfaction | Page 53
relatively greater weight. In fact, Figure 7-3Error! Reference source not found. shows that the phone-surveyed participants with non-lighting upgrades were more likely than the lighting-only participants to cite energy or cost savings or improved reliability or decreased maintenance as benefits.
Figure 7-3: Benefits of the New or Upgraded Equipment – Lighting Only Participants (n = 104) Compared to Non-Lighting Participants (n = 21)
7.3. Contractors’ Satisfaction Contractors were largely satisfied with the program. Of the 16 interviewed contractors 12 rated their overall program satisfaction as high and the other four indicated moderate satisfaction.37 Twelve contractors indicated that the program was well run and well recognized in the market. Items contractors particularly liked about the program included the incentive amounts (4), financing (4), marketing support (1), and the flexibility the program provides that allows them to customize approaches for customers ensuring high customer satisfaction (1).
Contractors also reported ways the program’s processes could be improved. Seven noted that it often takes a long time to get a project through the process, one of whom noted that a similar program in a neighboring state does not have the same concerns. Five of those seven contractors offered possible solutions: three suggested hiring additional staff to hasten the approval and inspection reviews, and one each suggested limiting the number of signatures required of the customer throughout the process and providing staged payments of incentives for larger projects that take longer periods of time. Providing the staged payments would limit the financial burden on the contractor to carry project costs.
Five contractors suggested improvements to the worksheets where savings and incentives are calculated. Three of the suggestions were primarily compatibility issues: two contractors suggested
37 Highly satisfied was defined as those who rated their satisfaction from 8 to 10 on a scale of zero to ten and moderately satisfied was
defined as 6 to 7.
42%33%
3%
67%
52%
33%
0%
25%
50%
75%
100%
Reduced energy cost /saving money
Reliability / decreasedmaintenance
Other
Perc
ent o
f Res
pond
ents
Lighting Only Non-lighting

Small Business Energy Advantage (SBEA) Process Evaluation
Program Satisfaction | Page 54
upgrading the Conservation and Load Management Tracking and Reporting System (CLMTRS) to work with newer web browsers and one suggested making it possible to import data from Excel or Word into the program database. One contractor noted that the headings in one of the utility’s savings calculators do not match the CLMTRS system headings, requiring the contractor to contact the utility “to figure out which column [in one tool] matches which column in the other software.” That contractor suggested making the column headings match.
Two contractors suggested revisions to the processes for calculating savings. One would like to be able to make changes to the application worksheet “on the fly” during customer presentations to allow them to show customers the effect of including or excluding various measures. The other suggested that the program should make it possible for contractors to model savings for comprehensive projects on equipment in place, rather than on standard efficiency equipment. We provide this comment not as a suggestion to change the program rules, but as an indication that some contractors may not fully understand that some measures are cost-effective only as normal or replace-on-burnout incremental cost and savings treatments.
Other suggestions, made by one contractor each, were to budget more money for natural gas projects,38 limit the number of contractors who may do SBEA work, provide better vetted leads to contractors, and conduct more program marketing. The contractor who wants to limit the number of program contractors argued that most projects are done by a handful of contractors and the program is “wasting resources” on those who are not generating large numbers of projects. The contractor who desired better vetting suggested that some leads are not good because they do not qualify for financing, while others may have contacted the utility because their energy bill was too high but are not “really serious” about an energy audit and upgrades.
38 The program online dashboard shows that one gas company expended 138% of its gas budget for SBEA and another expended 98%.

Small Business Energy Advantage (SBEA) Process Evaluation
Potential for Future Program Participation | Page 55
8. Potential for Future Program Participation The evaluation obtained information from multiple sources – contractors, program participants, and nonparticipating utility customers – that provides insights into the potential for continued program success and expansion. Surveyed nonparticipants reported on existing equipment and upgrade plans as well as their awareness of the potential for energy savings from equipment upgrades and of the SBEA program. The interviewed contractors described challenges they encountered when marketing the SBEA program to their customers and how they addressed those challenges. They further offered several suggestions for increasing program participation based on their experience with the program’s target segment. Finally, the onsite participant survey offers evidence that carrying out recent upgrades of specific equipment types does not preclude further upgrades through the SBEA program.
8.1. Existing Upgrade Opportunities The survey asked respondents to report whether they had lighting equipment that was at least three years old and non-lighting equipment that was at least five years old. Note that the selection of the 3-year and 5-year time frames does not imply the belief that such equipment is near burnout, but to provide the most liberal estimate of equipment that may not be as efficient as equipment that is now available. In particular, the 3-year criterion for lighting reflects the considerable changes in lighting and lighting control technologies that have occurred in the past few years.
All 24 nonparticipants who were knowledgeable about their existing building equipment reported having either lighting equipment that was at least three years old (n = 21) or having non-lighting equipment that was at least five years old (n = 21; Table 8-1Error! Reference source not found.). Even taking into consideration the modest precision of the nonparticipant survey (because of the small sample), these results suggest that a large majority of eligible customers have equipment that offers opportunities for energy savings through program participation.
Table 8-1: Nonparticipants’ Report of Older Equipment (n = 24)
Equipment Type Count Percent
Lighting at Least Three Years Old
Any lighting 21 88%
Ceiling tube fluorescent lighting 15 63%
Other ceiling lighting 7 29%
Outdoor lighting 2 8%
Refrigeration case lighting 1 4%
Non-lighting at Least Five Years Old
Any non-lighting 21 88%
Heating 21 88%
Air-conditioning 12 50%
Refrigeration 1 4%

Small Business Energy Advantage (SBEA) Process Evaluation
Potential for Future Program Participation | Page 56
One-third of the surveyed nonparticipants (9 of 27) reported plans to make upgrades to their energy using equipment, mostly lighting, in the next two years (Table 8-2Error! Reference source not found.). All said they would seek out high-efficiency equipment for at least some of their upgrades and most would use program incentives. When asked how they would pay their share of the upgrades, all either said they would pay with company cash reserves or did not specify – none said they would use a credit card or other type of financing even though five said they were aware of the zero-percent financing available from their utility.
Table 8-2: Plans for Replacing Equipment (n = 9)
Respondent ID
Organization Type
Make Upgrades in 2 Years
Upgrade With EE Use Program
Incentives
Pay Own Share with
Cash Lighting Non-
lighting Lighting Non-
lighting
NP18 Government 9 9 9 9
NP6103 Auto 9 9 9
NP179 School (K-12) 9 9
NP20208 Restaurant 9 9 9 9 9
NP141 Office 9 9 9 9
NP126 School (K-12) 9 9 9 9 9
NP138 Office 9 9 9 9 9
NP119 Medical 9 9* 9
NP5943 Multifamily 9 9 9 9 9
* Respondent did not explicitly indicate plan to upgrade to energy efficient lighting, but did state plan to use program incentives, which requires upgrading to energy efficient equipment.
8.2. Possible Barriers to Participation The evaluation provided information relevant to several potential barriers to program participation. The following subsections present a detailed review of potential barriers and information relating to overcoming them.
8.2.1. Upgrade Cost, Payback, and Ownership Issues
All 16 interviewed contractors identified some type of concern about achieving savings as a challenge to selling the program to customers – all but one specifically mentioned the equipment payback period. Frequently, contractors mentioned payback as an issue relative to the length of the business owner’s lease for the work space. A corollary issue, cited by four respondents, was lack of trust in the program or in the reported payback figures. Twelve of the 16 contractors identified the payback issue (nine respondents) and/or upfront costs (six respondents) as specific challenges in getting customers to go beyond lighting measures.
Small Business Energy Advantage (SBEA) Process Evaluation
Potential for Future Program Participation | Page 57
Information from the nonparticipant survey underscores these challenges. After hearing a description of the program and how it could reduce their overall monthly costs, participants reported how likely they would be to use the program’s incentives and financing (see Section Error! Reference source not found.). Even after hearing the description, 13 of the 27 survey respondents reported that concerns relating to project cost and/or debt might prevent them from using the program’s incentives and financing to upgrade equipment. Five others did not specifically mention cost or debt concerns but said they would need more information about the specifics of the program.
The issue of payback is connected with that of building ownership. Eleven of the 15 contractors who identified payback as a concern did so in the context of tenancy or lease length. This is seen in the fact that building owners appear to be over-represented in the program population, as owners are able to take a longer-term view than are tenants who must think within the term of their lease.39
8.2.2. Limited Knowledge of Energy Costs and Potential Savings
Lack of knowledge of energy costs and of the potential for reducing those costs could exacerbate the above-identified challenge and prevent customers from carrying out energy efficiency upgrades, even if they know about the program. Of the 19 surveyed nonparticipants who reported paying their energy bills directly to the utility, about two-thirds (13) reported they knew “more or less” what they pay each month for electricity, and the other six did not know.
When it came to how much they could save through energy efficient upgrades, fewer respondents could venture a guess. Six of the 19 survey respondents estimated how much they could save on lighting, with estimates ranging from 8% to 35% “if I did parking lot lights” (mean = 17.2%). Four of the 19 estimated how much they could save on heating and cooling costs, ranging from 0% to 40% (mean = 20.6%).
Could such limited energy knowledge reduce the likelihood that someone will replace older equipment? Some information, admittedly based on a small sample, suggests that it might. As Figure 8-1Error! Reference source not found. shows, most of those with older equipment, both lighting and non-lighting, reported no plan to replace that equipment in the next two years. Nonparticipants with older equipment who knew their energy costs were more likely to report plans to replace older lighting equipment (6 of 13) than were those who did not know their energy costs (0 of 3).40 Because of the very small sample size, this finding should be replicated in a larger sample before it is accepted as more than preliminary and suggestive.
39 About three-quarters of the surveyed participants owned their building, but a study by the National Federation of Independent Business
(NFIB) found that building owners may make up just over half (57%) of all small businesses. NFIB Small Business Facts, Volume 6, Issue 3, 2006. ISSN 1534-8326. Available at: http://www.411sbfacts.com/sbpoll-about.php?POLLID=0047. Last accessed March 7, 2017.
40 Chi-square = 9.64, p = .002.

Small Business Energy Advantage (SBEA) Process Evaluation
Potential for Future Program Participation | Page 58
Figure 8-1: Surveyed Nonparticipants’ Plans to Upgrade Existing Equipment (n = 21)
8.2.3. Customer “Inertia”
Six of the 16 contractors indicated that simply getting their customers to move forward with a project sometimes was a challenge. This was not an issue of whether customers accepted the value of the upgrade in principle, but rather of customer priorities. In some cases, contractors identified specific roadblocks, such as having done equipment upgrades in the past four or five years or having other upgrades pending. In other cases, the contractor expressed the issue in terms of “inertia” or the fact that upgrades are not “mission critical.” One of these respondents said this issue of getting customers to move forward on projects was the most critical challenge to overcome. 41
Interestingly, those contractors who reported customer inertia concerns, on average, completed more projects overall (77.7 vs. 46.3) and more non-lighting projects (35.2 vs. 26.2) than did contractors who did not identify this concern. Possibly, those contractors that work harder at completing projects are more likely to identify customer inertia as a challenge.
8.2.4. Challenges Specific to Certain Customer Types
All but one interviewed contractor identified customer types for which there are specific challenges in getting the customers to qualify for or to participate in the program.
The most commonly identified customer type by far was faith-based organizations and others with limited hours of operation. Ten contractors reported that those types are a challenge because the limited operational hours create longer payback times. Those ten contractors reported a variety of strategies for addressing this customer-specific challenge. Five focused on how to get customers to think long-term, either by explaining how the low hours of use relate to the long payback. The others looked for ways to reduce the payback time, such as suggesting non-lighting retrofits that do not have the same
41 The first difference just missed statistical significance by Mann-Whitney test, fpc-adjusted z = -1.879, p = .06. The second difference was
statistically significant by Mann-Whitney test, fpc-adjusted z = -2.259, p <.03.
74
1417
0
14
28
Has lighting at least 3 years old Has non-lighting at least 5 years old
Num
ber o
f Sur
vey
Resp
onde
nts
No plan to replacePlan to replace
Small Business Energy Advantage (SBEA) Process Evaluation
Potential for Future Program Participation | Page 59
hours of use issues, finding ways to reduce the cost of lighting retrofits, such as discounting their own price, or attaching a church retrofit to one at an associated school to provide an acceptable overall payback time.
Four contractors noted that chain or franchise establishments, like retail chains and hotels, can be difficult because of the multiple decision makers associated with those business type. Three of those were among the seven contractors who had said identifying the decision maker often was a challenge. In those cases, the main issue was reaching the decision maker, sometimes with utility assistance.
Three contractors reported challenges getting restaurants to participate because they are often cash-strapped and struggle to qualify for financing. These contractors did not identify a consistent approach: one said they encourage restaurant owners contact the utility to get an explanation of the financing; one said they attempt to decrease the lighting cost through re-lamping or replacing ballasts rather than fixtures; and one said their approach was to develop a relationship with the owner.
Finally, two contractors identified customer-specific challenges that had to do with ease of implementation rather than resistance to participation. Specifically, facilities with difficult areas to access, such as dry cleaners with small spaces, and facilities like churches with very high ceilings can be difficult to serve because of the higher labor costs required. Those contractors did not identify any specific strategies for addressing those challenges.
Neither the customer-specific challenges that contractors reported nor the strategies they employed were related to their reported success rates.
8.2.5. Lack of Program Awareness
One notable barrier to overcome is the lack of awareness of program benefits. Of the 25 surveyed nonparticipants who reported responsibility for any equipment maintenance, 15 (60%) were not aware of the available cash incentives from the SBEA program, and 16 (64%) were not aware of the available zero-percent financing. While additional research with more respondent data points would be valuable to verify this estimate, this suggests that a large portion of the Connecticut small business market is not aware of cash incentives or financing available from utilities for making energy efficient upgrades.
8.2.6. Recent Equipment Replacement
Two interviewed contractors said they do not push to upgrade equipment that had been replaced or upgraded in the previous few years. Some additional information on this point comes from the 51 participants surveyed onsite, who reported on any other equipment they had replaced other equipment in the past two years.42 Of those, 24 (47%) reported some equipment – most commonly lighting and heating (Figure 8-2Error! Reference source not found.). Most of the equipment replacements were done with Energize Connecticut incentives, although most of the refrigeration and domestic hot water replacements and all of the process upgrades were done without incentives.
42 To avoid respondent burden in the phone participant survey, which focused on several other topics, the evaluation team did not ask
about prior equipment replacements in the phone survey.

Small Business Energy Advantage (SBEA) Process Evaluation
Potential for Future Program Participation | Page 60
Figure 8-2: Other Equipment Replaced in Past Two Years – Onsite Survey (n = 51)
Of the 24 respondents who reported replacing other equipment outside the SBEA program in the past two years, 19 (79%) reported the same type of equipment as they replaced through the SBEA program. That was most common for those who replaced lighting, but even those who replaced other equipment outside the program replaced or upgraded similar equipment through SBEA (Table 8-3Error! Reference source not found.). This seems to suggest that having recently replaced or upgraded a certain type of equipment is not necessarily a barrier to replacing or upgrading that type of equipment again through SBEA.
Table 8-3: Comparison of Equipment Replaced Through and Outside of SBEA (n = 24)
Replaced Equipment Outside SBEA in Past Two Years
Reported Same Type of Equipment as Replaced Through SBEA
Count Count Percent
Any 24 19 79%
Lighting 19 16 84%
Heating/HVAC 11 8 73%
Other* 11 8 73%
* Cooling, motors, refrigeration, domestic hot water.
It is important to keep in mind that these findings are from SBEA participants, who represent a self-selected subset of the market: they had decided for various reasons to agree to replace or upgrade the
4%
2%
2%
8%
18%
20%
25%
2%
4%
6%
4%
2%
2%
8%
0% 25% 50% 75% 100%
Other
Process
HVAC
Motors
Domestic Hot Water
Refrigeration
Cooling
Heating
High Performance Lighting
Standard Lighting
Replaced With Incentive Replaced Without Incentive

Small Business Energy Advantage (SBEA) Process Evaluation
Potential for Future Program Participation | Page 61
equipment through the program. Additional resource would be needed to conclude that high percentages of businesses and other organizations that recently have upgraded equipment would agree to upgrade the same type of equipment again through the program.
8.3. Sources of Influence in Upgrade Decisions To identify potential channels for program outreach, the participant phone survey solicited information on who, other than the program contractor, the participants consulted in deciding what upgrades to make through the program. In addition, both the participant phone survey and the nonparticipant survey asked whether there were any professional, community, or cultural associations whose opinions respondents would trust in making such decisions.
Of the 125 surveyed participants, 72 (58%) identified some source other than the program contractor. Mostly commonly, they identified a source within their organization – typically the owner, an officer, or a board of directors (Figure 8-3Error! Reference source not found.). Fewer participants reported they talked to other business owners they knew, including referrals provided by the program (8), a contractor they previously had worked with (4), or other trusted groups, such as professional associations (2), the local Chamber of Commerce (1), and a local conservation-oriented nonprofit organization (1).
Figure 8-3: Sources Participants Consulted in Making Upgrade Decisions through the Program
* Includes company owner, including the respondent’s partner if the respondent is an owner (30), officers or board members, (19), or
other internal sources, such as coworkers (9). ** Includes professional associations (2), the local Chamber of Commerce (1), the Northwest Conservation District (1), and one other
source the respondent could not remember (1).
Responses from the nonparticipant survey were consistent with those from the participant survey. Of six respondents who identified a group or association involved when making decisions about building upgrades, three identified an internal organizational source (school board or board of directors), two cited their Chamber of Commerce, and one cited neighboring businesses.
7%
7%
14%
83%
4%
4%
8%
46%
0% 25% 50% 75% 100%
Other**
Contractor
Other business owner
Internal organizational source*
Percent of Respondents
All Surveyed Participants (n = 125) Those Reporting Source (n = 69)

Small Business Energy Advantage (SBEA) Process Evaluation
Potential for Future Program Participation | Page 62
8.4. Capacity to Expand Program Participation Twelve of the 16 interviewed contractors estimated how much they could increase their production of SBEA projects. The estimates ranged from a low of a 10% to 15% increase to a more than doubling of current production. The amount varied by contractor, with the currently less-active ones on average reporting greater capacity to increase their project load, compared to the more active ones. Across all interviewed contractors, when current activity level is taken into consideration, the current contractors could increase activity by more than 50%.
The interviewed contractors offered comments on what might help sell more projects. All 16 contractors suggested some change to program rules that might improve participation. In addition, 13 contractors identified some type of utility support for their sales efforts, including increased marketing and/or lead generation, utility involvement in closing sales, and contractor training support.
8.4.1. Suggested Program Changes
Of the suggested program changes, the most common were suggestions relating to the program incentive levels and processing of projects. Nine contractors suggested raising incentive levels, of whom five suggested raising incentive levels in general and four identified certain types of projects or customers for which the program should consider raising incentives: expensive or cash flow -negative projects (2), long-standing businesses (1), customers that pay their bills on time (1), and those with expiring or short-term leases (1). One additional contractor referred to running “special” incentives for a longer period of time.
As noted elsewhere (Section 7.3), multiple contractors talked about slow or complicated project processing, referring to the process as “cumbersome” and having “a lot” of paperwork to sign. Four specifically cited the slow process in relation to large or comprehensive projects, and three said the program administrator needs to hire additional engineering and inspection staff. Three contractors explicitly said that the slow program processes were an impediment to their ability to do more projects. Note that citing the slow process was unrelated to the number or type of projects that contractors completed.
Six contractors suggested changing program rules or processes to make more customers eligible for financing. While some were not specific about how the criteria should be changed, three suggested a more liberal evaluation of past bill payments when determining creditworthiness, one suggesting that a couple of late bill payments can disqualify a customer for financing.43 One respondent suggested using the length of time in business as a criterion for evaluating creditworthiness – but by the same token, another noted that new businesses can be particularly hard to qualify for financing and suggested the program provide a specific evaluation criteria for new businesses.
As noted in Section 6.3, four contractors suggested that the program should raise the loan cap, with the suggested caps ranging from $150,000 to $250,000. In addition, two contractors offered suggestions relating to the payment schedule. One suggested the grace period should be 45 to 60 days rather than
43 The evaluators note that a contact for one of the utility companies acknowledged this concern and reported that the utility had changed
its criterion for considering a payment as late, for the purpose of determining program eligibility, from 30 days to 39 days post-due.

Small Business Energy Advantage (SBEA) Process Evaluation
Potential for Future Program Participation | Page 63
the current 30 days. The other suggested that participants should have a one-month grace period after project approval before payments begin.
Two contractors suggested raising the usage eligibility cap from 200 kW to 300 kW.
To address the limit imposed by the $100,000 loan cap, one contractor reported offering third-party financing and C-PACE (commercial property assessed clean energy financing). That contractor reported that C-PACE is not very popular and is hard to explain to customers.
8.4.2. Other Suggested Forms of Program Support
Eight contractors commented on the value of utility involvement with prospective program participants. Four of those said they had gotten one of the utilities involved as a strategy for convincing a customer to do upgrades and five suggested that utility involvement during or after project presentations would help increase participation (one contractor made both comments).
Seven contractors said that more extensive program marketing and/or provision of more leads would help them sell more projects.
Finally, four contractors suggested that some sort of training support would be valuable. Three of those said the program administrator should provide or subsidize some program-related sales training, of whom one said the training should relate specifically to gas measures and one suggested the training should extend to auditors. In addition, one contractor suggested that the program administrator provide classes to HVAC and mechanical subcontractors who support the program contractors to make them familiar with program rules, paperwork, and forms.
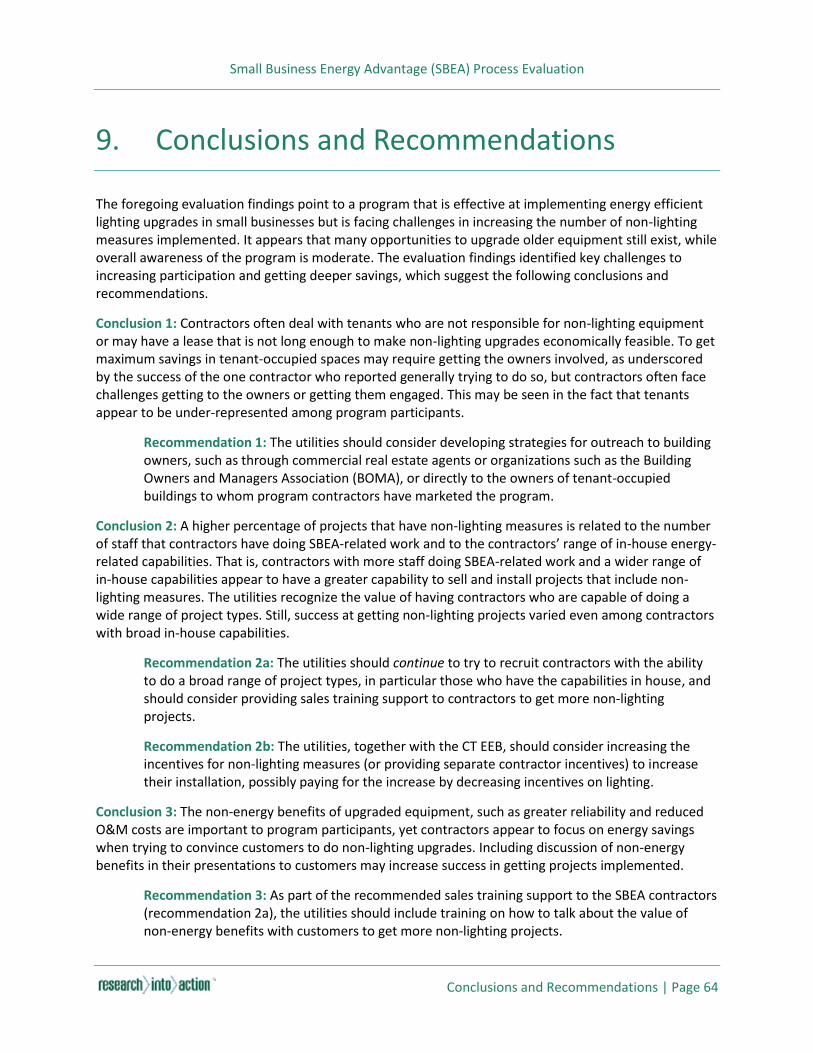
Small Business Energy Advantage (SBEA) Process Evaluation
Conclusions and Recommendations | Page 64
9. Conclusions and Recommendations
The foregoing evaluation findings point to a program that is effective at implementing energy efficient lighting upgrades in small businesses but is facing challenges in increasing the number of non-lighting measures implemented. It appears that many opportunities to upgrade older equipment still exist, while overall awareness of the program is moderate. The evaluation findings identified key challenges to increasing participation and getting deeper savings, which suggest the following conclusions and recommendations.
Conclusion 1: Contractors often deal with tenants who are not responsible for non-lighting equipment or may have a lease that is not long enough to make non-lighting upgrades economically feasible. To get maximum savings in tenant-occupied spaces may require getting the owners involved, as underscored by the success of the one contractor who reported generally trying to do so, but contractors often face challenges getting to the owners or getting them engaged. This may be seen in the fact that tenants appear to be under-represented among program participants.
Recommendation 1: The utilities should consider developing strategies for outreach to building owners, such as through commercial real estate agents or organizations such as the Building Owners and Managers Association (BOMA), or directly to the owners of tenant-occupied buildings to whom program contractors have marketed the program.
Conclusion 2: A higher percentage of projects that have non-lighting measures is related to the number of staff that contractors have doing SBEA-related work and to the contractors’ range of in-house energy-related capabilities. That is, contractors with more staff doing SBEA-related work and a wider range of in-house capabilities appear to have a greater capability to sell and install projects that include non-lighting measures. The utilities recognize the value of having contractors who are capable of doing a wide range of project types. Still, success at getting non-lighting projects varied even among contractors with broad in-house capabilities.
Recommendation 2a: The utilities should continue to try to recruit contractors with the ability to do a broad range of project types, in particular those who have the capabilities in house, and should consider providing sales training support to contractors to get more non-lighting projects.
Recommendation 2b: The utilities, together with the CT EEB, should consider increasing the incentives for non-lighting measures (or providing separate contractor incentives) to increase their installation, possibly paying for the increase by decreasing incentives on lighting.
Conclusion 3: The non-energy benefits of upgraded equipment, such as greater reliability and reduced O&M costs are important to program participants, yet contractors appear to focus on energy savings when trying to convince customers to do non-lighting upgrades. Including discussion of non-energy benefits in their presentations to customers may increase success in getting projects implemented.
Recommendation 3: As part of the recommended sales training support to the SBEA contractors (recommendation 2a), the utilities should include training on how to talk about the value of non-energy benefits with customers to get more non-lighting projects.
Small Business Energy Advantage (SBEA) Process Evaluation
Conclusions and Recommendations | Page 65
Conclusion 4: Some customers, particularly building owners, may do more extensive upgrades if they can extend the loan length or increase the loan amount, but doing so ties up the utilities’ loan funds longer or ties up a larger loan amount at no interest. Most contractors do not appear to promote financing outside the SBEA program.
Recommendation 4: The utilities might consider offering alternative loan terms for building owners or tenants with long-term leases, such as: 1) an extension of the loan length or amount at a non-zero interest rate for the portion of the loan payback period that exceeds 48 months or the amount that exceeds $100,000, if the utilities can determine how that can be done at their current capital costs; or 2) a floating loan term set to ensure a positive cashflow.
Recommendation 5: The utilities should continue to investigate how third-party financing, including C-PACE could be leveraged to help promote projects with longer paybacks or exceed the loan cap. As part of this, they should consider providing contractors with information on C-PACE and how to talk to building owners or tenants with long-term leases about using it.

Small Business Energy Advantage (SBEA) Process Evaluation
Data Collection Instruments | Page A-1
Appendix A. Data Collection Instruments
A.1. Stakeholder Survey
A.1.1. Survey Introduction
Thank you for agreeing to take this important survey. As you respond to the questions, please keep in mind that they apply to the statewide program, not to any specific utility.
A.1.2. Respondent Background [ASK ALL]
First, please provide a little information about yourself.
Q1. Please confirm your name is [NAME] or provide your correct name: 1. Confirmed 2. Correct name:
Q2. Please confirm that you work for [EMPLOYER] or provide the correct name of the organization you work for:
1. Confirmed 2. Correct name:
Q3. Please confirm that your title within that organization is [TITLE] or provide your correct title: 1. Confirmed 2. Correct title:
Q4. Please briefly describe your role in the CT SBEA program? (We are just looking for a quick summary.)
Q5. How long have you been involved with the CT SBEA program?
Q6. What parts of your background and experience are most relevant to your role in the CT SBEA program? (We are just looking for a quick summary.)
A.1.3. Program Goals and Objectives [ASK ALL]
Please provide your views on the importance of various SBEA program goals and objectives.
Please answer on a scale from 1 to 5, where 1 means “not at all important” and 5 means “critically important”.
Q7. How important is it that the program continue to achieve at least the current level of savings from lighting to achieve program goals over the next three years?
[INSERT 1-5 SCALE WITH DK OPTION]

Small Business Energy Advantage (SBEA) Process Evaluation
Data Collection Instruments | Page A-2
Q8. How important is it that the program continue to achieve at least the current level of savings from HVAC improvements to achieve program goals over the next three years?
[INSERT 1-5 SCALE WITH DK OPTION]
Q9. How important is it that the program continue to achieve at least the current level of savings from refrigeration improvements to achieve program goals over the next three years?
[INSERT 1-5 SCALE WITH DK OPTION]
Q10. How important is it that the program continue to achieve at least the current level of savings from natural gas measures to achieve program goals over the next three years?
[INSERT 1-5 SCALE WITH DK OPTION]
We also would like to hear your thoughts on how likely it is that the program will achieve various goals and objectives. For the questions below, please answer on a scale from 1 to 5, where 1 means “not at all likely” and 5 means “extremely likely”.
Q11. How likely is it that the program will continue to achieve at least the current level of lighting savings over the next three years?
[INSERT 1-5 SCALE WITH DK OPTION]
[IF Q7>1 AND Q11 < 3]
Q12. What will keep the program from achieving at least the current level of lighting savings over the next three years?
Q13. How likely is it that the program will continue to achieve at least the current level of HVAC savings over the next three years?
[INSERT 1-5 SCALE WITH DK OPTION]
[IF Q8 > 1 AND Q13 < 3]
Q14. What will keep the program from continuing to achieve at least the current the level of HVAC savings over the next three years?
Q15. How likely is it that the program will continue to achieve at least the current level of refrigeration savings over the next three years?
[INSERT 1-5 SCALE WITH DK OPTION]
[IF Q9 > 1 AND Q15 < 3]
Q16. What will keep the program from achieving at least the current level of refrigeration savings over the next three years?
Q17. How likely is it that the program will continue to achieve at least the current level of savings from gas measures over the next three years?
[INSERT 1-5 SCALE WITH DK OPTION]

Small Business Energy Advantage (SBEA) Process Evaluation
Data Collection Instruments | Page A-3
[IF Q10 > 1 AND Q17 < 3]
Q18. What will keep the program from achieving at least the current level of savings from gas measures over the next three years?
Q19. How likely is it that the program will achieve its savings goals over the next three years?
[INSERT 1-5 SCALE WITH DK OPTION]
[IF Q19 < 3]
Q20. Other than anything you already have identified, what might keep the program from achieving its savings goals over the next three years?
A.1.4. Importance of Program Elements [ASK ALL]
Q21. On a scale where one equals "not at all important" and five equals "critically important", please rate the importance of each of the following program elements to achieving the program’s goals. [FORCE RESPONSE]
[MATRIX – INSERT RATING SCALE 1-5 WITH DK] 1. The audits are free 2. The audits cover lighting 3. The audits cover HVAC 4. The audits cover refrigeration equipment 5. On-bill payment of equipment and installation costs 6. Retrofit lighting incentives usually pay about 35% of installation costs 7. High performance lighting incentives usually pay about 40% of total costs
[IF Q21.1 < 4]
Q22. Why are free audits not very important to achieving the program's savings goals?
[IF Q21.2 < 4]
Q23. Why is the fact that audits cover lighting not very important to achieving the program's savings goals?
[IF Q21.3 < 4]
Q24. Why is the fact that audits cover HVAC not very important to achieving the program's savings goals?
[IF Q21.4 < 4]
Q25. Why is the fact that audits cover refrigeration equipment not very important to achieving the program's savings goals?
[IF Q21.5 < 4]

Small Business Energy Advantage (SBEA) Process Evaluation
Data Collection Instruments | Page A-4
Q26. Why is the fact that the program provides on-bill financing of installation not very important to achieving the program's savings goals?
[IF Q21.6 < 4]
Q27. Why are the current incentives for retrofit lighting not very important to achieving the program's savings goals?
[IF Q21.7 < 4]
Q28. Why are the current incentives for high performance lighting not very important to achieving the program's savings goals?
A.1.5. Program Operations and Implementation
The next questions are about program administration and implementation, such as eligibility criteria, the incentive structure, and interactions with contractor/arrangers and customers.
A.1.5.1. Program Progress Toward Goals
Q29. Are you sufficiently familiar with details of the program’s operations and implementations to answer some questions on that topic? [FORCE RESPONSE]
1. Yes 2. No [SKIP TO Q34]
[ASK IF Q29 =1]
Q30. Why are electric savings goals staying flat but gas savings goals increasing noticeably from 2016 through 2018?”
[ASK IF Q29 =1]
Q31. What strategies does the program have in place to accomplish these gas goals?
[ASK IF Q29 =1]
Q32. In 2014, the program spent 82% of its budget and achieved 81% of savings goals, and in 2015, the program spent 90% of its budget and achieved 87% of savings goals. What changes, if any, did the program make between 2014 to 2015 that might account for the increased spending and savings?
[ASK IF Q29 =1]
Q33. Despite the increased percentage of budget spent and savings achieved between 2014 and 2015, the program still did not spend all of its budget or achieve all of its savings goals in 2015. What might the program do differently in 2016 to achieve its savings goal?

Small Business Energy Advantage (SBEA) Process Evaluation
Data Collection Instruments | Page A-5
A.1.5.2. Program Eligibility
Q34. Are you sufficiently familiar with details of program eligibility criteria to answer some questions on that topic? [FORCE RESPONSE]
1. Yes 2. No [SKIP TO Q42]
[IF Q34 = 1]
Q35. The program website and documentation we reviewed states that customers with 12-month peak demand in the range of 10 kW to 200 kW are eligible to participate in the SBEA program. How, if at all, have the eligibility criteria for participating changed in the past five years?
[IF Q34 = 1]
Q36. Have there been any challenges or difficulties relating to the eligibility requirements to participate in the SBEA program?
1. Yes 2. No 98. Don't know
[IF Q36 = 1]
Q37. Please briefly identify any challenges or difficulties there have been relating to the eligibility requirements to participate in the SBEA program – for example, they are too restrictive, it is too difficult to determine a business’s eligibility:
[IF Q36 = 1]
Q38. How serious are the challenges you identified? Please answer on a scale from 1 to 5, where 1 means “not at all serious” and 7 means “extremely serious.”
[INSERT 1-7 SCALE WITH DK]
[IF Q34 = 1]
Q39. Are there any plans or discussions about changing the eligibility requirements to participate in the SBEA program?
1. Yes – plans are in place 2. Yes – changes have been discussed 3. No plans or discussions 98. Don't know
[IF Q39 = 1 OR 2]
Q40. Please explain any plans or discussions about changing the eligibility requirements to participate in the SBEA program:
[IF Q39 = 1 OR 2]
Q41. What are the reasons for planned or discussed changes to the eligibility requirements?

Small Business Energy Advantage (SBEA) Process Evaluation
Data Collection Instruments | Page A-6
A.1.5.3. Incentive Levels
Q42. Are you sufficiently familiar with details of program incentives to answer some questions on that topic? [FORCE RESPONSE]
1. Yes 2. No [SKIP TO Q49]
[IF Q42 = 1]
Q43. The program documentation identified maximum incentive levels, as a percentage of installed equipment costs (35% for retrofit lighting, 40% for high-performance lighting, 50% for prescriptive HVAC and VSD). When would a project receive less than the maximum incentive level?
[IF Q42 = 1]
Q44. 2015 program data showed that a few projects got incentives of 70% to 100% of installed equipment cost. What is the reason that a project would get such a high percentage of cost?
[IF Q42 = 1]
Q45. How, if at all, has the incentive structure for the SBEA program changed in the past five years?
[IF Q42 = 1]
Q46. Are there any plans or discussions about changing the incentive structure for the SBEA program? 1. Yes – plans are in place 2. Yes – changes have been discussed 3. No plans or discussions
98. Don't know
[IF Q46 = 1 OR 2]
Q47. Please explain any plans or discussions about changing the incentive structure for the SBEA program:
[IF Q46 = 1 OR 2]
Q48. What are the reasons for planned or discussed changes?
A.1.5.4. Interaction with Contractors/Arrangers
Q49. Are you sufficiently familiar with the program’s interactions with contractor/arrangers to answer some questions on that topic? [FORCE RESPONSE]
1. Yes 2. No
[IF Q49 = 1]
Q50. Contractor/arrangers are responsible for explaining financing options to customers. How does the program prepare contractor/arrangers to be able to explain financing options?

Small Business Energy Advantage (SBEA) Process Evaluation
Data Collection Instruments | Page A-7
[IF Q49 = 1]
Q51. What feedback, if any, have you heard from contractor/arrangers about their ability to explain financing?
[IF Q49 = 1]
Q52. How does the program ensure that there are contractor/arrangers that are knowledgeable about the particular needs and concerns of the various business types the program serves (office, restaurant, grocery, and other)?
[IF Q49 = 1]
Q53. How many times in the past five years have program contractor/arrangers failed to meet the following compliance guidelines? [SCALE IS 1=NEVER, 2=ONCE OR TWICE, 3=THREE OR FOUR TIMES, 4=FIVE OR MORE TIMES, 98=DK] [FORCE RESPONSE]
1. Submit a minimum of twelve (12) customer leads per month 2. Develop/present a minimum of eight (8) projects per month 3. Convert 40% of leads into installed projects 4. Install at least one comprehensive project per month. 5. Install at least one project per month with a gas measure. 6. Maintain an 80% or better Compliance Rate on all Pre- and Post-installation inspections. 7. Build and complete projects in accordance with the SBEA time guidelines.
[ASK IF Q49 =1 AND Q53_1 =2,3, OR 4)]
Q54. How did the program handle the contractor/arranger failing to submit a minimum of twelve customer leads per month?
[ASK IF Q49 =1 AND Q53_2 =2,3, OR 4)]
Q55. How did the program handle the contractor/arranger failing to develop/present a minimum of eight projects per month?
[ASK IF Q49 =1 AND Q53_2 =2,3, OR 4)]
Q56. How did the program handle the contractor/arranger failing to convert 40% of leads into installed projects?
[ASK IF Q49 =1 AND Q53_4 =2,3, OR 4)]
Q57. How did the program handle the contractor/arranger failing to install at least one comprehensive project per month?
[ASK IF Q49 =1 AND Q53_5 =2,3, OR 4)]
Q58. How did the program handle the contractor/arranger failing to install at least one gas project per month?
[ASK IF Q49 =1 AND Q53_6 =2,3, OR 4)]

Small Business Energy Advantage (SBEA) Process Evaluation
Data Collection Instruments | Page A-8
Q59. How did the program handle the contractor/arranger failing to maintain an 80% or better compliance rate on all pre- and post-inspections?
[ASK IF Q49 =1 AND Q53_7 =2,3, OR 4)]
Q60. How did the program handle the contractor/arranger failing to build and complete projects in accordance with SBEA guidelines?
[IF Q49 = 1]
Q61. A few contractor/arrangers do most of the projects. What, if anything, has the program done to encourage greater activity among the less-active contractor/arrangers?
[IF Q49 = 1]
Q62. What feedback, if any, have you heard from customers, either positive or negative, about contractor/arrangers?
A.1.6. Program Marketing
Q63. Are you sufficiently familiar with details of program marketing to answer some questions on that topic? [FORCE RESPONSE]
1. Yes 2. No [SKIP TO Q42]
[IF Q63 =1]
Q64. Does any of the SBEA program marketing target specific business sectors? 1. Yes 2. No 98. Don't know
[IF Q64 = 1]
Q65. Please describe what sectors it targets and how it does so?
A.1.7. Program Staffing
Q66. Is the program sufficiently staffed to carry out all the responsibilities assigned to the utility’s SBEA program staff?
1. Yes 2. No 98. Don't know
[IF Q66 = 2]
Q67. What additional staffing is needed – how many and what kind of staff?

Small Business Energy Advantage (SBEA) Process Evaluation
Data Collection Instruments | Page A-9
Q68. Would the addition of any particular skills to the program staff’s skill sets help the program meet its goals and objectives in the small business sector?
1. Yes 2. No 98. Don't know [SKIP TO Q70]
[IF Q68 = 1]
Q69. What additional skill sets would be useful?
A.1.8. Program Market Research
The last set of questions relate to possible market research done to identify program opportunities. Please answer each to the best of your ability.
Q70. Has any research been done to estimate the percentage of tube lighting fixtures in CT that still have T12 lamps?
1. Yes 2. No 98. Don't know
[IF Q59 = 1]
Q71. What is the approximate percentage of T12s still in place in Connecticut’s small businesses?
Q72. Has any research been done to estimate the percentage of small businesses that are purchasing lighting that has been marked down through residential upstream programs?
1. Yes 2. No 98. Don't know
[IF Q72 = 1]
Q73. What is the approximate percentage of small businesses that are purchasing lighting that has been marked down through residential upstream programs?
A.1.9. Suggested Process Evaluation Research Topics
Q74. What do you think would be valuable to learn about program participants’ experience with the program?
Q75. What do you think would be valuable to learn about how contractor/arrangers work with the program, including with the program participants and the utilities?
Q76. Is there anything else you’d like to share that was not covered by any of the questions in this survey – if so, what?
That is all the questions. Thank you again for your time.

Small Business Energy Advantage (SBEA) Process Evaluation
Data Collection Instruments | Page A-10
A.2. Staff In-Depth Interview Guide
A.2.1. Introduction
Thank you for setting the time aside for us to talk. To recap what I said when scheduling this call, our evaluation purpose is to assess what could be done to increase program participation and savings and to document program delivery challenges and potential improvements. Thus, we are speaking with program staff and stakeholders, like yourself, as well as contractors, participants, and nonparticipants.
Please note your comments are confidential. All reporting will use only summary-level data and will not identify individual respondents or organizations.
Also, if I ask you about areas you don’t know about, please feel free to tell me that and we will move on. Also, if you want to refer me to specific documents to answer any of my questions, that’s great – I’m happy to look things up if I know where to get the information.
I would like to record this interview for my note-taking purposes. Do I have your permission?
A.2.2. Roles & Responsibilities
Q1. Can you briefly describe your role(s) in the Small Business Energy Advantage or SBEA program and provide your current job title?
A.2.3. Program Processes
A.2.3.1. Application Processing
Now, I’d like to hear about program processes. Let’s start with…
Q2. How well does the application process work, in your opinion? Are there any challenges or concern? If so, what are they?
[Follow-ups to ask, if appropriate] a. How often do these occur? b. How are these issues tracked/monitored? [Probe: Through your (if Eversource, say
“CLMTRS;” if UI say “EnerNet”) tracking system?] c. Is there a certain time (or times) of year when you see the most problems? d. Are there some contractors or types of contractors that generally have more
errors/problems than others? e. In the last few years, what actions by Eversource / UI have been taken to reduce
errors/problems with the application submissions? [Probes: Education, training, changes in forms, submission process changes, etc.]
• Have these actions been effective?

Small Business Energy Advantage (SBEA) Process Evaluation
Data Collection Instruments | Page A-11
A.2.3.2. Inspections
Next, let’s talk briefly about pre- and post-inspections of projects.
Q3. How many pre- and post-inspections do your inspectors perform on average per week? a. Just to confirm, your staff does inspections? b. How does your staff determine which projects need a pre-inspection?
Q4. What kinds of project concerns or issues, if any, have post-inspections identified? a. How often do these come up? b. Are the issues more common with specific types of contractors or participants? c. How are the issues addressed?
A.2.3.3. Loans and Loan-related Barriers
The next few questions are about financing.
Q5. What have you heard, if anything, from contractors or customers on whether financing issues may be a barrier to participating or to doing larger projects?
[If the following barriers are not mentioned, ask:] a. Is maximum loan amount of $100,000 a barrier for some to take a loan and undertake a
project? Why? b. Is payback period preventing some businesses to take a loan? c. Have there been any challenges with the loan approval process? If so, what were they?
[Probe about time it takes for loan approval, ease/difficulty of the paperwork, and issues with qualifying customers.]
d. What actions by Eversource / UI have been taken to address these issues? Have these actions been effective?
Q6. What types of changes, if any, are you considering to financing options or terms to encourage businesses to take loans for non-lighting or comprehensive projects?
[Follow-up, if appropriate]
Q7. Is Eversource / UI considering raising an interest rate on the loan to further leverage financing dollars? [If yes:] What are you considering: 1%, 2%, or something else?
a. How much of a drop in participation do you expect if you raise the interest rate? b. When we interview SBEA participants and nonparticipants, would you like us to investigate
(to the extent that we can) a potential drop in participation if interest rate is raised?
A.2.3.4. Communication
I'd also like to hear briefly about program communication processes.
Q8. Who all do you communicate with on a regular basis in administering this program?
Q9. Can you describe how you communicate with them? a. How is this process working for you? Any challenges?

Small Business Energy Advantage (SBEA) Process Evaluation
Data Collection Instruments | Page A-12
Q10. [If speaking with Eversource/UI staff] Can you describe how you interact with contractors other than in the training you provide them?
a. How often do you have to resolve an issue with a contractor? What types of issues come up?
A.2.3.5. Contractor Engagement and Compliance Guidelines
From what we have read, the participation of the contractors is vital to the success of the program. I'd like to hear a bit more detail about how the program engages contractors.
Q11. How are contractors recruited to participate in the program? a. Do you know what percent of potentially qualified contractors are in the program?
Q12. We know that program provides training to contractors about financing options and methods to reach the various types of small businesses. What have you heard from contractors about this training? Is it useful?
Q13. What other training would help contractors generate more leads for the program?
Q14. What training or services could program staff offer to contractors to help them generate more non-lighting projects?
Q15. What have you heard from contractors on why customers do not to participate in the program? [Probe about awareness, cost/payback, building ownership/tenancy]
Q16. We heard contractors sometimes fail to meet program guidelines; most notably, they often fail to install at least one gas measure per month. What have you done to help contractors install more gas measures through the program?
Q17. In 2016, did you have to remove any contractors from your list of participating contractors?
[If had to remove contractors:] a. How many did you have to remove? b. Why did you have to remove the contractors?
A.2.3.6. Marketing and Outreach
Let’s talk about marketing and outreach.
Q18. [If speaking with Eversource staff] In 2016, Eversource invested in online, radio, and social media advertising to promote the SBEA program. Has Eversource done anything else to promote the program? [If speaking with UI staff] What type of marketing has UI done to promote the program in 2016?
a. How does Eversource / UI decide which marketing strategy to implement? b. How do you typically measure the success of your marketing campaigns? c. How do you optimize messaging for specific business types, such as restaurants, agriculture,
or medical offices? How do you identify which messaging is most effective in generating leads?

Small Business Energy Advantage (SBEA) Process Evaluation
Data Collection Instruments | Page A-13
Q19. Is the program pursuing or planning to pursue any additional opportunities for expanding market penetration in the small business sector?
[Probe as needed] For example, are there other… a. Measures that are being considered? b. Incentive changes that are being considered? c. Financing changes that are being considered? d. Population segments to target? e. Contractor targets? [If needed: Has anything been done to increase the number of
contractors doing work with SBEA?]
A.2.4. Program Staffing
Q20. What additional staffing is needed to carry out all the responsibilities assigned to the utility’s SBEA program staff?
[Probe as needed] a. How many? b. What kind of staff? c. Are there bottlenecks that this additional staff would help with? [If yes] What? d. How exactly would program be affected if you added this extra staff? [IF NEEDED: Would
more projects be processed, would measurements and verification improve, or would something else change?]
e. Are you in the process of hiring additional staff? If not, why not? [Probe if there is sufficient budget or if they cannot find the right people to hire.]
A.2.5. Wrap Up
Q21. Is there anything else about the program that we have not discussed that you feel should be mentioned?
Those are all of my questions. Thank you very much for your time.

Small Business Energy Advantage (SBEA) Process Evaluation
Data Collection Instruments | Page A-14
A.3. Contractors Interview
A.3.1. Introduction
To begin, I have a few questions about your business and the SBEA program.
Q1. Just to confirm, my information indicates that you have worked on approximately [number of projects] SBEA projects in the last year [or since 2015 if appropriate]. Does that sound correct? If not, what is approximate number of projects completed in the last year?
Q2. About what percentage of your firm’s work do SBEA projects make up?
Q3. Could you see your firm doing more projects?
[If yes, ask: How many more? What would your firm need to do to accomplish that? What assistance from the utilities would be needed? If no, ask: Why not? (Probe about relative profitability, role of SBEA in firm’s workload) What could the utilities do to support more work by your firm?]
A.3.2. Program Processes
I want to talk a bit about the process you go through, from finding a customer to completing a project.
Q4. Please describe the steps you go through from your first interaction with a potential SBEA customer to the audit, the installation, and the final interaction with the customer?
A.3.3. Barriers to Recruiting Participants
The next set of questions is about your interactions with customers. I want to start with a few questions about your experience in getting customers to do upgrades through the program.
Q5. Of all customers you attempt to sell upgrades to through SBEA, about what percentage result in installed SBEA projects?
Q6. What challenges do you face in getting customers to do upgrades?
[Probes: Lack of awareness of/interest in saving energy Payback too long Measures too expensive Disruption to business Lack of desire to take on additional debt]
[ASK ALL IF NOT ADDRESSED IN PREVIOUS QUESTION]

Small Business Energy Advantage (SBEA) Process Evaluation
Data Collection Instruments | Page A-15
Q7. Are there any particular points in the participation process that are more challenging than others? If so, what are they?
[Probes: Getting an audit done? Implementing measures based on audit results? Convincing customers to do more measures than they are initially interested in? Convincing customers to take on financing? Something else?]
Q8. Are there any particular customer types that pose more challenges than others?
[Probes: Cultural groups Business size Business type]
Q9. How do you address those challenges?
[Probe: Work with community organizations/cultural groups – which ones?]
Q10. What would help you increase the percentage of small businesses that complete projects? [If says, “higher incentives,” ask “What else?”]
A.3.4. Barriers to Non-lighting/Comprehensive Projects
Now, just a few questions about getting the most energy and demand savings from each site.
Q11. What strategies do you use with customers who agreed to do lighting upgrades, to get them to do more extensive projects, including non-lighting and comprehensive measures?
[Probe about heating, cooling, refrigeration, hot water, motor, process, custom.]
Q12. To what degree do you focus on getting a customer to do as much as possible in one project as opposed to trying to get repeat projects at a given site?
[Probe about heating, cooling, refrigeration, hot water, motor, process, custom.]
Q13. What challenges do you face in getting such customers to do more extensive projects?
[Probes: Lack of awareness of/interest in saving energy, Payback too long, Disruption to business, Measures too expensive, Lack of desire to take on additional debt.]
Q14. How do you address those challenges?
Q15. What might keep you from pushing for more extensive upgrades, including non-lighting and comprehensive measures? [Probe about non-lighting and comprehensive upgrades]

Small Business Energy Advantage (SBEA) Process Evaluation
Data Collection Instruments | Page A-16
A.3.5. Financing
The next set of questions is about customers’ use of financing.
Q16. What, if anything, could make program financing more attractive to small businesses that are reluctant to participate in the program? [Probe: More inclusive eligibility requirements, longer terms, etc.]
Q17. What changes to the financing element of the program would encourage participants to take on greater debt to do more extensive upgrades?
Q18. What changes to the financing element of the program absolutely should not be changed? [Probe about 0% financing] Why?
A.3.6. Satisfaction/Suggestions for Program Improvement
Before we conclude I have a few questions about your satisfaction with the SBEA program and your thoughts on ways to improve the program.
Q19. Overall, on a scale of 0 to 10, where 0 means not at all satisfied and 10 means completely satisfied, how satisfied are you with the program? [Record 0-10 as well as any comments]
Q20. What works particularly well about the program?
Q21. What, if anything, does not work well? [Probe about program rules (e.g., more inclusive eligibility requirements, longer terms, etc.), paperwork, program staff]
[ASK IF ANY ISSUES IDENTIFIED]
Q22. What do you think the program should do to address that issue/those issues? [Probe about each element mentioned]
Q23. What other improvements to the program, if any, should be considered?
A.3.7. Firmographics
Finally, to end, I have a few questions about your firm.
Q24. How many business locations do you have in Connecticut?
Q25. How many employees work at these Connecticut locations?
Q26. How many employees work on SBEA projects?
Q27. What areas of Connecticut do you serve?
Those are all my questions. Thank you for your time.

Small Business Energy Advantage (SBEA) Process Evaluation
Data Collection Instruments | Page A-17
A.4. Participant Onsite Survey
A.4.1. Upgrades
[Prefill following information prior to interview, if available]
Q1. What equipment did the participant upgrade through participation in the SBEA program?
[MULTIPLE RESPONSE]
Heating: Electric or Gas Domestic Hot Water (DHW): Electric or Gas Process: Electric or Gas (ADH): Electric or Gas Cooling Lighting, standard High performance lighting Motor Refrigeration Other explain: __________________________________________________________
[Record responses to Q2 in left column of following matrix. For each item that the contractor suggested should be upgraded but was not, ask Q3 and Q4 record responses in right columns]
Q2. What other types of equipment, if any, did the SBEA contractor suggest should be upgraded?
Q3. Why didn’t you do the recommended … upgrade?
Q4. What, if anything, did the contractor tell you about the value of the …. upgrade?
Q2. Suggested upgrade Q3. Reason did not upgrade Q4. What contractor told them about value of upgrade
Heating: Electric or Gas Upfront cost
Payback or ROI
Don’t want to take on debt
Burdensome on operations
No responsibility/authority
Other (explain):
Domestic hot water: Electric or Gas
Process: Electric or Gas
ADH: Electric or Gas
Cooling
High performance lighting
Lighting
Motor
Refrigeration
Other:

Small Business Energy Advantage (SBEA) Process Evaluation
Data Collection Instruments | Page A-18
[Ask Q5 and check appropriate box in second column of following matrix for each item replaced. For each item replaced, ask Q6 and check appropriate box in third column if received an incentive.]
Q5. What other equipment, if any, have you replaced in the past two years?
[IF REPLACED LIGHTING, AS Q6]
Q6. What did you replace the lighting with?
[Use response to determine whether to indicate it was standard or high performance lighting upgrade]
Q7. Did you receive any Energize Connecticut incentives for the … that you replaced?
Equipment Replaced Received Incentive
1. Heating
2. Domestic hot water
3. Process
4. ADH
5. Cooling
6. High performance lighting
7. Lighting, standard
8. Motor
9. Refrigeration
10. Other:
A.4.2. Financing
[Ask questions in this section only if they financed the project. Start by reading the following text, and then read the questions]
The next two questions are about the SBEA program’s finance terms.
Q8. I’d like you to imagine you have been presented the cost estimate for your upgrades. But instead of 0% financing the loan is being offered at 1%. Which of the following will you most likely do?
[Read list and record one response. Repeat if necessary] 1. Take the loan and do the same upgrades 2. Take the loan but do fewer or less expensive upgrades 3. Do the same upgrades without the loan 4. Do fewer or less expensive upgrades without the loan 5. Not do any upgrades
[Do not read:] 6. Other (explain): ____________________________________________

Small Business Energy Advantage (SBEA) Process Evaluation
Data Collection Instruments | Page A-19
98. Don't know 99. Refused
Q9. Suppose the loan is being offered at 2%. Which of the following will you most likely do?
[Read list and record one response. Repeat if necessary] 1. Take the loan and do the same upgrades 3. Take the loan but do fewer or less expensive upgrades 2. Do the same upgrades without the loan 4. Do fewer or less expensive upgrades without the loan 5. Not do any upgrades
[Do not read:] 6. Other (explain): ____________________________________________ 98. Don't know 99. Refused
A.4.3. Satisfaction
Q10. On a scale 0 to 10 where 0 means “not at all satisfied” and 10 means “extremely satisfied,” how satisfied were you with …
0 1 2 3 4 5 6 7 8 9 10 DK
1…the thoroughness of the audit that was done to identify energy savings opportunities
2…how well the contractor explained the financing options
3…the steps you had to go through to get the incentive
4…the amount of time it took to get the incentive
5…the quality of the installation work completed by your contractor
6…the quality of the equipment installed by the contractor
[For each item in Q9 for which the respondent gave a rating of less than 7 (dissatisfaction indicated), ask them Q10 and record their response in the right column.]
Q11. What was unsatisfactory about ...? 1. The thoroughness of the audit 2. How the contractor explained financing options 3. The steps you had to go through [Which steps were problems?]

Small Business Energy Advantage (SBEA) Process Evaluation
Data Collection Instruments | Page A-20
4. The amount of time it took to get the incentive [How long did it take? How did that compare to what you expected?]
5. Quality of the installation work 6. Quality of the equipment
Q12. Do you have any suggestions to improve the Small Business program?
A.4.4. Firmographics
Q13. How many employees do you have at this site? _______
Q14. How many locations does your organization have in Connecticut? __________
Q15. What is the ownership structure of your organization? Is it a
[Read] [SINGLE RESPONSE] 1. Privately owned by a person(s) or company 2. Franchise owned by a person 3. Corporate owned franchise 4. Regional or national chain
[Do not read:] 98. Don't know 99. Refused
Q16. Do you lease or own your business space?
[Read] [SINGLE RESPONSE] 1. Lease 2. Own 3. Other – explain: ________________________________
[Do not read:] 98. Don't know 99. Refused
Those are all the questions I have for you. Thank you.

Small Business Energy Advantage (SBEA) Process Evaluation
Data Collection Instruments | Page A-21
A.5. Participant Phone Survey
A.5.1. Audit and Upgrades
[ASK ALL]
Q1. What items did you upgrade through the Small Business program?
[Do not read responses; probe to code]
[MULTIPLE RESPONSE] 1. Lighting 2. Heating equipment 3. Cooling equipment 4. Domestic hot water (DHW) / Hot water heater 5. Refrigeration 6. Motor 96. Other, please specify: [OPEN-ENDED RESPONSE] 97. NONE 98. Don't know 99. Refused
[ASK ALL]
Q2. Aside from the things that you upgraded through the program, what else did the program contractor suggest should be upgraded?
[Do not read responses; probe to code]
[MULTIPLE RESPONSE] 1. Lighting 2. Heating equipment 3. Cooling equipment 4. Domestic hot water (DHW) / Hot water heater 5. Refrigeration 6. Motor 96. Other, please specify: [OPEN-ENDED RESPONSE] 97. NONE – installed everything the contractor suggested 98. Don't know 99. Refused
Q2a. Did you receive financing through the program for your project?
[SINGLE RESPONSE] 1. Yes 2. No 98. Don't know 99. Refused

Small Business Energy Advantage (SBEA) Process Evaluation
Data Collection Instruments | Page A-22
[ASK ALL]
Q3. Did the contractor ask you to accompany him/her around your facility to examine the existing equipment and determine the need for upgrades?
[SINGLE RESPONSE] 1. Yes 2. No 96. NA – Did not interact with the contractor who did the audit 96. Don't know 99. Refused
[ASK ALL]
Q4. Did you accompany the contractor while he/she examined the existing equipment to determine the need for upgrades?
[SINGLE RESPONSE] 1. Yes 2. No 96. NA – Did not interact with the contractor who did the audit 96. Don't know 99. Refused
[ASK IF Q4=1]
Q5. On a scale of 0 to 10, how useful was accompanying the contractor during the examination of existing equipment in deciding about what upgrades to do?
[PROGRAMMER: INSERT 0-10 SCALE WITH DK OPTION]
[ASK IF Q2=2, 3, 4, 5, 6, OR 96 (NON-LIGHTING UPGRADE WAS RECOMMENDED)]
Q6. What did the contractor do or say to try to convince you to do the recommended upgrades?
[SINGLE RESPONSE] 1. [OPEN-ENDED RESPONSE] 98. Don't know 99. Refused
[ASK IF RESPONDENT DID NOT UPGRADE ANY RECOMMENDED NON-LIGHTING EQUIPMENT: (Q2 = 2 (HEATING RECOMMENDED BUT NOT UPGRADED) OR (Q2 = 3 (COOLING RECOMMENDED BUT NOT UPGRADED) OR (Q2 = 4 (DHW RECOMMENDED BUT NOT UPGRADED) OR (Q2 = 5 (REFRIGERATOR RECOMMENDED BUT NOT UPGRADED) OR (Q2 = 6 (MOTOR RECOMMENDED BUT NOT UPGRADED)]

Small Business Energy Advantage (SBEA) Process Evaluation
Data Collection Instruments | Page A-23
Q7. What were your reasons for not upgrading your [EQUIPMENT RECOMMENDED BUT NOT UPGRADED] through the Small Business program?
[PROBE ABOUT EACH EQUIPMENT TYPE AS NEEDED] 1. [OPEN-ENDED RESPONSE] 98. Don't know 99. Refused
Q8. What could the Small Business program have offered you to get you to upgrade that equipment?
1. [OPEN-ENDED RESPONSE] 98. Don't know 99. Refused
A.5.2. Program Experience
The next few questions are about your experience with the program and the new or upgraded equipment.
[ASK ALL]
Q9. What were the benefits, if any, of the new or upgraded equipment?
[Interviewer: Do not read responses; probe to code. After each response, ask “anything else?” until respondent indicates no others. If respondent refers to reduced energy use, ask what specifically was beneficial about that – the purpose is to determine whether they are referring to cost savings, environmental benefits, or both.]
[MULTIPLE RESPONSE] 1. Reduced energy cost / saving money 2. Environmental benefits / carbon reduction 3. Improved comfort 4. Reduced noise level 5. Better lighting 6. Decreased maintenance 7. Increased reliability / fewer break-downs 96. Other, please specify: [OPEN-ENDED RESPONSE] 97. NONE 98. Don't know 99. Refused
[ASK ALL]
Q10. On a scale 0 to 10 where 0 means “not at all satisfied” and 10 means “extremely satisfied,” how satisfied were you with…
[PROGRAMMER: INSERT 0-10 SCALE FOR EACH ITEM BELOW WITH DK OPTION] [SINGLE RESPONSE ON EACH ITEM BELOW]
a. The contractor’s thoroughness in identifying energy savings opportunities

Small Business Energy Advantage (SBEA) Process Evaluation
Data Collection Instruments | Page A-24
b. How well the contractor explained the financing options c. The steps you had to go through to get the incentive d. [DISPLAY IF LOAN=1 (financed the project)] The loan application paperwork e. The quality of the installation work completed by your contractor f. The quality of the equipment installed by the contractor
[ASK IF ANY OF Q10<7]
Q11. What was not satisfactory about …? [Probe as needed] 1. [IF Q10A<7] …the thoroughness of the audit? [OPEN-ENDED RESPONSE] 2. [IF Q10B<7] …how the contractor explained the financing options? [OE RESPONSE] 3. [IF Q10C<7] …the steps you had to go through to get the incentive? [OE RESPONSE] 4. [IF Q10E<7] …the loan application paperwork? [OE RESPONSE] 5. [IF Q10F<7] …the quality of the installation work? [OE RESPONSE] 6. [IF Q10G<7] …the quality of the installed equipment? [OE RESPONSE]
[Do not read:] 98. Don't know 99. Refused
[ASK ALL]
Q12. Was there anything else about your experience with the Small Business program that was not satisfactory? If so, what was it?
1. [YES - OPEN-ENDED RESPONSE] 2. No 98. Don't know 99. Refused
A.5.3. Financing
[ASK Q13 THROUGH Q18 IF Q2A=1 (FINANCED THE PROJECT)]
[Before asking Q13, read:] The next few questions are about the Small Business program’s financing.
[ASK IF Q2a = 1 (received financing)]
Q13. Are there any benefits of having your loan payment be part of your [UTILITY] energy bill? If so, what are they?
1. Simple loan application process 2. Convenient payment 3. Can see energy savings and loan payment in one place 4. Does not show up in balance sheet as a debt 5. Other – please specify [OPEN-ENDED RESPONSE] 6. No advantages 98. Don't know 99. Refused
[ASK IF Q13 1- 5 ANY ARE SELECTED AND IF Q2a = 1 (received financing)]

Small Business Energy Advantage (SBEA) Process Evaluation
Data Collection Instruments | Page A-25
Q14. On a scale of 0 to 10, with 10 meaning it was a very great benefit and 0 meaning it was not a benefit, how much of a benefit was [first item mentioned]? [Repeat for each item identified as a benefit]
[PROGRAMMER: INSERT 0-10 SCALE W DK AND REF FOR EACH ITEM; DISPLAY ONLY ITEMS SELECTED IN Q13]
1. [ASK IF Q13_1 = SELECTED] Simple loan application process 2. [ASK IF Q13_2 = SELECTED] Convenient payment 3. [ASK IF Q13_3 = SELECTED] Can see energy savings and loan payment in one place 4. [ASK IF Q13_4 = SELECTED] Does not show up in balance sheet as a debt 5. Other – please specify [OPEN-ENDED RESPONSE] 98. Don't know 99. Refused
[ASK IF Q2a = 1 (received financing)]
Q15. I’d like you to imagine you have been presented the cost estimate for your upgrades. But instead of 0% financing the loan is being offered at 2%. Would you still do the same upgrades at 2% financing?
[SINGLE RESPONSE] 1. Yes 2. No 98. Other, please specify: [OPEN-ENDED RESPONSE] 98. Don't know 99. Refused
[ASK IF Q15=2 AND [ASK IF Q2a = 1 (received financing)]
Q16. What would you do differently if you had 2% financing instead of 0%? [Probe to code] 1. Take the loan but do fewer or less expensive upgrades with a smaller loan 2. Do all the same upgrades, some with program financing and paying for others in another
way 3. Do all the same upgrades without using any program financing 4. Do fewer or less expensive upgrades without the loan 5. Not do any upgrades
[Do not read:] 96. Other, please specify: [OPEN-ENDED RESPONSE] 98. Don't know 99. Refused
[ASK IF Q2a = 1 (received financing)]
Q17. On a 0 to 10 scale, to what degree did the maximum loan amount of $100,000 limit the upgrades you were willing to do? 0 means “not at all” and 10 means “to an extremely great degree.”
[PROGRAMMER: INSERT 0-10 SCALE WITH DK AND REF OPTIONS]

Small Business Energy Advantage (SBEA) Process Evaluation
Data Collection Instruments | Page A-26
[ASK IF Q2a = 1 (received financing)]
Q18. On a 0 to 10 scale, to what degree did the maximum loan term of 48 months limit the upgrades you were willing to do? 0 means “not at all” and 10 means “to an extremely great degree.”
[PROGRAMMER: INSERT 0-10 SCALE WITH DK AND REF OPTIONS]
[ASK IF Q2a = 2 (Did not receive financing)]
Q18a. Why did you not receive financing for your project? 1. [OPEN-ENDED RESPONSE]
A.5.4. Influences on Decision-Making
[ASK ALL]
Q19. Did you consult anyone other than the program contractor in deciding what upgrades to make through the Small Business program? If so, who?
[MULTIPLE RESPONSE] 1. [OPEN-ENDED RESPONSE] 2. Did not consult anyone 98. Don't know 99. Refused
[ASK ALL]
Q20. Are there any professional, community, or cultural associations whose opinions you would trust when making decisions about equipment upgrades? If so, who are they?
[SINGLE RESPONSE] 1. [OPEN-ENDED RESPONSE] 2. No 98. Don't know 99. Refused
A.5.5. Firmographics
We are almost done. I have just a few more questions about your organization.
[ASK ALL]
Q21. How many employees do you have at [PROPERTY ADDRESS]? 1. [OPEN-ENDED RESPONSE] 98. Don't know 99. Refused
[ASK ALL]

Small Business Energy Advantage (SBEA) Process Evaluation
Data Collection Instruments | Page A-27
Q22. At this site, does your organization own or lease the space it occupies?
[SINGLE RESPONSE] 1. Own the space that it occupies 2. Lease the space
[Do not read:] 96. Other, please specify: [OPEN-ENDED RESPONSE] 98. Don't know 99. Refused
[ASK IF Q22=2 (Lease the space)]
Q23. Do you pay or does your landlord pay for the utilities?
[SINGLE RESPONSE] 1. We pay 2. Landlord pays 96. Other, please specify: [OPEN-ENDED RESPONSE] 98. Don't know 99. Refused
[ASK ALL]
Q24. How many locations does your organization have in Connecticut? 1. [OPEN-ENDED RESPONSE] 98. Don't know 99. Refused
[ASK ALL]
Q25. What is the ownership structure of your organization? Is it a: [Read first four responses]
[SINGLE RESPONSE] 1. Privately owned by a person(s) or company 2. Franchise owned by a person 3. Corporate owned franchise 4. Regional or national chain
[Do not read:] 96. Other-specify: [OPEN-ENDED RESPONSE] 98. Don't know 99. Refused
Those are all the questions I have for you. Thank you for your time.

Small Business Energy Advantage (SBEA) Process Evaluation
Data Collection Instruments | Page A-28
A.6. Non-participant Survey
A.6.1. Introduction
Hi, my name is ___ and I’m calling on behalf of [UTILITY] and Energize Connecticut. I would like to speak with someone involved in making decisions about purchasing energy-using equipment such as lighting, heating and cooling equipment in Connecticut. If you are not that person could you please refer me to someone who could answer a few questions about your organization and decisions about equipment purchases? Your feedback will help [UTILITY] evaluate its programs that provide incentives for building improvements to customers like you.
I’ll only need about 10 to 12 minutes. Is now a good time to talk, or can we make an appointment for a later time?
A.6.2. Screening
S1. To the best of your knowledge, has your company or organization received a cash rebate or incentive from [UTILITY] for installing any energy-efficient equipment in Connecticut in the last two years?
1. Yes 2. No
[Do not read:] 98. Don't know 99. Refused
[IF S1 = 1, THANK AND TERMINATE]
[IF S1 = 98 OR 99, RESPONDENT STILL QUALIFIES FOR SURVEY]
S2. When it comes to purchasing energy-using equipment for your facilities/sites in Connecticut, do you …?
[Read List:] 1. Make those decisions 2. Provide input to others who make those decisions 3. Have no involvement with those decisions
[Do not read:] 98. Don't know 99. Refused
[IF S2 = 3, ASK TO BE REFERRED TO SOMEONE IN THE BUSINESS WHO DOES MAKE EQUIPMENT DECISIONS OR THANK AND TERMINATE IF NO DECISION MAKER AVAILABLE]

Small Business Energy Advantage (SBEA) Process Evaluation
Data Collection Instruments | Page A-29
A.6.3. Equipment Responsibility
I’d like to start by asking about your company’s energy-using equipment, including any replacements you have made or plan to make. Note that I am only talking about properties in Connecticut so if you own or lease properties outside Connecticut, please think only about your Connecticut properties.
[ASK ALL]
Q1. First, how many properties do you own or lease in Connecticut?
[SINGLE RESPONSE] 1. One 2. More than one
[Do not read:] 96. Other, please specify: [OPEN-ENDED RESPONSE] 97. Not applicable 98. Don't know 99. Refused
[ASK ALL]
Q2. First, does your company own or lease the building space [IF Q1=2: “M”] it occupies in Connecticut?
1. Company owns 2. Company leases 3. [IF MULTIPLE SITES] Company owns some and leases some 4. Other – specify [OPEN-ENDED RESPONSE]
[Do not read:] 96. Other, please specify: [OPEN-ENDED RESPONSE] 98. Don't know 99. Refused
[ASK IF Q2 = 2 (LEASES) OR 3 (OWNS SOME AND LEASES SOME)]
Q3. For facilities or sites leased in Connecticut, does your company pay its energy expenses, either directly to the utility or as a line item on your payments to the building owner?
[SINGLE RESPONSE] 1. Yes 2. No 3. Yes for some, no for some
[Do not read:] 96. Other, please specify: [OPEN-ENDED RESPONSE] 98. Don't know 99. Refused

Small Business Energy Advantage (SBEA) Process Evaluation
Data Collection Instruments | Page A-30
[ASK IF Q2 = 2 (LEASES)]
Q4. Is your company responsible for replacing or upgrading any energy-using equipment, such as lighting, heating, or cooling equipment at its site(s)?
[SINGLE RESPONSE] 1. Yes 2. Yes in some, no in some 3. No -> [SKIP TO Q28]
[Do not read:] 98. Don't know -> [SKIP TO Q28] 99. Refused -> [SKIP TO Q28]
[ASK IF Q4 = 1 (YES) OR 2 (YES IN SOME, NO IN SOME)]
Q5. What energy-using equipment is your company responsible for replacing or upgrading in leased spaces in Connecticut?
[MULTIPLE RESPONSE] 1. Lighting 2. Heating or cooling 3. Refrigeration
[Do not read:] 96. Other, please specify: [OPEN-ENDED RESPONSE] 98. Don't know 99. Refused
A.6.4. Existing Equipment
[ASK ALL]
Q6. Does the building space that your company occupies have any lighting that is at least three years old?
[SINGLE RESPONSE] 1. Yes 2. No
[Do not read:] 96. Other, please specify: [OPEN-ENDED RESPONSE] 98. Don't know 99. Refused

Small Business Energy Advantage (SBEA) Process Evaluation
Data Collection Instruments | Page A-31
[ASK IF Q6=1]
Q7. What types of lighting does your building space have that is at least three years old?
[MULTIPLE RESPONSE] 1. Ceiling tube fluorescent lighting 2. Other ceiling lighting – please specify [OPEN-ENDED RESPONSE] 3. Refrigeration case lighting
[Do not read:] 96. Other, please specify: [OPEN-ENDED RESPONSE] 98. Don't know 99. Refused
[ASK ALL]
Q8. Does the building space that your company occupies have any other energy-using equipment that is at least five years old? If so, which equipment?
[Interviewer: If respondent says “RTU” or “rooftop” unit, clarify whether that provides both heating and air conditioning or one or the other.]
[MULTIPLE RESPONSE] 1. Heating 2. Air conditioning 3. Refrigeration 4. Has not replaced or upgraded any equipment
[Do not read:] 96. Other, please specify: [OPEN-ENDED RESPONSE] 98. Don't know 99. Refused
A.6.5. Planned Equipment Replacements/Upgrades
Now I’d like to ask about your plans for replacing energy using equipment at your site(s).
Q9. Do you plan to replace or upgrade any of your business’s energy-using equipment in the next two years? If so, which equipment?
[MULTIPLE RESPONSE] 1. Lighting 2. Heating 3. Cooling 4. Refrigeration 5. Does not plan to replace or upgrade any equipment
[Do not read:] 96. Other, please specify: [OPEN-ENDED RESPONSE] 98. Don't know

Small Business Energy Advantage (SBEA) Process Evaluation
Data Collection Instruments | Page A-32
99. Refused
[IF Q9 = 1 (LIGHTING) OR 2 (HEATING) OR 3 (COOLING) OR 4 (REFRIGERATION)]
Q10. Do you plan to replace or upgrade any of that equipment using more energy efficient equipment, which typically costs more than standard equipment? If so, which ones?
[MULTIPLE RESPONSE] 1. Lighting 2. Heating 3. Cooling 4. Refrigeration 5. None of the above
[Do not read:] 96. Other, please specify: [OPEN-ENDED RESPONSE] 98. Don't know 99. Refused
[IF Q10 = 1 (LIGHTING) OR 2 (HEATING) OR 3 (COOLING) OR 4 (REFRIGERATION)]
Q11. Do you plan to apply for any utility or other incentives to help pay for…
[if only one selected] that upgrade?
[if more than one selected] any of those upgrades?
[SINGLE RESPONSE] 1. Yes 2. No
[Do not read:] 96. Other, please specify: [OPEN-ENDED RESPONSE] 98. Don't know 99. Refused
[IF Q9 = 1 (LIGHTING) OR 2 (HEATING) OR 3 (COOLING) OR 4 (REFRIGERATION)]
Q12. How would you pay your cost of the replacement(s) or upgrade(s)?
[MULTIPLE RESPONSE] 1. Company cash reserves 2. Credit card 3. Bank financing or line of credit 4. Utility financing
[Do not read:] 96. Other, please specify: [OPEN-ENDED RESPONSE] 98. Don't know 99. Refused

Small Business Energy Advantage (SBEA) Process Evaluation
Data Collection Instruments | Page A-33
[IF Q9 = 2 (HEATING)]
Q13. You said you plan to replace or upgrade your heating equipment. On a scale of zero to ten, to what degree is that because of concerns that your current heating system might fail? Zero means not at all and ten means to a great degree.
[IF Q9 = 3 (COOLING)]
Q14. You said you plan to replace or upgrade your air conditioning equipment. On a scale of zero to ten, to what degree is that because of concerns that your current air conditioning might fail? Zero means not at all and ten means to a great degree.
[IF Q9 = 4 (REFRIGERATION)]
Q15. You said you plan to replace or upgrade your refrigeration equipment. On a scale of zero to ten, to what degree is that because of concerns that your current refrigeration might fail? Zero means not at all and ten means to a great degree.
[PROGRAMMER: INSERT 0-10 SCALE, WITH DK, FOR THE ABOVE THREE QUESTIONS]
A.6.6. Awareness
[ASK ALL]
Q16. Before I called you, were you aware that [UTILITY] provides cash incentives to reduce the cost of energy efficient building upgrades for eligible small businesses?
[SINGLE RESPONSE] 1. Yes 2. No
[Do not read:] 98. Don't know 99. Refused
[ASK ALL]
Q17. And were you aware that [UTILITY] provides zero percent financing for energy efficient building upgrades for eligible small businesses?
[SINGLE RESPONSE] 1. Yes 2. No
[Do not read:] 98. Don't know 99. Refused
[IF EITHER (COMPANY EITHER OWNS SPACE OR IS RESPONSIBLE FOR EQUIPMENT MAINTENANCE/UPKEEP AND HAS NOT UPGRADED AND DOES NOT PLAN TO UPGRADE/REPLACE) OR (PLANS TO UPGRADE/REPLACE BUT NOT WITH EE EQUIPMENT) –

Small Business Energy Advantage (SBEA) Process Evaluation
Data Collection Instruments | Page A-34
((Q2=1 (COMPANY OWNS) OR Q4 = 1 (RESPONSIBLE FOR LIGHTING)) AND Q6 <> 1 (LIGHTING) AND Q9 <> 1 (LIGHTING)) OR
((Q2=1 (COMPANY OWNS) OR Q4 = 2 (RESPONSIBLE FOR HEATING/COOLING)) AND Q6 <> 2 (HEATING OR COOLING) AND Q9 <> 2 (HEATING OR COOLING)) OR
((Q2=1 (COMPANY OWNS) OR Q4 = 3 (RESPONSIBLE FOR REFRIGERATION)) AND Q6 <> 3 (REFRIGERATION) AND Q9 <> 3 (REFRIGERATION)) OR
(Q9 = 1 (LIGHTING) AND Q10 <> 1 (LIGHTING)) OR
(Q9 = 2 (HEATING OR COOLING) AND Q10 <> 2 (HEATING OR COOLING)) OR
(Q9 = 3 (REFRIGERATION) AND Q10 <> 4 (REFRIGERATION))
READ FOLLOWING SCRIPT AND ASK Q18-Q20]
With efficiency upgrades made through the [UTILITY] small business program, your monthly loan payment and energy costs together may be lower than your energy costs alone were before you installed the high-efficiency equipment.
[PROGRAMMER: INSERT 0-10 SCALE FOR Q18-Q20]
Q18. On a scale of zero to ten, where zero is not at all likely and ten is highly likely, how likely would you be to use the program’s incentives and financing to install more efficient equipment if it reduced your overall monthly expenses and you could pay off the loan in two years?
Q19. And how likely would you be to use the program’s incentives and financing to install more efficient equipment if it reduced your overall monthly expenses but it would take four years to pay off the loan? [If needed: Please use the same scale]
Q20. And how likely would you be to use the program’s incentives and financing to install more efficient equipment if it reduced your overall monthly expenses but it would take more than four years to pay off the loan? [If needed: Please use the same scale]
[IF Q18 < 8 OR Q19 < 8 OR Q20 < 8]
Q21. What would keep you from using the program’s incentives and financing to do efficient equipment upgrades? [Interviewer: After each response, ask, “what else?” until respondent says there is no other reason. If respondent says something like “don’t have capacity,” try to clarify – time, money, staff, something else?]
[MULTIPLE RESPONSE] 1. Does not want to take on any debt 2. May not be in business for much longer 3. Does not like dealing with the utility 4. Is not concerned about energy usage 5. Does not have time to deal with it 6. Does not have staff to deal with it
[Do not read:] 96. Other, please specify: [OPEN-ENDED RESPONSE] 98. Don't know

Small Business Energy Advantage (SBEA) Process Evaluation
Data Collection Instruments | Page A-35
99. Refused
[ASK IF Q21=1]
Q22. And just to confirm, you would not want to take on any debt, even if it were at zero percent interest and would reduce your monthly costs?
[SINGLE RESPONSE] 1. Yes 2. No
[Do not read:] 98. Don't know 99. Refused
[ASK IF Q18 = 8, 9, OR 10 OR Q19 = 8, 9, OR 10 OR Q20 = 8, 9, OR 10]
[PROGRAMMER: INSERT 0-10 SCALE FOR Q23]
Q23. You said you might use the program’s incentives and zero percent financing to install more efficient equipment. How likely would you be to use the program’s incentives and financing at two percent interest financing rather than zero? Please use the same 0-to-10 scale as before.
[ASK IF Q2=1 (COMPANY OWNS SPACE) OR Q3=1 (COMPANY PAYS ENERGY COSTS)]
Q24. Do you know, more or less, what you pay each month for electricity at your site [OR IF Q1=2 (MULTIPLE SITES) “sites”]?
[Interviewer: We are not asking them to report what they pay, just whether or not they know what they pay]
[SINGLE RESPONSE] 1. Yes 2. No
[Do not read:] 98. Don't know 99. Refused
Q25. If you had to guess, [IF Q1=2 (MULTIPLE SITES) “across all your sites,”] by what percentage do you think you could reduce your electricity costs by replacing your lighting with high-efficiency lighting?
1. [OPEN-ENDED RESPONSE] 98. Don't know 99. Refused
[ASK IF Q2=1 OR Q4=1 OR Q4=2 (COMPANY IS RESPONSIBLE FOR MAINTENANCE/UPKEEP OF EQUIPMENT)]
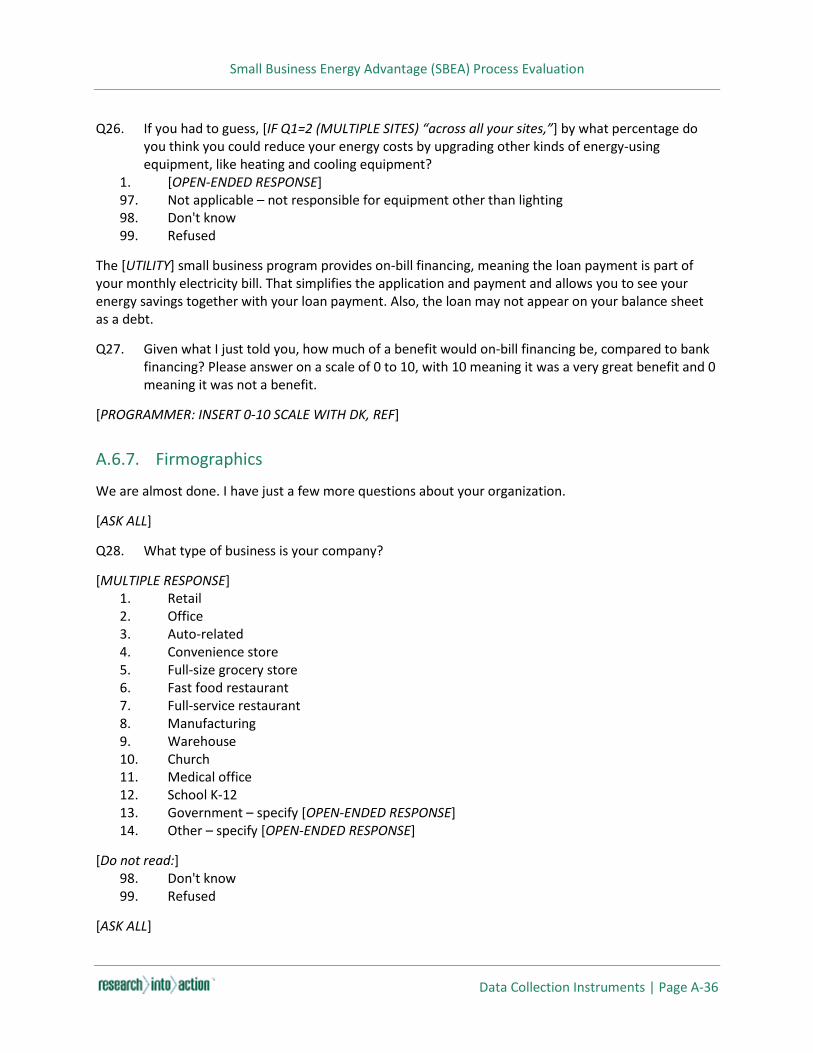
Small Business Energy Advantage (SBEA) Process Evaluation
Data Collection Instruments | Page A-36
Q26. If you had to guess, [IF Q1=2 (MULTIPLE SITES) “across all your sites,”] by what percentage do you think you could reduce your energy costs by upgrading other kinds of energy-using equipment, like heating and cooling equipment?
1. [OPEN-ENDED RESPONSE] 97. Not applicable – not responsible for equipment other than lighting 98. Don't know 99. Refused
The [UTILITY] small business program provides on-bill financing, meaning the loan payment is part of your monthly electricity bill. That simplifies the application and payment and allows you to see your energy savings together with your loan payment. Also, the loan may not appear on your balance sheet as a debt.
Q27. Given what I just told you, how much of a benefit would on-bill financing be, compared to bank financing? Please answer on a scale of 0 to 10, with 10 meaning it was a very great benefit and 0 meaning it was not a benefit.
[PROGRAMMER: INSERT 0-10 SCALE WITH DK, REF]
A.6.7. Firmographics
We are almost done. I have just a few more questions about your organization.
[ASK ALL]
Q28. What type of business is your company?
[MULTIPLE RESPONSE] 1. Retail 2. Office 3. Auto-related 4. Convenience store 5. Full-size grocery store 6. Fast food restaurant 7. Full-service restaurant 8. Manufacturing 9. Warehouse 10. Church 11. Medical office 12. School K-12 13. Government – specify [OPEN-ENDED RESPONSE] 14. Other – specify [OPEN-ENDED RESPONSE]
[Do not read:] 98. Don't know 99. Refused
[ASK ALL]

Small Business Energy Advantage (SBEA) Process Evaluation
Data Collection Instruments | Page A-37
Q29. Does any equipment in your properties [IF Q1=2 (MULTIPLE SITES) “properties”] use natural gas?
[MULTIPLE RESPONSE] 1. Yes 2. No
[Do not read:] 98. Don't know 99. Refused
[ASK ALL]
Q30. How many employees does your company have? 1. [OPEN-ENDED RESPONSE] 98. Don't know 99. Refused
[ASK ALL]
Q31. What is the ownership structure of your organization? Is it a:
[Read] [SINGLE RESPONSE] 1. Privately owned by a person(s) or company 2. Franchise owned by a person 3. Corporate owned franchise 4. Regional or national chain
[Do not read:] 98. Don't know 99. Refused
[ASK ALL]
Q32. Are there any professional, community, or cultural associations whose opinions you would trust when making decisions about equipment upgrades? If so, who are they?
[SINGLE RESPONSE] 1. [OPEN-ENDED RESPONSE] 2. No 98. Don't know 99. Refused
Those are all the questions I have for you. Thank you for your time.