Embed Size (px)
Citation preview

Connecticut Commission on Children
2014 Annual & RBA Report


February 10, 2015
Appropriations Committee
Connecticut General Assembly
Room 2700
Legislative Office Building
Hartford, CT 06106
Dear Senator Bye, Representative Walker, and members of the Appropriations Committee:
Pursuant to Section 46a-129 of the Connecticut General Statutes, you will find herein the
Commission on Children’s 2014 Results-Based Accountability (RBA) Report Card and Annual
Report.
We thank you again for the opportunity to lead in coordination and best practices for
children. If you have any questions, feel free to contact us at 860-240-0290.
Sincerely,
George Coleman Elaine Zimmerman
Chairman Executive Director
cc: Governor Dannel P. Malloy
Clerk of the Senate
Clerk of the House of Representatives
Connecticut State Library
Legislative Library, Connecticut General Assembly
State of Connecticut GENERAL ASSEMBLY
Commission on Children


Table of Contents Introduction ............................................................................................................................................................... 5
Commission on Children Performance Report, 2014................................................................................. 7
Approach 1: Research and Model Policy ................................................................................................. 7
Approach 2: Education and Outreach ...................................................................................................... 9
Approach 3: Partnership Development .................................................................................................10
Approach 4: Family Civic Engagement ...................................................................................................12
Approach 5: Resource and Partnership Maximization .....................................................................13
Result—Children Are Safe and Healthy .........................................................................................................15
Indicator 1: Children Remain Safe in Natural and Unnatural Disasters .....................................15
Indicator 2: Mental Health ..........................................................................................................................19
Indicator 3: Child Obesity............................................................................................................................22
Indicator 4: Youth Concussions .................................................................................................................26
Indicator 5: Home Visitation .....................................................................................................................31
Result—Children and Youth Are Ready for School and Succeed in School ....................................35
Indicator 1: Preschool Enrollment and Early Education ...................................................................35
Indicator 2: Reading ......................................................................................................................................38
Indicator 3: Chronic Absence .....................................................................................................................42
Indicator 4: School Climate ........................................................................................................................45
Indicator 5: Achievement Gap ...................................................................................................................48
Result — Parents Are Engaged and Informed about Children’s Programs and Policies ............50
Indicator 1: Family Civic Engagement ....................................................................................................51
Indicator 2: Parent Involvement in Schools ..........................................................................................55
Result—No Child Lives in Poverty ...................................................................................................................57
Indicator 1: Child Poverty ............................................................................................................................58
Indicator 2: Hunger .......................................................................................................................................59
Indicator 3: Parents with a High School Degree – Two-Generational Strategy ......................62
Result—Programs that Serve Children and Youth Are Measured for Accountability ..................67
Indicator 1: Children’s Report Card .........................................................................................................67
Indicator 2: Return on Investment (Results First) ...............................................................................69
Indicator 3: Setting the National Standard for Family Civics .........................................................70
Keeping the Public Fully Informed on Issues and Policies Regarding Children and Families ...73
The Web ............................................................................................................................................................73
Webinars............................................................................................................................................................74
Social Media .....................................................................................................................................................74
News Media .....................................................................................................................................................75
Commission Honors in 2014: A Sampler ......................................................................................................77
Commission on Children Members and Staff, 2014 .................................................................................79

4

5
Introduction
This report focuses on five core strategies pursued by the Commission on Children in 2014:
research and model policy, education and outreach, partnership development, family civics, and
revenue generation. We strive to ensure best practices, build authentic community capacity,
engage state and national partners, maximize a return on investment, and promote positive
change for children and youth. Highlights of the work include:
Developing a WorkPath Fund in partnership with the Liberty Bank Foundation and the
regional Workforce Boards. The Fund helps low-income parents pay for some of the
unexpected costs of a job, such as car repairs, tools, and license fees.
Participating in a White House conference to showcase our successful parent leadership
work, and explore how to measure and replicate quality family engagement around the
country.
Forging a partnership with Yale University and Lady Gaga’s Born This Way Foundation to
improve school climate and help students build social and emotional skills.
Facilitating the creation of the first two-generational state policy and plan in the nation to
concurrently build school and workforce readiness. Initiated with the co-chairs of the General
Assembly’s Appropriations Committee, this policy was highlighted by the National
Conference of State Legislatures (NCSL) and the National Governors Association (NGA) as a
best state practice.
Leading a legislative Task Force on Youth Athletics and Concussions, which was assigned to
develop a plan to reduce concussions among our young sports players in informal settings,
such as recreation leagues and youth club sports. The plan, informed by leaders and experts
in health and youth sports, promotes best practice and safety for all youth athletic settings.
Staffing the Achievement Gap Task Force as it developed a five- year plan for closing the
achievement gap both inside and outside of the schoolhouse, within community and family,
and in government and higher education. Thirty agencies have agreed to partner on various
components of the report’s recommendations.
Facilitating significant reading gains in low-performing schools, using scientific based
interventions. In partnership with the legislature’s Black and Puerto Rican Caucus, we
ensured the hiring of a director of literacy initiatives at the State Department of Education to
provide a systemic response to the achievement gap in reading.
Enclosed you will find a Results-based Accountability (RBA) performance report, followed by details
of our work within specific policy domains.

6

7
Commission on Children Performance Report, 2014
Approach 1: Research and Model Policy
The Commission on Children performs pertinent research on current trends impacting children
and families and shares the research findings with the legislature and the public. We work on
best policy practice and help draft model policy for children and youth with the Legislature.
Major Commission-Supported Bills Adopted into Law:
Two-Generational Policy: Section 198 of House Bill No. 5597, An Act Implementing Provisions
Of The State Budget For The Fiscal Year Ending June 30, 2015.
School Climate, Social and Emotional: Substitute Senate Bill No. 106, An Act Concerning
Improving Employment Opportunities Through Education And Ensuring Safe School Climates.
Signed into law as Public Act No. 14-172, An Act Concerning Improvement Opportunities
Through Education and Ensuring Safe School Climates.
Concussions: Raised H.B. No. 5113, An Act Concerning Youth Athletics and Concussions
Signed into law as Public Act No. 14-66.
OEC and Dyslexia: Raised H.B. No. 5562, An Act Establishing The Office Of Early Childhood,
Expanding Opportunities For Early Childhood Education And Concerning Dyslexia And Special
Education. Signed into law as Public Act No. 14-39.
2015 Specific Budget Policy Allocations:
SDE Director of Reading Initiatives Funding
K-3 Reading Continued Funding

8
Studies, focus groups, and reports on child and family issues that were done by the
Commission on Children or commissioned by it, in partnership with key stakeholders :
“A Draft Theory of Change on Parent Leadership,” commissioned for the RMC Research
Corporation and Anne Henderson, in partnership with the Peppercorn and Hagedorn
foundations. Drafts in circulation.
Curriculum for parents with children in kindergarten through grades three on early reading
success, focused on vocabulary, dialogic communications, and using community civic
canopies as literacy resources. Written by Executive Director Elaine Zimmerman and Margie
Gillis of Literacy How, Fall 2014.
“A Sampler of Connecticut Parent Leadership Training,” by Director of Parent Engagement and
Family Policy, Dawn Homer-Bouthiette, July 2014.
“Annual Evaluation of the Impact of the Parent Leadership Training Institute (PLTI),” published
by the RMC Research Corporation, August 2014.
“A Two-Generational Approach: Helping Parents Work and Children Thrive,” a report of the
Commission-led Two-Generational Policy Work Group, December 2014.
“A Master Plan to Eliminate the Achievement Gap in Connecticut,” a report of the
Achievement Gap Task Force, staffed by the Commission on Children, April 2014.
“Connecticut K-3 Reading Pilot,” an ongoing study conducted in selected schools and Alliance
Districts by the Neag School of Education at the University of Connecticut, in partnership with
the Commission, Literacy How, and others.
“Goals in Social Media for Parents,” a focus group on how parents wish to use social media to
improve child outcomes, conducted by Elaine Zimmerman and Communications Director
Kevin Flood as part of the first-annual Parent Leadership Conference at the Legislative Office
Building in Hartford, October, 2014.
“How Youth Lead in School Climate Change,” a focus group with schools and youth leaders,
led by the Commission on Children and Yale University at Yale, June 2014
“Task Force on Youth Concussions Preliminary Report and Recommendations,” written by
Director of Development and Special Initiatives Mary Kate Lowndes on behalf of the Task
Force, December 2014.

9
Approach 2: Education and Outreach
The Commission on Children educates the public on child development and public policy issues in
the areas of child health and safety, learning, economic self-sufficiency and access equity, family
strength, and overall social health.
59,258 Page views in 2014 on the Commission website, www.cga.ct.gov/coc.
15,041 Subscribers to Commission newsletters, excluding legislators and staff.
594 Files added to the Commission website, including pages, PDF documents,
photos, and audio and video files.
46 News reports, newsletters and/or releases highlighting the Commission’s work
780 Facebook followers
816 Twitter followers
7 Meetings televised on the Connecticut Network (CT-N)
7 Staff-produced videos uploaded to YouTube
3 Webinar presentations (Grantmakers for Children, Youth and Family, April 22;
Help Me Grow, August 26; and Ascend at the Aspen Institute, November 7.)
3
Professional-grade video projects: one on parent leadership, produced in
conjunction with the National Parent Leadership Institute (NPLI); one using
footage shot at a Commission-moderated workshop for LGBTQ middle-school,
high-school, and college students at the University of Connecticut; and one in
which Parent Leadership Training Institute (PLTI) graduates were interviewed on
civic-leadership skills by the Connecticut Network (CT-N).

10
Approach 3: Partnership Development
The Commission on Children performs its functions through substantive partnerships with
educators, families, state and town officials, youth leaders, scholars, the business sector, the
news media, nonprofits, researchers, religious communities, and health and public safety
professionals.
We held dozens of informational meetings and events with these partners across the state, in a
variety of settings. As this partial list demonstrates, the topics were diverse but always vital to
the interests of Connecticut children and families:
January 31 – News conference with Governor Malloy, Liberty Bank Foundation, Workforce
Alliance, and the five Connecticut Workforce Investment Boards to announce the launch of the
WorkPath Fund, an initiative created by the Commission with the above listed partners, to
reduce the quiet costs of new employment for low-income parents such as car repair, tools,
uniforms, license fees..
February 25 – “A Night with Secretary of the State Denise Merrill,” held at the state Capitol for
alumni of the Commission-led Parent Leadership Training Institute (PLTI) and Parents Supporting
Educational Excellence (Parents SEE), in celebration of National Parent Leadership Month.
March 13 – “The Natural Leader: Bringing Out the Best from Within,” a workshop for fathers and
family men promoting parent leadership at the 15th-annual New England Fathering Conference
in Newport, Rhode Island.
March 21 – “The Speak Your Mind Tour,” a workshop moderated by the Commission and the
Anti-Defamation League at the annual True Colors conference, which was held at the University
of Connecticut in Storrs. The workshop allowed LGBTQ middle-school, high-school, and college
students to candidly discuss their lives.
April 8 – “Turning the Curve in Reading,” a public forum the Commission co-hosted with the
Connecticut Achievement Gap Task Force and the legislature’s Black and Puerto Rican Caucus.
The forum focused on the costs of the reading achievement gap in Connecticut, the latest
research, and what must be done to close the gap.
April 23 – The state’s Child Emergency Preparedness Committee, co-chaired by Commission
Director of Development and Special Initiatives Mary Kate Lowndes, convened to assess the
progress linking child care providers and emergency management local leaders throughout the
state, and to finalize injects for Governor’s statewide emergency exercise.
11
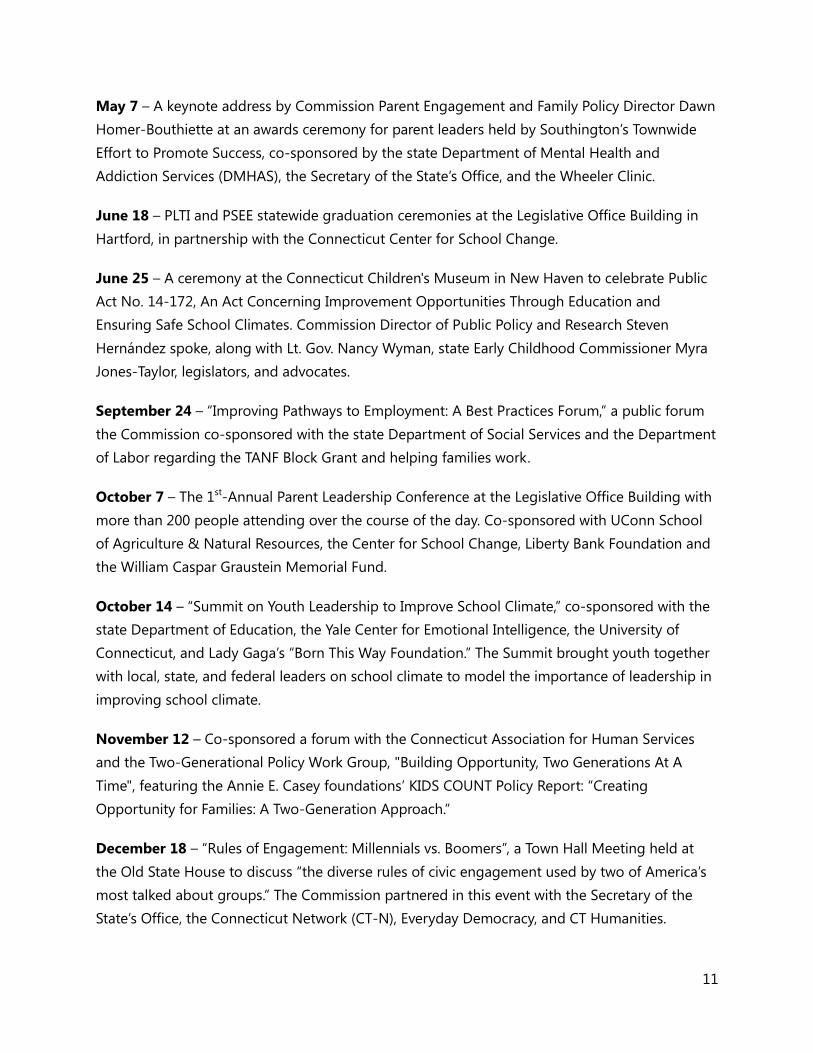
May 7 – A keynote address by Commission Parent Engagement and Family Policy Director Dawn
Homer-Bouthiette at an awards ceremony for parent leaders held by Southington’s Townwide
Effort to Promote Success, co-sponsored by the state Department of Mental Health and
Addiction Services (DMHAS), the Secretary of the State’s Office, and the Wheeler Clinic.
June 18 – PLTI and PSEE statewide graduation ceremonies at the Legislative Office Building in
Hartford, in partnership with the Connecticut Center for School Change.
June 25 – A ceremony at the Connecticut Children's Museum in New Haven to celebrate Public
Act No. 14-172, An Act Concerning Improvement Opportunities Through Education and
Ensuring Safe School Climates. Commission Director of Public Policy and Research Steven
Hernández spoke, along with Lt. Gov. Nancy Wyman, state Early Childhood Commissioner Myra
Jones-Taylor, legislators, and advocates.
September 24 – “Improving Pathways to Employment: A Best Practices Forum,” a public forum
the Commission co-sponsored with the state Department of Social Services and the Department
of Labor regarding the TANF Block Grant and helping families work.
October 7 – The 1st-Annual Parent Leadership Conference at the Legislative Office Building with
more than 200 people attending over the course of the day. Co-sponsored with UConn School
of Agriculture & Natural Resources, the Center for School Change, Liberty Bank Foundation and
the William Caspar Graustein Memorial Fund.
October 14 – “Summit on Youth Leadership to Improve School Climate,” co-sponsored with the
state Department of Education, the Yale Center for Emotional Intelligence, the University of
Connecticut, and Lady Gaga’s “Born This Way Foundation.” The Summit brought youth together
with local, state, and federal leaders on school climate to model the importance of leadership in
improving school climate.
November 12 – Co-sponsored a forum with the Connecticut Association for Human Services
and the Two-Generational Policy Work Group, "Building Opportunity, Two Generations At A
Time", featuring the Annie E. Casey foundations’ KIDS COUNT Policy Report: “Creating
Opportunity for Families: A Two-Generation Approach.”
December 18 – “Rules of Engagement: Millennials vs. Boomers”, a Town Hall Meeting held at
the Old State House to discuss “the diverse rules of civic engagement used by two of America’s
most talked about groups.” The Commission partnered in this event with the Secretary of the
State’s Office, the Connecticut Network (CT-N), Everyday Democracy, and CT Humanities.
12
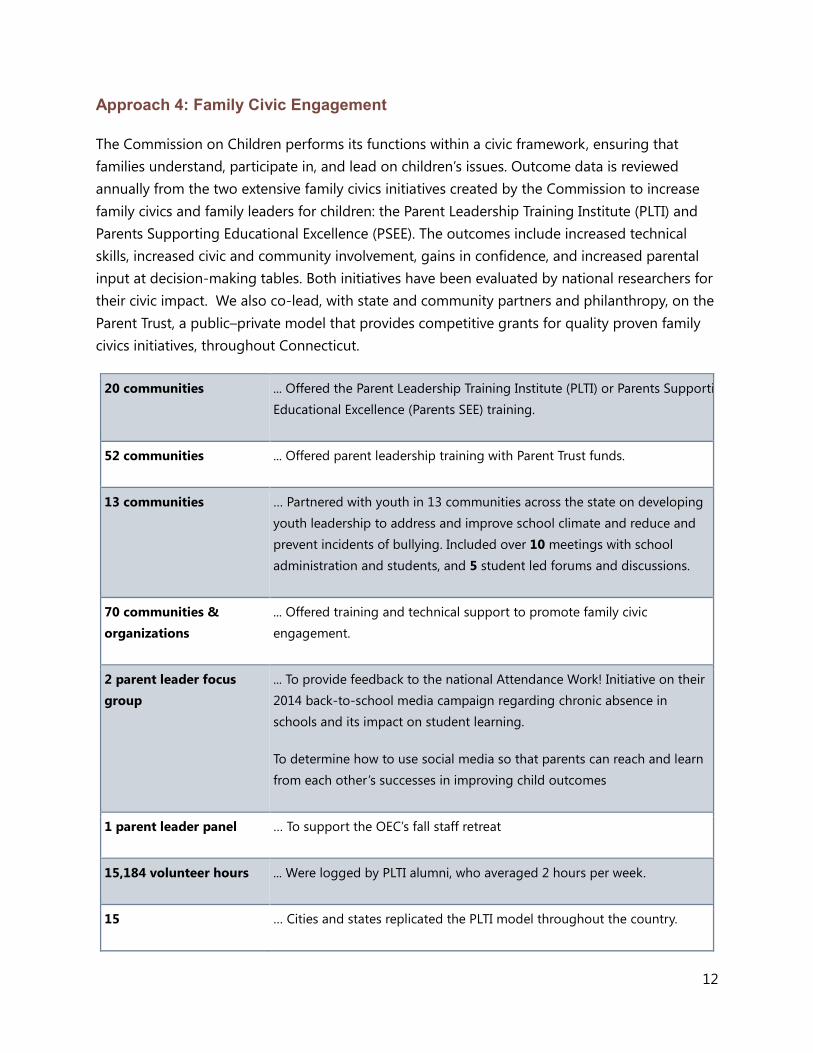
Approach 4: Family Civic Engagement
The Commission on Children performs its functions within a civic framework, ensuring that
families understand, participate in, and lead on children’s issues. Outcome data is reviewed
annually from the two extensive family civics initiatives created by the Commission to increase
family civics and family leaders for children: the Parent Leadership Training Institute (PLTI) and
Parents Supporting Educational Excellence (PSEE). The outcomes include increased technical
skills, increased civic and community involvement, gains in confidence, and increased parental
input at decision-making tables. Both initiatives have been evaluated by national researchers for
their civic impact. We also co-lead, with state and community partners and philanthropy, on the
Parent Trust, a public–private model that provides competitive grants for quality proven family
civics initiatives, throughout Connecticut.
20 communities ... Offered the Parent Leadership Training Institute (PLTI) or Parents Supporting
Educational Excellence (Parents SEE) training.
52 communities ... Offered parent leadership training with Parent Trust funds.
13 communities … Partnered with youth in 13 communities across the state on developing
youth leadership to address and improve school climate and reduce and
prevent incidents of bullying. Included over 10 meetings with school
administration and students, and 5 student led forums and discussions.
70 communities &
organizations
... Offered training and technical support to promote family civic
engagement.
2 parent leader focus
group
... To provide feedback to the national Attendance Work! Initiative on their
2014 back-to-school media campaign regarding chronic absence in
schools and its impact on student learning.
To determine how to use social media so that parents can reach and learn
from each other ’s successes in improving child outcomes
1 parent leader panel … To support the OEC’s fall staff retreat
15,184 volunteer hours ... Were logged by PLTI alumni, who averaged 2 hours per week.
15 … Cities and states replicated the PLTI model throughout the country.
13
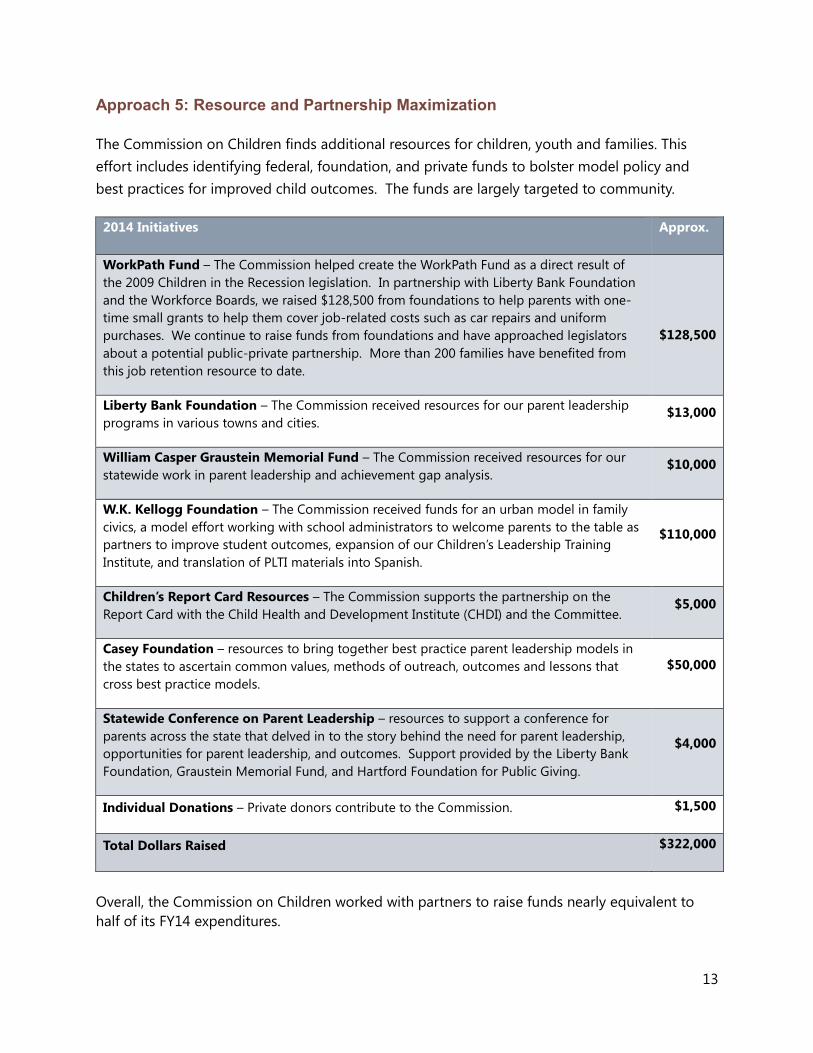
Approach 5: Resource and Partnership Maximization
The Commission on Children finds additional resources for children, youth and families. This
effort includes identifying federal, foundation, and private funds to bolster model policy and
best practices for improved child outcomes. The funds are largely targeted to community.
2014 Initiatives Approx.
WorkPath Fund – The Commission helped create the WorkPath Fund as a direct result of
the 2009 Children in the Recession legislation. In partnership with Liberty Bank Foundation
and the Workforce Boards, we raised $128,500 from foundations to help parents with one-
time small grants to help them cover job-related costs such as car repairs and uniform
purchases. We continue to raise funds from foundations and have approached legislators
about a potential public-private partnership. More than 200 families have benefited from
this job retention resource to date.
$128,500
Liberty Bank Foundation – The Commission received resources for our parent leadership
programs in various towns and cities. $13,000
William Casper Graustein Memorial Fund – The Commission received resources for our
statewide work in parent leadership and achievement gap analysis. $10,000
W.K. Kellogg Foundation – The Commission received funds for an urban model in family
civics, a model effort working with school administrators to welcome parents to the table as
partners to improve student outcomes, expansion of our Children’s Leadership Training
Institute, and translation of PLTI materials into Spanish.
$110,000
Children’s Report Card Resources – The Commission supports the partnership on the
Report Card with the Child Health and Development Institute (CHDI) and the Committee. $5,000
Casey Foundation – resources to bring together best practice parent leadership models in
the states to ascertain common values, methods of outreach, outcomes and lessons that
cross best practice models.
$50,000
Statewide Conference on Parent Leadership – resources to support a conference for
parents across the state that delved in to the story behind the need for parent leadership,
opportunities for parent leadership, and outcomes. Support provided by the Liberty Bank
Foundation, Graustein Memorial Fund, and Hartford Foundation for Public Giving.
$4,000
Individual Donations – Private donors contribute to the Commission. $1,500
Total Dollars Raised $322,000
Overall, the Commission on Children worked with partners to raise funds nearly equivalent to
half of its FY14 expenditures.

14

15
Result—Children Are Safe and Healthy
The story behind the baseline: Increasingly, children are exposed to both natural and unnatural
disaster in the United States. Natural disaster includes floods, storms, and hurricanes. Connecticut
has experienced significant damage from hurricanes, snow, and ice storms. Unexpected results have
included loss of homes and businesses, including child care centers closing down.
Unnatural disasters include mass shootings. December 14, 2012 was an unnatural disaster that
brought loss of life and child trauma, which ultimately led to both education and health safety
reforms. This was compounded by 22 deadly school shootings throughout the states since
Newtown, and severe acts of terrorism in our neighbor state of Massachusetts.1
After 12/14, Connecticut refocused its efforts, through increased attention to child and youth mental
health, furthered understanding of assessment and trauma, enhanced structural responses to
prevent and/or respond to disaster, and continued exploration of model policy to protect our
communities.
Indicator 1: Children Remain Safe in Natural and Unnatural Disasters
Disaster preparedness, response, and recovery are essential to ensuring child safety. Child care
programs and schools provide a foundation for young children’s physical, emotional, and
cognitive well-being, and are essential to community recovery in the aftermath of an emergency.
The ability of child care facilities and schools to re-open following a disaster is vital to returning
to “normal” and jump-starting local economies.
While 2014 was nowhere as severe as 2013 for natural or unnatural disaster, several lesser
storms throughout the year left many families homeless. When it comes to protecting children
in such events, our state has had a head start in recent years, thanks to a first-in-the-nation law
requiring that the needs of children be incorporated in disaster planning. The Commission on
Children, which played a pivotal role in adoption of the legislation, co-chairs an inter-agency
committee that seeks to ensure the requirement is met.
1 This number only tracks deadly shooting where the shooter killed at least one person. When other gun related
incidents are taken into account, including where a shooter discharged firearm on school property, injured at least one person but did not kill anyone, attempted but did not complete suicide, and committed suicide, the total number is closer to 94 as January 27, 2015. Source: Everytown for Gun Safety, http://everytown.org/article/schoolshootings/.
16
In 2014, the Connecticut Department of Public Health, United Way 211 Child Care, and the
Office of Early Childhood continued to provide emergency preparedness training to protect and
support children, their families, and child care providers before, during, and after emergencies.
The Emergency Preparedness Guidelines flipchart for Child Care Providers has been distributed
to over 5,200 licensed child care providers and local health departments, is available in English
and Spanish, and can be accessed on the DPH web site.
Public Act 13-3, An Act Concerning Gun Violence Prevention and Children’s Safety, contains a
number of provisions related to school safety and security. The Commission has helped to
translate these provisions in to templates and trainings for schools to use across our state.
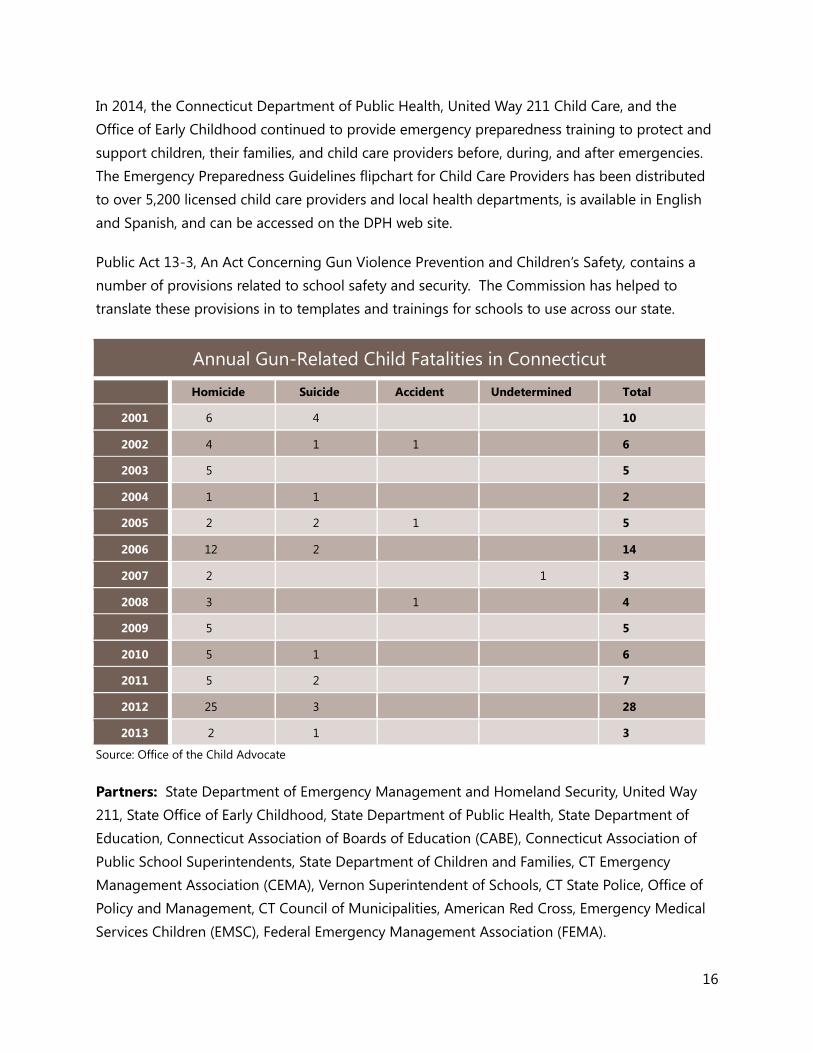
Annual Gun-Related Child Fatalities in Connecticut
Homicide Suicide Accident Undetermined Total
2001 6 4 10
2002 4 1 1 6
2003 5 5
2004 1 1 2
2005 2 2 1 5
2006 12 2 14
2007 2 1 3
2008 3 1 4
2009 5 5
2010 5 1 6
2011 5 2 7
2012 25 3 28
2013 2 1 3
Source: Office of the Child Advocate
Partners: State Department of Emergency Management and Homeland Security, United Way
211, State Office of Early Childhood, State Department of Public Health, State Department of
Education, Connecticut Association of Boards of Education (CABE), Connecticut Association of
Public School Superintendents, State Department of Children and Families, CT Emergency
Management Association (CEMA), Vernon Superintendent of Schools, CT State Police, Office of
Policy and Management, CT Council of Municipalities, American Red Cross, Emergency Medical
Services Children (EMSC), Federal Emergency Management Association (FEMA).
17
What the Commission did in 2014:
Continued to Co-Chair the statewide, cross-agency Child Emergency Preparedness
Committee (CEPC), the goal of which is to identify gaps and intentionally include children in
all disaster prevention and recovery planning and activities;
Worked in partnership with DEMHS and others to develop an all-hazards school plan
template and guidance, and support training of school personnel and day care providers;
Through the CEPC, supported the development and delivery of school emergency planning
workshops in accordance with the school emergency planning standards outlined in Public
Act 13-3. The two-day workshops were conducted around the state, and over 130
individuals representing 50 school districts participated;
Supported the creation and delivery of the first training developed and delivered by a local
emergency management director (Waterbury), adding impetus to ensuring linkages between
local emergency management and local child care;
Met with canine response volunteers and is working with them, DEMHS and DEMHAS to
incorporate them within the statewide disaster response system, as a resource for schools,
children, first responders, and others. This stems from the successful use of canine response
volunteers in Newtown, Milford and in Cheshire after disasters.
Participated in the Governor’s annual emergency planning and preparedness initiative (EPPI)
exercise, working as part of a team to (1) develop exercise injects meant to stimulate
conversation and planning around events that impact children and families before, during
and after a disaster, and (2) be a voice for children at the table in the Emergency Operations
Center during the actual EPPI exercise; and
Worked with United Way 211, the state Department of Public Health, and DEMHS to utilize
results of pilot assessment of a child care center disaster planning and risk reduction to
compile resource for child care centers statewide.
Worked with Capitol Region Council of Governments (CCROG) and schools throughout the
Region to share with school administrators the requirements from Public Act No. 13-3
regarding school security planning and training as well as resources.

18
75 75 100
420
257
118
20
0
50
100
150
200
250
300
350
400
450
2008 2009 2010 2011 2012 2013* 2014**
Connecticut Child Care Providers Trained in Disaster
Preparedness and Response
What remains to be done:
Co-chair and partner, through the statewide Child Emergency Planning Committee, to
explore disaster-related gaps vis-à-vis children and potential solutions including emergency
planning.
Continue to expand alignment between all first responders and information regarding
location of child care settings, non-traditional school settings, summer camps, temporary
foster care settings and other sites where children are located that are not a traditional part
of an organized data system.
*Connecticut's grant from Save the Children to conduct emergency preparedness and response trainings with child-care
providers ended in 2012. The state continues to dedicate funding to this critical initiative but cannot match the level of the
Save the Children grant. **
** The 2014 total includes 15 providers trained in emergency preparedness and response through Waterbury Emergency
Management Director training, developed in concert with Office of Early Childhood, United Way 211 Child Care, DEMHS, the
Commission on Children, and the Child Emergency Preparedness Committee; the remaining five were trained through CEPC.
The child care provider disaster preparedness and response trainings (OEC) were put on hold this year to revise curriculum,
incorporating feedback from training participants on what was and was not effective, incorporating the most up-to-date
emergency management science, and focusing more on the actual writing of a plan.
Sources: Connecticut Office of Early Childhood, the state Department of Emergency Management and Homeland Security
(DEMHS), the Waterbury Emergency Management Director, Child Emergency Preparedness Committee, and United Way 211
Child Care.

19
Share the United Way 211 child care map and online tool denoting location of child care
providers across the state, participation in statewide conferences, and regular outreach.
Widely disseminate the newly developed training for local emergency management
personnel and child care providers. This training also includes information on how to file
with FEMA for reimbursement for disaster-related damages, with special emphasis on
procedures pertaining to child care providers;
Continue to train child care providers statewide on how to make child care centers and
family day cares as safe as possible for children and staff, in a manner coordinated with the
training mentioned in bullet above;
Incorporate child-specific guidelines into all towns’ emergency shelter plans and guidelines,
including separate sleeping spaces for families with children, food considerations for
infants/toddlers/PK children, recreation spaces and kits/toys/resources for children at
shelters, and more;
Continue to work with local leaders and emergency response personnel to ensure they
factor children into their disaster planning. Utilize statewide DEMHS Advisory Council
meetings, CCM, EPPI planning, and year-long disaster planning.
Coordinate disaster planning and home visitation skills and resources, where trauma takes
place in families, resulting from natural or unnatural disaster.
Continue to offer school emergency planning trainings to staff and administrators through
regional DEMHS, CCROG and other regional organizations.
Work with DEMHS and DEMHAS to develop a system for incorporating the option of canine
response into disaster response planning;
Continue to work with emergency service providers statewide to ensure ambulances are
equipped with child-specific resources.
Indicator 2: Mental Health
Connecticut’s children and adolescents continue to experience a behavioral and mental health
crisis. There is a critical shortage of mental health and substance abuse prevention and
treatment services:
Twenty percent (156,000) of the approximately 783,000 children and adolescents in
Connecticut may have behavioral health symptoms that would benefit from treatment.2
2 Connecticut Children’s Behavioral Health Plan, prepared by the Child Health and Development Institute of
Connecticut, Inc. (CHDI), pursuant to Public Act 13-178, and submitted to Connecticut General Assembly on October 1, 2014.
20
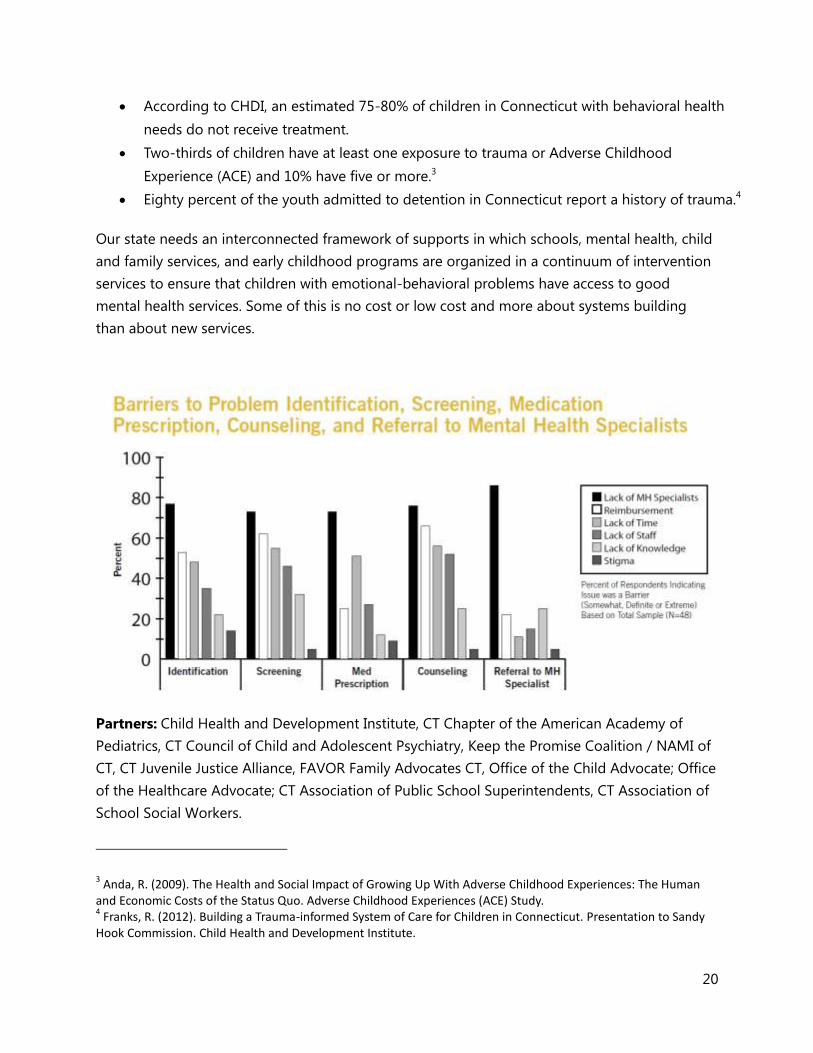
According to CHDI, an estimated 75-80% of children in Connecticut with behavioral health
needs do not receive treatment.
Two-thirds of children have at least one exposure to trauma or Adverse Childhood
Experience (ACE) and 10% have five or more.3
Eighty percent of the youth admitted to detention in Connecticut report a history of trauma.4
Our state needs an interconnected framework of supports in which schools, mental health, child
and family services, and early childhood programs are organized in a continuum of intervention
services to ensure that children with emotional-behavioral problems have access to good
mental health services. Some of this is no cost or low cost and more about systems building
than about new services.
Partners: Child Health and Development Institute, CT Chapter of the American Academy of
Pediatrics, CT Council of Child and Adolescent Psychiatry, Keep the Promise Coalition / NAMI of
CT, CT Juvenile Justice Alliance, FAVOR Family Advocates CT, Office of the Child Advocate; Office
of the Healthcare Advocate; CT Association of Public School Superintendents, CT Association of
School Social Workers.
3 Anda, R. (2009). The Health and Social Impact of Growing Up With Adverse Childhood Experiences: The Human
and Economic Costs of the Status Quo. Adverse Childhood Experiences (ACE) Study. 4 Franks, R. (2012). Building a Trauma-informed System of Care for Children in Connecticut. Presentation to Sandy
Hook Commission. Child Health and Development Institute.

21
What the Commission did in 2014:
Served on the Children’s Behavioral Health Plan Advisory Committee, created by the
Department of Children and Families with the Child Health and Development Institute of
Connecticut, Inc. (CHDI), to create a comprehensive mental health plan for children and
youth pursuant to Public Act 13-178.
Helped Child First continue to grow as a new and upcoming national model of home
visitation, reaching those with emotional and mental health issues early.
Worked with a team of community stakeholders, mental health experts, and legislators to
begin analysis on the needs for a public information campaign on children’s mental health,
attachment, and the importance of early connection between parent and child.
Served on the newly created Early Childhood Comprehensive Systems Advisory Committee,
comprised of state agencies, the United Way, and infant, toddler and early care experts to
bolster early childhood assessment and intervention. Funds were received from the federal
government for this work.
Drafted and worked to implement legislation for three Alliance School Districts to create an
age three to grade three model of social emotional work. Successfully arranged a
partnership with Yale University for this. Worked on a private donor plan to support the costs
of this innovation.
Served on the School Based Health Center (SBHC) Advisory Committee and Strategic Action
Group, exploring the role of SBHCs to coordinate mental health and physical health services
on school grounds.
What still needs to be done
Redesign how the public and private sector identify and respond to the mental health needs
of children and adolescents through innovative funding streams, such as the State
Innovation Model (SIM). Specifically, support efforts to improve accountability, consumer
engagement, and high quality of care, by: 1) developing of a comprehensive evidence-based
plan for improving population health; 2) strengthening primary care and integrating
community and clinical care; 3) value-based payment and insurance design; and 4) multi-
payer alignment on quality, health equity, and care experience measures.5
5 The State Innovation Model Initiative is a federal initiative to support the development and testing of state-
based models for multi-payer payment and health care delivery system transformation. In 2014, Connecticut was one of 11 states selected to receive SIM Test Grant Awards to improve population health, strengthen primary care, promote value-based payment and insurance design, and obtain multi-payer alignment on quality, health equity, and care experience measures. Connecticut will receive up to $45 million to implement a number of initiatives.

22
Design an infant mental health plan, to reach children before they enter the school system,
preventatively.
Create a family friendly mental health media campaign that works to de-stigmatize mental
health and social emotional challenges.
Bring research-based practice, prevention, and families as partners into our medical home
system to bolster our early interventions.
Ensure that parents know how to access information and referrals, can access information in
different languages and with cultural competence.
Promote school based early identification and screening efforts Increase the number of
school counselors and social workers. Increase School Based Health Centers , to offer both
mental and physical health services, with increased access and coordination.
Address the shortage of programs and staff with skills in mental health, particularly child and
youth psychiatrists.
Create a coordinated system of care, with more attention to trauma-informed practice.
Ensure that schools, including preschools, have school climate plans.
Indicator 3: Child Obesity
The story behind the baseline: Obesity continues to be one of the most serious public health
concerns facing our state. It reduces the productivity of our state’s economy, places an
unsustainable burden on our health care system, and disables workers. (reference at bottom )
The annual health care costs of obesity-related illness are $190.2 billion or 21% of annual
medical spending in the USA. Childhood obesity is responsible for $14 billion in direct medical
costs. The average total health cost for a child treated for obesity under private insurance is
$3,743, while the average health cost for all children covered by private insurance is $1,108.
These costs are anticipated to rise, given the likelihood that today’s obese children will become
tomorrow’s obese adults. If obesity rates were to remain at 2010 levels rather than continue to
rise, the projected savings for medical expenditures would be $549.5 billion nationwide over the
next 20 years.
Children and adolescents who are obese are 5 times more likely than normal-weight children to
become obese adults, and their obesity is likely to be more severe. Obese children and youth
are at greater risk for physical and mental health problems during their youth and as
adults. Obese children are more likely to have high blood pressure and high cholesterol, which
are risk factors for cardiovascular disease.. Obese children are also at increased risk for Type 2
diabetes, breathing problems (e.g., sleep apnea and asthma), joint and musculoskeletal
23
problems, and social and psychological problems that can continue into adulthood. the current
generation may be the first in our history to live sicker and die younger than their parents, due
to obesity.
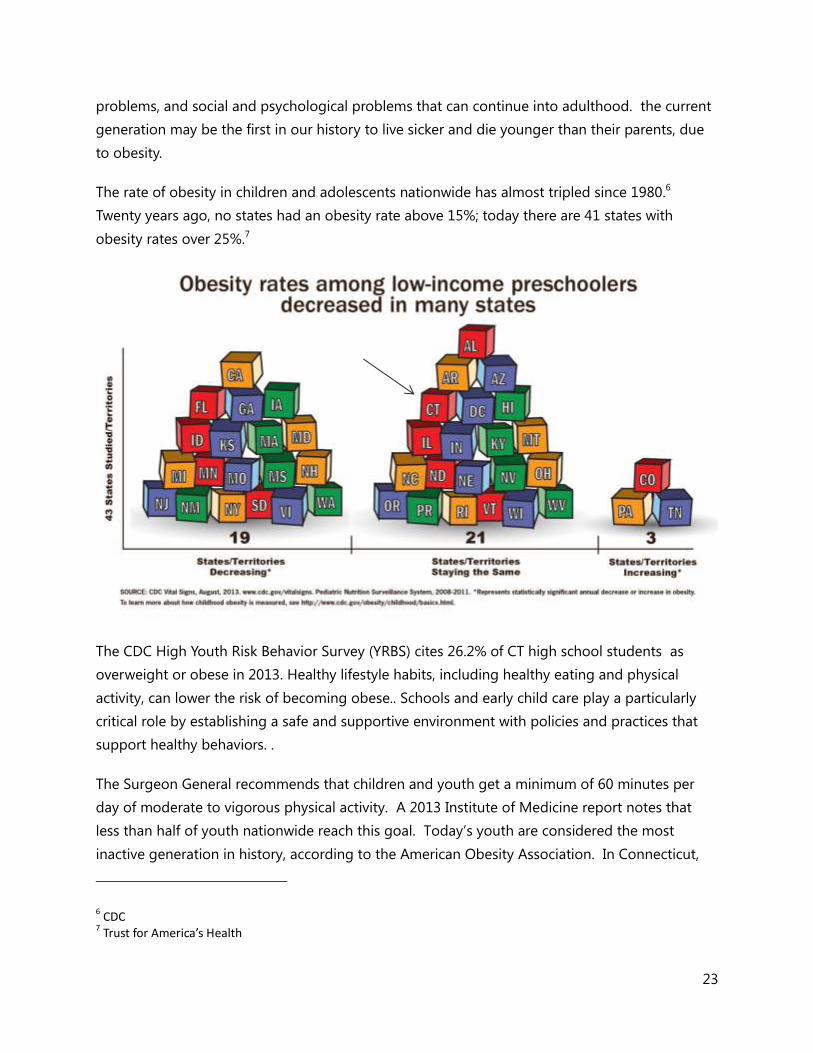
The rate of obesity in children and adolescents nationwide has almost tripled since 1980.6
Twenty years ago, no states had an obesity rate above 15%; today there are 41 states with
obesity rates over 25%.7
The CDC High Youth Risk Behavior Survey (YRBS) cites 26.2% of CT high school students as
overweight or obese in 2013. Healthy lifestyle habits, including healthy eating and physical
activity, can lower the risk of becoming obese.. Schools and early child care play a particularly
critical role by establishing a safe and supportive environment with policies and practices that
support healthy behaviors. .
The Surgeon General recommends that children and youth get a minimum of 60 minutes per
day of moderate to vigorous physical activity. A 2013 Institute of Medicine report notes that
less than half of youth nationwide reach this goal. Today’s youth are considered the most
inactive generation in history, according to the American Obesity Association. In Connecticut,
6 CDC
7 Trust for America’s Health

24
53.4% of high school students do not get the recommended level of physical activity during an
average week.
Partners: The Yale Rudd Center for Food Policy & Obesity, End Hunger CT!, American Heart
Association, CT Department of Public Health, CT State Department of Education, American
Academy of Pediatrics, CT General Assembly Children's Committee, Stamford Hospital, UConn
Center for Public Health and Health Policy, American Dietetic Association, American Society for
Nutrition and the Hispanic Health Council.
What the Commission did in 2014:
Researched factors contributing to childhood obesity, considered policy remedies,
conveyed findings to Task Force on Childhood Obesity,(Public Act No. 13-173, An Act
Concerning Childhood Obesity and Physical Exercise in Schools). The Task Force
recommendations include (1) refining the language in existing statutes related to child
nutrition and physical activity to clarify legislative intent; (2) expanding opportunities for
physical activity in after-school programs; (3) creating a statewide physical activity
12.2
10.2
12.5 12.3
0
2
4
6
8
10
12
14
2007 2009 2011 2013
Percentage of Obese High School Students in Connecticut
*Data provided by the Center for Disease Control and Prevention, Youth Risk Behavioral Survey
Data

25
commission; (4) collecting BMI data statewide for surveillance purposes; and (5) using
state purchasing power to increase healthy food access.
Provided testimony, served on the Steering Committee of the statewide CT Coalition
Against Childhood Obesity. The Coalition Against Childhood Obesity educates the public,
providers and legislators on model policy.
Researched the need for baseline and continuing data, and the pros and cons of utilizing
BMI as the standard measure for surveillance purposes.
Drafting policy recommendations with Coalition partners to on how to collect BMI for
surveillance purposes across our state.
Explored best practices in obesity prevention in early childhood. L looked at messaging
to new parents, baby-friendly hospitals, breastfeeding education, limiting screen time,
and nutrition in early childhood settings. Fielded calls from press and researchers on
childhood obesity and shared updated information on the issue.
Appointed to National Conference of State Legislatures Hunger Partnership. The Hunger
Partnership connects public and private sectors to improve the availability of healthy
food for hungry families. The Partnership brings together legislators, legislative staff and
interested businesses to identify innovative and successful policies and programs to
reduce hunger in America. Significant attention is on food in cities and in the rural
sectors.
Proposed strategies to turn the curve:
Collect BMI data statewide to have baseline for obesity reduction efforts, identify
communities with higher levels of obesity, tailor interventions, and evaluate outcomes;
Explore policy options regarding obesity and early child hood, including limiting
beverages to healthy options for children in child care, reducing screen time, and
increasing physical activities in early care settings.
Remove unhealthy food and beverage options from vending machines in children’s
hospitals.
Continue to explore impacts of School Based Health Centers (SBHCs) on overall child
health and obesity, through the SBHC Strategic Action Group and Advisory Committee.

26
Expand opportunities for physical activity during school and during after school
programs.
Train home visitors on factors contributing to child obesity, for home visitors to
incorporate into their work with families.
Leverage state purchasing power to affect healthy food supply and access, bringing the
state’s large purchasing power to bear on healthy food supply
Develop policy template for local communities to implement shared use policy, where
school facilities are open to the community for physical activity and nutrition when not in
use by the school.
Explore continued expansion of hospitals participating in “baby friendly” certification.
Such certification involves a number of factors, including breastfeeding information and
early childhood nutrition information.
Establish a permanent council on childhood obesity.
Indicator 4: Youth Concussions
The story behind the baseline: Concussions are a form of traumatic brain injury caused by a
bump, blow, or jolt to the head that can change the way the brain normally works. Concussions
typically result in the rapid onset of short-lived impairment of neurologic function that resolves
spontaneously. Concussions can, however, result in loss of consciousness, posttraumatic
amnesia, and signs or symptoms that last for 30 minutes up to more than seven days.
Recognition and proper response to concussions when they first occur can help prevent further
injury or even death. Information for coaches, parents, and athletes on preventing, recognizing,
and responding to a concussion is critical. The State of CT requires this in high school athletics
and PK-12 intramural activities, but does not have any such requirements for outside of school
athletics for children and youth. Given the increasing knowledge of the impact of concussions,
and particularly a second concussion within 10 days of the first, the need is noted to offer
information and training to best protect our young athletes.
The CDC reports that each year, U.S. emergency departments treat an estimated 173,285 sports-
and recreation-related TBIs (traumatic brain injuries), including concussions, among children and
adolescents ages 0 to 19 years. During the last decade, such visits among children and
adolescents increased by 60%. Because of the large numbers of participants in youth and high

27
school sports, concussions in the pediatric and adolescent age groups account for the majority
of sports-related concussions. Concussions represent an estimated 8.9% of all high school
athletic injuries. Data are significantly lacking about concussions in grade school and middle
school athletes, which highlights the need for more research about concussions in this younger
age group.
Girls are reported to have a higher rate of concussion than boys in similar sports. The reason for
this difference is unknown, although some have theorized that female athletes have weaker neck
muscles and a smaller head mass than their male counterparts. Alternatively, male athletes may
be more reluctant to report their injuries for fear of removal from competition, which may result
in the incidence of concussion in boys being underestimated.
The sport with highest risk of concussion in high school is football. In girls' sports, the rate of
concussion is highest in girls' soccer and basketball. Rugby, ice hockey, and lacrosse also
account for higher rates of concussions but are often club sports, which limits their data
inclusion in the larger high school sports epidemiologic studies.
If someone who has had a concussion has a repeat concussion that occurs before the brain
recovers from the first—usually within a short period of time (hours, days, or weeks)—this can
result in brain swelling, permanent brain damage and even death. This condition is called
Second Impact Syndrome.
The Brain Injury Alliance of Connecticut notes:
From 2001 to 2009, the rate of Emergency Department visits for sports and recreation-
related injuries with a diagnosis of concussion or TBI, alone or in combinations with
other injuries, rose 57% among children (age 20 or younger);
300,000 sport and recreation-related concussions are diagnosed nationwide each year
with a possible seven times more going undiagnosed; and
In Connecticut alone, there are approximately 22,000 deaths, emergency department
visits and hospitalizations that result from traumatic brain injury each year.

28
Partners: Connecticut General Assembly, American Academy of Neurology, County Medical
Associations, CIAC, CT State Medical Society, Association of School Nurses of CT, Association of
Athletic Trainers, Shoreline Youth Football League, CT Concussion Task Force, CCMC, CT
Association of School Psychologists, Brain Injury Alliance of CT, CT Recreation and Parks
Association, Parent Concussion Coalition, American Academy of Pediatrics, DCF, SDE, and DPH.
29
What the Commission did in 2014:
Served as Administrator of the Task Force on Youth Sports-Related Concussions, created
in Public Act No. 14-66, An Act Concerning Youth Athletics and Concussions. Worked with
sponsors of legislation to concretize legislative intent, worked with appointing authorities
to complete Task Force appointments, convened bill sponsors and Task Force Co-Chairs
to plan Task Force meetings, provided research on content, communicated with Task
Force membership on goals of Task Force, invited Speakers and informed them on Task
Force needs and goals.
Wrote draft Task Force report for CGA, communicated such to Task Force membership
and incorporated their feedback into final report. Submitted report to CGA on behalf of
Task Force chairs.
Worked with legislators to define draft bill language for 2015 on youth sports-related
concussions, based on Task Force findings and related legislation in other states.
Testified in support of Raised HB No. 5113, An Act Concerning Youth Athletics and
Concussions.
Created a website for Resources, Efforts and Information regarding youth sports-related
concussions for parents, youth athletes, policymakers, and the general public. The
website informs these stakeholders, provides data and research, shares the Task Force
findings, and notes further resources. The intent is to both inform the public to
individuals’ personal knowledge and thereby safety, and to inform policymakers as the
state considers legislation in this arena.
Researched best practice policy efforts in cities and states, including work with NCSL.
Shared national best practices with the Task Force and legislators.
30
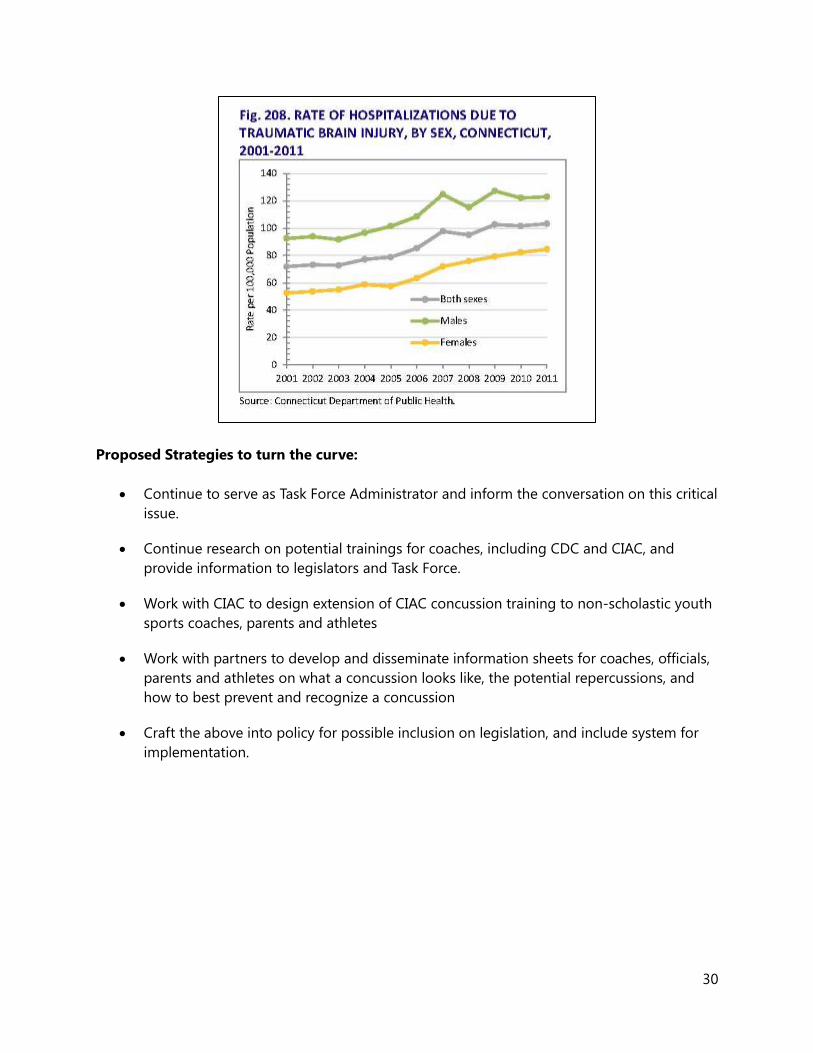
Proposed Strategies to turn the curve:
Continue to serve as Task Force Administrator and inform the conversation on this critical
issue.
Continue research on potential trainings for coaches, including CDC and CIAC, and
provide information to legislators and Task Force.
Work with CIAC to design extension of CIAC concussion training to non-scholastic youth
sports coaches, parents and athletes
Work with partners to develop and disseminate information sheets for coaches, officials,
parents and athletes on what a concussion looks like, the potential repercussions, and
how to best prevent and recognize a concussion
Craft the above into policy for possible inclusion on legislation, and include system for
implementation.

31
Indicator 5: Home Visitation
There are approximately 40,000 births in Connecticut each year. Roughly 10,000 births are to
families with at least one significant risk factor. Of these births, 2,400 babies are born to mothers,
age 19 and younger. Children’s’ earliest experiences have a major impact on their lifelong
development. High-quality home visiting is a proven approach to strengthening families with
young children.
Often, home visiting occurs in the home. It is family–focused and attentive to young children.
Home visiting, if performed qualitatively and within a system of early care and learning, can
improve language, social and emotional development, and school readiness. It can meet and
proactively, address maternal depression and improve family economic status.
Children with mothers who are depressed face extreme challenges. Depression leads to
isolation, lack of connection and, at its extreme, and an absence of nurturance. For a child, this
lacuna is harmful to the heart of childhood growth, play, and attachment. According to the
National Center for Children in Poverty, about 12 percent of women experience depression in a
given year and postpartum depression is estimated to affect between five to 25% of pregnant
mothers. Targeted programs that address maternal depression help children significantly.
*Number of Connecticut Children Living in Poverty, 20138
Home visitation is not the primary staircase to a mental health system. But it is a preventive
strategy that can buttress numerous early and weak links from breaking apart and harming
children. This includes attending to neglect, abuse, and violence.
Connecticut has home visitation programs of excellence but lacks a coordinated system of these
programs to maximize consumer utilization, efficiencies, data analysis. Better-woven and
8 US Census American Community Survey, Connecticut Home Visiting Plan, December 2014.

32
coordinated with our early care, mental health, and Birth to Three systems, this model could be a
system of family strengthening, parent support, and early infant toddler assessment. Home
visitation should be integrated into Connecticut’s family, housing, school readiness, infant-
toddler, early childhood and mental health policy.
Partners: Connecticut Office of Early Childhood-the Home Visiting System Development
Workgroup, Pew Charitable Trust, Governor’s Early Care and Education Cabinet, CT Legislature’s
Co-Chairs of Human Services and the Children’s Committee, Parents as Teachers, Early Head Start,
Head Start, Child First, and Real Dads Forever.
What the Commission did in 2014:
Worked on both the state and national levels to determine the most integrated system for
home visitation to assure best supports and interventions for vulnerable families, during and
after pregnancy.
Served on Home Visiting System Development Workgroup of the Office of Early Childhood
to design an integrated home visiting plan, embedded in early childhood and with attention
to infant care policy and programs. Resulting from PA 13-178, this entailed a plan for
continuum of services with prevention focus, early intervention for families facing poverty,
trauma, violence, special health care needs, and mental or behavioral health care needs.
Developed, with home visitation program experts, a more seamless and less fragmented
home visitation system with attention to a common referral process, core set of
competencies and standards for programs, required training for all home visitation program
staff, coordinated training for home visitation and early care providers, development of
common outcomes and shared reporting of outcomes to the General Assembly.
Linked home visitation to two generational planning.
What remains to be done:
Expand capacity of existing home visiting system to meet the needs of vulnerable families
and children throughout Connecticut. Pay particular attention to including fathers men in the
service, maternal depression, mental illness, cognitive limitations, children experiencing
emotional or behavioral health issues, trauma or who have mild developmental delays.
Establish governance and collaboration infrastructure to guide home visiting system
development and implementation.
33
Improve public awareness, knowledge, and perception of home visiting programs. Expand
and strengthen the capacity of a referral infrastructure within Child Development Infoline.
Create a central training institute to support home visiting programs that build on existing
resources. (this could be combined with the one above it)Develop core competencies that
align across all early childhood disciplines and services.
Ensure program standards promote high quality programs. Establish a shared system of data
collection across all home visitation programs and models. Agree to collect common
indicators on the population level and to identify underserved groups to assess access and
intervention opportunity. .
Link home visitation to chronic absence so a CT home visitor, working with a vulnerable
family with an infant as well as siblings in the school system, can be contacted by the State
Department of Education to partner with a school if the siblings of the younger child are
seriously missing school days.
Create a family-friendly so parentsunderstand how to use home visitation services to meet
their parenting goals. Consider an advisory of parents to assist with marketing, outreach,
coordination from the ground.
Create or utilize existing access hubs so referrals can be made and the public, both families
and professionals, know how and where to refer.
Use a fatherhood audit to help bring in the dads or minimally, make agencies aware that
they should engage fathers in home visiting plans.
Assure systems building on the community level, which is different than on the state level.
Create a community based intake model. Loop back and gather community feedback.
Make home visitation an explicit component of an infant toddler system.

34

35
Result—Children and Youth Are Ready for School and
Succeed in School
Indicator 1: Preschool Enrollment and Early Education
The story behind the baseline: The brain develops to 90% of its capacity in the first five years.
A child’s ego, self-esteem and learning patterns are developing and linked together before a
child reaches kindergarten. Quality preschool is proven to assist in these important years with
cognition, social and emotional, gross motor and language and numeracy skills. Poor quality
care or no early care is often the starter fuel for inequities in educational achievement.
The chart below shows that the number of children utilizing preschool slots in the last nine
years.. The state has increased preschool accesss, expanded quality, and resourced an Office of
Early Childhood to develop a system of early care and education for parents with young
children. The State newly developed opportunityfor schools and towns that do not have school
readiness through Smart Start, a competitive grant funding program created during the 2014
legislative session, to expandpreschool in public school settings with unmet need.
7925 8759
9691 9682 9582 9576 10320 10225
10846
0
2,000
4,000
6,000
8,000
10,000
12,000
2006-072007-082008-092009-102010-112011-122012-132013-142014-15
Priority School Districts School Readiness Preschool Spaces
*Data provided by the CT Office of Early Childhood

36
Partners: State Department of Education, Governor’s Early Care and Education Cabinet,
Hartford Childcare Collaborative, Connecticut Academy of Pediatrics, Birth to Three, State
Legislature, PEW Charitable Trusts, Early Childhood Funders Collaborative, the United Ways, the
Early Childhood Alliance, School Readiness Councils, Help Me Grow, Discovery sites,
Achievement Gap Task Force, Children’s Investment Partnership, Connecticut Health and
Educational Facilities Authority, and the Local Initiatives Support Corporation (LISC).
What the Commission did in 2014:
Selected to serve as a member of an Interagency Early Childhood Comprehensive Systems
(ECCS) group with practitioners, United Way, Help Me Grow, and mental health experts, to
help prevent and identify social and emotional issues in children by utilizing the Infant and
Early Childhood Mental health Competencies (Sec. 2 of PA 13-178).
Served on an OEC designated work group to integrate Home Visitation and Early Care and
Education. Worked on the plan to align the services between prenatal and infant toddler
home visitation and family support and early care and education.
State-funded Child Day Care Centers, 2,264,
7%
School Readiness
Priority School Districts, 9,705,
27%
School Readiness Competitive
School Districts, 1,098, 3%
Head Start, 6,124, 17%
Public School District (Not in
SR, HS), 11,442, 32%
Care4Kids (Not in SR, CDC,
HS), 4,847, 14%
Preschool Age Capacity - State, Federal or Municipally-Funded Preschool Capacity
(Jan 2014)
State-funded Child DayCare Centers
School Readiness PrioritySchool Districts
School ReadinessCompetitive SchoolDistrictsHead Start
Public School District (Notin SR, HS)
*Data provided by the CT Office of Early Childhood

37
Served as an Executive Committee Member on the Governor’s Early Childhood Cabinet to
guide the direction of early care policy, programs, and the success of the newly established
Office of Early Childhood.
Selected by the State Department of Education to serve on the OEC /SDE’s 3 to three
committee to design policy that aligns early care and early education, kindergarten through
grade three.
Worked with policy leaders to embed Smart Start to address unmet preschool need in areas
while ensuring the model did not have unanticipated impact on the current quality school
readiness system. .
Partnered with Ellen Galinksy on Mind in the Making to train home visitors, early care
providers, and parents in early brain development and activities to maximize early
connection and learning.
Worked with Jackie Bezos, on “Brain Builders” and the Mayor of Providence, on “Providence
Talks” to learn newly designed models of early language and early brain development work
that might be of interest to Connecticut.
Proposed strategies to turn the curve:
Build preschool to scale for poor children who are three and four years old.
Invest in child care workforce through scholarship and increased wages to ensure
continuity of skilled early care providers.
Align standards and financing for the early childhood education system across
departments. This will increase supply and align reimbursements.
Expand infant and toddler programs to address our current shortage.
Develop birth-to-five programming, rather than separate and fragmented services for
infants, toddlers, birth to three and preschool.
Build the skills and resources of family day care providers as an ignored cohort, though a
frequently preferred program for many parents with very young children.
Ensure quality oversight of standards and regulations in early care facilities. Though we
have high standards in early care, oversight is limited and leads to child harm..

38
Integrate home visitation with the early care and education system to ensure a prenatal
through preschool system of care, family education, and school readiness planning.
Attend to chronic absence reporting in preschool, as this is the first sign of school
absence difficulties and portends challenges for the child.
Increase information to parents about quality care and how to access it. Our regional
groups with parents revealed parents were significantly ill-informed about access and
quality.
Continue to improve training on literacy for early care and education providers and in
home visitation staff to maximize early language and literacy acquisition.
Design two generational strategies that help children with school readiness and parents
with both adult literacy and pathways to work.
Indicator 2: Reading
The story behind the baseline: A child who is not reading by the end of first grade has a one in
eight chance of becoming a proficient reader. low literacy impact is seen at many levels, including
school retention, special education, dropout rates, unemployment, and crime. Connecticut has the
greatest achievement gap in reading in the country.
The Connecticut Mastery Test (CMT) results have consistently revealed large differences in
performance between low- and moderate-income children and middle-class children. 9 Similarly,
the National Assessment of Educational Progress (NAEP) reading test shows white students
significantly outperforming black and Hispanic students. But we also know that 95 percent of all
children can be taught to read. Therefore, our state achievement gap in reading demands an
urgent turnaround.
The majority of teachers in the early grades have not had opportunity to acquire researched-
based classroom skills to close the reading achievement gap. They are not trained in ongoing
9 Statewide results in reading are not available for the CMT for the 2014 administration of the test. In 2014, districts in the state were allowed to administer an alternative assessment in these content domains. Because many Connecticut districts did not administer the CMT in 2014, statewide results could not be determined. In our K-3 reading model schools, we can use internal assessments to document changes in achievement for all kids and subgroups – but it is difficult to put these in context compared to schools/districts that are not participating. If districts are using comparable internal assessments K-3, and we can access those data, we can look at how participating schools are doing compared to other schools within the same district.

39
assessment, prompt intervention, or how to place children into differentiated group cohorts for
various fundamental early literacy skills acquisition and practice. This continues to be a crisis in
education that is disproportionately impacting children of color and poor children.
Partners: Parents, the Legislature’s Black and Puerto Rican Caucus, State Department of
Education, Literacy How, NEAG School of Education, Hill for Literacy, Committee on Education,
Achievement Gap Task Force, Connecticut Education Association, and American Federation of
Teachers.
What the Commission did in 2014:
Following targeted and statewide legislative reforms in reading in 2012, the Commission
staffed the Black and Puerto Rican Caucus to ensure fidelity in implementation of both
the statewide and targeted elements of the reading reforms. Statewide elements
adopted in the 2012 education reform bill (PA 12-116) included increased expectations in
pre-service of our special education and reading specialists who now have to pass a test
in the science of teaching reading before they can work in CT schools; development of
new reading assessment tools, a professional development system in reading, higher
education improvements in oral language and early literacy for pre service teachers; and
explicit transition reporting between early childhood and kindergarten teachers to assist
young children in their early language skills.
Representing the Caucus at bi-weekly meetings held at the State Department of
Education, the Commission also worked with the Academic Office to ensure fidelity of
implementation at the pilot schools that are employing Tier 1 and Tier 2 scientifically-
based interventions in reading.
Hosted national experts on state reading reforms to learn best systems changes with
large and sustainable literacy gains. Florida and Colorado were two strong models.
Worked with the State Department of Education and the Legislature’s Black and Puerto
Rican Caucus to create and define a Director of Literacy Initiatives, a key position in every
state that has turned the curve in reading. Defined all functions and partnered with
legislators concerned about the achievement gap to secure funds within the budget.
Worked to combine a tier one and tier two strategy in selected schools and in the
alliance districts to train on the methods of literacy assessment and intervention,
kindergarten through grades three.

40
As the chart above shows, students in 4 of the pilot schools who have received multiple years of the K-3 Reading
Model demonstrate greater literacy growth and achievement than students who received fewer years of the K-3
Reading Model – so effects are cumulative over time.10
Designed curriculum for parents, in English and in Spanish, so parents could learn about
the importance of vocabulary to literacy development. Designed trainings in dialogic
communications that could be used with parents, across educational level.
Created literacy partnerships in communities with libraries, historical societies, museums,
and linked in parents with k-3 children, as partnersInvited to join the Casey Foundation’s
Kitchen Cabinet for the Campaign for Grade Level Reading to learn best national
practices in chronic absence, early literacy, summer reading loss, and school reform and
to bring this information and network to Connecticut.
10 Analyses were conducted on 4 Pilot Schools who have been participating in the K-3 Reading Model pilot since
the 2012-2013 school year: (1) Burns, Hartford, (2) Truman, New Haven, (3) Norris, East Hartford, and (4) Windham Center, Windham.

41
Worked with the Department of Education to create an assessment instrument model
that would utilize research based instruments to both help k-3 students master reading
and to be more teacher- friendly in time and efficacy.
Facilitated partnerships between best practice assessments in early literacy and the State
Department of Education. Collaborated with the Department to bring reading
intervention and assessment to scale at a competitive rate.
Trained school leaders, reading teachers and k-3 teachers in ways to work with parents to
partner on literacy.
Worked with SDE, the teachers unions and literacy experts, to create an anonymous
school survey for k-3 teachers that will help ascertain professional development needs
and a statewide plan for professional development in reading.
Partnered with parents to include dyslexia as a category that would be eligible for an IEP.
Specifically, P.A. 14-39 required that (1) dyslexia be added to the special education
individualized education program (IEP) form as a separate category and (2) instruction in
dyslexia be added to teacher preparation programs that lead to professional teacher
certification.
Proposed Strategies to turn the curve:
Phased implementation should continue to take piloted Tier 1 and Tier 2 interventions to
scale, focusing in districts and schools that exhibit persistent gaps in academic achievement,
namely Alliance District Schools and individual schools in the Commissioner’s Network of
underperforming schools. Sustainable, embedded reforms in each school should include, at
minimum:
o A team of embedded literacy leaders with a cohesive knowledge base on the
leadership routines necessary to institute evidence-based literacy practices within
a tiered instructional model, who will provide on-site facilitation and establish
sustainability for the initiative;
o Creation of a consistent knowledge base and common language among teachers
that is based on the overview of reading, current reading research and evidence-
based practices in reading instruction and behavior management;

42
o Collaboration with the school leaders to establish a framework and process for
using scientifically-based dynamic assessments to make instructional decisions at
the district, school, grade, classroom and individual student levels and
o Development and implementation of a school-home/family model for parent and
family engagement and student support in literacy.
o Integration with best practices for English Language Learner (ELL) instruction,
either through bilingual or English as a Second Language programming,
emphasizing assessment, intervention, and progress monitoring.
Indicator 3: Chronic Absence
The story behind the baseline: Good attendance is essential to student achievement and
graduation. But too often, students, parents and schools do not realize how quickly absences –
excused or unexcused – can leave children and youth falling behind. Chronic absence – missing
ten percent of the school year, or just 2-3 days each month – predicts lower third-grade reading
proficiency, course failure and eventual dropout.
The impact hits children of color and low-income students particularly hard, especially if they
don’t have the resources to make up for lost time in the classroom. These children are more
likely to face systemic barriers to getting to school – such as unreliable transportation or
conflicting parent work schedules. Other factors that contribute to chronic absence may be
situated in the family, school, and the community and include high family mobility, low
maternal education, food insecurity, inadequate healthcare, ineffective parent engagement, and
high levels of neighborhood violence.
*Data for both charts provided by Connecticut State Department of Education

43
Although attendance policy is typically developed by local education agencies, SDE can play a key
role in promoting best practices and marshalling resources to ensure that schools track the most
reliable attendance data and intervene in meaningful ways. Essential to this is looking beyond the
traditional measures of attendance: the number of students who show up every day (average daily
attendance) and the number of students skipping school (truancy). Schools and districts must look
at how many students are missing ten percent the school year in unexcused and excused absences,
including disciplinary absences. Research shows that ten percent is the threshold where
absenteeism correlates to poor academic outcomes.
Partners: Attendance Works, a national and state initiative that promotes better policy and
practice around school attendance, the Legislature’s Black and Puerto Rican Caucus, the State
Department of Education and the Interagency Council for Ending the Achievement Gap,
Children’s Report Card Leadership Group, the Casey Foundation’s Campaign for Grade level
Reading, The Graustein Memorial Foundation, and the Committee on Children.
What the Commission did in 2014:
In 2014, the Commission continued its partnership with the Interagency Council for
Ending the Achievement Gap, Children’s Report Card Leadership Group, the Committee
on Children, and national partners, including AtendanceWorks, to quantify the problem
of chronic absenteeism in the state, to explore best practices, and to consider possible
infrastructure, policy and legislative changes to improve how we track chronic
absenteeism in the state.
Ed educated policymakers and the public thatchronic absence can be turned around
when schools, districts, community agencies and families work together to monitor the
data, identify and remove barriers for getting students to class, and nurture a habit of
regular attendance. State policy and action are essential to advancing such practice.
The Commission staffed the Black and Puerto Rican Caucus to ensure that legislation to
address chronic absenteeism include: a)a nationally-recognized definition of chronic
absence, which included disciplinary absences; b) tracking of excused and disciplinary
absences; c) a required plan to address chronic absenteeism, statewide, with attention to
best practices to improve attendance.
Worked with all the New England states to share and learn best outcomes, through the
National Campaign for Grade Level Reading.

44
Proposed Strategies to Turn the Curve:
Track individual student attendance and absences in state longitudinal student databases,
ensuring that data are entered accurately and consistently, and that data are available “real
time” to ensure that interventions have maximum impact.
The State Department of Education, in collaboration with the Commission on Children and
other state agencies, should continue to build public awareness of chronic absence and why
it matters across schools and communities.
Partner with the public and private and philanthropic entities across the state to address
chronic absenteeism and to promote multilateral approaches to improve attendance, such as
mentorship, school breakfast, and in-school alternatives to suspension and expulsion.
Track longitudinal data on chronic absenteeism to inform policy and turn the curve on
chronic absenteeism, which can exacerbate persistent gaps in academic achievement along
racial and socio-economic lines.
While the state of Connecticut defines truancy statutorily (10 or more unexcused absences,
not including discipline), the state should adopt a standard definition of chronic absence
(missing 10% of the school year) to be used statewide and by each school district. The
definition should clarify how chronic absence is different from unexcused absences (truancy)
and ensure the inclusion of absences due to suspensions, as well as absences that come
when children switch schools and do not immediately start at a new school.
Chronic Absence Reports: Regularly calculate and share chronic absence data statewide,
providing information by district, school, grade and subgroup. Make the information
publicly available through school and district report cards.
Reports to Families: Districts should be encouraged to provide families with real-time data
on their child’s attendance, as well as an alert if their child may be accruing too many
absences. Often parents do not realize how quickly absences add up.
Help families understand what they can do to ensure their children are in school, the
outcomes of chronic absence on school performance and where they go for assistance.
School Improvement Planning: School improvement plans should include chronic absence
data, strategies that will be used to identify causes for such absence, build a culture of
attendance, and fashion effective interventions for chronically absent students.

45
Policymakers and advocates should encourage schools, public agencies, civic organizations,
businesses and non-rofits to jointly review data on chronic absence and discuss the
implications for action, policy and allocation of resources to reverse the trend such as as
health supports, early education programs, afterschool programs and mentoring efforts.
Indicator 4: School Climate
The story behind the baseline: Research has found a correlation between school climate and
student achievement, with negative school climate impacting student performance in English
and mathematics. By promoting positive school climate through research-based behavioral and
emotional supports and interventions, we addresses external stressors, improve student
learning, reduce the likelihood of depression and suicide in youth who are targets of bullying,
reduce crime, and strengthen communities—now and well into adulthood.
In 2011, Governor Malloy signed into law a measure that strengthened our efforts to improve
school climate and prevent and address school bullying. The law required—among other
things—that each school board develop and implement a safe school climate plan, that each
superintendent appoint a district safe school climate coordinator, and that the principal or a
designee for the principal serve as a safe school climate specialist.
Reported verified acts of bullying in Connecticut for the 2012-13 School Year
Type of district Number of districts Incidents reported as bullying
Local school districts 166 1,201
RESC school districts 6 34
Charter schools 18 72
State school districts 3 86
Endowed and incorporated academies 3 38
Total 196 1,431*
*Data provided by the state Department of Education.11
11 As of this writing, 2014 data has not been issued.
46
Partners: The State Department of Education, Dr. George Sugai of the Center for Behavioral
Education and Research (CBER), the Governor’s Prevention Partnership, Anti-Defamation League,
True Colors, Yale University Center for Emotional Intelligence, Bully Busters, Norwalk Youth
Leaders, and the CT Family Support Council.
What the Commission did in 2014:
Collaborated with the State Department of Education to conduct focus groups of school
leaders, including superintendent and principals, to address issues related to the
implementation of the bullying law. Focused on assessment, intervention, and prevention
through improved school climate.
Designed, organized and facilitated a “Youth Leadership and School Climate Forum” at the
Legislative Office Building, with state policy leaders that included US Department of
Education speaker David Esquith, Director of the Office of Safe and Healthy Students, the
Center for Emotional Intelligence at Yale University, and the Lady Gaga Born this Way
Foundation. The forum was led by youth and showcased youth leadership in improving
school climate. Youth representatives across the state provided input on how youth can
lead to improve school climate.
Partnered year-long with Marc Brackett, Ph.D., director of the Yale Center for Emotional
Intelligence, consultant to Facebook on a large-scale research project designed to both
prevent and decrease online bullying, on ways to bring in youth as ambassadors on school
climate.
Tested youth leadership and its gains in schools with peer strategies to improve school
climate.
Worked with the State Department of Education to expand training opportunities on
improving school climate to more school districts within the state.
Collaborated with state and not for profit partners on public information and
implementation strategies for state law on positive school climate and bullying prevention.
Represented Connecticut at the New Jersey Anti-Bullying Conference, which serves as a
venue for national scholars and practitioners to share expertise on bully prevention and
the creation of, positive school climate and culture. This year’s conference discussed the
interplay between school climate and school safety, as well as stressed the need for
assessing school climate using nationally developed assessment models.

47
Collaborated with Dr. George Sugai of the Center for Behavioral Education and Research
(CBER), at University of Connecticut to initiate the CT Bullying Behavior Prevention Project
(CBBPP), provide Connecticut school and community members with evidence-based
information to guide their prevention decision-making within a multi-tiered support
systems (MTSS) approach.
Conducted various presentations on implementation of the school climate law, including
continued collaboration with the Family Support Council at their annual retreat at Camp
Harkness.
Worked with school counselors to bolster proven interventions in the school house and
assisted families in direction and policy remedies for school climate and bullying.
Proposed Strategies to Turn the Curve:
Promoting positive school climate prevents bullying and creates a school environment
conducive to learning. To date, a division of the State Department of Education has led in
providing (limited) training for schools and districts that want to improve school climate.
While training is provided at a nominal cost to the school, to date funding has been limited
for this purpose. This training, focuses on assessment, students as participants in improving
school climate, and on improving relationships between every person in a school house.
The State of Connecticut should fund expanded opportunities for school climate training
across the state.
The State Department of Education should provide expanded guidance and support to
implement the state’s school climate and anti-bullying statute with fidelity in K-12 districts
and schools that experience persistent gaps in academic achievement. Such support may
include resources to alleviate any administrative challenges in the law, administrator and
teacher access to training, and to identify and promote best practices to ensure climate that
is conducive to learning;
The State Department of education should provide assessment models, such as the school
climate assessment model provided by the National School Climate Center, and funding to
assess school climate in every school in the State of Connecticut.
K-12 districts and schools that experience persistent gaps in academic achievement should
include after-school programs, evening family and community supports, neighborhood
vocational and recreation programming in their school climate assessments and training.

48
Indicator 5: Achievement Gap
The story behind the baseline: The gap in scores in Connecticut between white students and
students of color, as well as between low-income and non-low-income students, is among the
largest of any state in the nation. These
glaring gaps in academic achievement
and graduation rates separate low-
income students and students of color
from other students.
Closing Connecticut’s achievement gap
would produce clear and immediate
social and economic gains. For instance,
significantly reducing the number of high
school dropouts would lessen the need
for costly remedial education while
boosting the employment rates and
earnings of poor and minority youth in
our state.
The legislature established an
Achievement Gap Task Force to address
the academic achievement gaps in
Connecticut by considering effective
approaches in elementary, middle and
high schools. The legislature assigned the
task force with the creation of a master
plan to eliminate the academic
achievement gaps by January 1, 2020.
The master plan, with an initial working
draft completed February 2014, identified
the achievement gaps that exist among
and between identified cohorts; focused
efforts on closing the achievement gaps; and established initial annual benchmarks for
implementation of the master plan and closing the achievement gaps.

49
The Master Plan is organized to provide recommendations that can influence policy at the State
level for the next five years, both inside and outside the schoolhouse, and across agencies and
disciplines. At the initial public presentation of the Master Plan, the Task Force heard testimony
from various stakeholders in support of moving forward on the policies outlined in this report.
Partners: Achievement Gap Task Force, Interagency Council for Ending the Achievement Gap,
University of Connecticut Neag School of Education, United Way of Coastal Fairfield County,
Elena Koulidobrova, Margie Gillis, and Jeffrey Villar.
What the Commission did in 2014:
The Executive Director continued to serve on the Achievement Gap Task Force as the
Speaker’s appointee, and worked with the Lt Governor’s Interagency Task Force on
achievement gap policy implementation.
Worked with stakeholders and legislators to move several of the recommendations made
by the Task Force for year one and year two of implementation. Some of those
recommendations, which were adopted into state policy, included:
o Increased efforts and funding to provide accredited quality preschool for low income
children.
o Grew a tier one and tier two reading coach model in the classroom that prepares teachers,
K-3, in early literacy assessment, intervention, and practice.
o Grew a tier two model of individualized reading intervention for every student not reading
at proficiency, in K-3rd grade.
o Required routine formative assessments in reading for all students in K-3 to inform and
ensure differentiated instruction, using research-based assessment tools that are offer
information on immediate intervention and groupings.
o Collected statewide data on progress monitoring assessments that inform instruction and
can be analyzed to highlight schools that are “beating the odds.”
o Drafted legislation linking the Office of Early Childhood and the State Department of
Education on an age 3 to 3rd grade strategy, creating alignment, training, and leadership
development on social emotional learning for teachers, school leaders, community
agencies and families.

50
Developed collaboration between school committees on school safety and school climate
to focus on prevention and intervention models.
Worked with national scholars and philanthropy on data regarding the achievement gap
concerning Black and Hispanic male students in school performance, opportunities and
advancement.
Partnered with national scholars and Scholastic Magazine on literacy research and
intervention strategies.
Proposed Strategies to Turn the Curve:
The Master Plan included an array of recommendations for inside and outside the schoolhouse
to continue to close the achievement gap by 2020. The Commission recommends the State
work across agency and policy domain to implement those recommendations in the next five
years. Some of these recommendations are moving forward this legislative session. Those policy
recommendations include:
Reassess TANF policy to avoid abrupt cliffs in income and bolster authentic opportunities
for job training and education. (Poverty)
Build two generational strategies of school readiness and workforce readiness for children
and their parents in poverty. (Early Care and Education)
Adopt a standard definition of chronic absence to be used statewide and by each school
district, and for planning purposes, at the state level, to improve attendance. (Chronic
Absence)
Require the State Department of Education to develop high quality model K-5 curricula in
reading and math, with considerations for students learning English as a Second Language.
Curriculum recommended to districts with limited resources, high transiency and large
achievement gaps. (ELL)
Limit the use of certain ELL student performance data in teacher performance evaluations
and school district performance measures. (ELL)Develop a Reading Director for SDE in
charge of literacy across all divisions, policies and programs to review data, implement
policies, support schools, and assure professional development and fidelity to best
practices.

51
Result — Parents Are Engaged and Informed about
Children’s Programs and Policies
Rainforest ArtLink
Program Director Miguel
Barreto facilitates an
exciting and thought-
provoking
videoconference at the
Rowayton Elementary
School in Norwalk with an
international partner class
in Guatemala.
Miguel Barreto, a Danbury
Parent Leadership Training
Institute graduate,
launched ArtLink as his
PLTI community project.
The class is a fifth-grade
one led by art educator
Jennifer Russo.
Indicator 1: Family Civic Engagement
The story behind the baseline: Since 1992 and the inception of the Commission’s Parent
Leadership Training Institute (PLTI), Connecticut has led the nation in promoting family civic
engagement. We know that for any initiative involving children to succeed, parents must be
involved from the outset. The Commission has repeatedly demonstrated for more than 20 years
that increasing family civic engagement improves the operation of programs, changes policy and
creates a diverse network of involved parents focused on improving child outcomes.
The number of communities offering parent leadership training has more than tripled in the last 10
years. This trend is largely due to public demand, recognition of the importance of parental
involvement in schools, and a public-private funding partnership supporting the Parent Trust Act.
The Commission on Children worked with the Legislature and the Robert Wood Johnson
Foundation to create The Parent Trust. This Fund, formalized in 2001 as the Parent Trust Act,
creates a funding stream for proven family civics programs, with requirements for data, proven
quality, diversity and community input, in a public-private partnership. The success of Connecticut’s

52
landmark legislation has garnered national attention with interest in the Parent Trust Act in
Virginia, Colorado, Oregon and Washington.
Funds for the Parent Trust were allocated in the 2011-13 state budget, and $250,000 in matching
funds were leveraged from the William Caspar Graustein Memorial Fund. Additional matching
funds were generated at the local level from funding partners like the Liberty Bank Foundation,
Newman's Own Foundation, the Napier Foundation, and many others.
Families, schools and community organizations all contribute to student achievement. The best
result comes from all three working together. Schools that connect to their communities have
higher achievement and graduation rates. (Henderson & Mapp)
Background image: Attendees of the Parent Leadership Training Institute (PLTI) graduation at the Legislative
Office Building on June 18, 2014. Included in this image is graduation moderator, Donna Thompson-
Bennett, Facilitator of the 2014 Stamford, CT class, Coordinator Josephine Fulcher Anderson and students of
the graduating class. Photo: Kevin Flood.
12,500
13,000
13,500
14,000
14,500
15,000
15,500
Volunteer Hours of PLTI Graduates
13,728
15,184
2010 2014

53
Elaine Zimmerman at the White House with members of the
Domestic Policy Council, HRSA, and Department of Education staff
on how federal leaders can further quality family engagement.
Partners: Danbury Children First,
Hartford Office of the Mayor, Meriden
Children First, RYASAP – Bridgeport,
Middletown Public Schools, Milford
Health Department, Naugatuck
Discovery, United Way of West
Central Connecticut, Stamford Health
& Human Services, Clifford Beers
Clinic, Waterbury Hospital, Bridge
Family Center – West Hartford,
Norwalk Public Schools, Plymouth
Early Childhood Council, Bristol
Discovery Initiative, Windham
Regional Community Council,
Windham Public Schools, Hamden
Public Schools, Stratford Public
Schools, Liberty Bank Foundation,
William Caspar Graustein Memorial
Fund, State Department of Education – Family, School & Community Partnership, State Education
Resource Center, Connecticut Early Childhood Education Cabinet, Statewide Fatherhood Advisory Council,
Charter Oak Group, Department of Social Services, Child Plan – East Hartford, Windsor Early Childhood
Collaborative, Hartford Foundation for Public Giving, New London Youth Affairs, Waterbury Bridge to
Success, Greenwich Discovery Initiative, Bloomfield Alliance for Children, Kellogg Foundation, State Special
Education Advisory Council, University of Connecticut Extension Services, Old State House – Hartford, CT-
N, Everyday Democracy, CT Secretary of State’s Office, Connecticut Civic Health Advisory Council, Real
Dads Forever – Manchester, Hartford Area Child Care Collaborative, Hartford Catholic Charities, CT Parent
Power, Parents as Teachers, CT Department of Children & Families - Head Start Strengthening Families
Initiative, Office of Policy and Management Attendance Consortium, Juvenile Justice Advisory Council,
Connecticut Juvenile Justice Alliance, Right From the Start Collaborative, Connecticut After School
Network, CT Parenting Education Network, Strengthening Families State Leadership Team, SDE Statewide
Special Education Advisory Council and the Connecticut Family Support Network.
What the Commission did in 2014:
Coordinated CLTI so that children can attend a two generationprogram of both parent and
child leadership. CLTI uses children’s literature with trained early care providers as the
facilitators. The children study the same topics as their parents and often are able to bring
the books home for a leadership library.
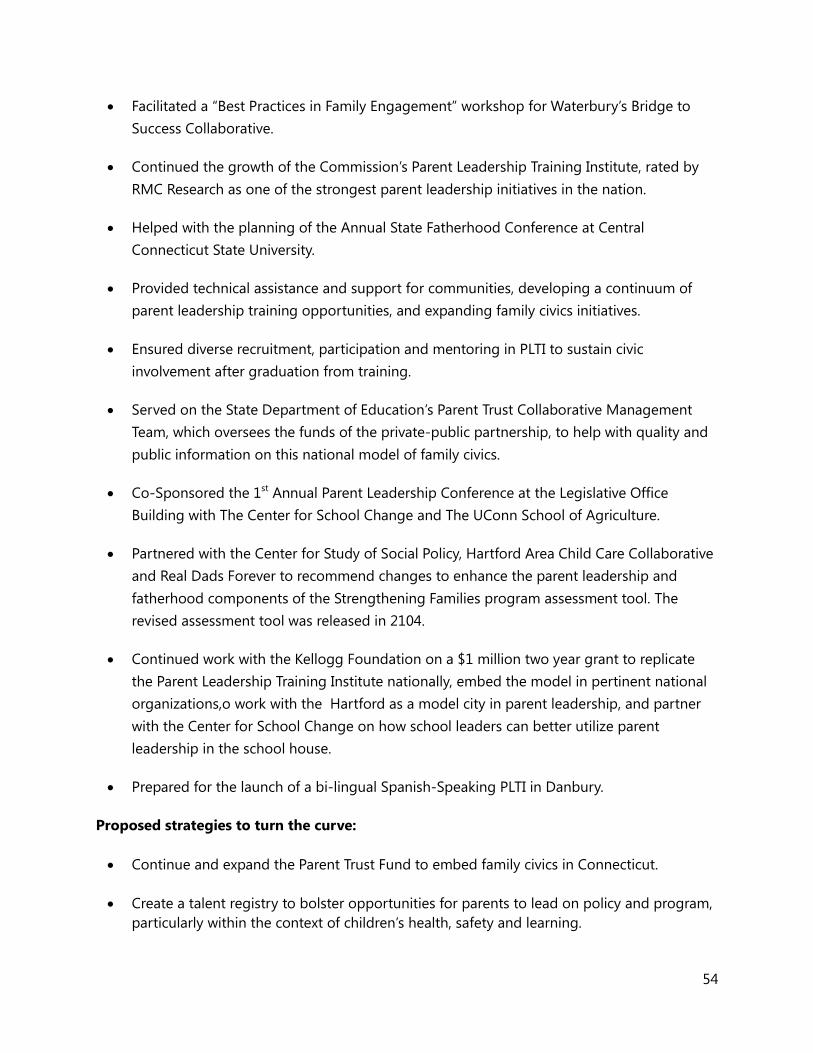
54
Facilitated a “Best Practices in Family Engagement” workshop for Waterbury’s Bridge to
Success Collaborative.
Continued the growth of the Commission’s Parent Leadership Training Institute, rated by
RMC Research as one of the strongest parent leadership initiatives in the nation.
Helped with the planning of the Annual State Fatherhood Conference at Central
Connecticut State University.
Provided technical assistance and support for communities, developing a continuum of
parent leadership training opportunities, and expanding family civics initiatives.
Ensured diverse recruitment, participation and mentoring in PLTI to sustain civic
involvement after graduation from training.
Served on the State Department of Education’s Parent Trust Collaborative Management
Team, which oversees the funds of the private-public partnership, to help with quality and
public information on this national model of family civics.
Co-Sponsored the 1st Annual Parent Leadership Conference at the Legislative Office
Building with The Center for School Change and The UConn School of Agriculture.
Partnered with the Center for Study of Social Policy, Hartford Area Child Care Collaborative
and Real Dads Forever to recommend changes to enhance the parent leadership and
fatherhood components of the Strengthening Families program assessment tool. The
revised assessment tool was released in 2104.
Continued work with the Kellogg Foundation on a $1 million two year grant to replicate
the Parent Leadership Training Institute nationally, embed the model in pertinent national
organizations,o work with the Hartford as a model city in parent leadership, and partner
with the Center for School Change on how school leaders can better utilize parent
leadership in the school house.
Prepared for the launch of a bi-lingual Spanish-Speaking PLTI in Danbury.
Proposed strategies to turn the curve:
Continue and expand the Parent Trust Fund to embed family civics in Connecticut.
Create a talent registry to bolster opportunities for parents to lead on policy and program,
particularly within the context of children’s health, safety and learning.

55
Continue outreach to increase fathers’ engagement in civic leadership roles for their
children and guide the RBA Strategic Planning process for the statewide Fatherhood
Advisory Council.
Ensure that public and private contributions are allocated and released through the Parent
Trust Fund in a timely and transparent fashion so communities can offer parent leadership
training.
Continue to develop culturally competent Spanish-language PLTI and PSEE curriculums.
Expand the opportunity for longitudinal evaluation on the impact of parent leadership
training.
Study if and how parent leadership has an impact on child and youth leadership, expanded
networks of supports, and racial integration within community activity.
Embed parent leadership in policy such as early care, child obesity, neighborhood disaster
planning, et al.
Indicator 2: Parent Involvement in Schools
The story behind the baseline: Research shows that children with parents involved in their learning
develop better grades, test scores, long-term academic achievement, attitudes, and behaviors.
Children do best when families and schools share information and partner in creating quality learning
environments. Families, schools, and communities have come together to more than double the
number offering Parents Support Educational Excellence (Parent SEE) training between 2005 and
2014.
What the Commission did in 2014:
Worked with the federal and State Department of Education on the importance of parent
engagement in school reform.
Co-led the growth and implementation of Parents Supporting Educational Excellence
(Parents SEE), which the Commission envisioned, designed and co-authored with the
Connecticut Center for School Change.
Partnered with the Center for School Change on national and state research to ascertain
what school leaders needed to better apply and authentically implement parent school
partnerships for improved school success.
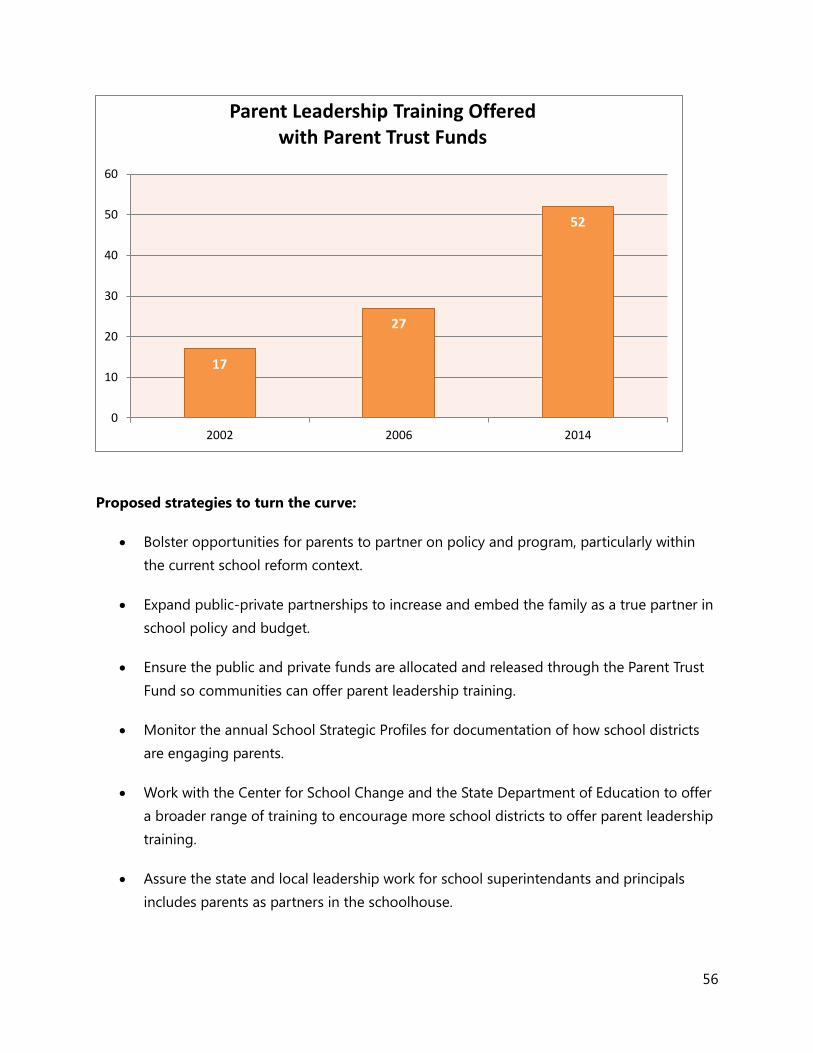
56
17
27
52
0
10
20
30
40
50
60
2002 2006 2014
Parent Leadership Training Offered with Parent Trust Funds
Proposed strategies to turn the curve:
Bolster opportunities for parents to partner on policy and program, particularly within
the current school reform context.
Expand public-private partnerships to increase and embed the family as a true partner in
school policy and budget.
Ensure the public and private funds are allocated and released through the Parent Trust
Fund so communities can offer parent leadership training.
Monitor the annual School Strategic Profiles for documentation of how school districts
are engaging parents.
Work with the Center for School Change and the State Department of Education to offer
a broader range of training to encourage more school districts to offer parent leadership
training.
Assure the state and local leadership work for school superintendants and principals
includes parents as partners in the schoolhouse.
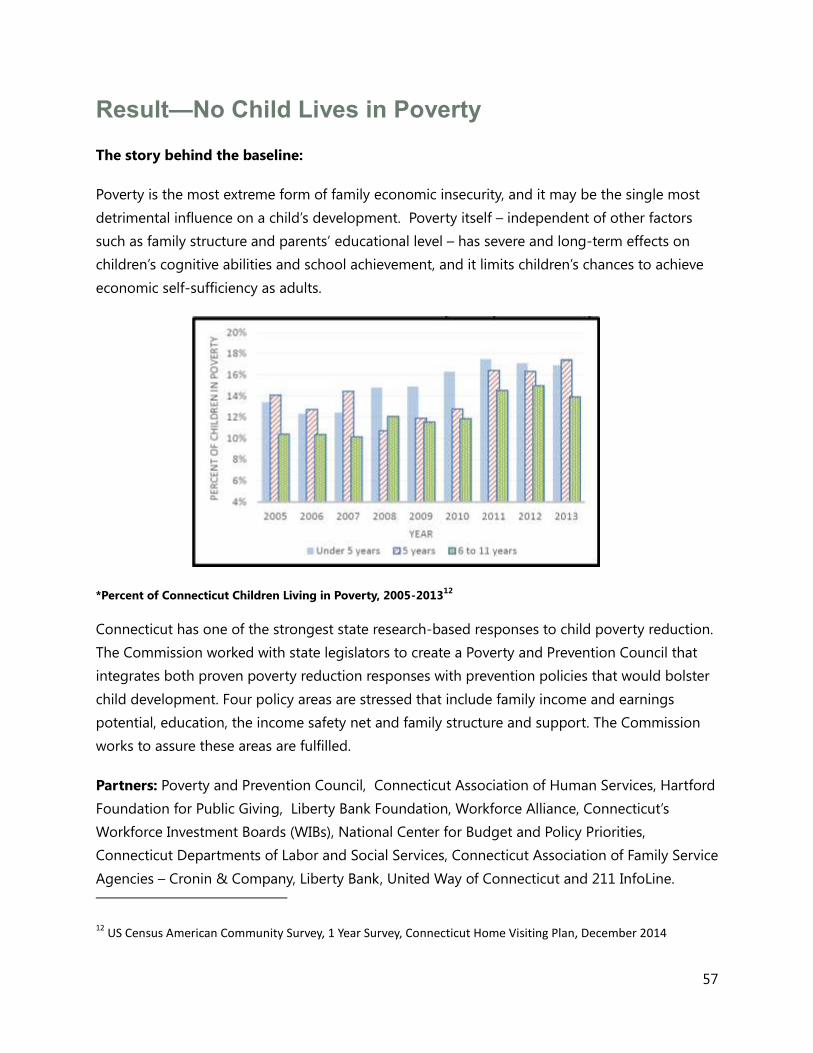
57
Result—No Child Lives in Poverty
The story behind the baseline:
Poverty is the most extreme form of family economic insecurity, and it may be the single most
detrimental influence on a child’s development. Poverty itself – independent of other factors
such as family structure and parents’ educational level – has severe and long-term effects on
children’s cognitive abilities and school achievement, and it limits children’s chances to achieve
economic self-sufficiency as adults.
*Percent of Connecticut Children Living in Poverty, 2005-201312
Connecticut has one of the strongest state research-based responses to child poverty reduction.
The Commission worked with state legislators to create a Poverty and Prevention Council that
integrates both proven poverty reduction responses with prevention policies that would bolster
child development. Four policy areas are stressed that include family income and earnings
potential, education, the income safety net and family structure and support. The Commission
works to assure these areas are fulfilled.
Partners: Poverty and Prevention Council, Connecticut Association of Human Services, Hartford
Foundation for Public Giving, Liberty Bank Foundation, Workforce Alliance, Connecticut’s
Workforce Investment Boards (WIBs), National Center for Budget and Policy Priorities,
Connecticut Departments of Labor and Social Services, Connecticut Association of Family Service
Agencies – Cronin & Company, Liberty Bank, United Way of Connecticut and 211 InfoLine.
12 US Census American Community Survey, 1 Year Survey, Connecticut Home Visiting Plan, December 2014

58
Indicator 1: Child Poverty
Child Poverty has profound effects on young children. These include greater likelihood of low
birth weight, stunted growth, infectious diseases, missed immunizations, anemia, and asthma.
Health–related problems that are higher among children in poverty, such as lead poisoning,
have a significant impact on children’s school attendance and ability to learn. Children in
poverty also face greater food insecurity and an increase in emotional and behavioral problems.
Children Poverty in Connecticut and United States 2003-2013 2005 2006 2007 2008 2009 2010 2011 2012 2013
Percent of children under 18
11.6%
11.0%
11.1%
12.5%
12.1%
12.8%
14.9%
14.8%
14.5%
Percentage of children under 18
United States
18.5%
18.3%
18.0%
18.2%
20.0%
21.6%
22.5%
22.6%
22.2%
Connecticut rank among states
46
49
47
42
49
50
45
47
43
What the Commission did in 2014:
Worked with the Departments of Corrections and Social Services on a study committee
to assess how to revamp and update TANF to address adult learning, skills enhancement,
sector workforce training and integrated work and learning opportunities for parents in
chronic poverty.
Created a state forum on welfare reform with the state departments of DSS and
Corrections bringing in best practices in states, a more focused social work model,
improved poverty reduction outcomes with employment for the family as a goal. NCSL
supported this forum and attended, sharing best state practices throughout the country.
Continued to partner on the expansion of the WorkPath Fund, which offers $200 to
$1000 dollars per family for one-time costs of car repair, work equipment, child care,
tools, and various supports to help pay the hidden costs of work. In 2014, 200 families
* Data provided by the State of Connecticut Child Poverty and Prevention Council’s 2014 Progress Report
59
were assisted.This Fund, resulted from Public Act No. 10-133 An Act Concerning Children
in the Recession, was created in partnership with Liberty Bank and Workforce Investment
Board.ised over $128,500 with WorkPath partners from numerous foundations, including
American Savings Bank; Bank of America; Community Foundation for Greater New
Haven; Hartford Foundation for Public Giving; Middlesex United Way; Napier; People’s
United Community ; Travelers; United Way of Greater New Haven; and Valley Community
Foundation.
Served as an active member of the Poverty and Prevention Council, determining poverty
reduction strategies for the year including increase of minimum wage, family supports in
housing, SNAP and energy, and public information on EITC state and federal benefits.
Drafted legislation with state Appropriations Committee Co-Chairs to create a two
generational plan for families in poverty that would simultaneously address school
readiness and workforce readiness.
Indicator 2: Hunger
Hunger continues to be a critical issue in our state. FRAC (the national Food, Research and
Action Center) reported 13.4% of Connecticut households were “food insecure” in 2013 and
5.0% were very food insecure, showing steady increases since 2005. Connecticut’s overall child
food insecurity rate increased to 19.6% in 2014. Food insecurity affects child development,
increasing the odds of cognitive, behavioral, and other development delays. These, in turn, have
implications for educational achievement.
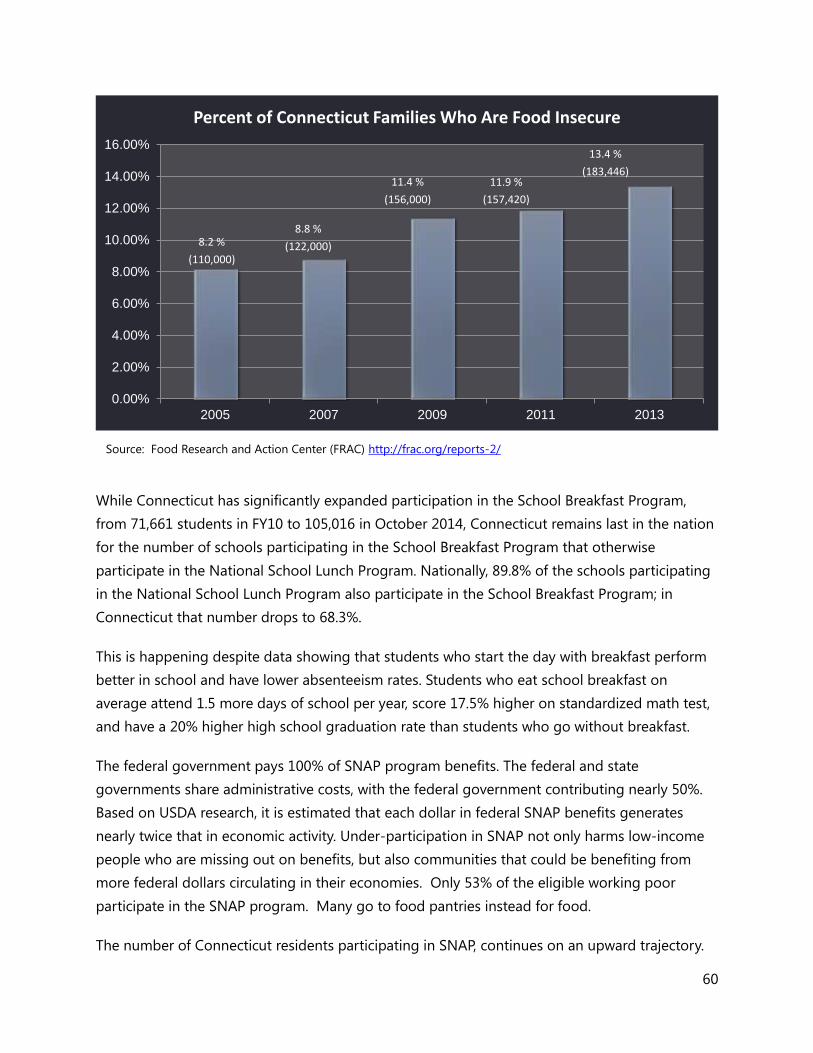
60
While Connecticut has significantly expanded participation in the School Breakfast Program,
from 71,661 students in FY10 to 105,016 in October 2014, Connecticut remains last in the nation
for the number of schools participating in the School Breakfast Program that otherwise
participate in the National School Lunch Program. Nationally, 89.8% of the schools participating
in the National School Lunch Program also participate in the School Breakfast Program; in
Connecticut that number drops to 68.3%.
This is happening despite data showing that students who start the day with breakfast perform
better in school and have lower absenteeism rates. Students who eat school breakfast on
average attend 1.5 more days of school per year, score 17.5% higher on standardized math test,
and have a 20% higher high school graduation rate than students who go without breakfast.
The federal government pays 100% of SNAP program benefits. The federal and state
governments share administrative costs, with the federal government contributing nearly 50%.
Based on USDA research, it is estimated that each dollar in federal SNAP benefits generates
nearly twice that in economic activity. Under-participation in SNAP not only harms low-income
people who are missing out on benefits, but also communities that could be benefiting from
more federal dollars circulating in their economies. Only 53% of the eligible working poor
participate in the SNAP program. Many go to food pantries instead for food.
The number of Connecticut residents participating in SNAP, continues on an upward trajectory.
0.00%
2.00%
4.00%
6.00%
8.00%
10.00%
12.00%
14.00%
16.00%
2005 2007 2009 2011 2013
Percent of Connecticut Families Who Are Food Insecure
8.2 %
(110,000)
8.8 %
(122,000)
11.4 %
(156,000)
11.9 %
(157,420)
13.4 %
(183,446)
Source: Food Research and Action Center (FRAC) http://frac.org/reports-2/
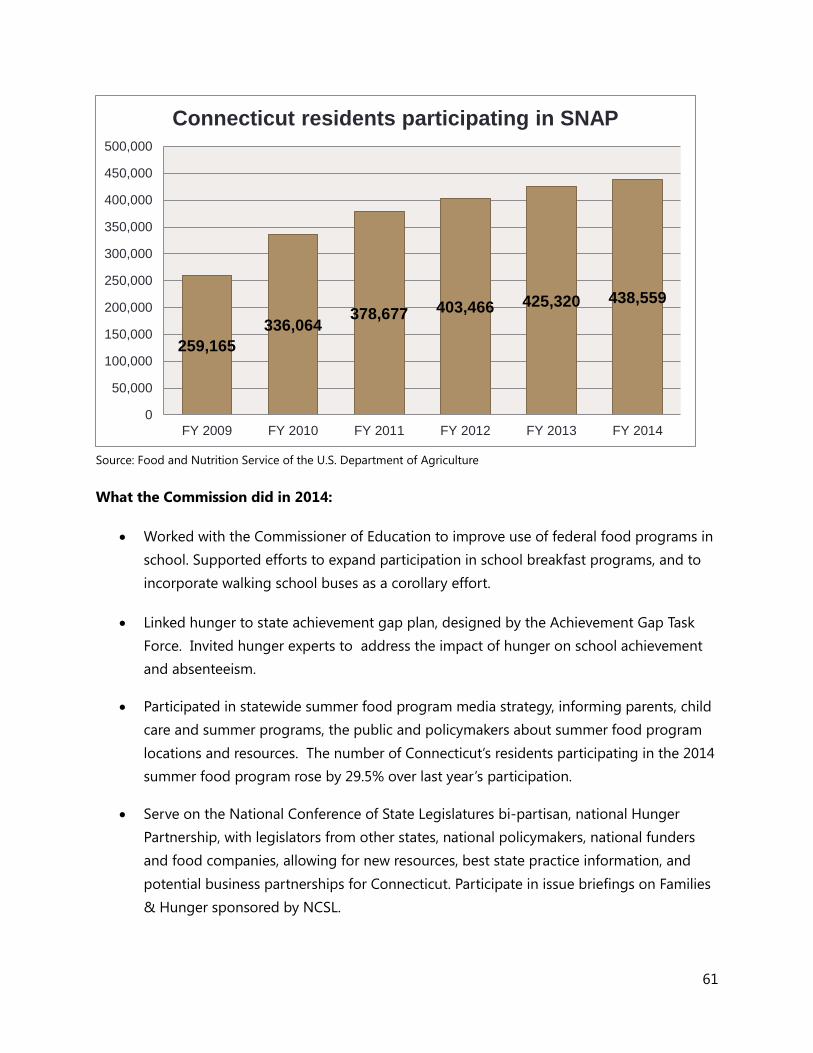
61
Source: Food and Nutrition Service of the U.S. Department of Agriculture
What the Commission did in 2014:
Worked with the Commissioner of Education to improve use of federal food programs in
school. Supported efforts to expand participation in school breakfast programs, and to
incorporate walking school buses as a corollary effort.
Linked hunger to state achievement gap plan, designed by the Achievement Gap Task
Force. Invited hunger experts to address the impact of hunger on school achievement
and absenteeism.
Participated in statewide summer food program media strategy, informing parents, child
care and summer programs, the public and policymakers about summer food program
locations and resources. The number of Connecticut’s residents participating in the 2014
summer food program rose by 29.5% over last year’s participation.
Serve on the National Conference of State Legislatures bi-partisan, national Hunger
Partnership, with legislators from other states, national policymakers, national funders
and food companies, allowing for new resources, best state practice information, and
potential business partnerships for Connecticut. Participate in issue briefings on Families
& Hunger sponsored by NCSL.
259,165
336,064 378,677 403,466 425,320 438,559
0
50,000
100,000
150,000
200,000
250,000
300,000
350,000
400,000
450,000
500,000
FY 2009 FY 2010 FY 2011 FY 2012 FY 2013 FY 2014
Connecticut residents participating in SNAP

62
Proposed strategies to turn the curve:
Increase information sharing through back-to-school nights, PTOs, community- and faith-
based organizations to increase summer food, school breakfast and lunch, and SNAP
participation. Increase information sharing through faith-based and community
organizations to expand participation in WIC;
Support efforts to expand participation in school breakfast program. Incorporate related
walking school buses where possible.
roll out eWIC cards statewide rather than paper checks, to remove barrier of shame at
check-out; currently this effort is being done on a pilot-only basis in certain locations.
Enhance partnerships between DSS and local agencies to promote efficiency and speed-
up in the application process for food stamps;
Complete DSS online benefits project that will expedite SNAP enrollment online;
Continue working with organizations across the state to expand doubling of SNAP
coupons at CT farmers markets.
Partners: End Hunger CT!, NCSL, Hispanic Health Council, DSS, Achievement Gap Task Force, CT
Children’s Medical Center, Hartford Childhood Wellness Alliance, and DPH.
Indicator 3: Parents with a High School Degree – Two-Generational Strategy
The goal of two-generational policy is family economic stability through quality learning for the
child, adult education and pathways to work for the parent, and related support services. Under
an optimal two-generational structure, bureaucracy is scaled back and parent and child receive
direct services and support as a family.
When the family is treated as a unit, resources are optimized and the likelihood of improved
coordination and synchronous activity for the benefit of the family increases. For example, adult
education and targeted sector workforce opportunities are coupled with quality childhood
education for the child.

63
*Educational Attainment for Individuals 25 Years and Older, 201313
In 2014, the Connecticut General Assembly approved the development of a two-generational
plan to promote long-term learning and economic success for low-income families. Notably,
Connecticut’s two-generational initiative aims to combine school success and workforce
readiness to improve outcomes for low-income families. In implementing the plan, the state may
access Federal TANF funds as permitted.
Partners: Maggie Adair, Director of Government & Community Relations – Office of Early Childhood,R.
David Addams, Executive Director – William Caspar Graustein Memorial Fund, Rebecca Allen, Program
Officer – Melville Charitable Trust, Cathy Battista, Director – Family Resource Centers, Alexandra Beaudoin,
Legislative Analyst – Connecticut Conference of Municipalities, Alexis Bivens, Program Director for
Education and Youth Development – Fairfield County’s Community Foundation, Erin Boggs, Executive
Director – Open Communities Alliance, Jim Boucher, Director of Strategic Development – Capital
Workforce Partners, Judy Carson, Family Support Services Unit – State Department of Education, George
Coleman, Chair – Commission on Children, Sarah Dudzic, Director – Move Up!, Doug Edwards, Founder
and Program Director – Real Dads Forever, Janice Elliott, Executive Director – Melville Charitable Trust,
13 U.S. Census American Community Survey, December 2014.
64
Harriet Feldlaufer, Director of the Division of Early Care and Education – Office of Early Childhood,
Elizabeth Fraser, Policy Analyst – Connecticut Association for Human Services, Merrill Gay, Executive
Director – Connecticut Early Childhood Alliance, Judith Goldfarb, Consultant, Myra Jones-Taylor,
Commissioner – Office of Early Childhood, Patricia Marsden-Kish, Director of Learning Centers – Norwalk
Housing Authority, Jane McNichol, Executive Director – Legal Assistance Resource Center of CT, Alice
Pritchard, Executive Director – CT Women's Education and Legal Fund (CWEALF), Orlando Rodriguez,
Associate Legislative Analyst – Latino and Puerto Rican Affairs Commission, Ellen Shemitz, Executive
Director – Connecticut Voices for Children, Megan Smith, Director of New Haven MOMS Partnership – Yale
School of Medicine, Richard Sussman, Director of Early Childhood Investments – Hartford Foundation for
Public Giving, Monique Turner-Lopez, Chief Program Officer – YWCA Hartford Region, Betty Weintraub,
Associate Director for Community Initiatives – Liberty Bank Foundation, Grace Whitney, Director of the
Connecticut Head Start State Collaboration Office – Office of Early Childhood and Alicia Woodsby,
Executive Director – Partnership for Strong Communities.
What the Commission did in 2014
Established a workgroup on two-generational planning and policy that met bi-monthly
since passage of the two-generational statute. Members represent housing, business,
health, mental health, school success, employment, foundations, and human services.
Partnered with the United Way, which authored a report on Connecticut’s ALICE residents
(asset-limited, income-constrained, employed), to link two-generational strategy with
statewide poverty reduction and workforce opportunity.
Worked with the national leaders on two generational best practices, including the Aspen
Institute and the Casey Foundation to ascertain proven practices.
Partnered with National Conference of State Legislatures and the National Governors
Association to create a two generational learning community among the five states
working on two-generational strategy.
Worked with state and national scholars to assess two generational planning in welfare
reform.
Brought in speakers on early care, kindergarten through grades three, literacy, pathways to
work, transportation, housing, sector employment training, family centers to think through
how each field could perform more intentionally in a two generational framework.
Drafted a report for the legislature, with the Two Generational Work Group, on two-
generational planning. The report offers systemic recommendations to create a two

65
generational plan and policy agenda for CT with attention to efficacy, seamless service, and
poverty reduction for the family.
Partnered with state philanthropy to consider matching dollars for two-generational pilots
in Connecticut.
Proposed strategies to turn the curve:
Support a workforce intermediary to administer and guide two-generation strategy and build
connections between partner programs and employers who are essential to its success. A
workforce intermediary would have contacts between the various workforce development
programs and early childhood initiatives and would get feedback from the private sector to
assure the program meets local economic needs.
Develop two-generational co-training opportunities for leadership and staff members across
agencies in workforce, human services and early childhood
Assure case practice in each agency to support a family decision making process, including a
family economic stability plan, rather than a separate plan for each child and adult.
Build two-generational state programing over four years. Establish a 4 year state target for a
percentage of existing programs to reflect significant two-generational programming, with
cross-agency support. Direct specific state partner agencies to: a) provide incentives for RFPs
reflecting two-generation approaches; b) set aside a percentage in currents grants, serving
children and adults, to begin offering incentives for two-generational transition; c) set aside a
percentage in current and future grants to foster cross-agency two-generational initiatives;
Create a no-wrong door approach that encourages agencies to connect families with needed
programs. Strengthen two-generational strategy and outcomes by developing and
implementing a simplified, single eligibility determination process that helps the family across
areas of need and learning.
Incentivize adult education to develop a cross generation strategy in the owns with the
greatest low-literacy adults. This could include literacy assessments of young adult students to
facilitate classes with best-practice adult literacy models as well as preschool center/adult-
education center collaboration for care and coordinated programming; writing for children,
storytelling skill/arts; monitoring student progress e.g. Watch Me Grow.

66
67
Result—Programs that Serve Children and Youth Are Measured for Accountability
Measuring programs for efficacy, efficiency, and return on investment (ROI) aims to increase
information for state policy leaders on which policies bolster good outcomesThese are hallmarks
of accountability and should be part of any embedded system to help government do more, in a
better way, with fewer resources.
The state has steadily deepened its commitment to the principles of results-based accountability
(RBA) since 2005, building upon proven models such as Washington State’s Results First model
and the research-based investment model of Social Impact bonding.
Indicator 1: Children’s Report Card
The story behind the baseline: Under legislation adopted in 2011 (Public Act No. 11-109), the
legislature's Children Committee, in consultation with the Office of Fiscal Analysis, the Office of
Legislative Research and the Commission on Children, is required to develop an annual Report
Card to help the public evaluate state policies and programs affecting the ability of children to
grow up in a stable living environment, be safe and healthy, and ready to lead successful lives.
The law further requires applying results-based accountability (RBA) principles to the effort, so
that anyone reading the Report Card can see exactly how well a program is doing in achieving
its mandate. The legislature created an initial set of primary indicators to track progress,
including state-wide rates of child abuse, child poverty, low birth weight, third grade reading
proficiency, and the annual social health index. For each indicator, the data must be presented
according to ethnicity or race, gender, geography and, where appropriate, age and other
relevant characteristics. The report card is to be updated annually.
Indicator data are being compiled in a central, electronically accessible location. Work has begun
on analyzing the story behind these data, assessing the impact of existing state policies and
programs for children, and determining what state agencies and their partners need to do to
achieve the desired quality of life result: “All Connecticut children grown up in stable
environments, safe, healthy, and ready to lead successful lives.”
Partners: Committee on Children, the CT Kids Report Card, the legislature’s Black and Puerto
Rican Caucus, and the State Department of Education, DCF, DSS, DPH, Judicial, OEC, Child
68
Advocate, CT Voices, CAHS, CAN, CCPA, Parent Power, CHDI, and the Center for Children’s
Advocacy.
What the Commission did in 2014:
Continued to serve on the Children’s RBA Report Card Leadership Committee, a group
made up of the heads of key partner agencies and organizations, providing the
Committee on Children with high level executive input needed to identify and promote
implementation of strategies that ensure Connecticut's young people grow up in stable
environments, safe, healthy, and ready to lead successful lives. The Leadership
Committee meets quarterly to help set, steer, and monitor the state's course of action for
achieving the quality of life results tracked by the CT Kids Report Card.
Worked with the Children’s Report Card and the Interagency Council for Ending the
Achievement Gap to address chronic absenteeism in the State. Chronic absence, or
missing 10% of instructional days during a school year for any reason, including
disciplinary absences, aims to address the core reasons children miss instructional days.
Served as a member of the newly created CT Kids Report Card Strategic Action Group
(SAG) on School-Based Health Centers (SBHCs), looking at the potential of SBHCs to
achieve measurably better results for CT children in physical and behavioral health.
Continued to provide technical assistance to the Children’s RBA Report Card Working
Group to develop a Web-based platform, which is developing into “a central source for
all the data collected now and in the future on the well-being of Connecticut’s children
and youth.”
Proposed strategies to turn the curve:
Link parent awareness of the Report Card so the consumer can apply the data in
community engagement and in family choices about programs and policies. Inform
mayors, through the Children’s Subcommittee at the Connecticut Conference of
Municipalities (CCM), about the Report Card and how it can be used by towns.
Adopt a uniform definition for chronic absence in the state of CT and continue to
monitor improvements in the absentee rate in CT schools through the Children’s Report
Card.

69
Link Report Card information to children’s forums and policy debates so the data helps
drive the content direction.
Create a consumer-friendly system to access the data that is simple, accessible and offers
more and more tiers for depth.
Continue to bring information, data and insights to the School Based Health Center Kids
Report Card Strategic Action Group discussions.
Link the Report Card data to the Results First data (see below), where the content intersects
to create an integrated system of best practices for the consumer, regarding children.
Indicator 2: Return on Investment (Results First)
The story behind the baseline: Since the start of the recession in 2007, the state of Connecticut
has had to make difficult budget choices, reducing public services for many of our neediest
residents
In 1983, the Washington legislature established the Washington State Institute for Public Policy
(WSIPP) and its method of rigorous analysis of available research (Results First model) to help
state leaders: (1) systematically identify which programs work and which do not; (2) calculate
potential returns on investment of funding alternative programs; (3) rank programs based on
their projected benefits, costs, and investment risks; (4) identify ineffective programs that could
be targeted for cuts or elimination; and (5) predict the impact of different policy options.
WSIPP is now sharing its cost-benefit analysis tools for state government in a pilot program with
other states. The Commission, working with the Office of Policy and Management (OPM) and the
legislature’s Appropriations Committee, applied for a grant from the Pew Foundation to bring
the WSIPP model to Connecticut. Connecticut and 12 other states now participate in Pew’s
Results First initiative. The Initiative adapts the proven research and analysis model developed
and implemented WSIPP.
The Results First model uses the best national research to identify evidence-based programs that
work, and applies those findings to Connecticut-specific population data to estimate the fiscal
and policy impact of potential investments in programs that are designed to reduce crime and
recidivism. The first stage of the model in Connecticut is focusing on criminal justice, but it is
70
anticipated that the model will be expanded to evaluate critical programs in, child welfare, pre-
K–12 education, adult and children’s mental health, and substance abuse.
What the Commission did in 2014:
Continued to serve as the policy coordinator for the Connecticut Results First Initiative, chaired
by Representative Toni Walker and Office of Policy Management (OPM) Undersecretary
Michael Lawlor.
Serve as a statutory member of the Results First Policy Oversight Committee, (P.A. 13-247).
Worked with Pew Charitable Trust on the benefits of Results First for policy issues beyond
corrections and garnered a media expert on communications strategies for Connecticut.
Proposed strategies to turn the curve:
Work with state agencies that provide programmatic services, particularly to children and
youth, to generate sufficient and accurate data to ensure Connecticut has the best
information on programmatic fixed and marginal costs to evaluate return on investment.
Continue to participate on the Connecticut Results First Policy Oversight Committee and
Chair the policy workgroup to recommend procedures and policy directions based on
return on investment findings.
Indicator 3: Setting the National Standard for Family Civics
The story behind the baseline: Parent engagement and leadership is growing throughout the
states. However, accountability and evaluation are modest in this new policy arena. The
Commission on Children has become one model for Connecticut and other states in rigorous
family civics evaluation. An evaluation model in parent leadership emerged from the creation of
the Parent Leadership Training Institute (PLTI), a statewide family civics initiative created by the
Commission in 1992 to bolster child health, safety and learning.14
In 2005, the Commission also partnered with the Connecticut Center for School Change (CSC) to
create a parent leadership training initiative, Parents Supporting Education Excellence (PSEE),
14 Parents attend twenty weeks of classroom instruction and develop leadership skills to engage as partners for
children in their neighborhoods, schools, communities and in state and local government. Since its inception, PLTI has helped more than 3,000 parents across Connecticut lead for children.

71
focused on educational excellence. Annually, PLTI and PSEE are offered in 25 communities.
Connecticut has developed a comprehensive array of English and Spanish- language parent
leadership trainings over the past two decades, setting the national standard for family civics.
To measure the effectiveness of the PLTI and PSEE trainings, parents are asked a series of
questions when they start and end the leadership training. The annual pre & post-test data
measures learning & change along several key civic measures. In 2004 and 2009, the
Commission partnered with nationally recognized research entities to document the longitudinal
impact of the training as well.15
Liberty Bank Foundation is now working with us to expand our evaluation to include on-going
analysis of where graduates are, what they are doing and how to track gains as parent leaders
contribute significantly to improved child outcomes.
The 2004 evaluation conducted by the University of New Hampshire and the 2009 study
conducted by RMC research Corporation revealed that parent leadership training alumni:
Gained better understanding of how state and local government works;
Experienced more frequent use of civic skills;
Perceived a greater sense of civic empowerment in responding to community issues and
problems; and
Increase their engagement in civic activities.16
The Kellogg Foundation and the Connecticut Civic Health Advisory Council have both
recognized PLTI as a national best practice in family civic engagement. The Kellogg Foundation
provided funding for national replication of PLTI in 2010 and in 2013..
15 As part of the National PLTI Replication Project, a narrative paradigm has also been field tested to document the
impact of parent leadership training. While not yet available in Connecticut, this methodology offers questions for parents and members in the community on the parent’s community impact. Concurrent with this, research is being done to study the impact of peer network expansion, resulting from increased civic knowledge, self-esteem and self-efficacy. 16
66% practice what they learned on a weekly basis. 90% engage or work now with parents and communities that are different from them in race or culture.

72
What the Commission did in 2014:
Continued to improve an electronic version of our state evaluation model for parent
leadership in Connecticut and in our national replication project, funded by the Kellogg
Foundation. Evaluation performed by RMC Research.
Field tested a narrative story collection platform, designed by Anne Henderson of the
Annenberg Institute, funded by Kellogg Foundation that could be used in CT and in other
states. This will allow for stories of parent leaders to be offered to other parents, policy
leaders and communities, showing how parent leaders impact model policy..
Created a study group of researchers focused on developing a theory of change in parent
leadership that could be used in both Connecticut and in other states. This request came
from both philanthropy and the United States Domestic Policy Council, resulting from our
evaluation design for PLTI.
Met with Liberty Bank Foundation and other partners to begin design of longitudinal data
collection portal on all parent leadership graduate outcomes for all major parent
leadership training programs in Connecticut over a multi-year span of civic participation.
Participated in a national webinar on PLTI outcome data, sponsored by Grantmakers for
Children and Families.
Proposed Strategies to Turn the Curve:
Expand public awareness and information on parent leadership outcomes and
methodology.
Identify additional funding for more comprehensive, longitudinal research on the civic
impact of parent leadership training, as discussed above.
Develop a common platform and shared evaluation tool to measure civic gains across all
parent leadership training programs funded through the Parent Trust in Connecticut.
Identify and implement strategies to create a family engagement system that is integrated
and comprehensive, starting with the early years.
Assess and show how different policy areas in child health, safety and learning benefit from
parents as partners, utilizing the evaluation information.
Showcase civic projects of PLTI grads to show the community impact of parent leadership
in child policy and program gains.
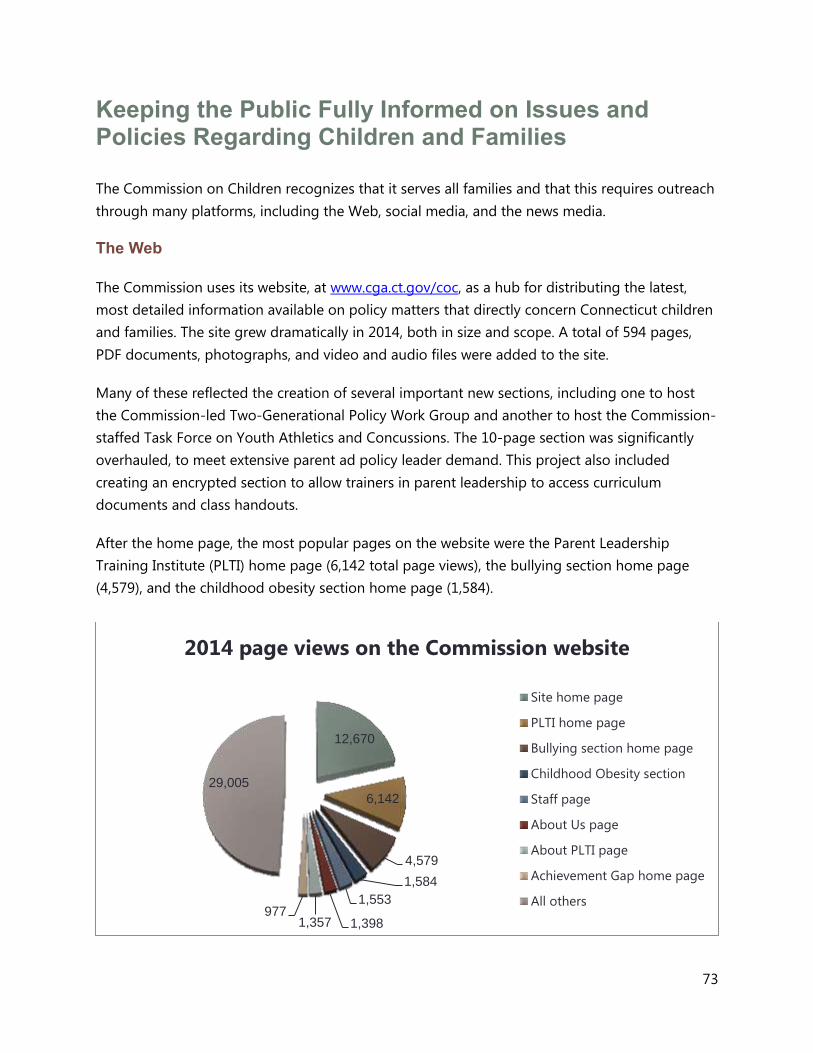
73
Keeping the Public Fully Informed on Issues and Policies Regarding Children and Families The Commission on Children recognizes that it serves all families and that this requires outreach
through many platforms, including the Web, social media, and the news media.
The Web
The Commission uses its website, at www.cga.ct.gov/coc, as a hub for distributing the latest,
most detailed information available on policy matters that directly concern Connecticut children
and families. The site grew dramatically in 2014, both in size and scope. A total of 594 pages,
PDF documents, photographs, and video and audio files were added to the site.
Many of these reflected the creation of several important new sections, including one to host
the Commission-led Two-Generational Policy Work Group and another to host the Commission-
staffed Task Force on Youth Athletics and Concussions. The 10-page section was significantly
overhauled, to meet extensive parent ad policy leader demand. This project also included
creating an encrypted section to allow trainers in parent leadership to access curriculum
documents and class handouts.
After the home page, the most popular pages on the website were the Parent Leadership
Training Institute (PLTI) home page (6,142 total page views), the bullying section home page
(4,579), and the childhood obesity section home page (1,584).
12,670
6,142
4,579
1,584
1,553
1,398 1,357 977
29,005
2014 page views on the Commission website
Site home page
PLTI home page
Bullying section home page
Childhood Obesity section
Staff page
About Us page
About PLTI page
Achievement Gap home page
All others

74
In addition, 2014 saw significant accessing of the Commission website through mobile devices—
another sign of a diversifying and technologically advancing audience. Specifically, 14 percent of
the 25,035 user sessions were held on mobile devices, while 6 percent were held on tablets.17
Webinars
The Commission also took advantage of the growing popularity of webinars, leading in three to
give more granular and customized information to citizens of Connecticut and elsewhere:
Webinars in which the Commission participated in 2014
Family Engagement and Parent Organizing
Host: Grantmakers for Children, Youth and Family
Date: April 22
Presentation Title: “Parent Leadership: A Civic Strategy for Children and Community”
Expanding our Definition of Family Engagement
Host: Help Me Grow
Date: August 26, 2014
Presentation Title: “Parent Leadership: A Civic Strategy for Children and Community”
Webinar: Top 10 for 2Gen
Host: Ascend at the Aspen Institute
Date: November 7, 2014
Presentation Title: State Snapshot: Connecticut
Social Media
Cognizant of the growing popularity of the Twitter social network, the Commission began using
Twitter as another avenue for connecting with Connecticut families, legislators, municipalities,
academia, and nonprofit organizations. It currently “tweets” at least once daily, alerting followers
to upcoming Commission events, the activities of Commission staffers, new information on the
Commission website, and important news articles concerning Connecticut children and families. ,
The effort has been successful, with total usage jumping by 71 percent in 2014 :
17 Source for website data: Google Analytics.

75
The Commission also continues to make extensive use of Facebook, posting at least once daily
concerning upcoming events and news articles concerning Connecticut children and families.
Because this platform allows for more interaction with users, the Commission usually tries to
begin dialogues, soliciting opinions on various events and topics. The strategy has worked.
Starting with 636 page “likes” at the start of 2014, the Commission ended the year with 780, for
an 82 percent increase. This in keeping the overall trend of recent years: 375 “likes” in 2011, 545
in 2012, and 636 in 2013.
News Media
Despite continued fragmentation of the traditional news media in Connecticut, the Commission
continued to work extensively with newspapers, radio stations, commercial and cable-access
television stations, and bloggers to communicate children’s policy issues. The backbone of this
effort has been the televising of the Commission’s public forums on the Connecticut Network
(CT-N), which reaches into nearly every home in Connecticut with cable service and presents its
programming online. CT-N carried seven Commission events in 2014, often broadcasting the
recordings several times.
300
400
500
600
700
800
900
Growth in Twitter followers in 2014
Source: Dashboard for Twitter account https://twitter.com/CtChildren

76
In addition, Commission staffers were interviewed for their expert insights by the Hartford
Courant, CT News Junkie, the Connecticut Mirror, the Norwich Bulletin, The Day of New London,
and other publications. They appeared on radio and television programs as well, such as WTIC-
AM’s “Mornings with Ray Dunaway,” and Fox CT’s “Stan Simpson Show.”
Steven Hernández, the
Commission’s director
of public policy and
research, was
interviewed by Fox CT
(WTIC-TV) at the
Legislative Office
Building in Hartford,
March 24, 2014, the
day the legislature’s
Education Committee
endorsed legislation to
curb chronic student
absenteeism.

77
R. David Addams, Executive Director of the Graustein Memorial Fund,
presented the “Parents as Partners” champions award at the Annual Stone
Soup Conference. Pictured above from left to right: R. David Addams, Elaine
Zimmerman, Gwen Samuels, Doug Edwards and Dawn Homer-Bouthiette.
Commission Honors in 2014: A Sampler
April 5: Commission Chair George Coleman and Executive Director Elaine Zimmerman were
among those honored by the Stepping Stones Children’s Museum in Norwalk at its annual
Kaleidoscope Ball.
May 20: The Kellogg Foundation selected the Parent Leadership Training Institute as a model
and best practice for the states in parent leadership, with attention to innovations and diversity.
July 30: Elaine Zimmerman traveled to the White House to participate in a symposium on how
to ensure quality family engagement.
October 28: PLTI alumni
Doug Edwards and Gwen
Samuels were recognized with
inaugural “Parents as
Partners” awards at the
annual Stone Soup
Conference, held as part of
the William Casper Graustein
Memorial Fund’s Discovery
Initiative. In addition, Director
of Parent Engagement and
Family Policy Dawn Homer-
Bouthiette and Executive
Director Elaine Zimmerman
received “Champion” honors.
Late 2014: Harvard University
selected the Commission on
Children as a finalist for model civic state entity for its creation and implementation of the Parent
Leadership Training Institute. Finalists will be narrowed down to five in 2015.

78

79
Commission on Children Members and Staff, 2014
Commission Members
Appointed by legislative leaders of both parties, serving on a volunteer basis.
George A. Coleman
Chair
Mark DeWaele, D.M.D.
Member At Large
Donna Grant
Mary Grace Reed
Vice-Chair
Alison Hilding
Member At Large
Donald R. Green
Deborah J. Poerio
Secretary
Josh Piteo
Member At Large
Jordan E. Grossman
Barbara J. Ruhe
Treasurer
James P. Cordier Susan B. Roman
Laura Lee Simon
Chair Emerita
Robert Francis
Ex-officio Members
Commissioner Joette Katz, Department of Children and Families
Designee: Dr. Stephen Tracy, Superintendent of Unified School District #2
Interim Commissioner Scott Semple, Department of Correction
Designee: Patricia Kupec, Correctional Counselor Supervisor
Commissioner Terrance W. Macy, Department of Developmental Services
Designee: Rod O'Connor, Legislative and Regulations Analyst
Commissioner Stefan Pryor, Department of Education
Commissioner Jewel Mullen, Department of Public Health
Designee: Rosa Biaggi, Chief of Family Health Section
Commissioner Roderick Bremby, Department of Social Services
Designee: Sylvia Gafford-Alexander, Project Director
Attorney General George C. Jepsen
Designee: Assistant Attorney General Jonathan Blake
Judge Barbara M. Quinn, Chief Court Administrator, Judicial Branch
Designee: Judge Peter Brown
Secretary Benjamin Barnes, Office of Policy and Management
Designee: Anne Foley, Senior Policy Advisor
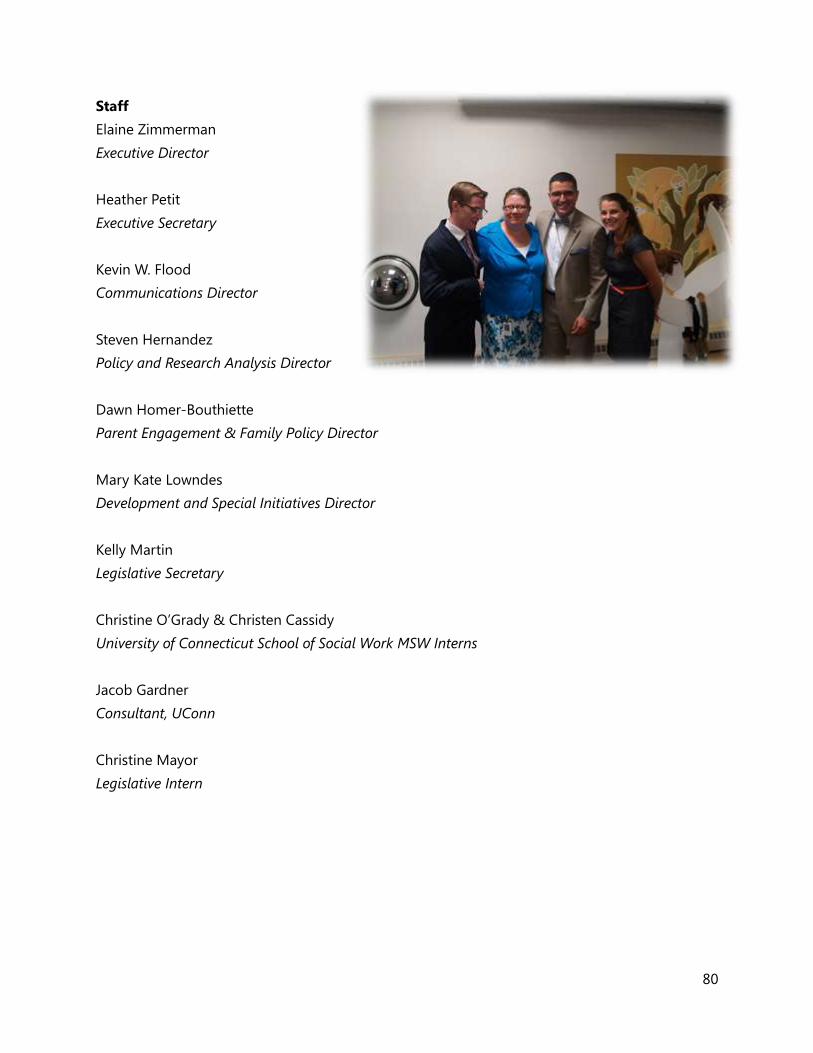
80
Staff
Elaine Zimmerman
Executive Director
Heather Petit
Executive Secretary
Kevin W. Flood
Communications Director
Steven Hernandez
Policy and Research Analysis Director
Dawn Homer-Bouthiette
Parent Engagement & Family Policy Director
Mary Kate Lowndes
Development and Special Initiatives Director
Kelly Martin
Legislative Secretary
Christine O’Grady & Christen Cassidy
University of Connecticut School of Social Work MSW Interns
Jacob Gardner
Consultant, UConn
Christine Mayor
Legislative Intern

For additional copies of this report, contact the Connecticut Commission on Children at:
Mailing address: 18-20 Trinity Street, Hartford, Connecticut 06106
Phone: (860)240-0290
E-mail: [email protected]
It may also be downloaded from the Commission website, at:
www.cga.ct.gov/coc/annual_reports.htm