Embed Size (px)
Citation preview

Congestion Management Process: A Guidebook

Quality Assurance Statement
The Federal Highway Administration (FHWA) provides high-quality information to serve Government, industry, and the public in a manner that promotes public understanding. Standards and policies are used to ensure and maximize the quality, objectivity, utility, and integrity of its information. FHWA periodically reviews quality issues and adjusts its programs and processes to ensure continuous quality improvement.

1200 New Jersey Ave., SE Washington, D.C. 20590
In Reply Refer To: HEPP-1 Dear Colleague: The Federal Highway Administration’s (FHWA) Office of Planning, Environment, and Realty, in collaboration with the FHWA Office of Operations and the Federal Transit Administration’s (FTA) Office of Planning and Environment, has developed two new products to advance the Congestion Management Process (CMP). These two products, The Congestion Management Process: A Guidebook and a summary report Showcasing Visualization Tools in Congestion Management, have been developed to act as a companion package of documents and reflect strong, continuing collaboration among FHWA, FTA, and professionals in metropolitan transportation planning processes nationwide. These documents stand as products of FHWA’s and FTA’s on-going effort to provide assistance in implementing key provisions of the Safe, Accountable, Flexible, Efficient Transportation Equity Act: A Legacy for Users. These documents do not create new requirements, but merely provide suggested approaches for integrating the CMP into metropolitan transportation planning processes. We look forward to receiving your feedback, reactions, and experiences in implementing these concepts and utilizing these resources. Please direct any comments, questions, and suggestions to Egan Smith at [email protected] or (202-366-6072); or John Sprowls at [email protected] or (202-366-5362).
Sincerely yours,
__________________________ ___________________________. James A. Cheatham, Director Charles R. Goodman, Director FHWA Office of Planning FTA Office of Systems Planning

This page is intentionally left blank.
Technical Report Documentation Page
1. Report No. FHWA-HEP-11-011
2. Government Accession No.
3. Recipient’s Catalog No.
4. Title and Subtitle 5. Report Date April 2011
Congestion Management Process: A Guidebook 6. Performing Organization Code
7. Authors Michael Grant (ICF), Beverly Bowen (ICF), Matthew Day (ICF), Robert Winick (Motion Maps), Jocelyn Bauer (SAIC), Anna Chavis (ICF), Stephanie Trainor (ICF)
8. Performing Organization Report No.
9. Performing Organization Name and Address ICF International, Inc. 9300 Lee Highway Fairfax, VA 22031
Motion Maps, LLC 1424 Fallswood Drive Rockville, MD 20854
Science Applications International Corporation (SAIC) 8301 Greensboro Drive McLean, VA 22102
10. Work Unit No. (TRAIS) 11. Contract or Grant No. DTFH61-09-Q-00083
12. Sponsoring Agency Name and Address United States Department of Transportation Federal Highway Administration 1200 New Jersey Ave. SE Washington, DC 20590
13. Type of Report and Period Covered September 2009-April 2011 14. Sponsoring Agency Code HEP
15. Supplementary Notes Mr. Egan Smith, Federal Highway Administration, COTR 16. Abstract This publication is a guidebook designed to provide information on how to create an objectives-driven, performance-based congestion management process (CMP). This guidebook describes a flexible framework of 8 actions that should be included in the development of a CMP. It also highlights the role of the CMP in addressing multiple objectives, including livability, multimodal transportation, linkages with environmental review, collaboration with partners and stakeholders, demand management and operations strategies, and effective practices for documentation and visualization. 17. Key Words Congestion management process, transportation operations, performance-based, objectives-driven, performance measures, planning for operations, regional goals and objectives, operations data, visualization, multimodal, metropolitan planning, data collection
18. Distribution Statement No restrictions. This document is available to the public from the National Technical Information Service, Springfield, VA 22161.
19. Security Classif. (of this report) Unclassified
20. Security Classif. (of this page) Unclassified
21. No. of Pages 68
22. Price N/A
Form DOT F 1700.7 (8-72) Reproduction of completed page authorized
Acknowledgements
This document was developed with input from many individuals from metropolitan planning organizations
(MPOs) across the country, and active participation and support from the Association of Metropolitan
Planning Organizations (AMPO). FHWA and FTA would specifically like to thank the following individuals
for their contributions that helped to shape this document:
Jane Hayse, Atlanta Regional Commission
Kofi Wakhisi, Atlanta Regional Commission
Efi Pagitsas, Boston Region MPO
Michelle Meaux, Capital Area MPO
Cathy Stephens, Capital Area MPO
Chris O’Neill, Capital District Transportation Committee
Ali Banakdar, Corvallis Area Metropolitan Planning Organization
Jesse Buerk, Delaware Valley Regional Planning Commission
Zoe Neaderland, Delaware Valley Regional Planning Commission
Tonya Winkler, Denver Regional Council of Governments
Joe Zambito, Hillsborough County MPO
Jeff Kaufman, Houston-Galveston Area Council
Phil Williams, Kentuckiana Regional Planning & Development Agency
Eric Hill, Metroplan Orlando
Ana Ramirez, Miami Valley Regional Planning Commission
Ron Achelpohl, Mid America Regional Council
Andrew Meese, National Capital Region Transportation Planning Board
Jan Khan, New York Metropolitan Transportation Council
Natalie Bettger, North Central Texas Council of Governments
Ralph Zaragoza, North Central Texas Council of Governments
Andy Reser, Ohio-Kentucky-Indiana Regional Council of Governments
Paul Casertano, Pima Association of Governments
Robin Mayhew, Puget Sound Regional Council
Stephanie Rossi, Puget Sound Regional Council
Doug Smith, Southwestern Pennsylvania Commission
Dan Blevins, Wilmington Area Planning Council

Table of Contents i
Table of Contents 1–Introduction ........................................................................................................................................ 1
1.1 – What is a CMP?.................................................................................................................................................. 1
1.2 – History of the CMP ........................................................................................................................................... 2
1.3 – Why is a CMP useful? ....................................................................................................................................... 2
1.4 – What is the Purpose of this Guidebook? ....................................................................................................... 4
1.5 – The CMP as an Integral Part of the Metropolitan Planning Process ........................................................ 5
2–Process Model .................................................................................................................................... 7
2.1 – Action 1: Develop Regional Objectives for Congestion Management ..................................................... 9
2.2 – Action 2: Define CMP Network ................................................................................................................... 14
2.3 – Action 3: Develop Multimodal Performance Measures ............................................................................ 15
2.4 – Action 4: Collect Data / Monitor System Performance ........................................................................... 26
2.5 – Action 5: Analyze Congestion Problems and Needs ................................................................................. 30
2.6 – Action 6: Identify and Assess CMP Strategies ............................................................................................ 32
2.7 – Action 7: Program and Implement CMP Strategies .................................................................................. 38
2.8 – Action 8: Evaluate Strategy Effectiveness ................................................................................................... 40
3–The CMP within the Regional Transportation Planning Context .................................................... 41
3.1 – Collaboration among Stakeholders ............................................................................................................... 41
3.2 – Livability and Multimodal Considerations in the CMP ............................................................................. 42
3.3 – Single Occupant Vehicle (SOV) Capacity-Adding Projects and the Role of Demand Management
and Operations Strategies ........................................................................................................................................ 45
3.4 – Linkage to NEPA and the Project Development Process ........................................................................ 47
3.5 – Documentation of the CMP .......................................................................................................................... 49
4–Using Visualization as a Communication and Analysis Tool ......................................................... 50
4.1 – The Role of Visualizations in the CMP ....................................................................................................... 50
4.2 – Data Used in Visualizations ........................................................................................................................... 51
4.3 – Visualization Methods Used in CMP Activities ......................................................................................... 51
4.4 – Lessons Learned on Effective Visualization ............................................................................................... 61
5–Conclusion ....................................................................................................................................... 62
Appendix A – Legislative Language .................................................................................................... 64
Appendix B – Regulation ..................................................................................................................... 65

ii Congestion Management Process: A Guidebook

Introduction 1
―The transportation planning process
in a TMA shall address congestion
management through a process that
provides for safe and effective
integrated management and operation
of the multimodal transportation
system, based on a cooperatively
developed and implemented
metropolitan-wide strategy, of new and
existing transportation
facilities…through the use of travel
demand reduction and operational
management strategies.
The development of a congestion
management process should result in
multimodal system performance
measures and strategies that can be
reflected in the metropolitan
transportation plan and TIP.‖
23 CFR 450.320(a) and (b).
Metropolitan Transportation Planning,
Final Rule, February 14, 2007.
1–Introduction
1.1 – What is a CMP?
Congestion management is the application of strategies to
improve transportation system performance and reliability by
reducing the adverse impacts of congestion on the movement of
people and goods. A congestion management process (CMP) is a
systematic and regionally-accepted approach for managing
congestion that provides accurate, up-to-date information on
transportation system performance and assesses alternative
strategies for congestion management that meet state and local
needs. The CMP is intended to move these congestion
management strategies into the funding and implementation
stages.
The CMP, as defined in federal regulation, is intended to serve as
a systematic process that provides for safe and effective
integrated management and operation of the multimodal
transportation system. The process includes:
Development of congestion management objectives
Establishment of measures of multimodal transportation
system performance
Collection of data and system performance monitoring to
define the extent and duration of congestion and determine
the causes of congestion
Identification of congestion management strategies
Implementation activities, including identification of an implementation schedule and possible funding
sources for each strategy
Evaluation of the effectiveness of implemented strategies
A CMP is required in metropolitan areas with population exceeding 200,000, known as Transportation
Management Areas (TMAs). Federal requirements also state that in all TMAs, the CMP shall be developed
and implemented as an integrated part of the metropolitan transportation planning process. While not
required in MPOs with populations below 200,000, the decision-making process represented by the CMP can
still serve as a valuable approach at these smaller Metropolitan Planning Organizations (MPOs). This is
especially true in MPOs that are close to the 200,000 TMA population cutoff, which may benefit from
developing a CMP in preparation for becoming a TMA.
In TMAs designated as ozone or carbon monoxide non-attainment areas, the CMP takes on a greater
significance. Federal law prohibits projects that result in a significant increase in carrying capacity for single-
occupant vehicles (SOVs) from being programmed in these areas unless the project is addressed in the
region‘s CMP. The CMP must provide an analysis of reasonable travel demand reduction and operational
management strategies; if the analysis demonstrates that these strategies cannot fully satisfy the need for

2 Congestion Management Process: A Guidebook
additional capacity and additional SOV capacity is warranted, then the CMP must identify strategies to
manage the SOV facility safely and effectively, along with other travel demand reduction and operational
management strategies appropriate for the corridor.
Although a CMP is required in every TMA, federal regulations are not prescriptive regarding the methods and
approaches that must be used to implement a CMP. This flexibility has been provided in recognition that
different metropolitan areas may face different conditions regarding traffic congestion and may have different
visions of how to deal with congestion. As a result, TMAs across the country have demonstrated compliance
with the regulations in different ways. For many MPOs, the CMP has become an important tool for
addressing persistent congestion problems and for prioritizing investments. The examples in this guidebook
illustrate these uses, as well as linkages to other aspects of the planning and project development process.
The flexibility in the development of the CMP allows MPOs to design their own approaches and processes to
fit their individual needs. The CMP is an on-going process, continuously progressing and adjusting over time
as goals and objectives change, new congestion issues arise, new information sources become available, and
new strategies are identified and evaluated.
Appendix A includes language on the CMP from the Safe, Accountable, Flexible, Efficient Transportation
Equity Act: A Legacy for Users (SAFETEA-LU), identifying the legal requirement for a CMP. 23 CFR Part
450 Section 320 identifies the specific federal requirements for a CMP, and is included in Appendix B.
1.2 – History of the CMP
The Congestion Management System (CMS) was first introduced by the Intermodal Surface Transportation
Efficiency Act (ISTEA) of 1991 and continued under the successor law, the Transportation Equity Act for
the 21st Century (TEA-21). The CMS was intended to augment and support effective decision making as part
of the overall metropolitan transportation planning processes.
Whereas previous laws referred to this set of activities as a ―congestion management system‖ (CMS), the
most recent surface transportation authorization law, the Safe, Accountable, Flexible, Efficient
Transportation Equity Act: A Legacy for Users (SAFETEA-LU), refers to a ―congestion management
process,‖ reflecting that the goal of the law is to utilize a process that is an integral component of
metropolitan transportation planning.
While the CMS was often treated as a stand-alone data analysis exercise or report on congestion, the CMP is
intended to be an on-going process, fully integrated into the metropolitan transportation planning process.
The CMP is a ―living‖ document, continually evolving to address the results of performance measures,
concerns of the community, new objectives and goals of the MPO, and up-to-date information on congestion
issues.
1.3 – Why is a CMP useful?
Traffic congestion continues to challenge our nation‘s transportation system, resulting in billions of gallons of
wasted fuel, hours of wasted time, and costs to the economy. The Texas Transportation Institute estimates
that traffic congestion costs the nation 2.8 billion gallons in wasted fuel and 4.2 billion hours of wasted time

Introduction 3
per year.1 Efforts to address congestion in urban areas are one of the primary demands on transportation
funding.
A successful CMP offers many benefits to the regional transportation system. Congestion concerns inevitably
tie into community objectives regarding transit use, livability, and land use. When identifying goals and
actions to address regional congestion, other planning goals should be considered as well in order to create
one unified and efficient approach, thereby helping to ensure that the region‘s transportation investments
support the desired vision of the community. The CMP is therefore not intended to be a standalone process,
but instead an integral part of a larger overall planning process. Some specific benefits of the CMP are noted
below.
A Structured Process for Analyzing Congestion Issues
The CMP creates a structured process for incorporating congestion issues into the metropolitan
transportation planning process. By addressing congestion through a process that involves developing
congestion management objectives, developing performance measures to support these objectives, collecting
data, analyzing problems, identifying solutions, and evaluating the effectiveness of implemented strategies, the
CMP provides a framework for responding to congestion in a consistent, coordinated fashion. The CMP
both informs and receives information from other elements of the planning process, including the
Metropolitan Transportation Plan (MTP) and Transportation Improvement Program (TIP).
An Objectives-Driven, Performance-based Approach
The CMP is intended to use an objectives-driven, performance-based approach to planning for congestion
management. Through the use of congestion management objectives and performance measures, the CMP
provides a mechanism for ensuring that investment decisions are made with a clear focus on desired
outcomes. This approach involves screening of strategies using objective criteria, relying on system
performance data, analysis, and evaluation. In turn, this approach can help to demonstrate which congestion
management strategies are most effective over time, assess why they work (or do not), and help practitioners
to target individual strategies to those locations where they may be most successful at reducing congestion.
In some regions, the CMP may function as a primary mechanism for an objectives-driven, performance-based
approach to integrating management and operations (M&O) strategies into the planning process. More
information on this approach is available on U.S. Department of Transportation‘s Planning for Operations
website – http://www.plan4operations.dot.gov.
Increased Collaboration and Coordination
The CMP often brings an expanded group of partners and stakeholders into the metropolitan transportation
planning process, including agencies responsible for transportation system operations (e.g., state and local
transportation agencies, toll authorities, transit agencies), land use planning agencies, transportation
management associations, and the public. In particular, the involvement of many stakeholders is often
important in developing agreed-upon regional objectives for congestion management and appropriate
performance measures. Many agencies may be involved in collecting data for the CMP, including operations
agencies that may provide real-time data from Intelligent Transportation Systems (ITS), transit agencies, state
police and safety agencies, and others. These stakeholders can also help to identify strategies, such as demand
management approaches (e.g., road pricing, parking management, ridesharing incentives) and operational
1 Texas Transportation Institute, 2009 Urban Mobility Report. Citing data for 2007.
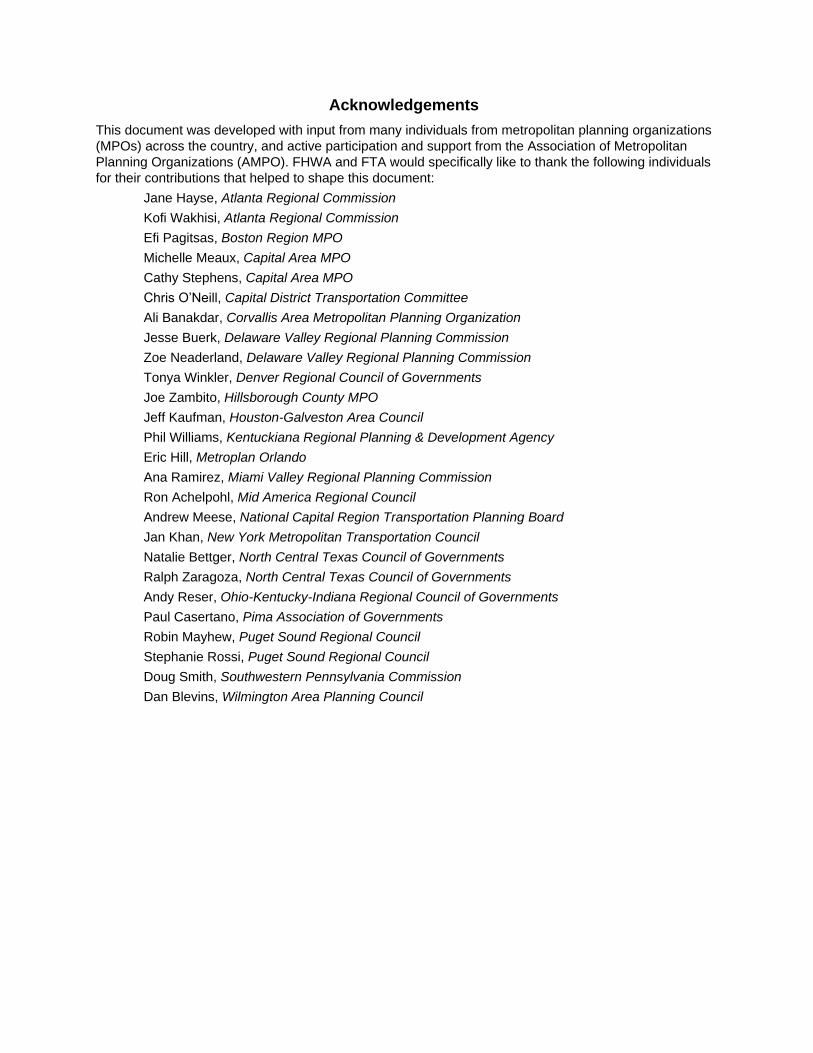
4 Congestion Management Process: A Guidebook
strategies (e.g., transit signal priority, traffic signal coordination, incident management), that traditionally may
not have been considered in the planning process. Collaboration among practitioners is a key element in a
successful CMP.
More Effective Resource Allocation
One of the potential benefits of the CMP is a more effective allocation of limited transportation funding
among operations and capital projects and programs. The CMP provides a mechanism for identifying short,
medium, and long-term strategies for addressing congestion on a system-wide, corridor-level, and site-specific
basis. It also highlights travel demand management and operations strategies that historically may not have
been a focus of metropolitan transportation planning, and can bring attention to issues such as transportation
system reliability and non-recurring congestion, which are not well addressed through traditional
transportation demand modeling.
By providing information to decision-makers on system performance and the effectiveness of potential
solutions and implemented strategies, alternatives to major capital investments can be identified and
considered along with the need for infrastructure improvement. Demand management and operations
strategies may be more cost-effective in the short-term than larger capacity adding projects, or could be
integrated into capacity projects in order to enhance their effectiveness. A CMP can be designed to swiftly
address small-scale congestion problems that threaten the efficiency of the regional transportation network.
Prioritization criteria and funding set-asides can be established to support small-scale projects such as
bottleneck relief projects and traffic signal coordination that may help to address immediate transportation
challenges, serving as a critical link between strategy identification and implementation.
In addition, by examining congestion in the context of multiple goals, the CMP provides information to help
make tradeoffs among various issues important to the public, including safe bicycling and walking options
and support for livable communities. By considering all of the factors that are important to the public, the
CMP helps to ensure the development of appropriate congestion management strategies that fit within the
context of the community and help to support the regional vision.
Linkage to Project Development and Environmental Review
Finally, the CMP is not only an integral part of the planning process, but can also help to link planning and
project development by providing information to support the environmental analysis conducted under the
National Environmental Policy Act (NEPA). The CMP, if appropriately developed, can provide a valuable
starting point for identifying a project‘s purpose and need, and for alternatives development and screening.
Rather than starting from a blank page, the data and decisions made during the planning process can carry
forward to feed into the NEPA process.
1.4 – What is the Purpose of this Guidebook?
This guidebook provides practitioners with an understanding of the individual elements of a CMP and
includes practical examples of how to implement a successful process based on lessons learned from MPOs
across the country. The Process Model included in this document is intended to assist practitioners in their
efforts to integrate the CMP into the metropolitan transportation planning process, including the
development of the MTP and the TIP.
Introduction 5
In 2008, FHWA and FTA released two companion interim guidebooks: An Interim Guidebook on the
Congestion Management Process in Metropolitan Transportation Planning and Management & Operations in
the Metropolitan Transportation Plan: A Guidebook for Creating an Objectives-Driven, Performance-Based
Approach (Interim Draft). These interim guidebooks are available at http://www.plan4operations.dot.gov.
Following the development of the interim guidebooks, FHWA and FTA conducted a wide-ranging outreach
program to showcase the guidebooks and receive additional input on the approaches recommended in the
documents. In response, FHWA and FTA developed an updated guidebook, Advancing Metropolitan
Planning for Operations: An Objectives-Driven, Performance-Based Approach – A Guidebook in 2010,
which describes an approach to advance planning for operations, including the role of the CMP.
This CMP guidebook builds on the Interim CMP Guidebook and the Advancing Metropolitan Planning for
Operations guidebook, which focus on an objectives-driven, performance-based approach to address
congestion and the relationship between the CMP and efficient system management and operations. This
guidebook underscores the importance of developing congestion management objectives appropriate to the
region and using performance measures to understand congestion problems, assess potential solutions, and
evaluate implemented strategies. Moreover, it goes beyond the previous documents by emphasizing the role
of the CMP in addressing multiple objectives, including livability, accessibility and mobility, multimodal
connectivity, and economic vitality. It also highlights effective practices for documentation and visualization
of congestion information, and includes more case study examples of CMP practices at MPOs around the
country. In-depth case studies of the CMP at several MPOs also have been developed in association with this
guidebook, and are available on the Planning for Operations website
(http://plan4operations.dot.gov/congestion.htm) and the FHWA/FTA Transportation Planning Capacity
Building website (http://www.planning.dot.gov/).
1.5 – The CMP as an Integral Part of the Metropolitan Planning Process
Transportation planning within a metropolitan region represents a comprehensive, continuing, and
cooperative (3C) process to support the needs, vision, and goals of the region. The individual aspects of
MPO planning, including the development of the Metropolitan Transportation Plan (MTP), the
Transportation Improvement Program (TIP), the Unified Planning Work Program (UPWP), and the
Congestion Management Process (CMP), represent the tools that policy makers use to implement their
adopted vision and goals. Integration of these elements is a key feature of a comprehensive planning
process. Regardless of how an individual MPO structures its CMP, the process is both supportive of and
supported by the other activities.
A continuing planning process requires that each of the required products (MTP, TIP, UPWP, CMP)
undergoes review and update on a periodic basis. Federal regulations establish minimum update schedules
for both the MTP and the TIP; however, there is flexibility within the requirements that allow state DOTs
and MPOs to coordinate their plans and programs. The MTP cycle is different for areas that are in
attainment (every five years) and those that are non-attainment with respect to air quality (every four years).
The required update deadline of the MTP is specific to the individual MPO and is based on the date
designated as a TMA. The TIP is required to be updated at least every four years. Many states have adopted
an annual or biennial update schedule for the State Transportation Improvement Program (STIP), and the
6 Congestion Management Process: A Guidebook
MPOs coordinate their TIP updates accordingly. As a result, the cycle for the MTP update may be unrelated
to the TIP cycle.
Designation of an MPO as a Transportation Management Area (TMA) invokes the requirement for the CMP.
Although the CMP does not have an update cycle established by federal regulations, both the four-year
certification review cycle and the four- or five-year MTP update cycle for each TMA provide a baseline for a
re-evaluation/update cycle in the absence of an identified requirement. The CMP must, at minimum, be
updated often enough to provide relevant, recent information as an input to each MTP update. In order to
establish a routine CMP review, many MPOs have chosen to link CMP updates to either the MTP or TIP
development cycle. The CMP may also operate on an independent update schedule and provide input to
both the MTP and the TIP.
The cooperative aspect of the 3C process also can be viewed within the CMP with respect to data collection
and analysis. Both the CMP and the MTP are data-driven planning efforts that rely on an understanding of
the existing conditions of the transportation system to make projections of future conditions. However,
because the CMP identifies areas with significant congestion, it provides an opportunity to consider detailed
data on the operation of individual segments and corridors. Along with the use of more detailed data often
comes the use of analysis tools and techniques that are not commonly used in long-range planning. The
CMP can be greatly enhanced by data sharing among planning partners, as well as supporting resources such
as tools and knowledgeable staff. Although this finer level of data and analysis may establish a more robust
understanding of the existing conditions, projections of future congested areas still rely upon travel demand
models and system-level analysis. As agencies collect operations data on individual corridors or segments
over time, identified trends may inform traffic forecasting techniques to more strongly connect observations
and analysis of existing congestion and the strategies available to address it with the development of scenarios
to mitigate congestion in the future, and may also be a useful tool in calibration/validation of the travel
demand model.
The CMP mirrors the elements of the transportation planning process shown in Figure 1. The strong
similarities between the activities in both the CMP and the overall transportation planning process facilitate
the integration of the CMP into the planning process. The development of regional objectives for the CMP
responds to the goals and vision for the region established early in the transportation planning process. As
part of the CMP, congestion management strategies are identified, assessed, programmed, implemented, and
evaluated. Those activities occur for all types of improvement strategies in the transportation planning
process and are reflected in the elements shown in Figure 1. The connections provide opportunities for
conducting the CMP in conjunction with, or completely integrated with, the overall metropolitan
transportation planning process.
The Interim CMP Guidebook provided in 2008, along with its companion, Management and Operations in the
Metropolitan Transportation Plan: A Guidebook for Creating an Objectives-Driven, Performance-Based Approach (Interim
Draft), were part of initial efforts to incorporate operational strategies into the MPO planning process using
an objectives-driven, performance-based approach. The use of performance measures, data collection, and
analysis within the CMP is compatible with a systems operations approach. The framework for an integrated
CMP provided in this guidebook is intended to support the use of appropriate demand management,
operations, and other strategies to meet transportation needs, for inclusion in both the MTP and the TIP.

The CMP within the Regional Transportation Planning Context 7
Figure 1. The Transportation Planning Process
Source: U.S Department of Transportation, FHWA and FTA ―The Transportation Planning Process: Key Issues - A Briefing Book
for Transportation Decisionmakers, Officials, and Staff,‖ Updated September 2007, Publication Number: FHWA-HEP-07-039.
Available at: http://www.planning.dot.gov/documents/BriefingBook/BBook.htm.
2–Process Model The Process Model that follows is built upon activities or ―actions‖ that are common to successful CMPs,
and at a basic level must be implemented to comply with federal regulations. The actions, however, may be
integrated into the MPO planning process in many different ways, providing a flexible framework from which
MPOs can develop an individualized CMP approach. This guidebook also provides suggestions of good
practices and examples of effective approaches associated with each of these actions.
The elements of a successful CMP defined in the Process Model that follows serve as a guide for the actions
to be taken in developing a CMP. Whereas the Interim Guidebook referred to ―steps‖ in the CMP, they are
referred to here as ―actions‖, recognizing that while the CMP includes a general sequence of activities, the
cyclical nature of the metropolitan planning process means that there are iterations within the sequence, and
MPOs may have some variations to this approach. These eight actions – and related questions – include:

8 Congestion Management Process: A Guidebook
1. Develop Regional Objectives for Congestion Management – First, it is important to consider,
―What is the desired outcome?‖ and ―What do we want to achieve?‖ It may not be feasible or desirable
to try to eliminate all congestion, and so it is important to define objectives for congestion management
that achieve the desired outcome. Some MPOs also define congestion management principles, which
shape how congestion is addressed from a policy perspective.
2. Define CMP Network – This action involves answering the question, ―What components of the
transportation system are the focus?‖, and involves defining both the geographic scope and system
elements (e.g., freeways, major arterials, transit routes) that will be analyzed in the CMP.
3. Develop Multimodal Performance Measures – The CMP should address, ―How do we define and
measure congestion?‖ This action involves developing performance measures that will be used to
measure congestion on both a regional and local scale. These performance measures should relate to, and
support, regional objectives.
4. Collect Data/Monitor System Performance – After performance measures are defined, data should be
collected and analyzed to determine, ―How does the transportation system perform?‖ Data collection
may be on-going and involve a wide range of data sources and partners.
5. Analyze Congestion Problems and Needs – Using data and analysis techniques, the CMP should
address the questions, ―What congestion problems are present in the region, or are anticipated?‖ and
―What are the sources of unacceptable congestion?‖
6. Identify and Assess Strategies – Working together with partners, the CMP should address the
question, ―What strategies are appropriate to mitigate congestion?‖ This action involves both identifying
and assessing potential strategies, and may include efforts conducted as part of the MTP, corridor studies,
or project studies.
7. Program and Implement Strategies – This action involves answering the question, ―How and when
will solutions be implemented?‖ It typically involves including strategies in the MTP, determining
funding sources, prioritizing strategies, allocating funding in the TIP, and ultimately, implementing these
strategies.
8. Evaluate Strategy Effectiveness – Finally, efforts should be undertaken to assess, ―What have we
learned about implemented strategies?‖ This action may be tied closely to monitoring system
performance under Action 4, and is designed to inform future decision making about the effectiveness of
transportation strategies.
The graphic that follows illustrates these actions, and highlights the cyclical nature of the process. While
these actions are presented in a linear form, it is important to recognize that within the cycles of
transportation planning, some of these actions may be revisited, or occur on an on-going basis, while others
may not. For instance, in updating the MTP, the MPO may revisit or develop new congestion management
objectives, which may lead to development of new performance measures; but the MPO might not redefine
other aspects of its CMP at the same time. The CMP network might not be updated with each update of the
MTP, and data collection activities may occur on an annual basis or some other cycle. Consequently, the
Process Model is not intended to serve as a step-by-step approach, but is intended to convey the general flow
of the approach, building on regional objectives to implementation of strategies, and evaluation of their
effectiveness.

The CMP within the Regional Transportation Planning Context 9
Figure 2. Elements of the Congestion Management Process
The process model actions are discussed with illustrated examples from current MPO practices in the
following text.
2.1 – Action 1: Develop Regional Objectives for Congestion Management
The starting point for the CMP is the development of
regional objectives for congestion management. These
objectives should draw from the regional vision and goals
that are articulated in the MPO‘s MTP. Congestion
management objectives also may be developed for the
CMP as part of the long-range transportation planning
process and incorporated directly into the MTP. In some
cases, MPOs develop objectives specifically for the CMP;
in other cases, congestion management objectives from
other sources (e.g. the MTP or a regional vision document)
are used to guide the CMP.
Develop Regional
Objectives
Define CMP Network
Develop Multimodal
Performance Measures
Program and Implement
Strategies
Collect Data/Monitor
System Performance
Analyze Congestion
Problems and Needs
Identify and Assess
Strategies
Evaluate Strategy
Effectiveness
What do we want to achieve?
Congestion management objectives define
what the region wants to achieve in regard
to congestion management. Eliminating
traffic congestion may not be possible,
particularly in fast growing regions.
Moreover, eliminating congestion may not
actually be desired if it comes at the
expense of economic vitality, community
livability, or bicycle/pedestrian access.
Therefore, it is important to define what is
considered ―unacceptable congestion‖ and
set appropriate objectives for congestion
management that support regional goals.
Federal regulation (23 CFR 450.320 (c) 2)
requires congestion management
objectives as part of the CMP.

10 Congestion Management Process: A Guidebook
The Role of Congestion Management Objectives
Congestion management objectives define what the region wants to achieve regarding congestion
management, and are an essential part of an objectives-driven, performance-based approach to planning for
operations. Congestion management objectives should serve as one of the primary points of connection
between the CMP and the MTP, and will serve as a basis for defining the direction of the CMP and
performance measures that are used.
Historically, the development of congestion management objectives has often been missing from the CMP,
particularly if the process was primarily envisioned as a data collection and analysis exercise. However, to
effectively address congestion, it is vital to specify objectives that the region would like to achieve. In
developing objectives for congestion management, it is important for MPOs to consider how to define these
objectives such that they support a range of regional goals. Looking at the role of congestion management in
the context of livability, economic vitality, safety, and multimodal access helps to ensure an efficient use of
resources and ultimately will lead to strategies that help to achieve the regional vision. These objectives are
typically developed by the policy board of the MPO or a designated subcommittee of elected officials, with
technical input from staff, often with the involvement of the public and stakeholders.
The congestion management objectives should reflect the priorities of the MPO, and should serve as a
valuable tool for the MPO to assess how well its actions and policies are helping to achieve its goals.
Objectives are not designed to measure the ―success‖ or ―failure‖ of specific programs, activities, or projects
– they are meant to address regional priorities to help guide the direction of future decision making. Objectives
should be derived from the vision and goals articulated in the MTP and other plans of the region. The vision
and goals will likely be developed early in the planning process, but the development of congestion
management objectives may help sharpen and focus the goals.
Understanding What the Public Wants
The development of congestion management objectives should rely heavily on stakeholder participation and
an understanding of the needs and desires of the public related to congestion. This may be identified through
the public involvement aspects of the long-range transportation planning process, as well as through what
stakeholders articulate at the local level, such as through corridor studies and project-related efforts. Some
regions have also used public opinion surveys to understand the priorities of the public, and stakeholder work
groups as a basis for developing objectives.
Traditionally, the CMP has often focused on capacity issues, and used engineering measures focused on
motor vehicles, such as volume-to-capacity ratios. In defining appropriate congestion management
objectives, planners and decision-makers should consider the following questions:
What does the public really care about with regard to congestion?
How high of a priority is traffic congestion in the region?
What type of congestion is most problematic for the public and freight shippers?
What aspects of congestion are most important to address to support livability, safety, and economic
vitality, among other goals?
Answering these questions may lead to objectives that are quite different from a traditional approach focusing
on addressing level of service (LOS) deficiencies or easing vehicle traffic congestion. For instance, some
The CMP within the Regional Transportation Planning Context 11
regions have found that focusing on the aspects of congestion that stakeholders and the public care about
most can lead to a focus on issues such as:
Improving transportation system reliability,
Increasing multimodal options so that people have greater choices and the ability to avoid traffic
congestion,
Focusing attention on strategic freight corridors or economic development corridors,
Creating greater accessibility through smart growth development patterns that reduce the need for vehicle
travel, or
Providing improved traveler information so that the public can make more informed travel choices.
In other words, the objectives that guide the CMP are not limited to the traditional measures such as level of
service – a CMP can also address other issues that are affected by or have an effect on congestion.
Characteristics of Congestion Management Objectives
Regional objectives should ideally focus on outcomes – such as hours of delay, system reliability, and access
to traveler information. However, they may also be written using output measures – such as incident
clearance time or number of traffic signals retimed annually. In all cases, objectives should be stated in a way
that meaningful performance measures can be derived from the objectives.
Objectives are specific, measurable statements developed in collaboration with a broad range of regional
partners. They are regional or multi-jurisdictional in nature. The objectives should be defined in a manner
that allows practitioners to focus on specific aspects of congestion and to advance a timeframe within which
the objectives can be attained. Objectives generally lead directly to a performance measure that can be used
to assess whether or not the objective has subsequently been achieved. They can be tracked and/or
monitored on a regional level and inform cyclical investment decisions.
An ideal objective should have ―SMART‖ characteristics as defined here:
Specific – The objective provides sufficient specificity to guide formulation of viable approaches to achieve
the objective without dictating the approach.
Measurable – The objective facilitates quantitative evaluation, saying how many or how much should be
accomplished. Tracking progress against the objective enables an assessment of effectiveness of actions.
Agreed – Planners, operators, and relevant planning participants come to a consensus on a common
objective. This is most effective when the planning process involves a wide-range of stakeholders to facilitate
regional collaboration and coordination.
Realistic – The objective can reasonably be accomplished within the limitations of resources and other
demands. The objective may require substantial coordination, collaboration, and investment to achieve.
Factors such as population growth, economic development, and land use may also have an impact on the
feasibility of the objective and should be taken into account. Based on data on system performance and
analysis, the objective may need to be adjusted to be achievable.
Time-bound – The objective identifies a timeframe within which it will be achieved (e.g., ―by 2012‖).
12 Congestion Management Process: A Guidebook
Examples of SMART Objectives
Examples of ―SMART‖ objectives include the following:
Reduce hours of delay per capita by 15% percent by year 2030.
Reduce mean incident clearance time per incident by 20% percent over 8 years.
Improve average on-time performance for specified transit routes/facilities by 25 percent within 5 years.
Passenger loads on transit routes at each route's busiest point should not exceed 50 passengers on any
vehicle (or on average) during the hour during peak/off-peak periods.
In practice, objectives may start out somewhat general (e.g., improve system reliability), but then through the
actions that follow – including defining performance measures, collecting data, etc. – the objectives may be
revisited and defined to be more specific, measurable, and time-bound (e.g., reduce the person hours of total
delay on highways and major arterials associated with traffic incidents by ―X‖ percent over ―Y‖ years.). A
typical progression may occur as follows:
Identify the important congestion concerns in the region.
Select the area and time of focus, such as major arterials during peak hours.
Identify what data are being collected or may be available to track the objectives. Based on this
information, make the objectives more specific and define specific measures of performance.
Consider growth trends, fiscal constraints, and other factors to ensure the objectives are realistic.
Developing SMART operations objectives may be challenging to some MPOs since it may be difficult to
develop consensus on specific target numbers, and staff and decision-makers may be concerned about what
happens if specific targets are not achieved. On the other hand, the process of developing regional
congestion management objectives may be a catalyst for getting decision-makers from across a region to work
together with a common focus, resulting in progress on issues that constituents care about, such as
multimodal accessibility, reliability, and access to accurate traveler information.
Congestion Management Principles
In addition to developing objectives, this early stage of the CMP may also involve development of congestion
management principles that shape how congestion is addressed from a policy perspective. Principles are
different from objectives since they do not focus on outcomes or outputs that can be measured and tracked
over time. Rather, they are statements of priority from a policy perspective. For instance, congestion
management principles may:
Affirm the importance of addressing all modes of transportation;
Place priority or emphasis on certain types of congestion management strategies, such as demand
management or system management and operations, before accommodating vehicle travel demand;
The Capital District Transportation Committee (CDTC) in Albany, New York has established congestion
management principles as part of its CMP, and these principles are included in the MTP. CDTC believes that
what the residents of the region want – as articulated in the regional vision and as expressed though their
involvement in corridor and project-level studies – must help to define the way in which congestion
management is applied in the region.

The CMP within the Regional Transportation Planning Context 13
Through surveys and public involvement activities, CDTC has learned a key public opinion: that the public
wants more bicycle, pedestrian, and other improvements, and that travel time reliability is the most important
congestion issue for travelers in the region. CDTC has defined congestion management principles that focus
on demand management and operations improvements before constructing new capacity (see text box). 2
2 CDTC, ―The Metropolitan Congestion Management Process,‖ May 2007, www.cdtcmpo.org
Case Study: Congestion Management Goals and Principles at the Capital District
Transportation Committee (CDTC)
The CMP of CDTC in Albany, New York, contains two goals, developed by CDTC and approved by
the MPO Board:
Support growth in economic activity and maintain the quality of life in the Capital District by limiting
the amount of ―excess‖ delay encountered in the movement of people, goods, and services.
Make contributions to the avoidance and mitigation of congestion on all modes by implementing
demand management programs first, before performing capacity expansions. Reducing single-
occupant vehicle travel can be accomplished by encouraging telecommuting and programs that
reduce the need for travel, balancing travel demand by time of day, encouraging the use of transit,
ridesharing, pedestrian and bicycle modes, improving operational efficiencies and achieving
complementary transportation and land use systems.
In addition, a set of congestion management principles are included in CDTC’s New Visions Plan, and
are designed as principles to help guide the selection of actions. The congestion management
principles include:
Management of demand is preferable to accommodation of single-occupant vehicle demand growth.
Cost-effective operational actions are preferable to physical highway capacity expansion.
Capital projects designed to provide significant physical highway capacity expansion are appropriate
congestion management actions only under certain circumstances.
Significant physical highway capacity additions carried-out in the context of major infrastructure
renewal are appropriate only under certain circumstances.
Incident management is essential to effective congestion management.
Any major highway expansion considered by CDTC will include a management approach.
In project development and design, other performance measures, such as pedestrian, bicycle, and
transit access, community quality of life, and safety will be considered along with congestion
measures.
The New York State Department of Transportation guidelines for roundabouts will be used for all
CDTC federal aid projects that involve intersection improvements.
Source: CDTC, ―The Metropolitan Congestion Management Process,‖ May 2007, www.cdtcmpo.org
14 Congestion Management Process: A Guidebook
2.2 – Action 2: Define CMP Network
Defining the CMP network involves defining two
aspects of the system that will be examined as
part of the planning process:
the geographic boundaries or area of
application; and
the system components/network of surface
transportation facilities.
The travel demand model represents a primary
analysis tool in regional planning, and therefore
the model roadway network typically provides the
baseline for establishing a CMP roadway network.
If the model contains a transit network as well as
a highway network, the CMP network may consider how these two modes interact. In areas where
multimodal analysis is done off-model, the highway network may provide the basis for selecting a CMP
network, although transit services, and bicycle and pedestrian infrastructure may also be incorporated into the
CMP network analysis. It is important to note that this does not mean the model must be the primary source
of information for the CMP, just that this is a logical baseline many MPOs use for defining the set of roads
and multimodal facilities that will be studied in the CMP.
Geographic Area of Application
For many regions the CMP network will correspond to the full planning area network; however there are
exceptions. In areas where there are significant traffic generators in the rural area outside the MPO
boundary, it may be important to capture the connecting roads in the CMP network to monitor congestion.
Neighboring MPOs may choose to partner in the development of a joint CMP, extending the network
beyond their individual planning boundaries.
System Components
In regions where the planning area highway network is very dense, a subset of roads may be identified for the
CMP in order to limit data collection and analysis to the most congested facilities. Some MPOs have adopted
a corridor-based planning approach–in these areas, selected corridors will make up the CMP network. In
each instance, the CMP network must include those areas that meet the regionally identified definition of
‗congested‘ and represent the area for data collection and monitoring activities.
There are several methods by which MPOs define their CMP networks.
Some MPOs have a two-step process, in which data are collected on a broad network (often based on
functional classification, traffic volumes, or some other easily-measured attribute) and then a subset of
these roads are defined as CMP corridors for further steps in the process.
Other MPOs identify a set of corridors for analysis at the beginning and only collect data on facilities in
those corridors. The decision-making process for selecting corridors can be driven by either data or
professional judgment, and may be led by MPO staff or by committees.
What components of the transportation system
are we analyzing?
The CMP should involve analysis within a specific
geographic area and network of surface
transportation facilities. The action of defining the
CMP network for analysis will likely not need to be
revisited on a regular basis, unlike other elements
of the CMP. However, as travel patterns and
development in a region change, and as new data
sources become available, it may be useful to
revisit the system components being analyzed as
part of the CMP.
The CMP within the Regional Transportation Planning Context 15
Multimodal transportation elements are important factors for addressing congestion in any urban area.
Elements of a multimodal network may include:
Freeways or interstate highways
Arterial roadways
Transit services (e.g., rail, bus)
Bicycle networks
Pedestrian networks
Although the CMP has traditionally focused primarily on the road network, the CMP network should
consider the transit, bicycle, and pedestrian networks as well as their interface with the highway network.
Doing so can help take advantage of strategies that rely upon the other modes to reduce single occupancy
vehicle (SOV) travel. Typically, collectors and local roadways are not included in the roadway analysis of the
CMP since it would be time-consuming to address these roadways and they generally have relatively low
traffic volumes and congestion levels; however, these facilities should still be considered as potential bicycle,
pedestrian, or transit corridors. The CMP analysis network will often include major intersections along
arterials, given that intersections are often points where travel delay occurs.
2.3 – Action 3: Develop Multimodal Performance Measures
Developing performance measures to identify, assess, and communicate to others about congestion is a
critical element of the CMP. One key to the effectiveness of the CMP is the ability of the MPO staff to
adequately assess system performance in order to identify problem areas and communicate this information
to the public and decision-makers, thereby affecting on-the-ground projects.
Roles of Performance Measures
The overarching purpose of using performance measures in the CMP is to characterize current and future
conditions on the multimodal transportation system in the region. However, performance measures serve
multiple purposes that intersect and overlap in the context of the CMP, including:
To characterize existing and anticipated conditions on the regional transportation system;
Case Study: CMP Network Definition at the Delaware Valley Regional Planning Commission
(DVRPC) and Wilmington Area Planning Council (WILMAPCO)
Following data collection/gathering, DVRPC, the MPO for the Philadelphia region, uses analysis of its
identified evaluation criteria to identify congested corridors and divide them into logical subcorridors.
There are usually around 15 corridors identified in each state (PA and NJ), with over 100 subcorridors
defined. DVRPC uses GIS layers for its network and does most of its analysis using GIS.
WILMAPCO, the MPO for Wilmington, Delaware, has a two-tiered CMP network. The first tier, for
data collection, includes all roads within the MPO area that are functionally classified as minor arterials
or a higher class. The second tier of the CMP network is a set of congested corridors for which
detailed congestion management strategies are developed—these corridors are identified following
the collection and analysis of data.
Sources: DVRPC, ―Overview of the CMP,‖ 2009, www.dvrpc.org/CongestionManagement; WILMAPCO,
―2009 WILMAPCO Congestion Management System Summary,‖ July 2009 www.wilmapco.org/cms
16 Congestion Management Process: A Guidebook
To track progress toward meeting regional
objectives;
To identify specific locations with
congestion to address;
To assess congestion mitigation strategies,
programs, and projects; and
To communicate system performance,
often via visualization, to decision-makers,
the public, and MPO member agencies.
Performance measures are used at two levels:
Regional Level – To measure
performance of the regional transportation
system.
Local (Corridor, Segment, Intersection)
Level – To identify locations with congestion problems and to measure the performance of individual
segments or system elements.
At the regional level, performance measures can be used to compare plan alternatives in the development of
the MTP, to determine which alternatives are more successful in achieving a balance between different
objectives (including those identified in Action 1), maximizing the overall benefit. They also can be used as
part of transportation system monitoring to track progress toward the achievement of the objectives. To
accomplish these functions, performance measures must be developed that directly correspond to CMP
objectives. For example, if one of the CMP objectives is to ―Reduce hours of delay per capita by 15 percent
by year 2030,‖ then one of the performance measures used should be the hours of delay per capita. As part of
the CMP, data for this performance measure and others would be collected and analyzed to determine
whether or not adequate progress is being made in the region toward reaching the CMP objectives.
At the local level, performance measures are used to identify locations currently experiencing or anticipated to
experience congestion problems in the future. They also are used to support assessment and selection of
congestion mitigation strategies and evaluation of implemented strategies. The smaller scale application of
performance measures in this context often means that the performance measures selected for monitoring
system-level congestion and tracking regional objectives must be tailored to be applicable at a segment, link,
or intersection scale.
A threshold or definition of ―unacceptable congestion‖ may be developed for performance measures applied
at a local level. For instance, the region may define excess delay as the average travel time in excess of a free
flow travel time, and then identify road segments that exceed a certain threshold of delay as ―congested‖. It is
important for these local (e.g., segment, intersection) measures of congestion to be linked to regional
performance measures so that measures used to pinpoint congestion problems and evaluate solutions have a
connection to the attainment of regional objectives.
Performance Measures May Be Adapted and Adjusted Over Time
The action of developing performance measures is a highly iterative component of the CMP, and typically
consists of three major activities:
How do we define and measure congestion?
Performance measures are a critical component of the
CMP. According to Federal regulation, the CMP must
include “appropriate performance measures to assess
the extent of congestion and support the evaluation of
the effectiveness of congestion reduction and mobility
enhancement strategies for the movement of people
and goods. Since levels of acceptable system
performance may vary among local communities,
performance measures should be tailored to the
specific needs of the area and established
cooperatively by the State(s), affected MPO(s), and
local officials in consultation with the operators of major
modes of transportation in the coverage area.”
23 CFR 450.320 (c) 2
The CMP within the Regional Transportation Planning Context 17
Selecting performance measures,
Developing a data collection plan, and
Refining objectives and performance measures.
Through the selection of the performance measures and identification of data needs, the MPO and its
planning partners come to a greater understanding of the feasibility of objectives that have been developed.
If the effort required to obtain the data to track specific objectives is deemed too great for the region, the
MPO and its partners may revise the objectives so that they can be better tracked or they may identify
surrogate performance measures that are thought to be strong indicators of the performance measures
directly linked to the objectives. Each activity is described briefly below.
Selecting Multimodal Performance Measures
There are a wide range of measures that can be considered for use in the CMP. The following text describes
several types of measures, addressing different components of congestion and aspects related to congestion
that may be addressed in the CMP.
Components of Congestion. Traditionally in regional long-range transportation planning, MPOs have used
volume-to-capacity (V/C) ratios or level of service (LOS) indicators as their primary metrics for analyzing
existing and forecasted congestion on roadways and at intersections. However, there are several components
of the concept of congestion that cannot be captured by V/C ratios and LOS.
The concept of congestion deals with the quality of use of the system as well as the quantity of use: in
concept, ―congestion‖ happens when there are too many people and/or vehicles at the same general place at
the same general time, causing the user‘s experience to decline in quality. Congestion also deals with two
dimensions, spatial and temporal – the where (location, such as an intersection, roadway segment, or transit
route) and the when (time of day or year). Further, there is a systemic aspect in that transportation facilities
do not operate in isolation and actions that take place in one part of the transportation system can affect
(positively or negatively) congestion on other nearby facilities. There is also a relative aspect in that
observations of congestion may be qualitatively perceived as being more or less severe than observations at
the same location at a different time, or at a different location.
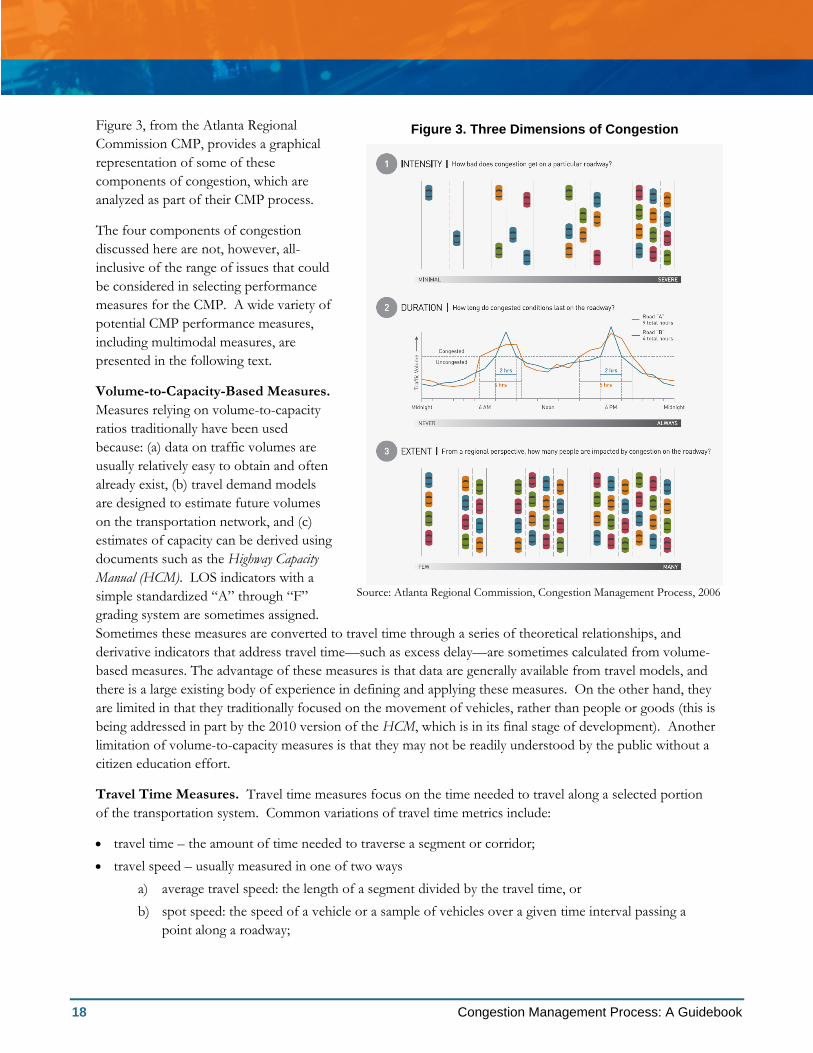
Four major dimensions of congestion include the following:
Intensity – The relative severity of congestion that affects travel. Intensity has traditionally been
measured through indicators such as V/C ratios or LOS measures that consistently relate the different
levels of congestion experienced on roadways.
Duration – The amount of time the congested conditions persist before returning to an uncongested
state.
Extent – The number of system users or components (e.g. vehicles, pedestrians, transit routes, lane miles)
affected by congestion, for example the proportion of system network components (roads, bus lines, etc.)
that exceed a defined performance measure target.
Variability – The changes in congestion that occur on different days or at different times of day. When
congestion is highly variable due to non-recurring conditions, such as a roadway with a high number of
traffic accidents causing delays, this has an impact on the reliability of the system.
18 Congestion Management Process: A Guidebook
Figure 3, from the Atlanta Regional
Commission CMP, provides a graphical
representation of some of these
components of congestion, which are
analyzed as part of their CMP process.
The four components of congestion
discussed here are not, however, all-
inclusive of the range of issues that could
be considered in selecting performance
measures for the CMP. A wide variety of
potential CMP performance measures,
including multimodal measures, are
presented in the following text.
Volume-to-Capacity-Based Measures.
Measures relying on volume-to-capacity
ratios traditionally have been used
because: (a) data on traffic volumes are
usually relatively easy to obtain and often
already exist, (b) travel demand models
are designed to estimate future volumes
on the transportation network, and (c)
estimates of capacity can be derived using
documents such as the Highway Capacity
Manual (HCM). LOS indicators with a
simple standardized ―A‖ through ―F‖
grading system are sometimes assigned.
Sometimes these measures are converted to travel time through a series of theoretical relationships, and
derivative indicators that address travel time—such as excess delay—are sometimes calculated from volume-
based measures. The advantage of these measures is that data are generally available from travel models, and
there is a large existing body of experience in defining and applying these measures. On the other hand, they
are limited in that they traditionally focused on the movement of vehicles, rather than people or goods (this is
being addressed in part by the 2010 version of the HCM, which is in its final stage of development). Another
limitation of volume-to-capacity measures is that they may not be readily understood by the public without a
citizen education effort.
Travel Time Measures. Travel time measures focus on the time needed to travel along a selected portion
of the transportation system. Common variations of travel time metrics include:
travel time – the amount of time needed to traverse a segment or corridor;
travel speed – usually measured in one of two ways
a) average travel speed: the length of a segment divided by the travel time, or
b) spot speed: the speed of a vehicle or a sample of vehicles over a given time interval passing a
point along a roadway;
Figure 3. Three Dimensions of Congestion
Source: Atlanta Regional Commission, Congestion Management Process, 2006

The CMP within the Regional Transportation Planning Context 19
delay – the difference between travel time and acceptable or free-flow travel time; and
travel time index – ratio of peak-period to non-peak-period travel time.
These measures can be translated, using various assumptions, into other measures such as user costs, and can
be used in the process of validating travel demand forecasting models.
Variability of Congestion/Reliability. The variability or change in congestion on a day-to-day basis
provides a measure of reliability. Recurring congestion is generally predicable, regularly occurring, and
typically caused by excess demand compared to the capacity of the system. On the other hand, non-recurring
congestion causes unreliable travel times and is caused by transient events such as traffic incidents, weather
conditions, work zones, or special events. Non-recurring congestion, and unreliable travel times that result,
are often the most frustrating form of congestion to travelers. 3 Moreover, FHWA estimates that non-
recurring sources of congestion are responsible for over half of all delay experienced by travelers. Since the
transportation planning models used in metropolitan transportation planning are designed to address
recurring congestion issues, many regions have found it challenging to incorporate measures of non-recurring
congestion as part of their CMP. Some MPOs have used crash data as a surrogate measure for non-recurring
congestion under the premise that traffic incidents are directly linked to non-recurring congestion. Others
have begun to gather archived real-time traffic data from operating agencies to examine the variability in
traffic volumes, speeds, and/or travel times on a daily basis.
Measures Addressing Transit System Congestion and/or Reliability. Transit performance measures
provide information on the conditions experienced by transit travelers. Aspects of transit travel conditions
include:
passenger crowding or utilization – measured by passenger loads relative to vehicle capacities
reliability of performance or schedule adherence – measured by percentage of on-time performance.
In most areas, passenger overcrowding is not a major transit issue, but schedule adherence is generally an
important aspect of transit conditions. The Puget Sound Regional Council (PSRC), the MPO for the Seattle
region, identified five performance measures to characterize the types of congestion relevant to transit
operators: 4
General roadway congestion (trapped in general roadway congestion).
Re-entry congestion (unable to re-enter general travel lanes from station pull-outs due to congestion).
High-volume loading congestion (longer times at stops and stations due to high volume of passenger
loading and unloading).
Mobility device loading congestion (loading congestion due to extra time needed for passengers with
personal mobility devices).
Bus queuing congestion (delays caused by other transit vehicles at stops or stations).
Measures Addressing Multimodal (Transit, Bicycle, Pedestrian Infrastructure) Availability. In many
areas, MPOs are incorporating measures beyond those focused on the automobile to include multimodal
options, such as buses, trains, pedestrians, bicycles, and ferries. The non-automobile transportation modes
support the CMP by providing the potential to reduce highway congestion. These measures provide an
3 FHWA, ―Traffic Congestion and Reliability: Linking Solutions to Problems‖ p. ES-6. Sources of congestion were estimated as rough approximations based on many congestion research studies. http://ops.fhwa.dot.gov/congestion_report_04/congestion_report.pdf
4 PSRC, ―Draft SMART Corridors/CMP Report,‖ Feb. 2010, www.psrc.org/transportation/cmp/

20 Congestion Management Process: A Guidebook
indication of the extent to which travelers are able to choose an alternative mode of travel to single-
occupancy vehicles. Measures include the extent of the bicycle, pedestrian, or transit network, and quality of
the network or comfort to users. Measures may also include actual use of facilities, such as park-and-ride lots,
buses, and bicycle lanes. For example, by measuring the total number of transit riders in a corridor, it is
possible to identify corridors with high ridership, where improvements not only to transit service frequency
but also physical improvements such as sidewalks to improve accessibility and signal pre-emption to improve
transit service reliability would be most helpful.
Freight Performance Measures. Measures that focus on goods movement generally utilize other types of
performance measures identified above, such as volume-to-capacity ratios or travel time measures, but focus
on roadways with a high volume of trucks or designated freight corridors. The purpose of these measures is
to highlight congestion that affects freight since consideration of solutions specifically-targeted to freight
traffic issues may be needed.
Accessibility Measures. This broad set of measures describes the ability of the public to reach employment
sites, retail centers, activity centers, and other land uses that produce or attract travel demand. Accessibility
measures frame travel as a means to access desired goods, services, and activities that is affected by multiple
factors, including proximity to places and mobility of people. Measuring accessibility can involve calculating
the number or share of population that can access desired destinations within a specific amount of time and
by different travel modes – e.g., percentage of the labor force with a commute of 30 minutes or less; percent
of households within 40 minutes of downtown; or the percentage of employment in the region within a five-
minute walk of transit service.
Land Use Measures. Land use and transportation are very closely connected, and these measures look at
some of the ways in which this interconnection occurs. Among these are measures of the mix of land uses in
a given area, and the pattern of development and how supportive it is of transit, bicycle, and pedestrian
transportation – e.g., a connectivity index (based on how many intersections vs. dead ends are within a local
street system) or a measure of the percentages of land used for different types of development (residential,
commercial, mixed use, etc.) within a corridor or area.

The CMP within the Regional Transportation Planning Context 21
Table 1 highlights several examples of performance measures that can be considered at a local and regional
scale.
Case Study: Performance Measure Selection at WILMAPCO
WILMAPCO uses three standard performance measures in its CMP every year, with an additional fourth
performance measure that has varied over the years. The three standard measures are daily roadway
volume-to-capacity ratio, peak-hour intersection level of service, and peak-hour observed speed as a
percentage of posted speed. These measures were selected for several reasons, including the fact that
they are user-friendly and relatively easy for the average citizen to understand. These measures also
create a consistent scale of measurement that allows comparisons of data from year to year, and are all
based on standard technically-defensible measures in common use around the country.
The fourth CMP performance measure, which has varied over time (including years when no fourth
measure was included), has generally measured one of two things: crashes or transit usage. Crash rates
have been the more prominent of these, and are intended to identify areas with higher-than-average
instances of incident-caused non-recurring congestion. WILMAPCO worked with DelDOT to get their
crash data in a format that would be usable for the CMP—DelDOT now provides an annual GIS file
containing the point locations of all crashes within the state. WILMAPCO uses standards of two-times
and three-times the average crash rate within the region to determine high crash locations for the CMP.
For the other performance measure, transit load factors, there has been disagreement within the MPO
over whether high transit load factors (indicating high transit usage, close to vehicle capacity) are
indicative of a positive or negative outcome. After considerable debate, the MPO decided to focus on
transit in the strategy identification phase of the CMP rather than trying to create a transit performance
measure, while still collecting the necessary data on transit usage to make informed decisions about
potential transit strategies.
Source: WILMAPCO, ―2009 WILMAPCO Congestion Management System Summary,‖ July 2009
www.wilmapco.org/cms

22 Congestion Management Process: A Guidebook
Table 1. Examples of Performance Measures: Local and Regional
Type of Measure Sample Localized/Corridor-level
Measures
Sample Regional/System-level
Measures
Congestion intensity:
volume/capacity
measures
• Volume-to-capacity ratio (V/C), for segment
• Level of Service (LOS), for a segment or intersection
• Number or share of roadway miles operating at V/C ratio over 1.0
• Number/share of roadway miles at LOS E or worse
• Number of intersections at LOS E or worse
Congestion intensity:
travel time measures
• Travel speed (miles per hour)
• Average delay time (the difference between travel time and acceptable or free-flow travel time)
• Travel time index (ratio of peak-period to non-peak-period travel time)
• Average regional commute time (by mode)
• Total excess delay time (wasted travel time)
• Share of roads experiencing travel time index over 2.0
Congestion duration • Hours of travel per day at V/C ratio over 1.0
• Hours of travel per day at LOS E or worse
• Number or share of roadway miles experiencing more than 3 hours of congestion per day on average
Congestion extent:
vehicle measures
• Number of vehicles experiencing LOS E or worse, for a segment
• Number or share of vehicle miles traveled at LOS E or worse, regionally
Congestion extent:
delay measures
• Total delay on roadway (average delay time per vehicle x number of vehicles)
• Total excess delay time (wasted travel time)
Reliability • Planning time index – ratio of 95th percentile travel time to free flow travel time
• Buffer index – ratio of difference between 95th percentile travel time and average travel time, divided by average travel time
• Crash rate by route or intersection
• Number of incidents
• Share of freeway segments with planning time index over a certain threshold
• Average buffer index for commute trips
• Crash rate regionally
Transit travel
conditions
• Transit crowding
• Transit on-time performance (by route)
• Percentage of buses/trains exceeding a certain crowding level.
• Percentage of buses arriving on-time regionally
Availability or service
level of modes
• Existence of sidewalks
• Existence of bicycle lanes or paths
• Existence of pedestrian features (countdown pedestrian signals, painted crosswalks, etc.)
• Existence of high-frequency bus services
• Miles of sidewalks or share of roads with sidewalks regionally
• Miles of bicycle lanes or paths or share of roads designated as bicycle routes regionally
• Number of intersections with pedestrian features
Accessibility • Number of jobs/households within a defined distance or travel time from location
• Share of regional jobs within ¼ mile of transit
• Share of regional households within ¼ mile of transit
Land use • Jobs-housing balance (ratio) within area/zone
• Jobs-housing balance (ratio) across each area
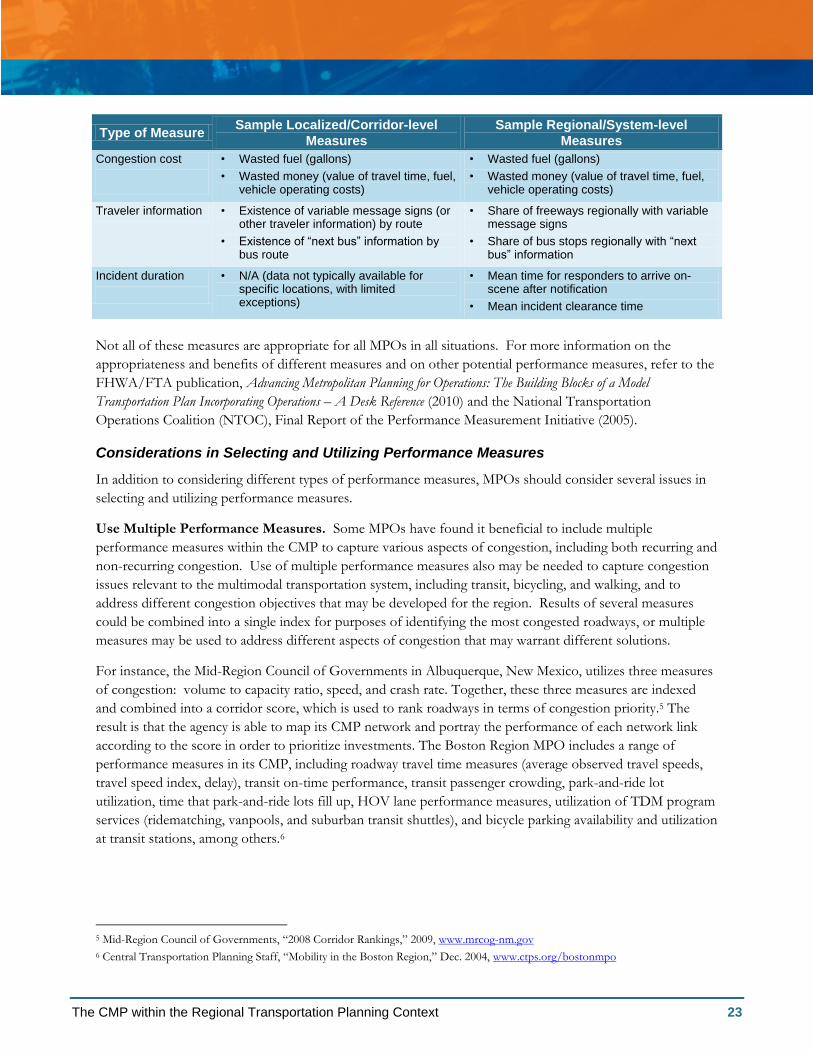
The CMP within the Regional Transportation Planning Context 23
Type of Measure Sample Localized/Corridor-level
Measures
Sample Regional/System-level
Measures
Congestion cost
• Wasted fuel (gallons)
• Wasted money (value of travel time, fuel, vehicle operating costs)
• Wasted fuel (gallons)
• Wasted money (value of travel time, fuel, vehicle operating costs)
Traveler information • Existence of variable message signs (or other traveler information) by route
• Existence of ―next bus‖ information by bus route
• Share of freeways regionally with variable message signs
• Share of bus stops regionally with ―next bus‖ information
Incident duration
• N/A (data not typically available for specific locations, with limited exceptions)
• Mean time for responders to arrive on-scene after notification
• Mean incident clearance time
Not all of these measures are appropriate for all MPOs in all situations. For more information on the
appropriateness and benefits of different measures and on other potential performance measures, refer to the
FHWA/FTA publication, Advancing Metropolitan Planning for Operations: The Building Blocks of a Model
Transportation Plan Incorporating Operations – A Desk Reference (2010) and the National Transportation
Operations Coalition (NTOC), Final Report of the Performance Measurement Initiative (2005).
Considerations in Selecting and Utilizing Performance Measures
In addition to considering different types of performance measures, MPOs should consider several issues in
selecting and utilizing performance measures.
Use Multiple Performance Measures. Some MPOs have found it beneficial to include multiple
performance measures within the CMP to capture various aspects of congestion, including both recurring and
non-recurring congestion. Use of multiple performance measures also may be needed to capture congestion
issues relevant to the multimodal transportation system, including transit, bicycling, and walking, and to
address different congestion objectives that may be developed for the region. Results of several measures
could be combined into a single index for purposes of identifying the most congested roadways, or multiple
measures may be used to address different aspects of congestion that may warrant different solutions.
For instance, the Mid-Region Council of Governments in Albuquerque, New Mexico, utilizes three measures
of congestion: volume to capacity ratio, speed, and crash rate. Together, these three measures are indexed
and combined into a corridor score, which is used to rank roadways in terms of congestion priority.5 The
result is that the agency is able to map its CMP network and portray the performance of each network link
according to the score in order to prioritize investments. The Boston Region MPO includes a range of
performance measures in its CMP, including roadway travel time measures (average observed travel speeds,
travel speed index, delay), transit on-time performance, transit passenger crowding, park-and-ride lot
utilization, time that park-and-ride lots fill up, HOV lane performance measures, utilization of TDM program
services (ridematching, vanpools, and suburban transit shuttles), and bicycle parking availability and utilization
at transit stations, among others.6
5 Mid-Region Council of Governments, ―2008 Corridor Rankings,‖ 2009, www.mrcog-nm.gov
6 Central Transportation Planning Staff, ―Mobility in the Boston Region,‖ Dec. 2004, www.ctps.org/bostonmpo

24 Congestion Management Process: A Guidebook
At the same time that it is valuable to utilize multiple performance measures, it is advisable to keep the total
number of measures manageable, in order to: (a) reduce data collection costs, (b) reduce complexity, and (c)
improve the ease of understanding by officials and the public.
Focus on Persons and Goods, Rather than Vehicles. Traditionally, performance measures in the CMP
have focused on traffic congestion, which is not surprising since traffic congestion is often a key issue of
concern to the public and elected officials. However, even in looking at measures of traffic congestion, it is
useful to consider performance measures that focus on people and goods movement, rather than simply on
the movement of vehicles.
Vehicle-based measures, such as vehicle hours of delay, focus on the experience of individual vehicles or the
cumulative experience of many vehicles. In contrast, person travel-based measures, such as person hours of
delay or person travel time, may lead to selection of different types of strategies. For instance, a measure
focusing on personal travel time may lead to strategies such as bus rapid transit and transit signal priority,
which increase the speeds of buses carrying multiple passengers. A vehicle-based measure would not show
the same benefit to these types of strategies, since all vehicles, regardless of occupancy, are treated equally.
Use Screening Measures, with Additional Measures for Identified Congested Locations. Some areas
have found it helpful to use one measure, such as volume-to-capacity ratio, as a screening measure to identify
congested corridors, and then apply additional performance measures only to those congested corridors. This
approach allows agencies to focus scarce resources directly on the areas that benefit most from more in-depth
analysis, while also providing coverage for the entire system. One example of this approach is undertaken by
the Hillsborough County MPO, covering the Tampa, Florida area. The Hillsborough County MPO has
developed a tiered structure for performance measures that is intended to monitor the transportation system
effectively while expending monitoring resources strategically. The program measures performance system-
wide and by corridor using a set of primary performance measures; corridor-specific measures include basic
performance measures for roadway (volume-to-capacity), transit (ridership and frequency), bicycle (extent of
corridor with bicycle facilities), and pedestrian travel (extent of corridor with sidewalks). For identified
congested corridors, a more in-depth set of measures is tracked, drawing on data such as travel time surveys,
pedestrian counts, employer rideshare programs, and transit on-time performance.7
Define Different Levels of Performance that are Acceptable in Different Circumstances. Different
thresholds can be used to define congestion, based on location, facility type, and/or time frame. This option
recognizes that the public may find different levels of congestion acceptable based on these parameters.
Clearly an arterial might be expected to experience slower travel speeds than a limited-access freeway. On a
high occupancy vehicle (HOV) facility, a travel speed less than 50 or 60 miles per hour or LOS C or higher
might be considered unacceptable congestion, while these conditions may be more acceptable in the adjacent
general purpose freeway lanes.
Facility location may also influence expectations; a central business district might be expected to experience
slower travel speeds than an outlying suburban area. Differentiating between location types also recognizes
that eradicating congestion may not be the sole community goal in all areas; higher levels of traffic congestion
may be acceptable, for instance, in downtown areas with high levels of transit service and high-quality
pedestrian environments. Lastly, although transportation planning processes often focus on weekday
7 Hillsborough County MPO, ―Hillsborough County Congestion Management Process Definitions and Guidelines,‖ Mar. 2008, www.hillsboroughmpo.org

The CMP within the Regional Transportation Planning Context 25
commute periods when examining congestion, there may be other periods of interest, such as weekend
periods or specific seasons that are associated with heavy shopping or recreational travel. There may be
different thresholds for performance during different periods in order to adequately capture the traffic
congestion problems that are of concern to the public.
Consider Use in Communicating Information. An additional role of the performance measures selected
for the CMP is to communicate to decision-makers, the public, and MPO member agencies about system
performance, the progress being made, and the impact of proposed mitigation strategies. When developing
performance measures for the CMP, it is important to keep in mind the role of performance measures in
communications. It is useful to focus on aspects of system performance that matter most to the public so
that MPOs and their member agencies can communicate effectively with the public, demonstrate
accountability and transparency, and get the public‘s support for transportation programs. See Section 4 on
‗Using Visualization as a Communication and Analysis Tool‘ for information on visualization techniques that
can be helpful in communicating performance measures and other CMP data. It is also important to
remember that beneficiaries of the performance measure analysis are the MPOs themselves; performance
measures should be selected such that they will be useful to the decision making of the MPO, for example by
guiding decision-makers to prioritize and implement certain strategies recommended in the CMP.
Developing a Data Collection and Management Plan
An integral part of developing performance measures is creating a plan for collecting the data needed to
support those measures. The plan should describe what data is needed to support the performance measures,
where data will be collected, how often it will be collected, and by whom. Additionally the plan should
include agreed-upon accuracy levels and data formats so that system-wide or regional statistics can be
developed based on the data collected. This is particularly important when several different entities are
collecting data to support the same performance measure. Close collaboration between transportation facility
owners/operators and transportation planners is needed to develop a comprehensive data collection plan for
the region‘s CMP. Often, the MPO is not the primary data collection organization. Rather, operating
agencies often collect data for their own purposes that may be transformed and shared with the MPO for the
CMP. For example, the Capitol Region Council of Governments (CRCOG) in Hartford, Connecticut
receives its freeway performance data for the CMP from the Connecticut Department of Transportation.8
The regional ITS architecture may be an important resource for identifying sources of data in the region that
can support the CMP‘s performance measures.
Refining Objectives and Performance Measures
During the selection of performance measures and identification of data needs, regions may need to
reconsider the objectives and/or performance measures that they selected because of data availability. The
development of a data plan serves as a ―reality check‖ for the objectives and performance measures selected
for the CMP. In this activity, the MPO and its planning partners must balance the need to work toward
objectives that are tied to performance measures and communicate important aspects of multimodal system
performance with the use of objectives that can be tracked using available or easily-collected data.
For example, the objective ―Reduce non-recurring delay on freeways and regionally significant arterials by
10% over the next 5 years‖ describes an aspect of congestion that the public cares about: non-recurring delay.
8 CRCOG, Central Connecticut Regional Planning Agency, and Midstate Regional Planning Agency, ―Transportation Monitoring & Management Report: Metropolitan Hartford Area: 2005,‖ Dec. 2007, www.crcog.org

26 Congestion Management Process: A Guidebook
How does the transportation system
perform?
Data collection and system monitoring are
needed to provide information to make
effective decisions, and are typically an on-
going activity. According to Federal
regulation, the CMP must include
―Establishment of a coordinated program
for data collection and system performance
monitoring to define the extent and
duration of congestion, to contribute in
determining the causes of congestion, and
evaluate the efficiency and effectiveness of
implemented actions. To the extent
possible, this data collection program
should be coordinated with existing data
sources (including archived operational/ITS
data) and coordinated with operations
managers in the metropolitan area;‖
23 CFR 450.320 (c) 3
Unfortunately, non-recurring delay is often difficult to measure using typical transportation data sources. If a
region that selected this objective does not have data available on non-recurring delay, the region may either
try to modify the objective so that it can be measured or it may develop surrogate measures that are thought
to directly contribute to the primary measure. Surrogate measures for non-recurring delay may include
incident clearance time or work zone queue length.
Upon revising the objectives and performance measures based on resource availability, the data collection
plan should be updated to reflect the latest measures.
2.4 – Action 4: Collect Data / Monitor System Performance
Gathering data to monitor system performance is typically the element of the CMP that requires the largest
amount of resources and staff time for the MPO and its planning partners. After establishing performance
measures that will be used to evaluate system performance and a plan for collecting data, regions are ready to
gather the data necessary to inform the CMP. In-depth case studies of the CMP at several MPOs developed
in association with this guidebook provide detailed information on the different approaches used for data
collection and monitoring (available on-line at http://www.fhwa.dot.gov/planning/).
Common Types of Data and Collection Techniques
There are many types of data that can be used as part of the CMP process. Data types are often
differentiated or categorized according to the source or underlying nature of the data. The following list is
not exhaustive, but includes several common types of data that are used in the CMP by MPOs.
Traffic Volume Counts (automated or manual):
Volume, expressed either as Annual Average Daily
Traffic (AADT) or Annual Average Weekday Daily
Traffic (AAWDT), is a widely-available dataset at most
MPOs around the nation. Sometimes, vehicle
classification and time-of-day counts may be available –
these can be especially useful in areas with heavy freight
traffic or intermodal/port facilities. Manual turning-
movement counts may also be used to analyze traffic at
intersections. Raw traffic volumes may also be
converted into vehicle miles of travel, particularly for use
in regional or system-level analyses.
Speed and travel time data: Travel time and speed
samples are conducted by many MPOs as part of the
CMP process to directly observe congested conditions.
These are generally conducted using GPS technology in
a probe vehicle to measure link-speeds. This information
is typically used for corridor-level analyses of recurring
congestion. As an alternative to directly collecting this
type of data, some MPOs are exploring the purchase and
use of commercially-available probe vehicle speed and
delay data.
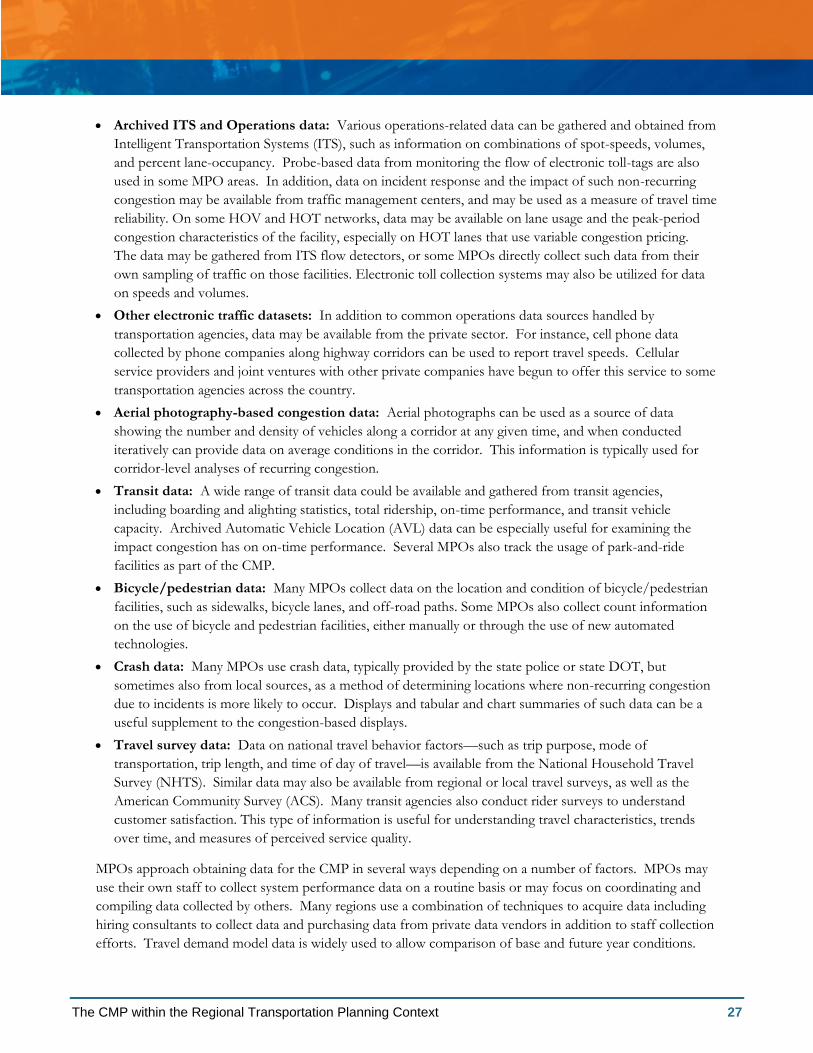
The CMP within the Regional Transportation Planning Context 27
Archived ITS and Operations data: Various operations-related data can be gathered and obtained from
Intelligent Transportation Systems (ITS), such as information on combinations of spot-speeds, volumes,
and percent lane-occupancy. Probe-based data from monitoring the flow of electronic toll-tags are also
used in some MPO areas. In addition, data on incident response and the impact of such non-recurring
congestion may be available from traffic management centers, and may be used as a measure of travel time
reliability. On some HOV and HOT networks, data may be available on lane usage and the peak-period
congestion characteristics of the facility, especially on HOT lanes that use variable congestion pricing.
The data may be gathered from ITS flow detectors, or some MPOs directly collect such data from their
own sampling of traffic on those facilities. Electronic toll collection systems may also be utilized for data
on speeds and volumes.
Other electronic traffic datasets: In addition to common operations data sources handled by
transportation agencies, data may be available from the private sector. For instance, cell phone data
collected by phone companies along highway corridors can be used to report travel speeds. Cellular
service providers and joint ventures with other private companies have begun to offer this service to some
transportation agencies across the country.
Aerial photography-based congestion data: Aerial photographs can be used as a source of data
showing the number and density of vehicles along a corridor at any given time, and when conducted
iteratively can provide data on average conditions in the corridor. This information is typically used for
corridor-level analyses of recurring congestion.
Transit data: A wide range of transit data could be available and gathered from transit agencies,
including boarding and alighting statistics, total ridership, on-time performance, and transit vehicle
capacity. Archived Automatic Vehicle Location (AVL) data can be especially useful for examining the
impact congestion has on on-time performance. Several MPOs also track the usage of park-and-ride
facilities as part of the CMP.
Bicycle/pedestrian data: Many MPOs collect data on the location and condition of bicycle/pedestrian
facilities, such as sidewalks, bicycle lanes, and off-road paths. Some MPOs also collect count information
on the use of bicycle and pedestrian facilities, either manually or through the use of new automated
technologies.
Crash data: Many MPOs use crash data, typically provided by the state police or state DOT, but
sometimes also from local sources, as a method of determining locations where non-recurring congestion
due to incidents is more likely to occur. Displays and tabular and chart summaries of such data can be a
useful supplement to the congestion-based displays.
Travel survey data: Data on national travel behavior factors—such as trip purpose, mode of
transportation, trip length, and time of day of travel—is available from the National Household Travel
Survey (NHTS). Similar data may also be available from regional or local travel surveys, as well as the
American Community Survey (ACS). Many transit agencies also conduct rider surveys to understand
customer satisfaction. This type of information is useful for understanding travel characteristics, trends
over time, and measures of perceived service quality.
MPOs approach obtaining data for the CMP in several ways depending on a number of factors. MPOs may
use their own staff to collect system performance data on a routine basis or may focus on coordinating and
compiling data collected by others. Many regions use a combination of techniques to acquire data including
hiring consultants to collect data and purchasing data from private data vendors in addition to staff collection
efforts. Travel demand model data is widely used to allow comparison of base and future year conditions.

28 Congestion Management Process: A Guidebook
The techniques used to acquire system data for the CMP will depend largely on the availability of MPO staff
time and equipment, cost, and the ability to partner with others.
Collaboration for Data Collection
Although some MPOs are able to collect data needed for the CMP using in-house staff, collaboration to
support data collection and analysis is essential. Collaboration with many partners including state, regional,
and local transportation facility owners and operators is a significant opportunity to leverage and tailor
existing data collection efforts for the purpose of the CMP, thereby reducing the burden on the MPO. This
is particularly true of multimodal data that may be available from transit agencies, bicycle groups, or local
governments. Some specific opportunities are noted in the following text.
Transit Agencies. There are significant opportunities in many regions to improve the overall understanding
of congestion on the multimodal transportation system through the use of data collected by transit agencies.
This data can not only help to provide a better picture of congestion experienced on the transit system but
also on arterials and other roadways where buses travel. Obtaining data on arterial travel time is particularly
important as data on arterial congestion is often missing from other CMP data sources. Frequently, State
DOTs will instrument freeways in urbanized areas with some type of automated traffic detection devices to
better manage traffic and collect performance data but far less often are arterials instrumented for data
collection. As more and more buses become equipped with automatic vehicle location (AVL) systems,
regions can use AVL data from transit agencies to help identify congestion on arterials. AVL data can also be
used to monitor transit service measures such as on-time performance. Several MPOs are beginning to use
AVL data as part of the CMP. For instance, the Pioneer Valley Planning Commission in Springfield,
Case Study: Data Collection at the Southwestern Pennsylvania Commission (SPC) and the
Puget Sound Regional Council (PSRC)
SPC collects data on travel time, speed, and delay on a three-year cycle, using in-house staff and
equipment. Each year within the cycle is divided into two data collection seasons (spring and fall),
creating a total of six seasons over which to spread the entire effort. Travel time, speed, and delay
information is collected by GPS through travel time runs along each corridor. Multiple runs are
conducted in each direction along each corridor for both the AM and PM peak periods. In total, the
level of effort required for this data collection is equal to approximately 1.5 full-time employees during
the spring and fall data collection periods.
Alternatively, PSRC primarily uses data collected by member agencies. It generally views its role as
the collator, coordinator, and analyzer of data collected by agencies across the region rather than data
collector. Collecting data on system performance is viewed to be more the responsibility of the facility
owners and operators. This role as data collator may also be the result of the large and complex
region that PSRC serves and the relatively advanced data collection efforts undertaken by member
agencies such as the Washington State DOT. According to PSRC staff, there are many local
transportation agencies in the region that are also collecting data and PSRC is working with the
agencies to coordinate and harness these somewhat disparate resources. Another reason why PSRC
turns to its member agencies for CMP data is the highly multimodal nature of its CMP. PSRC’s CMP
covers the roadway, ferry, transit, bicycle/pedestrian, freight, and rail systems. Collaboration with a
variety of agencies is necessary to obtain information across so many different modes.
Sources: SPC, Congestion Management Process, 2005, www.spcregion.org/trans_cong.shtml
PSRC, ―Draft SMART Corridors/CMP Report,‖ Feb. 2010, www.psrc.org/transportation/cmp/

The CMP within the Regional Transportation Planning Context 29
Case Study: Regional Data Clearinghouse,
Atlanta Regional Commission (ARC)
In the fall of 2008, ARC began the development of a
regional data clearinghouse. The purpose of the
regional data clearinghouse is to facilitate the use of
data collected in the region for transportation planning,
project prioritization, travel demand model development,
and congestion management. It will bring together data
from a variety of sources. ARC created an inventory of
data collected in the region through interviews and
surveys and found that while many local agencies
collected traffic count and even speed data, there was
limited coverage across the region. The member
agencies of ARC did express significant interest in
obtaining data from and contributing data to a regional
clearinghouse. A general framework and recommended
collection policies have been developed; ARC continues
work to clarify how it will function and how to agree
upon a common set of standards for data integrity.
Source: ARC, ―Regional Data Inventory, Collection Standards, and
Clearinghouse Framework,‖ Aug. 2009, www.atlantaregional.com
Massachusetts notes in its CMP that the Pioneer Valley Transit Authority (PVTA) is implementing AVL to
accurately track bus and vehicle locations and provide on-time performance information to riders, and these
data will be incorporated into the CMP as they become available.9 The Hampton Roads Transportation
Planning Organization in Norfolk, Virginia similarly notes the potential use of AVL data from express transit
buses.10
Operations Agencies. Another opportunity for obtaining system performance data to support the CMP is
in the use of archived operations data from ITS applications, including those being operated by State DOTs
and toll authorities. Data on transportation system performance, such as travel speeds, volumes, and raw
video images of roadways, is collected by State DOTs and other operating agencies using cameras and loop
detectors for the purpose of managing traffic in real-time often from a transportation management center.
When State DOTs or other agencies archive data, it has the potential to be useful for planning. Archived
operations data typically must undergo some type of re-formatting and processing so that it can be used for
planning purposes in the CMP.
One example of this is in the Atlanta,
Georgia metropolitan region where the
Georgia Regional Transportation Authority
(GRTA) obtains traffic volume and speed
data from the Georgia DOT. The Georgia
DOT uses NAVIGATOR, an intelligent
transportation system deployed on the
region‘s roadways to manage traffic in real-
time but also to archive the data. The
volume and speed data are derived from
camera images sent back to the Georgia
DOT transportation management center
from closed-circuit television cameras
installed on State roads. Each year, GRTA
conducts an intensive data processing effort
to transform the archived data into
information that can be shared through a
report titled the ―Transportation
Metropolitan Atlanta Performance Report‖
or Transportation MAP Report. The report
includes maps of the region displaying the
freeway travel time index, freeway planning time index, and freeway buffer time index all calculated using
archived data from Georgia NAVIGATOR.11
Operations data may be particularly important for mid-sized MPOs that do not have significant traffic
congestion problems and may want to focus the CMP on reliability measures. As an example, the Capital
9 Congestion Management Process for the Pioneer Valley, Pioneer Valley Planning Commission, 2010. http://www.pvpc.org/resources/transport/Final%20CMP%20report_July2010_web.pdf
10 Statewide Opportunities for Integrating Operations, Safety and Multimodal Planning: A Reference Manual, FHWA 2010. http://www.fhwa.dot.gov/planning/statewide/manual/manual04.cfm
11 GRTA, ―2009 Transportation Metropolitan Atlanta Performance Report,‖ 2009, www.grta.org

30 Congestion Management Process: A Guidebook
District Transportation Committee (CDTC) in Albany, NY utilized data from the New York State DOT‘s
ITS system called MIST – Management Information System for Transportation. The data set covered an
entire year of data for 2003, and was used to identify both recurring and non-recurring delay on major
expressways (I-87, I-90, I-787, and Alternate Route 7).12
2.5 – Action 5: Analyze Congestion Problems and Needs
Once collected, raw data must be translated into meaningful
measures of performance. The purpose of this action is to
identify specific locations with congestion problems, and to
identify the sources of these problems. The complexity of
translating data into meaningful information for analysis varies
with the complexity of the multimodal performance measures
and data sources chosen. When data has been provided by
another source (secondary data) it may have a primary use that is
quite different than what is needed for the CMP. In addition,
the data may represent something entirely new to the staff
assigned to perform the analysis or translation. One example is
the use of ITS data. ITS sensor data is collected continuously
and represents a large volume of data that must be collapsed
into some form that provides useful information. While this
type of data can be extremely helpful to MPOs in understanding
reliability issues and sources of delay, considerable effort may be
needed to convert the data into a useful format for planning
purposes.
The technologies needed to analyze certain types of data may be unavailable or unfamiliar to the MPO staff,
creating logistical difficulties. Micro-simulation analysis is one tool that can be very effective at identifying the
potential causes of congestion in corridors or segments of a road; however, it requires a great deal of detailed
data to be truly illustrative of the existing condition and is not often available to MPO technical staff.
Partnerships with state DOT operations staff and research institutions can greatly assist the MPO in
incorporating this data into the CMP.
A strong interest in using operations data and strategies, in addition to support at the federal level, has led to
the use of new techniques in many regions. The use of visualization is one example that can be used at many
levels of sophistication for several uses: from communicating to the public and decision-makers to helping
technical staff analyze strategies for congestion mitigation. Other innovative analysis methodologies are
becoming more widely used with supporting training and technical assistance. Several examples are available
on the FHWA Office of Operations website (http://www.ops.fhwa.dot.gov/trafficanalysistools/index.htm).
12 CDTC, ―The Metropolitan Congestion Management Process,‖ May 2007, www.cdtcmpo.org
What are the congestion problems
in the region?
Before congestion management
strategies can be identified, it is
necessary to identify what the
problems are, where they are located,
and what is causing them. This
action serves as a critical link
between data collection and strategy
identification. Federal regulations
require that the CMP include
“methods to monitor and evaluate the
performance of the multimodal
transportation system [and] identify
the causes of recurring and non-
recurring congestion.”
23 CFR 450.320 (c) 1

The CMP within the Regional Transportation Planning Context 31
There are several issues that MPOs should take into account when analyzing data for the purpose of defining
or locating congestion problems, including:
Locations of major trip generators – in order to understand congestion issues related to specific
locations, it is often beneficial to have a knowledge of major trip generators (such as freight/intermodal
facilities, major tourist attractions, stadiums/arenas, universities, hospitals, major employers, airports, and
major shopping centers) and the typical traffic patterns, users, and times of high demand at these
locations;
Seasonal traffic variations – traffic patterns can vary greatly due to seasonal changes in school-related
trips, tourist/resort activity, farming and farm equipment activity, weather conditions, and daylight
conditions. When possible, data should be collected at times that will account for these variations, but
data manipulation may be necessary to account for these in some cases;
Time-of-day traffic variations – not all locations experience their highest demand during typical peak
periods, especially in areas with heavy school traffic (which often coincides with the morning peak, but has
an earlier afternoon peak) or in areas with large employers with shift change times outside the typical peak
period; and
Work trips vs. non-work trips – to the extent possible, it is helpful to understand the balance between
work-related trips and non-work trips within an area, as the strategies to address these different trip types
may differ.
Once data has been translated to allow comparisons between the various levels of congestion in the region,
the MPO must begin to apply the definitions of unacceptable congestion considered in Action 2 to individual
sections of the system. The result may be any of the following:
A set of areas or corridors defined as ―congested‖ based on the performance measures; these congested
corridors may be used to denote areas where activities to address congestion are necessary and
appropriate.
Case Study: Data Analysis at the Southwestern Pennsylvania Commission (SPC)
After the completion of a full season of data collection, the CMP planner at SPC spends about one
week analyzing the data with regard to the performance measures that SPC has chosen to use. The
primary performance measures are travel time, speed, and delay, but these are further broken into
seven more specific measures. Each of these performance measures is calculated for a daily, AM,
and PM value. The intention of measuring time, speed, and delay in several different ways is to
ensure that different types of congestion are all addressed by the process.
As part of the analysis, SPC does not set a specific threshold defining an acceptable level of
congestion. However, the analysis does result in regional rankings of the level of congestion in each
corridor. Rankings of the corridors are created for each of the seven performance measures, and are
broken out by functional classification so different types of roadways that are not comparable are
ranked separately. These rankings are used to inform the prioritization of congestion management
projects and to identify areas where local governments should be encouraged to implement
congestion management improvements.
Source: SPC, Congestion Management Process, 2005, www.spcregion.org/trans_cong.shtml
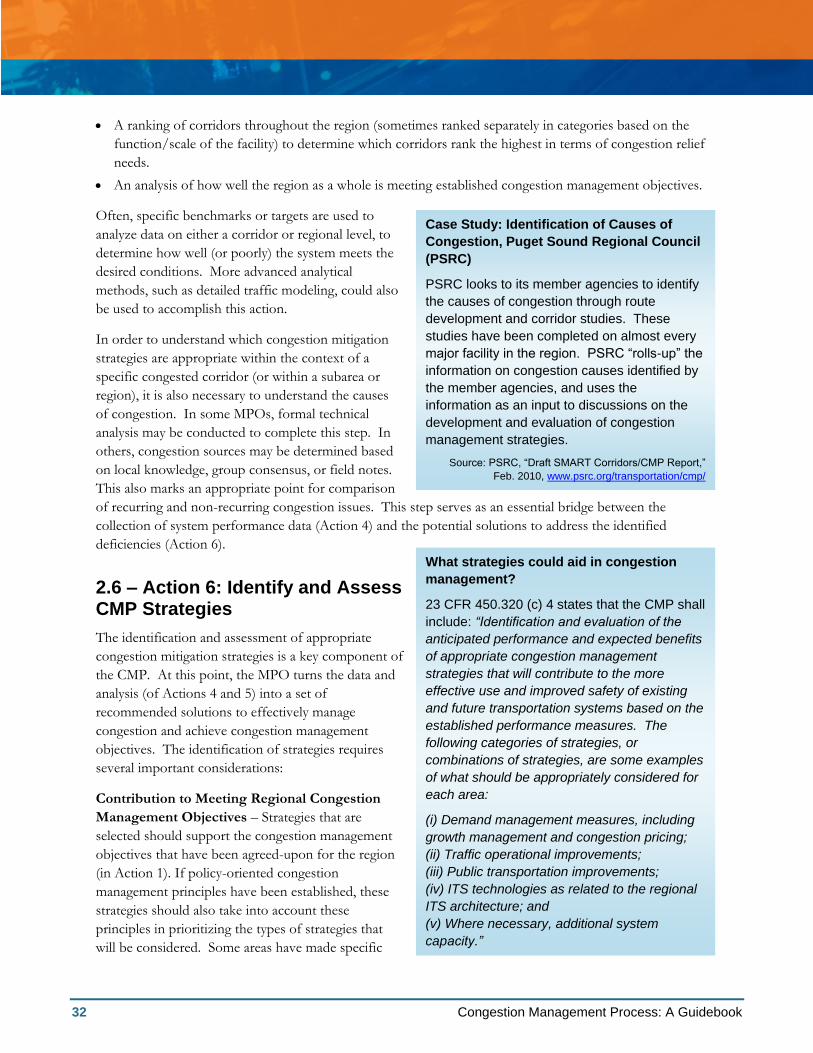
32 Congestion Management Process: A Guidebook
A ranking of corridors throughout the region (sometimes ranked separately in categories based on the
function/scale of the facility) to determine which corridors rank the highest in terms of congestion relief
needs.
An analysis of how well the region as a whole is meeting established congestion management objectives.
Often, specific benchmarks or targets are used to
analyze data on either a corridor or regional level, to
determine how well (or poorly) the system meets the
desired conditions. More advanced analytical
methods, such as detailed traffic modeling, could also
be used to accomplish this action.
In order to understand which congestion mitigation
strategies are appropriate within the context of a
specific congested corridor (or within a subarea or
region), it is also necessary to understand the causes
of congestion. In some MPOs, formal technical
analysis may be conducted to complete this step. In
others, congestion sources may be determined based
on local knowledge, group consensus, or field notes.
This also marks an appropriate point for comparison
of recurring and non-recurring congestion issues. This step serves as an essential bridge between the
collection of system performance data (Action 4) and the potential solutions to address the identified
deficiencies (Action 6).
2.6 – Action 6: Identify and Assess CMP Strategies
The identification and assessment of appropriate
congestion mitigation strategies is a key component of
the CMP. At this point, the MPO turns the data and
analysis (of Actions 4 and 5) into a set of
recommended solutions to effectively manage
congestion and achieve congestion management
objectives. The identification of strategies requires
several important considerations:
Contribution to Meeting Regional Congestion
Management Objectives – Strategies that are
selected should support the congestion management
objectives that have been agreed-upon for the region
(in Action 1). If policy-oriented congestion
management principles have been established, these
strategies should also take into account these
principles in prioritizing the types of strategies that
will be considered. Some areas have made specific
Case Study: Identification of Causes of
Congestion, Puget Sound Regional Council
(PSRC)
PSRC looks to its member agencies to identify
the causes of congestion through route
development and corridor studies. These
studies have been completed on almost every
major facility in the region. PSRC ―rolls-up‖ the
information on congestion causes identified by
the member agencies, and uses the
information as an input to discussions on the
development and evaluation of congestion
management strategies.
Source: PSRC, ―Draft SMART Corridors/CMP Report,‖
Feb. 2010, www.psrc.org/transportation/cmp/
What strategies could aid in congestion
management?
23 CFR 450.320 (c) 4 states that the CMP shall
include: “Identification and evaluation of the
anticipated performance and expected benefits
of appropriate congestion management
strategies that will contribute to the more
effective use and improved safety of existing
and future transportation systems based on the
established performance measures. The
following categories of strategies, or
combinations of strategies, are some examples
of what should be appropriately considered for
each area:
(i) Demand management measures, including
growth management and congestion pricing;
(ii) Traffic operational improvements;
(iii) Public transportation improvements;
(iv) ITS technologies as related to the regional
ITS architecture; and
(v) Where necessary, additional system
capacity.”
The CMP within the Regional Transportation Planning Context 33
policy decisions to prioritize demand management strategies first, followed by system management and
operations strategies, and only build new capacity as a last resort if other approaches are not sufficient.
Local Context – Community context and public involvement should play an important role in determining
the types of strategies that are appropriate for a specific corridor, facility, or intersection. Strategies should fit
into the context of the community and should be appropriate in regard to the role of the transportation
facilities within the regional network (e.g., whether it is a freight corridor, economic development corridor,
major commuter route, etc.). For example, in urban centers (high density, mixed use places, typically with
well-connected street networks, high levels of transit service, and pedestrian supportive environments), the
strategies implemented to address traffic congestion will differ from the strategies to be applied in suburban
communities (typically characterized by a limited mix of housing, employment, and commercial services,
limited connections in street networks, and large amounts of surface parking). Similarly, the strategies to
address freeway congestion on an urban interstate accessing a downtown or major suburban jobs center will
likely differ from strategies that would be appropriate for a corridor that does not serve as much commuter
traffic.
Contribution to Other Goals and Objectives – In addition to focusing on the operational performance of
the transportation system, it is important to consider strategies in the context of multiple goals and objectives
for the region. These other considerations will likely include issues such as safety, economic vitality, system
preservation, and air quality.
Jurisdiction over CMP Strategies – The MPO charged with implementing the CMP will typically rely on
the actions of other governmental partners in implementing strategies, including State DOTs, transit agencies,
and local jurisdictions. In particular, land use strategies are often a challenge given local authority over land
use planning. Coordination and collaboration among multiple agencies is critical to an effective CMP.
Consequently, the MPO will need to coordinate with potential partners by framing desirable strategy types
and defining roles in implementation.
Identifying Congestion Management Strategies
A wide range of strategies are available and can be broadly grouped into the following categories.
Demand Management Strategies. Travel Demand Management (TDM), nonautomotive travel modes, and
land use management can all help to provide travelers with more options and reduce the number of vehicles
or trips during congested periods. These include strategies that substitute communication for travel, or
encourage regional cooperation to change development patterns and/or reduce sprawl.
Promoting Alternatives
Programs that encourage transit use and ridesharing, such as marketing/outreach for transit and travel
demand management (TDM) services
Pedestrian and bicycle improvements and other strategies that promote nonmotorized travel
Managing and Pricing Assets
Congestion pricing strategies, including high occupancy toll (HOT) lanes
Parking management
Pricing fees for parking spaces by the number of persons in the vehicle and the time of day or location
Pricing fees for the use of travel lanes by the number of persons in the vehicle and the time of day

34 Congestion Management Process: A Guidebook
Increasing intercity freight rail or port capacity to reduce truck use of highways
Work Patterns
Flexible work hours programs
Telecommuting programs
Land Uses
Land use controls or zoning to support/encourage mixed use development and TDM friendly
neighborhoods
Growth management restrictions such as urban growth boundaries
Development policies that support transit-oriented designs for corridors and communities involving
homes, jobsites, and shops
Incentives for high-density development, such as tax incentives
Traffic Operations Strategies. These strategies focus on getting more out of what we have. Rather than
building new infrastructure, many transportation agencies have embraced strategies that deal with operation
of the existing network of roads. Many of these operations-based strategies are supported by the use of
enhanced technologies or Intelligent Transportation Systems (ITS).
Highway/Freeway Operations
Metering traffic onto freeways
Reversible commuter lanes
Access management
Movable median barriers to add capacity during peak periods
Automated toll collection improvements
Conversion of HOV lanes to High Occupancy Toll (HOT) lanes
Bus-only shoulder lanes
Arterial and Local Roads Operations
Optimizing the timing of traffic signals
Restricting turns at key intersections
Geometric improvements to roads and intersections
Converting streets to one-way operations
Transit signal priority
Access management
Traffic calming
Road diets (narrowing or removing of travel lanes, often on undivided multilane facilities – e.g. converting
from a 4-lane cross-section to a 3-lane cross-section)
Other Operations Strategies
Faster and anticipatory responses to traffic incidents (incident management)
Traveler information systems

The CMP within the Regional Transportation Planning Context 35
Improved management of work zones
Identifying weather and road surface problems and rapidly targeting responses
Anticipating and addressing special events, including emergency evacuations, that cause surges in traffic
Better freight management, especially reducing delays at border crossings
Public Transportation Strategies. Improving transit operations, improving access to transit, and
expanding transit service can help reduce the number of vehicles on the road by making transit more
attractive or accessible. These strategies may be closely linked to strategies in the previous two categories
(demand management and traffic operations). As with traffic operations, transit operations are often
enhanced by ITS
Operations Strategies
Realigned transit service schedules and stop locations
Providing real-time information on transit schedules and arrivals using vehicle location data
Providing travelers with information on travel conditions as well as alternative routes and modes
Monitoring the security of transit patrons, stations, and vehicles
Enhanced transit amenities and safety
Universal farecards for regions with multiple transit agencies
Transit signal priority
Bus rapid transit
Capacity Strategies
Reserved travel lanes or rights-of-way for transit operators, including use of shoulders during peak periods
More frequent transit or expanded hours of service
Expanding the transit network through new bus and rail services
Accessibility Strategies
Improvements to bicycle and pedestrian facilities that provide access to transit stops
Provisions for bicycles on transit vehicles and at transit stops (bikes on trains and buses, secure bicycle
parking at stops)
Road Capacity Strategies. This category of strategies addresses adding more base capacity to the road
network, such as adding additional lanes and building new highways, as well as redesigning specific
bottlenecks (such as interchanges and intersections) to increase their capacity. Given the expense and possible
adverse environmental impacts of new single-occupant vehicle capacity, management and operations
strategies should be given due consideration before additional capacity is considered.
Constructing new HOV or HOT lanes
Removing bottlenecks
Intersection improvements
Center turn lanes
Overpasses or underpasses at congested intersections
36 Congestion Management Process: A Guidebook
Closing gaps in the street network
Add travel lanes on major freeways and streets (including truck climbing lanes on grades)
Some MPOs have developed a ―toolbox‖ of strategies for consideration by local governments that are
implementing projects. For example, the New York Metropolitan Transportation Council (NYMTC) has a
CMP toolbox that identifies strategies in nine categories: highway, transit, bicycle and pedestrian, travel
demand management, Intelligent Transportation Systems and transportation supply management, access
management, land use, parking, and regulatory strategies. It highlights congestion and mobility benefits and
costs and impacts of each strategy. 13 The Grand Valley Metro Council in Grand Rapids, Michigan refers to
its approach as a ―Cafeteria Plan,‖ which also identifies a list of strategies along with their benefits.14 Some
areas have also developed a hierarchy of strategies, drawing on policy goals or principles (e.g., they may seek
to prioritize demand management and operations strategies above capacity additions).
Assessing Congestion Management Strategies
Techniques for evaluating and selecting strategies include the use of committees or group consensus, the
refinement of standard ―seed‖ strategies based on local characteristics, and staff-level technical analysis.
Information collected through monitoring of implemented strategies can be most helpful in evaluating the
success of individual strategies and targeting specific strategies to applications where they have demonstrated
success. This feedback loop provides a continuous refinement of the strategies considered for congestion
management in different situations.
Some examples of tools and methods for assessing the potential effectiveness of congestion management
strategies include the following:
Travel demand models – Travel demand models are the primary tools used in regional travel forecasting,
and are used to predict future travel patterns based on current conditions and projections of future
household and employment patterns. Travel demand models may be used to analyze the effectiveness of
land use planning strategies and transportation infrastructure investments, as well as some pricing
strategies, but have only limited capabilities to accurately estimate changes in operational characteristics,
such as speed, delay, and queuing resulting from implementation of operations strategies.
Sketch planning tools – Sketch planning methodologies typically produce general order-of-magnitude
estimates of changes in travel demand and/or speeds in response to different types of transportation
strategies, and are commonly used to estimate the effects of travel demand management strategies. For
example, several tools, such as EPA‘s COMMUTER Model and the TRIMMS tool developed by the
Center for Urban Transportation Research, are available to estimate the effects of TDM strategies, such as
parking management, employer-based programs, and transit subsidies. The ITS Deployment Analysis
System (IDAS) and Screening for ITS (SCRITS) work with the outputs of traditional transportation
planning models, and enable planners to evaluate the costs and benefits of ITS investments. The Surface
Transportation Efficiency Analysis Model (STEAM) enables users to assess the safety and mobility
benefits of transportation investments, as well as policy alternatives such as road pricing. Spreadsheet-
13 New York Metropolitan Transportation Council, ―CMP Toolbox,‖ http://www.nymtc.org/project/CMS/2009_CMP_files/CMP%20Toolbox.pdf.
14 Grand Valley Metro Council, Congestion Management Process, January 2009. http://www.gvmc.org/transportation/documents/GVMC%20CMP%20Document%202009%20Update%20Updated%205~2010.pdf
The CMP within the Regional Transportation Planning Context 37
based benefit/cost analysis tools, such as Cal-B/C, can be used to evaluate the costs and benefits of
potential roadway or transit improvements.
Past experience or evaluations of strategies – Information about the use and effectiveness of
previously implemented strategies may provide information on the effectiveness of strategies such as
operations approaches (e.g. incident management and work zone management) that may not be easily
analyzed using travel demand forecasting models. For instance, some areas have conducted evaluations of
the effects of traffic signal coordination, and use this information to help justify and assess the potential
benefits of signal coordination in additional corridors.
Analytical/deterministic tools (HCM-based) – Most analytical/deterministic tools implement the
procedures of the Highway Capacity Manual (HCM). These tools quickly predict capacity, density, speed,
delay, and queuing on a variety of transportation facilities and are validated with field data, laboratory test
beds, or small-scale experiments. Analytical/deterministic tools are good for analyzing the performance of
isolated or small-scale transportation facilities; however, they are limited in their ability to analyze network
or system effects.
Traffic signal optimization tools – Traffic signal optimization tools are primarily designed to develop
optimal signal-phasing and timing plans for isolated signal intersections, arterial streets, or signal networks.
This may include capacity calculations; cycle length; splits optimization, including left turns; and
coordination/offset plans. Some optimization tools can also be used for optimizing ramp metering rates
for freeway ramp control.
Simulation models – Simulation tools may be used by agencies to analyze the impact of operations
strategies. These tools can provide information relating to analysis of incidents and real-time diversion
patterns. However, they may also be costly to use because of data requirements and necessary computing
capability. There are several categories of simulation tools including macroscopic, mesoscopic, and
microscopic simulation models.
Dynamic Traffic Assignment (DTA) – DTA models supplement existing travel forecasting models and
microscopic traffic simulation models. Travel forecasting models represent the static regional travel
analysis capability, whereas microscopic traffic simulation models are superior for dynamic corridor-level
travel analysis. DTA models fill the gap between these by enabling dynamic traffic to be modeled at a
range of scales from corridors to regions, with expanded and unique functional capabilities enabled by the
DTA methodology. For more information on DTA, see:
http://tmip.fhwa.dot.gov/resources/clearinghouse/browse/list/6/1371.
For more information on potential analysis tools, see FHWA, Applying Analysis Tools in Planning for Operations,
FHWA-HOP-10-001 (Washington, DC) and “Traffic Analysis Tools, Types of Traffic Analysis Tools”, available at
http://ops.fhwa.dot.gov/trafficanalysistools.
Often, more detailed analysis of potential strategies occurs within corridor studies or project-level studies
(described further in Action 7).

38 Congestion Management Process: A Guidebook
2.7 – Action 7: Program and Implement CMP Strategies
Implementation of CMP strategies occurs on
three levels: system or regional, corridor, and
project.
Regional-level implementation of congestion
management strategies occurs through inclusion
of strategies in the fiscally-constrained MTP
and the TIP. At the corridor level, more
specific strategies such as bicycle and pedestrian
improvements and operational improvements
can be assessed in studies and implemented
using a variety of funding sources, including
Federal funding streams such as the Surface Transportation Program (STP), National Highway System (NHS)
funds, and the Congestion Mitigation and Air Quality Improvement (CMAQ) Program, as well as through
state or local funding or other discretionary funding sources. For larger projects, particularly capacity-adding
projects, demand management and operational strategies should also be analyzed for incorporation into the
project as part of the project development process.
This tiered approach to strategy implementation integrates the CMP into all aspects of MPO planning and
allows a flexible and robust incorporation of congestion management. It also introduces the consideration of
scale. Some MPOs are actively engaged in efforts to integrate transportation planning into the NEPA
decision-making process, and one of the notable barriers is the difference in scale between regional analysis
and project analysis. The CMP offers one way to bridge that gap by translating system-level understanding to
inform project-level decisions.
Regional Prioritization of Strategies
There are several ways to integrate the CMP analysis into regional prioritization of strategies:
Use the CMP in criteria for prioritizing projects in the MTP and/or TIP - The process of prioritizing
projects for inclusion in the MTP and/or TIP might include a scoring element that gives weight to the
relative congestion on that corridor based on the CMP data. In a formal scoring process, points could be
allotted based on a number of factors, including the potential for the project to address and manage
congestion. Scoring systems could treat projects differently based on location or strategy type according to
congestion levels, or community goals. For instance, more points might be allotted to projects in very
congested locations, or, specifically to certain types of projects in the urban core than to projects in areas
where further development is not desired.
As an example, the Ohio-Kentucky-Indiana Regional Council of Governments (OKI) in Cincinnati
developed a scoring process for selecting worthy highway and transit projects in its MTP. The process ranks
projects using several transportation and planning factors, including existing level of congestion and projected
impact on congestion, which are added together for a maximum of 100 points. Both the model V/C data
and observed delay data were mapped and placed into three congestion categories: None or Low, Medium,
and High. All projects under consideration for the MTP were located on the maps and given points
corresponding to the congestion category of the roadway they impacted. Projects in the None or Low
How will congestion management strategies be
implemented?
Action 7 is critical for turning the strategy
recommendations of the CMP into on-the-ground
implemented projects. Federal regulations require that
the CMP include: “Identification of an implementation
schedule, implementation responsibilities, and possible
funding sources for each strategy (or combination of
strategies) proposed for implementation.”
23 CFR 450.320 (c) 5

The CMP within the Regional Transportation Planning Context 39
category were given zero points, Medium projects scored three points and projects in the High congestion
locations scored five points.15 Other areas use similar scoring procedures for prioritizing projects for the TIP;
one example is the Wilmington Area Planning Council in Delaware (see text box).
Some MPOs feel that a quantitative scoring of
congestion as part of project prioritization is not
appropriate to their situation, given the wide range of
qualitative factors, such as quality of life and livability,
that need to be considered in making project
investment decisions. These MPOs typically use
information from the CMP along with other data to
make decisions using a more qualitative process of
balancing various objectives. An MPO may also
specify that roadway capacity projects will not be
funded unless the project emerges from the CMP as
having a critical congestion problem.
Explicitly set aside funding for congestion
management projects - An MPO can establish a
program designed to fund relatively small congestion
management projects. The CMP can be used to define
criteria for rapid allocation of funds to solve
straightforward congestion problems. This can be
useful not only for improving mobility, but also for
elevating the MPO‘s visibility among stakeholders that
are primarily interested in short-term implementation,
such as freight shippers and developers. It may be
useful to identify geographic areas of need based on
congestion data, in which projects would then be
eligible for funding under such a program. This
approach may be useful in larger areas with numerous
large projects competing for transportation funding,
where smaller projects may have difficulty competing
on their own, and in areas where quick-response projects may arise in between regular TIP cycles. For
example, METROPLAN Orlando, the MPO in Orlando, Florida, has set aside funding for quick-response
operational improvements.16 Miami-Dade MPO in Miami, Florida, is expanding an earlier set-aside program
to take a more comprehensive, corridor-wide approach to funding congestion management improvements,
better integrating them with one another and the MTP. Such projects will have a set-aside fund as of the
2015 TIP, and in the meantime the agency will conduct CMP improvement studies on congested corridors in
preparation for design work and seek alternative funding for more immediate implementation.17
15 Telephone interview with Andy Reser, OKI Regional Council of Governments, January 2010
16 Telephone interview with Eric Hill, Metroplan Orlando, January 2010
17 Conversation with Jesus Guerra, Miami-Dade MPO, October 1, 2010.
Case Study: Project Prioritization at the
Wilmington Area Planning Council
(WILMAPCO)
WILMAPCO has a mathematical process for
assigning scores to proposed projects, which is
used to develop a prioritized list of projects for
funding. The score is divided among many
different policy areas and goals (based on the
goals of the long-range plan), with congestion
management making up the largest single
share of the score (28%). The congestion
management score is based entirely on the
CMP, with points awarded to projects that are
located within CMP corridors (after checking
that the type of improvement proposed is
consistent with the strategies outlined in the
CMP). Additional points are awarded to
projects based on the trip volumes in the
project corridor (both roadway and transit
volume), as a way to give additional weight to
major corridors where congestion mitigation is
likely to have a greater public benefit. The final
scoring/ranking of projects based on these
criteria is then applied to the overall project
prioritization scoring process, and the results
are documented in the CMP report.
Source: WILMAPCO, “2009 WILMAPCO Congestion Management System Summary,” July 2009 www.wilmapco.org/cms

40 Congestion Management Process: A Guidebook
Corridor and Project Studies
In many cases, specific congestion management strategies may be identified through more detailed corridor
studies and project development efforts. Some MPOs, such as the Delaware Valley Regional Planning
Commission in the Philadelphia area, have required that any capacity-adding project be accompanied by
congestion reducing strategies to improve the long-term effectiveness of the improvement. Because projects
are most often implemented by agencies other than the MPO, this requires oversight by the MPO staff or a
system to relay information on the effectiveness of associated strategies. Such information is crucial to
achieving the full realization of the CMP as a continuous process. This step also represents the point at
which consistency between planned/programmed projects and the CMP should be ensured, particularly for
projects that will add capacity to roadways. Collaboration with partners at implementing agencies is a critical
element of this step.
As projects are advanced to project development and environmental review, the CMP offers an opportunity
to link planning and the NEPA process. This process can sometimes break down if project developers and
designers are not aware of the CMP‘s congestion management objectives or the range of performance
measures that are being used regionally to monitor performance. The link between NEPA and the CMP is
discussed in more detail in section 3.4.
2.8 – Action 8: Evaluate Strategy Effectiveness
Evaluation of strategy effectiveness can be seen as either a
sequential step within the CMP process or as an on-going
process. This is an essential, required element of the CMP that
is often overlooked. The primary goal of this Action is to
ensure that implemented strategies are effective at addressing
congestion as intended, and to make changes based on the
findings as necessary. Two general approaches are used for
this type of analysis:
(1) System-level performance evaluation - Regional
analysis of historical trends to identify improvement or
degradation in system performance, in relation to
objectives; and
(2) Strategy effectiveness evaluation - Project-level or
program-level analysis of conditions before and after the
implementation of a congestion mitigation effort.
Findings that show improvement in congested conditions due to specific implemented strategies can be used
to encourage further implementation of these strategies, while negative findings may be useful for
discouraging or downplaying the effectiveness of similar strategies in similar situations. The information
learned from evaluation should be used to inform the TIP and MTP, as well as other steps within the CMP,
notably the identification and assessment of strategies (Action 6).
One approach to evaluation is for the MPO to fund studies to measure the effectiveness of particular
congestion strategies or projects by examining conditions before and after, or with and without, a strategy of
interest. For instance, a study could be conducted to quantify vehicle-miles-traveled (VMT) reductions or
How effectively have implemented
strategies achieved congestion
management objectives?
23 CFR 450.320 (c) 6 requires that the
CMP include: “Implementation of a
process for periodic assessment of the
effectiveness of implemented
strategies, in terms of the area’s
established performance measures.
The results of this evaluation shall be
provided to decisionmakers and the
public to provide guidance on selection
of effective strategies for future
implementation.”
The CMP within the Regional Transportation Planning Context 41
mode shifts of a transportation demand management (TDM) program, to quantify the speed improvements
associated with traffic flow improvement projects, to examine the reduction in vehicle delay associated with
operational strategies, or other similar types of impacts. An example is the effort of the National Capital
Region Transportation Planning Board (TPB) in the Washington, DC region to quantify the effectiveness of
its Commuter Connections TDM program. TPB conducts a regional ―State of the Commute‖ survey, along
with additional surveys such as a Guaranteed Ride Home Program survey and tracking of participation rates
in programs, in order to analyze the vehicle travel reductions and air quality improvements associated with
the program. 18 The North Central Texas Council of Governments (NCTCOG), the MPO for the Dallas-Ft.
Worth area, has conducted evaluations of its Thoroughfare Assessment Program, which involves retiming
traffic signals on major corridors. The results demonstrate reductions in travel delay and emissions.19
Another approach is for the MPO to develop guidance for evaluating strategies, and require local project
sponsors to conduct evaluations of their projects and programs. Guidance can be provided on when an
assessment should be done, what measures should be used, how data should be gathered, what methods
should be used to analyze the data, and other aspects of evaluation studies. This approach is appropriate
where partner agencies are responsible for implementation of CMP strategies, or where the MPO does not
currently have sufficient resources to conduct studies. The East-West Gateway Coordinating Council
(EWGCC) in St. Louis, Missouri, provides guidance to localities on when focused evaluations of strategy
effectiveness are warranted, and how to conduct them. For example, if little is known about the actual
benefits of the project, effectiveness evaluation can determine whether such strategies should be implemented
more broadly (e.g., a trip reduction program that has not previously been used in the region), or if changes are
required in the implementation of the strategy to produce the desired benefits.20
3–The CMP within the Regional Transportation Planning Context
3.1 – Collaboration among Stakeholders
Collaboration and coordination among a wide range of stakeholders – MPO planners, State DOT planning
and operations staff, transit agencies, local governments, toll authorities, university transportation centers, and
the private sector – is an important foundation for an effective CMP. Within the metropolitan transportation
planning process, these partners can work together to develop regional objectives for congestion
management, define performance measures, share and analyze data, and identify potential strategies.
Transportation agencies in the region may collectively have both the data and analysis capabilities to fully
understand and address system congestion. As noted earlier, many different organizations currently collect
data, and these data can be utilized within the CMP. The MPO provides a forum for consideration of this
technical information as well as potential strategies to address congestion. Many MPOs have used this role to
create committees and working groups to address various aspects of CMP in very successful ways.
18 See for example TPB and MWCOG, ―2007 State of the Commute Survey Report,‖ June 2008, www.mwcog.org
19 See for example Kimley-Horn and Associates for NCTCOG, ―Thoroughfare Assessment Program Phase 2.0,‖ July 2009, www.nctcog.org/trans/tsm
20 EWGCC, ―St. Louis Region CMS Congestion Mitigation Handbook,‖ February 1998, http://www.ewgateway.org/pdffiles/library/trans/cmshandbook.pdf

42 Congestion Management Process: A Guidebook
Congestion management strategies also benefit from a broad partnership in their design and implementation.
Congested corridors that span several jurisdictions require a collaborative approach to the identification of
appropriate strategies. Spot improvements such as bottlenecks can be addressed relatively quickly with
collaborative support. This provides a win-win situation for individual stakeholders when resources are
pooled to reach a common goal. Collaboration and the short-term implementation of solutions create
support for the CMP by demonstrating its value.
3.2 – Livability and Multimodal Considerations in the CMP
While the transportation planning process involves developing transportation investments and policies to
support community quality of life, there has recently been renewed attention placed on the role of
transportation in supporting community livability. The concept of livability was given greater focus through
the six livability principles established by the Sustainable Communities Partnership between the U.S. DOT,
the Environmental Protection Agency (EPA), and the Department of Housing and Urban Development
(HUD) (see text box on next page).
Traffic congestion and limited travel choices can adversely affect community well-being. Residents‘ quality of
life is diminished when congestion impedes reliable and timely access to employment, education, and
recreational opportunities, and as congestion steals time away from families, increases fossil fuel consumption
and air pollution, and increases travel costs.
Many congestion management strategies that may be identified in the CMP help to support livable
communities. For instance, increasing transit, bicycling, and walking options provides more transportation
choices, which can decrease household transportation costs, reduce dependence on foreign oil, improve air
quality, reduce greenhouse gas emissions, and promote public health. Strategies to better manage and operate
the transportation system can enhance economic competitiveness by increasing reliable travel times for
Case Study: Collaborative Approach to the CMP at the Capital Area MPO (CAMPO)
A central feature of the CMP at CAMPO in Austin, Texas is the extensive use of working groups and
committees to support all aspects of the process. This collaborative approach allows the pooling of
resources; elimination of conflicting plans, projects, and goals; and establishment of buy-in from all
partners.
For example, the Bottleneck Committee was established to identify, evaluate, and prioritize actions
needed to address individual bottleneck locations. This committee has representatives from local
governments and functional areas within TXDOT as well as the MPO staff who meet on a regular
basis to address each location. In addition to developing strategies to address the congested areas,
the members ensure that individual jurisdictions are not working at cross purposes on the same issue.
This provides a consistent perspective across the region and promotes the most efficient use of
resources. In this group, TxDOT provides the technical resources to support data collected by
CAMPO and others. The working relationship also encourages local governments to participate in the
funding of identified improvements.
Other committees and working groups include the Congestion Management/Intelligent Transportation
System Working Group, the Austin-Area Incident Management for Highways (AIMHigh) Team, and the
Managed Lanes Working Group.
Source: CAMPO, “CAMPO 2035 Regional Transportation Plan Appendices,” March 2010, www.campotexas.org
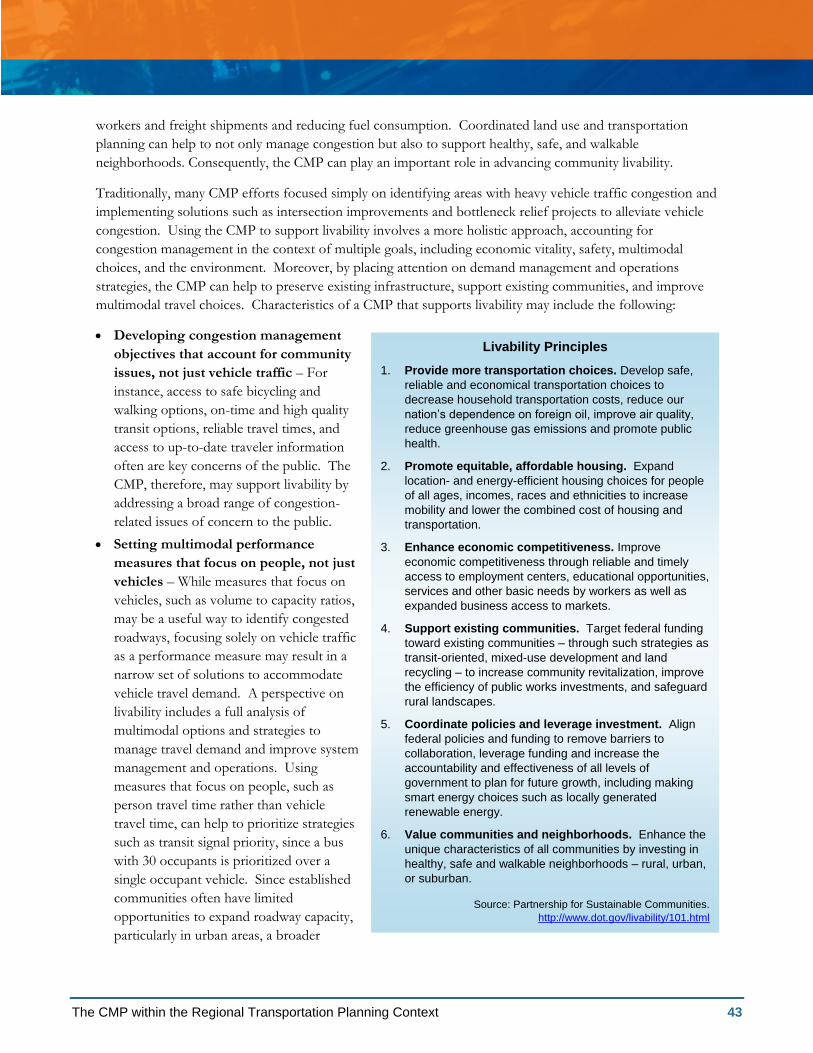
The CMP within the Regional Transportation Planning Context 43
workers and freight shipments and reducing fuel consumption. Coordinated land use and transportation
planning can help to not only manage congestion but also to support healthy, safe, and walkable
neighborhoods. Consequently, the CMP can play an important role in advancing community livability.
Traditionally, many CMP efforts focused simply on identifying areas with heavy vehicle traffic congestion and
implementing solutions such as intersection improvements and bottleneck relief projects to alleviate vehicle
congestion. Using the CMP to support livability involves a more holistic approach, accounting for
congestion management in the context of multiple goals, including economic vitality, safety, multimodal
choices, and the environment. Moreover, by placing attention on demand management and operations
strategies, the CMP can help to preserve existing infrastructure, support existing communities, and improve
multimodal travel choices. Characteristics of a CMP that supports livability may include the following:
Developing congestion management
objectives that account for community
issues, not just vehicle traffic – For
instance, access to safe bicycling and
walking options, on-time and high quality
transit options, reliable travel times, and
access to up-to-date traveler information
often are key concerns of the public. The
CMP, therefore, may support livability by
addressing a broad range of congestion-
related issues of concern to the public.
Setting multimodal performance
measures that focus on people, not just
vehicles – While measures that focus on
vehicles, such as volume to capacity ratios,
may be a useful way to identify congested
roadways, focusing solely on vehicle traffic
as a performance measure may result in a
narrow set of solutions to accommodate
vehicle travel demand. A perspective on
livability includes a full analysis of
multimodal options and strategies to
manage travel demand and improve system
management and operations. Using
measures that focus on people, such as
person travel time rather than vehicle
travel time, can help to prioritize strategies
such as transit signal priority, since a bus
with 30 occupants is prioritized over a
single occupant vehicle. Since established
communities often have limited
opportunities to expand roadway capacity,
particularly in urban areas, a broader
Livability Principles
1. Provide more transportation choices. Develop safe,
reliable and economical transportation choices to
decrease household transportation costs, reduce our
nation’s dependence on foreign oil, improve air quality,
reduce greenhouse gas emissions and promote public
health.
2. Promote equitable, affordable housing. Expand
location- and energy-efficient housing choices for people
of all ages, incomes, races and ethnicities to increase
mobility and lower the combined cost of housing and
transportation.
3. Enhance economic competitiveness. Improve
economic competitiveness through reliable and timely
access to employment centers, educational opportunities,
services and other basic needs by workers as well as
expanded business access to markets.
4. Support existing communities. Target federal funding
toward existing communities – through such strategies as
transit-oriented, mixed-use development and land
recycling – to increase community revitalization, improve
the efficiency of public works investments, and safeguard
rural landscapes.
5. Coordinate policies and leverage investment. Align
federal policies and funding to remove barriers to
collaboration, leverage funding and increase the
accountability and effectiveness of all levels of
government to plan for future growth, including making
smart energy choices such as locally generated
renewable energy.
6. Value communities and neighborhoods. Enhance the
unique characteristics of all communities by investing in
healthy, safe and walkable neighborhoods – rural, urban,
or suburban.
Source: Partnership for Sustainable Communities.
http://www.dot.gov/livability/101.html

44 Congestion Management Process: A Guidebook
perspective on system performance can help to ensure investments in effective strategies (e.g., pricing,
demand management) are made in these areas.
Identifying the most appropriate congestion management strategies for specific locations, based
on their positive contributions to communities and neighborhoods – Identification of appropriate
congestion management solutions should account for the local context and setting (e.g., urban center,
suburban center, parkway to access recreational areas, freight corridor). Issues such as aesthetics,
pedestrian and bicycle access and safety, and support for desired land use plans are important
considerations, and may affect the congestion solutions that are appropriate for a specific area.
The Capital District Transportation Committee (CDTC) in Albany, New York is an example of an MPO with
a strong emphasis on livability in its MTP and CMP. CDTC has found through public outreach, including
surveys, that the public wants more multimodal options, more vibrant urban centers, and more livable
communities. The MTP calls for a strong livability agenda—land use planning, urban reinvestment,
transportation choices and community values—and the region‘s focus on livability has placed a strong
emphasis on management and operations (M&O) strategies as a key approach for congestion management.
M&O is seen as supportive of livability goals because it minimizes the construction of new pavement and
addresses travel time reliability, of which the latter has been identified as the most important congestion issue
for travelers. A central feature of the CMP is the recognition that while reducing traffic congestion is
important, it is not the preeminent goal of transportation planning in the region. Objectives of reducing
traffic congestion need to be balanced with multiple planning objectives.21
Several MPOs have incorporated land use and sustainable development strategies into their MTPs, and
consider land use as one strategy to reduce vehicle travel and congestion. For example, both the Tri-County
Regional Planning Commission (TCRPC) in Lansing, Michigan and the Columbia Area Transportation Study
(COATS) in Columbia, South Carolina call for land use strategies to be the first considered when deciding
how to address regional congestion. TCRPC‘s land use strategy is focused around the adopted ―wise growth‖
scenario from their Regional Growth: Choices for Our Future project, which was incorporated into their 2035
MTP. Analysis conducted at the time of the Regional Growth project found that the ―wise growth‖ strategy of
focused growth in existing centers would reduce congested lane miles to half what would otherwise occur if
current growth trends continued. The MPO has an adopted policy to review all proposed uses of federal
funds and their priorities on the basis of the regional land use vision of Wise Growth 22 COATS‘ CMP has
five hierarchical levels of congestion mitigation strategies, arranged from most to least cost-effective and
efficient. Land use is the first level, and therefore seen as the most effective/efficient, while adding capacity
is seen as the most cost prohibitive and intrusive. COATS does not as explicitly link its CMP land use
strategies to the regional growth management efforts, but its CMP is embedded in the MTP where regional
growth strategies are also addressed.23 In California, state statutes require that counties develop Congestion
Management Plans, which generally feed into regional CMP documentation—see text box for a discussion of
the land use analysis conducted by Los Angeles County as part of its CMP.
21 See case study of Capital District Transportation Committee (CDTC) CMP developed as companion to this guidebook, http://plan4operations.dot.gov/congestion.htm
22 Tri-County Regional Planning Commission, ―Congestion Management System for the Tri-County Region, 2004, http://www.tri-co.org
23 Columbia Area Transportation Study, ―Chapter 8 – Congestion Management‖ in Midlands Tomorrow 2035 LRTP, 2008, http://www.centralmidlands.org

The CMP within the Regional Transportation Planning Context 45
Multimodal considerations are an
important aspect of livability within
the CMP. Congestion management
does not apply only to highway
transportation. Transit systems are
subject to congestion and have a
unique set of measures and potential
congestion mitigation strategies. In
areas where public transportation
represents a large share of the
transportation system, the CMP may
contain specific performance measures
focused on transit. The CMP may also
serve as an important source of data
and supporting documentation for
major projects seeking funding
through the FTA New Starts program.
Even in regions where public
transportation is limited, transit may
still be important to consider as a
strategy in the CMP. Moreover, in
regions with limited transit, the role of
bicycle and pedestrian improvements,
ridesharing, and other demand
management strategies may be
particularly important to consider as
viable multimodal congestion
management strategies.
3.3 – Single Occupant Vehicle (SOV) Capacity-Adding Projects and the Role of Demand Management and Operations Strategies
Adding capacity in the form of highway widening and the construction of new highway facilities is considered
the strategy of last resort by many MPOs. There are several reasons cited for this, including land
preservation/discouragement of sprawl, promotion of alternative transportation modes, and cost
considerations (allowing multiple low-cost improvements rather than fewer high-cost improvements). As a
general policy, these MPOs attempt to solve congestion problems using all other reasonable and appropriate
strategies before resorting to capacity expansion.
In TMAs that are designated as non-attainment or maintenance areas for ozone or carbon monoxide federal
regulations require certification that any project resulting in a significant increase in SOV carrying capacity
(with the exception of safety improvements and bottleneck elimination projects) be identified or addressed
through the CMP. In these areas, the CMP must provide an appropriate analysis of reasonable travel demand
reduction and operational management strategies. Figure 4 outlines the process followed by the North
Central Texas Council of Governments (NCTCOG) in justifying the need for SOV projects.
Case Study: Land Use Analysis at the Los Angeles
County Metropolitan Transportation Authority (LACMTA)
The Southern California Association of Governments (SCAG), the
MPO for the Los Angeles area, uses the information from the CMPs
developed by county agencies to develop its regional CMP
documentation. According to the LACMTA CMP:
―The CMP Land Use Analysis Program ensures that local
jurisdictions consider the regional transportation impacts that may
result from major development projects through the local land use
approval process. While cities and the county routinely examine and
mitigate impacts to transportation services and facilities within their
jurisdictions, this commitment often does not extend to the regional
transportation system...
Through local jurisdictions’ existing environmental impact review
process (i.e., the California Environmental Quality Act (CEQA)
process), the Land Use Analysis Program provides jurisdictions with
the opportunity to plan ahead to reduce travel demand and mitigate
regional transportation impacts of new development projects.
Local jurisdictions have the lead authority for determining the
level of project mitigation required and for ensuring that
mitigation measures are reasonably related to the impact.
Within that context, the CEQA process provides local
jurisdictions with the opportunity to incorporate traffic
mitigation measures that are multi-modal, and that encourage
the use of alternative transportation modes.‖
Source: LACMTA, Draft 2010 Congestion Management Program
for Los Angeles County,
http://www.metro.net/projects_studies/cmp/images/Final_Draft_2010.pdf

46 Congestion Management Process: A Guidebook
Additionally, the identified need for additional SOV capacity does not obviate the need for operational and
demand management improvements to address congestion. In TMAs that are designated as non-attainment
or maintenance areas for ozone or carbon monoxide, federal regulations require that in cases where additional
SOV capacity is warranted, the CMP must identify all reasonable strategies to manage the SOV facility safely
and effectively, and identify travel demand reduction and operational management strategies appropriate for
the corridor. At the Delaware Valley Regional Planning Commission (DVRPC), for example, major capacity
adding projects are required to identify supplemental congestion management strategies that will be
implemented in conjunction with the expansion. DVRPC tracks all TIP projects for their compliance with
these requirements, and works with project managers to identify appropriate supplemental strategies.24
One issue that has been noted at some MPOs is that sometimes TIP projects are identified by outside
sources, and are not specifically derived from the MPO‘s long-range plan or CMP. The long-range plan and
CMP must then be revisited and updated (if necessary) to ensure consistency. It is important for the MPO to
have a procedure in place to handle this type of situation when it arises, and to ensure that all TIP projects are
in compliance with the CMP. It is also helpful for MPOs to define ―safety‖ and ―bottleneck‖ projects up-
front so there is less confusion about which projects may be exempt from the requirement for SOV analysis.
24 DVRPC, ―Overview of the CMP,‖ 2009, www.dvrpc.org/CongestionManagement
Case Study: SOV Projects at the Delaware Valley Regional Planning Commission (DVRPC)
The following are two examples of the types of supplemental strategies that DVRPC requires on SOV-
capacity-adding projects:
US 322 Widening
This project will widen US 322 for approximately six miles from US 1 to I-95. The project will consist of
widening the current road from two to four lanes and reconstructing the roadway and shoulders.
Supplemental commitments for these corridor improvements include a Park and Ride lot and transit
stop enhancements. Bike lanes and sidewalks will be included in the design of the project. This
project will also tie in the new traffic signals to Concord Township’s closed-loop system.
I-95/Pennsylvania Turnpike Interchange
This project will provide a direct interchange between I-95 and the Pennsylvania Turnpike (I-276),
widen I-95 from two lanes to three lanes between PA 413 and US 1, and widen the turnpike from two
lanes to three between US 1 and US 13. The project will eliminate two existing toll booth locations and
install a new toll booth immediately west of the new interchange. The new interchange will result in a
revised routing of I-95 in Pennsylvania and New Jersey.
This project will remove significant truck traffic from local roads. Supplemental commitments include a
new Park and Ride lot with freight inspection capacity in the vicinity of the new interchange,
improvements to parking at the Levittown and Croydon R7 train stations, and Express E-Z Pass lanes
at the new toll booth. Additional ITS improvements are included in the project.
Source: DVRPC, 2009 Congestion Management Process Supplemental Projects Status Memorandum
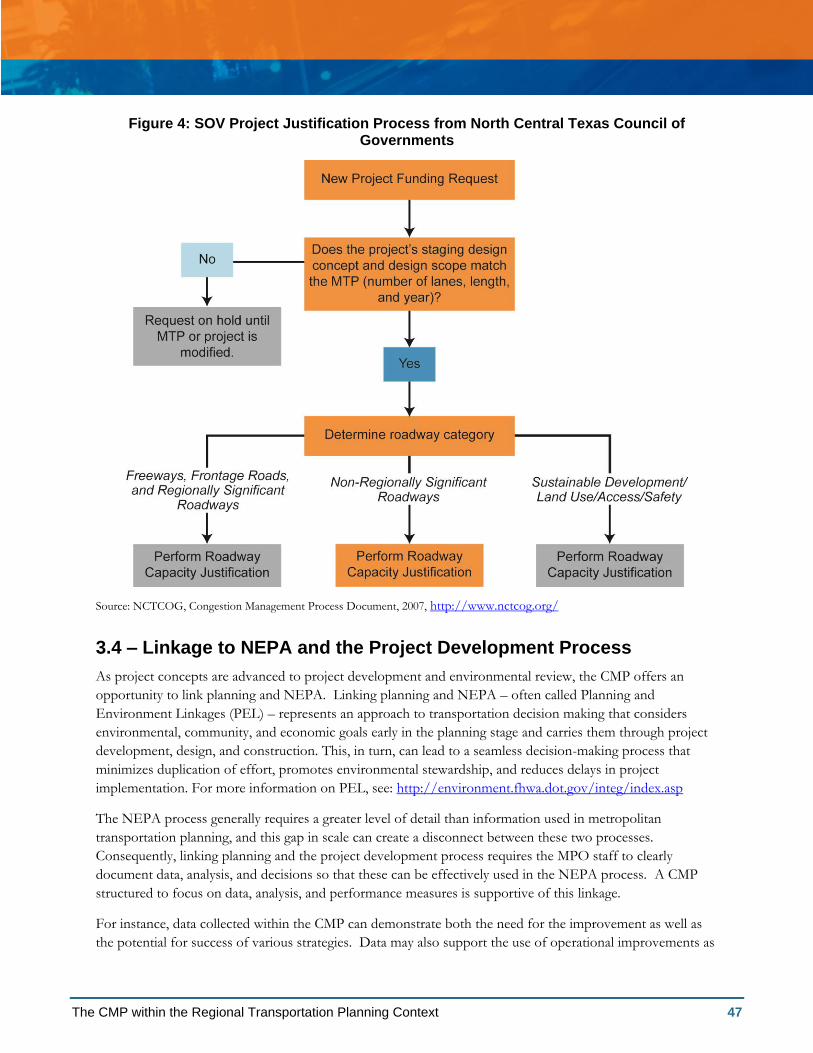
The CMP within the Regional Transportation Planning Context 47
Figure 4: SOV Project Justification Process from North Central Texas Council of Governments
Source: NCTCOG, Congestion Management Process Document, 2007, http://www.nctcog.org/
3.4 – Linkage to NEPA and the Project Development Process
As project concepts are advanced to project development and environmental review, the CMP offers an
opportunity to link planning and NEPA. Linking planning and NEPA – often called Planning and
Environment Linkages (PEL) – represents an approach to transportation decision making that considers
environmental, community, and economic goals early in the planning stage and carries them through project
development, design, and construction. This, in turn, can lead to a seamless decision-making process that
minimizes duplication of effort, promotes environmental stewardship, and reduces delays in project
implementation. For more information on PEL, see: http://environment.fhwa.dot.gov/integ/index.asp
The NEPA process generally requires a greater level of detail than information used in metropolitan
transportation planning, and this gap in scale can create a disconnect between these two processes.
Consequently, linking planning and the project development process requires the MPO staff to clearly
document data, analysis, and decisions so that these can be effectively used in the NEPA process. A CMP
structured to focus on data, analysis, and performance measures is supportive of this linkage.
For instance, data collected within the CMP can demonstrate both the need for the improvement as well as
the potential for success of various strategies. Data may also support the use of operational improvements as

48 Congestion Management Process: A Guidebook
a way to improve the existing facility or to avoid and/or mitigate environmental impacts for capacity-adding
projects. Congestion management strategies used in conjunction with a selected alternative can support the
community‘s preferences, allowing the community to commit to actions that support its preferred alternative.
There are several key ways in which the CMP can inform and streamline the NEPA process. Some uses
include:
Documentation of the need for capacity enhancement as part of the CMP (based on analyses of alternative
strategies) can be used in the project purpose and need.
Project alternatives to be studied in NEPA include congestion management strategies to support efficient
use of facility capacity
Collection of before and after data for implemented improvement projects supports use of congestion
management strategies within future projects.
In several regions, the CMP has been used to support definition of a project‘s purpose and need and
identification of alternatives within NEPA studies. For example:
As part of the CMP, the Regional Planning Commission of Greater Birmingham in Alabama identified
portions of I-65/US 31 as congested and in need of improvement. In turn, the NEPA documentation for
improvements to that corridor relied upon and cited the CMP data to explain the need for corridor
improvements.25
Metro in Los Angeles relied upon system performance monitoring data collected through its CMP to
define freeway conditions and needs along the study corridor for the Eastside extension of the Gold Line
light rail.26
Green Bay MPO in Wisconsin used CMP-identified strategies for both transportation demand
management (TDM) and transportation system management (TSM) as initial alternatives for
transportation improvements in the southern portion of the region. Analysis indicated, however, that
TDM and TSM alone would not be enough to meet future needs and therefore TDM and TSM strategies
needed to be accompanied by additional capacity.27
While there historically has been a gap between planning and NEPA, some MPOs have tried to make an
explicit connection between the CMP and NEPA. For instance, the North Central Texas Council of
Governments (NCTCOG) in the Dallas-Fort Worth metro area, notes in its CMP documentation that once
the lead agency has completed a draft corridor/NEPA study and has endorsed its recommendations, the
NCTCOG‘s Regional Transportation Council must endorse the recommendations, including CMP strategies.
The recommendations of the corridor/NEPA study must be the same as the recommendations in the MTP
for the subject corridor, and if differences exist and the RTC endorses the results of the study, the MTP is
modified to reflect the results. Moreover, operations and travel demand reduction strategies identified in the
corridor/NEPA study are seen as commitments at the program and project levels. Program-level
commitments are inventoried in the CMP, included in the MTP, and future resources are designated for their
25 Regional Planning Commission of Greater Birmingham, ―Mobility Matters Project: Purpose and Need, Draft,‖ November 2008, http://www.i65-us31mobilitymatters.com/
26 Metro, ―Los Angeles Eastside Corridor Final SEIS/SEIR: Purpose and Need,‖ 2002, http://www.metro.net/projects/eastside/
27 Brown County Planning Commission, ―Environmental Impact Statement for Transportation Improvements in the Southern Portion of the Green Bay Metropolitan Area: Alternatives Identification, Retention, and Elimination Report, Draft,‖ February 2010, http://www.co.brown.wi.us/ - The Green Bay MPO CMP is still in draft form and has not yet been adopted by the MPO’s policy board. The MPO is not currently a TMA, but has developed a CMP in anticipation of potentially being designated in the near future.
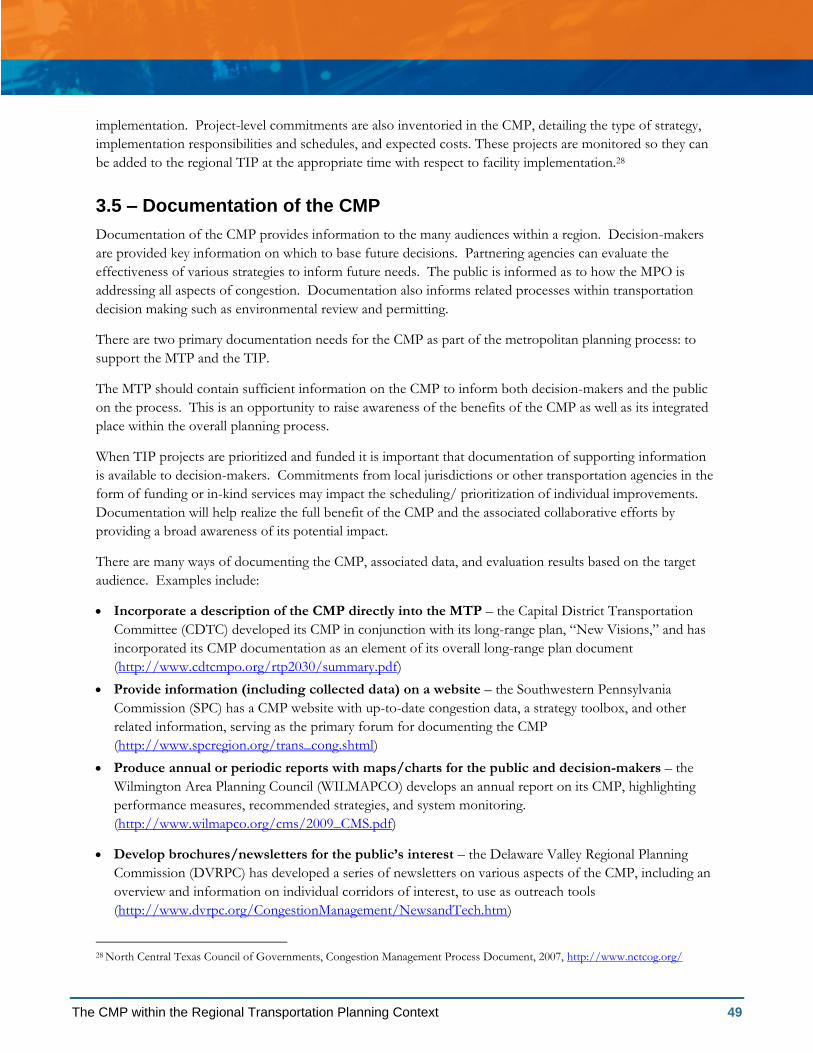
The CMP within the Regional Transportation Planning Context 49
implementation. Project-level commitments are also inventoried in the CMP, detailing the type of strategy,
implementation responsibilities and schedules, and expected costs. These projects are monitored so they can
be added to the regional TIP at the appropriate time with respect to facility implementation.28
3.5 – Documentation of the CMP
Documentation of the CMP provides information to the many audiences within a region. Decision-makers
are provided key information on which to base future decisions. Partnering agencies can evaluate the
effectiveness of various strategies to inform future needs. The public is informed as to how the MPO is
addressing all aspects of congestion. Documentation also informs related processes within transportation
decision making such as environmental review and permitting.
There are two primary documentation needs for the CMP as part of the metropolitan planning process: to
support the MTP and the TIP.
The MTP should contain sufficient information on the CMP to inform both decision-makers and the public
on the process. This is an opportunity to raise awareness of the benefits of the CMP as well as its integrated
place within the overall planning process.
When TIP projects are prioritized and funded it is important that documentation of supporting information
is available to decision-makers. Commitments from local jurisdictions or other transportation agencies in the
form of funding or in-kind services may impact the scheduling/ prioritization of individual improvements.
Documentation will help realize the full benefit of the CMP and the associated collaborative efforts by
providing a broad awareness of its potential impact.
There are many ways of documenting the CMP, associated data, and evaluation results based on the target
audience. Examples include:
Incorporate a description of the CMP directly into the MTP – the Capital District Transportation
Committee (CDTC) developed its CMP in conjunction with its long-range plan, ―New Visions,‖ and has
incorporated its CMP documentation as an element of its overall long-range plan document
(http://www.cdtcmpo.org/rtp2030/summary.pdf)
Provide information (including collected data) on a website – the Southwestern Pennsylvania
Commission (SPC) has a CMP website with up-to-date congestion data, a strategy toolbox, and other
related information, serving as the primary forum for documenting the CMP
(http://www.spcregion.org/trans_cong.shtml)
Produce annual or periodic reports with maps/charts for the public and decision-makers – the
Wilmington Area Planning Council (WILMAPCO) develops an annual report on its CMP, highlighting
performance measures, recommended strategies, and system monitoring.
(http://www.wilmapco.org/cms/2009_CMS.pdf)
Develop brochures/newsletters for the public’s interest – the Delaware Valley Regional Planning
Commission (DVRPC) has developed a series of newsletters on various aspects of the CMP, including an
overview and information on individual corridors of interest, to use as outreach tools
(http://www.dvrpc.org/CongestionManagement/NewsandTech.htm)
28 North Central Texas Council of Governments, Congestion Management Process Document, 2007, http://www.nctcog.org/

50 Congestion Management Process: A Guidebook
Develop detailed technical reports and guidebooks on congestion management for use within the
MPO and with partnering agencies – the Atlanta Regional Commission (ARC) has recently gone
through a process of updating its CMP process and has developed extensive technical documentation on
this decision-making process (http://www.atlantaregional.com/transportation/roads--
highways/congestion-management-process/congestion-management-process)
4–Using Visualization as a Communication and Analysis Tool The use of visualizations to display information about congestion of transportation systems is evolving, and
may occur both within and outside of the CMP. Applications of the visualization techniques to CMPs can
lead to: (a) an improved understanding by transportation planning staffs preparing the CMPs, (b) more
informed decision making by appointed and elected officials, (c) the implementation of more effective
congestion management solutions, and (d) greater acceptance and appreciation by the general public and
interested stakeholders.
4.1 – The Role of Visualizations in the CMP
Clear, concise visuals—such as annotated maps, graphs, photographs, illustrations, and videos—can often
communicate important information more effectively than through statistics and numerical tables.
Consequently, visualization can be a very effective tool for presenting transportation performance data and
information in ways that can be understood and absorbed by various audiences, including technical staff,
transportation decision-makers, and the general public.
Visualization serves three essential functions within an MPO‘s CMP, from the information gathering that
occurs at the beginning of the process to the dissemination of information at the end. Visualization:
Facilitates analysis of congestion problems by technical staff through the visual examination of data from
various sources for pertinent information about congestion, such as location, extent, time and duration,
variability, and intensity, as well as causality, and through organization of congestion-related data as maps,
graphs, and charts;
Enables the professional staff involved in the CMP to more effectively discuss congestion problems and
develop solutions with a mutual and more informed understanding of the congested conditions
throughout the region; and
Provides a means to effectively communicate information to decision-makers and the public about the
status of congestion and the need for congestion management strategies in the metropolitan area.
Visualizations, especially maps, can also serve as valuable tools in organizing data and making it easier to
analyze on a technical level. Since much of the data collected for the CMP is geographically-based (tied either
to an area, corridor, or spot location), mapping—whether on paper, through a GIS program, or through an
online mapping service—is especially important for practitioners, both within an MPO and at partner
agencies outside the MPO, to better understand the geographic patterns in the data. Graphs and

The Role of Visualizations in the CMP 51
photographs can also be effective tools in helping practitioners analyze and apply the large volumes of data
that are often collected or gathered as part of a CMP effort.
These display maps of technical data can also be an effective tool for reaching the general public, if they are
kept relatively simple and easy to read. While these materials are generally broad in scope, they often include
visuals such as maps of congested locations or bar graphs of changes in transportation system use over time
that are intended to convey a simple message about congestion in the area, which can then help people
understand the issue as it relates to other parts of the planning process. For example, an MPO may use a
visualization developed as part of its CMP to illustrate a point in its MTP.
4.2 – Data Used in Visualizations
Visualizations are tools that summarize an extensive amount of data into a more easily-comprehensible set of
information displays that allow viewers to quickly assess and interpret the information. This data can come
from multiple sources and may be tied to the performance measures developed in Action 3. Data may be
directly collected by the MPO utilizing in-house staff and resources or temporary personnel, or through
consultants. Data may also be gathered by the MPO from external sources that collect data for a different
main purpose, such as archived ITS data from traffic flow detectors used by transportation operations
organizations. In creating visualizations, there is a distinction between the observed data that some MPOs
use and simulated or forecasted information. When the CMP is dealing with future scenarios, modeling of
information is necessary. When dealing with existing or past conditions, the observed data is often more
accepted by decision-makers.
Visualization can be an effective tool for organizing, interpreting, and using large volumes of data and
information, and for presenting the most pertinent information to the public. Data activities take many
forms, ranging from the manual collection of speed data through travel-time runs to the gathering of vast
data repositories available through Intelligent Transportation System (ITS) and Advanced Transportation
Management System (ATMS) activities. In many cases, data is gathered from existing data sources at partner
agencies, such as crash databases from the state police or state DOT. Ultimately, visualizations are an
illustration of data collected and presented in a format that allows the observer to more rapidly respond to an
image than would be possible when simply looking at raw data.
4.3 – Visualization Methods Used in CMP Activities
A wide range of different types of visuals can be used as part of the CMP. Several examples are noted in this
section.
Displays of Measured Congestion based on Observed Data
These are maps of current data collected in the CMP monitoring process. Examples include:
Schematic maps of freeway level of service, representing the level of service of a system through aerial
photographic data converted to abstract graphic symbols;
Roadway segments showing levels of congestion using color-coded segments based on ranges of average
link speed;
Travel speed contour displays of average directional speed by location.
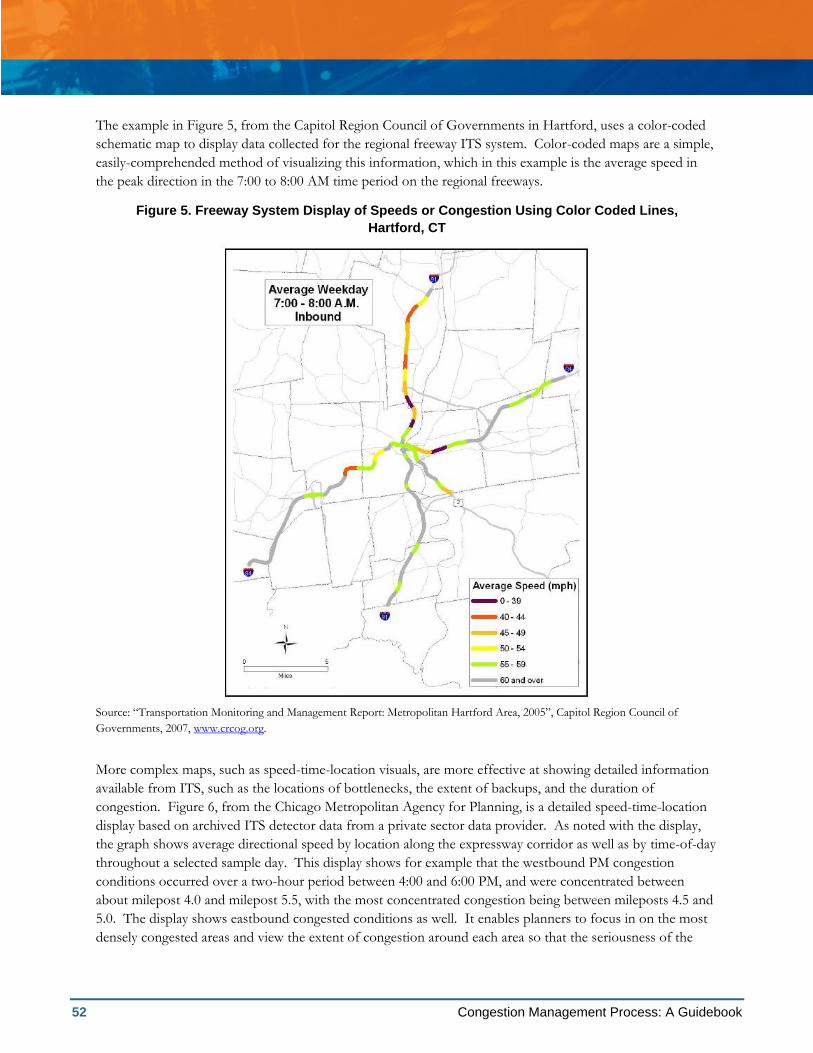
52 Congestion Management Process: A Guidebook
The example in Figure 5, from the Capitol Region Council of Governments in Hartford, uses a color-coded
schematic map to display data collected for the regional freeway ITS system. Color-coded maps are a simple,
easily-comprehended method of visualizing this information, which in this example is the average speed in
the peak direction in the 7:00 to 8:00 AM time period on the regional freeways.
Figure 5. Freeway System Display of Speeds or Congestion Using Color Coded Lines,
Hartford, CT
Source: ―Transportation Monitoring and Management Report: Metropolitan Hartford Area, 2005‖, Capitol Region Council of
Governments, 2007, www.crcog.org.
More complex maps, such as speed-time-location visuals, are more effective at showing detailed information
available from ITS, such as the locations of bottlenecks, the extent of backups, and the duration of
congestion. Figure 6, from the Chicago Metropolitan Agency for Planning, is a detailed speed-time-location
display based on archived ITS detector data from a private sector data provider. As noted with the display,
the graph shows average directional speed by location along the expressway corridor as well as by time-of-day
throughout a selected sample day. This display shows for example that the westbound PM congestion
conditions occurred over a two-hour period between 4:00 and 6:00 PM, and were concentrated between
about milepost 4.0 and milepost 5.5, with the most concentrated congestion being between mileposts 4.5 and
5.0. The display shows eastbound congested conditions as well. It enables planners to focus in on the most
densely congested areas and view the extent of congestion around each area so that the seriousness of the

The Role of Visualizations in the CMP 53
congestion in terms of delay can be assessed, and to communicate this complex information to the public in
an understandable way.
Figure 6. Congestion Display Showing Speeds by Location and Time of Day for a Roadway,
Chicago
Source: Chicago Metropolitan Agency for Planning CMP Performance Measurement Website (2009 data),
http://www.cmap.illinois.gov/cmp/measurement.aspx
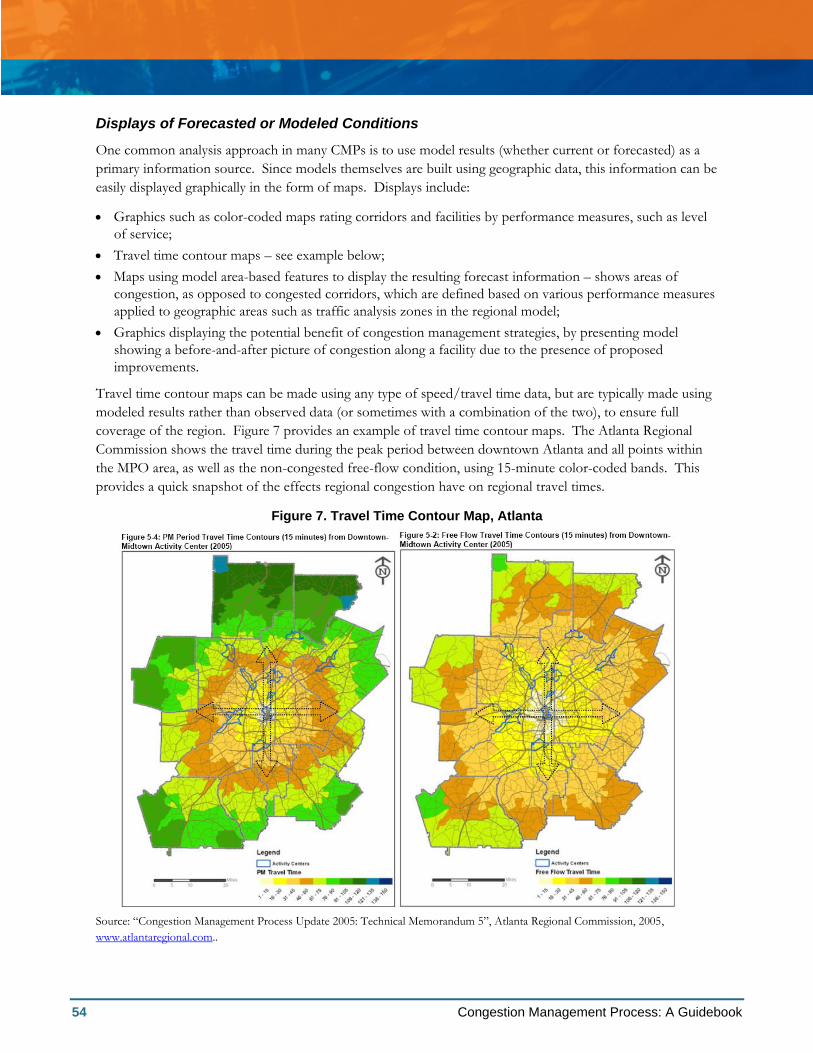
54 Congestion Management Process: A Guidebook
Displays of Forecasted or Modeled Conditions
One common analysis approach in many CMPs is to use model results (whether current or forecasted) as a
primary information source. Since models themselves are built using geographic data, this information can be
easily displayed graphically in the form of maps. Displays include:
Graphics such as color-coded maps rating corridors and facilities by performance measures, such as level
of service;
Travel time contour maps – see example below;
Maps using model area-based features to display the resulting forecast information – shows areas of
congestion, as opposed to congested corridors, which are defined based on various performance measures
applied to geographic areas such as traffic analysis zones in the regional model;
Graphics displaying the potential benefit of congestion management strategies, by presenting model
showing a before-and-after picture of congestion along a facility due to the presence of proposed
improvements.
Travel time contour maps can be made using any type of speed/travel time data, but are typically made using
modeled results rather than observed data (or sometimes with a combination of the two), to ensure full
coverage of the region. Figure 7 provides an example of travel time contour maps. The Atlanta Regional
Commission shows the travel time during the peak period between downtown Atlanta and all points within
the MPO area, as well as the non-congested free-flow condition, using 15-minute color-coded bands. This
provides a quick snapshot of the effects regional congestion have on regional travel times.
Figure 7. Travel Time Contour Map, Atlanta
Source: ―Congestion Management Process Update 2005: Technical Memorandum 5‖, Atlanta Regional Commission, 2005,
www.atlantaregional.com..

The Role of Visualizations in the CMP 55
Displays of Congestion Trends Observed over Time
The ongoing data collection that occurs as a result of the CMP can also be a source of information on
congestion trends over time. Several MPOs have developed methods of displaying this trend data on maps,
which can be useful tools in determining whether implemented CMP strategies are effective at addressing
congestion concerns in certain corridors. Common approaches include:
Results displayed for several years side by side on the map – see Figure 8;
Relative change in results displayed between two time periods (e.g., increase in travel speed, decrease in
speed, no change) – compares data from two time periods in order to show travel segments with increases
or decreases in travel speed.
The North Central Texas Council of Governments (NCTCOG) displays results of traffic condition trends
over several years side-by-side. It shows the average temporal variability within each year, the spatial
variability along the roadway corridor, as well as the year-to-year trends of both. In addition to the year-to-
year temporal variability, this type of visual can be used to show the temporal variability within the hours of a
typical weekday, by day of the week, month of the year, or by season. Each of these may be of different
interest to the general public, planning staff, and decision-makers. This provides detailed information useful
for tracking change over time, and can be a helpful tool in determining whether implemented CMP strategies
are effective at addressing congestion concerns in certain corridors.
Figure 8. Display of Measured Congestion Levels over Time, Dallas
Source: ―2007 Traffic Conditions in the Dallas-Fort Worth Metropolitan Area‖, North Central Texas Council of Governments, 2007,
www.nctcog.org.
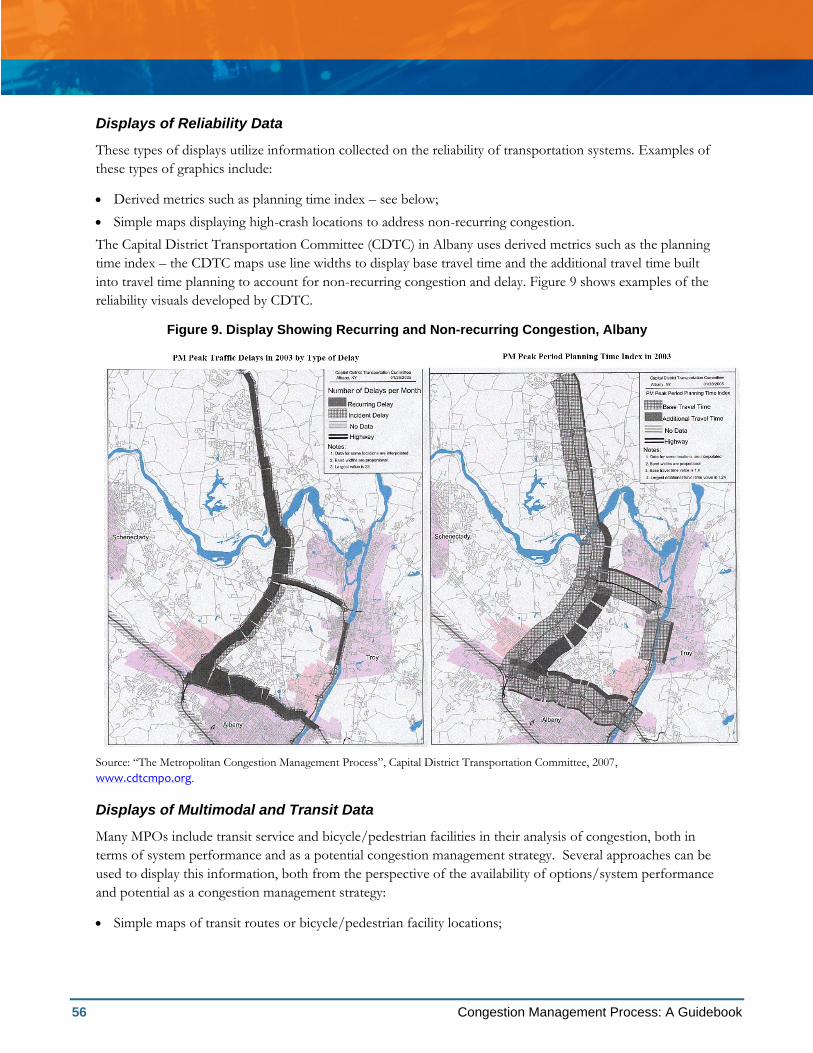
56 Congestion Management Process: A Guidebook
Displays of Reliability Data
These types of displays utilize information collected on the reliability of transportation systems. Examples of
these types of graphics include:
Derived metrics such as planning time index – see below;
Simple maps displaying high-crash locations to address non-recurring congestion.
The Capital District Transportation Committee (CDTC) in Albany uses derived metrics such as the planning
time index – the CDTC maps use line widths to display base travel time and the additional travel time built
into travel time planning to account for non-recurring congestion and delay. Figure 9 shows examples of the
reliability visuals developed by CDTC.
Figure 9. Display Showing Recurring and Non-recurring Congestion, Albany
Source: ―The Metropolitan Congestion Management Process‖, Capital District Transportation Committee, 2007,
www.cdtcmpo.org.
Displays of Multimodal and Transit Data
Many MPOs include transit service and bicycle/pedestrian facilities in their analysis of congestion, both in
terms of system performance and as a potential congestion management strategy. Several approaches can be
used to display this information, both from the perspective of the availability of options/system performance
and potential as a congestion management strategy:
Simple maps of transit routes or bicycle/pedestrian facility locations;
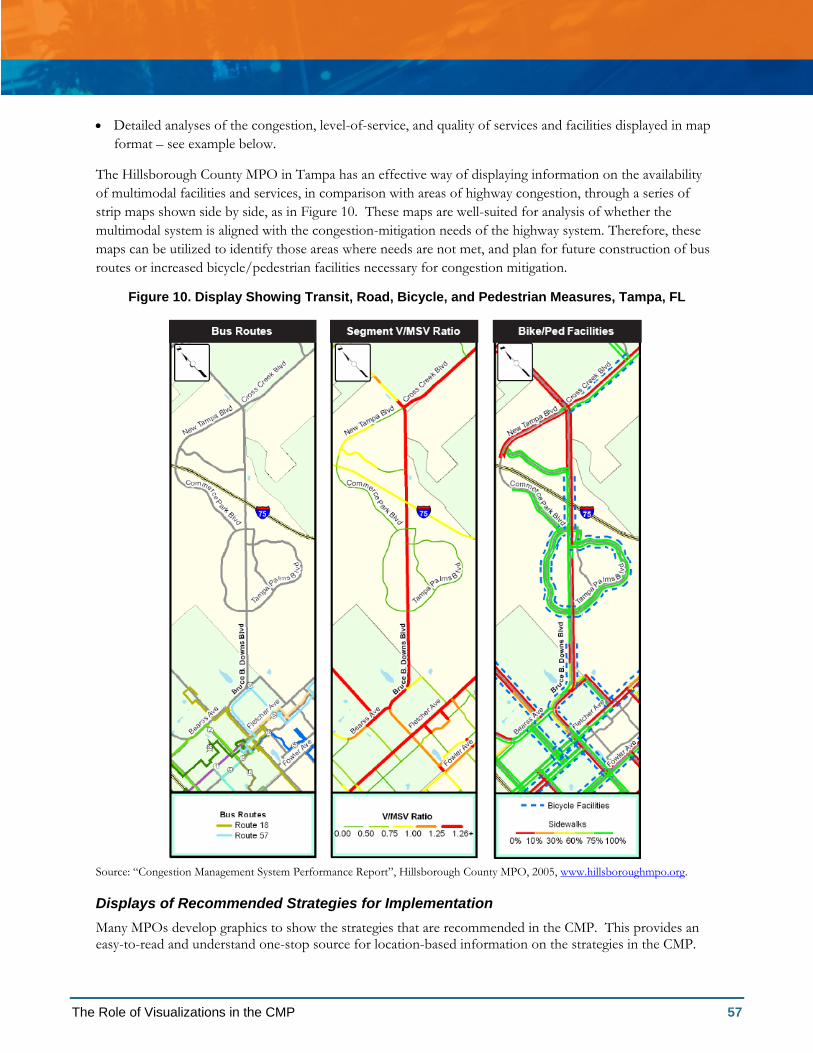
The Role of Visualizations in the CMP 57
Detailed analyses of the congestion, level-of-service, and quality of services and facilities displayed in map
format – see example below.
The Hillsborough County MPO in Tampa has an effective way of displaying information on the availability
of multimodal facilities and services, in comparison with areas of highway congestion, through a series of
strip maps shown side by side, as in Figure 10. These maps are well-suited for analysis of whether the
multimodal system is aligned with the congestion-mitigation needs of the highway system. Therefore, these
maps can be utilized to identify those areas where needs are not met, and plan for future construction of bus
routes or increased bicycle/pedestrian facilities necessary for congestion mitigation.
Figure 10. Display Showing Transit, Road, Bicycle, and Pedestrian Measures, Tampa, FL
Source: ―Congestion Management System Performance Report‖, Hillsborough County MPO, 2005, www.hillsboroughmpo.org.
Displays of Recommended Strategies for Implementation
Many MPOs develop graphics to show the strategies that are recommended in the CMP. This provides an easy-to-read and understand one-stop source for location-based information on the strategies in the CMP.
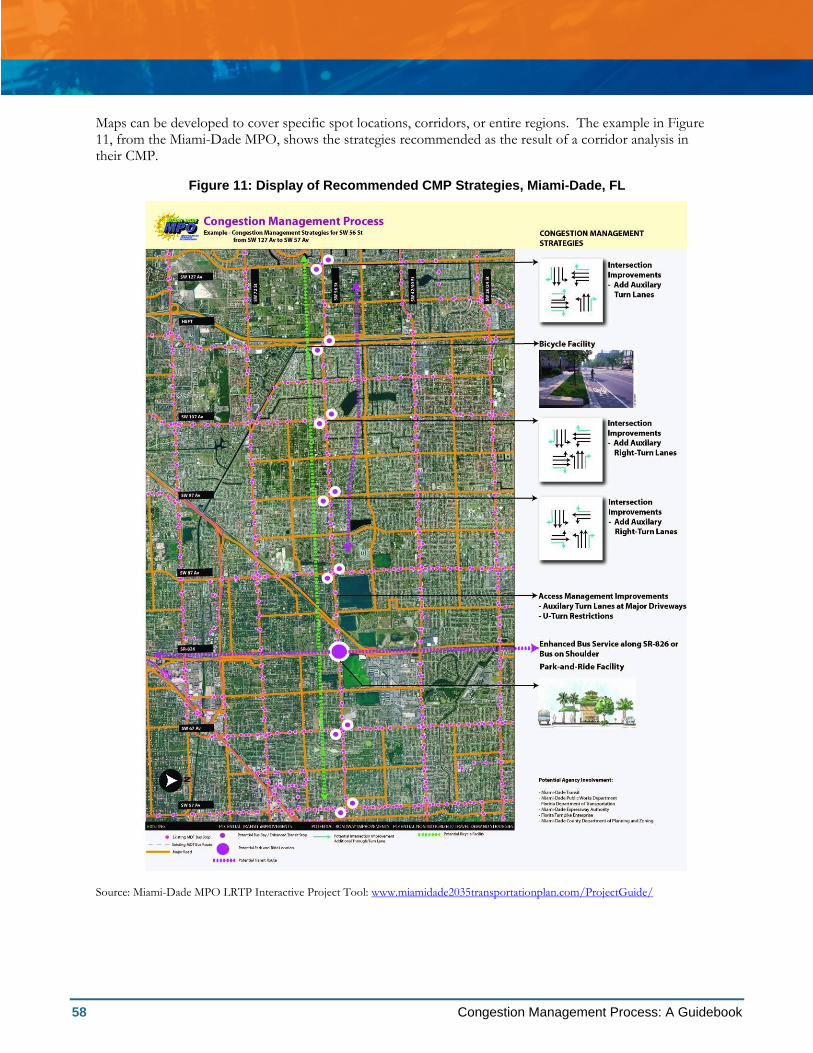
58 Congestion Management Process: A Guidebook
Maps can be developed to cover specific spot locations, corridors, or entire regions. The example in Figure 11, from the Miami-Dade MPO, shows the strategies recommended as the result of a corridor analysis in their CMP.
Figure 11: Display of Recommended CMP Strategies, Miami-Dade, FL
Source: Miami-Dade MPO LRTP Interactive Project Tool: www.miamidade2035transportationplan.com/ProjectGuide/

The Role of Visualizations in the CMP 59
Charts, Graphs, and Tables
Charts, graphs, and tables are a clear, easy to understand way of visualizing data and analysis results.
Examples include:
Tables to show relative levels of congestion on several transit lines over a certain time period – see
example below;
Bar graphs showing delay data for a corridor;
Line graphs showing variability in speeds.
Figure 12, from the Washington Metropolitan Area Transit Authority, used in the National Capital Region
Transportation Planning Board‘s CMP, clearly shows the relative levels of congestion on several transit lines
in an easy-to-understand manner. It alerts the public to future capacity problems along certain lines, and can
be used to help show policy makers the need for more funding or management and operations strategies for
the Metrorail system to meet the needs of its ridership growth.
Figure 12. Display of Transit Congestion Using Simple Color Coding, Washington, DC
Source: MWCOG CLRP Website, http://www.mwcog.org/clrp/performance/congestion.asp
Use of Visuals to Differentiate among CMP Strategy Options
Beyond using visualizations to convey data, several MPOs use photo-simulation and other visual tools to conceptually convey the ideas presented as potential CMP strategies. The Capital District Transportation Committee (CDTC), the MPO for the Albany area, uses photographs and photo-simulations to show the public what different CMP strategies would look like on the ground, as shown in Figure 13. The visuals below show an existing corridor in the Albany area (top) and an example of what this corridor could look like with improvements to the bicycle and pedestrian infrastructure (bottom). The MPO uses these visuals to help the public understand differences between strategies outlined in the CMP.

60 Congestion Management Process: A Guidebook
Figure 13. Photo Simulation of Potential Strategy Implementation, Albany, NY
After
Before
Source: Capital District Transportation Committee, www.cdtcmpo.org
Use of Video or Animation
Multimedia displays can appeal to audiences by providing dynamic information. Examples include:
Dynamic displays of color-coded traffic congestion maps over time (by hour of day, or by year), showing
changes in traffic congestion levels
A paired video showing traffic conditions before and after implementation of CMP strategies to allow
stakeholders to ―drive‖ through the project corridor and experience the travel time improvement – see
below.
The video in Figure 14, from Evans City in the Southwestern Pennsylvania Commission (SPC), demonstrates
the result of SPC‘s regional traffic signal program, which is an outgrowth of its CMP. It utilizes an appealing
visualization to make the results of the program more tangible and real, allowing drivers to see exactly how
change will affect them. The display shows traffic conditions before and after the implementation of several
CMP strategies at this location, and highlights the vast improvement in travel time through the corridor (as
both videos are played simultaneously). On one side of the screen, the viewer can see that after signal re-
timing, the driver is able to travel the roadway in 3 minutes and 1 second, while before signal re-timing it took
6 minutes, 10 seconds.

The Role of Visualizations in the CMP 61
Figure 14. Video Demonstrating Result of Strategy Implementation, Pittsburgh, PA
Source: SPC Transportation website: http://www.spcregion.org/trans_ops_traff.shtml
4.4 – Lessons Learned on Effective Visualization
The primary lesson learned with regard to visualization of the CMP is that visualizations intended for public
consumption must be easy to understand, and must clearly convey their intended message. While graphics
should not be littered with superfluous information, and should not attempt to show too much information
all at once, too simplistic representations of the data may skip over or trivialize important interrelationships
that need to be better understood to effectively select and gain support for implementing a particular
congestion management strategy.
Some visualization methods can be costly to perform due to intensive labor needs, specialized skills or
training, expensive technology, or the amount/type of data required. However, visualizations do not need to
be expensive to be effective – many of the methods above could be developed relatively simply, using either
in-house staff or hired consultants. The type(s) of visualization used in the CMP will vary based on the type
of information being displayed, the intended audience, and the resources available.
It is sometimes difficult to overcome the perception of visualization as a frill that is not a necessary part of
the CMP process. However, visualization plays a major role in organizing the spatial and temporal data
collected as part of the CMP and in communicating the results of the CMP analysis to the public and elected
officials. The primary goal of the CMP is for the congestion analysis to be a major factor in the development
of long-range plans and short-range funding plans developed by MPOs, and to influence the selection of
projects that are included in these plans. For this to happen, it is vital for the congestion data collected and
analyzed through the CMP to be distributed in a format that can exert that influence on the rest of the MPO
planning process. Visualization is a very effective way of doing this.

62 Congestion Management Process: A Guidebook
5–Conclusion The Congestion Management Process serves an essential purpose within the overall transportation planning
and programming process by enabling decision-makers at MPOs, local governments, and state agencies to
base their decisions on a clear analytical understanding of congestion in a region. The CMP is a critical
element of an objectives-driven, performance-based planning approach, and the integration of the CMP data,
objectives, and outcomes with the MTP and TIP allows these to become an integral part of project decision
making. Consequently, the issues analyzed as part of the CMP should be reflective of the broad objectives of
the MPO, including livability.
The CMP regulations and guidelines allow considerable flexibility in how individual MPOs can choose to
implement their processes. This has allowed MPOs to tailor their CMPs in various ways to both reflect
regional needs and priorities and acknowledge time and budget constraints. This guidebook outlines eight
actions that are considered to be at the core of the CMP process. There are many different ways in which
individual MPOs choose to implement these actions, and each MPO may not consider each action to be a
discrete step in its process, but each action serves an important role and must be addressed in the CMP in
some way. The eight actions are:
1. Develop Regional Objectives for Congestion Management – What is the desired outcome? Objectives
should be developed in coordination with the long-range plan, and should guide the decisions made
throughout the CMP and the broader MPO planning process.
2. Define CMP Network – What components of the transportation system are the focus? This step defines the
geographic area to be covered by the CMP, as well as the transportation facilities that will be analyzed,
including transit, bicycle, pedestrian, and freight facilities.
3. Develop Multimodal Performance Measures – How do we define and measure congestion? The
performance measures selected for use in the CMP should address the congestion management
objectives identified above, addressing a wide variety of congestion-related issues.
4. Collect Data/Monitor System Performance – How does the transportation system perform? Collecting data
to assess system performance is typically the most resource-intensive element of the CMP process.
5. Analyze Congestion Problems and Needs – What congestion problems are present in the region, or are
anticipated? What are the sources of unacceptable congestion? Before congestion management strategies can be
identified, it is necessary to analyze the collected data with regard to the performance measures and
identify the congestion problems that are present in the region.
6. Identify and Assess Strategies – What strategies are appropriate to mitigate congestion? A wide variety of
strategies, including demand management, operational improvements, and multimodal facilities/services,
should be examined and identified to address congestion.
7. Program and Implement Strategies – How and when will solutions be implemented? CMP strategies are
typically implemented through the MTP and TIP processes, and CMP performance measures are often
used as a tool for project prioritization.
8. Evaluate Strategy Effectiveness – What have we learned about implemented strategies? Evaluation allows the
MPO to understand how well its CMP strategies are working, whether further improvements are needed,
and whether the strategies should be implemented elsewhere in the region.

Conclusion 63
MPOs around the country have each developed unique methods of implementing the CMP. Some have
integrated the CMP with the long-range planning process to the extent that the CMP is not identifiable as a
standalone process. Some have aligned the CMP closely with the TIP, with CMP performance measures
directly influencing project prioritization and funding. Some MPOs have developed CMP objectives and
performance measures that are closely tied with issues of livability and quality of life, while others focus more
on traditional congestion measures. Some MPOs develop extensive written documentation, while some
others maintain online data and information resources. All of these processes, developed with individual
needs and resources in mind, represent appropriate examples of CMP process development.
64 Congestion Management Process: A Guidebook
Appendix A – Legislative Language
SAFETEA-LU modified Title 23, Section 134 of the U.S. Code to include the following (corresponding
changes were made to Title 49, the Public Transportation portion of the Code, under Section 5303):
(k) TRANSPORTATION MANAGEMENT AREAS (TMA).
(1) IDENTIFICATION AND DESIGNATION.
(A) REQUIRED IDENTIFICATION. – The Secretary shall identify as a transportation management area
each urbanized area (as defined by the Bureau of the Census) with a population of over 200,000 individuals.
(B) DESIGNATIONS ON REQUEST. – The Secretary shall designate any additional area as a
transportation management area on the request of the Governor and the metropolitan planning organization
designated for the area.
(2) TRANSPORTATION PLANS. – In a metropolitan planning area serving a transportation management
area, transportation plans shall be based on a continuing and comprehensive transportation planning process
carried out by the metropolitan planning organization in cooperation with the State and public transportation
operators.
(3) CONGESTION MANAGEMENT PROCESS. – Within a metropolitan planning area serving a
transportation management area, the transportation planning process under this section shall address
congestion management through a process that provides for effective management and operation, based on a
cooperatively developed and implemented metropolitan-wide strategy, of new and existing transportation
facilities eligible for funding under this chapter and chapter 53 of title 49 through the use of travel demand
reduction and operational management strategies. The Secretary shall establish an appropriate phase-in
schedule for compliance with the requirements of this section but no sooner than one year after the
identification of a transportation management area....
(m) ADDITIONAL REQUIREMENTS FOR CERTAIN NONATTAINMENT AREAS.
(1) IN GENERAL. – Notwithstanding any other provisions of this chapter or Chapter 53 of Title 49, for
transportation management areas classified as nonattainment for ozone or carbon monoxide pursuant to the
Clean Air Act, Federal funds may not be advanced in such area for any highway project that will result in a
significant increase in the carrying capacity for single-occupant vehicles unless the project is addressed
through a congestion management process.
(2) APPLICABILITY. – This subsection applies to a nonattainment area within the metropolitan planning
area boundaries determined under subsection (e).
In addition, under the Statewide Planning Requirements, SAFETEA-LU added the following language to
Title 23, Section 135 (and Title 49, Section 5304):
(i) TREATMENT OF CERTAIN STATE LAWS AS CONGESTION MANAGEMENT PROCESSES. –
For purposes of this section and Section 134, and Sections 5303 and 5304 of Title 49, State laws, rules, or
regulations pertaining to congestion management systems or programs may constitute the congestion
management process under this section and Section 134, and Sections 5303 and 5304 of Title 49, if the
Secretary finds that the state laws, rules, or regulations are consistent with, and fulfill the intent of, the
purposes of this section, Section 134, and Sections 5303 and 5304 of Title 49, as appropriate.‖
Appendix B – Regulation 65
Appendix B – Regulation
Below is language from the Statewide Transportation Planning; Metropolitan Transportation Planning; Final
Rule, February 14, 2007, Federal Register:
Title 23 Sec. 450.320 Congestion management process in transportation management areas.
(a) The transportation planning process in a TMA shall address congestion management through a process
that provides for safe and effective integrated management and operation of the multimodal transportation
system, based on a cooperatively developed and implemented metropolitan-wide strategy, of new and existing
transportation facilities eligible for funding under title 23 U.S.C. and title 49 U.S.C. Chapter 53 through the
use of travel demand reduction and operational management strategies.
(b) The development of a congestion management process should result in multimodal system
performance measures and strategies that can be reflected in the metropolitan transportation plan and the
TIP. The level of system performance deemed acceptable by State and local transportation officials may vary
by type of transportation facility, geographic location (metropolitan area or subarea), and/or time of day. In
addition, consideration should be given to strategies that manage demand, reduce single occupant vehicle
(SOV) travel, and improve transportation system management and operations. Where the addition of general
purpose lanes is determined to be an appropriate congestion management strategy, explicit consideration is to
be given to the incorporation of appropriate features into the SOV project to facilitate future demand
management strategies and operational improvements that will maintain the functional integrity and safety of
those lanes.
(c) The congestion management process shall be developed, established, and implemented as part of the
metropolitan transportation planning process that includes coordination with transportation system
management and operations activities. The congestion management process shall include:
(1) Methods to monitor and evaluate the performance of the multimodal transportation system, identify
the causes of recurring and non-recurring congestion, identify and evaluate alternative strategies, provide
information supporting the implementation of actions, and evaluate the effectiveness of implemented actions;
(2) Definition of congestion management objectives and appropriate performance measures to assess the
extent of congestion and support the evaluation of the effectiveness of congestion reduction and mobility
enhancement strategies for the movement of people and goods. Since levels of acceptable system
performance may vary among local communities, performance measures should be tailored to the specific
needs of the area and established cooperatively by the State(s), affected MPO(s), and local officials in
consultation with the operators of major modes of transportation in the coverage area;
(3) Establishment of a coordinated program for data collection and system performance monitoring to
define the extent and duration of congestion, to contribute in determining the causes of congestion, and
evaluate the efficiency and effectiveness of implemented actions. To the extent possible, this data collection
program should be coordinated with existing data sources (including archived operational/ITS data) and
coordinated with operations managers in the metropolitan area;

66 Congestion Management Process: A Guidebook
(4) Identification and evaluation of the anticipated performance and expected benefits of appropriate
congestion management strategies that will contribute to the more effective use and improved safety of
existing and future transportation systems based on the established performance measures. The following
categories of strategies, or combinations of strategies, are some examples of what should be appropriately
considered for each area:
(i) Demand management measures, including growth management and congestion pricing;
(ii) Traffic operational improvements;
(iii) Public transportation improvements;
(iv) ITS technologies as related to the regional ITS architecture; and
(v) Where necessary, additional system capacity;
(5) Identification of an implementation schedule, implementation responsibilities, and possible funding
sources for each strategy (or combination of strategies) proposed for implementation; and
(6) Implementation of a process for periodic assessment of the effectiveness of implemented strategies, in
terms of the area's established performance measures. The results of this evaluation shall be provided to
decisionmakers and the public to provide guidance on selection of effective strategies for future
implementation.
(d) In a TMA designated as nonattainment area for ozone or carbon monoxide pursuant to the Clean Air
Act, Federal funds may not be programmed for any project that will result in a significant increase in the
carrying capacity for SOVs (i.e., a new general purpose highway on a new location or adding general purpose
lanes, with the exception of safety improvements or the elimination of bottlenecks), unless the project is
addressed through a congestion management process meeting the requirements of this section.
(e) In TMAs designated as nonattainment for ozone or carbon monoxide, the congestion management
process shall provide an appropriate analysis of reasonable (including multimodal) travel demand reduction
and operational management strategies for the corridor in which a project that will result in a significant
increase in capacity for SOVs (as described in paragraph (d) of this section) is proposed to be advanced with
Federal funds. If the analysis demonstrates that travel demand reduction and operational management
strategies cannot fully satisfy the need for additional capacity in the corridor and additional SOV capacity is
warranted, then the congestion management process shall identify all reasonable strategies to manage the
SOV facility safely and effectively (or to facilitate its management in the future). Other travel demand
reduction and operational management strategies appropriate for the corridor, but not appropriate for
incorporation into the SOV facility itself, shall also be identified through the congestion management process.
All identified reasonable travel demand reduction and operational management strategies shall be
incorporated into the SOV project or committed to by the State and MPO for implementation.
(f) State laws, rules, or regulations pertaining to congestion management systems or programs may
constitute the congestion management process, if the FHWA and the FTA find that the State laws, rules, or
regulations are consistent with, and fulfill the intent of, the purposes of 23 U.S.C. 134 and 49 U.S.C. 5303.

This page is intentionally left blank.

1200 New Jersey Avenue SEWashington, DC 20590 Toll‐Free “Help Line” 866‐367‐7487 www.fhwa.dot.gov/planning/ Publication No.: FHWA‐HEP‐11‐011