Embed Size (px)
Citation preview

Document of the World Bank
Confidential Report No. 31725-LAC
A Time to Choose Caribbean Development in the 21st Century April 26, 2005 Caribbean Country Management Unit Poverty Reduction and Economic Management Unit Latin America and the Caribbean Region

i
i
CURRENCY EQUIVALENTS
(Exchange Rate Effective: March 2005) Currency Unit=Bahamas dollar, BH$1.0=US$1.0, BH$1.0=US$1.0 Currency Unit=Barbados dollar, BB$1.0=US$0.50, BB$1.99=US$1.0 Currency Unit=Belize dollar, BZ$1.0=US$0.51, BZ$1.97=US$1.0 Currency Unit=Dominican Peso, DO Peso1.0=US$0.04, DO Peso 26.75=US$1.0 Currency Unit=Eastern Caribbean Dollar, ECD$1.0=US$0.37, ECD$2.7=US$1.0 Currency Unit=Guyana Dollar, GY$1.0=US$0.005602, GY$179.0-US$1.0 Currency Unit=Haiti Gourde, HTG1.0=US$0.03, HTG$36.75=US$1.0 Currency Unit=Jamaican Dollar, JM$1.0=US$0.02, JM$60.9=US$1.0 Currency Unit=Suriname Dollar, SR$1.0=US$0.37, SR$2.72=US$1.0 Currency Unit=Trinidad and Tobago Dollar, TT$1.0=US$0.16, TT$6.28=US$1.0
FISCAL YEARS Antigua and Barbuda, Barbados, Belize, Jamaica, St. Lucia: April 1 - March 31; The Bahamas and Dominica: July 1 – June 30; Dominican Republic, Grenada, Guyana, St. Kitts and Nevis, St. Vincent and the Grenadines, and Suriname: January 1 – December 31; Haiti and Trinidad and Tobago: October 1 – September 30
Vice President: Pamela Cox Country Director: Caroline Anstey Sector Director: Ernesto May Sector Manager: Mauricio Carrizosa Sector Leader: Antonella Bassani Task Team Leader: Sanjay Kathuria
ii
ABBREVIATIONS ACP Asia, Caribbean and Pacific BWIA British West Indies Airlines CAMC Central America, Mexico and the Caribbean CARICOM Caribbean Community CBI Caribbean Basin Initiative CBTPA Caribbean Basin Trade Partnership Act of 2000 CET Common External Tariff CGCED Caribbean Group for Cooperation in Economic Development CIDA Canadian International Development Agency CIT Caribbean Information Technologies CKLN Caribbean Knowledge and Learning Network CLAA Caribbean Latin America Action COMTRADE Commodity Trade Statistics Database CPI Corruption Perceptions Index CRNM Caribbean Regional Negotiating Machinery CROSQ Caribbean Regional Organization on Standards and Quality CSME Caribbean Single Market and Economy CTAG Counter-Terrorism Action Group CTO Caribbean Tourism Organization CXC Caribbean Examination Council DBJ Development Bank of Jamaica EAP East Asia and Pacific ECA Europe and Central Asia ECCU Eastern Caribbean Currency Union ECIP Eastern Caribbean Investment Promotion Service ECLAC Economic Commission for Latin America ECTEL Eastern Caribbean Telecommunications Authority EIA Environmental Impact Assessment ERP Economic Recovery Project EPA Environment Protection Agency EPZ Export Processing Zones EU European Union FAO Food and Agricultural Organization FDI Foreign Direct Investment FIAS Foreign Investment Advisory Services FSMB Federation of State Medical Boards of the US FTA Free Trade Agreement FTAA Free Trade Area of the Americas FTZ Free Trade Zones GATS General Agreement on Trade in Service GDP Gross Domestic Product GNFS Goods and Non-factor Services GNP Gross National Product GPA Government Procurement Agreement GSP Generalized System of Preferences HDI Human Development Indicators HEART/NTA Human Employment and Resource Training/ National Training Agency HIPIC Heavily Indebted Poor Countries HS High School ICAO International Civil Aviation Organization ICT Information and Communication Technology IDB Inter-American Bank IFC International Financial Corporation IFI International Financial Institution
iii
IFS International Financial Statistics ILO International Labor Organization IMF International Monetary Fund IPA Investment Promotion Agency ISPs Internet Service Providers ITU International Telecommunication Union LAC Latin America and the Caribbean LCME Liaison Committee on Medical Education LDC Less-Developed Countries M.D. Medical Doctor MDB Multilateral Development Bank MDC More Developed Countries MDG Millennium Development Goals MENA Middle East and North Africa MERCOSUR Southern Cone Trade Agreement MFA Mutifibre Agreement MFN Most Favored Nation MSc Master of Science NAFTA North American Free Trade Agreement NORAD Norwegian Agency for Development NSFMEA National Committee of Foreign Medical Education and Accreditation NTRC National Telecommunications Regulatory Commission OAS Organization of American States ODA Official Development Assistance OECD Organization for Economic Cooperation and Development OECS Organization of Eastern Caribbean States OHADA Organization pour l’Harmonization en Afrique du Droit des Affairs OLS Ordinary Least Squares PAHO Pan American Health Organization PAJ Port Authority of Jamaica PBL Problem Based Learning PhD Doctor of Philosophy PPP Purchasing Power Parity PREM Poverty Reduction and Economic Management PSMP Public Sector Modernization Project R&D Research and Development REER Real Effective Exchange Rate RNM Regional Negotiating Machinery SAR South Asia Region SDT Special and Differential Treatment SITC Standard International Trade Classification SME Small and Medium Size Enterprises SPS Sanitary and Phytosanitary Standards SSA Sub-Saharan Africa STEP Small Tourism Enterprise Project TFP Total Factor Productivity TOT Terms-of-Trade TRAINS Trade Analysis and Information System TVET Technical and Vocational Education Training UASD Universidad Autonoma de Santo Domingo UNCTAD United Nations Conference on Trade and Development UNDP United Nations Development Program UNELCO Union Electrique du Vanuatu UNEP United Nations Environment Program UNESCO United Nations Educational, Scientific and Cultural Organization

iv
USAID United States Agency for International Development USDOL US Department of Labor USMLE United States Medical Licensing Examination UWI University of the West Indies VAT Value Added Tax WDI World Development Indicators WHO World Health Organization WTO World Trade Organization WTTC World Travel and Tourism Council
v
TABLE OF CONTENTS
FOREWORD................................................................................................................................................XI ACKNOWLEDGEMENTS ........................................................................................................................XII EXECUTIVE SUMMARY AND POLICY OPTIONS ...........................................................................XIV CHAPTER 1 ................................................................................................................................................. 1 GROWTH PERFORMANCE IN THE CARIBBEAN ............................................................................. 1
A. INTRODUCTION ................................................................................................................................. 1 B. ECONOMIC GROWTH AND SOCIAL DEVELOPMENT............................................................................ 1 C. SOURCES OF GROWTH—THE ROLE OF SERVICES AND PRODUCTIVITY ............................................. 6 D. THE PAYOFFS OF POLICY REFORM.................................................................................................. 10 E. ECONOMIC VULNERABILITY AND RESILIENCE ................................................................................ 19 F. MEDIUM-TERM GROWTH OUTLOOK ............................................................................................... 23 G. CONCLUSION—OVERALL POLICY DIRECTIONS .............................................................................. 26
CHAPTER 2 ............................................................................................................................................... 28 IMPROVING GOVERNMENT FINANCES AND EXPENDITURE................................................... 28
A. INTRODUCTION ............................................................................................................................... 28 B. GOVERNMENT EXPENDITURES AND REVENUES IN THE CARIBBEAN ............................................... 30 C. INTEREST EXPENDITURES AND THE DEBT ISSUE ............................................................................. 32 D. GOVERNMENT SPENDING ON EDUCATION....................................................................................... 35 E. GOVERNMENT SPENDING ON HEALTH ............................................................................................ 39 F. GOVERNMENT CAPITAL EXPENDITURES ......................................................................................... 41 G. CONCLUSION................................................................................................................................... 42
CHAPTER 3 ............................................................................................................................................... 44 ATTRACTING PRIVATE INVESTMENT IN THE CARIBBEAN..................................................... 44
A. INTRODUCTION ............................................................................................................................... 44 B. THE INVESTMENT CLIMATE, GROWTH AND POVERTY .................................................................... 44 C. FOREIGN DIRECT INVESTMENT TRENDS IN THE CARIBBEAN........................................................... 46 D. THE FOREIGN INVESTOR’S PERCEPTION OF THE CARIBBEAN .......................................................... 50 E. WHAT ARE THE SOURCES OF INFORMATION FOR INVESTORS? ........................................................ 61 F. CONCLUDING REMARKS ................................................................................................................. 62
CHAPTER 4 ............................................................................................................................................... 64 THE CHANGING INTERNATIONAL ENVIRONMENT FOR THE CARIBBEAN ........................ 64
A. INTRODUCTION ............................................................................................................................... 64 B. TRADE EXPOSURE AND PATTERNS.................................................................................................. 64 C. IS THE CARIBBEAN COMPETITIVE?.................................................................................................. 67 D. PROTECTION IN THE CARICOM – FROM THE EXTERNAL MARKET AND WITHIN CARICOM – AND
LIKELY IMPACT OF LIBERALIZATION ............................................................................................... 69 E. DO TRANSPORT COSTS IMPAIR COMPETITIVENESS? ......................................................................... 72 F. REVENUE EFFECTS OF TARIFF REDUCTION ON CARIBBEAN COUNTRIES......................................... 74 G. PREFERENCES- BLESSING OR MISSED OPPORTUNITY?.................................................................... 76 H. AGRICULTURE PREFERENCES HAVE ALSO PROPPED UP MANY INEFFICIENT SECTORS....................... 81 I. THE WAY FORWARD: LEVERAGING REGIONAL INTEGRATION AND A PRO-ACTIVE VISION FOR
COMPETITIVENESS .......................................................................................................................... 88 J. ACTIONS AND IMPLEMENTATION .................................................................................................... 91
CHAPTER 5 ............................................................................................................................................... 94 EMERGING OPPORTUNITIES FOR THE CARIBBEAN.................................................................. 94
vi
A. INTRODUCTION ............................................................................................................................... 94 B. ICT SERVICES AND ICT-ENABLED PRODUCTS AND SERVICES ........................................................ 94 C. TOURISM IN THE CARIBBEAN ........................................................................................................ 100 D. OFFSHORE EDUCATION................................................................................................................. 108 E. HEALTH SERVICES IN THE CARIBBEAN ......................................................................................... 114
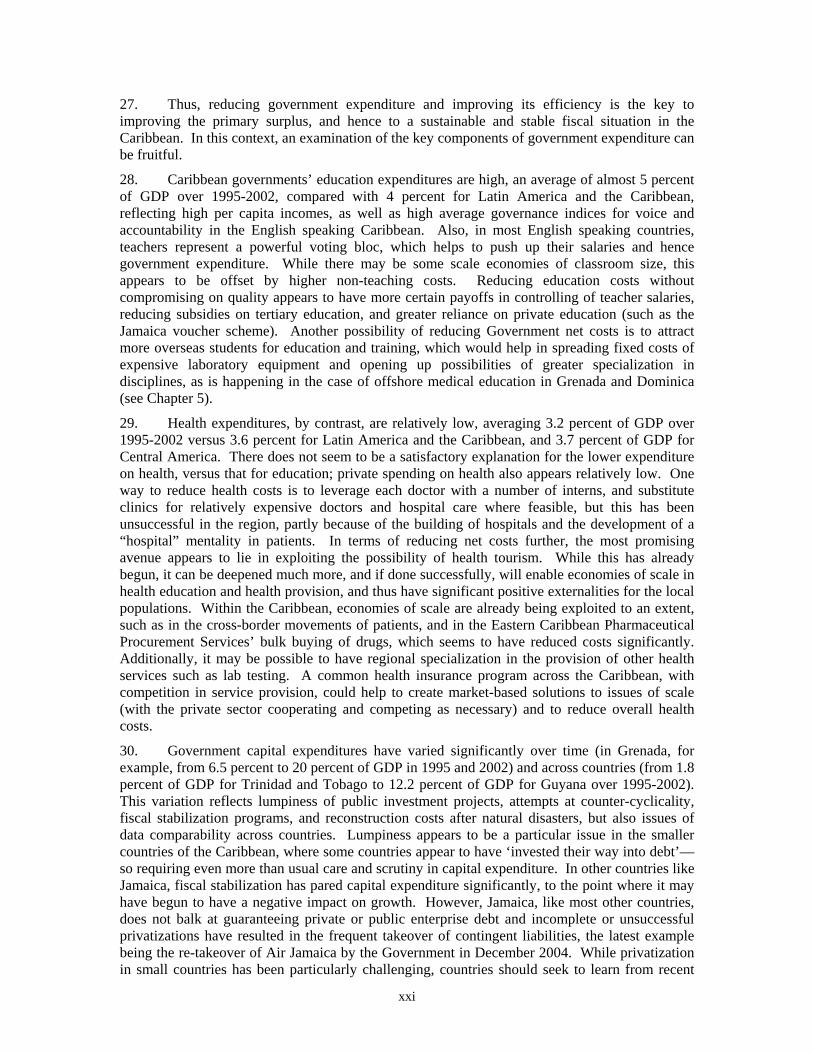
CHAPTER 6 ............................................................................................................................................. 119 IMPROVING LABOR MARKETS TO SUPPORT GROWTH AND EMPLOYMENT.................. 119
A. INTRODUCTION ............................................................................................................................. 119 B. CARIBBEAN LABOR DEMAND TRENDS AND CHARACTERISTICS.................................................... 120 C. LABOR SUPPLY AND MISMATCH................................................................................................... 127 D. LABOR LEGISLATION AND THE ROLE OF UNIONS.......................................................................... 132 E. INTRA-REGIONAL AND EXTRA-REGIONAL LABOR MOBILITY....................................................... 136 F. CONCLUSIONS............................................................................................................................... 141
CHAPTER 7 ............................................................................................................................................. 143 BUILDING SKILLS FOR KNOWLEDGE-DRIVEN GROWTH ...................................................... 143
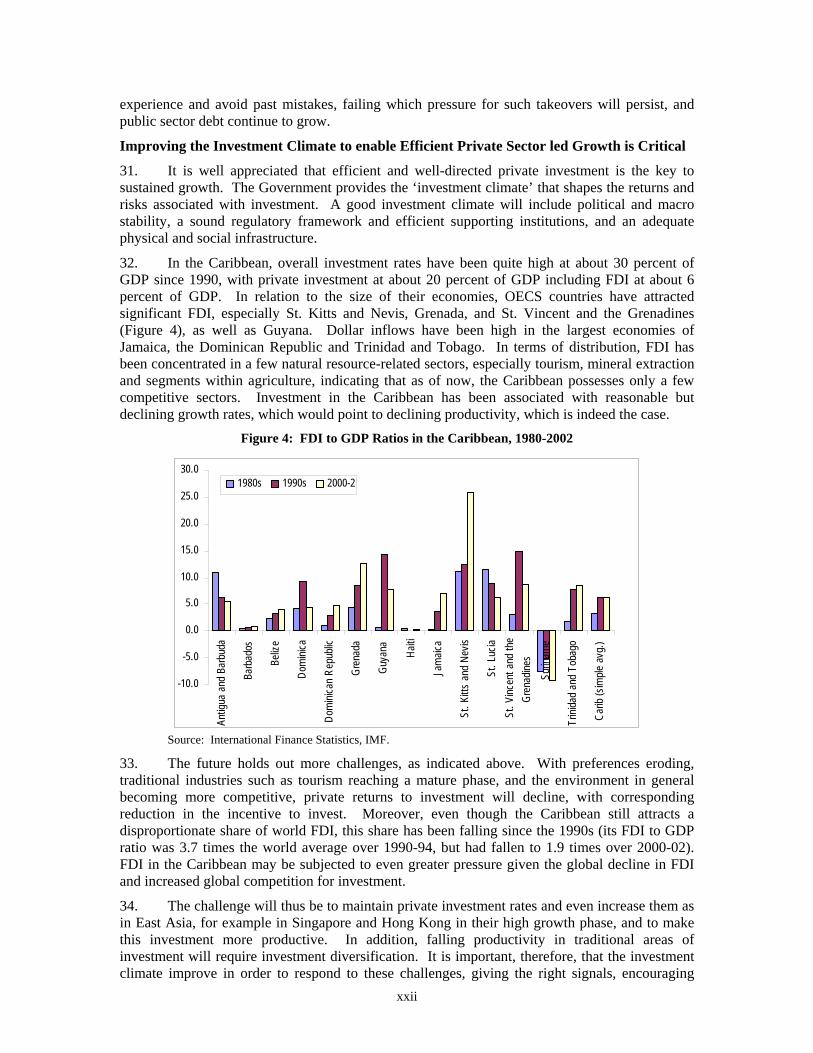
A. INTRODUCTION ............................................................................................................................. 143 B. WHY SKILLS ARE ESSENTIAL FOR COMPETITIVENESS ................................................................... 144 C. MANY CARIBBEAN COUNTRIES ARE FALLING BEHIND IN SKILL FORMATION OVER THE LAST TWO
DECADES....................................................................................................................................... 146 D. ASSESSING THE QUALITY OF EDUCATION IN THE CARIBBEAN ...................................................... 152 E. THE POLICY AGENDA ................................................................................................................... 154 F. IMPROVING QUALITY OF EDUCATION ........................................................................................... 154 G. INCREASING ACCESS TO TERTIARY EDUCATION THROUGH GREATER PRIVATE INVESTMENTS........ 158 H. PRODUCING SKILLS DEMANDED BY EMPLOYERS.......................................................................... 162 I. FACILITATING THE DEVELOPMENT OF TECHNOLOGY IN THE CARIBBEAN ..................................... 166
CHAPTER 8 ............................................................................................................................................. 169 THE PERFORMANCE OF CARIBBEAN INFRASTRUCTURE: SIZE AND INSTITUTIONS MATTER .................................................................................................................................................. 169
A. INTRODUCTION ............................................................................................................................. 169 B. LEVELS OF SERVICES VARY ACROSS SECTORS AND COUNTRIES .................................................. 169 C. ISSUES IN PUBLIC VERSUS PRIVATE FINANCING ............................................................................. 179 D. RECOMMENDATIONS..................................................................................................................... 181
BIBLIOGRAPHY .................................................................................................................................... 191 FIGURES
FIGURE 1: PER CAPITA INCOMES (PPP) 1975-2002 .....................................................................................XIV FIGURE 2: CARIBBEAN TOTAL FACTOR PRODUCTIVITY (MEDIAN GROWTH RATES, %) ............................XVII FIGURE 3: GDP GROWTH AND TOTAL DEBT (%GDP), 86 COUNTRIES ......................................................XVIII FIGURE 4: FDI TO GDP RATIOS IN THE CARIBBEAN, 1980-2002...............................................................XXII FIGURE 5: RATINGS OF THE INVESTMENT CLIMATE IN THE CARIBBEAN ....................................................XXIII FIGURE 6: RAW SUGAR PRODUCTION COSTS OF ACP PRODUCERS .............................................................XXVI FIGURE 7: QUALIFIED TEACHER SALARY IN STATE SCHOOL (ANNUAL $)...................................................XXX FIGURE 8: LOW PASS RATES IN CARIBBEAN EXAMINATIONS COUNCIL ................................................... XXXIII FIGURE 1.1: PER CAPITA GDP GROWTH RATES BY REGION: 1970 – 2003.................................................... 2 FIGURE 1.2: PER CAPITA INCOME BY REGION................................................................................................ 2 FIGURE 1.3: CHANGES IN GDP GROWTH AND POVERTY................................................................................. 6 FIGURE 1.4: CARIBBEAN TOTAL FACTOR PRODUCTIVITY ESTIMATES ............................................................ 9 FIGURE 1.5: THE CARIBBEAN: RELATIVE RANKING ON MACROECONOMIC PERFORMANCE ....................... 12 FIGURE 1.6: STRUCTURAL REFORMS IN THE CARIBBEAN............................................................................. 13 FIGURE 1.7: VULNERABILITY OF COUNTRIES ................................................................................................ 20 FIGURE 1.8: POTENTIAL CHANGE IN GDP PER CAPITA (%): BUSINESS AS USUAL VS. POLICY SCENARIOS... 24 FIGURE 2.1: CARIBBEAN: EDUCATIONAL SPENDING /GDP IN COUNTRIES WITH UNDER 1 MILLION PEOPLE 38 FIGURE 2.2: PRIMARY SCHOOL PUPIL TO TEACHER RATIO (PTR) ................................................................ 38
vii
FIGURE 3.1: INVESTMENT AND GROWTH IN THE CARIBBEAN, 1990-2003.................................................... 46 FIGURE 3.2: FDI TO GDP RATIO, 1980-2002 .............................................................................................. 47 FIGURE 3.3: RATINGS OF THE INVESTMENT CLIMATE IN THE CARIBBEAN ................................................... 51 FIGURE 3.4: COMPARISON OF THE IMPORTANCE OF THE INVESTMENT CLIMATE........................................... 52 FIGURE 3.5: COMPONENTS OF POLICY AND LEGAL ENVIRONMENT.............................................................. 53 FIGURE 3.6: COMPONENTS OF FDI FRAMEWORK (% OF FIRMS)................................................................... 54 FIGURE 3.7: COMPONENTS OF MARKET ACCESS (% OF FIRMS).................................................................... 57 FIGURE 3.8: COMPONENTS OF LABOR (% OF FIRMS) .................................................................................... 58 FIGURE 3.9: COMPONENTS OF ADMINISTRATIVE PROCEDURES (% OF FIRMS).............................................. 59 FIGURE 3.10: COMPONENTS OF TAXATION AND CUSTOMS........................................................................... 60 FIGURE 3.11: COMPONENTS OF INFRASTRUCTURE ...................................................................................... 61 FIGURE 4.1: MERCHANDISE AND SERVICE EXPORTS (% OF
GNFS)…………………………………………65 FIGURE 4.2: CARICOM'S DECLINING MARKET SHARES ............................................................................. 67 FIGURE 4.3: SHIPPING AND INSURANCE COSTS IN THE CARIBBEAN ............................................................. 73 FIGURE 4.4: IMPORTS AND CONTAINER USAGE............................................................................................ 73 FIGURE 4.5: LIBERALIZATION AND CHANGE IN FISCAL BALANCE IN CARIBBEAN COUNTRIES, 1990-2002 ... 75 FIGURE 4.6 EXPORT GROWTH IN A POST-PREFERENCE WORLD...................................................................... 77 FIGURE 4.7: PERCENTAGE OF IMPORTS INTO U.S. RECEIVING PREFERENCES ................................................ 78 FIGURE 4. 8: CHINA APPAREL EXPORTS TO THE US..................................................................................... 80 FIGURE 4.9: EXPORTS OF PRODUCTS ALREADY LIBERALIZED (1996=100)................................................... 80 FIGURE 5.1: INTERNET COSTS AND USERS ................................................................................................... 98 FIGURE 5.2 CARIBBEAN GROWTH HAS COME FROM CUBA AND DOMINICAN REPUBLIC............................. 101 FIGURE 5.3: PRICE COMPETITIVENESS ....................................................................................................... 105 FIGURE 5.4: INTERNATIONAL MEDICAL GRADUATES INTO THE US, 1984-2004 ........................................ 109 FIGURE 5.5: STAGES OF US MEDICAL TRAINING ....................................................................................... 110 FIGURE 6.1: EMPLOYMENT SHARE BY SECTOR ........................................................................................... 123 FIGURE 6.2: PUBLIC EMPLOYMENT (% OF LABOR FORCE).......................................................................... 123 FIGURE 6.3: EDUCATION BREAKDOWN OF EMPLOYMENT IN DOMINICA, DOMINICAN REPUBLIC AND ST. VINCENT AND THE GRENADINES ................................................................................................................. 123 FIGURE 6.4: RETURNS TO EDUCATION ........................................................................................................ 126 FIGURE 6.5: COMPARING MALE AND FEMALE UNEMPLOYMENT ................................................................ 131 FIGURE 6.6: COUNTRY COMPOSITION OF LAC IMMIGRANTS IN THE US, 2000........................................... 137 FIGURE 7:1:UNAVAILABILITY OF SKILLS BIGGEST OBSTACLE IN GRENADA’S INVESTMENT CLIMATE ....... 145 FIGURE 7.2: RESTING ON LAURELS: FALLING DOWN TO AVERAGE PERFORMERS ........................................ 148 FIGURE 7.3: REMARKABLE KOREA AND FINLAND....................................................................................... 149 FIGURE 7.4:QUALITY OF INSTRUCTION WITHIN THE CARIBBEAN ................................................................ 154 (THE PASS RATE OF MATH AND ENGLISH AT THE CXC EXAM) .................................................................... 154 FIGURE 7.5: RECORD HIGH PUBLIC SPENDING IN THE CARIBBEAN............................................................... 156 FIGURE 7.6: INSUFFICIENT LEARNING AMONG YOUNG CARIBBEAN MALES: COMPLETION OF SECONDARY EDUCATION ................................................................................................................................................. 157 FIGURE 7.7: TERTIARY EDUCATION: HOW INVESTMENT AND ENROLLMENT RELATE ................................. 159 FIGURE 7.8: PUBLIC TRAINING PROGRAMS: INSUFFICIENT EMPHASIS ON ENTERPRISE TRAINING IN THE CARIBBEAN................................................................................................................................................. 163 FIGURE 7.9: NATIONAL INNOVATION SYSTEMS .......................................................................................... 167 FIGURE 8.1: TOTAL FIXED AND MOBILE LINES ........................................................................................... 170 FIGURE 8.2: CELLULAR SUBSCRIPTIONS ..................................................................................................... 170 FIGURE 8.3: COST OF A 3 MINUTE PHONE CALL TO THE USA..................................................................... 171 FIGURE 8.4: DIAL-UP AND HIGH SPEED INTERNET MONTHLY COSTS ....................................................... 171 FIGURE 8.5: POPULATION WITH ACCESS TO ELECTRICITY .......................................................................... 172 FIGURE 8.6: AVERAGE END-USER ELECTRICITY PRICES ............................................................................. 172 FIGURE 8.7: ELECTRICITY TRANSMISSION AND DISTRIBUTION LOSSES ...................................................... 174 FIGURE 8.8: PRODUCTIVITY IN THE ELECTRICITY SECTOR.......................................................................... 174 FIGURE 8.9: ACCESS TO IMPROVED WATER ................................................................................................ 175 FIGURE 8.10: AIRPORT CHARGES TO AIRLINES AND PASSENGERS .............................................................. 177 FIGURE 8.11: PORT ..................................................................................................................................... 177 FIGURE 8.12: ECONOMY CLASS AIRFARE FROM MIAMI .............................................................................. 178 FIGURE 8.13: CRANE PRODUCTIVITY .......................................................................................................... 178
viii
FIGURE 8.14: EMPLOYEE PRODUCTIVITY .................................................................................................... 178 FIGURE 8.15: INSTITUTIONAL CAPACITY AND INFRASTRUCTURE PERFORMANCE ....................................... 181 BOXES
BOX 1.1: COUNTRY CASE STUDIES ............................................................................................................... 11 BOX 1.2: THE FINANCIAL SECTOR IN THE CARIBBEAN.................................................................................. 15 BOX 1.3: DEFINITION AND RATIONALE OF VARIABLES INFLUENCING GROWTH .......................................... 17 BOX 1.4: THE ENVIRONMENT AND NATURAL DISASTERS ............................................................................ 21 BOX 1.5: VOLATILITY AND SMALL STATES – EVIDENCE FOR THE CARIBBEAN............................................ 22 BOX 2.1: PUBLIC SECTOR REFORM: JAMAICA'S EXECUTIVE AGENCY EXPERIMENT ................................... 29 BOX 2.2: THE INCENTIVES ISSUE: DIFFICULTIES IN OFFSETTING HIGH TAX RATES WITH TAX INCENTIVES . 34 BOX 2.3: EDUCATIONAL QUALITY AND CROSS-COUNTRY INSTITUTIONS..................................................... 39 BOX 3.1. ACHIEVING DIVERSIFICATION THROUGH “SELF-DISCOVERY” ...................................................... 49 BOX 3.2: WALKERSWOOD’S RECIPE FOR SUCCESS: MADE IN JAMAICA ....................................................... 56 BOX 3.3: THE ROLE OF THE DIASPORA IN ATTRACTING FDI IN MAURITIUS .................................................. 58 BOX 3.4: IRELAND- PRIVATE SECTOR INSTITUTIONS IN ACTION.................................................................. 62 BOX 4.1: VAT IN GRENADA AND BELIZE ..................................................................................................... 76 BOX 4.2 : SERVICE EXPORTS GREW WITHOUT PREFERENCES ...................................................................... 78 BOX 4.3: DISTANCE STILL MATTERS ............................................................................................................ 81 BOX 4.4: SUGAR IN THE CARIBBEAN: ADJUSTING TO ERODING PREFERENCES ............................................. 83 BOX 4.5: THE CARIBBEAN BANANA INDUSTRY DECLINES, ALONG WITH THE BANANA REGIME................... 85 BOX 4.6: NON-TRADITIONAL FOOD EXPORTS ENCOUNTER MORE STRINGENT TRADE PARTNER SPS STANDARDS .................................................................................................................................................. 87 BOX 5.1: DEMYSTIFYING THE CALL CENTER TREND ................................................................................... 95 BOX 5.2: TELEMEDICINE IN ACTION ............................................................................................................ 97 BOX 5.3: ICT OPENING MARKETS FOR SMES ............................................................................................. 97 BOX 5.4: PROMOTING KNOWLEDGE EXCHANGE ........................................................................................ 100 BOX 5.5: EMERGING GROWTH SECTORS IN TOURISM.................................................................................. 102 BOX 5.6: ACHIEVING ENVIRONMENTALLY SUSTAINABLE TOURISM IN THE OECS SUB-REGION............... 104 BOX 5.7: LE SPORT, ST. LUCIA .................................................................................................................. 115 BOX 6.2: TEMPORARY WORKER PROGRAMS—GAINS WITHOUT PAINS ...................................................... 140 BOX 7.3: EDUCATION SPENDING IN THE CARIBBEAN NOT COMMENSURATE WITH OUTCOMES .................... 156 BOX 7.4: DISPARITIES IN LEARNING OUTCOMES BETWEEN SCHOOLS: A TELLING CASE FROM ST. VINCENT AND THE GRENADINES ................................................................................................................................ 157 BOX 7.5: THE UNIVERSITY OF WEST INDIES: THE POTENTIAL AND CHALLENGE OF COOPERATION............. 160 BOX 7.6: GRADUALLY REFORMING HIGHER EDUCATION FINANCING: THE AUSTRALIAN AND BRITISH REFORMS ..................................................................................................................................................... 161 BOX 7.7: MEXICAN EXPERIENCES IN SUPPORT OF SMES............................................................................. 164 BOX 7.8: HOW THE BARBADOS COMMUNITY COLLEGE ACCOMMODATES THE NEEDS OF FIRMS ............... 165 BOX 7.9: TECHNOLOGY THE CENTERPIECE OF SM JALEEL’S GROWTH STRATEGY..................................... 168 BOX 8.1: “FINANCIAL BLACKOUTS” IN THE DOMINICAN REPUBLIC’S POWER SECTOR............................... 173 BOX 8.2: VANUATU: A SMALL ISLAND SUCCESS STORY OF INTRODUCING THE PRIVATE SECTOR IN WATER SUPPLY........................................................................................................................................................ 176 BOX 8.3: THE PORT AUTHORITY OF JAMAICA............................................................................................. 177 BOX 8.4: SANGSTER INTERNATIONAL AIRPORT PRIVATIZATION DEVELOPMENT PROJECT ......................... 179 BOX 8.5: ECTEL – REGULATORY COOPERATION...................................................................................... 184 BOX 8.6: MAURITIUS PORT ........................................................................................................................ 188 TABLES
TABLE 1: CARIBBEAN: GOVERNMENT EXPENDITURES, REVENUES, DEFICITS AND DEBT.............................XX TABLE 2: KEY TRADE RELATED INDICATORS (PERCENT OF GDP) .............................................................XXV TABLE 1.1: STANDARD DEVIATION OF GDP GROWTH RATE, 1960-2000...................................................... 3 TABLE 1.2: SECTORAL GDP GROWTH RATES AND GDP SHARES (MEDIAN) ................................................... 7 TABLE 1.3: DEMAND DECOMPOSITION OF GDP GROWTH (%)....................................................................... 9 TABLE 1.4: EXPLAINING CHANGES IN GROWTH BETWEEN 1980S AND 1990S.............................................. 19 TABLE A. VOLATILITY AND PROXIMATE CAUSES: 1981- 2003..................................................................... 22 TABLE B. REGRESSION ANALYSIS OF DETERMINANTS OF VOLATILITY ........................................................ 23 TABLE 1.5: DETERMINANTS OF CHANGE IN GROWTH PER CAPITA UNDER TWO SCENARIOS (MEDIAN, %) . 24
ix
TABLE 2.1: CARIBBEAN: GOVERNMENT EXPENDITURES, REVENUES, DEFICITS AND DEBT.......................... 31 TABLE 2.2: THE CARIBBEAN: GOVERNMENT SPENDING ON EDUCATION AND HEALTH BY COUNTRY .......... 36 AND AVERAGES COMPARED TO LATIN AMERICA AND WORLDWIDE ............................................................. 36 TABLE 2.3: THE CARIBBEAN: DOCTORS AND HOSPITAL BEDS...................................................................... 40 COMPARED TO LATIN AMERICA, AND ALL COUNTRIES................................................................................. 40 TABLE 2.4: CARIBBEAN: GOVERNMENT CAPITAL EXPENDITURES/GDP (%), 1995-2002............................. 42 TABLE 3.1: FDI PERFORMANCE INDEX FOR CARIBBEAN ............................................................................. 47 TABLE 3.2: EXPORT STRUCTURE BY TECHNOLOGICAL INTENSITY (% OF EXPORTS) ..................................... 48 TABLE 3.3: LABOR COSTS (US$ PER HOUR)................................................................................................. 58 TABLE 4.1: KEY CARIBBEAN TRADE RELATED INDICATORS (PERCENT OF GDP) ........................................ 66 TABLE 4.2 COMPOSITION OF EXPORTS AS A % OF GDP AND GNFS ............................................................. 68 TABLE 4.3: TARIFF STRUCTURE ON ALL IMPORTS IN 2002 ........................................................................... 70 TABLE 5.1: INTERNATIONAL TOURIST ARRIVALS BY REGION OF DESTINATION (% SHARE)...................... 101 TABLE 5.2: STATISTICS ON THE US MEDICAL PROFESSION (%)................................................................. 108 TABLE 5.3: PASS RATES FOR USMLE........................................................................................................ 111 TABLE 5.4: COMPARISON OF US AND OFFSHORE MEDICAL SCHOOLS ....................................................... 112 TABLE 5.5: POTENTIAL HEALTH AND HEALTH-RELATED SERVICES FOR THE CARIBBEAN ......................... 116 TABLE 7.1: PRIVATE RETURNS TO EDUCATION IN THE CARIBBEAN ............................................................ 146 TABLE 7.2: AVERAGE YEARS OF SCHOOLING OF THE ADULT POPULATION IN THE CARIBBEAN ................. 147 TABLE 7.3: WORLD EDUCATION RANKING (YEARS OF SCHOOLING) ........................................................... 147 TABLE 7.4: THE CARIBBEAN LOST ITS HEAD START IN SECONDARY EDUCATION....................................... 150 TABLE 7.5: LOW ENROLLMENT IN TERTIARY EDUCATION .......................................................................... 151 TABLE 7.6:RETURNS TO EDUCATION FOR CARIBBEAN MIGRANTS IN THE US ............................................. 153 TABLE 7.7: HIGH TAX LEVY FOR TRAINING ................................................................................................. 163 ANNEXES
ANNEX 1.1: METHODOLOGY USED TO OBTAIN ALTERNATIVE MEASURES OF TFP.................................... 202 ANNEX 3.1. ALTERNATIVE INVESTMENT LOCATIONS ................................................................................ 218 ANNEX 3.2. JAMAICA’S BUSINESS ENVIRONMENT.................................................................................. 220 ANNEX 3.4. FOREIGN INVESTOR PERCEPTION SURVEY........................................................................... 226 ANNEX 5.1: JAMAICA MUSIC PRODUCTION- JAMAICA SIGNATURE BEATS ................................................ 236 ANNEX 5.2: THE CROSSROADS CENTER IN ANTIGUA AND BARBUDA ........................................................ 238 ANNEX 5.3: GROWING DEMAND IN CARIBBEAN YACHTING SECTOR.......................................................... 238 ANNEX 6.1: DEFINITIONS OF UNEMPLOYMENT IN THE CARIBBEAN ........................................................... 240 ANNEX 6.2: TRADE UNIONS IN THE CARIBBEAN ........................................................................................ 241 ANNEX 6.3: REGULATORY ENVIRONMENT FOR MIGRATION ...................................................................... 242 ANNEX 8.1: CARIBBEAN INFRASTRUCTURE: GOOD POLICY PRACTICES ................................................... 252
ANNEX TABLE 1.1. CARIBBEAN TOTAL FACTOR PRODUCTIVITY (MEDIAN GROWTH RATES, %) ............... 204 ANNEX TABLE 1.2: SOLOW GROWTH ACCOUNTING, TFP CARIBBEAN VS. LATIN AMERICA..................... 206 ANNEX TABLE 1.3: TFP1: SIMPLE GROWTH ACCOUNTING, 1980-2000 .................................................... 206 ANNEX TABLE 1.4: TFP2: REGRESSION ESTIMATES OF TFP GROWTH, 1981-2000.................................. 207 ANNEX TABLE 1.5: TFP3A: REGRESSION ESTIMATES OF TFP GROWTH ADJUSTED FOR BUSINESS CYCLES
.......................................................................................................................................................... 208 ANNEX TABLE 1.6: TFP 3B: REGRESSION ESTIMATES OF TFP GROWTH ADJUSTED FOR BUSINESS CYCLES
.......................................................................................................................................................... 209 ANNEX TABLE 1.7: SELECTED SOCIO-ECONOMIC INDICATORS .................................................................. 210 ANNEX TABLE 1.8: SELECTED ECONOMIC INDICATORS .............................................................................. 212 ANNEX TABLE 1.9: PER CAPITA GDP GROWTH ........................................................................................ 213 ANNEX TABLE 1.10: MEDIUM-TERM GROWTH PROJECTIONS BY COUNTRY UNDER FIRST SCENARIO ....... 213 ANNEX TABLE 1.11: MEDIUM-TERM GROWTH PROJECTIONS BY COUNTRY UNDER SECOND SCENARIO ... 214 ANNEX TABLE 2.1: DETERMINANTS OF PER CAPITA GOVERNMENT EXPENDITURE ON EDUCATION. .......... 215 1995-2002 AVERAGES. ............................................................................................................................... 215 ANNEX TABLE 2.2: PUPIL TO TEACHER RATIO (PTR) AND SPENDING, POPULATION, AND PER CAPITA INCOME, 1995-2002.................................................................................................................................... 216 ANNEX TABLE 2.3: ECONOMIES OF SCALE IN EXPENDITURE ON HEALTH................................................... 217 ANNEX TABLE 3.1: DISTRIBUTION OF FIRMS IN SAMPLE BY SECTOR......................................................... 227
x
ANNEX TABLE 3.1: SECTORAL IMPORTANCE IN INVESTMENT CLIMATE FACTORS..................................... 228 ANNEX TABLE 4.1: MERCHANDISE EXPORTS AS A % OF TOTAL EXPORTS................................................ 230 ANNEX TABLE 4.2: DECADAL AVERAGE EXPORT GROWTH RATES ........................................................... 231 ANNEX TABLE 4.3: DIRECTION OF MERCHANDISE EXPORT BY COUNTRY (2002 UNLESS OTHERWISE INDICATED) ................................................................................................................................................. 232 ANNEX TABLE 4.4: TARIFF REVENUE BY SITC CATEGORY: AGGREGATE FOR ALL CARIBBEAN COUNTRIES
.......................................................................................................................................................... 233 ANNEX TABLE 4.5: INWARD FDI TO GDP RATIO: % FIGURES ................................................................... 234 ANNEX TABLE 4.6: LOSS IN TARIFF REVENUE AND TARIFF RATES IN 2002 ............................................... 235 ANNEX TABLE 6.1: EMPLOYMENT IN THE CARIBBEAN 1991-2001 (THOUSANDS)....................................... 244 ANNEX TABLE 6.2: COMPARATIVE ANNUAL SALARIES OF SELECTED OCCUPATIONS IN THE CARIBBEAN, 2000/1 (US$) .............................................................................................................................................. 244 ANNEX TABLE 6.3: WEEKLY WAGES DATA FOR SELECTED CATEGORIES OF WORKERS IN THE HOTEL INDUSTRY, 2001 (BDS$) ............................................................................................................................. 245 ANNEX TABLE 6.4: HOURLY MANUFACTURING WAGES (US$), 2002 ....................................................... 245 ANNEX TABLE 6.5: REGRESSION RESULTS OF THE DETERMINANTS OF LABOR FORCE PARTICIPATION ..... 246 ANNEX TABLE 6.6: UNEMPLOYMENT IN THE CARIBBEAN (%) .................................................................... 247 ANNEX TABLE 6.7: UNEMPLOYMENT PROBIT REGRESSION RESULTS ...................................................... 247 ANNEX TABLE 6.8: RATIFICATION OF ILO CONVENTIONS BY CARIBBEAN COUNTRIES.............................. 248 ANNEX TABLE 6.9: SELECTED LABOR LEGISLATION IN THE CARIBBEAN.................................................... 248 ANNEX TABLE 6.10: REGIONAL MIGRANT STOCK AND MIGRATION RATES FOR SELECT CARIBBEAN COUNTRIES (1990 AND 1991).................................................................................................................... 249 ANNEX TABLE 8.1: INSTITUTIONAL FEATURES OF INFRASTRUCTURE SECTORS IN THE CARIBBEAN ........... 255
ANNEX FIGURE 1.1: ADJUSTED TFP (3A) GROWTH (1981-1990 AND 1991-2000) .................................... 205 ANNEX FIGURE 3.1: FACTORS RATED AS MAJOR OR SEVERE OBSTACLES IN GRENADA (% FIRMS)............ 223 ANNEX FIGURE 3.1: SKILLS COMPOSITION OF SAMPLE FOREIGN FIRMS IN CARIBBEAN (%) ..................... 228 ANNEX FIGURE 6.1: REAL UNIT LABOR COST (1996=100)......................................................................... 250 ANNEX FIGURE 6.2: COMPARING HOURLY CONSTRUCTION AND MANUFACTURING WAGES (US$) ........... 250 ANNEX FIGURE 6.3: LABOR FORCE AND POPULATION GROWTH 1996-2002............................................... 250
xi
FOREWORD The Caribbean is at a development crossroads. Decades of reliance on traditional markets, and on trade preferences, have given way to a new reality, where traditional agriculture plays a much smaller role in most economies, and where a much harsher and more competitive international wind blows. In such an environment, business as usual will no longer suffice. Adapting to the demands of this new world will require a much greater focus on sustaining and improving growth and competitiveness. In many respects, the Caribbean is well positioned for this. Endowed, for the most part, with strong traditions of democratic participation and political stability, favorable locations, excellent climates and an early targeting of universal primary education, many Caribbean countries already possess a number of the ingredients necessary to adapt to the challenges of the 21st century. And yet we know that breaking with the past is never easy. Vested interests will block and parry; and political groups may see insufficient political returns in supporting or driving change. Proper account, too, must be taken of winners and losers, of transition costs, and of bringing in previously disadvantaged and excluded groups. All this speaks to the fundamental need to begin a debate among political parties, civil society, the private sector, media and academic groups about the proper directions of development strategy at both the national and regional levels. It is our hope that this volume and its companion piece on Growth and Competitiveness in the Organization of Eastern Caribbean States, will serve as a launching pad for such a debate. The time for such a debate could not be more opportune. While poverty in the Caribbean has declined in the past, it remains high and many of the region’s impressive social gains are at risk of eroding. Unemployment, particularly of youth, is a major issue, and there is growing concern about recent increases in crime and violence across the region. Tourism, too, is under increasing pressure from new markets in Cuba and Central America, and the region now has the dubious distinction of having many of the most indebted countries in the world. While none of these challenges is insurmountable, all require political leadership and strong national support. Deepening the bonds of regionalism will also require considerable political will, but the pay-offs, we believe, in terms of economies of scale and long-term improvements in growth and competitiveness, will be considerable. While this volume focuses primarily on decision makers and publics in the Caribbean there is a set of players who are largely absent from its pages, but whose role is none the less crucial. For more than three decades, the international donor community has supported Caribbean development. If wrong choices have been made, they have been made by donors together with governments. This volume is not intended to ascribe blame, but to point to the fundamental need to choose a better path for the future. That choice must also include more country ownership of development programs, better harmonized and coordinated donor support, and a reduction in the burden donors too often impose on recipient countries. We hope that this volume will provide an opportunity for the international donor community to debate and finally resolve many of these longstanding issues. This report, and its companion piece on the Organization for Eastern Caribbean States, have been informed by extensive consultations across the Caribbean. We would like to thank all those who took the time to share their expertise, their insights and their unique brand of Caribbean hospitality. We have endeavored to capture the richness of the input we received, although ultimately the responsibility for the Reports’ conclusions remains ours alone.
Caroline Anstey Director, Caribbean Country Management Unit The World Bank
xii
ACKNOWLEDGEMENTS
This report was prepared by a team of Bank staff led by Sanjay Kathuria, and included a core team consisting of Mustapha Rouis, Michael Corlett, James Hanson, Rina H. Oberai, Kevin Tomlinson, Elizabeth Ruppert Bulmer, and Andreas Blom. Key responsibilities for chapters/sections were: Growth/Chapter 1 (Mustapha Rouis); Government/Chapter 2, financial sector (James Hanson); Investment Climate/Chapter 3 (Rina H. Oberai); Trade/Chapter 4, Executive Summary (Sanjay Kathuria); Services case studies/Chapter 5 (Tourism—Michael Corlett; ICT—On the Frontier Group, Inc.; Education—Camille Nuamah; Health—Logan Brenzel); Labor/Chapter 6 (Elizabeth Ruppert Bulmer); Skills/Chapter 7 (Andreas Blom); Infrastructure/Chapter 8 (Abhas Jha, James Hanson, Kevin Tomlinson, Castalia and Associates). Michael Corlett provided analytical support for the full report, and helped in many ways to bring the report to completion. Kevin Tomlinson did a field-based firm case study and provided analytical support for several chapters. Desktop publishing was done by Anna Musakova, with critical technical and other support from Shunalini Sarkar. Rachel McColgan and Alejandra Viveros were responsible for developing the dissemination strategy. In addition, the team benefited greatly from the collaboration of its colleagues preparing the companion, sub-regional report on the OECS, notably Camille Nuamah and Theresa Beltramo.
The report was prepared under the stewardship of Caroline Anstey, Country Director; Ernesto May, Sector Director; Mauricio Carrizosa, Sector Manager; and Antonella Bassani, Lead Economist and Sector Leader.
The report draws on the work of a large, inter-disciplinary team both within and outside the Bank. Background papers were written by Mizuho Kida (on growth); Gunnar Eskeland, D. Nikitin, E. Villanger, and I. Kostad (CICERO, Norway, on the role of the state); Xiaolun Sun/FIAS (on FDI benchmarking through a foreign investor survey, and Grenada investment climate diagnostic); Caroline Freund with Mohammed Amin (on trade); On the Frontier Group, Inc., for infoDev (on ICT-based services); Swedish Development Advisers (on offshore education); DMRussell Consulting and Michael Corlett (on tourism); Logan Brenzel, Elsie Le Franc (UWI, Barbados), Kim Clarke (UWI, Jamaica), Aaditya Mattoo and Randeep Rathindran (on health services); Tom McArdle (HEART, Jamaica, on worker training); Andrew Downes (UWI, Barbados, on labor markets); Elizabeth Thomas-Hope (UWI, Jamaica, on labor migration); Lawrence Nurse (UWI, Barbados, on trade unions); Castalia and Associates (on Caribbean infrastructure); Donald Mitchell (sugar); Steven Jaffee (SPS standards in Jamaica). Thomas Pave Sohnesen provided research support on education. For the labor chapter, the following individuals provided data and helped with regression analysis on returns to education: Ralph Henry (Kairi Consultants Limited, Trinidad and Tobago); Edwin St. Catherine (Statistics Dept., Government of St. Lucia); A.V. Browne (Statistical Service Department, Barbados); Selvon Hazel (Policy Research and Development Institute, Tobago); and Theodora Xenogiani (Consultant, currently at OECD).
The report has benefited from inputs at different stages of preparation from various parts of the World Bank, clients, and development partners. Designated reviewers from the World Bank were Shahrokh Fardoust, Carlos Felipe Jaramillo, and William Maloney. The external reviewers were Gladstone Bonnick, and Paul Mullard (DFID). Additional reviewers for the concept paper of the report were Clive Harris (World Bank), Donald J. Harris, and Juliet Melville (Caribbean Development Bank). Comments were received from several Bank staff including Caroline Anstey, Guillermo Perry, Mauricio Carrizosa, Antonella Bassani, Cynthia Hobbs, Errol Graham, and Peter Walkenhorst. Support on specific issues was received from Seth Ayers, Lisa Bhansali, Auguste Kouame, and Claudia Sepulveda. From outside the Bank, comments were received from the IMF (Ratna Sahay, Sanjaya Panth, Goohoon Kwon, Montfort Mlachila, Prachi Misra, and Rafael Romeu), EC (Jan-Peter Mout), Reynold Simons (ILO) and Sir George Alleyne (PAHO). The team benefited from frequent discussions with and support of Aaditya Mattoo (World Bank), Esteban Perez (ECLAC), and Deryck Brown (Caribbean Regional Negotiating Machinery), and
xiii
from discussion with Simon Johnson (MIT/IMF visitor) and Kelvin Dalrymple (CDB). It also received support and help from the Caribbean sector leaders in the World Bank, Charles Feinstein, Chingboon Lee, and Pierre Werbrouck.
The World Bank would also like to acknowledge the support of several institutions. The task team benefited from feedback from a workshop organized by the Caribbean Development Bank, with the participation of all its country economists, to discuss the proposed themes of the report. A similar workshop was organized by the EU and DFID with all development partners based in Barbados. The team would like to thank all the government officials, firms and private sector organizations in the Caribbean who gave generously of their time to meet with the team.
Finally, the World Bank would like to thank the European Commission and the Government of the Netherlands for their generous financial support, without which this report would not have been possible. The EC support was given as part of their trade diagnostic studies program, and the Government of Netherlands supported the FIAS investment diagnostics through its Consultant Trust Funds program.
xiv
A TIME TO CHOOSE: CARIBBEAN DEVELOPMENT IN THE 21ST CENTURY
EXECUTIVE SUMMARY AND POLICY OPTIONS
1. Caribbean countries1 face unique development challenges arising from their small size and vulnerability to natural disasters as well as the resulting economic volatility. Also, they continue to confront a changing international environment, with a significant transformation in the production structure of most economies, away from traditional agriculture.
2. Despite these challenges, the Caribbean has continued to see a sustained growth in per capita incomes, with most of them becoming middle income countries and achieving high levels of human development. These achievements reflect many of the positive endowments that the Caribbean countries have been blessed with, including favorable locations and excellent climates, virtually no hinterlands, the advantage of the English language in most countries (Spanish, French, and Dutch in other cases), an early targeting of universal primary education, strong traditions of democratic participation and political stability for most countries, and a significant degree of regional integration despite significant differences in economic and social characteristics.
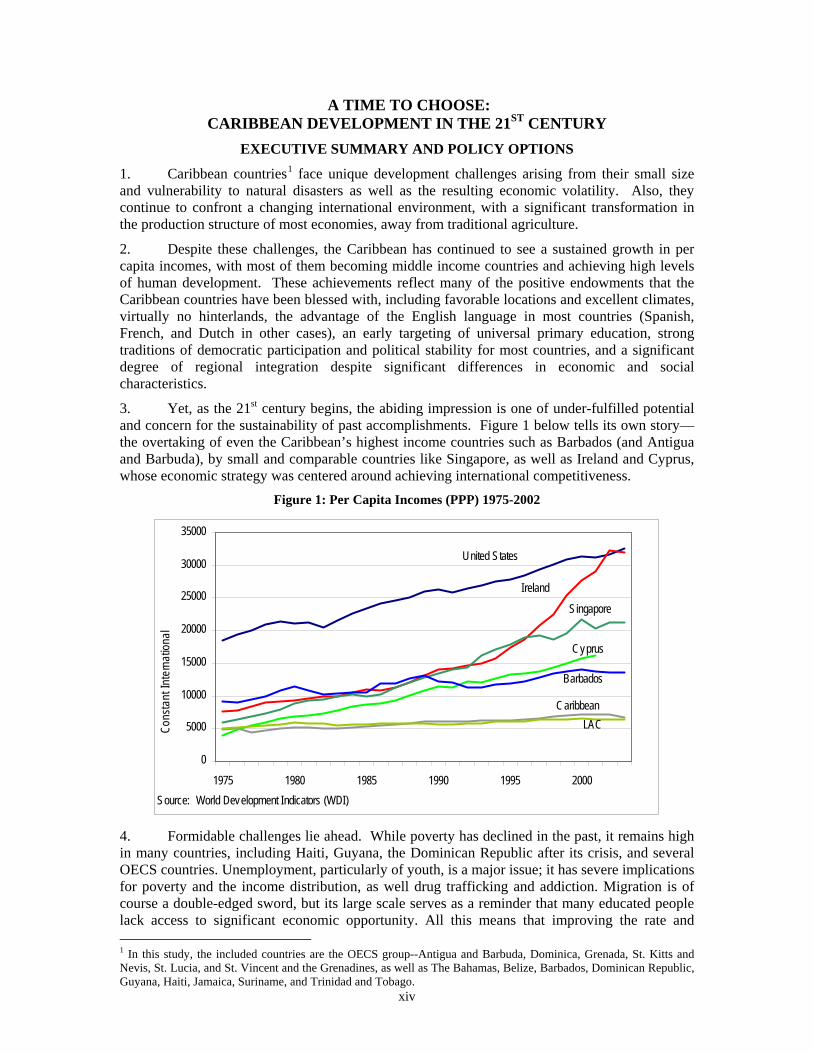
3. Yet, as the 21st century begins, the abiding impression is one of under-fulfilled potential and concern for the sustainability of past accomplishments. Figure 1 below tells its own story—the overtaking of even the Caribbean’s highest income countries such as Barbados (and Antigua and Barbuda), by small and comparable countries like Singapore, as well as Ireland and Cyprus, whose economic strategy was centered around achieving international competitiveness.
Figure 1: Per Capita Incomes (PPP) 1975-2002
0
5000
10000
15000
20000
25000
30000
35000
1975 1980 1985 1990 1995 2000
Cons
tant
Inte
rnat
ional
Source: World Development Indicators (WDI)
Barbados
Cyprus
Singapore
Ireland
United States
CaribbeanLAC
4. Formidable challenges lie ahead. While poverty has declined in the past, it remains high in many countries, including Haiti, Guyana, the Dominican Republic after its crisis, and several OECS countries. Unemployment, particularly of youth, is a major issue; it has severe implications for poverty and the income distribution, as well drug trafficking and addiction. Migration is of course a double-edged sword, but its large scale serves as a reminder that many educated people lack access to significant economic opportunity. All this means that improving the rate and 1 In this study, the included countries are the OECS group--Antigua and Barbuda, Dominica, Grenada, St. Kitts and Nevis, St. Lucia, and St. Vincent and the Grenadines, as well as The Bahamas, Belize, Barbados, Dominican Republic, Guyana, Haiti, Jamaica, Suriname, and Trinidad and Tobago.
xv
quality of growth is crucial, given the linkages between pro-poor growth and poverty reduction and employment. Another challenge is coping with natural disasters and economic volatility, as the 2004 hurricane season reminded us. Still another challenge is reducing crime, which is affecting the larger islands and increasingly the smaller ones; it impacts the social fabric as well as investment and growth, and contributes to increased migration. Meeting these challenges is complicated by the massive increase in public debt in the last few years—the Caribbean now has the dubious distinction of having many of the most indebted countries in the world. High debt makes the countries even more susceptible to volatility, increases risks of macro instability and compromises their growth prospects.
5. Fortunately, the challenges are not insurmountable, and can be dealt with, with the central plank being a focus on sustaining and improving growth and competitiveness. Of course, some of the issues highlighted above have a two-way causation, meaning they also affect growth, but it is nevertheless useful to think of growth as being the main instrument to achieve many of the social goals. Experience across the world shows that growth results in poverty reduction, and this is true for the Caribbean as well; also, for some of the countries for which evidence exists, the elasticity of employment with respect to output is positive. Thus, a virtuous circle of growth could reduce unemployment, poverty, crime, reduce incentives for migration, and create fiscal space for dealing better with disasters.
6. This report seeks to discuss the critical constraints to sustainable, job-creating growth, and to present policy options for the region and country Governments to stimulate such growth. It analyzes growth performance in the Caribbean over the last four decades, and highlights key determinants of past and also future growth. Given the recent deterioration in government finances, the report then studies key areas of government expenditure. A discussion of the climate for private investment follows, which looks at the framework that shapes the risks and returns for private investment. The report then discusses the impact of recent trade developments on the Caribbean, the future outlook in view of major ongoing changes in the international environment, as well as the opportunities that are likely to emerge, especially in the services sector. It then focuses on some key factors that have been significant in determining past growth in the Caribbean, including labor market issues; education, skill development and training; and infrastructure.
7. The report suggests a pro-active approach for the region to take on the challenges of a group of small states facing severe resource constraints, eroding trade preferences, declining productivity, and increasing risk of macro instability. First, it argues that greater integration within the CARICOM region on several fronts will be a critical input into improving competitiveness. Easing up further on labor mobility within the region would improve wage and skill arbitrage; joint investment promotion would make the region more attractive for investment; tax harmonization would help reduce harmful tax competition; more cooperation in provision of services and regulation could help to reduce the high costs of government. Second, on trade, the report argues that a negotiation of an orderly dismantling of preferences in return for increased technical and financial support would be in the region’s interest. Third, improving the investment climate and orienting it away from being subsidy-driven, addressing problems of high taxes and inefficient customs procedures, as well as specific infrastructure deficiencies, would help improve the quality of private investment and maintain the high levels of FDI. Fourth, making the public sector more cost-effective and delivering services more efficiently, through greater reliance on the private sector where feasible, and seeking cost efficiencies through regional cooperation, would be necessary to reduce crowding out by Government of private sector employment and investment. Fifth, improving the quality and effectiveness of human resources would enable diversification into knowledge-based activities including services, increase exports, and improve productivity in existing activities.
8. One of the challenges of doing a regional report is the issue of country specificity. During the analysis, it was found that countries were often too heterogeneous to permit easy
xvi
classification into country groupings. Accordingly, some generalized points made in the report for the Caribbean may not be valid for specific countries, even though the individual chapters will try to bring out specificities where possible.
9. The report naturally draws on the extensive research material that already exists in the Caribbean. However, it adds to that body of research and analysis in each of the chapters, including the analysis and projections of growth in a cross-country framework; primary data collection in a foreign investors’ perception survey and a diagnostic of the investment climate in Grenada; new case studies in several services sectors (such as offshore education, health tourism, tourism, temporary labor migration and ICT-enabled services), as well as analysis of firm success stories; new work on labor markets and skill development; case studies of sugar, and SPS standards and Jamaica’s agricultural exports; and a new analysis of infrastructure issues, focusing on efficiency and the quality of institutions. Drawing all these strands together, the report presents a holistic and integrated view of the critical factors that inhibit improved growth. It is hoped that the report will catalyze debate amongst the various stakeholders in society, a process that could help identify bottlenecks, create consensus and, as a result, leverage support for the implementation of reforms. It is also hoped that the report will serve as a tool to help countries develop their own national plans for development, keeping the regional dimension very much in the forefront. Further analytical work is needed, inter alia, on migration and its net impact on society, as well as on inequality and social change and its relationship with economic growth.
Reasonable past growth, but now slowing down
10. Between 1961-2002, average per capita GDP growth for a median Caribbean country was 2.8 percent, higher than Latin America in every decade, but lower than East Asia, especially some of the fast-growing small economies like Singapore and Hong Kong. However, this reasonable growth performance is clouded by several factors.
11. First, average growth has been slowing down in each decade since the 1970s. Average rates of per capita GDP growth in the Caribbean have declined from 4.3 percent in the 1970s, 2.1 percent in the 1980s, to 1.7 percent in the 1990s. Ten Caribbean countries suffered a decline in trend growth after the 1980s, especially the OECS countries of Antigua and Barbuda, Dominica, St. Lucia and St. Vincent and the Grenadines. The Dominican Republic, Guyana, Suriname and Trinidad and Tobago saw increases in trend growth in the 1990s, having suffered major slowdowns in the 1980s.
12. Second, the gap between the rich and poor countries within the region has widened over time, with growth performance varying more widely within the Caribbean than within Latin America. Over 1960-2002, the slowest growing countries in the region were Haiti, Jamaica, Guyana and Suriname, also four of the five poorest in terms of per capita GDP.
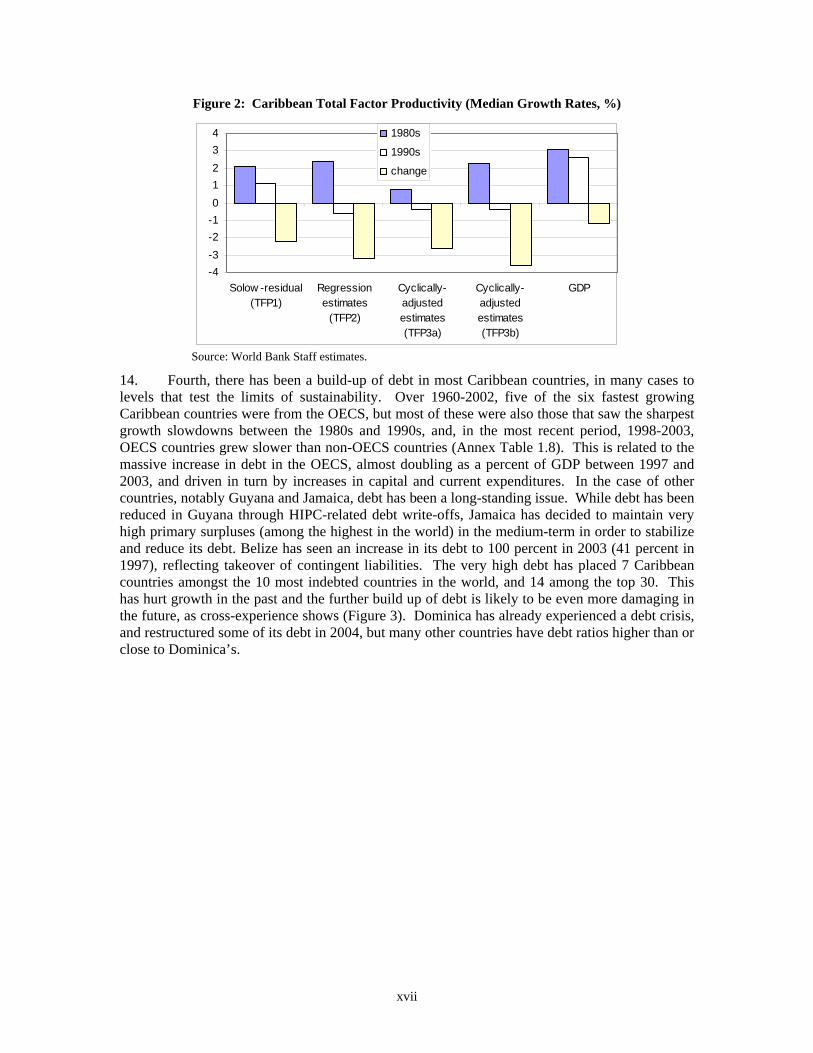
13. Third, there has been a sharp decline in productivity gains between the 1980s and the 1990s, irrespective of methodology employed to measure productivity growth (Figure 2). In fact, after adjustments in the measurement of total factor productivity (TFP) for short-run cyclical fluctuations, the contribution of TFP growth to GDP growth in the 1990s becomes negative (TFP3a and TFP3b in Figure 2) for most countries. After cyclical adjustment, only three countries showed a statistically significant and positive TFP growth in the 1990s—the Dominican Republic, Trinidad and Tobago and Guyana. In the 1980s, on the other hand, most estimates show a significant contribution of productivity gains to growth in the Caribbean. In other words, growth in factor inputs contributed more to economic growth in the 1990s than in the 1980s. This decline in productivity growth in the 1990s is due to several factors—the lower productivity of public investments, especially in the OECS countries, which over-invested after 1997, partly in an attempt to compensate for the decline in private investment; the locking in of investments into traditional, low productivity sectors such as agriculture, in part due to preferences and high tariffs; and the large investments in maturing sectors, namely tourism, where productivity improvements are more difficult to come by, and this applied to most Caribbean countries.
xvii
Figure 2: Caribbean Total Factor Productivity (Median Growth Rates, %)
-4-3-2-101234
Solow -residual(TFP1)
Regressionestimates
(TFP2)
Cyclically-adjustedestimates(TFP3a)
Cyclically-adjustedestimates(TFP3b)
GDP
1980s
1990s
change
Source: World Bank Staff estimates.
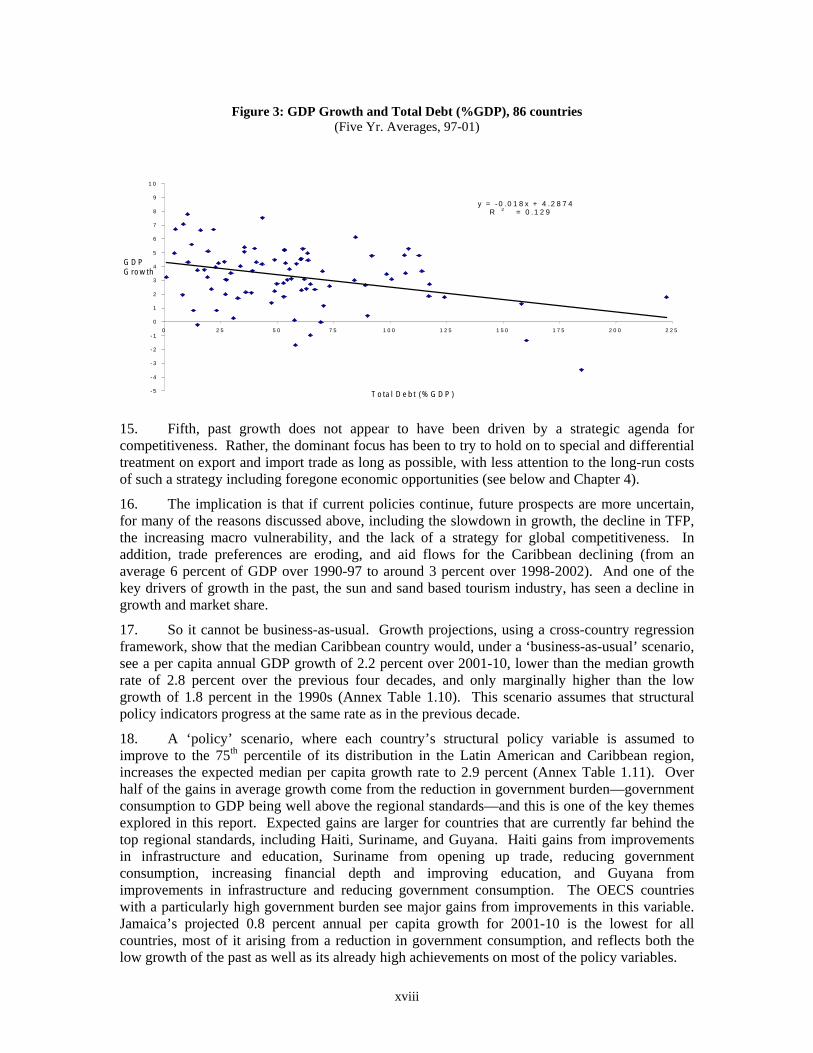
14. Fourth, there has been a build-up of debt in most Caribbean countries, in many cases to levels that test the limits of sustainability. Over 1960-2002, five of the six fastest growing Caribbean countries were from the OECS, but most of these were also those that saw the sharpest growth slowdowns between the 1980s and 1990s, and, in the most recent period, 1998-2003, OECS countries grew slower than non-OECS countries (Annex Table 1.8). This is related to the massive increase in debt in the OECS, almost doubling as a percent of GDP between 1997 and 2003, and driven in turn by increases in capital and current expenditures. In the case of other countries, notably Guyana and Jamaica, debt has been a long-standing issue. While debt has been reduced in Guyana through HIPC-related debt write-offs, Jamaica has decided to maintain very high primary surpluses (among the highest in the world) in the medium-term in order to stabilize and reduce its debt. Belize has seen an increase in its debt to 100 percent in 2003 (41 percent in 1997), reflecting takeover of contingent liabilities. The very high debt has placed 7 Caribbean countries amongst the 10 most indebted countries in the world, and 14 among the top 30. This has hurt growth in the past and the further build up of debt is likely to be even more damaging in the future, as cross-experience shows (Figure 3). Dominica has already experienced a debt crisis, and restructured some of its debt in 2004, but many other countries have debt ratios higher than or close to Dominica’s.
xviii
Figure 3: GDP Growth and Total Debt (%GDP), 86 countries (Five Yr. Averages, 97-01)
y = -0 .0 1 8 x + 4 .2 8 7 4 R 2 = 0 .1 2 9
- 5 - 4 - 3 - 2 - 1 0 1 2 3 4 5 6 7 8 9
1 0
0 2 5 5 0 7 5 1 0 0 1 2 5 1 5 0 1 7 5 2 0 0 2 2 5
T o ta l D e b t ( % G D P )
G D P G ro w th
15. Fifth, past growth does not appear to have been driven by a strategic agenda for competitiveness. Rather, the dominant focus has been to try to hold on to special and differential treatment on export and import trade as long as possible, with less attention to the long-run costs of such a strategy including foregone economic opportunities (see below and Chapter 4).
16. The implication is that if current policies continue, future prospects are more uncertain, for many of the reasons discussed above, including the slowdown in growth, the decline in TFP, the increasing macro vulnerability, and the lack of a strategy for global competitiveness. In addition, trade preferences are eroding, and aid flows for the Caribbean declining (from an average 6 percent of GDP over 1990-97 to around 3 percent over 1998-2002). And one of the key drivers of growth in the past, the sun and sand based tourism industry, has seen a decline in growth and market share.
17. So it cannot be business-as-usual. Growth projections, using a cross-country regression framework, show that the median Caribbean country would, under a ‘business-as-usual’ scenario, see a per capita annual GDP growth of 2.2 percent over 2001-10, lower than the median growth rate of 2.8 percent over the previous four decades, and only marginally higher than the low growth of 1.8 percent in the 1990s (Annex Table 1.10). This scenario assumes that structural policy indicators progress at the same rate as in the previous decade.
18. A ‘policy’ scenario, where each country’s structural policy variable is assumed to improve to the 75th percentile of its distribution in the Latin American and Caribbean region, increases the expected median per capita growth rate to 2.9 percent (Annex Table 1.11). Over half of the gains in average growth come from the reduction in government burden—government consumption to GDP being well above the regional standards—and this is one of the key themes explored in this report. Expected gains are larger for countries that are currently far behind the top regional standards, including Haiti, Suriname, and Guyana. Haiti gains from improvements in infrastructure and education, Suriname from opening up trade, reducing government consumption, increasing financial depth and improving education, and Guyana from improvements in infrastructure and reducing government consumption. The OECS countries with a particularly high government burden see major gains from improvements in this variable. Jamaica’s projected 0.8 percent annual per capita growth for 2001-10 is the lowest for all countries, most of it arising from a reduction in government consumption, and reflects both the low growth of the past as well as its already high achievements on most of the policy variables.
xix
19. Of course, achieving results under the policy scenario would not be easy, and, for countries such as Jamaica, St. Lucia, St. Kitts and Nevis, Trinidad and Tobago, and Dominica, would demand going beyond the standards demanded by the 75th percentile, and also addressing other factors not taken into account in the framework of the above projections (such as crime for Jamaica, educational quality for all, and improving the investment climate in general).
20. Actions under the policy scenario and beyond would be necessary to improve productivity and diversify, which are the only paths to sustainable improvement in growth. The decline in productivity has been documented earlier, and would need to be reversed if growth rates are to improve. Moreover, new areas for efficient and profitable investment would also be required, given the declining productivity in existing activities, and would require, among other things, improvement in the investment climate. The examples of small countries such as Singapore, Cyprus and Ireland show that it is possible to successfully diversify and move up the production chain to higher value-added products. Indeed, this is happening already to an extent in the Caribbean. Offshore education and ICT-enabled activities are areas of potential growth, particularly for English speaking countries. Barbados and, to a lesser extent, Antigua and Barbuda, have gained from offshore business. The Dominican Republic and Trinidad and Tobago have seen some increase in manufacturing activities. Belize has increased exports of shrimps. And many countries are trying to diversify their tourism products, beyond sun-sand-sea related services.
21. This report takes the results from the cross-country growth analysis as a starting point, and then goes beyond this to analyze in detail some of the key factors that could enable productivity improvement and diversification. These include an assessment of government finances and the role of government, the investment climate, the labor market, education and skills, and infrastructure.
Improving government finances and expenditure
22. With Independence in the 1960s, most Caribbean countries sought to play a catalytic role in economic development, which, combined with the dominant development thinking of the times, led to an expanded and interventionist role for Government. Several decades and many problems later, the same Governments began, in the 1990s, to shift to a private sector-led, market-based development strategy, and to reform their public sectors.
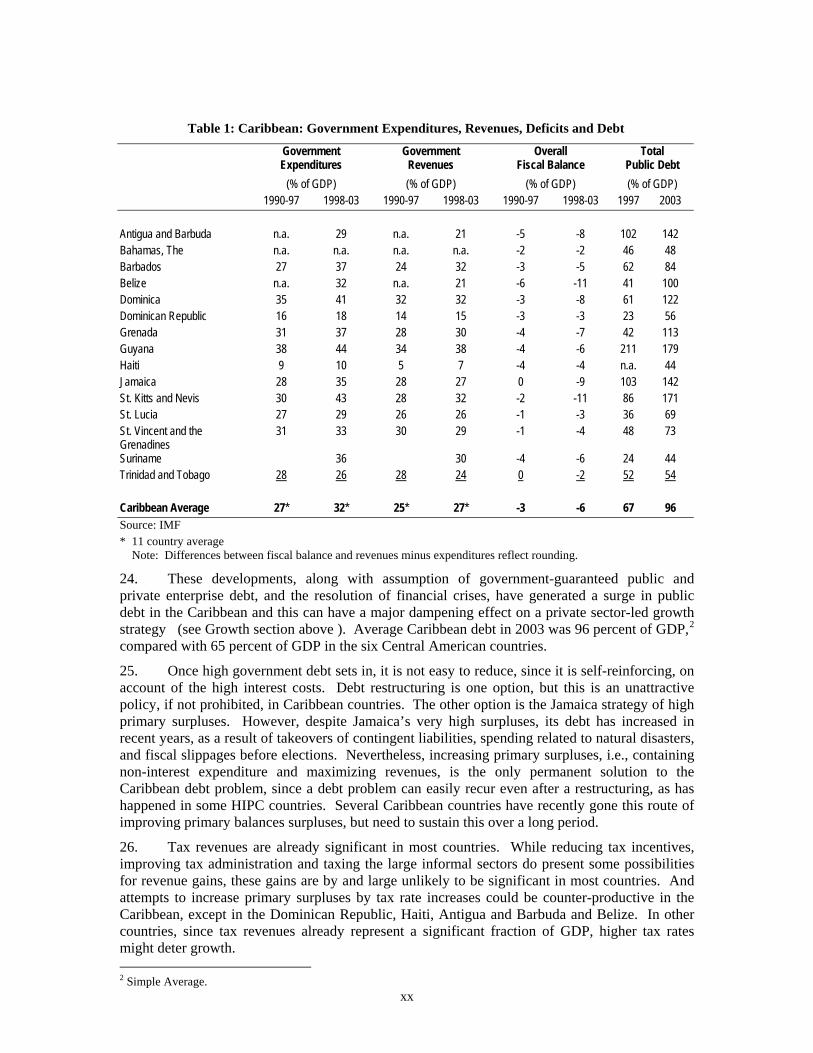
23. However, these intentions were not reflected in outcomes, with government expenditures, as well as taxes and debt, actually rising significantly since the first half of the 1990s. Government spending rose for every country for which there is data, and the average rose from 27 percent of GDP over 1990-97 to 32 percent of GDP over 1998-2003, often in an attempt to use expansionary fiscal policy to address exogenous shocks (Table 1). The increased spending owed to rising wage bills (increase in employment, often accompanied by real wage increases), rising capital spending, especially in most of the OECS countries, and rising interest costs. Revenues rose, but not by as much, and average fiscal deficits in 1998-2003 are about 3 percentage points of GDP worse than in 1990-97.
xx
Table 1: Caribbean: Government Expenditures, Revenues, Deficits and Debt
Government Expenditures
Government Revenues
Overall Fiscal Balance
Total Public Debt
(% of GDP) (% of GDP) (% of GDP) (% of GDP) 1990-97 1998-03 1990-97 1998-03 1990-97 1998-03 1997 2003
Antigua and Barbuda n.a. 29 n.a. 21 -5 -8 102 142 Bahamas, The n.a. n.a. n.a. n.a. -2 -2 46 48 Barbados 27 37 24 32 -3 -5 62 84 Belize n.a. 32 n.a. 21 -6 -11 41 100 Dominica 35 41 32 32 -3 -8 61 122 Dominican Republic 16 18 14 15 -3 -3 23 56 Grenada 31 37 28 30 -4 -7 42 113 Guyana 38 44 34 38 -4 -6 211 179 Haiti 9 10 5 7 -4 -4 n.a. 44 Jamaica 28 35 28 27 0 -9 103 142 St. Kitts and Nevis 30 43 28 32 -2 -11 86 171 St. Lucia 27 29 26 26 -1 -3 36 69 St. Vincent and the Grenadines
31 33 30 29 -1 -4 48 73
Suriname 36 30 -4 -6 24 44 Trinidad and Tobago 28 26 28 24 0 -2 52 54
Caribbean Average 27* 32* 25* 27* -3 -6 67 96 Source: IMF * 11 country average Note: Differences between fiscal balance and revenues minus expenditures reflect rounding.
24. These developments, along with assumption of government-guaranteed public and private enterprise debt, and the resolution of financial crises, have generated a surge in public debt in the Caribbean and this can have a major dampening effect on a private sector-led growth strategy (see Growth section above ). Average Caribbean debt in 2003 was 96 percent of GDP,2 compared with 65 percent of GDP in the six Central American countries.
25. Once high government debt sets in, it is not easy to reduce, since it is self-reinforcing, on account of the high interest costs. Debt restructuring is one option, but this is an unattractive policy, if not prohibited, in Caribbean countries. The other option is the Jamaica strategy of high primary surpluses. However, despite Jamaica’s very high surpluses, its debt has increased in recent years, as a result of takeovers of contingent liabilities, spending related to natural disasters, and fiscal slippages before elections. Nevertheless, increasing primary surpluses, i.e., containing non-interest expenditure and maximizing revenues, is the only permanent solution to the Caribbean debt problem, since a debt problem can easily recur even after a restructuring, as has happened in some HIPC countries. Several Caribbean countries have recently gone this route of improving primary balances surpluses, but need to sustain this over a long period.
26. Tax revenues are already significant in most countries. While reducing tax incentives, improving tax administration and taxing the large informal sectors do present some possibilities for revenue gains, these gains are by and large unlikely to be significant in most countries. And attempts to increase primary surpluses by tax rate increases could be counter-productive in the Caribbean, except in the Dominican Republic, Haiti, Antigua and Barbuda and Belize. In other countries, since tax revenues already represent a significant fraction of GDP, higher tax rates might deter growth. 2 Simple Average.
xxi
27. Thus, reducing government expenditure and improving its efficiency is the key to improving the primary surplus, and hence to a sustainable and stable fiscal situation in the Caribbean. In this context, an examination of the key components of government expenditure can be fruitful.
28. Caribbean governments’ education expenditures are high, an average of almost 5 percent of GDP over 1995-2002, compared with 4 percent for Latin America and the Caribbean, reflecting high per capita incomes, as well as high average governance indices for voice and accountability in the English speaking Caribbean. Also, in most English speaking countries, teachers represent a powerful voting bloc, which helps to push up their salaries and hence government expenditure. While there may be some scale economies of classroom size, this appears to be offset by higher non-teaching costs. Reducing education costs without compromising on quality appears to have more certain payoffs in controlling of teacher salaries, reducing subsidies on tertiary education, and greater reliance on private education (such as the Jamaica voucher scheme). Another possibility of reducing Government net costs is to attract more overseas students for education and training, which would help in spreading fixed costs of expensive laboratory equipment and opening up possibilities of greater specialization in disciplines, as is happening in the case of offshore medical education in Grenada and Dominica (see Chapter 5).
29. Health expenditures, by contrast, are relatively low, averaging 3.2 percent of GDP over 1995-2002 versus 3.6 percent for Latin America and the Caribbean, and 3.7 percent of GDP for Central America. There does not seem to be a satisfactory explanation for the lower expenditure on health, versus that for education; private spending on health also appears relatively low. One way to reduce health costs is to leverage each doctor with a number of interns, and substitute clinics for relatively expensive doctors and hospital care where feasible, but this has been unsuccessful in the region, partly because of the building of hospitals and the development of a “hospital” mentality in patients. In terms of reducing net costs further, the most promising avenue appears to lie in exploiting the possibility of health tourism. While this has already begun, it can be deepened much more, and if done successfully, will enable economies of scale in health education and health provision, and thus have significant positive externalities for the local populations. Within the Caribbean, economies of scale are already being exploited to an extent, such as in the cross-border movements of patients, and in the Eastern Caribbean Pharmaceutical Procurement Services’ bulk buying of drugs, which seems to have reduced costs significantly. Additionally, it may be possible to have regional specialization in the provision of other health services such as lab testing. A common health insurance program across the Caribbean, with competition in service provision, could help to create market-based solutions to issues of scale (with the private sector cooperating and competing as necessary) and to reduce overall health costs.
30. Government capital expenditures have varied significantly over time (in Grenada, for example, from 6.5 percent to 20 percent of GDP in 1995 and 2002) and across countries (from 1.8 percent of GDP for Trinidad and Tobago to 12.2 percent of GDP for Guyana over 1995-2002). This variation reflects lumpiness of public investment projects, attempts at counter-cyclicality, fiscal stabilization programs, and reconstruction costs after natural disasters, but also issues of data comparability across countries. Lumpiness appears to be a particular issue in the smaller countries of the Caribbean, where some countries appear to have ‘invested their way into debt’—so requiring even more than usual care and scrutiny in capital expenditure. In other countries like Jamaica, fiscal stabilization has pared capital expenditure significantly, to the point where it may have begun to have a negative impact on growth. However, Jamaica, like most other countries, does not balk at guaranteeing private or public enterprise debt and incomplete or unsuccessful privatizations have resulted in the frequent takeover of contingent liabilities, the latest example being the re-takeover of Air Jamaica by the Government in December 2004. While privatization in small countries has been particularly challenging, countries should seek to learn from recent
xxii
experience and avoid past mistakes, failing which pressure for such takeovers will persist, and public sector debt continue to grow.
Improving the Investment Climate to enable Efficient Private Sector led Growth is Critical
31. It is well appreciated that efficient and well-directed private investment is the key to sustained growth. The Government provides the ‘investment climate’ that shapes the returns and risks associated with investment. A good investment climate will include political and macro stability, a sound regulatory framework and efficient supporting institutions, and an adequate physical and social infrastructure.
32. In the Caribbean, overall investment rates have been quite high at about 30 percent of GDP since 1990, with private investment at about 20 percent of GDP including FDI at about 6 percent of GDP. In relation to the size of their economies, OECS countries have attracted significant FDI, especially St. Kitts and Nevis, Grenada, and St. Vincent and the Grenadines (Figure 4), as well as Guyana. Dollar inflows have been high in the largest economies of Jamaica, the Dominican Republic and Trinidad and Tobago. In terms of distribution, FDI has been concentrated in a few natural resource-related sectors, especially tourism, mineral extraction and segments within agriculture, indicating that as of now, the Caribbean possesses only a few competitive sectors. Investment in the Caribbean has been associated with reasonable but declining growth rates, which would point to declining productivity, which is indeed the case.
Figure 4: FDI to GDP Ratios in the Caribbean, 1980-2002
-10.0
-5.0
0.0
5.0
10.0
15.0
20.0
25.0
30.0
Antig
ua a
nd B
arbu
da
Barb
ados
Beliz
e
Dom
inica
Dom
inica
n Re
publi
c
Gren
ada
Guya
na Haiti
Jam
aica
St. K
itts
and
Nevis
St. L
ucia
St. V
incen
t and
the
Gren
adine
sSu
rinam
e
Trini
dad
and
Toba
go
Carib
(sim
ple a
vg.)
1980s 1990s 2000-2
Source: International Finance Statistics, IMF.
33. The future holds out more challenges, as indicated above. With preferences eroding, traditional industries such as tourism reaching a mature phase, and the environment in general becoming more competitive, private returns to investment will decline, with corresponding reduction in the incentive to invest. Moreover, even though the Caribbean still attracts a disproportionate share of world FDI, this share has been falling since the 1990s (its FDI to GDP ratio was 3.7 times the world average over 1990-94, but had fallen to 1.9 times over 2000-02). FDI in the Caribbean may be subjected to even greater pressure given the global decline in FDI and increased global competition for investment.
34. The challenge will thus be to maintain private investment rates and even increase them as in East Asia, for example in Singapore and Hong Kong in their high growth phase, and to make this investment more productive. In addition, falling productivity in traditional areas of investment will require investment diversification. It is important, therefore, that the investment climate improve in order to respond to these challenges, giving the right signals, encouraging
xxiii
productivity improvement and some investment in non-traditional areas including business and professional services, niche manufacturing and new segments in tourism.
35. A 2004 World Bank survey of 159 firms shows that foreign investors in the Caribbean perceive most components of the investment climate as very important to their investment decisions, but pay particular attention to infrastructure, labor and the policy and legal environment (Figure 5). The survey also indicates that the performance ratings under infrastructure, policy and legal environment, and taxation and customs, in particular, do not meet the investors’ expectations. Within each category, there are some sub-components which are of critical or major importance to firms. Some of these factors include political/regime stability, exchange rate stability, laws and regulations, attitude towards FDI, labor productivity, cost and availability of skilled labor, tax rates, telecommunications, power supply, shipping and ports.
Figure 5: Ratings of the Investment Climate in the Caribbean
3 3.5 4 4.5
Quality of Life
Infrastructure
Taxation and Customs
Administ rat ive Procedures
Labor
M arket Access
FDI Framework
Policy & Legal Environment
Importance
Performance
Note: Importance rating scale: 3 = moderate importance, 4 = major importance, 5 = critical importance; Performance rating scale: 3 = neutral, 4 = good, 5 = excellent
36. Firms in different businesses, however, attach varying degrees of importance to the various factors affecting investment climate (Annex Table 3.1). As manufacturing firms tend to be more export-oriented, they are concerned about exchange rate stability and shipping services and ports, but less about access to land or anti-monopoly practices. Services sector firms, on the other hand, because they are more geared towards the local market, tend to focus on political and regime stability and local market size, but less on the availability of unskilled labor.
37. The survey also identified country-specific issues on perceived performance of the investment climate categories, for five Caribbean countries. Barbados is considered strong on the policy and legal environment, the FDI framework, and reliable utilities, but, with its high tax rates and weak tax administration, relatively poor on taxation and customs. The Dominican Republic is perceived positively on account of its low cost and readily available pool of skilled and unskilled labor, advanced telecommunications, good and widespread shipping facilities, but negatively for its unreliable electricity supply and exchange rate instability. Grenada is perceived positively on account of the availability of unskilled labor, and a good power supply, but negatively on availability of technical and managerial skills, high tax rates and import tariffs, and complicated customs clearance procedures. Jamaica’s perceived strengths include telecommunications, a network of airports and seaports, access to skilled and unskilled labor, and weaknesses include low labor productivity, and high costs of crime. Trinidad and Tobago enjoys macroeconomic stability and abundant power supply, but suffers from high crime (especially targeted to business) and anti-competitive practices arising from a still significant public enterprise sector.
xxiv
38. In order to help improve productivity and encourage diversification, specific aspects of the investment climate need to be strengthened, many of which are analyzed in the report in detail. Some of the important policy initiatives could include addressing the identified constraints including high corporate income tax rates, inefficient customs clearances, shortages of skills in some countries (an increasingly important issue for a knowledge-based production structure), low labor productivity, and some aspects of infrastructure.
39. The added challenge for the Caribbean countries is dealing with the issue of small market size, which has only been partially overcome by the very open nature of these economies. Accelerating trade integration in the CSME will help to increase ‘domestic’ market size, and moving as quickly as possible towards free movement of labor within the region will ease labor and skills shortages. Single visa and work permits for foreign nationals valid in all Caribbean countries will improve incentives for multi-country investment. Joint promotion by a regional investment promotion center to engage in image-building, provide information and aim to standardize procedures across the region could help attract investment.
40. The focus needs to shift from a subsidy-driven policy to one that provides a conducive investment climate for all potential investors. In this context, the region should seek to reduce and eliminate the damaging tax competition between countries that currently prevails, by implementing tax harmonization. In any case, the scope for tax incentives would be constrained by prospective revenue losses arising from possible future tariff liberalization.
The International Environment presents Challenges as well as Opportunities
41. Adjusting to the changing international trading environment is perhaps the most fundamental immediate challenge for the Caribbean. Trade preferences are being eroded, tariff revenues are facing the prospect of decline, and, perhaps most damning of all, competitiveness is declining. Reversing the decline in competitiveness will not be easy, and will require tackling, among other things, and in varying degrees in different countries, the fiscal deterioration and associated instability, high and often rising wages, and inadequate skill formation and technology absorption. At the same time, there are also some increasing opportunities, especially in services, which the Caribbean could exploit if some of the above challenges are addressed and the investment climate improved.
42. While remaining very open, trade to GDP in the Caribbean has declined from an average of 135 percent to 118 percent of GDP over 1990-2001, with Trinidad and Tobago, Grenada, Haiti and Belize being exceptions to this trend. Much of the reason for this could be traced to the real appreciation in the currencies over the 1990s, which leads to lower valuation of imports and exports relative to GDP. Trade patterns have changed somewhat since 1990. Merchandise exports fell from 52 to 45 percent of total exports of goods and services between 1990 and 2001, while services rose correspondingly. Owing to CARICOM trade preferences, intra-regional exports rose from 13 to 20 percent of total exports over the decade of the 1990s.
43. Several indicators suggest that there has been a decline in competitiveness of the Caribbean countries since 1990, particularly in goods trade and in the CARICOM group. CARICOM’s market share in merchandise imports of NAFTA fell from 0.71 percent in 1985 to 0.27 percent in 2000, and EU market share fell as well. Even in tourism, the most dynamic export segment, CARICOM’s market share in share of international tourist arrivals declined from 0.91 percent in 1990 to 0.69 percent in 2002. The Hispanic Caribbean, the Dominican Republic and Cuba, gained in tourism, partly at CARICOM’s expense. Compared to the 1980s, export growth rates of services as well as goods declined over 1991-2002. The current account deteriorated alarmingly for most countries except for the oil producing Trinidad and Tobago over the period, partly a reflection of the increased fiscal imbalances as well as the appreciation of real exchange rates. In fact, for nearly all countries, the REER appreciated in the 1990s. It started to reverse in 2002, and had reached 1990 levels for most countries by 2003, excepting Jamaica, Haiti and Suriname. The appreciation in the currencies can be traced to the large capital inflows
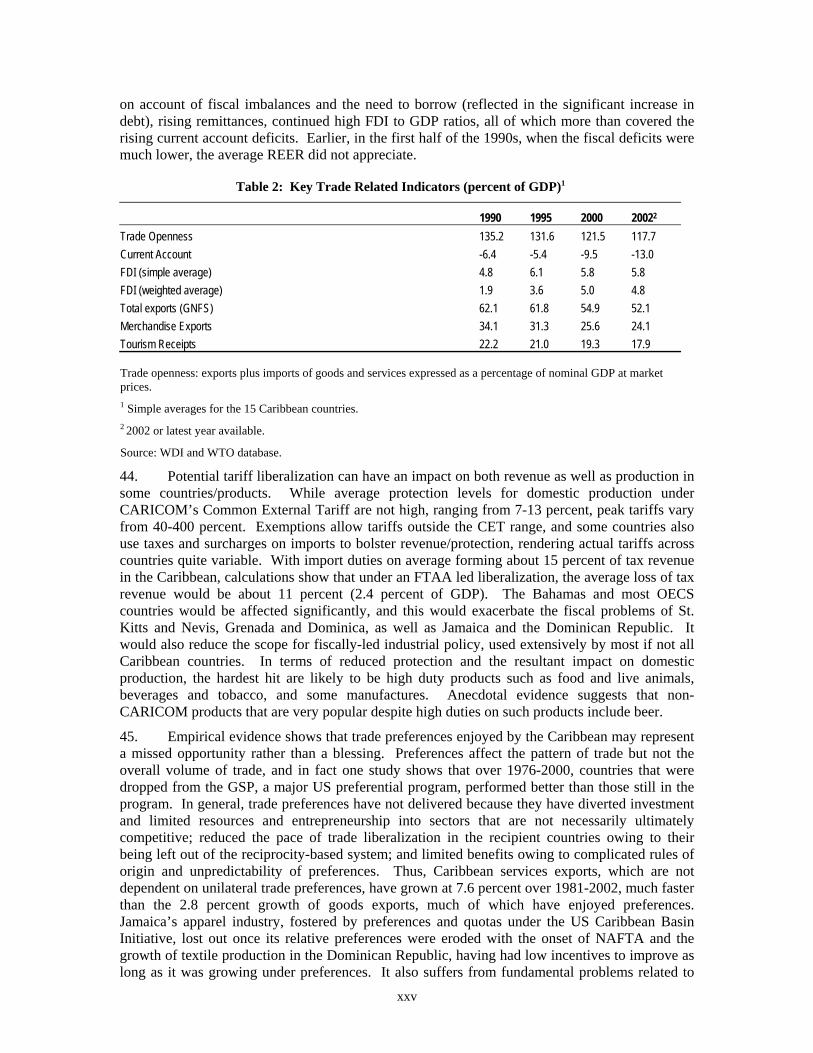
xxv
on account of fiscal imbalances and the need to borrow (reflected in the significant increase in debt), rising remittances, continued high FDI to GDP ratios, all of which more than covered the rising current account deficits. Earlier, in the first half of the 1990s, when the fiscal deficits were much lower, the average REER did not appreciate.
Table 2: Key Trade Related Indicators (percent of GDP)1
1990 1995 2000 20022 Trade Openness 135.2 131.6 121.5 117.7 Current Account -6.4 -5.4 -9.5 -13.0 FDI (simple average) 4.8 6.1 5.8 5.8 FDI (weighted average) 1.9 3.6 5.0 4.8 Total exports (GNFS) 62.1 61.8 54.9 52.1 Merchandise Exports 34.1 31.3 25.6 24.1 Tourism Receipts 22.2 21.0 19.3 17.9 Trade openness: exports plus imports of goods and services expressed as a percentage of nominal GDP at market prices. 1 Simple averages for the 15 Caribbean countries. 2 2002 or latest year available.
Source: WDI and WTO database.
44. Potential tariff liberalization can have an impact on both revenue as well as production in some countries/products. While average protection levels for domestic production under CARICOM’s Common External Tariff are not high, ranging from 7-13 percent, peak tariffs vary from 40-400 percent. Exemptions allow tariffs outside the CET range, and some countries also use taxes and surcharges on imports to bolster revenue/protection, rendering actual tariffs across countries quite variable. With import duties on average forming about 15 percent of tax revenue in the Caribbean, calculations show that under an FTAA led liberalization, the average loss of tax revenue would be about 11 percent (2.4 percent of GDP). The Bahamas and most OECS countries would be affected significantly, and this would exacerbate the fiscal problems of St. Kitts and Nevis, Grenada and Dominica, as well as Jamaica and the Dominican Republic. It would also reduce the scope for fiscally-led industrial policy, used extensively by most if not all Caribbean countries. In terms of reduced protection and the resultant impact on domestic production, the hardest hit are likely to be high duty products such as food and live animals, beverages and tobacco, and some manufactures. Anecdotal evidence suggests that non-CARICOM products that are very popular despite high duties on such products include beer.
45. Empirical evidence shows that trade preferences enjoyed by the Caribbean may represent a missed opportunity rather than a blessing. Preferences affect the pattern of trade but not the overall volume of trade, and in fact one study shows that over 1976-2000, countries that were dropped from the GSP, a major US preferential program, performed better than those still in the program. In general, trade preferences have not delivered because they have diverted investment and limited resources and entrepreneurship into sectors that are not necessarily ultimately competitive; reduced the pace of trade liberalization in the recipient countries owing to their being left out of the reciprocity-based system; and limited benefits owing to complicated rules of origin and unpredictability of preferences. Thus, Caribbean services exports, which are not dependent on unilateral trade preferences, have grown at 7.6 percent over 1981-2002, much faster than the 2.8 percent growth of goods exports, much of which have enjoyed preferences. Jamaica’s apparel industry, fostered by preferences and quotas under the US Caribbean Basin Initiative, lost out once its relative preferences were eroded with the onset of NAFTA and the growth of textile production in the Dominican Republic, having had low incentives to improve as long as it was growing under preferences. It also suffers from fundamental problems related to
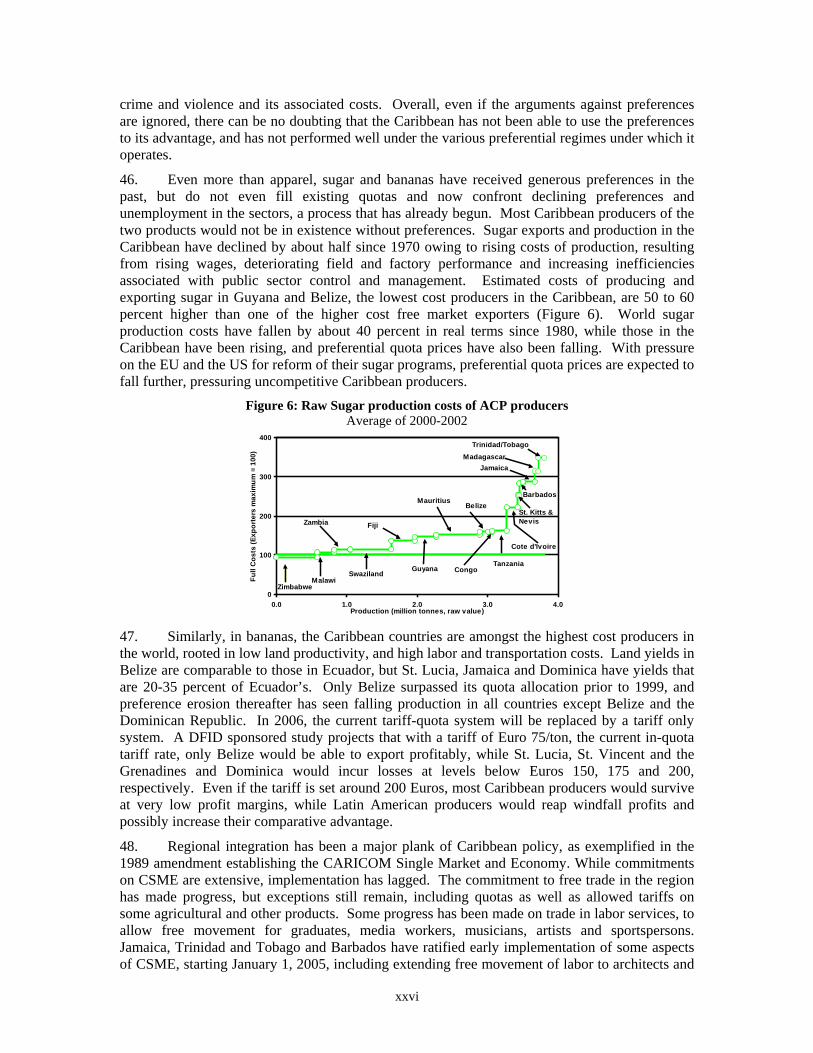
xxvi
crime and violence and its associated costs. Overall, even if the arguments against preferences are ignored, there can be no doubting that the Caribbean has not been able to use the preferences to its advantage, and has not performed well under the various preferential regimes under which it operates.
46. Even more than apparel, sugar and bananas have received generous preferences in the past, but do not even fill existing quotas and now confront declining preferences and unemployment in the sectors, a process that has already begun. Most Caribbean producers of the two products would not be in existence without preferences. Sugar exports and production in the Caribbean have declined by about half since 1970 owing to rising costs of production, resulting from rising wages, deteriorating field and factory performance and increasing inefficiencies associated with public sector control and management. Estimated costs of producing and exporting sugar in Guyana and Belize, the lowest cost producers in the Caribbean, are 50 to 60 percent higher than one of the higher cost free market exporters (Figure 6). World sugar production costs have fallen by about 40 percent in real terms since 1980, while those in the Caribbean have been rising, and preferential quota prices have also been falling. With pressure on the EU and the US for reform of their sugar programs, preferential quota prices are expected to fall further, pressuring uncompetitive Caribbean producers.
Figure 6: Raw Sugar production costs of ACP producers Average of 2000-2002
0
100
200
300
400
0.0 1.0 2.0 3.0 4.0Production (million tonnes, raw value)
Full
Cos
ts (E
xpor
ters
max
imum
= 1
00)
Zambia
MalawiSwaziland
Fiji
CongoGuyana
Belize
Tanzania
Mauritius
Cote d'Ivoire
Madagascar
St. Kitts & Nevis
Jamaica
Barbados
Trinidad/Tobago
Zimbabwe
47. Similarly, in bananas, the Caribbean countries are amongst the highest cost producers in the world, rooted in low land productivity, and high labor and transportation costs. Land yields in Belize are comparable to those in Ecuador, but St. Lucia, Jamaica and Dominica have yields that are 20-35 percent of Ecuador’s. Only Belize surpassed its quota allocation prior to 1999, and preference erosion thereafter has seen falling production in all countries except Belize and the Dominican Republic. In 2006, the current tariff-quota system will be replaced by a tariff only system. A DFID sponsored study projects that with a tariff of Euro 75/ton, the current in-quota tariff rate, only Belize would be able to export profitably, while St. Lucia, St. Vincent and the Grenadines and Dominica would incur losses at levels below Euros 150, 175 and 200, respectively. Even if the tariff is set around 200 Euros, most Caribbean producers would survive at very low profit margins, while Latin American producers would reap windfall profits and possibly increase their comparative advantage.
48. Regional integration has been a major plank of Caribbean policy, as exemplified in the 1989 amendment establishing the CARICOM Single Market and Economy. While commitments on CSME are extensive, implementation has lagged. The commitment to free trade in the region has made progress, but exceptions still remain, including quotas as well as allowed tariffs on some agricultural and other products. Some progress has been made on trade in labor services, to allow free movement for graduates, media workers, musicians, artists and sportspersons. Jamaica, Trinidad and Tobago and Barbados have ratified early implementation of some aspects of CSME, starting January 1, 2005, including extending free movement of labor to architects and
xxvii
engineers. The full CSME is scheduled to come on stream in 2008, with the eventual goal of complete dismantling of restrictions on labor movement within CARICOM.
49. This report suggests a recognition that preferences will not survive in the medium-term, and hence urges a pro-active vision for preference reduction, a phased decline in the external tariffs to reduce trade diversion, and use of the FTAA as a stepping stone to multilateral liberalization:
a) Unilateral preferences: Given the unclear long-term effects of unilateral preferences, and the fact that preferences will eventually not exist, the region could pre-empt the future erosion of preferences by negotiating an orderly dismantling of preferences in return for enhanced technical and financial assistance. This would be the Caribbean’s pro-active trade agenda, and its own version of a new type of special and differential treatment.
b) CSME: Integration within CARICOM suffers from possibly large trade diversion, owing to still relatively high external tariffs on many products. To improve benefits from CSME’s trade agenda, the Common External Tariff (CET) could be lowered further, towards the goal of low and uniform duties, and remaining quantitative restrictions be removed. Other aspects of CSME could impart economies of scale and should be pursued with vigor, especially labor, investment promotion, and training.
c) FTAA or EPA: As above, favorable market access i.e. preferences, is likely to lead to only transient gains (in any case more likely in services, since goods trade already enjoys significant preferences), and there are likely trade diversion costs of granting favorable access, in this case possibly excluding competitive producers from Asia. However, since the CSME already exists, and diverts trade, the FTAA or EPA producers will compete with and substitute some less efficient CSME producers, which would mean net trade creation. To the extent that the CET is reduced (unilaterally or multilaterally), the remaining trade diversion may be reduced further. The latter action would of course mean further erosion of customs revenue, which will require remedial action.
d) WTO: The logic of the above means that in the longer-term, the most abiding gains for the Caribbean are likely to come from reduction of its external tariffs. Under multilateral liberalization, i.e., under the WTO, this could also mean some enhanced market access for all countries. It is important, of course, to recognize that the Caribbean’s small size reduces the scope for reciprocity-based negotiations. In these conditions, domestic reforms should not be allowed to depend on successful international negotiations. In any case, the unilateral reduction of tariffs would help to reduce the costs of trade diversion that may result from the conclusion of regional preferential arrangements.
50. Policy options in other trade-related areas include the need to address revenue losses stemming from prospective tariff liberalization by taking action to set in place VAT or other domestic tax systems, and also reducing incentive-based industrial policy. The likely impact of this reduced protection on domestic agriculture and manufacturing will need to be handled by strengthening social protection, training, and improving the investment climate to encourage investment and redeployment. The sugar industry could be privatized or closed down, or general enabling conditions established that encourage diversification out of sugar into fresh fruits, vegetables, meat or dairy products, as has been done in Jamaica to some extent. In manufacturing such as apparel in the Dominican Republic, some high-value products could survive the dismantling of the MFA, especially where timeliness and hence location is important. Here, improving logistics and customs procedures, factors also identified as obstacles in investor perception surveys, will help impart an edge. Improvements in the investment climate to encourage diversification (such as better quality of education and training) will help new (niche) exporting sectors to emerge. Accelerated implementation of the CSME, especially in those aspects related to trade, labor, FDI, capital mobility and regional standards will make the Caribbean a more attractive investment destination. Improved market access in trade negotiations
xxviii
should seek to focus on services, especially on easing of restrictions on temporary movement of labor, such as has occurred between the Caribbean and Canada. Bilateral agreements on temporary migration offer an alternative means to realize the gains from labor mobility without suffering either the costs of brain drain or foreign hostility to permanent migration. Finally, trade negotiations are likely to be more successful if the region speaks up with one voice, and the Regional Negotiating Machinery should be empowered to negotiate on behalf of CARICOM at all regional and multilateral forums. For many of the above issues, the region may need significant time for transition, but it would be useful if, as in the MFA, it agrees to a time-bound program for phase-out of preferences and duty reduction.
Emerging Opportunities, especially in Services
51. While there are several areas of manufacturing and agriculture in the Caribbean that are not competitive and will find it hard to compete in a more open market regime, small economies can be competitive in many services sectors and, indeed, in niche manufacturing. The examples of Ireland and Singapore present dramatic illustrations of the possibilities. This report explores illustrative case studies of ICT-enabled products and services, higher-end tourism, offshore education, and health services. As the case studies demonstrate, success in moving to higher-end services (which is where the possibilities lie, given that high wages rule out competitiveness in lower-end areas such as call centers and tele-marketing) requires high skill levels, and underscores the emphasis in the report on improving the quality and cost effectiveness of human resources. Given the potential of the services sector, Caribbean governments could consider investors’ priorities as a way to prioritize their own policy actions to improve the investment climate. It is worth pointing out that this is different from picking winners, since it only creates an enabling environment that may allow investment in certain services sectors in the Caribbean. For example, telecommunications is usually a top priority if a country sees potential in ICT-enabled services and in medical services (see Annex Table 3.1), and would point to the need to bring telecom facilities up to the requisite cost and quality standards. This would, of course, help all business, since telecom is a key aspect of infrastructure.
52. The effective use of ICT is an essential ingredient for attaining competitiveness in both services and niche manufacturing sectors in the Caribbean. Amongst Caribbean services exporters, there are many examples of firms that have utilized ICT to cut costs, improve communications with customers, improve logistics, overcome distance and understand their competitive positioning. Unique Jamaica, a cluster of 100 small hoteliers and attractions, used ICT to launch a cost effective marketing campaign devised to attract higher-end adventure/nature tourists. SM Jaleel – a soft drink company in Trinidad and Tobago– identified an untapped market among children and has built a global brand, “Chubby”, now sold in major US retailers. In order to foster an environment for greater and more effective use of ICT, Caribbean policymakers would need to facilitate access and create a more competitive telecommunications sector (including addressing the problem of high internet costs), upgrade human resources, provide support services for firms, and accelerate regional harmonization in key policy areas related to ICT.
53. Growth in tourism has slowed over the last decade, owing to the maturing of the region’s sun, sea and sand product. However, growing demand in new product areas such as adventure and cultural tourism provides an opportunity for the region to revitalize the tourism sector and move into areas that could deepen linkages with the rest of the economy. Already, there are several success stories in these new niches, including St. Lucia’s Jazz Festival, Dominica’s Creole Festival, and Barbados’ upscale resort Sandy Lane. Success in these new areas requires that Caribbean governments improve the investment climate (including addressing the issue of crime in some countries) by managing and marketing the sector more effectively (with a key role for a regional investment promotion strategy), improving destination and product quality, and addressing skill deficiencies. Careful management of the environment is, of course, paramount to achieving and maintaining competitiveness in both new and old product areas. Governments
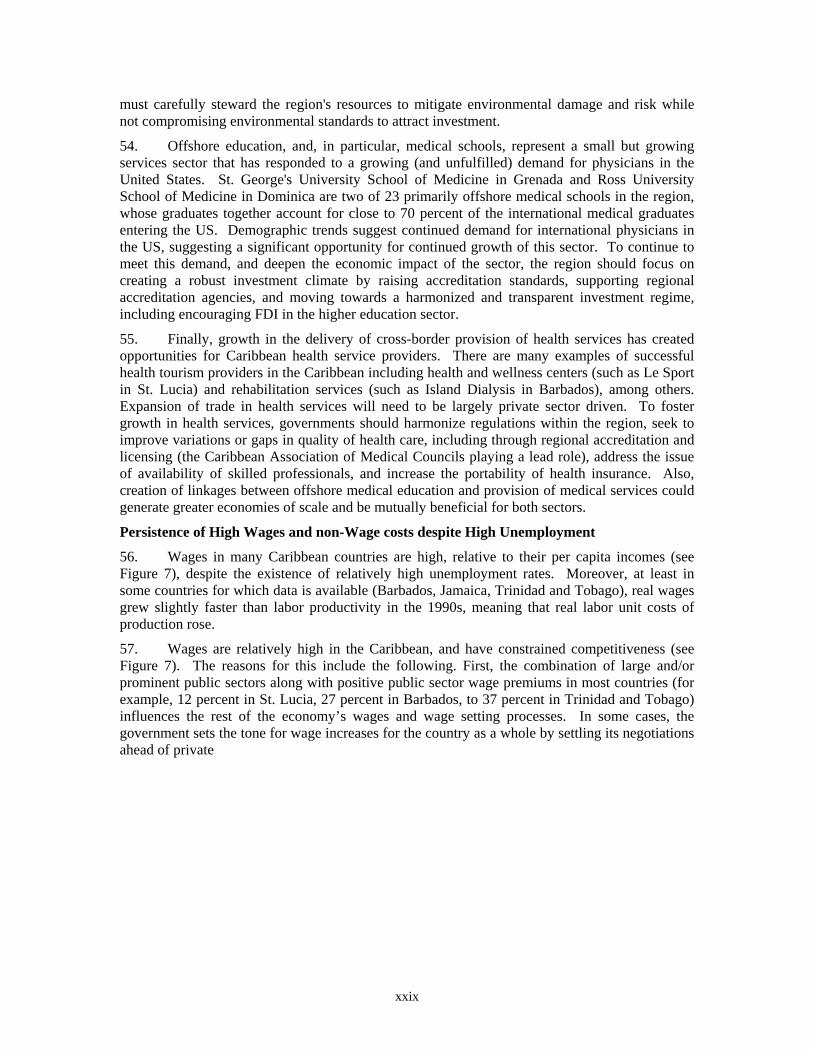
xxix
must carefully steward the region's resources to mitigate environmental damage and risk while not compromising environmental standards to attract investment.
54. Offshore education, and, in particular, medical schools, represent a small but growing services sector that has responded to a growing (and unfulfilled) demand for physicians in the United States. St. George's University School of Medicine in Grenada and Ross University School of Medicine in Dominica are two of 23 primarily offshore medical schools in the region, whose graduates together account for close to 70 percent of the international medical graduates entering the US. Demographic trends suggest continued demand for international physicians in the US, suggesting a significant opportunity for continued growth of this sector. To continue to meet this demand, and deepen the economic impact of the sector, the region should focus on creating a robust investment climate by raising accreditation standards, supporting regional accreditation agencies, and moving towards a harmonized and transparent investment regime, including encouraging FDI in the higher education sector.
55. Finally, growth in the delivery of cross-border provision of health services has created opportunities for Caribbean health service providers. There are many examples of successful health tourism providers in the Caribbean including health and wellness centers (such as Le Sport in St. Lucia) and rehabilitation services (such as Island Dialysis in Barbados), among others. Expansion of trade in health services will need to be largely private sector driven. To foster growth in health services, governments should harmonize regulations within the region, seek to improve variations or gaps in quality of health care, including through regional accreditation and licensing (the Caribbean Association of Medical Councils playing a lead role), address the issue of availability of skilled professionals, and increase the portability of health insurance. Also, creation of linkages between offshore medical education and provision of medical services could generate greater economies of scale and be mutually beneficial for both sectors.
Persistence of High Wages and non-Wage costs despite High Unemployment
56. Wages in many Caribbean countries are high, relative to their per capita incomes (see Figure 7), despite the existence of relatively high unemployment rates. Moreover, at least in some countries for which data is available (Barbados, Jamaica, Trinidad and Tobago), real wages grew slightly faster than labor productivity in the 1990s, meaning that real labor unit costs of production rose.
57. Wages are relatively high in the Caribbean, and have constrained competitiveness (see Figure 7). The reasons for this include the following. First, the combination of large and/or prominent public sectors along with positive public sector wage premiums in most countries (for example, 12 percent in St. Lucia, 27 percent in Barbados, to 37 percent in Trinidad and Tobago) influences the rest of the economy’s wages and wage setting processes. In some cases, the government sets the tone for wage increases for the country as a whole by settling its negotiations ahead of private
xxx
Figure 7: Qualified Teacher Salary in State School (annual $)
Source: Commonwealth/UNCTAD Small States Business Cost Survey (2002).
enterprises. Second, many governments legislate either sectoral or national minimum wages, which can be quite high relative to average wages and which typically take account of price changes rather than poverty levels. Both these factors effectively reinforce inflation rather than tying wage increases to productivity gains. Third, high remittances as well as high migration to other countries within the Caribbean as well as outside increase the reservation wage.
58. Significant non-wage costs also distort the labor market and render it less competitive. While Caribbean countries show a lower index of labor market rigidity than those in Latin America, the large and in many cases growing informal sector shows that the enforcement may be more rigid. Also, even though declining in importance, unions are politically powerful, and can affect labor relations and wage-setting, which also creates incentives amongst employers to create informal employment. Moreover, despite some decline over the last decade, unemployment rates in most countries except the Dominican Republic and St. Kitts and Nevis tend to be high, which implies the existence of rigidities that prevent unemployment from falling to ‘frictional’ levels, and keep formal sector wages high.
59. Migration has been a key influence on the evolution of the labor market in the Caribbean. The education level of migrants to the US, UK and Canada tends to be high, much higher than the average in the country of origin, which means there is a loss of skills; opportunities for migration as well as remittances also increase the reservation wage. However, migration increases the demand for education in the sending country. To the extent that migrants return, migration also facilitates skill and human capital accumulation, and there is some migration for tertiary education itself. Remittances finance schooling and investment, as well as consumption of goods. And the Caribbean expatriate community makes significant non-financial contributions that increase Caribbean competitiveness, such as through technology and knowledge transfer, FDI and other financial flows, and market contacts (which helps niche trade development). Further, intra-Caribbean migration has helped to reduce shortages of both skilled as well as unskilled labor, with Trinidad and Tobago hosting over one-third of the intra-Caribbean migrant population (excluding the Dominican Republic). Haitian migration to the Dominican Republic has helped to keep its labor costs down and allows it to compete internationally in textiles and other labor intensive products. Thus, while the net welfare impact of Caribbean migration is difficult to assess, policy should seek to reduce the costs of the brain drain by increasing fees for higher education scholarships; improve linkages with and the flow of benefits from overseas residents; encourage further reduction in the cost of transferring remittances; better leverage remittances for investment purposes; and accelerate wage and skill arbitrage through faster implementation of the CSME.
0
5000
10000
15000
20000
25000
0 5000 10000 15000 20000GDP per capita (US$)
Teac
hers
sal
ary
(ann
ual,
US$
)
WorldCaribbeanLinear (World)
xxxi
60. Persistently high unemployment is a particular cause for concern. Employment growth slowed down in most countries in the 1990s, and was concurrent with the slowdown in output growth, and there is evidence for a few countries showing the elasticity of employment varying between 0.22 and 1.1 during 1970-2001. High levels of open urban unemployment prevail in the larger countries while rural unemployment and underemployment exist in the OECS. Apart from weak aggregate demand arising from weak growth performance in the 1990s, high unemployment reflects the disconnect between education curricula and skills demanded in the private sector, exacerbated by the contraction in agriculture and manufacturing and the shift towards services. In addition, there are those who choose to remain unemployed, which happens when a household member receives remittances or for the time that people queue up for public sector jobs. The characteristics of the unemployed are similar across the region. The unemployed tend to be young, disproportionately female, and poorly educated. While lower than that of females, unemployment of young males is still very high, and is related to significant social problems such as crime and drug trafficking and addiction. Youth aged 15-24 account for 40-56 percent of the total unemployed pool. Unemployment tends to be low or non-existent among those with tertiary level education (except in the Dominican Republic), reflecting the scarcity of skilled labor.
61. Addressing the fundamental weaknesses in the labor market will help improve competitiveness, exports and aggregate demand, and also increase employment, a key factor in reducing poverty and improving the quality of life. Reform in public sector compensation policies, aligning them more closely with merit and productivity criteria, thereby reducing the public sector wage premium, will help reduce distortions in the labor market. In many countries, the increasing size of public employment—effectively a job creation program to offset the high wages that it has created—has crowded out private employers, and reorienting the public sector (see above) will also help private employers to get hold of skilled/productive employees. Moreover, while the rigidities of the labor market are not insurmountable, they create non-wage labor costs that reduce labor demand. Modernizing labor regulations to increase employers’ flexibility will be beneficial to workers in the medium and long run and should also help to increase the share of formal employment. While intra-regional migration has helped to address some of the shortages of skilled and unskilled labor, efforts to achieve a single Caribbean labor market will help further improve the competitiveness of the region as a whole, and should be accelerated. To benefit fully from this process, countries in the region should plan to address skill shortages and skill upgrading issues on a regional basis—i.e., it should be an ex-ante process rather than an ex-post one that only allows people to work in other countries. (Jamaica, Barbados and Trinidad and Tobago have recently enacted legislation to expand labor market integration to include architects and engineers, see Section on Trade). In terms of migration of skilled labor to OECD countries, the region could explore the possibility of cost sharing for education/training with the recipient country. It could also push for more liberal treatment for temporary labor movement, which reduces the permanent loss of skills from the host country, and is likely to encounter less hostility from the receiving country.
Renewed Focus needed on Education and Skill Development
62. The skill endowments of the labor force are indispensable for learning, technology absorption, productivity improvement, diversification and overall competitiveness. However, this relationship is long-term, which is why the early Caribbean emphasis on education paid off for many decades thereafter—for example, as of 2000, enrollment in primary education was universal in all countries except Haiti, even though universal completion was yet to be achieved in five countries. With the recent weakening of the traditional sources of growth, and given that wages are high, companies need to move up the value chain and into niche market segments, making the need for a skilled labor force paramount. This is also attested to by the fact that investors have cited skill availability to be a critical factor in their investment decisions. However, concerns are now being raised regarding the quantity as well as quality of skills available in many countries in the Caribbean, which requires an urgent redress in order to
xxxii
improve long-term growth prospects. At the same time, the redress must deal with the migration of trained employees, else education and skill development by Caribbean countries will largely end up as a subsidy for industrial countries.
63. Many countries in the Caribbean have lost their initial momentum in the build-up of skills, which has serious implications for technology absorption and competitiveness. On average, the adult population in six Caribbean countries (excluding the OECS) increased their average years of schooling (a proxy for the stock of skills in the labor force) from 4.8 years in 1980 to 6 years in 2000, with the Latin American average rose from 4.9 to 6.3 years, and the world average from 5.1 to 6.5 years. The Caribbean countries’ average ranking declined from 47 out of 92 countries in 1970 and 1980, to 48 in 1990 and 52 in 2000. Figures for Barbados and Trinidad and Tobago are well above average, while those for the Dominican Republic and Haiti are below average. Given their slow growth rates in the average years of schooling in the adult population, it could take Jamaica 120 years and the Dominican Republic 154 years to catch up with the current level of the US. Similar indications are provided by data on secondary enrollment, wherein in 1980 the Caribbean average enrollment for 7 countries was 56 percent versus 42 percent for Latin America, but by 2000 the averages were 75 and 69 percent respectively. Based on earlier trends, these enrollment rates (and implicitly lower completion rates in the Caribbean) are expected to lead to further decline in the world education ranking of the sample of Caribbean countries. Partly, of course, the figures on stock of skills reflect not just the educational system in the Caribbean, but the migration of the most educated and skilled out of the country.
64. Of even greater concern than the quantity of skills is the quality of education. Educational quality affects both individual returns as well as the growth rate of the economy. A study based on 1990 US census data found that returns to education for migrants from Caribbean countries were 2.9 percent, versus an average of 4.8 percent for South American migrants and 4.9 percent for the world, indicating lower pay for the same job or lack of access to higher quality jobs on account of lower quality of education. At the school, the Caribbean Examination Council tests for secondary school students for English-speaking countries show a very low pass rate in most countries, 20-50 percent in mathematics and slightly higher for English (Figure 8). More glaring than the disparities across Caribbean countries are those within each country. Learning outcomes vary greatly between different schools in the same country, with the good schools attracting better coached, generally richer students. Girls perform much better than boys at exams and are less likely to drop out, and female completion rates in secondary education in 10 Caribbean countries are, on average, almost 30 percent better than male.
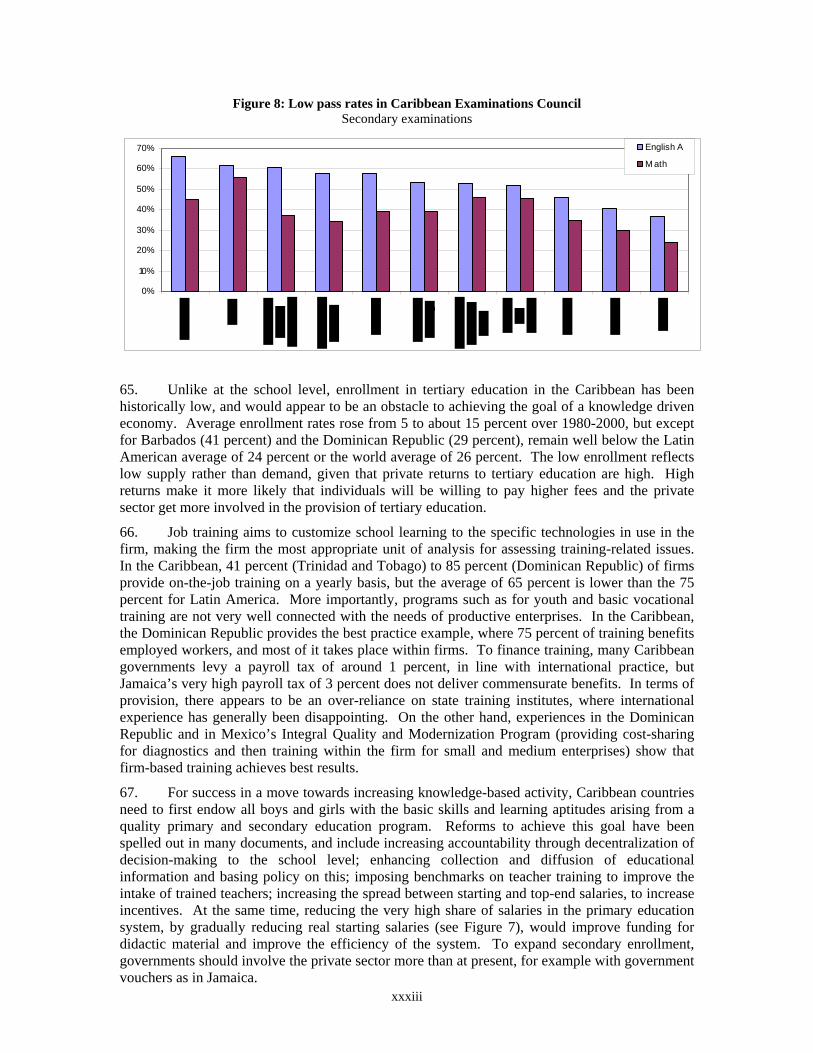
xxxiii
Figure 8: Low pass rates in Caribbean Examinations Council Secondary examinations
0%
10%
20%
30%
40%
50%
60%
70% English A
M ath
65. Unlike at the school level, enrollment in tertiary education in the Caribbean has been historically low, and would appear to be an obstacle to achieving the goal of a knowledge driven economy. Average enrollment rates rose from 5 to about 15 percent over 1980-2000, but except for Barbados (41 percent) and the Dominican Republic (29 percent), remain well below the Latin American average of 24 percent or the world average of 26 percent. The low enrollment reflects low supply rather than demand, given that private returns to tertiary education are high. High returns make it more likely that individuals will be willing to pay higher fees and the private sector get more involved in the provision of tertiary education.
66. Job training aims to customize school learning to the specific technologies in use in the firm, making the firm the most appropriate unit of analysis for assessing training-related issues. In the Caribbean, 41 percent (Trinidad and Tobago) to 85 percent (Dominican Republic) of firms provide on-the-job training on a yearly basis, but the average of 65 percent is lower than the 75 percent for Latin America. More importantly, programs such as for youth and basic vocational training are not very well connected with the needs of productive enterprises. In the Caribbean, the Dominican Republic provides the best practice example, where 75 percent of training benefits employed workers, and most of it takes place within firms. To finance training, many Caribbean governments levy a payroll tax of around 1 percent, in line with international practice, but Jamaica’s very high payroll tax of 3 percent does not deliver commensurate benefits. In terms of provision, there appears to be an over-reliance on state training institutes, where international experience has generally been disappointing. On the other hand, experiences in the Dominican Republic and in Mexico’s Integral Quality and Modernization Program (providing cost-sharing for diagnostics and then training within the firm for small and medium enterprises) show that firm-based training achieves best results.
67. For success in a move towards increasing knowledge-based activity, Caribbean countries need to first endow all boys and girls with the basic skills and learning aptitudes arising from a quality primary and secondary education program. Reforms to achieve this goal have been spelled out in many documents, and include increasing accountability through decentralization of decision-making to the school level; enhancing collection and diffusion of educational information and basing policy on this; imposing benchmarks on teacher training to improve the intake of trained teachers; increasing the spread between starting and top-end salaries, to increase incentives. At the same time, reducing the very high share of salaries in the primary education system, by gradually reducing real starting salaries (see Figure 7), would improve funding for didactic material and improve the efficiency of the system. To expand secondary enrollment, governments should involve the private sector more than at present, for example with government vouchers as in Jamaica.
xxxiv
68. Similarly, given the fiscal situation, and given high returns to tertiary education, the concentration of such education in children of higher income families, and the large share of tertiary students who migrate, higher tuitions and increased private sector provision must play a much larger role in tertiary education, with well-designed student loan schemes and scholarships for the most needy. This could also involve public-private partnerships (as done by Grenada Community College). Both public and private provision of education needs to be more aligned with private sector needs (and higher fees do create more pressure for relevance), as has been done by the Barbados Community College. And government could demand greater transparency and accountability such as introducing performance contracts in their funding of tertiary education. In terms of training, the Caribbean countries could learn from successful training experiences, all pointing to greater involvement of firms in training decisions, and separation of the financing and supervision role from the provision role. Finally, Caribbean countries could build further on the momentum created by the Caribbean Association of National Training Agencies, including the mutual recognition of occupational standards, vocational and technical certificates, all with a view to eventually creating a genuinely integrated training, education and labor market.
69. Improving productivity and moving towards more knowledge-based activity also demand better technology adaptation, entrepreneurship and risk-taking. In the Caribbean, trade protection and preferences have led to an under-supply of entrepreneurship and therefore the search for new product areas. A phased reduction of such preferences, as discussed earlier, will also create more incentives for risk-taking and product diversification. However, the supply side of the equation also needs to be improved. Apart from high quality and relevant skills, investments in new product areas demands fostering linkages between universities and public research institutions and firms; implementing support for technology development through existing and incipient sectoral clusters; encouraging knowledge transfers from the diaspora and returning migrants; and providing a good investment climate, including one that encourages high quality FDI.
Many Infrastructure Deficiencies arise from Inefficiency and Poor Regulation
70. Infrastructure is a critical issue for the development of the Caribbean and, given their small size, the countries face special challenges in attracting private investment and managing the risk of bulky public investments. As might be expected, the current level of services and costs vary across the Caribbean and by sectors. Regarding the main sectors, private cellular phone services have increased access dramatically. Jamaica is perhaps the best example of this success story. However, internet access, a key element in the globalizing economy, remains low in the Caribbean, reflecting high charges. Performance of the power sector could be improved. While access to power is above 80 percent in the English-speaking Caribbean, in the Dominican Republic and Haiti, access is low. In the English-speaking Caribbean, power prices are high, a factor contributing to high costs for businesses. Partly, the problem is low collections in many countries. The process of power privatization in the Dominican Republic involved high costs, low collections and large subsidies that eventually led to lengthy, financially caused blackouts, riots, and re-nationalization of the distributors. Water remains in the public sector in most countries. Access to safe water could be improved, losses through leaks and non-collection are high, and tariffs are equal to, or less than, operating costs. Airports have been a success story, particularly in the Dominican Republic, where private airports have made a major contribution to the rapid development of its tourist industry, and Jamaica, where the private operation of Sangster (Montego Bay) airport has proved a success. Public airports however failed to cover full costs, and so represent a fiscal burden. Port costs and operations vary substantially from country to country. Shipping capacity is adequate, and is privately provided.
71. To bring infrastructure up to standard and meet growth needs, substantial investment will be needed. In most of the higher income countries, the costs can probably be covered easily. However, in countries such as Haiti, Guyana, the Dominican Republic and, to a lesser extent, Jamaica, the costs of making the needed investment in power and water is likely to tax the fiscal
xxxv
capacity of these economies. Moreover, in many countries large debt overhangs probably limit the capacity of governments to borrow to finance infrastructure needs, particularly without a cost-covering policy for user charges. Yet the cost of not making the investments is also high—without these services, growth and poverty reduction will suffer. In addition, some institutional and (relatively minor) infrastructure improvements are needed in order to ensure that ports and airports comply with the new international safety and security standards.
72. Covering the investment costs will depend first of all on user charges that cover service costs and collections of these charges. This is especially true since investments will have to be funded out of user charges, particularly in high debt countries. Any subsidies need to be carefully targeted, for example by using the universal service subsidy approach. Allowing low collections or attempting major cross subsidies hurts businesses and reduces the attractiveness of the countries to investors.
73. While some performance indicators of infrastructure in the Caribbean can be explained by size, location, resources and endowments, policies and institutions also help to explain much of the observed differences in performance within the Caribbean as well as compared with benchmark countries. Thus, new policy approaches would help to increase infrastructure access and reduce costs. One area for greater reliance on private providers could be airports and liberalization of air services. While implementing an open skies policy, Governments could offer contracts for air service at auction, with a subsidy to ensure services, which could be a cheaper way to provide air services than subsidizing national and regional carriers. In electricity, lack of economies of scale is a factor in high charges, but so are over-manning and poor collections. Private suppliers already exist in many of the smaller countries, but the problems with privatization suggest that this policy approach is not an easy solution but requires some effort. Perhaps an independent regulator could be used to limit any attempt to exert monopoly power, as is being experimented with in Jamaica, Barbados, and Trinidad and Tobago. A cross island regulator for the small countries might be able to use their countries experiences to get prices down to the lowest levels. Another possibility is contracts for private operation of power plants. The water sector probably could also benefit from contracts for private operation of water companies (St. Lucia is experimenting with a variant), with investment made by development agency funds backed by user charge payments, and with any subsidies carefully targeted so as not to reduce incentives to pay for water and with a good legal framework for collections.
Improving and even Sustaining Growth will Require a Significant Shift in Policy
74. World economic history shows that sustained growth demands sustained improvement in productivity. In the Caribbean, on the other hand, productivity growth has declined, and the underlying determinants of growth have been of declining importance over time. To improve or even sustain past growth, productivity growth needs to improve, which means that the fundamental drivers of growth need to get back to center stage. Also, given the reduction in productivity growth and prospects in traditional activities such as sugar, bananas and traditional tourism, diversification is required, and this will also require productivity increases to offset high wages. Some diversification has already taken place, including in niche manufacturing and various service sectors, but this process needs to be accelerated to reverse the growth decline of the 1990s in a sustainable way.
75. The challenges in this process are often particular to the small Caribbean states. Given their size, many traditional manufacturing activities are ruled out. Their proximity to North America and migration help keep wages high and reduce skill availability for the domestic market. Small size and openness have resulted in high government expenditures, which put a premium on government efficiency in regulation, delivering services and in making investment decisions. For example, poor investment decisions, as happened in some OECS countries in recent years, achieved low returns and were a major cause of the debt spiral in these countries. Caribbean countries are also disaster-prone, and this has affected capital accumulation and
xxxvi
exacerbated the output volatility that small countries experience. Small size also puts a premium on cooperation among nations, in this case exemplified by the push towards the Caribbean Single Market and Economy, and tackling the difficult political issue of national sovereignty.
76. Keeping the above context in mind, policies for sustained, poverty-reducing growth in the Caribbean that help to improve productivity and increase output diversification, can be summarized under several major themes, as described below.
77. Improving macro stability. Underpinning future growth in the Caribbean, as elsewhere, will be improved macroeconomic stability. Fourteen Caribbean countries are among the thirty most indebted countries in the world, and this exacts a toll on sustainable growth and worsens expectations about macro instability. A trajectory of debt based on trends over the last few years is not sustainable for most countries. By the same token, improvement of the debt profile will have significant payoffs, especially for Jamaica, St. Kitts and Nevis, Grenada, Antigua and Barbuda, and Belize. (Dominica suffered from a debt crisis and restructured its debt in 2004). In general, improving macro stability will require improved primary surpluses through better expenditure management and, to a lesser extent, reducing tax incentives and taxing the informal sectors; reducing public debt relative to GDP; improving the quality of privatization where appropriate and reducing the takeover of contingent liabilities; and, given that many of the problems arise from high public investment, prioritization and increased efficiency of public investment.
78. Redefining the role of the public sector. In general, a large government that does not deliver services commensurate with the high tax level that supports it (along with the large debt that raises concerns of a crisis), tends to dampen private sector-led growth. Projections in this report (see Annex Table 1.10 and Annex Table 1.11) show that the maximum gains in growth for most Caribbean countries can be expected from reducing government expenditure. While gains are especially high (as a share of total expected increase in the growth rate) for Jamaica and Suriname, most countries show large projected increases in absolute terms.
79. Redefining the role of the public sector would involve seeking greater cost efficiencies in key government expenditures through greater private sector involvement and regional cooperation, including in the provision of education and health services; increasing reliance on the private sector to provide infrastructure services, such as in airports and air services; and in power, using an independent regional regulator to regulate private provision. Action along these and similar lines would be necessary to reduce the crowding out by the Government of private sector employment and investment, by reducing the growth and even size of public employment.
80. Improving the investment climate for private-sector driven growth and reorienting it away from being subsidy-driven. Productivity of investment has fallen significantly in the 1990s, which will affect the incentives for private investment including FDI. In addition, there is increased global competition for attracting FDI flows. Thus, going forward, the challenge for the Caribbean is to maintain and even increase private investment rates, to make this investment more productive, including through diversification. It is important therefore that the investment climate gives the right signals and encourages higher quality and more productive private investment. Rather than focusing on generous tax incentives, countries should focus on building a sound overall investment climate that attracts higher quality investment and creates increased spillovers and linkages with the domestic economy.
81. This would include addressing problems of high taxes and inefficient customs clearances, skill shortages in some countries (an increasingly important issue for knowledge-based production structures), improving specific aspects of infrastructure, setting in place a regional investment promotion center to provide information and catalyze a process of harmonizing investment and clearance procedures. One specific example of high payoffs is the growth increase in Haiti estimated in our projections, arising from improvements in infrastructure in a country where much of the infrastructure is highly deficient. Of course, all countries have many
xxxvii
specific deficiencies in infrastructure, beyond what can be captured by the cross-country regression framework, and addressing these would have investment and growth payoffs.
82. Enhancing the quality and effectiveness of human resources and enabling knowledge-based growth. Learning outcomes are very mixed within each Caribbean country, and not commensurate with the resources devoted to them. This impacts the quality and learning capability of the labor force. In many countries, the initial momentum in the build up of skills has been lost. Also, enrollment in tertiary education is very low in most countries except Barbados and the Dominican Republic. In addition, training is often not based on market demand. The skill problems in sending countries are often exacerbated by the high rates of migration. The quality and skill mix of human resources, along with other factors such as inadequate linkages between universities and firms, have led to under-investment in new product areas.
83. Targeting human resources would call for improving the quality of primary and secondary education in order to improve learning skills and thus better address the needs of increasing knowledge-based activity, including services; increasing private sector provision of tertiary education and making students pay more of the cost of public tertiary education (to reduce net cost of public education) – implying higher tuition fees, a more open environment for tertiary education, and improved student loans and targeted scholarships for the poorest; separating the financing and supervision of training from provision, and involving the firms much more in training decisions; and aligning public compensation policies more closely with merit and productivity, to reduce distortions in the labor market and so make labor more cost-effective. (While our growth projections cannot take into account qualitative issues regarding education, they do consider access, in terms of secondary enrollment. Again, lagging countries such as Haiti are projected to improve growth significantly by improving their secondary enrollment ratio; other gainers include the Dominican Republic, Suriname, and Belize).
84. Articulating a pro-active trade agenda. A trade regime that induces more competition would help foster entrepreneurship, improve the investment climate as well as the quality of FDI. The trade agenda would include negotiating an orderly dismantling of preferences, including on sugar and bananas, in return for enhanced technical and financial assistance from development partners; reducing external tariffs to reduce the losses from trade diversion; empowering the Regional Negotiating Machinery to represent the region at all trade negotiating forums; taking action to reduce dependence on import revenues by accelerating the pace of planning or implementation of VAT or other domestic tax systems; and negotiating to improve market access in services, especially in the temporary movement of labor.
85. Deepening regional integration. The one cross-cutting theme that recurs through the report relates to the potential for significant gains from achieving deeper regional integration. Thus, accelerating the implementation of the CSME, especially in those aspects related to free trade, free movement of labor, cooperation in education and training, regional standards and accreditation, tax harmonization, and harmonizing investment procedures, would improve competitiveness of the region as a whole, and make it a more attractive investment destination. While there are already many examples of regional institutions, such as UWI, the Caribbean Court of Justice, and several within the OECS, this report argues that a major thrust is now required to push the boundaries of the integration agenda, and to tackle the related, politically sensitive issues of national sovereignty.
86. Besides acting to improve sustainable growth prospects, the region needs also to cope better with natural disasters. The Caribbean, especially the OECS countries, stand out as the most hazard prone in the world, with a very high frequency of violent windstorms. While they have built up resilience to such disasters, this could be strengthened further by improving the macroeconomic environment, and taking other steps identified above to improve growth and diversification, by improving insurance including catastrophe risk insurance for those most vulnerable, by pooling capital market risk and improving building practices.

xxxviii
87. This is a large agenda, and one that requires considerable political will and leadership. The opportunities are great, but time is short and implementation will be key. Going forward, Caribbean governments, rather than creating expectations about the continuation of preferences or donors flows, should engage all stakeholders – civil society, the private sector, trade unions, the media, donors, and each other – in a dialogue and partnership on the challenges and opportunities of new sources of growth and competitiveness. Business as usual will no longer suffice.
Document of the World Bank
Chapter 1 Growth Performance in the Caribbean
A. Introduction
1.1 The 15 Caribbean countries3 covered in this report are quite diverse in many respects: population size, ethnic composition, social and economic development, income per capita, and languages. But they also share important common features: they are recently independent states (with the exception of Haiti and Dominican Republic), primarily small island economies, largely integrated into the world economy (owing to high degree of trade openness, high level of migration), and vulnerable to natural disasters. They also display low population growth rates (at around one-third of one percent), high unemployment rates, serious youth problems, and high HIV/AIDS incidence. Selected key social and economic indicators are provided in Annex Tables 1.7 and 1.8, respectively.
1.2 This chapter examines the growth performance of the Caribbean countries over the past four decades, taking a cross-country approach. It examines the pattern, sources (sectoral contribution as well as the relative importance of factor accumulation and productivity) and determinants of growth, taking into consideration factors of volatility. The chapter then analyzes, for illustrative purpose, the medium-term growth outlook and proposes some broad policy directions for enhancing growth, which are analyzed in greater depth in later chapters. The emphasis in the chapter is on generalization, i.e., to present meaningful stylized facts of growth and benchmarks against which to assess the growth experience of each Caribbean state in a wider context of regional and international experiences. Often, the comparators used are small economies, especially those which either have some similarities with the Caribbean regarding initial conditions (Mauritius and Singapore), or those which have been successful in implementing reforms (Ireland and Singapore).
B. Economic Growth and Social Development
(i) A Declining Economic Trend with a Widening Gap Among Countries4
1.3 During the last four decades the Caribbean as a region has grown at a rate faster than Latin America but not as fast as East Asia. And, unlike for Latin America, the 1980s was not a lost decade for the Caribbean. The per capita GDP growth rate for a median Caribbean country averaged 2.8 percent per year between 1961-2002. In all four decades, per capita GDP growth in the Caribbean has been around half a percentage point higher than in Latin America, except in the 1980s—a lost decade for Latin America—where the difference was nearly 2 percentage points (see Figure 1.1). The Caribbean region, however, does not compare favorably with countries in East Asia (see Figure 1.2). The long-run growth record of the Caribbean, which is broadly similar to OECD countries, compares favorably with other comparators such as the Pacific Islands and other Small States which include developed nations. There are however wide variations among countries. Those that have had the highest trend growth in the long-run are.5 St. Kitts and Nevis, St. Vincent and the Grenadines, Grenada, and 3 These are: Antigua and Barbuda, The Bahamas, Belize, Barbados, Dominica, Dominican Republic, Grenada, Guyana, Haiti, Jamaica, St. Kitts and Nevis, St. Lucia, Suriname, Trinidad and Tobago, and St. Vincent and the Grenadines. Cuba and dependent territories are not included in the report, unless explicitly stated, but many of the issues discussed here would be applicable to these economies as well. 4 Throughout the chapter, the average refers to the unweighted average of the fifteen Caribbean countries, unless otherwise indicated. 5 There are alternative ways to measure long-run trend growth and volatility of growth around the trend. Apart from the simple means and standard deviations, popular techniques in time series analyses use “filters” to extract cycles and
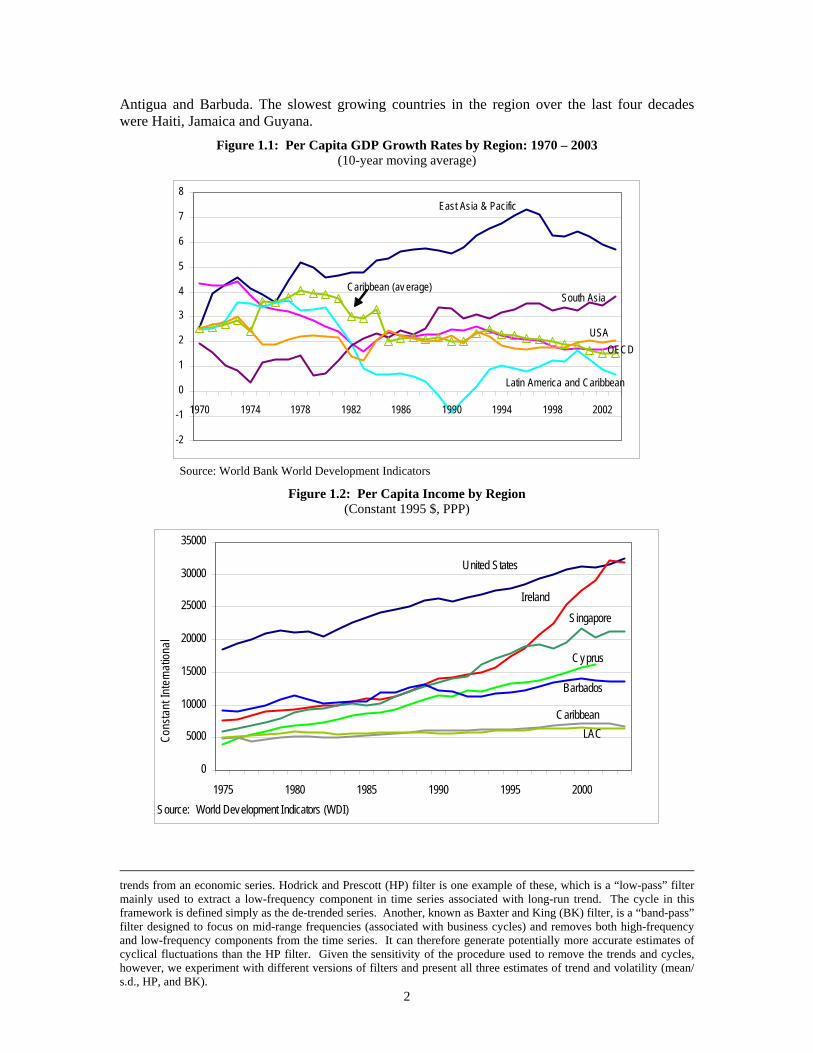
2
Antigua and Barbuda. The slowest growing countries in the region over the last four decades were Haiti, Jamaica and Guyana.
Figure 1.1: Per Capita GDP Growth Rates by Region: 1970 – 2003 (10-year moving average)
-2
-1
0
1
2
3
4
5
6
7
8
1970 1974 1978 1982 1986 1990 1994 1998 2002
East Asia & Pacific
South Asia
USA
Latin America and Caribbean
Caribbean (av erage)
OECD
Source: World Bank World Development Indicators
Figure 1.2: Per Capita Income by Region (Constant 1995 $, PPP)
0
5000
10000
15000
20000
25000
30000
35000
1975 1980 1985 1990 1995 2000
Cons
tant
Inte
rnat
ional
Source: World Development Indicators (WDI)
Barbados
Cyprus
Singapore
Ireland
United States
CaribbeanLAC
trends from an economic series. Hodrick and Prescott (HP) filter is one example of these, which is a “low-pass” filter mainly used to extract a low-frequency component in time series associated with long-run trend. The cycle in this framework is defined simply as the de-trended series. Another, known as Baxter and King (BK) filter, is a “band-pass” filter designed to focus on mid-range frequencies (associated with business cycles) and removes both high-frequency and low-frequency components from the time series. It can therefore generate potentially more accurate estimates of cyclical fluctuations than the HP filter. Given the sensitivity of the procedure used to remove the trends and cycles, however, we experiment with different versions of filters and present all three estimates of trend and volatility (mean/ s.d., HP, and BK).
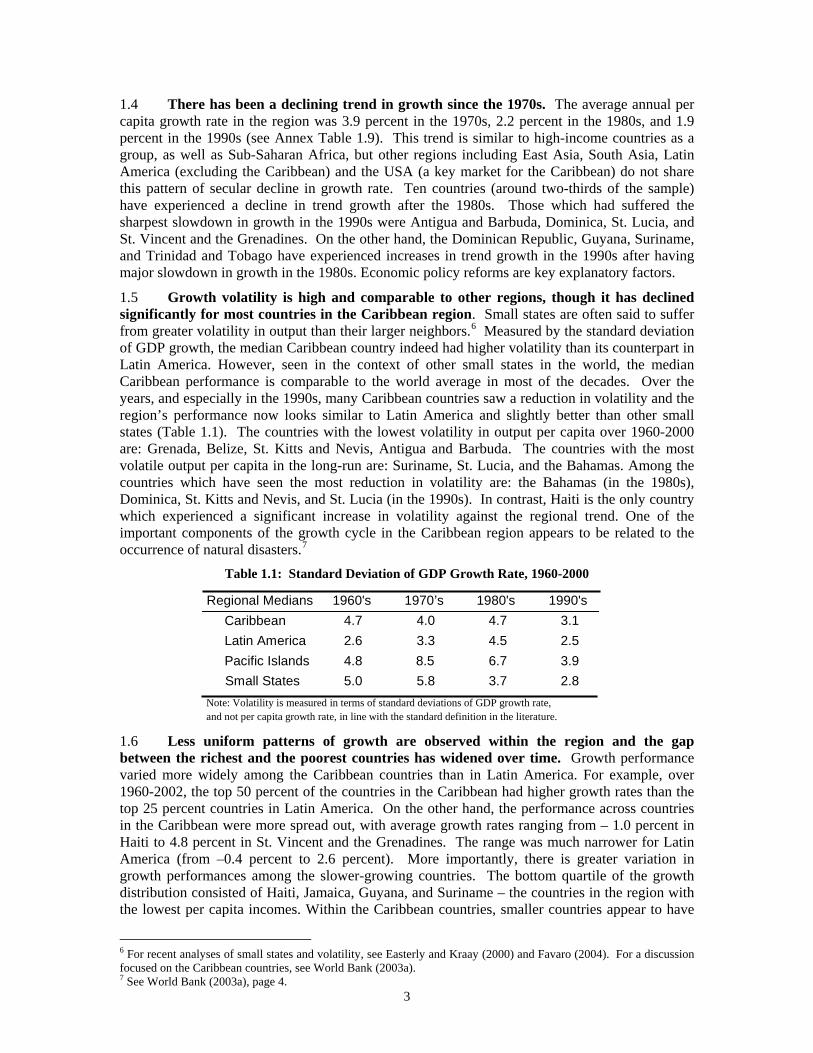
3
1.4 There has been a declining trend in growth since the 1970s. The average annual per capita growth rate in the region was 3.9 percent in the 1970s, 2.2 percent in the 1980s, and 1.9 percent in the 1990s (see Annex Table 1.9). This trend is similar to high-income countries as a group, as well as Sub-Saharan Africa, but other regions including East Asia, South Asia, Latin America (excluding the Caribbean) and the USA (a key market for the Caribbean) do not share this pattern of secular decline in growth rate. Ten countries (around two-thirds of the sample) have experienced a decline in trend growth after the 1980s. Those which had suffered the sharpest slowdown in growth in the 1990s were Antigua and Barbuda, Dominica, St. Lucia, and St. Vincent and the Grenadines. On the other hand, the Dominican Republic, Guyana, Suriname, and Trinidad and Tobago have experienced increases in trend growth in the 1990s after having major slowdown in growth in the 1980s. Economic policy reforms are key explanatory factors.
1.5 Growth volatility is high and comparable to other regions, though it has declined significantly for most countries in the Caribbean region. Small states are often said to suffer from greater volatility in output than their larger neighbors.6 Measured by the standard deviation of GDP growth, the median Caribbean country indeed had higher volatility than its counterpart in Latin America. However, seen in the context of other small states in the world, the median Caribbean performance is comparable to the world average in most of the decades. Over the years, and especially in the 1990s, many Caribbean countries saw a reduction in volatility and the region’s performance now looks similar to Latin America and slightly better than other small states (Table 1.1). The countries with the lowest volatility in output per capita over 1960-2000 are: Grenada, Belize, St. Kitts and Nevis, Antigua and Barbuda. The countries with the most volatile output per capita in the long-run are: Suriname, St. Lucia, and the Bahamas. Among the countries which have seen the most reduction in volatility are: the Bahamas (in the 1980s), Dominica, St. Kitts and Nevis, and St. Lucia (in the 1990s). In contrast, Haiti is the only country which experienced a significant increase in volatility against the regional trend. One of the important components of the growth cycle in the Caribbean region appears to be related to the occurrence of natural disasters.7
Table 1.1: Standard Deviation of GDP Growth Rate, 1960-2000
Regional Medians 1960's 1970’s 1980's 1990's Caribbean 4.7 4.0 4.7 3.1 Latin America 2.6 3.3 4.5 2.5 Pacific Islands 4.8 8.5 6.7 3.9 Small States 5.0 5.8 3.7 2.8 Note: Volatility is measured in terms of standard deviations of GDP growth rate,and not per capita growth rate, in line with the standard definition in the literature.
1.6 Less uniform patterns of growth are observed within the region and the gap between the richest and the poorest countries has widened over time. Growth performance varied more widely among the Caribbean countries than in Latin America. For example, over 1960-2002, the top 50 percent of the countries in the Caribbean had higher growth rates than the top 25 percent countries in Latin America. On the other hand, the performance across countries in the Caribbean were more spread out, with average growth rates ranging from – 1.0 percent in Haiti to 4.8 percent in St. Vincent and the Grenadines. The range was much narrower for Latin America (from –0.4 percent to 2.6 percent). More importantly, there is greater variation in growth performances among the slower-growing countries. The bottom quartile of the growth distribution consisted of Haiti, Jamaica, Guyana, and Suriname – the countries in the region with the lowest per capita incomes. Within the Caribbean countries, smaller countries appear to have
6 For recent analyses of small states and volatility, see Easterly and Kraay (2000) and Favaro (2004). For a discussion focused on the Caribbean countries, see World Bank (2003a). 7 See World Bank (2003a), page 4.
4
had, at least until quite recently, faster growth and a sounder macroeconomic framework than larger ones. In recent years, however, the macroeconomic performance of the OECS countries has come under pressure (World Bank, 2003a).
1.7 The Caribbean countries differ from each other in many ways, with Haiti and Guyana being particularly different. They are also the two poorest countries in the region. Larger and more populous that most other Caribbean countries, Haiti’s development level and economic performance are far below regional averages. Its per capita GDP, at US$460, is only a fraction of the regional average and one-half of Guyana’s, the next poorest country in the region. Due to chronic political instability, political violence, and economic mismanagement, per capita GDP growth over 1960-2002 averaged -1.1 percent, versus the regional median of 2.8 percent. Like other Caribbean countries, Haiti has a large services sector, but it is dominated by petty trade, whereas in other Caribbean countries tourism drives the services sector. Remittances as a share of GDP are the highest in the Caribbean, and help to finance the large trade deficit. Economic activity is constrained by a serious lack of infrastructure. In 2004, only 20 percent of roads were in acceptable condition. While airport facilities are comparable to some Caribbean countries, port facilities are old and often inoperative. With a telephone penetration rate of 33 (per 1,000 people) cell phone penetration of 17 and Internet penetration of 9.6, Haiti lags significantly behind other Caribbean countries in communications infrastructure as well. Its social indicators also lag, with life expectancy about two-thirds of the regional average, and primary enrollment only 56 percent, compared to near universal enrollment for the region. The shortage of skills – a phenomenon affecting other Caribbean countries – is perhaps worse in Haiti than elsewhere. Adult literacy is about 52 percent against 90 percent for the region, and economically and politically-motivated out-migration deprives the labor force of many educated Haitians.
1.8 With independence in 1966, Guyana had the potential to transform itself from a low-income commodity exporter into a prosperous gateway linking North America, South America and the Caribbean.8 But this was not to be. While the economy grew in the 1960s and 1970s, prevailing socialist policies had, by the late 1980s, a devastating impact on the country. Output fell (-3.5 percent per annum during the 1980s), living standards collapsed, the quality of social services eroded and infrastructure deteriorated. By 1988, it could no longer service its external debts. The 1989 Economic Recovery Program (ERP) marked the beginning of Guyana’s transition from a socialist regime to a market economy and a democratic system. Substantial reforms since then have resulted in higher growth (averaging 7.1 percent per annum during 1991-97) and reduced poverty (headcount falling from 43 percent in 1992 to 35 percent in 1999). Since 1998, however, the more difficult task of transforming public institutions and practices, as compared to first-generation transition reforms, led to a slowdown in the momentum of policy reform. Moreover, adverse movement in the terms of trade, the El Niño drought, elections, civil disturbances, criminality and labor unrest weakened the authorities’ resolve to reform. As a result, over 1998-2002, the economy grew only at 0.5 percent per annum. Since late 2003, there has been a renewed interest in reforms, demonstrated by successful completion of conditions for receiving debt relief, as well as other loans supported by the IMF and World Bank.
8 This section is an extract from the recent report “Guyana: Development Policy Review--the Challenges of Governance and Growth”, World Bank November 2003.
5
(ii) Social Development—An Overview
1.9 The high albeit declining growth rates experienced by the Caribbean over the past four decades have resulted in significant human development improvement in all countries except Haiti. Life expectancy has improved significantly. The Human Development Index (HDI) has improved steadily since 1980 for countries for which information is available (UNDP 2004). At present, with the exception of Haiti, all countries rank among the medium and high HDI categories. Measuring progress towards the MDGs requires complete data which is not available for many countries (see Annex Table 1.7). Nevertheless, it appears that most countries except Haiti are likely to achieve universal primary enrollment. Similarly, the region scores very high in terms of eliminating gender disparity in primary and secondary schools, though the indicators used to measure this goal are believed not to capture persistent gender inequality (UNDP, 2003). The goal of reducing child mortality rates by two-thirds by 2015 is on track for all countries, with seven countries having already achieved the goal. In other categories, the region seems less poised to meet its MDG goals. For example, the HIV/AIDS infection rates as a percentage of the population aged 15-49 have actually increased slightly from 1997 to 2001. Also, maternal mortality rates, which must be reduced by three-quarters by 2015, have not improved since 1990.
1.10 With the exception of Haiti, where the poverty level remains high at 76 percent (World Bank 2004a), poverty in other countries ranges between 12 percent in the case of Antigua and 35 percent in the case of Guyana. While time series data is scanty, it appears that poverty has been on the decline in the case of the Dominican Republic (33.9 to 28.6 percent),9 Jamaica (44.6 to 19.7 percent) and Guyana (43.2 to 35 percent), and on the rise for Haiti (65 to 76 percent).10 As shown in Figure 1.3, the decline in poverty is associated with the growth of GDP. Jamaica provides an interesting case – a small increase in measured GDP is seen to be associated with a large decline in the poverty. In fact, over 1994-98, headcount poverty in Jamaica declined by over 10 percentage points over 1994-98 despite a decline in GDP growth, and owes to several factors including a decline in inflation and in relative food prices, that are unlikely to be repeated (see World Bank, 2004b for a detailed explanation). While average income inequality in the Caribbean, as measured by the Gini coefficient, (Annex Table 1.7), at 0.38, is lower than in Latin America, some countries suffer from higher inequality, such as Haiti (0.65), St. Vincent and the Grenadines (0.60), Antigua and Barbuda (0.50), and the Dominican Republic (0.47).
9 In the Dominican Republic, poverty rates declined in the 1990s, though the recent crisis is likely to have increased poverty. 10 The four countries for which poverty data are available for at least two years are: Dominican Republic (1993, 1999), Guyana (1992, 1999), Haiti (1988, 2003) and Jamaica (1991, 2002). Jamaica is an exception in terms of availability of consistent poverty data every year since 1991. The GDP is calculated for the three-year average GDP (PPP) levels preceding the poverty year, and the change then calculated. For example, for Guyana the change in GDP is calculated as follows: average PPP GDP level for 1996-8 divided by average PPP GDP for 1990-2, minus 1.
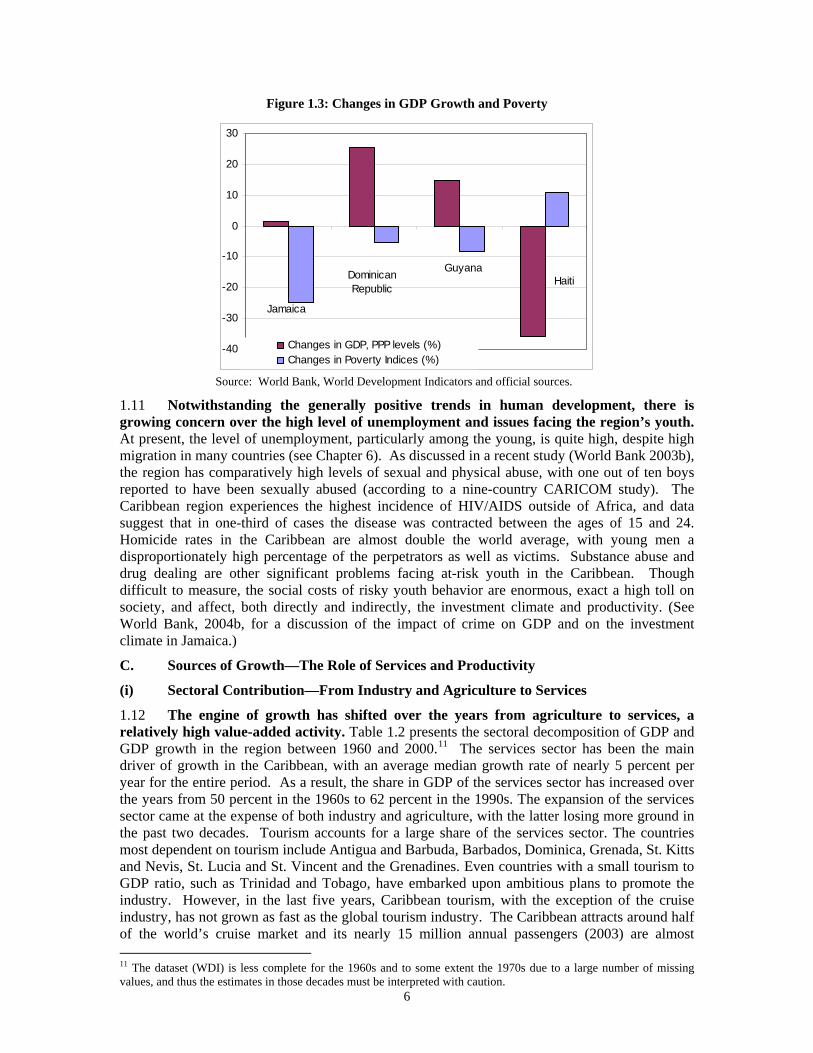
6
Figure 1.3: Changes in GDP Growth and Poverty
-40
-30
-20
-10
0
10
20
30
Changes in GDP, PPP levels (%)Changes in Poverty Indices (%)
Jamaica
DominicanRepublic
GuyanaHaiti
Source: World Bank, World Development Indicators and official sources.
1.11 Notwithstanding the generally positive trends in human development, there is growing concern over the high level of unemployment and issues facing the region’s youth. At present, the level of unemployment, particularly among the young, is quite high, despite high migration in many countries (see Chapter 6). As discussed in a recent study (World Bank 2003b), the region has comparatively high levels of sexual and physical abuse, with one out of ten boys reported to have been sexually abused (according to a nine-country CARICOM study). The Caribbean region experiences the highest incidence of HIV/AIDS outside of Africa, and data suggest that in one-third of cases the disease was contracted between the ages of 15 and 24. Homicide rates in the Caribbean are almost double the world average, with young men a disproportionately high percentage of the perpetrators as well as victims. Substance abuse and drug dealing are other significant problems facing at-risk youth in the Caribbean. Though difficult to measure, the social costs of risky youth behavior are enormous, exact a high toll on society, and affect, both directly and indirectly, the investment climate and productivity. (See World Bank, 2004b, for a discussion of the impact of crime on GDP and on the investment climate in Jamaica.)
C. Sources of Growth—The Role of Services and Productivity
(i) Sectoral Contribution—From Industry and Agriculture to Services
1.12 The engine of growth has shifted over the years from agriculture to services, a relatively high value-added activity. Table 1.2 presents the sectoral decomposition of GDP and GDP growth in the region between 1960 and 2000.11 The services sector has been the main driver of growth in the Caribbean, with an average median growth rate of nearly 5 percent per year for the entire period. As a result, the share in GDP of the services sector has increased over the years from 50 percent in the 1960s to 62 percent in the 1990s. The expansion of the services sector came at the expense of both industry and agriculture, with the latter losing more ground in the past two decades. Tourism accounts for a large share of the services sector. The countries most dependent on tourism include Antigua and Barbuda, Barbados, Dominica, Grenada, St. Kitts and Nevis, St. Lucia and St. Vincent and the Grenadines. Even countries with a small tourism to GDP ratio, such as Trinidad and Tobago, have embarked upon ambitious plans to promote the industry. However, in the last five years, Caribbean tourism, with the exception of the cruise industry, has not grown as fast as the global tourism industry. The Caribbean attracts around half of the world’s cruise market and its nearly 15 million annual passengers (2003) are almost 11 The dataset (WDI) is less complete for the 1960s and to some extent the 1970s due to a large number of missing values, and thus the estimates in those decades must be interpreted with caution.
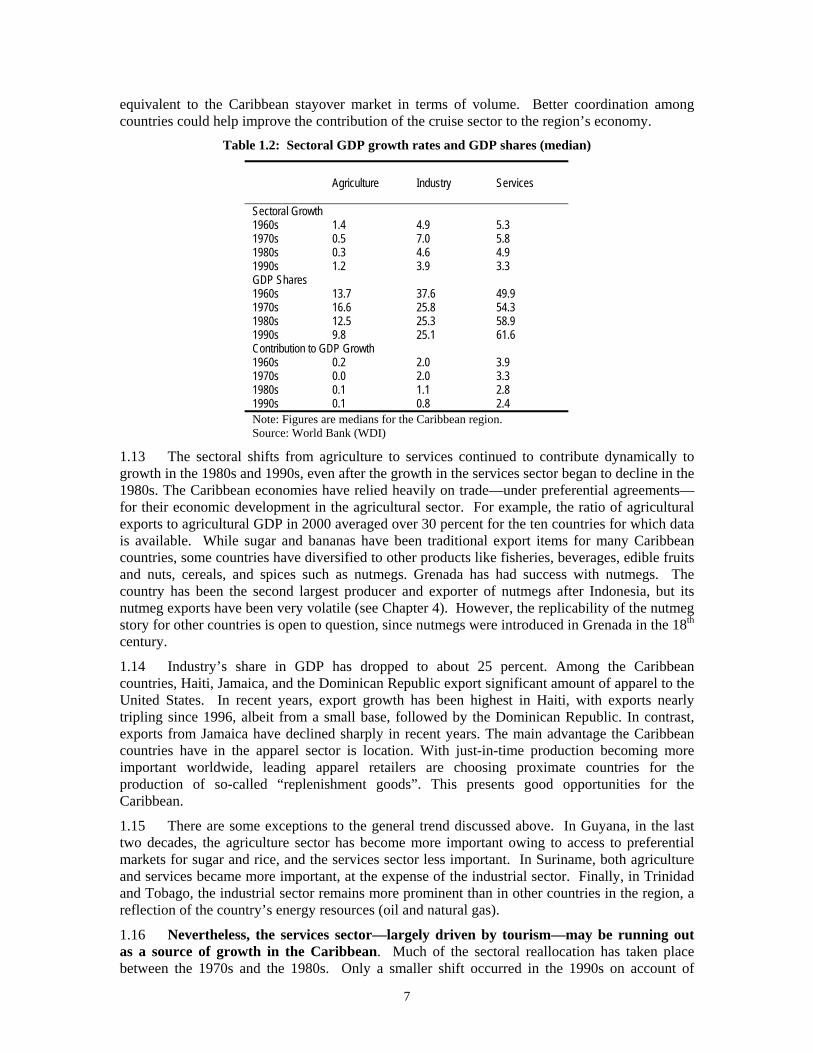
7
equivalent to the Caribbean stayover market in terms of volume. Better coordination among countries could help improve the contribution of the cruise sector to the region’s economy.
Table 1.2: Sectoral GDP growth rates and GDP shares (median)
Agriculture
Industry
Services
Sectoral Growth 1960s 1.4 4.9 5.3 1970s 0.5 7.0 5.8 1980s 0.3 4.6 4.9 1990s 1.2 3.9 3.3 GDP Shares 1960s 13.7 37.6 49.9 1970s 16.6 25.8 54.3 1980s 12.5 25.3 58.9 1990s 9.8 25.1 61.6 Contribution to GDP Growth 1960s 0.2 2.0 3.9 1970s 0.0 2.0 3.3 1980s 0.1 1.1 2.8 1990s 0.1 0.8 2.4 Note: Figures are medians for the Caribbean region. Source: World Bank (WDI)
1.13 The sectoral shifts from agriculture to services continued to contribute dynamically to growth in the 1980s and 1990s, even after the growth in the services sector began to decline in the 1980s. The Caribbean economies have relied heavily on trade—under preferential agreements—for their economic development in the agricultural sector. For example, the ratio of agricultural exports to agricultural GDP in 2000 averaged over 30 percent for the ten countries for which data is available. While sugar and bananas have been traditional export items for many Caribbean countries, some countries have diversified to other products like fisheries, beverages, edible fruits and nuts, cereals, and spices such as nutmegs. Grenada has had success with nutmegs. The country has been the second largest producer and exporter of nutmegs after Indonesia, but its nutmeg exports have been very volatile (see Chapter 4). However, the replicability of the nutmeg story for other countries is open to question, since nutmegs were introduced in Grenada in the 18th century.
1.14 Industry’s share in GDP has dropped to about 25 percent. Among the Caribbean countries, Haiti, Jamaica, and the Dominican Republic export significant amount of apparel to the United States. In recent years, export growth has been highest in Haiti, with exports nearly tripling since 1996, albeit from a small base, followed by the Dominican Republic. In contrast, exports from Jamaica have declined sharply in recent years. The main advantage the Caribbean countries have in the apparel sector is location. With just-in-time production becoming more important worldwide, leading apparel retailers are choosing proximate countries for the production of so-called “replenishment goods”. This presents good opportunities for the Caribbean.
1.15 There are some exceptions to the general trend discussed above. In Guyana, in the last two decades, the agriculture sector has become more important owing to access to preferential markets for sugar and rice, and the services sector less important. In Suriname, both agriculture and services became more important, at the expense of the industrial sector. Finally, in Trinidad and Tobago, the industrial sector remains more prominent than in other countries in the region, a reflection of the country’s energy resources (oil and natural gas).
1.16 Nevertheless, the services sector—largely driven by tourism—may be running out as a source of growth in the Caribbean. Much of the sectoral reallocation has taken place between the 1970s and the 1980s. Only a smaller shift occurred in the 1990s on account of
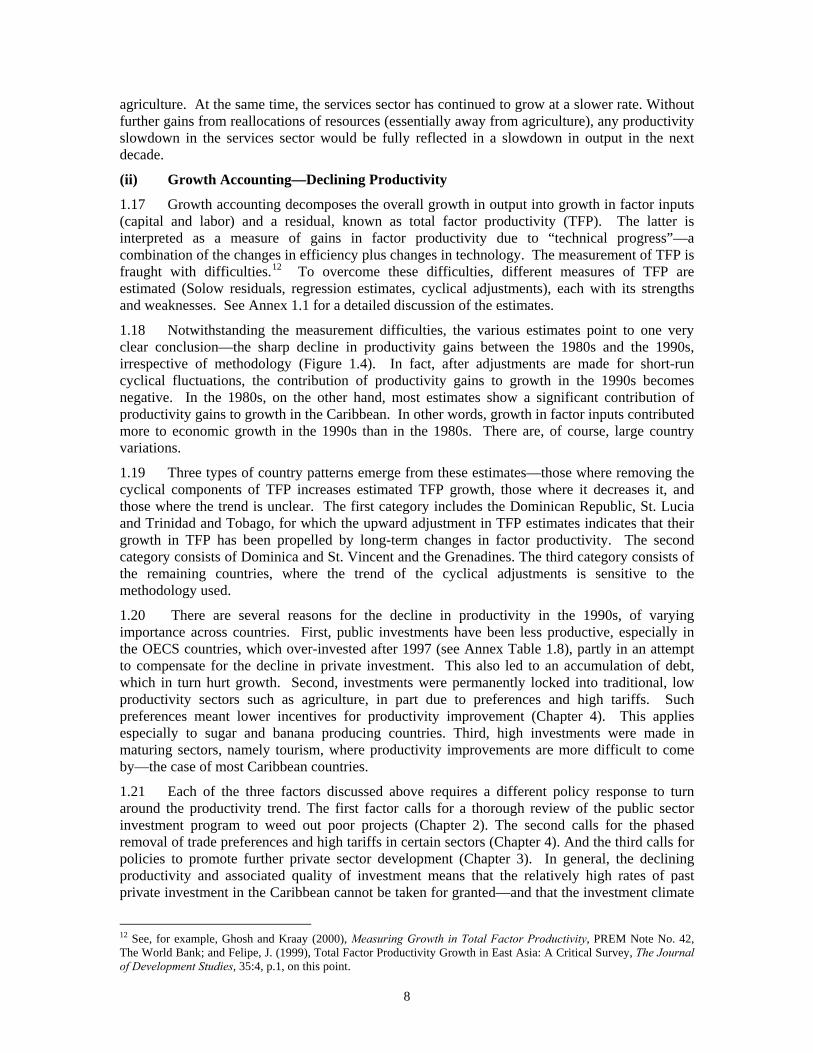
8
agriculture. At the same time, the services sector has continued to grow at a slower rate. Without further gains from reallocations of resources (essentially away from agriculture), any productivity slowdown in the services sector would be fully reflected in a slowdown in output in the next decade.
(ii) Growth Accounting—Declining Productivity
1.17 Growth accounting decomposes the overall growth in output into growth in factor inputs (capital and labor) and a residual, known as total factor productivity (TFP). The latter is interpreted as a measure of gains in factor productivity due to “technical progress”—a combination of the changes in efficiency plus changes in technology. The measurement of TFP is fraught with difficulties.12 To overcome these difficulties, different measures of TFP are estimated (Solow residuals, regression estimates, cyclical adjustments), each with its strengths and weaknesses. See Annex 1.1 for a detailed discussion of the estimates.
1.18 Notwithstanding the measurement difficulties, the various estimates point to one very clear conclusion—the sharp decline in productivity gains between the 1980s and the 1990s, irrespective of methodology (Figure 1.4). In fact, after adjustments are made for short-run cyclical fluctuations, the contribution of productivity gains to growth in the 1990s becomes negative. In the 1980s, on the other hand, most estimates show a significant contribution of productivity gains to growth in the Caribbean. In other words, growth in factor inputs contributed more to economic growth in the 1990s than in the 1980s. There are, of course, large country variations.
1.19 Three types of country patterns emerge from these estimates—those where removing the cyclical components of TFP increases estimated TFP growth, those where it decreases it, and those where the trend is unclear. The first category includes the Dominican Republic, St. Lucia and Trinidad and Tobago, for which the upward adjustment in TFP estimates indicates that their growth in TFP has been propelled by long-term changes in factor productivity. The second category consists of Dominica and St. Vincent and the Grenadines. The third category consists of the remaining countries, where the trend of the cyclical adjustments is sensitive to the methodology used.
1.20 There are several reasons for the decline in productivity in the 1990s, of varying importance across countries. First, public investments have been less productive, especially in the OECS countries, which over-invested after 1997 (see Annex Table 1.8), partly in an attempt to compensate for the decline in private investment. This also led to an accumulation of debt, which in turn hurt growth. Second, investments were permanently locked into traditional, low productivity sectors such as agriculture, in part due to preferences and high tariffs. Such preferences meant lower incentives for productivity improvement (Chapter 4). This applies especially to sugar and banana producing countries. Third, high investments were made in maturing sectors, namely tourism, where productivity improvements are more difficult to come by—the case of most Caribbean countries.
1.21 Each of the three factors discussed above requires a different policy response to turn around the productivity trend. The first factor calls for a thorough review of the public sector investment program to weed out poor projects (Chapter 2). The second calls for the phased removal of trade preferences and high tariffs in certain sectors (Chapter 4). And the third calls for policies to promote further private sector development (Chapter 3). In general, the declining productivity and associated quality of investment means that the relatively high rates of past private investment in the Caribbean cannot be taken for granted—and that the investment climate
12 See, for example, Ghosh and Kraay (2000), Measuring Growth in Total Factor Productivity, PREM Note No. 42, The World Bank; and Felipe, J. (1999), Total Factor Productivity Growth in East Asia: A Critical Survey, The Journal of Development Studies, 35:4, p.1, on this point.
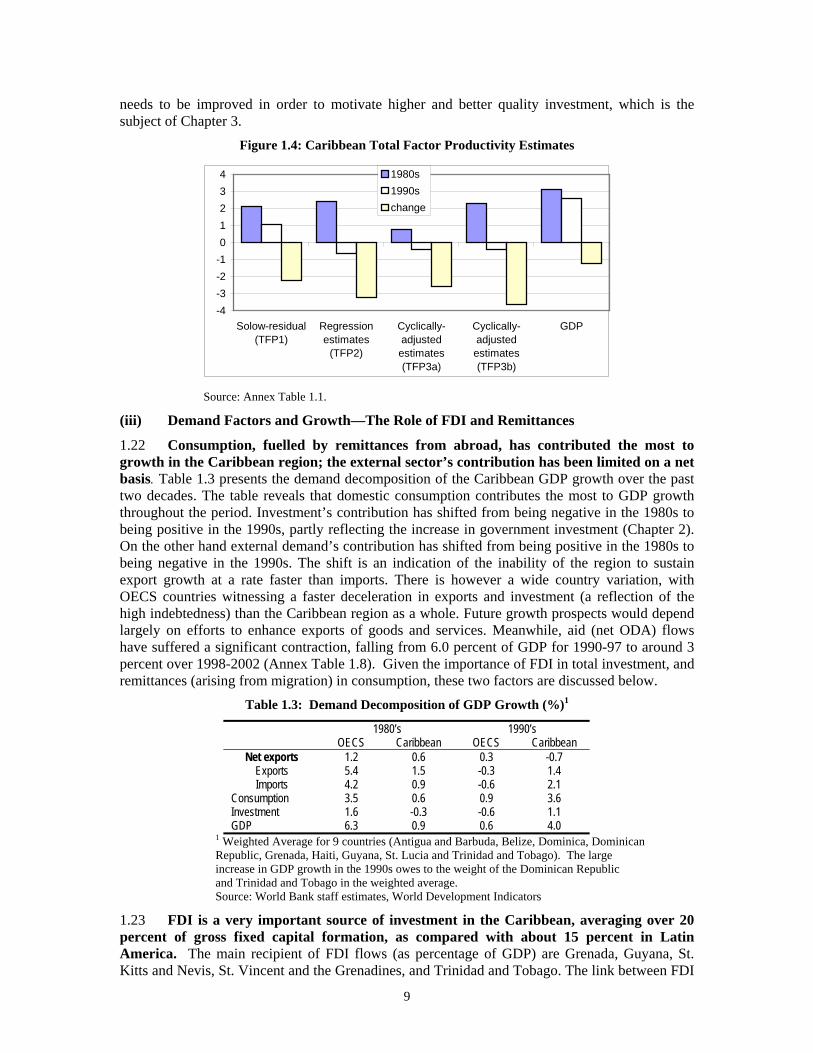
9
needs to be improved in order to motivate higher and better quality investment, which is the subject of Chapter 3.
Figure 1.4: Caribbean Total Factor Productivity Estimates
-4-3-2-101234
Solow-residual(TFP1)
Regressionestimates
(TFP2)
Cyclically-adjustedestimates(TFP3a)
Cyclically-adjustedestimates(TFP3b)
GDP
1980s1990schange
Source: Annex Table 1.1.
(iii) Demand Factors and Growth—The Role of FDI and Remittances
1.22 Consumption, fuelled by remittances from abroad, has contributed the most to growth in the Caribbean region; the external sector’s contribution has been limited on a net basis. Table 1.3 presents the demand decomposition of the Caribbean GDP growth over the past two decades. The table reveals that domestic consumption contributes the most to GDP growth throughout the period. Investment’s contribution has shifted from being negative in the 1980s to being positive in the 1990s, partly reflecting the increase in government investment (Chapter 2). On the other hand external demand’s contribution has shifted from being positive in the 1980s to being negative in the 1990s. The shift is an indication of the inability of the region to sustain export growth at a rate faster than imports. There is however a wide country variation, with OECS countries witnessing a faster deceleration in exports and investment (a reflection of the high indebtedness) than the Caribbean region as a whole. Future growth prospects would depend largely on efforts to enhance exports of goods and services. Meanwhile, aid (net ODA) flows have suffered a significant contraction, falling from 6.0 percent of GDP for 1990-97 to around 3 percent over 1998-2002 (Annex Table 1.8). Given the importance of FDI in total investment, and remittances (arising from migration) in consumption, these two factors are discussed below.
Table 1.3: Demand Decomposition of GDP Growth (%)1
1980’s 1990’s OECS Caribbean OECS Caribbean
Net exports 1.2 0.6 0.3 -0.7 Exports 5.4 1.5 -0.3 1.4 Imports 4.2 0.9 -0.6 2.1
Consumption 3.5 0.6 0.9 3.6 Investment 1.6 -0.3 -0.6 1.1 GDP 6.3 0.9 0.6 4.0
1 Weighted Average for 9 countries (Antigua and Barbuda, Belize, Dominica, Dominican Republic, Grenada, Haiti, Guyana, St. Lucia and Trinidad and Tobago). The large increase in GDP growth in the 1990s owes to the weight of the Dominican Republic and Trinidad and Tobago in the weighted average. Source: World Bank staff estimates, World Development Indicators
1.23 FDI is a very important source of investment in the Caribbean, averaging over 20 percent of gross fixed capital formation, as compared with about 15 percent in Latin America. The main recipient of FDI flows (as percentage of GDP) are Grenada, Guyana, St. Kitts and Nevis, St. Vincent and the Grenadines, and Trinidad and Tobago. The link between FDI
10
and growth is established both theoretically and empirically (see Chapter 3). For instance, Borenzstein et al. (1998) test the effect of FDI on economic growth in a cross-country regression framework utilizing data on FDI inflows from industrial countries and 69 developing countries. Their findings show that FDI is an important vehicle for the transfer of technology, contributing relatively more to growth than domestic investment.
1.24 Migration in the Caribbean plays a major role in economic and social developments. US census data for 2000 indicates that the stock of migrants from the Caribbean was 3 million (out of a total immigrant population of 28 million, the largest Caribbean shares coming from Cuba, Dominican Republic, Jamaica and Haiti (see Chapter 6). Most of the migrants are generally in the most productive age group 20-45 (Haitians 63 percent, Dominicans 53 percent and Jamaicans 48 percent) and generally have a high level of education. In terms of remittances, the Caribbean region has received increasing amounts over the years, from about US$ 400 million per year in the early 1990s to about US$ 4 billion in 2002. Representing an average of 6 percent of regional GDP over 1998-2003, remittance flows now exceed both FDI inflows as well as official development assistance. There is a great deal of country variation, with Haiti receiving the most (14 percent of GDP) and Trinidad and Tobago receiving the least (around 1 percent).
1.25 International migration is a double-edged sword. On the one hand, it contributes significantly to the inflow of ideas and resources to the country; on the other hand, it represents a brain drain. Migration has long been a means of extending the opportunities and overcoming the limitations of small, developing states. It also increases the demand for education in the sending country. Remittances have played an important role in financing and stabilizing consumption in the Caribbean countries (World Bank 2003a). There are at least two issues related to remittances which, if addressed, could increase the effectiveness of remittances: the still-high cost of sending remittances, and the consumption-oriented use of remittances. In this regard, it is worth studying the experience of countries like Mexico, which has sought to channel remittances into development projects through matching incentives. The overseas Caribbean community also creates significant opportunities for the export of culture and local products. Returning migrants also bring benefits to their home countries not only in terms of resources but also in terms of knowledge transfers.
1.26 On the other hand, migration represents a brain drain, thus weakening skills and capacity in the country. An extreme case in point is Guyana where the country has been losing teachers and nurses at high, unsustainable rates. In Jamaica, roughly 80 percent of the potential number of tertiary graduates have left the country (see World Bank, 2004b).13 Moreover, in the Dominican Republic, as well as in Jamaica, even the secondary graduates leave. The excessive emigration of skilled labor not only creates immediate gaps in the labor force, which affects productivity, but also means that the resources invested in education and training may never be fully recovered. Furthermore, there is evidence that remittances of such a large magnitude (in the relevant countries) have contributed to the overvaluation of the domestic currencies and led to high reservation wages. Thus, the overall assessment needs to balance the gains with the losses, and a more detailed analysis needs to be conducted on the impact of migration on consumption, investment, growth and employment, and policies put in place to improve the gains and reduce the losses (such as by charging higher fees for higher education; examining possibilities of cost sharing with countries receiving migrants; and increasing the scope and ambit of temporary migration).
D. The Payoffs of Policy Reform
(i) Policy Stance and the Road Ahead
1.27 Like most countries in LAC, most Caribbean countries have embarked on profound policy change since the mid-1980s. But similar to the Latin American countries, the advance of 13 Estimates of the migration vary, but all indicate a very high figure for Jamaica.
11
reforms in the Caribbean region has been uneven across countries and across areas of reform. In spite of the substantial progress made in most areas, the unfinished reform agenda remains large, as discussed briefly below and in more detail throughout the report. These reforms—some of which may be politically difficult to implement—would, if genuinely implemented, yield high payoffs in terms of growth and employment. The experience of small reforming countries such as Ireland, Mauritius and Singapore supports this claim (see Box 1.1).
Box 1.1: Country Case Studies
Ireland.14 The Irish economy has experienced a remarkable turnaround in about ten years; i.e. since it embarked on a major reform program in 1987. The reform program included a social pact (broad-based support for moderate wage increases), the openness to Europe, the promotion of FDI, the break with Sterling, substantial aid from the EU, changes in technology, industrial organization, and an increased awareness of the role of information. While the role of the European Union was complex, it provided an institutional umbrella that helped drive the stabilization process and galvanize it.15 It is notable, for instance, that during the Program for National Recovery (1987-2000), GDP grew at an average rate of 7 percent and the unemployment level went from 18 percent to near full employment, while the debt/GDP ratio went from around 120 percent to 40 percent and the primary balance went from a deficit of nearly 2 percent to a surplus of nearly 7 percent. At present, Ireland—a country of 3.8 million—enjoys a per capita income of nearly $23,000 (PPP).
Mauritius.16 The Mauritian growth performance has been remarkable, especially since the 1980s (averaging 5.4 percent per annum since 1981.) Its initial conditions—higher level of income, commodity dependence, unfavorable geography—have exerted a drag on growth. While trade performance—through the creation of FTZs and the country’s ability to fully offset the anti-export bias—is one of the explanatory factors for growth, strong domestic institutions and the ethnic diversity, matched with inclusive democratic traditions, provide the key explanatory factors for the exceptional growth. The diversity has important benefits, including diasporas which have important links with the rest of the world, and the separation of economic and political power. At present, Mauritius—a country of 1.2 million—enjoys a per capita income of nearly $4,000 (PPP).
Singapore.17 Since independence in 1965, Singapore has achieved sustained and rapid economic growth, averaging 5.9 percent p.a., despite a virtual lack of natural resources. During this period the economy underwent a rapid industrialization, transforming itself from a low wage, labor surplus economy to a dynamic capital-intensive producer. Macroeconomic stability underpinned Singapore’s success and allowed it to adopt policies to attract foreign investment and investment in human and physical capital. The government pursued an activist industrial policy for sectors deemed to have high growth potential including chemical, electronic and manufacturing. Incentives were also provided to encourage the technological diffusion and upgrades in worker skills. Through steady advances in technology and worker skills engendered by its development strategy, Singapore has achieved an impressive economic record as evidenced by per capita income levels amongst the highest in the world.
1.28 Macroeconomic Performance. Overall, the Caribbean countries have experienced a mixed macroeconomic performance over time and across countries. A recent study by the IMF (2005), ranked the Caribbean countries according to their overall macroeconomic performance over the period 1990-2003 as shown in Figure 1.5.18 According to this analysis, the top three performers are: Trinidad and Tobago, the Bahamas and Dominican Republic (before the recent crisis); and the bottom three performers are St. Kitts and Nevis, Jamaica and Dominica.
14 F. Desmond McCarthy (2001). Social Policy and Macroeconomics: The Irish Experience. PRWP #2736. The World Bank. 15 Ireland became a member of the European Community in 1973. 16 See Subramanian and Roy (2001): Who Can Explain the Mauritian Miracle: Meade, Romer, Sachs, or Rodrik? 17 Kenneth Bercuson, ed. (1995). Singapore. A Case Study in Rapid Development. International Monetary Fund. Washington DC, Feb 1995. 18 The index of macroeconomic performance is constructed using a combination of the following variables: economic growth, total public debt, fiscal balance, inflation. Countries are ranked from 1 to 15 in each category, with the best performers receiving the highest score. The score are then aggregated for each country and then normalized so that the scores for all countries fall between 1 and 100.
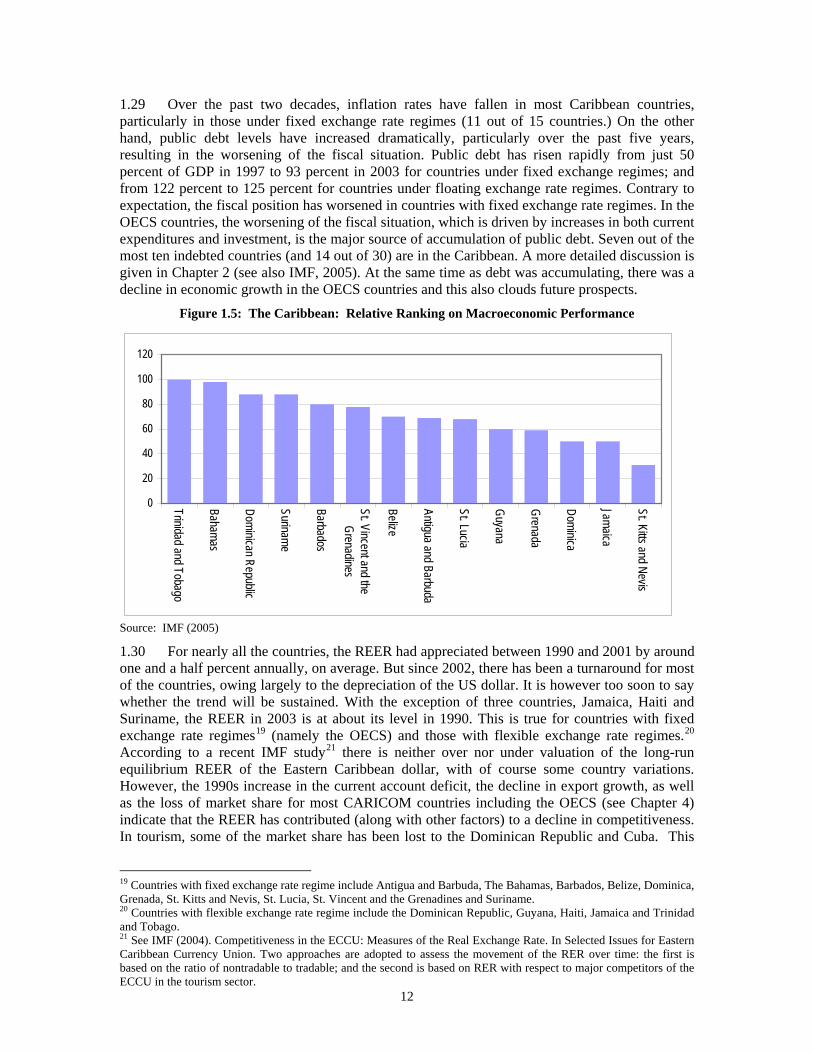
12
1.29 Over the past two decades, inflation rates have fallen in most Caribbean countries, particularly in those under fixed exchange rate regimes (11 out of 15 countries.) On the other hand, public debt levels have increased dramatically, particularly over the past five years, resulting in the worsening of the fiscal situation. Public debt has risen rapidly from just 50 percent of GDP in 1997 to 93 percent in 2003 for countries under fixed exchange regimes; and from 122 percent to 125 percent for countries under floating exchange rate regimes. Contrary to expectation, the fiscal position has worsened in countries with fixed exchange rate regimes. In the OECS countries, the worsening of the fiscal situation, which is driven by increases in both current expenditures and investment, is the major source of accumulation of public debt. Seven out of the most ten indebted countries (and 14 out of 30) are in the Caribbean. A more detailed discussion is given in Chapter 2 (see also IMF, 2005). At the same time as debt was accumulating, there was a decline in economic growth in the OECS countries and this also clouds future prospects.
Figure 1.5: The Caribbean: Relative Ranking on Macroeconomic Performance
0
20
40
60
80
100
120
Trinidad and Tobago
Bahamas
Dominican Republic
Suriname
Barbados
St. Vincent and theGrenadines
Belize
Antigua and Barbuda
St. Lucia
Guyana
Grenada
Dominica
Jamaica
St. Kitts and Nevis
Source: IMF (2005)
1.30 For nearly all the countries, the REER had appreciated between 1990 and 2001 by around one and a half percent annually, on average. But since 2002, there has been a turnaround for most of the countries, owing largely to the depreciation of the US dollar. It is however too soon to say whether the trend will be sustained. With the exception of three countries, Jamaica, Haiti and Suriname, the REER in 2003 is at about its level in 1990. This is true for countries with fixed exchange rate regimes19 (namely the OECS) and those with flexible exchange rate regimes.20 According to a recent IMF study21 there is neither over nor under valuation of the long-run equilibrium REER of the Eastern Caribbean dollar, with of course some country variations. However, the 1990s increase in the current account deficit, the decline in export growth, as well as the loss of market share for most CARICOM countries including the OECS (see Chapter 4) indicate that the REER has contributed (along with other factors) to a decline in competitiveness. In tourism, some of the market share has been lost to the Dominican Republic and Cuba. This
19 Countries with fixed exchange rate regime include Antigua and Barbuda, The Bahamas, Barbados, Belize, Dominica, Grenada, St. Kitts and Nevis, St. Lucia, St. Vincent and the Grenadines and Suriname. 20 Countries with flexible exchange rate regime include the Dominican Republic, Guyana, Haiti, Jamaica and Trinidad and Tobago. 21 See IMF (2004). Competitiveness in the ECCU: Measures of the Real Exchange Rate. In Selected Issues for Eastern Caribbean Currency Union. Two approaches are adopted to assess the movement of the RER over time: the first is based on the ratio of nontradable to tradable; and the second is based on RER with respect to major competitors of the ECCU in the tourism sector.
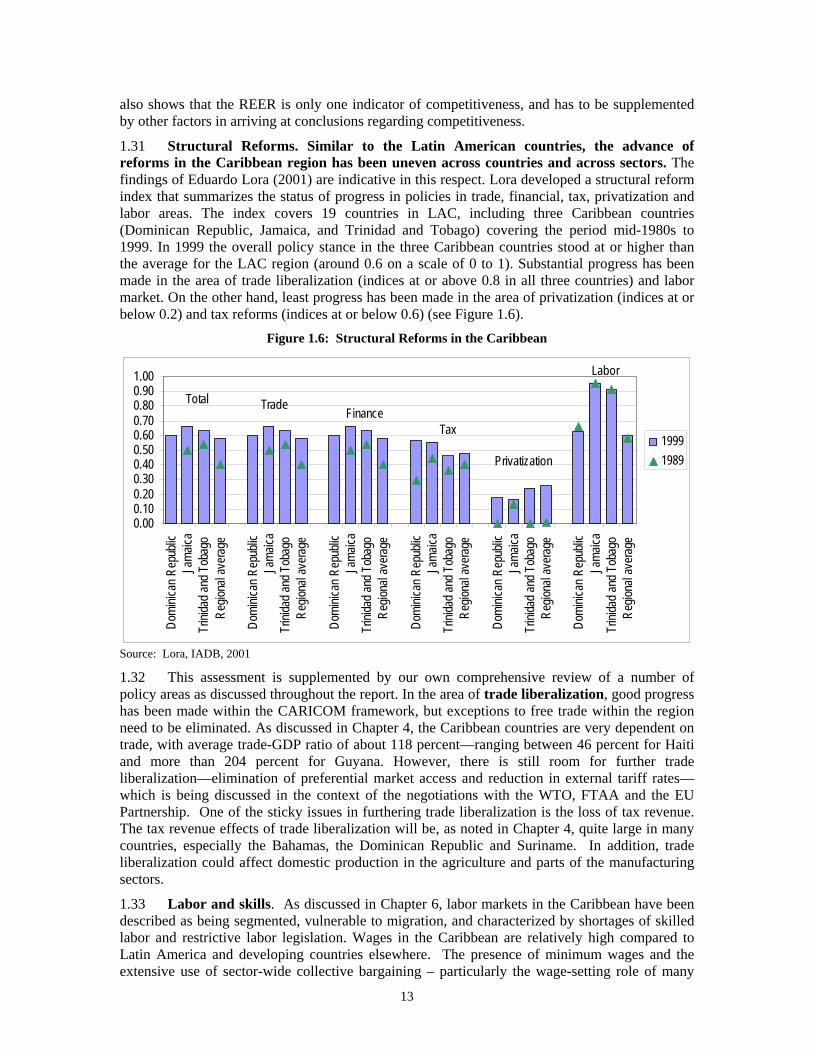
13
also shows that the REER is only one indicator of competitiveness, and has to be supplemented by other factors in arriving at conclusions regarding competitiveness.
1.31 Structural Reforms. Similar to the Latin American countries, the advance of reforms in the Caribbean region has been uneven across countries and across sectors. The findings of Eduardo Lora (2001) are indicative in this respect. Lora developed a structural reform index that summarizes the status of progress in policies in trade, financial, tax, privatization and labor areas. The index covers 19 countries in LAC, including three Caribbean countries (Dominican Republic, Jamaica, and Trinidad and Tobago) covering the period mid-1980s to 1999. In 1999 the overall policy stance in the three Caribbean countries stood at or higher than the average for the LAC region (around 0.6 on a scale of 0 to 1). Substantial progress has been made in the area of trade liberalization (indices at or above 0.8 in all three countries) and labor market. On the other hand, least progress has been made in the area of privatization (indices at or below 0.2) and tax reforms (indices at or below 0.6) (see Figure 1.6).
Figure 1.6: Structural Reforms in the Caribbean
0.000.100.200.300.400.500.600.700.800.901.00
Domi
nican
Rep
ublic
Jama
icaTr
inida
d and
Tob
ago
Regio
nal a
verag
e
Domi
nican
Rep
ublic
Jama
icaTr
inida
d and
Tob
ago
Regio
nal a
verag
e
Domi
nican
Rep
ublic
Jama
icaTr
inida
d and
Tob
ago
Regio
nal a
verag
e
Domi
nican
Rep
ublic
Jama
icaTr
inida
d and
Tob
ago
Regio
nal a
verag
e
Domi
nican
Rep
ublic
Jama
icaTr
inida
d and
Tob
ago
Regio
nal a
verag
e
Domi
nican
Rep
ublic
Jama
icaTr
inida
d and
Tob
ago
Regio
nal a
verag
e
19991989
Total Trade FinanceTax
Privatization
Labor
Source: Lora, IADB, 2001
1.32 This assessment is supplemented by our own comprehensive review of a number of policy areas as discussed throughout the report. In the area of trade liberalization, good progress has been made within the CARICOM framework, but exceptions to free trade within the region need to be eliminated. As discussed in Chapter 4, the Caribbean countries are very dependent on trade, with average trade-GDP ratio of about 118 percent—ranging between 46 percent for Haiti and more than 204 percent for Guyana. However, there is still room for further trade liberalization—elimination of preferential market access and reduction in external tariff rates—which is being discussed in the context of the negotiations with the WTO, FTAA and the EU Partnership. One of the sticky issues in furthering trade liberalization is the loss of tax revenue. The tax revenue effects of trade liberalization will be, as noted in Chapter 4, quite large in many countries, especially the Bahamas, the Dominican Republic and Suriname. In addition, trade liberalization could affect domestic production in the agriculture and parts of the manufacturing sectors.
1.33 Labor and skills. As discussed in Chapter 6, labor markets in the Caribbean have been described as being segmented, vulnerable to migration, and characterized by shortages of skilled labor and restrictive labor legislation. Wages in the Caribbean are relatively high compared to Latin America and developing countries elsewhere. The presence of minimum wages and the extensive use of sector-wide collective bargaining – particularly the wage-setting role of many
14
governments which effectively reinforce inflation rather than tying wage increases to productivity gains – also diminish labor demand and the prospects for increasing international competitiveness. Other aspects of labor regulation as well as the non-negligible influence of unions make Caribbean labor less attractive for foreign investors (with the exception of the Dominican Republic). Labor market outcomes such as the emergence of the informal sector, as well as the persistence of high rates of unemployment in some countries, provide additional indications of poor labor market functioning. The positive public sector wage premium may contribute to unemployment by encouraging queuing for civil service openings, and high migration and large remittances may also raise the reservation wage, thereby increasing voluntary unemployment. Several countries in the region have been engaging in social partnerships (government, labor unions and private sector associations) in an effort to control the extent to which labor market arrangements affect the economy.
1.34 As discussed in Chapter 7, some countries in the Caribbean have fallen behind competitors in terms of available skills over the past two decades, partly because of migration of educated labor and partly because of poor quality of education. The stock of skills of these countries, as measured by the number of schooling years each adult has, is now lower than the average for Latin American and the world (6 vs. 6.3 and 6.5, respectively). Firm surveys and labor market analysis show that the demand for skills clearly exceeds the supply. Skilled labor, with the ability to absorb and adopt technology, combined with a favorable environment (“learning institutions” and “learning regions”), tend to increase productivity and thus competitiveness and growth. While education, particularly primary and secondary, has expanded in the Caribbean region since independence, the quality in most countries remains below international standards. Improving the quality of education, increasing access to tertiary education without imposing additional demands on public finances, and increasing job-training would increase the availability of “knowledge workers”.
1.35 Liberalization and the enabling environment—the case of infrastructure. As discussed in Chapter 8, the progress on privatization and deregulation varies greatly depending on the sector and the country. Where it has been done, privatization has had mixed results, suggesting that each case needs to be approached on its own merits, and a whole range of feasible solutions including privatization, public-private partnerships, management contracts, auction of services, or just better incentives for improving efficiency under public ownership, needs to be explored. The experience so far shows that in telecommunications, a number of countries (Jamaica, Barbados and the OECS) have successfully liberalized their policies. In the electricity sector, only a few countries have made progress on the regulatory environment (Jamaica and Barbados) and on privatization (Barbados, Dominica and Grenada). The Dominican Republic's experience with power privatization has been difficult, as regulatory and policy failures resulted in high costs, low collections and large subsidies that eventually led to lengthy, financially-caused blackouts. In the water sector, most water utilities are not performing adequately with large losses due to large quantities of non-revenue generating water and overstaffing. Private involvement in water services has been attempted in Trinidad and Guyana with mixed results. In airports, private finance and operations of airports, as done in the case of Jamaica (Montego Bay) and Dominican Republic (Punta Cana), has been successful. Finally, liberalization of air services through open skies agreements has only been introduced in the Dominican Republic, with good results.
1.36 Institutions and governance. Based on the governance variables provided by Kraay, Kaufmann and Zoubido-Lobathon for the period 1996-2002, the Caribbean countries do fairly well on voice and accountability, political stability, and control of corruption; and less so on the regulatory quality, rule of law, and government effectiveness. There has been improvement over time on most variables, with the exception of voice and accountability, though with varying degrees among countries. The countries which made the most progress on at least three variables are: Bahamas, Barbados and Dominica; and those with least progress are Haiti, Guyana and Jamaica. Three variables--control of corruption, political stability, and voice and accountability--
15
seem to come more easily to small countries, including the Caribbean, than other variables. These variables are strongly and negatively associated with country size, in terms of population. It seems that small countries, and perhaps especially those with strong democratic traditions, can more easily achieve such institutional qualities as voice, stability and control of corruption (the Dominican Republic and Haiti, where there have been financial/electricity sector and political crises, respectively, illustrate the corruption and lack of accountability in these countries, which are both larger than the others and have not had a long democratic tradition). On the other hand, more systemic investments and institution-building may be involved in building quality regulation, government effectiveness, and rule of law. These may require scale to develop further, perhaps offering an opportunity for regional cooperation (Eskeland et al 2004).
1.37 Financial sector reform. The financial sector differs widely across countries in the Caribbean region owing to differences in the size and development of each economy, the macroeconomic performance, the legal and regulatory environment and institutional histories.22 Overall, the financial sector in the Caribbean has made only a limited contribution to the region’s development. Basically, there have been three different patterns of financial sector development in the relatively larger and higher income countries: the crisis countries, namely Jamaica and the Dominican Republic; the OECS countries and Barbados where the financial depth (M2/GDP) is quite high; and Trinidad and Tobago where the government is pursuing a regional financial sector strategy, with the objective of developing the financial sector as a source of growth. See Box 1.2 for more details.
Box 1.2: The Financial Sector in the Caribbean
Financial sector crises occurred in Jamaica in the mid-1990s (World Bank, 2004b) and in the Dominican Republic beginning in 2003. Both crises were preceded by credit booms in the context of interconnected lending, regulatory arbitrage, and weak financial regulation and supervision. In Jamaica, the direct cost of the crisis—bailing out depositors and other financial liability holders—was one of the highest in the world, over 40 percent of GDP. In the Dominican Republic, estimates of the crisis’ cost already exceed 20 percent of GDP. This is a large figure given that total on-shore deposits were only about 30 percent of GDP but not surprising given that the government took the completely unique step of bailing-out offshore depositors, as well as onshore depositors, in the failed banks. Moreover, the direct costs of the crisis in the Dominican Republic may rise as the quality of loans deteriorates after the crisis. In addition to these direct effects, financial crises also tend to slow GDP growth and investment (Barro, 2001). These indirect costs probably reflect the large increase in government debt in banks that is typically associated with cleaning up bad loans to bailout depositors, and the corresponding rise in debt to GDP, government interest expenditures, and the related rise in risk premia.
In the OECS countries, currency plus bank deposits are more than 90 percent of GDP, a high figure for their level of development.23 This financial depth has, in turn, generated a pool of private sector loans of 60-80 percent of GDP. Governments are often net depositors in the OECS banking systems; their large debts reflect offshore borrowings. In addition to the banks, non-bank intermediaries, most importantly credit unions, have assets equal to over 20 percent of GDP and insurance companies have assets of over 10 percent of GDP. Barbados in many respects, resembles OECS countries, including offshore banking facilities. The OECS also has an Eastern Caribbean Securities Exchange and Barbados its own exchange, but size and trading are small and no-equity has been raised in the markets. Though the small absolute size of the financial systems tends to mean small institutions with high costs, there is strong competition; in the OECS there are over 40 banks (more than half foreign), about 100 non-bank intermediaries, and about 150 life and general insurance companies in the OECS and Barbados also has numerous institutions.
22 According to a recent study by the USAID (2004), there appears to be a duality in the structure of financial intermediation by banks, depending on their ownership structure and place of origin, with private and foreign banks catering to a narrow range of clients, while state-owned banks are the least market-oriented, particularly in the OECS. 23 Foreigners hold about 10 percent of the on-shore deposits. About 15 percent of the deposits are denominated in foreign currency. In addition to the onshore banks, a significant, albeit declining off-shore banking industry exists in Antigua and Barbuda and St. Vincent and the Grenadines.
16
Box 1.2 (continued): The Financial Sector in the Caribbean Yet, despite the surprisingly large lending pool and the competition, small borrowers may have problems in obtaining business loans.
The deepness of the OECS countries’ banking systems and the corresponding volume of private lending reflect the history of macro-economic stability, the currency board (established in 1983) that has fixed the exchange rate to the dollar, and the presence of strong foreign banks. Nonetheless, weaknesses have developed in some of the OECS banking systems. (IMF, 2004). Non-performing loans are high in some countries, particularly in domestic banks. The problems in lending reflect low growth, difficulties in foreclosure of bad loans and in some cases interrelated and concentrated lending. Capital adequacy could be strengthened. Regulation and supervision suffer from some deficiencies, and are complicated by difficulties in consolidated and international supervision and the growing presence of regional banks. Compounding these financial risks are the macroeconomic issues: weak growth, high external debt, and fiscal problems that have led governments in two of the countries, Antigua and Barbuda and Dominica, to accumulate arrears. Interest rates in the countries have fallen much less than US rates in the last 3 years, perhaps reflecting depositors concerns about risks, but also the high legal minimum interest rate on savings deposits (3 percent), which applies to about 20 percent of deposits and which pushes up the cost of funds for borrowers.
The Trinidad and Tobago government is pursuing a regional financial sector strategy, with the objective of developing the financial sector as a source of growth (Finance Ministry, Trinidad and Tobago, 2003), although its financial system is less “deep” than those in the OECS and Barbados. As in the other Caribbean countries, the financial system is “bank dominated” and the capital market is small and inactive. The Royal Bank of Trinidad and Tobago has been expanding in the CARICOM countries by setting up offices (e.g., OECS) and buying banks (e.g., Jamaica). The expansion of the bank raises issues for supervisors in Trinidad and Tobago, as well as in the host countries.
Improving the contribution of finance to Caribbean development will depend on a number of factors. Improving credit access will depend on development of credit bureaus and a better legal and judicial framework for collateral. Securities markets are likely to remain small and inactive because of well-known issues of costs and liquidity in small markets through out the world (See Shah and Thomas, 2003, and Hanson, Honohan and Majnoni, 2003). However, markets for government debt and securitized debt such as mortgages could be developed.
(ii) Empirical Analysis of the Determinants of Growth
1.38 The above analysis is supplemented by a cross-section regression analysis for a sub-set of six countries (Barbados, Dominican Republic, Haiti, Jamaica, Trinidad and Tobago, and Suriname) for the period 1981-2000.24 These countries, which account for over 80 percent of total Caribbean GDP, have been chosen based on data availability. The analysis is based on the framework proposed in Loayza, et. al (2002) where a distinction was made between five major categories of growth determinants: (i) transitional convergence (due to diminishing returns), (ii) cyclical reversion (cyclical recovery or downturn from temporary recessions or booms), (iii) structural policies (education, financial depth, trade openness, government burden, and public infrastructure, (iv) stabilization policies (inflation and RER), and (v) external conditions (terms of trade and prevailing growth conditions in the world.) Box 1.3 provides the definition and theoretical rationale for the inclusion in the model of the above variables.
24 Understanding the determinants of growth through growth regressions requires a large number of countries and a relatively long period. It does not make sense, for example, to try to estimate a model for only fifteen Caribbean countries. Thus, we use the existing empirical results linking the long run growth rates and their determinants based on a world-wide sample, reported in Loayza, et al. (2002). Specifically, the proposed methodology consists of (i) taking the quantitative relationship between the long-run per capita growth rate and the determinants of growth reported in Loayza, et al (2002), and (ii) applying the estimated coefficients to the values of the explanatory variables of the additional Caribbean countries to calculate the “estimated’ or “expected” growth rates for these countries.
17
Box 1.3: Definition and Rationale of Variables Influencing Growth
Structural policies. The endogenous growth literature stresses the importance of good policies and institutions on economic growth. Indicators of major public policies are discussed here briefly. • Human capital. There is a large body of literature and empirical analysis emphasizing the crucial role
human capital plays in economic growth over the long-run (see for instance, Lucas (1988), Barro (1990), and Barro and Lee (1996)). Human capital can impact on economic growth mainly through two different channels. First, through its direct role as a factor of production augmenting the productivity or quality of labor. Second, through serving as a complement to other factors of production, such as physical capital, natural resources, and TFP. Human capital is typically proxied by education indicators in the literature. A particular measure used here is the rate of gross secondary-school enrollment.
• Financial depth. A number of cross-country empirical studies have documented a strong correlation between financial depth and growth. Well-functioning financial systems can influence long-run economic growth thorough different channels. They can lead to profitable investment projects and mobilize savings to finance them. They can facilitate risk diversification by trading, pooling, and hedging financial instruments. Further, they can help monitor firm managers and exert corporate controls. The measure of financial depth used is the ratio of private domestic credit supplied by private institutions to GDP. The use of this variable is justified not only because the private sector has clearer and stronger incentives to perform efficiently, but also because of its close correlation with other relevant variables such as M2/ GDP, market capitalization of GDP, and the turnover ratio.
• Government burden. Despite the important role that governments can play in the provision of public goods and services, government can be a drag on private sector development, by, for example, spending too much and, in doing so, imposing high taxes and borrowing (and so generating high interest rates), distorting markets, and assuming roles more appropriate for the private sector. Previous research has found that not only are measures of government burden correlated with growth, they are also highly endogenous (e.g., Levine and Renelt, 1992). The measure used here to compare government burden across countries is the ratio of government consumption to GDP, one of the most standard in the literature.
• Public infrastructure. Public services and infrastructure can directly enter the production function, improve total factor productivity, and encourage additional private investment. There are few alternative measures of public services. One advocated in the present analysis is the availability of telephone mainlines per 1,000 people.
• International trade openness. Trade encourages countries to exploit their areas of comparative advantage, leading to greater specialization and thus gains in production and allocative efficiency. Trade also expands the potential size of the market each country has access to, which allows domestic firms to take advantage of economies of scale. Finally, by promoting stronger interaction with foreign firms and markets, trade can diffuse both technological innovations and managerial practices, contributing to greater TFP (Loayza, et. al 2002). The typical measure of international openness used in the literature is the volume of trade (exports plus imports) over GDP.
Stabilization policies. Fiscal, monetary and financial policies that contribute to a stable macroeconomic environment are important for long-run growth. By reducing uncertainty, they encourage firm investment, and allow economic agents to concentrate on productive activities rather than on trying to manage high risk. Three variables are included here to account for macroeconomic stability. • Inflation. The inflation rate, which is an indicator of price stability, tends to be a good summary
measure of the quality of fiscal and monetary policies. In general, inflation tends to be positively correlated with fiscal deficit.
• Cyclical volatility of GDP. The indicator of output stability is measured by the cyclical volatility of GDP defined by the standard deviation of the output gap.
• Real Exchange Rate. The index of RER overvaluation is meant to capture the prevalence of policies that distort the allocation of resources between the exporting and domestic sectors, and thereby the risks of external imbalances and balance of payment crises.
18
Box 1.3: Definition and Rationale of Variables Influencing Growth (continued)
External conditions. The growth performance of a country is determined not only by internal factors but also by external conditions. Easterly (2001), for example, finds that global factors, such as the increase in international interest rates, slowdown of growth in industrialized countries, and rise in the debt burden of developing economies may have been relatively more important than country-specific factors in explaining the marked decrease in developing countries’ growth in the past two decades. In this analysis, terms of trade shocks are also included.
Transitional Convergence. The conditional convergence hypothesis maintains that, other things being equal, poor countries should grow faster than the rich countries because of diminishing returns to each factor in the production function. We control for this by including the (log) initial level of GDP per capita of each country in the set of explanatory variables.
Cyclical Reversion. The main objective of cross-country regression is to account for long-run trends in economic growth. Because we work with relatively short time periods, we attempt to account for potential business cycle effects (cyclical recovery or downturn from short-run recessions or booms), by including the "initial output gap"--defined by the (log) difference between the potential and actual output of each country at the start of the period. The potential output is estimated by using the Hodrik-Prescott (HP) filter. Controlling for initial output gap is expected to not only improve the estimate of long-run growth rate from the regression but also avoid overestimating the speed of transitional convergence which we defined above.
1.39 The main findings from the model are presented in Table 1.4 and discussed below:
• Cyclical reversion—one of three non-policy factors—has been the most important determinant factor of growth for the Caribbean over the past two decades, particularly in the 1990s. This is a similar finding as in the study of Latin America (Loayza et al., 2002). In the 1990s, for example, the cyclical reversion accounted for at least half of the predicted growth rate for all the countries in the sample, except Haiti. Transitional convergence accounts for little, with the exception of Suriname where it accounts for 40 percent of the predicted change in growth.
• Structural and, to some extent, stabilization policies, cannot systematically account for the direction or magnitude of change in growth rates (from the 1980s to the 1990s) for most countries in the sample. Structural policies, for example, predict the highest growth improvements in Haiti and Jamaica—the two countries that had the largest negative growth changes in the 1990s. They also predict similar improvements for the Dominican Republic and Trinidad and Tobago—the two countries which had the largest improvements in actual growth during the same period.
Compared to the 1980s, the 1990s saw all six countries improve, with variations, their rate of secondary enrollment; all except Barbados reduced government consumption; all saw improvements in telecommunications (a proxy for infrastructure); and all countries made good progress in trade openness.
Regarding stabilization policies, the picture is mixed. Between the 1980s and 1990s, inflation fell in three countries and increased in the other three. Barbados was the best performer followed by Trinidad and Tobago and the Dominican Republic. In Haiti and Jamaica, price instability has increased in the 1990s (Jamaica in the first half of the 1990s) from already high levels in the 1980s. In the area of RER, three countries (Dominican Republic, Jamaica, and Trinidad and Tobago) have reduced exchange rate distortions over the two periods, while in the other three countries the distortions have increased. Finally, regarding the cyclical volatility of GDP, Haiti is the only country in the sample for which volatility has increased in the 1990s.
• External conditions affected growth negatively for all countries in the sample, but their contribution to growth was mixed. Their contribution accounts for less
19
than one-fourth in the case of Barbados, Dominican Republic and Trinidad and Tobago and more than two-fifths in the case of the remaining three countries.
Table 1.4: Explaining Changes in Growth Between 1980s and 1990s
Source: World Bank staff estimates
1.40 In qualitative terms (i.e., direction of change), the six Caribbean countries performed more or less as predicted by the empirical growth regression model. With two exceptions, Haiti and Suriname, all countries where the model predicted an increase in growth in fact saw their growth accelerate in the 1990s; and where the model predicted a decline they saw their growth rates fall.
1.41 But in quantitative terms (i.e., magnitude of change), the extent of the fit between actual and projected changes varies across countries. Some Caribbean countries did much better than predicted, and some did much worse. Suriname, Trinidad and Tobago and the Dominican Republic are examples of countries where actual growth changes in the 1990s were significantly above what had been projected by the model (by 3.9, 1.3 and 0.9 percentage points, respectively). There are also countries such as Barbados and Haiti where the actual growth changes were significantly below what had been projected (by 1.2 and 0.9 percentage points, respectively). This inability of the model to account for the extent of changes in growth may be due to greater sensitivity to external shocks and/or larger cyclical volatility, the topic of the next section.
E. Economic Vulnerability and Resilience
1.42 Are the Caribbean countries economically vulnerable and if so have they built sufficient resilience? Several recent studies conclude that there is no evidence that small states suffer growth disadvantage because of their small sizes.25The possible factors that can cause small states to be more volatile are well-established in the literature. They include: i) greater trade openness, due to small size of domestic markets and the need to achieve economies of scale; ii) greater exposure to terms of trade risks, due to dependence on fewer export commodities; and iii) a larger government sector, due to the large fixed cost in providing public goods and services. In the case of the Caribbean countries, some have argued that small states suffer from additional sources of volatility such as frequent natural disasters, large share of primary commodity exports, and greater dependence on service exports.
25 These include studies by Easterly and Kraay (2000), Favaro (2004), and the World Bank (2003a).
Actual Predicted Transitional Cyclical Structural Stabilization External Change Change Convergence Reversion Policies Policies Conditions
Growth (%) Barbados 0.67 1.83 -0.08 1.75 0.53 0.11 -0.48 Dominican Rep. 3.66 2.79 -0.05 1.87 1.26 0.23 -0.54 Haiti -0.23 0.69 -0.05 -0.17 1.26 0.18 -0.54 Jamaica -1.82 -1.8 -0.24 -2.41 1.42 0.18 -0.75 Suriname 3.27 -0.62 0.25 -0.69 0.6 -0.19 -0.59 Trinidad/Tobago 3.57 2.29 0.18 1.14 1.28 0.25 -0.56
Distribution (%) Barbados 100 -4 96 29 6 -26 Dominican Rep. 100 -2 67 45 8 -19 Haiti 100 -7 -25 183 26 -78 Jamaica -100 -13 -134 79 10 -42 Suriname -100 40 -111 97 -31 -95 Trinidad/Tobago 100 8 50 56 11 -24
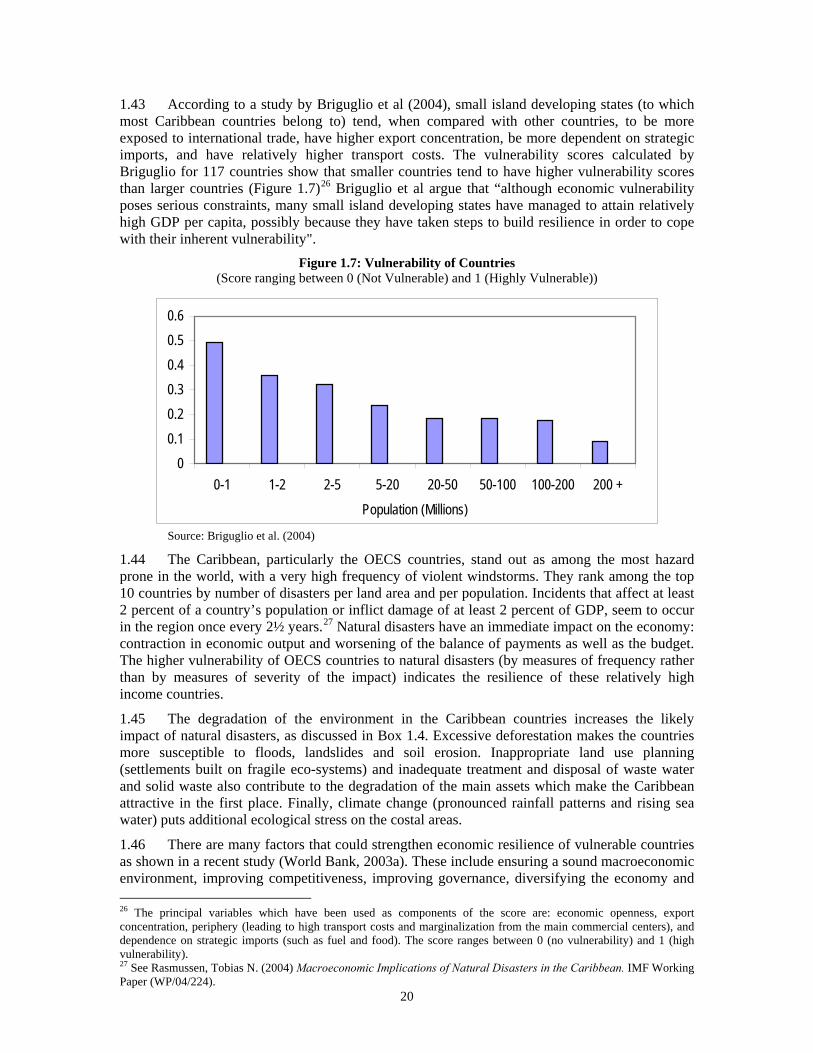
20
1.43 According to a study by Briguglio et al (2004), small island developing states (to which most Caribbean countries belong to) tend, when compared with other countries, to be more exposed to international trade, have higher export concentration, be more dependent on strategic imports, and have relatively higher transport costs. The vulnerability scores calculated by Briguglio for 117 countries show that smaller countries tend to have higher vulnerability scores than larger countries (Figure 1.7)26 Briguglio et al argue that “although economic vulnerability poses serious constraints, many small island developing states have managed to attain relatively high GDP per capita, possibly because they have taken steps to build resilience in order to cope with their inherent vulnerability".
Figure 1.7: Vulnerability of Countries (Score ranging between 0 (Not Vulnerable) and 1 (Highly Vulnerable))
00.10.20.30.40.50.6
0-1 1-2 2-5 5-20 20-50 50-100 100-200 200 +Population (Millions)
Source: Briguglio et al. (2004)
1.44 The Caribbean, particularly the OECS countries, stand out as among the most hazard prone in the world, with a very high frequency of violent windstorms. They rank among the top 10 countries by number of disasters per land area and per population. Incidents that affect at least 2 percent of a country’s population or inflict damage of at least 2 percent of GDP, seem to occur in the region once every 2½ years.27 Natural disasters have an immediate impact on the economy: contraction in economic output and worsening of the balance of payments as well as the budget. The higher vulnerability of OECS countries to natural disasters (by measures of frequency rather than by measures of severity of the impact) indicates the resilience of these relatively high income countries.
1.45 The degradation of the environment in the Caribbean countries increases the likely impact of natural disasters, as discussed in Box 1.4. Excessive deforestation makes the countries more susceptible to floods, landslides and soil erosion. Inappropriate land use planning (settlements built on fragile eco-systems) and inadequate treatment and disposal of waste water and solid waste also contribute to the degradation of the main assets which make the Caribbean attractive in the first place. Finally, climate change (pronounced rainfall patterns and rising sea water) puts additional ecological stress on the costal areas.
1.46 There are many factors that could strengthen economic resilience of vulnerable countries as shown in a recent study (World Bank, 2003a). These include ensuring a sound macroeconomic environment, improving competitiveness, improving governance, diversifying the economy and 26 The principal variables which have been used as components of the score are: economic openness, export concentration, periphery (leading to high transport costs and marginalization from the main commercial centers), and dependence on strategic imports (such as fuel and food). The score ranges between 0 (no vulnerability) and 1 (high vulnerability). 27 See Rasmussen, Tobias N. (2004) Macroeconomic Implications of Natural Disasters in the Caribbean. IMF Working Paper (WP/04/224).
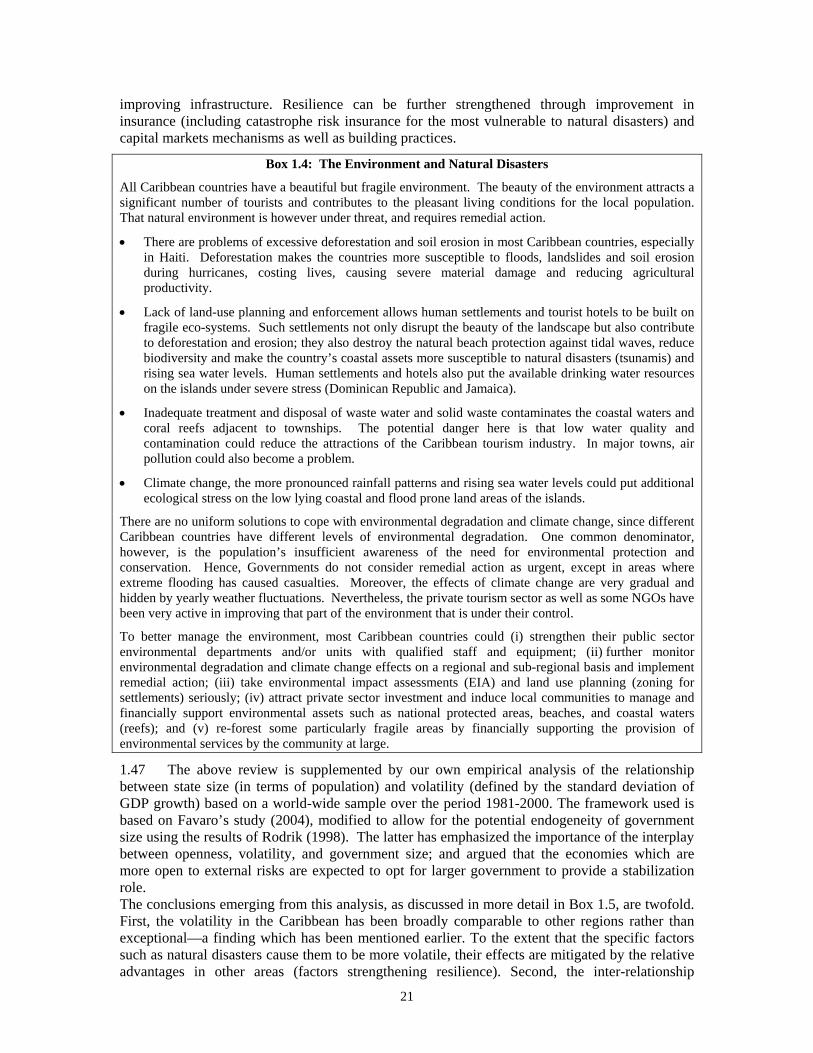
21
improving infrastructure. Resilience can be further strengthened through improvement in insurance (including catastrophe risk insurance for the most vulnerable to natural disasters) and capital markets mechanisms as well as building practices.
Box 1.4: The Environment and Natural Disasters
All Caribbean countries have a beautiful but fragile environment. The beauty of the environment attracts a significant number of tourists and contributes to the pleasant living conditions for the local population. That natural environment is however under threat, and requires remedial action.
• There are problems of excessive deforestation and soil erosion in most Caribbean countries, especially in Haiti. Deforestation makes the countries more susceptible to floods, landslides and soil erosion during hurricanes, costing lives, causing severe material damage and reducing agricultural productivity.
• Lack of land-use planning and enforcement allows human settlements and tourist hotels to be built on fragile eco-systems. Such settlements not only disrupt the beauty of the landscape but also contribute to deforestation and erosion; they also destroy the natural beach protection against tidal waves, reduce biodiversity and make the country’s coastal assets more susceptible to natural disasters (tsunamis) and rising sea water levels. Human settlements and hotels also put the available drinking water resources on the islands under severe stress (Dominican Republic and Jamaica).
• Inadequate treatment and disposal of waste water and solid waste contaminates the coastal waters and coral reefs adjacent to townships. The potential danger here is that low water quality and contamination could reduce the attractions of the Caribbean tourism industry. In major towns, air pollution could also become a problem.
• Climate change, the more pronounced rainfall patterns and rising sea water levels could put additional ecological stress on the low lying coastal and flood prone land areas of the islands.
There are no uniform solutions to cope with environmental degradation and climate change, since different Caribbean countries have different levels of environmental degradation. One common denominator, however, is the population’s insufficient awareness of the need for environmental protection and conservation. Hence, Governments do not consider remedial action as urgent, except in areas where extreme flooding has caused casualties. Moreover, the effects of climate change are very gradual and hidden by yearly weather fluctuations. Nevertheless, the private tourism sector as well as some NGOs have been very active in improving that part of the environment that is under their control.
To better manage the environment, most Caribbean countries could (i) strengthen their public sector environmental departments and/or units with qualified staff and equipment; (ii) further monitor environmental degradation and climate change effects on a regional and sub-regional basis and implement remedial action; (iii) take environmental impact assessments (EIA) and land use planning (zoning for settlements) seriously; (iv) attract private sector investment and induce local communities to manage and financially support environmental assets such as national protected areas, beaches, and coastal waters (reefs); and (v) re-forest some particularly fragile areas by financially supporting the provision of environmental services by the community at large.
1.47 The above review is supplemented by our own empirical analysis of the relationship between state size (in terms of population) and volatility (defined by the standard deviation of GDP growth) based on a world-wide sample over the period 1981-2000. The framework used is based on Favaro’s study (2004), modified to allow for the potential endogeneity of government size using the results of Rodrik (1998). The latter has emphasized the importance of the interplay between openness, volatility, and government size; and argued that the economies which are more open to external risks are expected to opt for larger government to provide a stabilization role. The conclusions emerging from this analysis, as discussed in more detail in Box 1.5, are twofold. First, the volatility in the Caribbean has been broadly comparable to other regions rather than exceptional—a finding which has been mentioned earlier. To the extent that the specific factors such as natural disasters cause them to be more volatile, their effects are mitigated by the relative advantages in other areas (factors strengthening resilience). Second, the inter-relationship
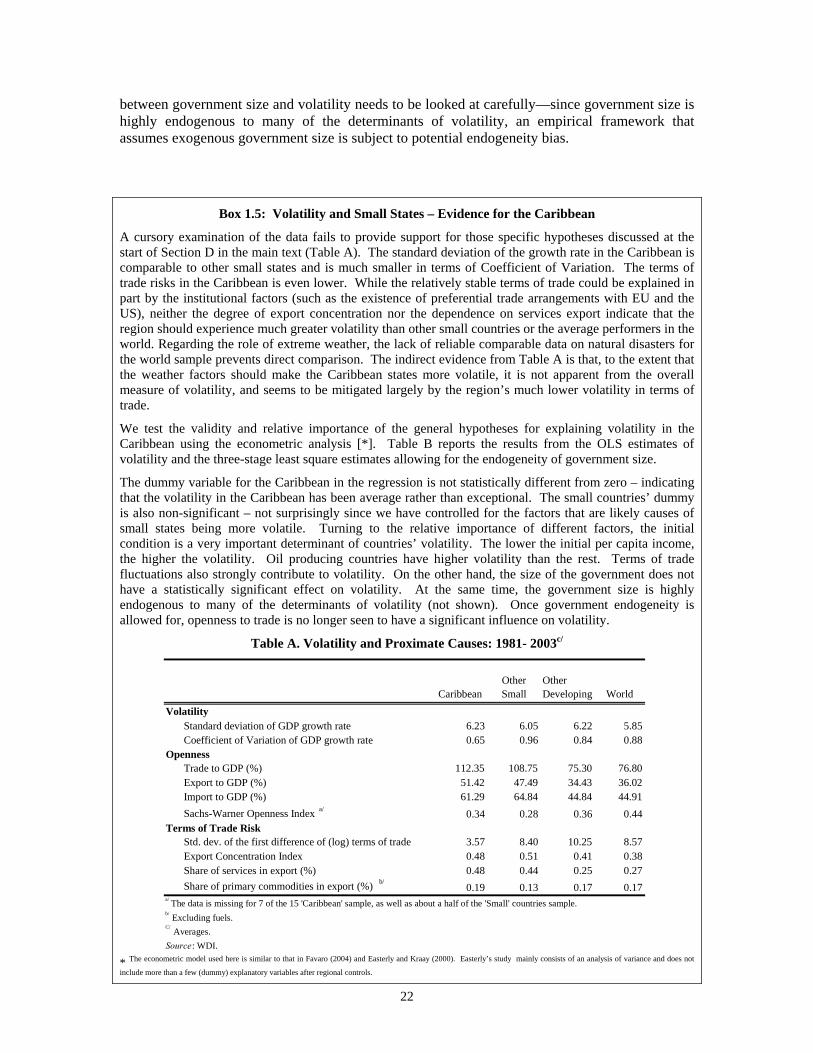
22
between government size and volatility needs to be looked at carefully—since government size is highly endogenous to many of the determinants of volatility, an empirical framework that assumes exogenous government size is subject to potential endogeneity bias.
Box 1.5: Volatility and Small States – Evidence for the Caribbean
A cursory examination of the data fails to provide support for those specific hypotheses discussed at the start of Section D in the main text (Table A). The standard deviation of the growth rate in the Caribbean is comparable to other small states and is much smaller in terms of Coefficient of Variation. The terms of trade risks in the Caribbean is even lower. While the relatively stable terms of trade could be explained in part by the institutional factors (such as the existence of preferential trade arrangements with EU and the US), neither the degree of export concentration nor the dependence on services export indicate that the region should experience much greater volatility than other small countries or the average performers in the world. Regarding the role of extreme weather, the lack of reliable comparable data on natural disasters for the world sample prevents direct comparison. The indirect evidence from Table A is that, to the extent that the weather factors should make the Caribbean states more volatile, it is not apparent from the overall measure of volatility, and seems to be mitigated largely by the region’s much lower volatility in terms of trade.
We test the validity and relative importance of the general hypotheses for explaining volatility in the Caribbean using the econometric analysis [*]. Table B reports the results from the OLS estimates of volatility and the three-stage least square estimates allowing for the endogeneity of government size.
The dummy variable for the Caribbean in the regression is not statistically different from zero – indicating that the volatility in the Caribbean has been average rather than exceptional. The small countries’ dummy is also non-significant – not surprisingly since we have controlled for the factors that are likely causes of small states being more volatile. Turning to the relative importance of different factors, the initial condition is a very important determinant of countries’ volatility. The lower the initial per capita income, the higher the volatility. Oil producing countries have higher volatility than the rest. Terms of trade fluctuations also strongly contribute to volatility. On the other hand, the size of the government does not have a statistically significant effect on volatility. At the same time, the government size is highly endogenous to many of the determinants of volatility (not shown). Once government endogeneity is allowed for, openness to trade is no longer seen to have a significant influence on volatility.
Table A. Volatility and Proximate Causes: 1981- 2003c/
CaribbeanOther Small
Other Developing World
Volatility Standard deviation of GDP growth rate 6.23 6.05 6.22 5.85 Coefficient of Variation of GDP growth rate 0.65 0.96 0.84 0.88
Openness Trade to GDP (%) 112.35 108.75 75.30 76.80 Export to GDP (%) 51.42 47.49 34.43 36.02 Import to GDP (%) 61.29 64.84 44.84 44.91 Sachs-Warner Openness Index a/ 0.34 0.28 0.36 0.44
Terms of Trade Risk Std. dev. of the first difference of (log) terms of trade 3.57 8.40 10.25 8.57 Export Concentration Index 0.48 0.51 0.41 0.38 Share of services in export (%) 0.48 0.44 0.25 0.27 Share of primary commodities in export (%) b/
0.19 0.13 0.17 0.17 a/ The data is missing for 7 of the 15 'Caribbean' sample, as well as about a half of the 'Small' countries sample. b/ Excluding fuels.
Source : WDI. Averages. C/
* The econometric model used here is similar to that in Favaro (2004) and Easterly and Kraay (2000). Easterly’s study mainly consists of an analysis of variance and does not
include more than a few (dummy) explanatory variables after regional controls.
23
Table B. Regression Analysis of Determinants of Volatility
(1) (2) OLS 3SLS Volatility: Initial GDP per capita -0.52 *** -0.63 *** (log, in 1980) (3.73) (4.37) Openness 0.01 *** 0.00 (ratio of total trade to GDP) (2.53) (0.24) TOT volatility 0.08 *** 0.06 ** (stdv. of growth rate of TOT) (2.76) (2.45) Government size 0.01 0.13 (government consumption to GDP) (0.20) (1.56) Small country dummy 0.06 0.00 (=1 if population less than 1.5 million) (0.11) 0.00 Oil exporting country dummy 1.41 * 1.79 *** (1.80) (2.60) Caribbean dummy -0.00 0.26 (-0.00) (0.00) R-squared 0.38 0.35 Number of observations 119 113 Source: Author's estimate Note: t-ratios in parentheses. * Significant at 10%, ** Significant at 5%, *** Significant at 1%
F. Medium-Term Growth Outlook
1.48 Can the Caribbean countries continue to grow and improve welfare of their population in the next decade? The methodology used here to generate projections is based on the cross-country regression framework. In the interest of providing a coherent set of forecasts for as many countries in the sample as possible, the framework has been simplified.28 Other than the cyclical reversion factor, changes in growth rate are assumed to come only from the structural determinants of growth which are under the control of national authorities. These include education, financial depth, trade openness, government burden, and public infrastructure. Other factors, such as changes in the external trade environment, increase in competition, or erosion of preferences, are not taken into account. Also, the forecast does not take into account quality of education, since the education variable refers to secondary enrollment. Alternative growth projections are generated under two scenarios regarding the evolution of growth determinants: a “business-as-usual” scenario, in which a country is assumed to progress on the same path as in the previous decade in each area of structural policy; and a “policy scenario”, in which a country is expected to improve each structural policy variable to the highest quartile of its distribution within the Latin America and Caribbean region.29 Figure 1.8 and Table 1.5 present the findings, with further details provided in Annex Tables 1.10 and 1.11.
28 We assume: (i) a minor role of stabilization policy determinants in the next decade; (ii) transitory convergence to be zero; and (iii) no change in the terms of trade. 29 The two hypothetical scenarios considered to generate growth projections are highly tentative and are meant only for illustrative purposes. As stated above, the projections are based on cross-country growth regression, which is a useful tool to analyze patterns of correlation between growth rates and their potential determinants across countries based on historical data, but not to establish causation (see, for example, Bosworth and Collins, 2003, for a discussion).
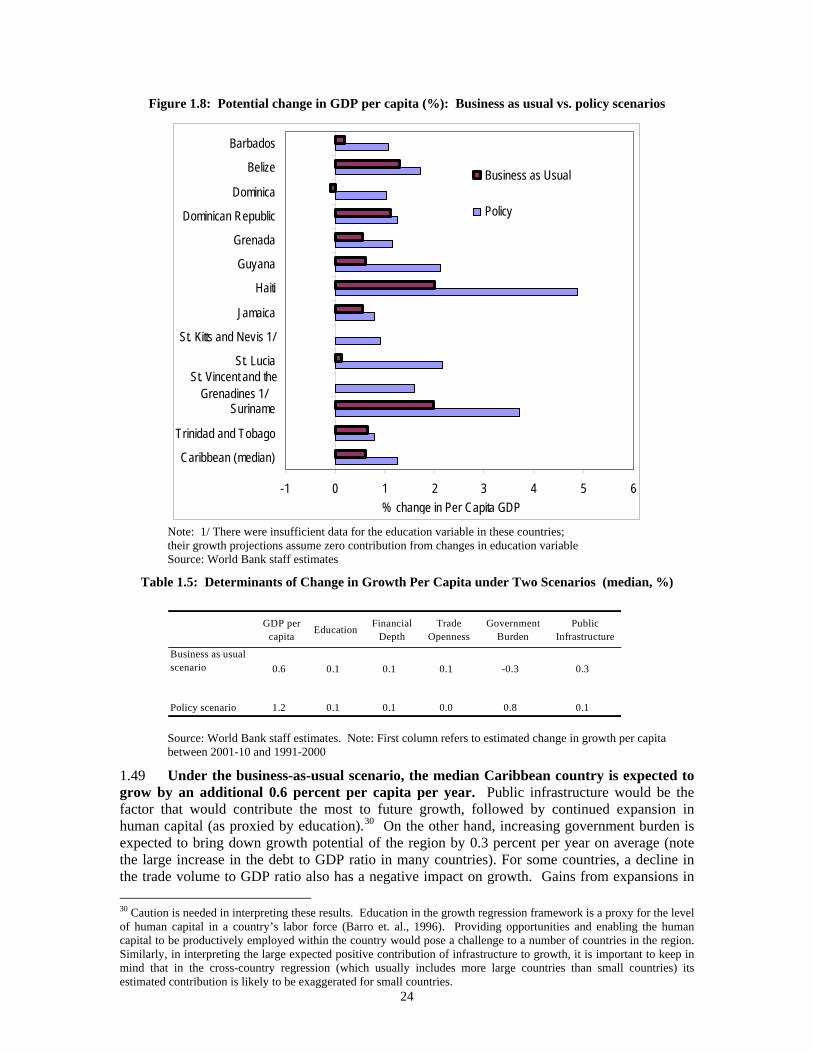
24
Figure 1.8: Potential change in GDP per capita (%): Business as usual vs. policy scenarios
-1 0 1 2 3 4 5 6
Caribbean (median)
Trinidad and Tobago
Suriname
St. Lucia
St. Kitts and Nevis 1/
Jamaica
Haiti
Guyana
Grenada
Dominican Republic
Dominica
Belize
Barbados
% change in Per Capita GDP
Business as Usual
Policy
St. Vincent and the Grenadines 1/
Note: 1/ There were insufficient data for the education variable in these countries; their growth projections assume zero contribution from changes in education variable
Source: World Bank staff estimates
Table 1.5: Determinants of Change in Growth Per Capita under Two Scenarios (median, %)
Source: World Bank staff estimates. Note: First column refers to estimated change in growth per capita between 2001-10 and 1991-2000
1.49 Under the business-as-usual scenario, the median Caribbean country is expected to grow by an additional 0.6 percent per capita per year. Public infrastructure would be the factor that would contribute the most to future growth, followed by continued expansion in human capital (as proxied by education).30 On the other hand, increasing government burden is expected to bring down growth potential of the region by 0.3 percent per year on average (note the large increase in the debt to GDP ratio in many countries). For some countries, a decline in the trade volume to GDP ratio also has a negative impact on growth. Gains from expansions in 30 Caution is needed in interpreting these results. Education in the growth regression framework is a proxy for the level of human capital in a country’s labor force (Barro et. al., 1996). Providing opportunities and enabling the human capital to be productively employed within the country would pose a challenge to a number of countries in the region. Similarly, in interpreting the large expected positive contribution of infrastructure to growth, it is important to keep in mind that in the cross-country regression (which usually includes more large countries than small countries) its estimated contribution is likely to be exaggerated for small countries.
GDP per capita Education Financial
DepthTrade
OpennessGovernment
BurdenPublic
Infrastructure Business as usual scenario 0.6 0.1 0.1 0.1 -0.3 0.3
Policy scenario 1.2 0.1 0.1 0.0 0.8 0.1
25
education and infrastructure are expected to continue to contribute to growth in a number of countries. Among the countries which are expected to grow faster than the median Caribbean countries are: Haiti, Suriname, Dominican Republic and Belize; and among those which are projected to lag behind are: Dominica, St. Lucia and Barbados.
1.50 The country with the largest projected acceleration in growth is Suriname, which comes from deepening of financial sector and expansion in infrastructure. On the other hand, Dominica, St. Lucia and Barbados are the three countries that are projected to experience slowdown in growth, largely on account of an increase in government burden. Under the business-as-usual scenario, the slowest growing country in the region during the next decade is expected to be Haiti, at a negative rate of more than 1.0 percent per capita per year.
1.51 Under the “policy scenario”, whereby each policy explanatory variable jumps to the 75th percentile of its distribution in the Latin America and Caribbean region, the projected acceleration in per capita growth would be 1.2 percent per year, or twice the rate achieved under the first scenario. Over half of the gain in growth would come from the reduction in government burden. For a number of countries, other areas of structural determinants (especially trade openness) are expected to add little or nothing to accelerate growth. This is because a number of countries in the Caribbean have already achieved substantial progress in the policy determinants of growth and are already at the top 25 percent of the LAC distribution, and have less to gain from policy reform in these areas. Among the countries which would benefit the most from further structural reform are: Suriname and Haiti (benefiting from all structural reform areas); Trinidad and Tobago (from trade openness); and Dominican Republic and Guyana (from education and infrastructure). On the other hand, most Caribbean countries “fall behind” in terms of large government burden in the economy and thus would have more to gain from making progress toward region-wide standards in this respect. In interpreting this result, it should be remembered, as explained above, that larger size of the government observed for many in the Caribbean is partly explained by (or not independent of) the small size and much greater openness of their economies.31
1.52 The projections under both scenarios need to be interpreted with caution, as other critical factors such as competition, skills and technology, as well as political stability and governance, are not taken into account. As discussed throughout the report, the environment is rapidly changing, leading to stiff competition and unless the Caribbean countries become more competitive, even the modest achievements under the “business as usual scenario” would be threatened. Worldwide trends show that sustained growth needs sustained TFP increases.
1.53 Improving productivity and diversification would be necessary to achieve the higher growth rates under the policy scenario. The decline in productivity has been documented earlier in this chapter, and would need to be reversed if growth rates are to improve. Moreover, new areas for efficient and profitable investment would also be required, given the declining productivity in existing activities, and would require, inter alia, improvements in the investment climate. As shown in Chapter 5 and elsewhere, opportunities do exist for Caribbean countries to diversify their economies away from the traditional sectors—namely: tourism, mineral extraction, and agriculture—which have attracted the bulk of FDI in the past. Higher value-added products such as fisheries and organic vegetables are promising areas. Barbados and, to a lesser extent, Antigua and Barbuda have gained from offshore business; Dominican Republic and Trinidad and Tobago have seen some increase in manufacturing activities. In the apparel sector, some comparative advantage in high value-added goods, especially where timeliness is important, may survive the dismantling of the MFA agreement. Offshore education and ICT-enabled activities are also areas of potential growth, particularly for English speaking countries. Finally,
31 The cross-country regression framework based on world-wide data does not take account of the country size or endogeneity of many of the growth determinants in the model, especially policy variables, which are among its main weaknesses.
26
introduction of eco-tourism in Guyana; sports tourism such as diving and yachting; entertainment tourism ranging from the reggae sounds of Jamaica, to the Creole festival in Dominica, the jazz festival in St. Lucia, and the Carnival in Trinidad and Tobago; and health tourism in St. Lucia and Trinidad and Tobago, are slowly emerging in place of just sand-sea-sun related services.
G. Conclusion—Overall Policy Directions
1.54 Five main policy conclusions arise from the above analysis. First, there is a need to improve the region’s economic productivity if past downward growth trend is to be reversed and sustained at relatively high level. Business as usual would no longer be able to sustain growth in the next decade. The cross-country analysis in this chapter indicates clearly that the underlying determinants of growth have been of a declining importance over time (which has also led to declining TFP growth, since the same factors also affect TFP). While the long-run per capita growth in the region has been higher than most other regions in the world–only second to East Asia over the last four decades—and has become increasingly more stable, it has been on a secular declining trend since the end of the 1970s. Unlike LAC, there has been no “lost decade” in the 1980s for the Caribbean, instead, growth continued to slow down in the 1990s. The gap between the poor and rich countries in the Caribbean has widened in the last forty years.
1.55 Decomposition of growth by sector showed that the strong growth in earlier decades was driven by the services sector (which grew at 5 percent per year in the 1960s and 1970s). Over time, the countries have managed to expand this sector which offset a contraction of agriculture. The sectoral shift continued to bolster growth in the 1980s even after the services sector growth had begun to falter. The slowdown in growth in the 1990s was explained by a large decline in TFP. A further investigation into the sources of growth based on growth accounting focusing on the last two decades has found similar results as those obtained above. As discussed in Chapter 4, trade preferences, largely in agriculture, did not drive growth, contrary to the general belief in the region. Traditional sources of growth—largely driven by tourism—have experienced declining returns and cannot be counted on in the future under a business-as-usual scenario. Consequently new sources of growth and economic diversification are needed.
1.56 Second, continued improvements in education, infrastructure, and trade openness are likely to help improve growth on a sustained basis over the medium and long-term. The analysis of determinants of growth (explaining past growth) found few or no surprises. Improvements in education, infrastructure, and further openness to trade have contributed positively to growth in the 1990s compared to the 1980s. A decline in trade volume has been the most common source of growth deceleration in the 1990s, along with adverse external conditions. In the future, continued improvements in education, infrastructure, and trade openness are likely to directly affect productivity (TFP) and therefore growth, along with the institutions that affect the investment climate.
1.57 Third, a reduction in the size of government—that is a better definition of the role of the state—is crucial from the point of view of growth enhancement (directly and indirectly). While the analysis has shown that large government size in the region is largely endogenous to greater openness and vulnerability to external shocks, the growing trend in government size in a number of countries, combined with some evidence of weakening financial depth and loss of price stability, suggests that improvements in these areas are crucial to both reducing the direct negative influence on growth as well as indirectly in improving the investment climate.
1.58 Fourth, while FDI seems to be closely linked to growth, a deeper analysis is needed of the link between migration, remittances and growth. FDI has been a very important source of investment in the Caribbean region. It has been an important vehicle for the transfer of technology. Although specific studies on the Caribbean region do not exist, it is likely that FDI has contributed more to growth than domestic investment, as evidenced in empirical studies on other regions. To help reverse the decline in productivity, the investment climate needs to improve in order to attract higher quality FDI, while maintaining and even increasing the quantity
27
of FDI. Although remittances have also been substantial, they seem to have played more a role of stabilizing consumption than contributing to investment. Policies to reduce the costs of migration (such as increasing fees for tertiary education) would help to improve the overall impact of labor mobility. At the same time, deeper analysis is needed of the link between migration, remittances and growth in the Caribbean.
1.59 Fifth, macroeconomic stability has to be maintained at all time, if economic growth is to be sustained. There are two sets of countries. Those which have achieved macroeconomic stability, though fragile it may be; and those which have either not achieved stability or seen their achievement reversed in recent years. The latter group of countries needs to attach high priority to sustainable fiscal policy and debt management. This takes on increased importance given the recent reduction in aid flows.
1.60 The rest of the report examines in depth the above key areas affecting the growth and competitiveness of the Caribbean region.
28
Chapter 2 Improving Government Finances and Expenditure
A. Introduction
2.1 During the 1990s, the Caribbean countries announced a major shift in development strategy, towards greater reliance on private sector-led growth, and, correspondingly, a reform of their public sectors. The public sector reform involved reducing the public enterprises’ role and reforming governments to provide both a better enabling environment for private sector growth and improved traditional public services. The shift in strategy was in many cases expressed in public declarations, for example in statements at the 1994 Caribbean Group of Cooperation in Economic Development.
2.2 The private sector-led development strategy reversed the state-led approach to development that had dominated the Caribbean for much of the previous thirty years. Beginning in the 1960s and 1970s, the Caribbean nations, along with many developing countries, expanded the role of their public sectors significantly. This expansion reflected a desire to “do something” to speed development, combined with socialist and nationalist ideologies, politics, and attempts at redistribution. The increased role of the public sector also involved a much expanded interpretation of the traditional economic rationales for the public sector—natural monopolies, income redistribution, “merit” goods and market failures, externalities and public goods (Musgrave, 1959). Government intervened in markets through laws and regulations, nationalized private enterprises, and set-up public enterprises. However, the state-led approach to development proved ineffective. The market interventions protected high cost and inefficient public and private enterprises, contributed to corruption, and led to a slow down in growth.32 The public enterprises usually had difficulties in charging prices that covered costs or in collecting fees; they usually provided poor service, and often were “captured” by the employees or particular groups in society to the detriment of customer service at reasonable costs. Moreover, technical developments, such as cell phones, and new approaches, such as unbundling the services in power and telephones, reduced some of the traditional economic rationale for government intervention, or changed its emphasis to one of improved regulation rather than public production.
2.3 In the 1990s, these economic issues and a change in political ideology led many Caribbean nations, along with many other developing countries, to shift to a private sector-led, market-based development strategy and to reform their public sectors. Protection of inefficient import substitution was cut, exports were promoted, regulations limiting markets and red tape were reduced. In the Caribbean, sell-offs or closures of loss-making state-owned enterprises began around 1990 in many countries (World Bank, 1996). All of these changes were not successful and some back-tracking developed. For example, some protection has been restored and problems developed after the financial liberalization in Jamaica and some re-nationalizations have occurred, such as Air Jamaica and the power sector in the Dominican Republic. And privatizations of public utilities have gone slowly and not always successfully.
2.4 The transition to a more market-based, private sector-led development model is not automatic or easy. The appropriate size of the public enterprise sector depends on country conditions. In particular, it depends on sectoral conditions, like natural monopolies and externalities. These conditions, to the extent that they exist, can be addressed either by actual production of goods and services by public enterprises or by regulation of private enterprises.
32 Worldwide, measured growth tended to rise when import substitution occurred. However, much of that growth typically reflected deficiencies in national accounting methodology; the new firms’ value added was added to national accounts without adjusting for the difference between international prices and the higher prices of import substitutes resulting from protection. In the longer run, as import substitution possibilities were exhausted, growth became more capital intensive and tended to slow.
29
The Caribbean’s history suggests that the public sector has difficulty in replicating the pressures for efficiency generated by market discipline and in some countries, shielding itself from corruption. Hence, the Caribbean countries have continued with the general strategy of reducing the role of public enterprises, liberalizing markets, and encouraging competition. Chapter 8 discusses the situation and suggests further reforms that might be made in infrastructure.
2.5 Reform of Caribbean government expenditures has been less successful, however—government expenditures, as well as taxes and debt, have actually risen substantially since the first half of the 1990s in the Caribbean. Again, no simple rule defines the appropriate size of government; it depends on country conditions. Countries like those in the Caribbean, with strong voice and governance and the associated strong democracies tend to have larger government sectors, for example to provide basic education and health, as well as infrastructure. However, these underlying strengths do not explain the substantial growth in Caribbean government expenditures in recent years.
2.6 Large government spending, particularly a large government that does not deliver services commensurate with the high tax level that supports it and with a large debt that raises concerns of a crisis, tends to dampen private sector-led growth.33 Private sector-led growth and an attractive investment climate are intimately linked with effectiveness in Government expenditures, the tax burden, non-preemption of resources by government debt, and macroeconomic stability. To make a private sector-led development strategy work, government must deliver services effectively, compared to the taxes and fees it charges, and maintain a debt level that does not crowd-out private investment and is consistent with macroeconomic stability. (See Box 2.1 for an innovative experiment in Jamaica to deliver government services through executive agencies, the pilot program for which has seen at least some success. Also, some OECS countries, in an attempt to control burgeoning costs and improve service delivery, are also undertaking public sector reform in some many areas. Regional initiatives include the Eastern Caribbean Supreme Court, the Eastern Caribbean Central Bank, the Eastern Caribbean Economic Management Program, and the Pharmaceutical Procurement Services).34
Box 2.1: Public Sector Reform: Jamaica's Executive Agency Experiment
There are some noteworthy efforts in the region to create more efficient public sectors. Jamaica has adapted the Executive Agency concept as a feature of its pilot Public Sector Modernization Project (PSMP). Launched in 1996, the project has created the institutional basis for the performance management of selected central government departments (designated as Executive Agencies--"EAs"). Modeled on reforms in the United Kingdom, New Zealand and Canada, the EAs are service delivery agencies, being empowered with greater authority and having incentives in place to manage and allocate resources in order to produce results. The EAs determine their strategic positioning and core businesses, formulate performance regimes, and develop new human resource policies and practices to meet the Government's stated performance requirements. Their transformation has also entailed the introduction of modern IT and financial management systems, including the use of accrual accounting for planning and reporting. To date, eight agencies have completed their implementation phases and one new agency (Child Development Agency) was designated in June 2004 in Jamaica. The pilot program has achieved positive service delivery and financial outcomes and appears also to have been positive in overall net cost-benefit terms. Many challenges remain, however, including adoption of an incentives framework that is incomplete owing to continuing central control over posts and remuneration for most jobs. The Government of Jamaica has under consideration a possible risk management approach to address this problem.
Other countries in the Caribbean, mainly Grenada, are studying the EA process in Jamaica with an interest to adapt that experience to their own public sector modernization.
Source: Wearne, M. Expert on Jamaica's Executive Agencies, and an International Consultant, Draft Note on EAs (forthcoming).
33 Chapter 1 discusses the negative relationship between the government size and growth in cross country data. 34 See OECS (2004) “Public Sector Transformation” Eastern Caribbean Central Bank, 11-12 November 2004, Paper No. OECS/AUT/04/40/22.
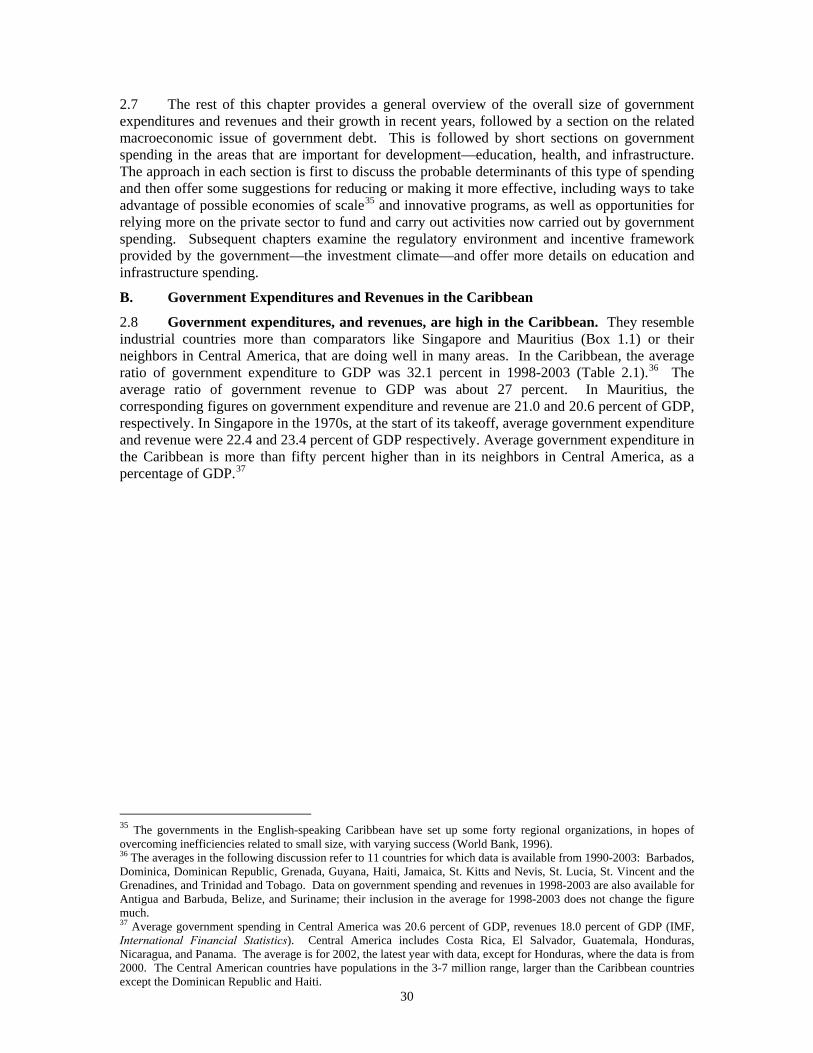
30
2.7 The rest of this chapter provides a general overview of the overall size of government expenditures and revenues and their growth in recent years, followed by a section on the related macroeconomic issue of government debt. This is followed by short sections on government spending in the areas that are important for development—education, health, and infrastructure. The approach in each section is first to discuss the probable determinants of this type of spending and then offer some suggestions for reducing or making it more effective, including ways to take advantage of possible economies of scale35 and innovative programs, as well as opportunities for relying more on the private sector to fund and carry out activities now carried out by government spending. Subsequent chapters examine the regulatory environment and incentive framework provided by the government—the investment climate—and offer more details on education and infrastructure spending.
B. Government Expenditures and Revenues in the Caribbean
2.8 Government expenditures, and revenues, are high in the Caribbean. They resemble industrial countries more than comparators like Singapore and Mauritius (Box 1.1) or their neighbors in Central America, that are doing well in many areas. In the Caribbean, the average ratio of government expenditure to GDP was 32.1 percent in 1998-2003 (Table 2.1).36 The average ratio of government revenue to GDP was about 27 percent. In Mauritius, the corresponding figures on government expenditure and revenue are 21.0 and 20.6 percent of GDP, respectively. In Singapore in the 1970s, at the start of its takeoff, average government expenditure and revenue were 22.4 and 23.4 percent of GDP respectively. Average government expenditure in the Caribbean is more than fifty percent higher than in its neighbors in Central America, as a percentage of GDP.37
35 The governments in the English-speaking Caribbean have set up some forty regional organizations, in hopes of overcoming inefficiencies related to small size, with varying success (World Bank, 1996). 36 The averages in the following discussion refer to 11 countries for which data is available from 1990-2003: Barbados, Dominica, Dominican Republic, Grenada, Guyana, Haiti, Jamaica, St. Kitts and Nevis, St. Lucia, St. Vincent and the Grenadines, and Trinidad and Tobago. Data on government spending and revenues in 1998-2003 are also available for Antigua and Barbuda, Belize, and Suriname; their inclusion in the average for 1998-2003 does not change the figure much. 37 Average government spending in Central America was 20.6 percent of GDP, revenues 18.0 percent of GDP (IMF, International Financial Statistics). Central America includes Costa Rica, El Salvador, Guatemala, Honduras, Nicaragua, and Panama. The average is for 2002, the latest year with data, except for Honduras, where the data is from 2000. The Central American countries have populations in the 3-7 million range, larger than the Caribbean countries except the Dominican Republic and Haiti.
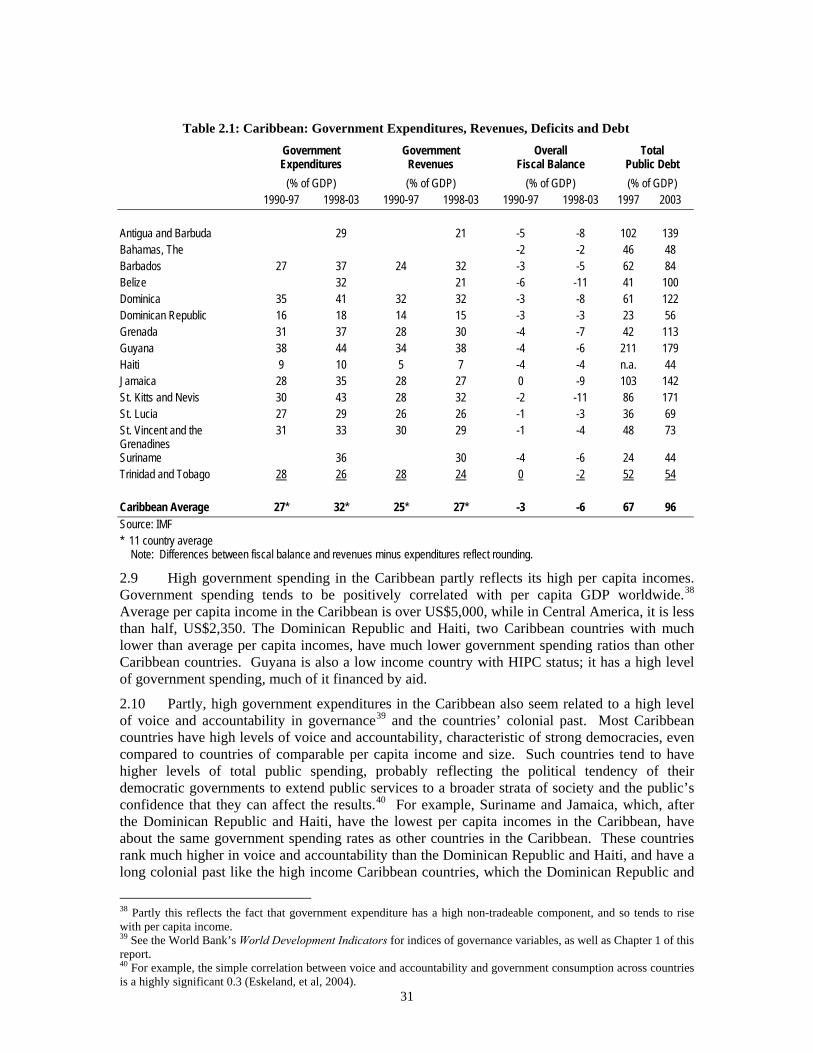
31
Table 2.1: Caribbean: Government Expenditures, Revenues, Deficits and Debt
Government Expenditures
Government Revenues
Overall Fiscal Balance
Total Public Debt
(% of GDP) (% of GDP) (% of GDP) (% of GDP) 1990-97 1998-03 1990-97 1998-03 1990-97 1998-03 1997 2003
Antigua and Barbuda 29 21 -5 -8 102 139 Bahamas, The -2 -2 46 48 Barbados 27 37 24 32 -3 -5 62 84 Belize 32 21 -6 -11 41 100 Dominica 35 41 32 32 -3 -8 61 122 Dominican Republic 16 18 14 15 -3 -3 23 56 Grenada 31 37 28 30 -4 -7 42 113 Guyana 38 44 34 38 -4 -6 211 179 Haiti 9 10 5 7 -4 -4 n.a. 44 Jamaica 28 35 28 27 0 -9 103 142 St. Kitts and Nevis 30 43 28 32 -2 -11 86 171 St. Lucia 27 29 26 26 -1 -3 36 69 St. Vincent and the Grenadines
31 33 30 29 -1 -4 48 73
Suriname 36 30 -4 -6 24 44 Trinidad and Tobago 28 26 28 24 0 -2 52 54
Caribbean Average 27* 32* 25* 27* -3 -6 67 96 Source: IMF * 11 country average Note: Differences between fiscal balance and revenues minus expenditures reflect rounding.
2.9 High government spending in the Caribbean partly reflects its high per capita incomes. Government spending tends to be positively correlated with per capita GDP worldwide.38 Average per capita income in the Caribbean is over US$5,000, while in Central America, it is less than half, US$2,350. The Dominican Republic and Haiti, two Caribbean countries with much lower than average per capita incomes, have much lower government spending ratios than other Caribbean countries. Guyana is also a low income country with HIPC status; it has a high level of government spending, much of it financed by aid.
2.10 Partly, high government expenditures in the Caribbean also seem related to a high level of voice and accountability in governance39 and the countries’ colonial past. Most Caribbean countries have high levels of voice and accountability, characteristic of strong democracies, even compared to countries of comparable per capita income and size. Such countries tend to have higher levels of total public spending, probably reflecting the political tendency of their democratic governments to extend public services to a broader strata of society and the public’s confidence that they can affect the results.40 For example, Suriname and Jamaica, which, after the Dominican Republic and Haiti, have the lowest per capita incomes in the Caribbean, have about the same government spending rates as other countries in the Caribbean. These countries rank much higher in voice and accountability than the Dominican Republic and Haiti, and have a long colonial past like the high income Caribbean countries, which the Dominican Republic and
38 Partly this reflects the fact that government expenditure has a high non-tradeable component, and so tends to rise with per capita income. 39 See the World Bank’s World Development Indicators for indices of governance variables, as well as Chapter 1 of this report. 40 For example, the simple correlation between voice and accountability and government consumption across countries is a highly significant 0.3 (Eskeland, et al, 2004).
32
Haiti do not. More equal distributions of income also may contribute to higher levels of public spending—when income distribution is more unequal, the higher income recipients may be less willing to bear taxes to pay for social services mostly consumed by others.
2.11 Government expenditures have grown rapidly in the Caribbean, despite the shift toward greater reliance on private sector led growth. In the last five years, government spending averaged 32 percent of GDP, up from 27 percent of GDP in 1990-97 (Table 2.1). Government spending has risen in every country for which there is data in the two periods. Government revenues have also grown, rising from an average of 25 percent of GDP to 27 percent for the same periods. However, with spending rising faster then revenues, fiscal deficits, and borrowing requirements, have increased by about 3 percentage points of GDP. Fiscal deficits have risen in almost every country, and fiscal adjustment has become an issue in many countries.
2.12 The rising government expenditures and deficit reflect three major factors that vary from country to country: rising wage bills, rising capital spending, and rising interest costs. First, in some countries, the public sector wage bill has risen substantially, despite the shift to a private sector led-development strategy. For example, in Jamaica, wages paid by the government have risen from 7.9 percent of GDP in 1993-94 to 1995-96 to 11.9 percent of GDP in 2001-02 to 2003-04, with public sector employment rising from about 90,000 to over 120,000 in the same period (World Bank, 2004b). In St. Kitts and Nevis, central government employment rose 54% between 1995 and 2001, while in Dominica, central government employment grew 15 percent over the same period. The government has provided jobs in a situation where private sector employment, particularly in the formal sector, has grown slowly. However, this has often generated an overstaffing at lower levels, with relatively high pay. At the upper levels, salaries are low compared to the private sector and it is often difficult to retain trained professionals. Adjustments in staffing, along with relative wages are needed to limit the growth of the wage bill. Such adjustments will be difficult especially since public sector employees are an important part of the electorate. Yet, if such adjustments are not made, then the costs of the wage bill will have to be borne by the taxpayers, and the high taxes will inhibit private sector growth.
2.13 Rising capital spending has also contributed to rising government expenditures in some countries and even fiscal crises. Capital expenditures have risen sharply, for example, in Barbados, Dominica, Grenada, and St. Kitts and Nevis. However, in some of the larger countries, capital spending has been reduced (as a percent of GDP), in Jamaica’s case, for example, to offset the rising wage bill and rising debt costs. Capital spending is, of course, a traditional government activity. The issues are, what is the appropriate level of capital spending by the government, given financing constraints, development needs, and the possibilities of private sector provision of infrastructure. These issues are taken up again in the latter part of this chapter, and for infrastructure in more detail in Chapter 8.
2.14 Tax revenues, as well as government expenditures, are relatively high in the Caribbean, as noted. Moreover, many of the countries have raised their tax revenues since the period 1990-1997, though not by as much as expenditures. This reflects both some increases in tax rates and some improvements in tax administration.
2.15 An upcoming tax issue for the Caribbean is the loss of tariff revenue. Tariff revenues, which account for an average of about 15 percent of total government revenues, are expected to fall sharply as a result of free trade within the FTAA. Thus, expenditure must be reduced, other revenues increased, or a value added tax be imposed in order to avoid a further rise in fiscal deficits.
C. Interest Expenditures and the Debt Issue
2.16 High and rising debt levels are both a major factor in the changes in government interest expenses and deficits in the Caribbean over the last seven years. In the 15 Caribbean countries, the ratio of total public sector debt to GDP was estimated to average a high 96 percent
33
in 2003, as discussed in Chapter 1 and shown in Table 2.1. By contrast, in Mauritius the ratio was 38 percent in 2003, and in the 6 Central American countries the average debt to GDP ratio was 65 percent (World Bank, Global Development Finance). Singapore’s public sector external debt was only 14 percent of GDP in 1979, but its internal public sector debt was about 60 percent of GDP, reflecting its ability to tap the high local savings rate.
2.17 Public sector debt is both a consequence and a cause of government spending and deficits. Countries’ fiscal deficits, along with public enterprise borrowing, the resolution of financial crises and assumption of government guaranteed private enterprise debt, generate public sector debt. Then, that rising debt, plus the assumption of public enterprise debt, has generated new government expenditures and contributed to further government deficits and debt increases. Reflecting this process in the Caribbean, the average ratio of public sector debt to GDP has risen nearly 25 percent since 1997.41 In contrast, the average debt ratio has actually fallen in Central America since 1997, although this decline largely reflects write-downs of large debt overhangs in Honduras and Nicaragua.
2.18 As discussed in Chapter 1, in almost every Caribbean country, public sector debt is an issue, with public sector debt levels rising sharply since 1997 from already high levels (Table 2.1). Two major exceptions are the Bahamas and Trinidad and Tobago. Antigua and Barbuda experienced only a small rise in the debt to GDP ratio but its public sector debt exceeds GDP and still generates large interest expenses. Guyana, has benefited from substantial bilateral and multilateral debt forgiveness but still has a debt to GDP ratio of over 150 percent (Table 2.1).
2.19 In the other countries, debt developments were worse. In Belize, Dominica, Grenada, and St. Kitts and Nevis, the debt to GDP ratio was close to or exceeded 100 percent in 2003 and had roughly doubled between 1997 and 2003. In 2003, Dominica experienced a debt crisis and some of its debt was restructured in 2004. In Suriname, St. Lucia, and the Dominican Republic, the debt ratio also roughly doubled between 1997 and 2003, albeit from lower levels. The Dominican Republic’s lower debt ratio was one factor in the Dominican Republic’s lower government expenditures during the period 1997-2003. However, the recent financial crisis and the resulting large depreciation pushed both public sector debt and interest expenditures, relative to GDP in 2004. In Barbados and St. Vincent and the Grenadines, debt to GDP ratios rose 35-50 percent, a growth rate of debt that is probably not sustainable. Finally in Jamaica, there was a sharp rise in debt after the financial crisis in the mid-1990s, to slightly over 100 percent of GDP in 1997. Since that time debt has continued to rise, with government spending continuing to rise because of growth in government interest and wage expenditures, and despite devotion of a substantial portion of revenue to interest payments; in 2003 it stood at over 140 percent of GDP.
41 The analysis of this process can be sharpened somewhat by splitting fiscal deficits into primary surpluses—the difference between revenues and non-interest expenditures—and interest expenditures. Primary surpluses are an indicator of the impact of fiscal management on the fiscal deficit and debt in a stable situation, while interest expenses are an indicator of how fast the debt is growing as a result of interest alone. For example, if the primary surplus were zero, and interest expenses as a percentage of GDP were equal to the nominal growth rate of GDP, then the ratio of debt to GDP would remain constant. The average primary surplus deteriorated by over 2 percent of GDP in the Caribbean in 1998-2003, compared to 1990-1997. Countries with less than 1 percent deterioration in the primary surplus were the Bahamas, the Dominican Republic, Jamaica, St. Lucia and Guyana (IMF, 2005). Thus part of the rising debt can be attributed to a deterioration in fiscal management. However, a constant primary surplus is only an imperfect indicator of sound debt management. First, when the average real interest rates on debt rises, as was the case for much of the period 1998-2003, compared to 1990-1997, the primary surplus must be increased to avoid a rise in the ratio of debt to GDP. This is particularly the case for market borrowers. Second, many of the Caribbean countries absorbed public enterprise or private debt or, in the case of Jamaica, used public sector debt to resolve a financial crisis. Again in this case, a constant primary surplus will not keep the ratio of debt to GDP constant, a higher primary surplus being needed to prevent a worsening of the debt to GDP ratio. Jamaica illustrates these points. It had a large, roughly constant average primary surplus of over 8 percent of GDP in both periods, but it was a market borrower and also experienced a financial crisis, which it resolved by injecting debt into the financial system, and taking over some public enterprise debt. Despite the massive primary surplus, Jamaica nonetheless experienced a rise in its debt to GDP ratio from 103 percent in 1997 to 140 percent in 2003.
34
2.20 The high interest costs of public sector debt represent a burden on taxpayers. Countries with high debt ratios must raise enough taxes to generate a primary surplus—revenues less non-interest expenditures—that keeps debt stable.42 Thus, high debt countries, like many of the Caribbean countries, must have relatively high taxes, limit non-interest spending, or default on their debts.
2.21 High public debt and interest expenditures and the corresponding need for high taxes represent a deterrent to private investment and thus a deterrent to growth. High public sector debt tends to push up interest rates and crowd-out private borrowing.43 The high tax regime needed to pay the interest on the debt obviously deters foreign direct investment, particularly when the taxes do not generate government services. Domestic investors are similarly deterred by high interest costs and high taxes.44 Tax incentives are not an effective way to attract investors in high tax environments (Box 2.2).
Box 2.2: The Incentives Issue: Difficulties in Offsetting High Tax Rates with Tax Incentives
Caribbean countries have often used tax incentives to offset their high tax rates, notably in the tourism industry. Such tax incentives have the disadvantage of creating substantially different effective tax rates across industries, not to mention within an industry.1 Tax incentives may have a role in correcting market externalities, but this is not an issue in the tourist industry. Caribbean countries often argue they need incentives to attract one of the limited number of tourist industry investors, but the results typically benefit only the investor. Moreover, excessive incentives may end up actually costing the government on balance. This is especially true when the incentives are not transparent, simple, and automatic (For a discussion of these points see LeCraw, 2004).
To reduce this competition among countries, a 1973 CARICOM agreement attempted to harmonize incentives but the signatories have actually paid little attention to it. From time to time, a new agreement has been suggested, but it seems likely to fail for the same reasons as the 1973 agreement has failed. A better alternative than tax incentives might be an attempt to deal with more investors and encourage tourists directly, rather than selling through the few all-in-one tourist operators.
Moreover, tax incentives are often not a factor attracting investors in the tourist industry, and have difficulties in offsetting the major disadvantage facing many countries—the macroeconomic situation. Studies suggest that factors other than tax incentives—infrastructure, law and order, and the macroeconomic situation—are more relevant to potential investors.
An unstable macroeconomic situation makes tax incentives not credible. High debt countries cannot commit themselves credibly to maintain tax incentives. If they have high interest costs—they have an incentive to default on the tax incentives once an investor is established in the country. Hence, the initial incentives must be very high, in order to keep the expected recovery period for the foreign investors short,
42 To some extent, interest costs can be financed by borrowing. This partly explains why indebted countries have increased their borrowing and deficits. Interest charges partly reflect some loss of purchasing power on principal. Borrowing countries can probably borrow enough to cover this inflation component, and even keep up with real growth, assuming their continued good macroeconomic situation is sufficient to encourage lenders to maintain a constant exposure relative to nominal GDP. This phenomenon explains why countries that become large borrowers may automatically run somewhat larger fiscal deficits. The issue is whether the borrowing countries’ demands for loans are sustainable, i.e. whether they imply a constant ratio of debt to GDP, or an unsustainable rise in the ratio of debt to GDP. Sustainability requires a primary surplus in the fiscal accounts sufficient to cover the excess of interest costs over nominal GDP growth (measured in a single currency). As noted in footnote 9, the primary surplus must be raised if interest rates rise or the government assumes debt, in order to keep the debt to GDP ratio constant. 43 In the open economies of the Caribbean, interest rates typically reflect external interest rates, plus a country risk premium. Countries with high government interest expenditures typically have fairly high risk premiums, because of investor concerns over a potentially disruptive debt crisis. These rates, plus government borrowing on- and off-shore, tend to crowd-out private borrowing or pre-empt funds available under fixed country limits. 44 To some extent, investment in owner-occupied housing may be less subject to such disincentives, particularly if home ownership is widespread. Investments in owner-occupied housing generate implicit income that is not usually subject to income taxes. Property taxes may be assessed on housing to capture some of this implicit income. However, widespread home ownership may make it politically difficult to impose property taxes. This analysis, as well as subsidies for home ownership and public provision of houses, may explain Jamaica’s continued high investment rate in housing, despite high interest expenditures and a high tax to GDP ratio.
35
an unstable equilibrium. Thus, the issue may not be competing for a few investors by offering more incentives, but trying to offset an underlying macroeconomic problem with excessive incentives.
Footloose industries, setting up in export zones, are less affected by these risks because the export zones automatically involve lower effective tax rates than domestic businesses. Moreover, footloose industries are, by definition, easier to move if it seems likely that their taxes may rise. Concerns about possible new taxes, as well as NAFTA and the development of export zones elsewhere in Latin America, may explain the departure of export zone companies from Jamaica after its financial crisis. In any case, with the expected wind-up of export zones in 2007 under WTO agreements, the high tax rates in the Caribbean countries are likely to pose even more of a deterrent to export zone companies. 1 Artana and Navajas, 2002, illustrate the large differences in effective tax rates across industries in Jamaica, largely reflecting the substantial differences in incentives.
2.22 Reducing high interest costs and the related high tax regime either through restructurings or higher primary surpluses are thus important to stimulating investment and growth in the Caribbean. Restructurings of large official debt are one possibility. In many countries of the Caribbean, public sector debt reflects substantial loans from official sources to the Caribbean governments. However, programs for concessionary official restructurings are typically aimed at much lower income countries than the Caribbean. In other countries, such as Jamaica, debt is mostly to private international lenders or backing domestic bank deposits as a result of the post-crisis restructurings. Reducing the cost of private external borrowings and domestic government debt would require a default, which is an unattractive policy, if not prohibited, in Caribbean countries.
2.23 The alternative to restructurings is high primary surpluses. Jamaica has adopted this approach, achieving primary surpluses that average roughly nine percent of GDP. Nonetheless, Jamaica’s public sector debt has increased over the last few years, because of takeovers of contingent liabilities, spending related to natural disasters, and slippages before elections. Of course, high primary surpluses extract a major cost in terms of foregone government expenditure in social and physical infrastructure, which puts a premium on efficiency of expenditure that does actually occur (see below).
2.24 One way to increase primary surpluses could be to improve tax revenues. While reducing tax incentives, improving tax administration and taxing the large informal sectors do present some possibilities for revenue gains, these alone will not be sufficient. And attempts to increase primary surpluses by tax rate increases could be counter-productive in the Caribbean, since tax revenues already represent a significant fraction of GDP in most countries (save for the Dominican Republic, Haiti, Antigua and Barbuda and Belize), and higher tax rates might deter growth.
2.25 The most fruitful approach to increasing primary surpluses is lower and better government spending, along with greater reliance on the private sector to substitute for providing services now provided by the government. The next two sections discuss some policy options for reducing and improving efficiency of expenditures for three major components of government spending in the Caribbean, viz., education, health and capital expenditures.
D. Government Spending on Education
2.26 Government education expenditures are high in the Caribbean compared to other countries. On average, Caribbean governments spent an average of 4.9 percent of GDP on education and US$330 per capita over the period 1995-2002, ranging from a high of US$860 per capita in Barbados to US$110 in the Dominican Republic.45 The average Caribbean figures are much higher than in the rest of Latin America and nearly the same as the average for all countries (Table 2.2). Excluding the Dominican Republic, with its low spending on public education, government educational spending in the Caribbean averages 5.1 percent of GDP and US$350 per
45 These figures exclude Haiti, for which government educational spending data are unavailable.
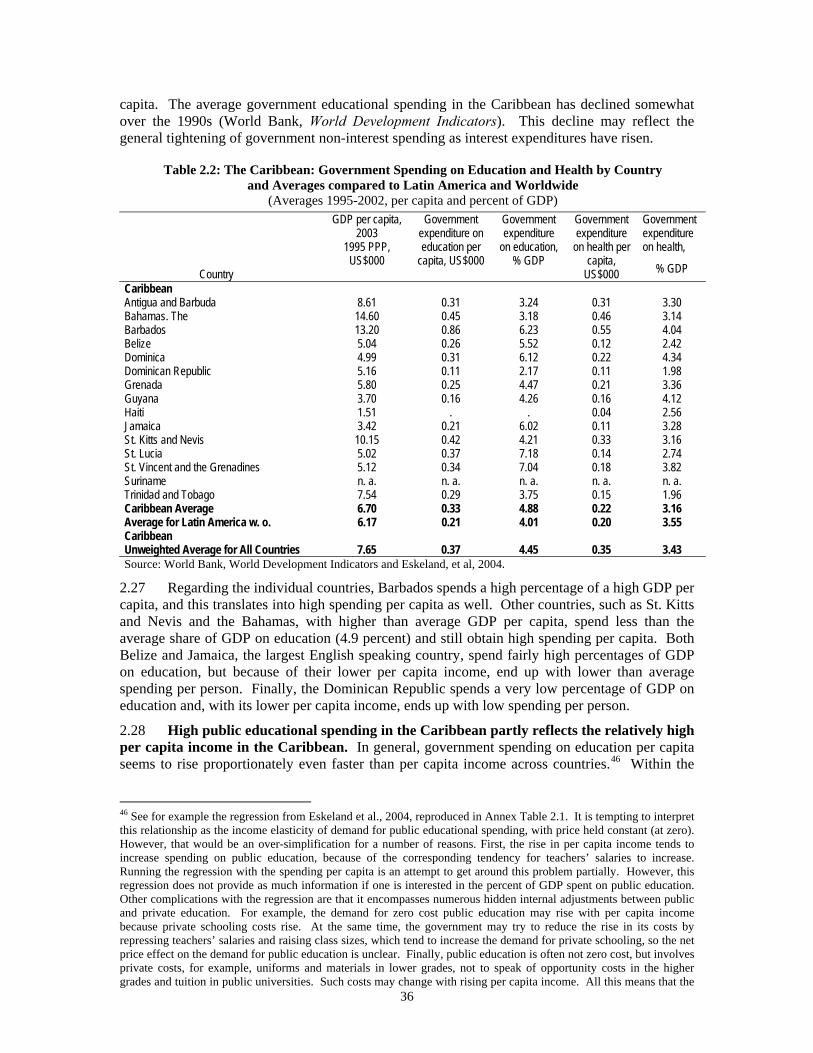
36
capita. The average government educational spending in the Caribbean has declined somewhat over the 1990s (World Bank, World Development Indicators). This decline may reflect the general tightening of government non-interest spending as interest expenditures have risen.
Table 2.2: The Caribbean: Government Spending on Education and Health by Country and Averages compared to Latin America and Worldwide
(Averages 1995-2002, per capita and percent of GDP)
Country
GDP per capita, 2003
1995 PPP, US$000
Government expenditure on education per
capita, US$000
Government expenditure
on education, % GDP
Government expenditure
on health per capita,
US$000
Government expenditure on health,
% GDP Caribbean Antigua and Barbuda 8.61 0.31 3.24 0.31 3.30 Bahamas. The 14.60 0.45 3.18 0.46 3.14 Barbados 13.20 0.86 6.23 0.55 4.04 Belize 5.04 0.26 5.52 0.12 2.42 Dominica 4.99 0.31 6.12 0.22 4.34 Dominican Republic 5.16 0.11 2.17 0.11 1.98 Grenada 5.80 0.25 4.47 0.21 3.36 Guyana 3.70 0.16 4.26 0.16 4.12 Haiti 1.51 . . 0.04 2.56 Jamaica 3.42 0.21 6.02 0.11 3.28 St. Kitts and Nevis 10.15 0.42 4.21 0.33 3.16 St. Lucia 5.02 0.37 7.18 0.14 2.74 St. Vincent and the Grenadines 5.12 0.34 7.04 0.18 3.82 Suriname n. a. n. a. n. a. n. a. n. a. Trinidad and Tobago 7.54 0.29 3.75 0.15 1.96 Caribbean Average 6.70 0.33 4.88 0.22 3.16 Average for Latin America w. o. Caribbean
6.17 0.21 4.01 0.20 3.55
Unweighted Average for All Countries 7.65 0.37 4.45 0.35 3.43 Source: World Bank, World Development Indicators and Eskeland, et al, 2004.
2.27 Regarding the individual countries, Barbados spends a high percentage of a high GDP per capita, and this translates into high spending per capita as well. Other countries, such as St. Kitts and Nevis and the Bahamas, with higher than average GDP per capita, spend less than the average share of GDP on education (4.9 percent) and still obtain high spending per capita. Both Belize and Jamaica, the largest English speaking country, spend fairly high percentages of GDP on education, but because of their lower per capita income, end up with lower than average spending per person. Finally, the Dominican Republic spends a very low percentage of GDP on education and, with its lower per capita income, ends up with low spending per person.
2.28 High public educational spending in the Caribbean partly reflects the relatively high per capita income in the Caribbean. In general, government spending on education per capita seems to rise proportionately even faster than per capita income across countries.46 Within the
46 See for example the regression from Eskeland et al., 2004, reproduced in Annex Table 2.1. It is tempting to interpret this relationship as the income elasticity of demand for public educational spending, with price held constant (at zero). However, that would be an over-simplification for a number of reasons. First, the rise in per capita income tends to increase spending on public education, because of the corresponding tendency for teachers’ salaries to increase. Running the regression with the spending per capita is an attempt to get around this problem partially. However, this regression does not provide as much information if one is interested in the percent of GDP spent on public education. Other complications with the regression are that it encompasses numerous hidden internal adjustments between public and private education. For example, the demand for zero cost public education may rise with per capita income because private schooling costs rise. At the same time, the government may try to reduce the rise in its costs by repressing teachers’ salaries and raising class sizes, which tend to increase the demand for private schooling, so the net price effect on the demand for public education is unclear. Finally, public education is often not zero cost, but involves private costs, for example, uniforms and materials in lower grades, not to speak of opportunity costs in the higher grades and tuition in public universities. Such costs may change with rising per capita income. All this means that the
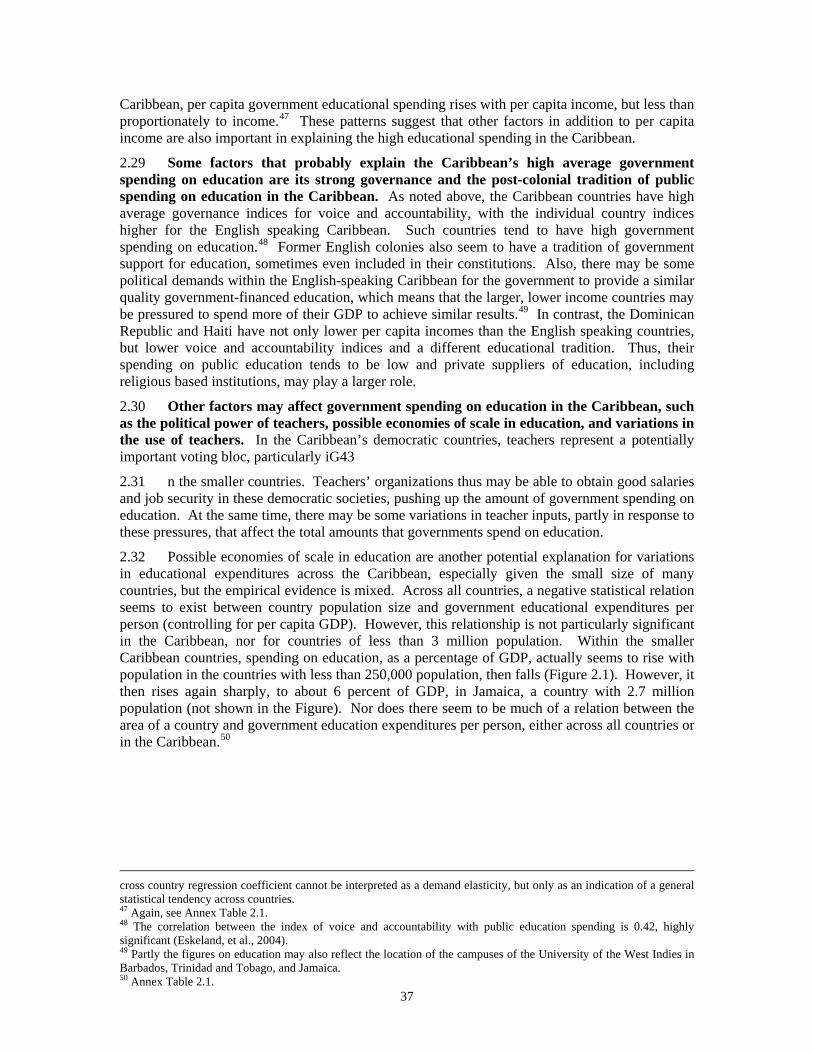
37
Caribbean, per capita government educational spending rises with per capita income, but less than proportionately to income.47 These patterns suggest that other factors in addition to per capita income are also important in explaining the high educational spending in the Caribbean.
2.29 Some factors that probably explain the Caribbean’s high average government spending on education are its strong governance and the post-colonial tradition of public spending on education in the Caribbean. As noted above, the Caribbean countries have high average governance indices for voice and accountability, with the individual country indices higher for the English speaking Caribbean. Such countries tend to have high government spending on education.48 Former English colonies also seem to have a tradition of government support for education, sometimes even included in their constitutions. Also, there may be some political demands within the English-speaking Caribbean for the government to provide a similar quality government-financed education, which means that the larger, lower income countries may be pressured to spend more of their GDP to achieve similar results.49 In contrast, the Dominican Republic and Haiti have not only lower per capita incomes than the English speaking countries, but lower voice and accountability indices and a different educational tradition. Thus, their spending on public education tends to be low and private suppliers of education, including religious based institutions, may play a larger role.
2.30 Other factors may affect government spending on education in the Caribbean, such as the political power of teachers, possible economies of scale in education, and variations in the use of teachers. In the Caribbean’s democratic countries, teachers represent a potentially important voting bloc, particularly iG43
2.31 n the smaller countries. Teachers’ organizations thus may be able to obtain good salaries and job security in these democratic societies, pushing up the amount of government spending on education. At the same time, there may be some variations in teacher inputs, partly in response to these pressures, that affect the total amounts that governments spend on education.
2.32 Possible economies of scale in education are another potential explanation for variations in educational expenditures across the Caribbean, especially given the small size of many countries, but the empirical evidence is mixed. Across all countries, a negative statistical relation seems to exist between country population size and government educational expenditures per person (controlling for per capita GDP). However, this relationship is not particularly significant in the Caribbean, nor for countries of less than 3 million population. Within the smaller Caribbean countries, spending on education, as a percentage of GDP, actually seems to rise with population in the countries with less than 250,000 population, then falls (Figure 2.1). However, it then rises again sharply, to about 6 percent of GDP, in Jamaica, a country with 2.7 million population (not shown in the Figure). Nor does there seem to be much of a relation between the area of a country and government education expenditures per person, either across all countries or in the Caribbean.50
cross country regression coefficient cannot be interpreted as a demand elasticity, but only as an indication of a general statistical tendency across countries. 47 Again, see Annex Table 2.1. 48 The correlation between the index of voice and accountability with public education spending is 0.42, highly significant (Eskeland, et al., 2004). 49 Partly the figures on education may also reflect the location of the campuses of the University of the West Indies in Barbados, Trinidad and Tobago, and Jamaica. 50 Annex Table 2.1.
38
Figure 2.1: Caribbean: Educational Spending /GDP in Countries with Under 1 Million People
2.33 A fairly significant relationship between country size and the number of pupils per teacher seems to exist in smaller countries, notably the Caribbean (Figure 2.2 and Annex Table 2.2). One interpretation of these results, which could contribute to higher costs in smaller countries, is that there may be some economies of scale in classroom size (although there appears to be little relation with area, which might be thought to be one explanation for smaller class size). Another is that there are some economies in administration (administrators in schools are often classified as teachers). However, there does not seem to be much of a relationship between costs (spending per capita) and population in the Caribbean. Thus the observed increased teachers per pupil in smaller countries seem to be offset by lower ratios of non-teaching costs. Another interpretation is that political pressures in smaller economies may increase the numbers of teachers, relative to the number of students, again with an offsetting reduction in non-teacher costs.
Figure 2.2: Primary School Pupil to Teacher Ratio (PTR)
Source: Eskeland, et al, 2004
2.34 A number of possibilities exist for savings on educational costs but the issue is whether this will affect quality. The possibilities are discussed in more detail in Chapter 7. One possibility, related to scale economies, is spreading administrative costs over more countries, through the joint purchases of materials, and consolidating schools to reduce administrative costs and increase class sizes. Of course, the question is whether the economies of scale are being gained at the expense of the non-measured costs. For example, joint purchases of materials may
Caribbean: Educational Spending/GDP in Countries with Under 1 Million People
012345678
0 100 200 300 400 500 600 700 800
Population Thousands
Educ
.Spe
ndin
g/G
DP
%
0
0 ,5
1
1 ,5
2
2 ,5
3
3 ,5
4
4 ,5
-6 -4 -2 0 2 4 6 8
L o g P o p u la tio n , m ln .
Log
PTR
C aribbean
39
mean that the materials are delivered to one island and then have to be transported to the other islands. The costs of transport must be included to compute any savings. Consolidating schools and increasing class sizes would save on administrative costs, but would mean that children have to spend more time going to and from school—a non-measured cost—which may even deter attendance.
2.35 Attracting more overseas students for education and training could also offer scope for scale economies, such as in spreading fixed costs of expensive laboratory equipment and opening up possibilities of greater specialization in disciplines, as is happening in the case of offshore medical education in Grenada and Dominica (see Chapter 5).
2.36 Other possibilities for savings may raise even clearer issues of quality. Class sizes could be increased, particularly in the smaller islands, even without consolidating schools. However, there is a long-standing debate on the impact of class sizes on quality. There does seem to be some positive relation across all countries between teacher to student ratios in primary schools and secondary enrollments, which may be an indicator of quality, but more simply this may reflect differences in national commitments to (public) education. (The issue of education quality in general is dealt with in Chapter 7; one aspect of quality is raised in Box 2.3, viz., the possibility of using arm’s length authority to reduce local capture and so raise standards. Another such example, unrelated to education, is the Caribbean Court of Justice, established in 1998 under the CSME).
Box 2.3: Educational Quality and Cross-country Institutions
Educational quality is affected not only by class and school size but also with political tensions such as those between the learning goals for students and the sometimes opposing interests of employees and bureaucrats. One example of where such tensions may arise is that of standards for student testing.
Independent educational jurisdictions may be helped by a higher level, joint authority setting standards for student testing, to prevent them from settling for a low common denominator (Costrell, 1997). Giving the Caribbean Examination Council (see also Chapter 7) a greater role could help to raise standards, as well as facilitate labor market integration (World Bank, 2002a).
2.37 Another possibility for savings may be greater reliance on private education. Private schools may be less subject to political pressures that push up teachers’ salaries and dictate smaller than necessary class sizes. One approach to using private educational facilities more could be to provide students with “vouchers” to attend private schools that have been accredited—an approach that Jamaica has begun. Alternatively, students attending private schools could be given a subsidy to ensure that students from poorer families are not kept out of schools by costs. Indeed, various countries have used additional subsidies to keep poorer students in schools, for example by providing students from poor families with free school lunches or providing poor families who keep their children in school with direct subsidies.
2.38 Finally, a substantial portion of public spending on education reflects higher education, which is highly subsidized. Students in higher education, particularly tertiary education, tend to be drawn from better-off families. Moreover, tertiary graduates often migrate meaning the countries do not benefit from the spending for their education. Thus, the benefits of tertiary education are largely private and any social returns may be earned offshore. Net savings on tertiary education spending could be realized by charging higher tuition and fees for public tertiary education, with a program of scholarships and loans to ensure that qualified students from lower income families can attend. As noted above, all these potential cost-saving measures are discussed more fully in Chapter 7.
E. Government Spending on Health
2.39 Caribbean government’s spending on health is relatively low, in contrast to their spending on education. On average, health spending by the Caribbean governments averaged 3.16 percent of GDP and US$220 per capita over the period 1995-2002, ranging from a high of
40
US$550 per capita in Barbados to US$40 in Haiti (Table 2.2). Excluding the low spending countries of Haiti and the Dominican Republic, the Caribbean figures are still relatively low, 3.30 percent of GDP and US$245 per capita. The Caribbean averages compare with an average spending of 3.67 percent of GDP in Central America (which has a much lower average per capita income), 3.55 percent of GDP and US$200 per capita in Latin America outside the Caribbean and 3.43 percent of GDP and US$350 per capita in all countries (Table 2.2). Thus, while the Caribbean countries tend to spend more than the average country on education, they spend less than average on health. Finally, average government spending on health in the Caribbean has remained a roughly constant percentage of GDP over the last decade.
2.40 Across all countries, government spending on health seems to rise with per capita income, even more rapidly than education spending. Thus, the Caribbean governments seem to spend somewhat less on health than might be expected, in contrast to their spending on education. One explanation might be a somewhat different attitude to public health in the Caribbean compared to public education. However, voice and governance indices are strongly related internationally to public spending on health, suggesting the same governance factors affect health as education. Moreover, estimates of private spending on health suggest that private expenditures in the Caribbean on health are in many cases even lower, relative say to Central America, than public expenditures. Thus, low public spending on health does not seem to reflect offsetting high private spending.
2.41 The Caribbean seems to have a relatively small number of physicians and, to a lesser degree, hospital beds (Table 2.3). Both these figures are influenced by the low figures in Haiti and the Dominican Republic. The number of physicians (working in the public and private sector) seems to increase with per capita income and with population, across all countries and within the Caribbean. The number of hospital beds also seems to rise with per capita income, but decline with population, again across all countries and within the Caribbean. In both cases the relationships with income are fairly significant in statistical terms across all countries and the Caribbean, while the relationships with population are more tenuous in statistical terms for the Caribbean countries.51 Finally, despite the low number of hospital beds, there appears to be some excess capacity, for example, in Trinidad and Tobago.
Table 2.3: The Caribbean: Doctors and Hospital Beds compared to Latin America, and All Countries
(average per 1000 population, 1995-2002)
Hospital Beds Physicians Caribbean (physicians, 15 countries; hospital beds, 15) 3.60 0.81 Latin America (23; 21) 3.14 1.59 All Countries (181; 122) 5.02 1.46 Source: World Bank, World Development Indicators.
2.42 To what extent do the data suggest economies of scale in public sector spending on health, and thus that some savings might be available by combing activities across countries? There does seem to be a tendency for costs per capita to decrease with population across all countries, and, to a less significant degree, within the Caribbean. However, exactly how the economies might be realized is a question. One possibility is the tendency for economies of scale in hospital beds, reflecting the need for hospitals to be of a certain size. However, this observation certainly applies only to fairly small countries, i.e., the economies of scale in hospital size are exhausted fairly quickly. Moreover, the CARICOM countries already take advantage of economies of scale through cross-border movement of patients between major hospitals and the smaller island economies of the region, under shared service arrangements. Second, in the case of the Caribbean, the relevant divisor is not solely population, but needs to be inflated to reflect
51 Annex Table 2.3
41
the numbers of tourists. While tourists do not think about hospital facilities when deciding to travel, an island that lacks acceptable hospitals may develop a bad reputation. Hence, it probably pays to maintain reasonable hospital facilities as part of the “cost” of the tourist industry.
2.43 Cost savings in public expenditures on health probably exist. In terms of economies of scale, there is the possibility of combining services such as laboratory tests and bulk purchases of drugs. However, the savings from combining purchases may be offset by then costs of splitting up and transporting bulk shipments to multiple destinations. The Eastern Caribbean Pharmaceutical Procurement Services seems to have reduced costs fairly significantly by its bulk buying. One negative is that there have been problems of reimbursements from some member governments. Presumably some economies of scale might also be realized on administrative expenses in public health, as there are in education. Islands might combine the administration of multiple government hospitals, as they might on administration of education. However, the gains from this are probably fairly small, except for the smallest islands.
2.44 A second possibility for cost savings is exploring the substitution of lower for higher cost health professionals and charging reasonable fees. Using non-physician, health professionals at non-hospital medical facilities has been recommended in many countries. However, these facilities often remain underutilized—the patients may simply go to hospitals, where they can see a “doctor”. Substituting non-hospital facilities for hospitals and physicians depends on setting reasonable fee differentials and on the non-hospitals building up a good reputation in the community they serve. Governments also need to think about reasonable cost recovery from hospital care, taking into account that treating catastrophic illnesses entails a large element of government-provided insurance.
2.45 Exactly how private physicians might be brought in is not an easy question. Setting up medical insurance, which would be needed to include private physicians completely, is far from easy and might even result in higher costs to the government. And, it is not clear that private physicians currently have underutilized capacity.
2.46 One approach to reducing the government’s net expenditure on health care might be to promote “Health Tourism”. Countries like Singapore and India are entering this field. Initially these countries supplied health services to nearby countries where the quality of medical care was lower. However, India and some other countries are now providing services at much lower costs than developed countries, and receiving patients. The English-speaking Caribbean has some good possibilities in health tourism, given its good tourist facilities and its established health and medical service industry. Some examples already exist of “health tourism” in the Caribbean, ranging from health and wellness services (such as Le Sport in St. Lucia), to rehabilitation services (such as Island Dialysis in Barbados and The Crossroads Center in Antigua); to plastic surgery and eye surgery, performed mostly in the private sector. There are substantial opportunities for Caribbean countries to compete in this market. Certainly the tourist industry can promote health and wellness facilities. Expanding more complex activities would require a standard of care and accreditation that attracted patients, and acceptance by the health care insurance in the industrial countries of treatment in the Caribbean beyond emergencies.
F. Government Capital Expenditures
2.47 Government capital spending, especially infrastructure, has traditionally been a major component of government spending. Governments, or public enterprises with government guarantees for their financing, have constructed roads, airports, and telephone, power, and water networks in the Caribbean. In recent years, private provision of infrastructure, particularly in telecommunications and power, has become more important. However, this change mainly affects investment by public enterprises, not government capital expenditures.
2.48 Government capital spending in the Caribbean has averaged nearly 6 percent of GDP over the last seven years and has actually risen by about one percent of GDP since the mid-1990s,
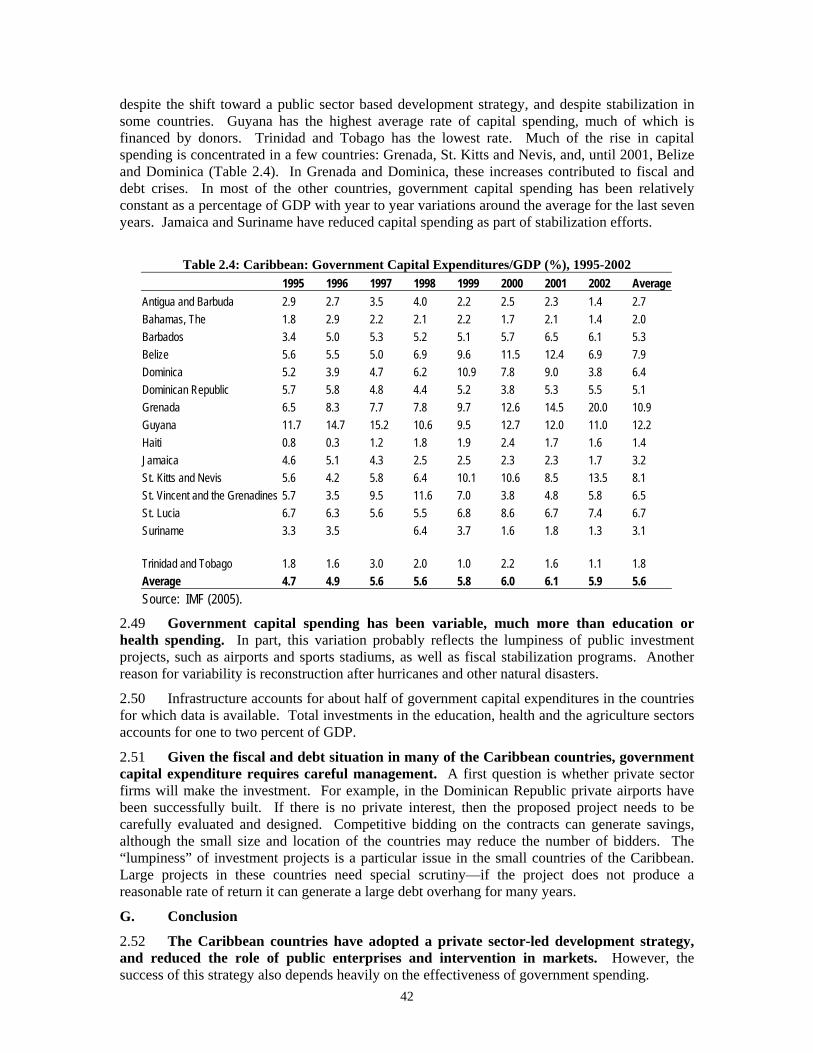
42
despite the shift toward a public sector based development strategy, and despite stabilization in some countries. Guyana has the highest average rate of capital spending, much of which is financed by donors. Trinidad and Tobago has the lowest rate. Much of the rise in capital spending is concentrated in a few countries: Grenada, St. Kitts and Nevis, and, until 2001, Belize and Dominica (Table 2.4). In Grenada and Dominica, these increases contributed to fiscal and debt crises. In most of the other countries, government capital spending has been relatively constant as a percentage of GDP with year to year variations around the average for the last seven years. Jamaica and Suriname have reduced capital spending as part of stabilization efforts.
Table 2.4: Caribbean: Government Capital Expenditures/GDP (%), 1995-2002 1995 1996 1997 1998 1999 2000 2001 2002 Average Antigua and Barbuda 2.9 2.7 3.5 4.0 2.2 2.5 2.3 1.4 2.7 Bahamas, The 1.8 2.9 2.2 2.1 2.2 1.7 2.1 1.4 2.0 Barbados 3.4 5.0 5.3 5.2 5.1 5.7 6.5 6.1 5.3 Belize 5.6 5.5 5.0 6.9 9.6 11.5 12.4 6.9 7.9 Dominica 5.2 3.9 4.7 6.2 10.9 7.8 9.0 3.8 6.4 Dominican Republic 5.7 5.8 4.8 4.4 5.2 3.8 5.3 5.5 5.1 Grenada 6.5 8.3 7.7 7.8 9.7 12.6 14.5 20.0 10.9 Guyana 11.7 14.7 15.2 10.6 9.5 12.7 12.0 11.0 12.2 Haiti 0.8 0.3 1.2 1.8 1.9 2.4 1.7 1.6 1.4 Jamaica 4.6 5.1 4.3 2.5 2.5 2.3 2.3 1.7 3.2 St. Kitts and Nevis 5.6 4.2 5.8 6.4 10.1 10.6 8.5 13.5 8.1 St. Vincent and the Grenadines 5.7 3.5 9.5 11.6 7.0 3.8 4.8 5.8 6.5 St. Lucia 6.7 6.3 5.6 5.5 6.8 8.6 6.7 7.4 6.7 Suriname 3.3 3.5 6.4 3.7 1.6 1.8 1.3 3.1
Trinidad and Tobago 1.8 1.6 3.0 2.0 1.0 2.2 1.6 1.1 1.8 Average 4.7 4.9 5.6 5.6 5.8 6.0 6.1 5.9 5.6 Source: IMF (2005).
2.49 Government capital spending has been variable, much more than education or health spending. In part, this variation probably reflects the lumpiness of public investment projects, such as airports and sports stadiums, as well as fiscal stabilization programs. Another reason for variability is reconstruction after hurricanes and other natural disasters.
2.50 Infrastructure accounts for about half of government capital expenditures in the countries for which data is available. Total investments in the education, health and the agriculture sectors accounts for one to two percent of GDP.
2.51 Given the fiscal and debt situation in many of the Caribbean countries, government capital expenditure requires careful management. A first question is whether private sector firms will make the investment. For example, in the Dominican Republic private airports have been successfully built. If there is no private interest, then the proposed project needs to be carefully evaluated and designed. Competitive bidding on the contracts can generate savings, although the small size and location of the countries may reduce the number of bidders. The “lumpiness” of investment projects is a particular issue in the small countries of the Caribbean. Large projects in these countries need special scrutiny—if the project does not produce a reasonable rate of return it can generate a large debt overhang for many years.
G. Conclusion
2.52 The Caribbean countries have adopted a private sector-led development strategy, and reduced the role of public enterprises and intervention in markets. However, the success of this strategy also depends heavily on the effectiveness of government spending.
43
2.53 Although the development strategy is private sector-led, government spending and taxes have grown substantially relative to GDP since the mid-1990s. Moreover, government debt has grown substantially, reflecting government deficits and the takeover of obligations from public and private enterprises. These increases raise risks for the private sector-led development strategy. First, high levels of government debt generate high risk premia and tend to deter and crowd-out private investment. Second, the high level of taxes necessary to support large governments, particularly taxes on formal sector enterprises and persons in the formal sector, deter investment and foreign investors. Tax incentives to offset these taxes are undesirable because of their distortionary effects, and they are not credible given the levels of government spending and debt. Third, high levels of government spending that are not effective in delivering education, health and infrastructure services, do not contribute to private sector growth. Governments that are ineffective can even become an obstacle for growth. As discussed above, and in the following chapters, improving the results from a private sector-led development strategy depends on reforms in government that improve its effectiveness and reduce its cost.
44
Chapter 3 Attracting Private Investment in the Caribbean
A. Introduction
3.1 Historically, the Caribbean has received significant trade concessions and foreign aid, and enjoyed preferential market treatment, in particular from the US, Canada and European Union countries. However, the reduction in foreign aid over the last decade and withdrawal of concessions means that it will need to increase foreign direct investment (FDI) as an alternative source of capital and investment. While the Caribbean has attempted to shift towards a private sector-led development strategy, high levels of government debt have crowded out private investment and, in some cases, public investment as well, and also led to high levels of taxation (these have been compensated with high tax incentives which further exacerbates the fiscal problem). Thus, efficient private domestic investment as well as FDI will be key to sustained future growth, more than in the past.
3.2 Overall investment levels in the Caribbean have been high since 1990, but this has been associated with declining growth, indicating low and declining levels of productivity. Furthermore, the Caribbean share of world FDI has been declining in the 1990s, partly due to strong competition for foreign investment from Latin America, and foreign investment policies which were historically restrictive, and more recently have become liberal but are still ad-hoc. The challenge for the Caribbean is to maintain and increase private investment rates in the face of impending erosion in preferences (that will lead to a decline in private returns to investment in protected segments), and with increasing international competition for FDI driven by liberalization of foreign investment policy regimes in most countries.
3.3 A good investment climate will channel investments into productive sectors and in the Caribbean also encourage investment in non-traditional areas (Chapters 1 and 3). Attracting productive private investment requires that the Government provide basic social services efficiently (Chapter 2), and also shape other aspects of the investment climate such as macroeconomic and political stability (Chapters 1 and 2), and a sound regulatory framework, and adequate physical and social infrastructure (Chapter 2, 6, 7 and 8).
3.4 This chapter seeks to identify the key constraints to the investment climate as perceived by foreign investors in the Caribbean, which will largely be valid for all private investment. The analysis of these constraints is presented in other chapters of the report. Section B discusses the links between private investment, growth, poverty, and between investment and small country size. Section C examines foreign direct investment (FDI) trends in the Caribbean. The perceptions of foreign investors of the Caribbean as an investment destination are presented in Section D. The sources of information for investors are discussed in Section E. Section F considers the key policy implications emerging from the analysis.
B. The Investment Climate, Growth and Poverty
3.5 Private investment is at the heart of growth and poverty reduction, creating opportunities and employment, increasing the choice and lowering the cost of goods and services, and providing a source for tax revenue. Economic growth is higher in countries that have higher investment rates, and growth has been shown to have a long term effect on poverty reduction.52 Generating investment requires a good investment climate that fosters productive private investment by removing unjustified costs, risks, and barriers to competition.53 A good investment climate unleashes competitive forces that stimulate innovation and productivity. Government policies can shape aspects of the investment climate, such as those relating to security of property
52 Levine and Renelt (1992), and Dollar and Kraay (2002). 53 Word Development Report 2005: A Better Investment Climate for Everyone, World Bank (2004d).
45
rights, regulation and taxation, provision of infrastructure, functioning of finance and labor markets, and governance.
3.6 The investment climate can be defined as the “policy, institutional, and behavioral environment, both present and expected, that influences the returns, and risks, associated with investment”.54 This environment is generally seen as having the following three main components:
• Political and macroeconomic stability is a pre-requisite for domestic and foreign private investment. Numerous studies have demonstrated that a country’s macroeconomic conditions, including its fiscal, monetary and exchange rate policy, are among the most important determinants for FDI.
• A sound regulatory framework and efficient supporting institutions to enforce the relevant laws and regulations are necessary for investors to enter the market and thrive. In a globally integrated competitive market, the costs of starting and operating a business have a large impact on choices of country location by an investor and how much contribution the investment will make to the host economy.
• An adequate physical and social infrastructure complements a good policy and regulatory framework to create the necessary environment for attracting and retaining investment. These includes the quantity and quality of power, transport and communication systems, access to finance, a qualified labor force, and the provision of social services.
3.7 Investment in most developing countries is largely domestic, but FDI in the Caribbean is more significant, on average accounting for over 20 percent of gross fixed capital formation. Studies on the Caribbean find that domestic and foreign investment has a significant impact on economic efficiency and growth. However, FDI has been shown to contribute relatively more to growth than domestic investment since it not only augments the capital stock of the recipient country but also facilitates the diffusion of technology, management practices and business culture. The magnitude of such spillovers or the transfer of technology is greater the higher the level of human capital (or the level of educational attainment) in the host country.55 Spillovers are also larger where the investment climate is more liberal since it is likely to attract more dynamic and efficient FDI. A liberal investment climate also creates a clustering effect whereby export-oriented investments attract other foreign investors into the location and generate large spillovers and externalities through backward linkages to local suppliers.56
3.8 An overview of the literature on the determinants of domestic investment and FDI reveals significant differences between industries. Manufacturing firms seek, among other things, low factor costs, a flexible labor market, small regulatory burden, and efficient infrastructure and customs. Services sector firms, on the other hand, also require a stable regulatory environment for quasi-natural monopolies, and functioning land markets for retail, hotels and construction.57 This implies that while investment policy should aim to create a competitive environment for all firms, improvements in the investment climate can be prioritized and sequenced based on an analysis of competitiveness. Thus, for the Caribbean, services are one obvious target, which
54 Nicholas Stern, A Strategy for Development, World Bank (2002). 55 Borenzstein et al (1998). 56 An example of these externalities is when General Motors opened an automobile engine plant in Mexico in 1979. This led to a clustering effect of foreign automobile companies, and the emergence of domestic suppliers of car parts (310 domestic suppliers sprang up within 5 years). By 1987, 6 out of the 10 largest exporters of auto parts were local companies (Peres Nunez, 1990 in Lim 2001). 57 Palmade and Anayiotas (2004).
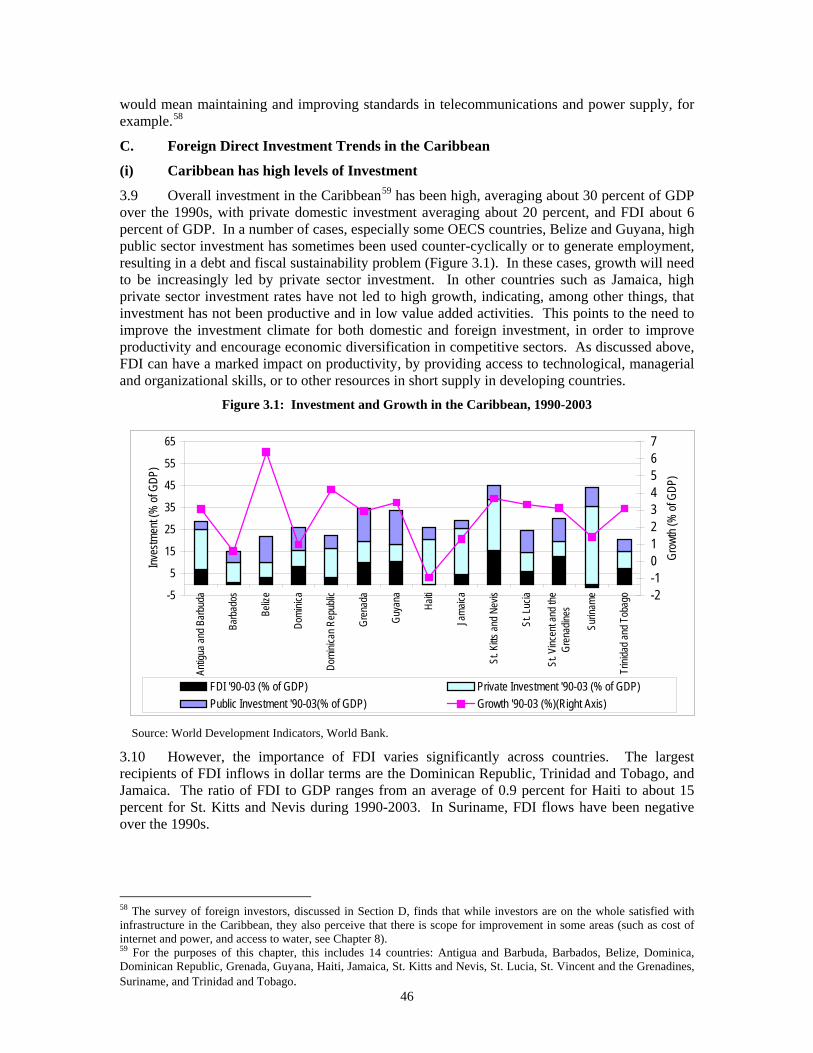
46
would mean maintaining and improving standards in telecommunications and power supply, for example.58
C. Foreign Direct Investment Trends in the Caribbean
(i) Caribbean has high levels of Investment
3.9 Overall investment in the Caribbean59 has been high, averaging about 30 percent of GDP over the 1990s, with private domestic investment averaging about 20 percent, and FDI about 6 percent of GDP. In a number of cases, especially some OECS countries, Belize and Guyana, high public sector investment has sometimes been used counter-cyclically or to generate employment, resulting in a debt and fiscal sustainability problem (Figure 3.1). In these cases, growth will need to be increasingly led by private sector investment. In other countries such as Jamaica, high private sector investment rates have not led to high growth, indicating, among other things, that investment has not been productive and in low value added activities. This points to the need to improve the investment climate for both domestic and foreign investment, in order to improve productivity and encourage economic diversification in competitive sectors. As discussed above, FDI can have a marked impact on productivity, by providing access to technological, managerial and organizational skills, or to other resources in short supply in developing countries.
Figure 3.1: Investment and Growth in the Caribbean, 1990-2003
-5
5
15
25
35
45
55
65
Antig
ua an
d Bar
buda
Barb
ados
Beliz
e
Domi
nica
Domi
nican
Rep
ublic
Gren
ada
Guya
na
Haiti
Jama
ica
St. K
itts an
d Nev
is
St. L
ucia
St. V
incen
t and
the
Gren
adine
s
Surin
ame
Trini
dad a
nd T
obag
o
Inves
tmen
t (%
of G
DP)
-2-101234567
Grow
th (%
of G
DP)
FDI '90-03 (% of GDP) Private Investment '90-03 (% of GDP)Public Investment '90-03(% of GDP) Growth '90-03 (%)(Right Axis)
Source: World Development Indicators, World Bank.
3.10 However, the importance of FDI varies significantly across countries. The largest recipients of FDI inflows in dollar terms are the Dominican Republic, Trinidad and Tobago, and Jamaica. The ratio of FDI to GDP ranges from an average of 0.9 percent for Haiti to about 15 percent for St. Kitts and Nevis during 1990-2003. In Suriname, FDI flows have been negative over the 1990s.
58 The survey of foreign investors, discussed in Section D, finds that while investors are on the whole satisfied with infrastructure in the Caribbean, they also perceive that there is scope for improvement in some areas (such as cost of internet and power, and access to water, see Chapter 8). 59 For the purposes of this chapter, this includes 14 countries: Antigua and Barbuda, Barbados, Belize, Dominica, Dominican Republic, Grenada, Guyana, Haiti, Jamaica, St. Kitts and Nevis, St. Lucia, St. Vincent and the Grenadines, Suriname, and Trinidad and Tobago.
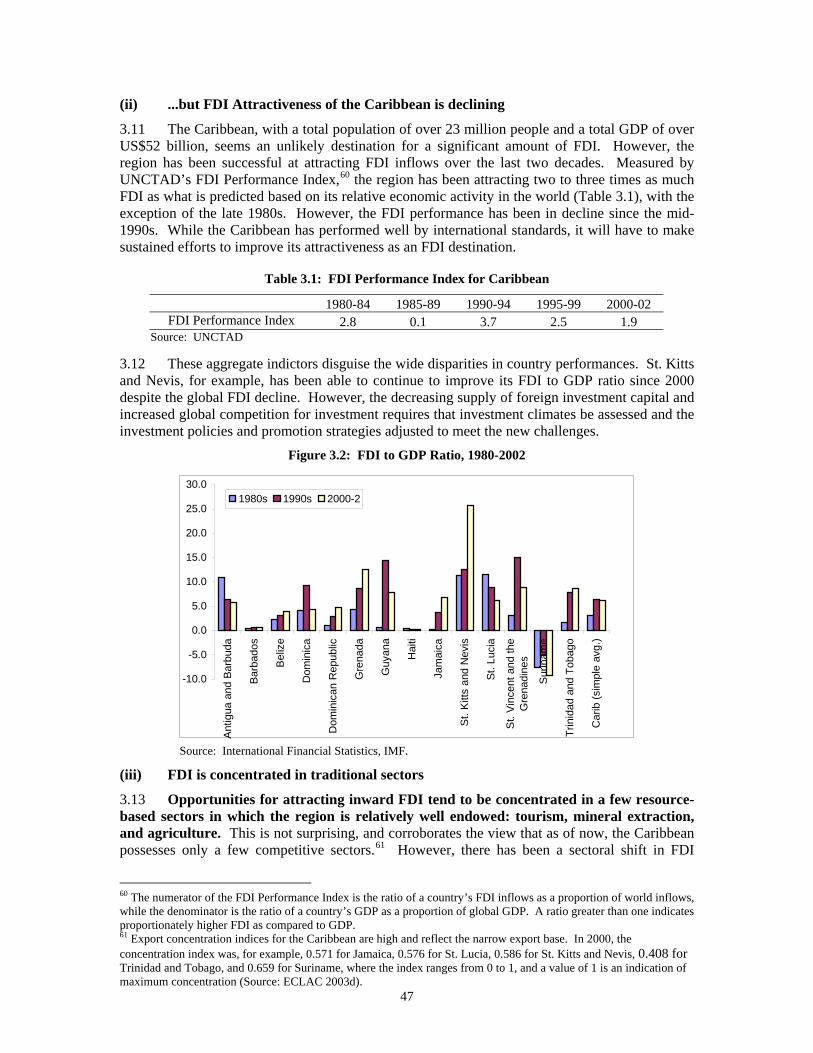
47
(ii) ...but FDI Attractiveness of the Caribbean is declining
3.11 The Caribbean, with a total population of over 23 million people and a total GDP of over US$52 billion, seems an unlikely destination for a significant amount of FDI. However, the region has been successful at attracting FDI inflows over the last two decades. Measured by UNCTAD’s FDI Performance Index,60 the region has been attracting two to three times as much FDI as what is predicted based on its relative economic activity in the world (Table 3.1), with the exception of the late 1980s. However, the FDI performance has been in decline since the mid-1990s. While the Caribbean has performed well by international standards, it will have to make sustained efforts to improve its attractiveness as an FDI destination.
Table 3.1: FDI Performance Index for Caribbean
1980-84 1985-89 1990-94 1995-99 2000-02 FDI Performance Index 2.8 0.1 3.7 2.5 1.9
Source: UNCTAD
3.12 These aggregate indictors disguise the wide disparities in country performances. St. Kitts and Nevis, for example, has been able to continue to improve its FDI to GDP ratio since 2000 despite the global FDI decline. However, the decreasing supply of foreign investment capital and increased global competition for investment requires that investment climates be assessed and the investment policies and promotion strategies adjusted to meet the new challenges.
Figure 3.2: FDI to GDP Ratio, 1980-2002
-10.0
-5.0
0.0
5.0
10.0
15.0
20.0
25.0
30.0
Ant
igua
and
Bar
buda
Barb
ados
Bel
ize
Dom
inic
a
Dom
inic
an R
epub
lic
Gre
nada
Guy
ana
Hai
ti
Jam
aica
St.
Kitt
s an
d N
evis
St. L
ucia
St.
Vin
cent
and
the
Gre
nadi
nes
Surin
ame
Trin
idad
and
Tob
ago
Car
ib (s
impl
e av
g.)
1980s 1990s 2000-2
Source: International Financial Statistics, IMF.
(iii) FDI is concentrated in traditional sectors
3.13 Opportunities for attracting inward FDI tend to be concentrated in a few resource-based sectors in which the region is relatively well endowed: tourism, mineral extraction, and agriculture. This is not surprising, and corroborates the view that as of now, the Caribbean possesses only a few competitive sectors.61 However, there has been a sectoral shift in FDI
60 The numerator of the FDI Performance Index is the ratio of a country’s FDI inflows as a proportion of world inflows, while the denominator is the ratio of a country’s GDP as a proportion of global GDP. A ratio greater than one indicates proportionately higher FDI as compared to GDP. 61 Export concentration indices for the Caribbean are high and reflect the narrow export base. In 2000, the concentration index was, for example, 0.571 for Jamaica, 0.576 for St. Lucia, 0.586 for St. Kitts and Nevis, 0.408 for Trinidad and Tobago, and 0.659 for Suriname, where the index ranges from 0 to 1, and a value of 1 is an indication of maximum concentration (Source: ECLAC 2003d).
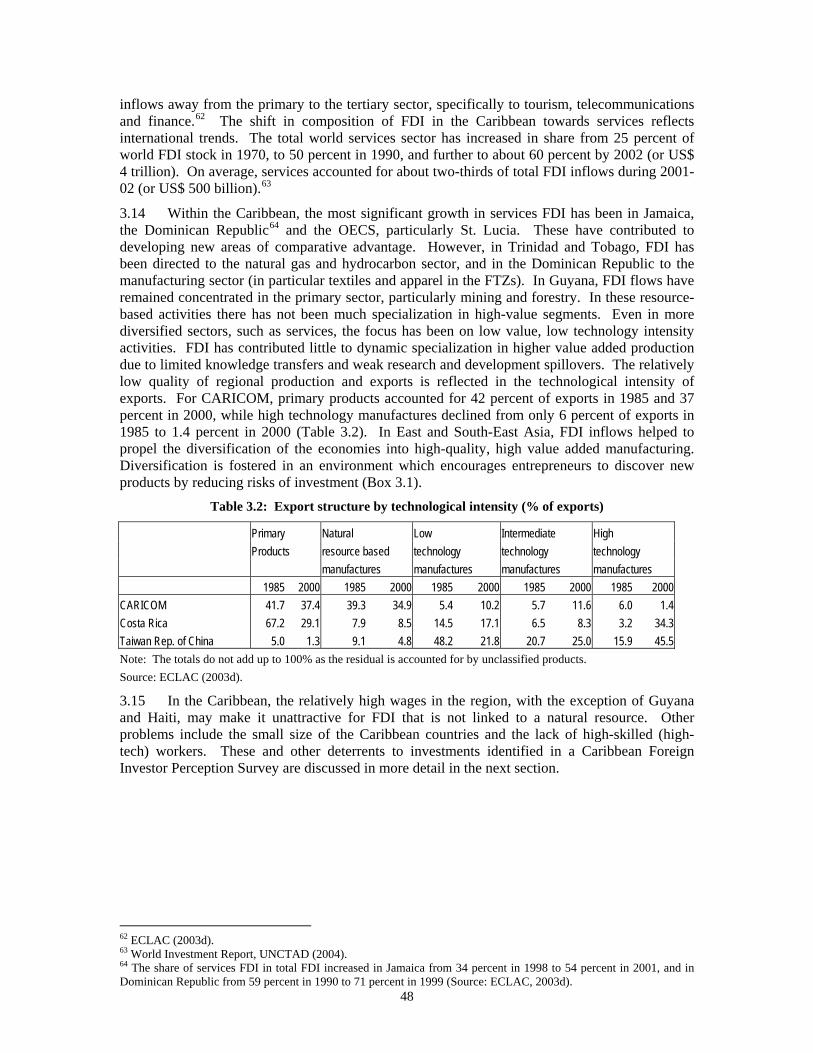
48
inflows away from the primary to the tertiary sector, specifically to tourism, telecommunications and finance.62 The shift in composition of FDI in the Caribbean towards services reflects international trends. The total world services sector has increased in share from 25 percent of world FDI stock in 1970, to 50 percent in 1990, and further to about 60 percent by 2002 (or US$ 4 trillion). On average, services accounted for about two-thirds of total FDI inflows during 2001-02 (or US$ 500 billion).63
3.14 Within the Caribbean, the most significant growth in services FDI has been in Jamaica, the Dominican Republic64 and the OECS, particularly St. Lucia. These have contributed to developing new areas of comparative advantage. However, in Trinidad and Tobago, FDI has been directed to the natural gas and hydrocarbon sector, and in the Dominican Republic to the manufacturing sector (in particular textiles and apparel in the FTZs). In Guyana, FDI flows have remained concentrated in the primary sector, particularly mining and forestry. In these resource-based activities there has not been much specialization in high-value segments. Even in more diversified sectors, such as services, the focus has been on low value, low technology intensity activities. FDI has contributed little to dynamic specialization in higher value added production due to limited knowledge transfers and weak research and development spillovers. The relatively low quality of regional production and exports is reflected in the technological intensity of exports. For CARICOM, primary products accounted for 42 percent of exports in 1985 and 37 percent in 2000, while high technology manufactures declined from only 6 percent of exports in 1985 to 1.4 percent in 2000 (Table 3.2). In East and South-East Asia, FDI inflows helped to propel the diversification of the economies into high-quality, high value added manufacturing. Diversification is fostered in an environment which encourages entrepreneurs to discover new products by reducing risks of investment (Box 3.1).
Table 3.2: Export structure by technological intensity (% of exports)
Primary Natural Low Intermediate High Products resource based technology technology technology manufactures manufactures manufactures manufactures 1985 2000 1985 2000 1985 2000 1985 2000 1985 2000 CARICOM 41.7 37.4 39.3 34.9 5.4 10.2 5.7 11.6 6.0 1.4 Costa Rica 67.2 29.1 7.9 8.5 14.5 17.1 6.5 8.3 3.2 34.3 Taiwan Rep. of China 5.0 1.3 9.1 4.8 48.2 21.8 20.7 25.0 15.9 45.5 Note: The totals do not add up to 100% as the residual is accounted for by unclassified products. Source: ECLAC (2003d).
3.15 In the Caribbean, the relatively high wages in the region, with the exception of Guyana and Haiti, may make it unattractive for FDI that is not linked to a natural resource. Other problems include the small size of the Caribbean countries and the lack of high-skilled (high-tech) workers. These and other deterrents to investments identified in a Caribbean Foreign Investor Perception Survey are discussed in more detail in the next section.
62 ECLAC (2003d). 63 World Investment Report, UNCTAD (2004). 64 The share of services FDI in total FDI increased in Jamaica from 34 percent in 1998 to 54 percent in 2001, and in Dominican Republic from 59 percent in 1990 to 71 percent in 1999 (Source: ECLAC, 2003d).
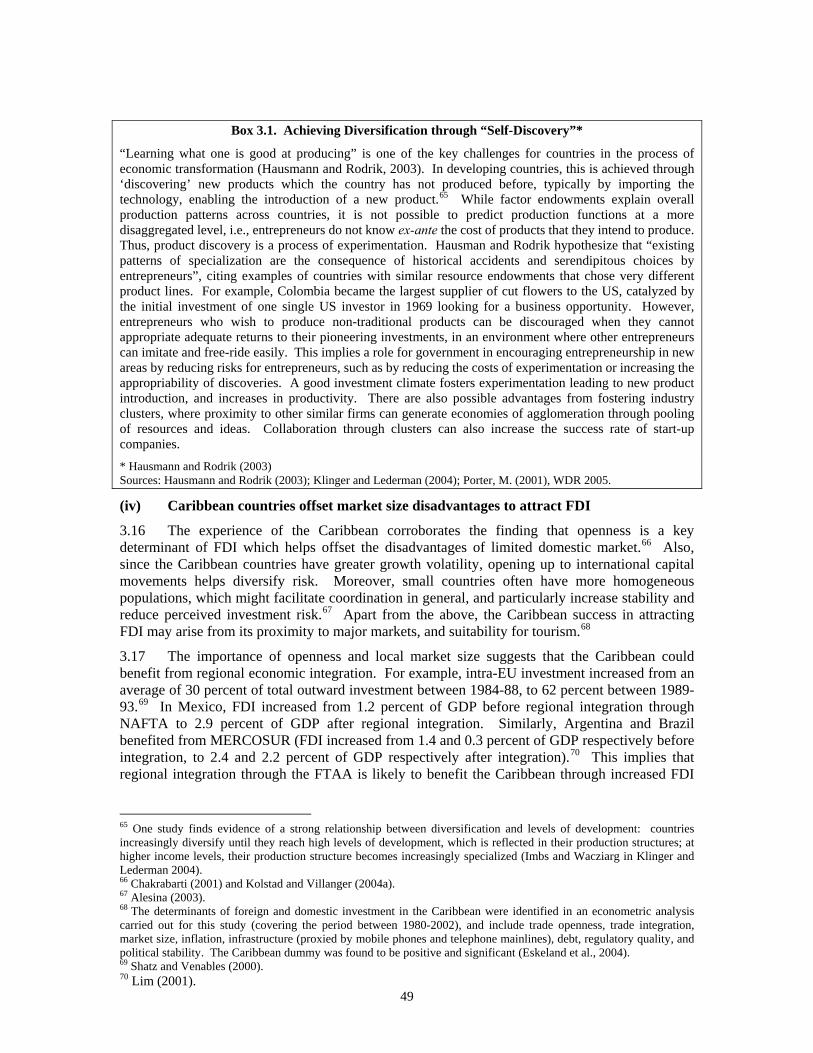
49
Box 3.1. Achieving Diversification through “Self-Discovery”*
“Learning what one is good at producing” is one of the key challenges for countries in the process of economic transformation (Hausmann and Rodrik, 2003). In developing countries, this is achieved through ‘discovering’ new products which the country has not produced before, typically by importing the technology, enabling the introduction of a new product.65 While factor endowments explain overall production patterns across countries, it is not possible to predict production functions at a more disaggregated level, i.e., entrepreneurs do not know ex-ante the cost of products that they intend to produce. Thus, product discovery is a process of experimentation. Hausman and Rodrik hypothesize that “existing patterns of specialization are the consequence of historical accidents and serendipitous choices by entrepreneurs”, citing examples of countries with similar resource endowments that chose very different product lines. For example, Colombia became the largest supplier of cut flowers to the US, catalyzed by the initial investment of one single US investor in 1969 looking for a business opportunity. However, entrepreneurs who wish to produce non-traditional products can be discouraged when they cannot appropriate adequate returns to their pioneering investments, in an environment where other entrepreneurs can imitate and free-ride easily. This implies a role for government in encouraging entrepreneurship in new areas by reducing risks for entrepreneurs, such as by reducing the costs of experimentation or increasing the appropriability of discoveries. A good investment climate fosters experimentation leading to new product introduction, and increases in productivity. There are also possible advantages from fostering industry clusters, where proximity to other similar firms can generate economies of agglomeration through pooling of resources and ideas. Collaboration through clusters can also increase the success rate of start-up companies.
* Hausmann and Rodrik (2003) Sources: Hausmann and Rodrik (2003); Klinger and Lederman (2004); Porter, M. (2001), WDR 2005.
(iv) Caribbean countries offset market size disadvantages to attract FDI
3.16 The experience of the Caribbean corroborates the finding that openness is a key determinant of FDI which helps offset the disadvantages of limited domestic market.66 Also, since the Caribbean countries have greater growth volatility, opening up to international capital movements helps diversify risk. Moreover, small countries often have more homogeneous populations, which might facilitate coordination in general, and particularly increase stability and reduce perceived investment risk.67 Apart from the above, the Caribbean success in attracting FDI may arise from its proximity to major markets, and suitability for tourism.68
3.17 The importance of openness and local market size suggests that the Caribbean could benefit from regional economic integration. For example, intra-EU investment increased from an average of 30 percent of total outward investment between 1984-88, to 62 percent between 1989-93.69 In Mexico, FDI increased from 1.2 percent of GDP before regional integration through NAFTA to 2.9 percent of GDP after regional integration. Similarly, Argentina and Brazil benefited from MERCOSUR (FDI increased from 1.4 and 0.3 percent of GDP respectively before integration, to 2.4 and 2.2 percent of GDP respectively after integration).70 This implies that regional integration through the FTAA is likely to benefit the Caribbean through increased FDI
65 One study finds evidence of a strong relationship between diversification and levels of development: countries increasingly diversify until they reach high levels of development, which is reflected in their production structures; at higher income levels, their production structure becomes increasingly specialized (Imbs and Wacziarg in Klinger and Lederman 2004). 66 Chakrabarti (2001) and Kolstad and Villanger (2004a). 67 Alesina (2003). 68 The determinants of foreign and domestic investment in the Caribbean were identified in an econometric analysis carried out for this study (covering the period between 1980-2002), and include trade openness, trade integration, market size, inflation, infrastructure (proxied by mobile phones and telephone mainlines), debt, regulatory quality, and political stability. The Caribbean dummy was found to be positive and significant (Eskeland et al., 2004). 69 Shatz and Venables (2000). 70 Lim (2001).
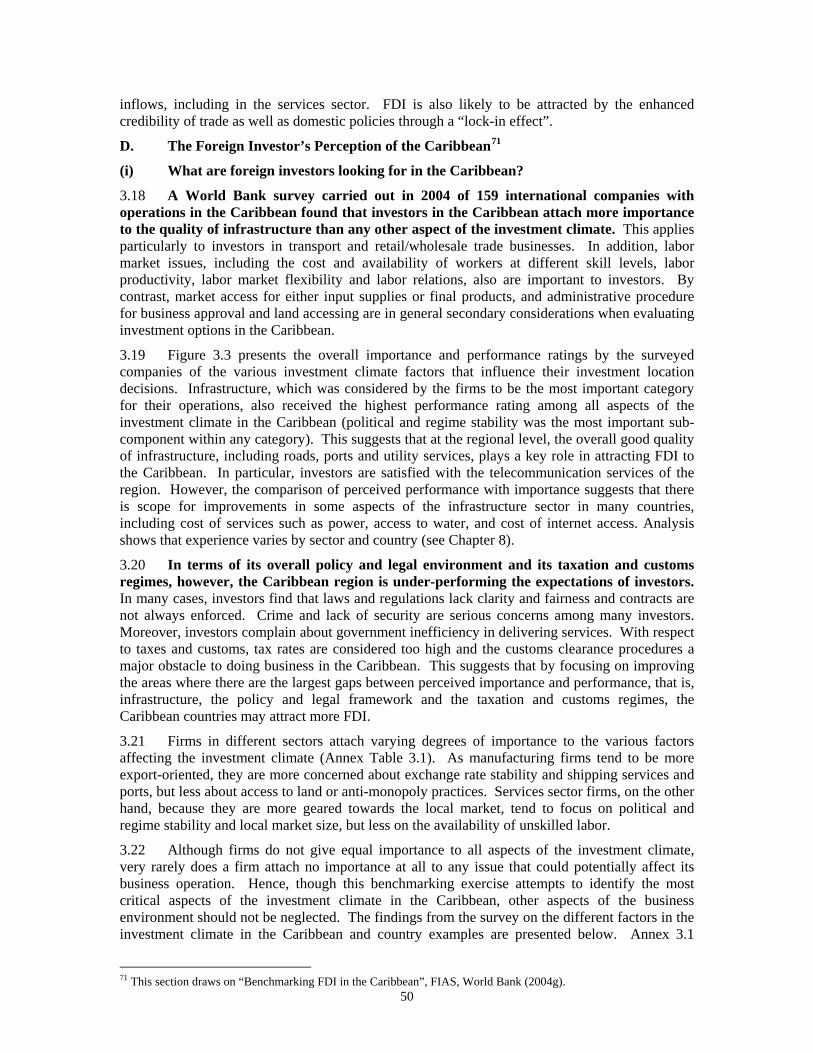
50
inflows, including in the services sector. FDI is also likely to be attracted by the enhanced credibility of trade as well as domestic policies through a “lock-in effect”.
D. The Foreign Investor’s Perception of the Caribbean71
(i) What are foreign investors looking for in the Caribbean?
3.18 A World Bank survey carried out in 2004 of 159 international companies with operations in the Caribbean found that investors in the Caribbean attach more importance to the quality of infrastructure than any other aspect of the investment climate. This applies particularly to investors in transport and retail/wholesale trade businesses. In addition, labor market issues, including the cost and availability of workers at different skill levels, labor productivity, labor market flexibility and labor relations, also are important to investors. By contrast, market access for either input supplies or final products, and administrative procedure for business approval and land accessing are in general secondary considerations when evaluating investment options in the Caribbean.
3.19 Figure 3.3 presents the overall importance and performance ratings by the surveyed companies of the various investment climate factors that influence their investment location decisions. Infrastructure, which was considered by the firms to be the most important category for their operations, also received the highest performance rating among all aspects of the investment climate in the Caribbean (political and regime stability was the most important sub-component within any category). This suggests that at the regional level, the overall good quality of infrastructure, including roads, ports and utility services, plays a key role in attracting FDI to the Caribbean. In particular, investors are satisfied with the telecommunication services of the region. However, the comparison of perceived performance with importance suggests that there is scope for improvements in some aspects of the infrastructure sector in many countries, including cost of services such as power, access to water, and cost of internet access. Analysis shows that experience varies by sector and country (see Chapter 8).
3.20 In terms of its overall policy and legal environment and its taxation and customs regimes, however, the Caribbean region is under-performing the expectations of investors. In many cases, investors find that laws and regulations lack clarity and fairness and contracts are not always enforced. Crime and lack of security are serious concerns among many investors. Moreover, investors complain about government inefficiency in delivering services. With respect to taxes and customs, tax rates are considered too high and the customs clearance procedures a major obstacle to doing business in the Caribbean. This suggests that by focusing on improving the areas where there are the largest gaps between perceived importance and performance, that is, infrastructure, the policy and legal framework and the taxation and customs regimes, the Caribbean countries may attract more FDI.
3.21 Firms in different sectors attach varying degrees of importance to the various factors affecting the investment climate (Annex Table 3.1). As manufacturing firms tend to be more export-oriented, they are more concerned about exchange rate stability and shipping services and ports, but less about access to land or anti-monopoly practices. Services sector firms, on the other hand, because they are more geared towards the local market, tend to focus on political and regime stability and local market size, but less on the availability of unskilled labor.
3.22 Although firms do not give equal importance to all aspects of the investment climate, very rarely does a firm attach no importance at all to any issue that could potentially affect its business operation. Hence, though this benchmarking exercise attempts to identify the most critical aspects of the investment climate in the Caribbean, other aspects of the business environment should not be neglected. The findings from the survey on the different factors in the investment climate in the Caribbean and country examples are presented below. Annex 3.1
71 This section draws on “Benchmarking FDI in the Caribbean”, FIAS, World Bank (2004g).
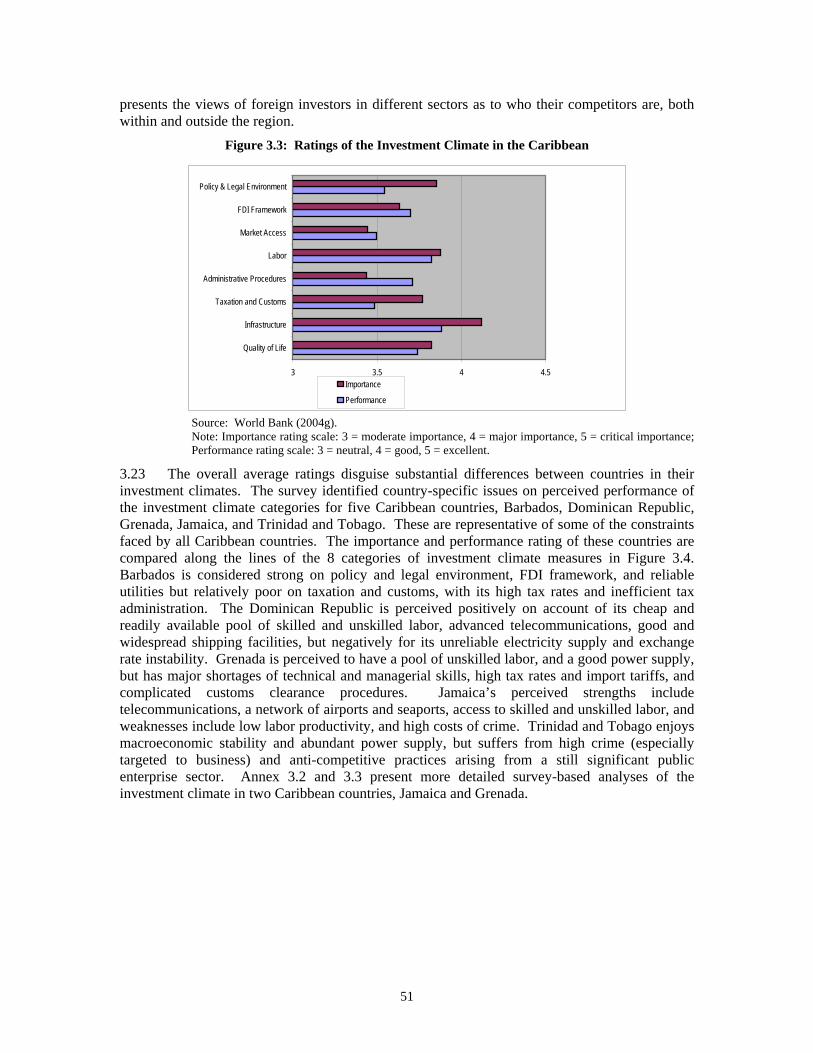
51
presents the views of foreign investors in different sectors as to who their competitors are, both within and outside the region.
Figure 3.3: Ratings of the Investment Climate in the Caribbean
3 3.5 4 4.5
Quality of Life
Infrastructure
Taxation and Customs
Administrative Procedures
Labor
Market Access
FDI Framework
Policy & Legal Environment
Importance
Performance
Source: World Bank (2004g). Note: Importance rating scale: 3 = moderate importance, 4 = major importance, 5 = critical importance; Performance rating scale: 3 = neutral, 4 = good, 5 = excellent.
3.23 The overall average ratings disguise substantial differences between countries in their investment climates. The survey identified country-specific issues on perceived performance of the investment climate categories for five Caribbean countries, Barbados, Dominican Republic, Grenada, Jamaica, and Trinidad and Tobago. These are representative of some of the constraints faced by all Caribbean countries. The importance and performance rating of these countries are compared along the lines of the 8 categories of investment climate measures in Figure 3.4. Barbados is considered strong on policy and legal environment, FDI framework, and reliable utilities but relatively poor on taxation and customs, with its high tax rates and inefficient tax administration. The Dominican Republic is perceived positively on account of its cheap and readily available pool of skilled and unskilled labor, advanced telecommunications, good and widespread shipping facilities, but negatively for its unreliable electricity supply and exchange rate instability. Grenada is perceived to have a pool of unskilled labor, and a good power supply, but has major shortages of technical and managerial skills, high tax rates and import tariffs, and complicated customs clearance procedures. Jamaica’s perceived strengths include telecommunications, a network of airports and seaports, access to skilled and unskilled labor, and weaknesses include low labor productivity, and high costs of crime. Trinidad and Tobago enjoys macroeconomic stability and abundant power supply, but suffers from high crime (especially targeted to business) and anti-competitive practices arising from a still significant public enterprise sector. Annex 3.2 and 3.3 present more detailed survey-based analyses of the investment climate in two Caribbean countries, Jamaica and Grenada.
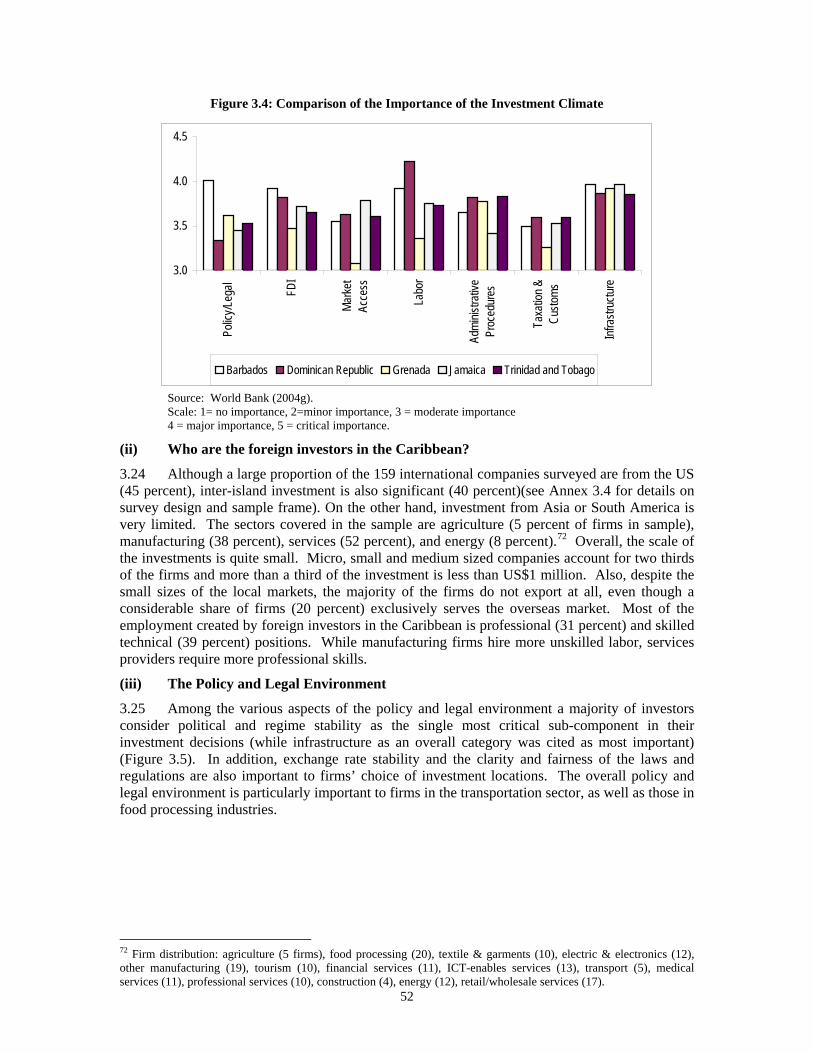
52
Figure 3.4: Comparison of the Importance of the Investment Climate
3.0
3.5
4.0
4.5
Polic
y/Leg
al FDI
Marke
tAc
cess
Labo
r
Admi
nistra
tive
Proc
edur
es
Taxa
tion &
Custo
ms
Infra
struc
ture
Barbados Dominican Republic Grenada Jamaica Trinidad and Tobago
Source: World Bank (2004g). Scale: 1= no importance, 2=minor importance, 3 = moderate importance 4 = major importance, 5 = critical importance.
(ii) Who are the foreign investors in the Caribbean?
3.24 Although a large proportion of the 159 international companies surveyed are from the US (45 percent), inter-island investment is also significant (40 percent)(see Annex 3.4 for details on survey design and sample frame). On the other hand, investment from Asia or South America is very limited. The sectors covered in the sample are agriculture (5 percent of firms in sample), manufacturing (38 percent), services (52 percent), and energy (8 percent).72 Overall, the scale of the investments is quite small. Micro, small and medium sized companies account for two thirds of the firms and more than a third of the investment is less than US$1 million. Also, despite the small sizes of the local markets, the majority of the firms do not export at all, even though a considerable share of firms (20 percent) exclusively serves the overseas market. Most of the employment created by foreign investors in the Caribbean is professional (31 percent) and skilled technical (39 percent) positions. While manufacturing firms hire more unskilled labor, services providers require more professional skills.
(iii) The Policy and Legal Environment
3.25 Among the various aspects of the policy and legal environment a majority of investors consider political and regime stability as the single most critical sub-component in their investment decisions (while infrastructure as an overall category was cited as most important) (Figure 3.5). In addition, exchange rate stability and the clarity and fairness of the laws and regulations are also important to firms’ choice of investment locations. The overall policy and legal environment is particularly important to firms in the transportation sector, as well as those in food processing industries.
72 Firm distribution: agriculture (5 firms), food processing (20), textile & garments (10), electric & electronics (12), other manufacturing (19), tourism (10), financial services (11), ICT-enables services (13), transport (5), medical services (11), professional services (10), construction (4), energy (12), retail/wholesale services (17).
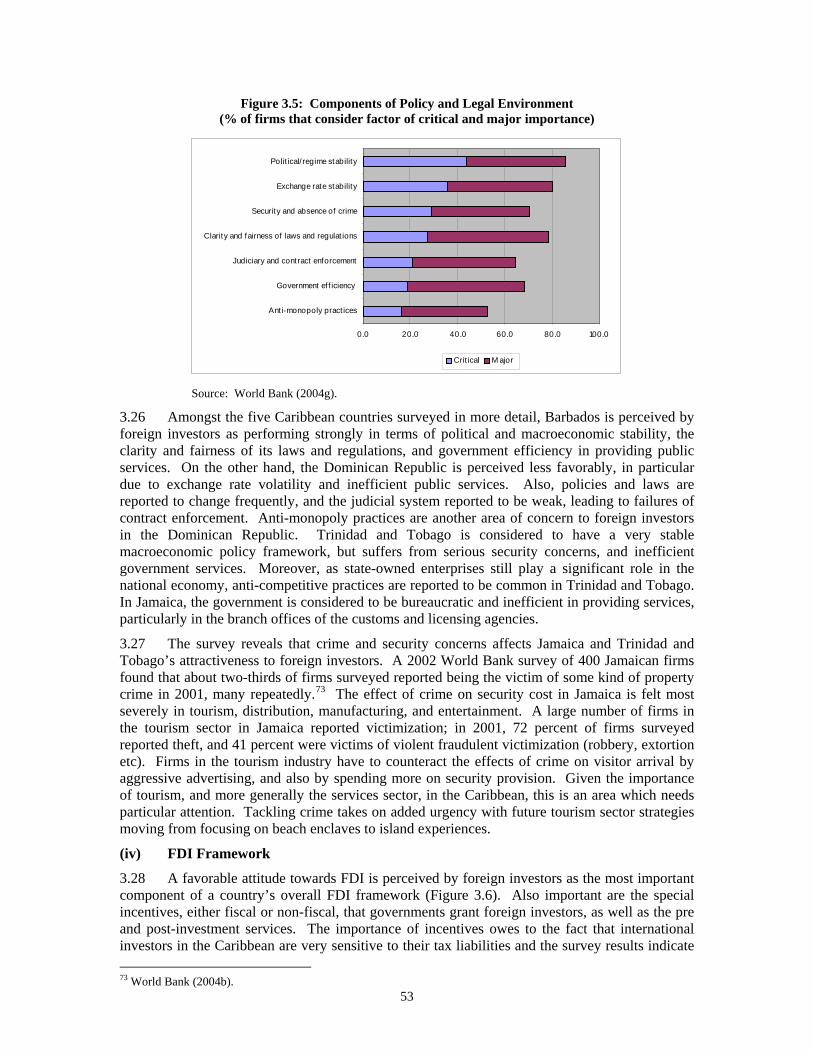
53
Figure 3.5: Components of Policy and Legal Environment (% of firms that consider factor of critical and major importance)
0.0 20.0 40.0 60.0 80.0 100.0
Anti-monopoly pract ices
Government eff iciency
Judiciary and contract enforcement
Clarity and fairness of laws and regulat ions
Security and absence of crime
Exchange rate stability
Polit ical/ regime stability
Crit ical M ajor
Source: World Bank (2004g).
3.26 Amongst the five Caribbean countries surveyed in more detail, Barbados is perceived by foreign investors as performing strongly in terms of political and macroeconomic stability, the clarity and fairness of its laws and regulations, and government efficiency in providing public services. On the other hand, the Dominican Republic is perceived less favorably, in particular due to exchange rate volatility and inefficient public services. Also, policies and laws are reported to change frequently, and the judicial system reported to be weak, leading to failures of contract enforcement. Anti-monopoly practices are another area of concern to foreign investors in the Dominican Republic. Trinidad and Tobago is considered to have a very stable macroeconomic policy framework, but suffers from serious security concerns, and inefficient government services. Moreover, as state-owned enterprises still play a significant role in the national economy, anti-competitive practices are reported to be common in Trinidad and Tobago. In Jamaica, the government is considered to be bureaucratic and inefficient in providing services, particularly in the branch offices of the customs and licensing agencies.
3.27 The survey reveals that crime and security concerns affects Jamaica and Trinidad and Tobago’s attractiveness to foreign investors. A 2002 World Bank survey of 400 Jamaican firms found that about two-thirds of firms surveyed reported being the victim of some kind of property crime in 2001, many repeatedly.73 The effect of crime on security cost in Jamaica is felt most severely in tourism, distribution, manufacturing, and entertainment. A large number of firms in the tourism sector in Jamaica reported victimization; in 2001, 72 percent of firms surveyed reported theft, and 41 percent were victims of violent fraudulent victimization (robbery, extortion etc). Firms in the tourism industry have to counteract the effects of crime on visitor arrival by aggressive advertising, and also by spending more on security provision. Given the importance of tourism, and more generally the services sector, in the Caribbean, this is an area which needs particular attention. Tackling crime takes on added urgency with future tourism sector strategies moving from focusing on beach enclaves to island experiences.
(iv) FDI Framework
3.28 A favorable attitude towards FDI is perceived by foreign investors as the most important component of a country’s overall FDI framework (Figure 3.6). Also important are the special incentives, either fiscal or non-fiscal, that governments grant foreign investors, as well as the pre and post-investment services. The importance of incentives owes to the fact that international investors in the Caribbean are very sensitive to their tax liabilities and the survey results indicate 73 World Bank (2004b).
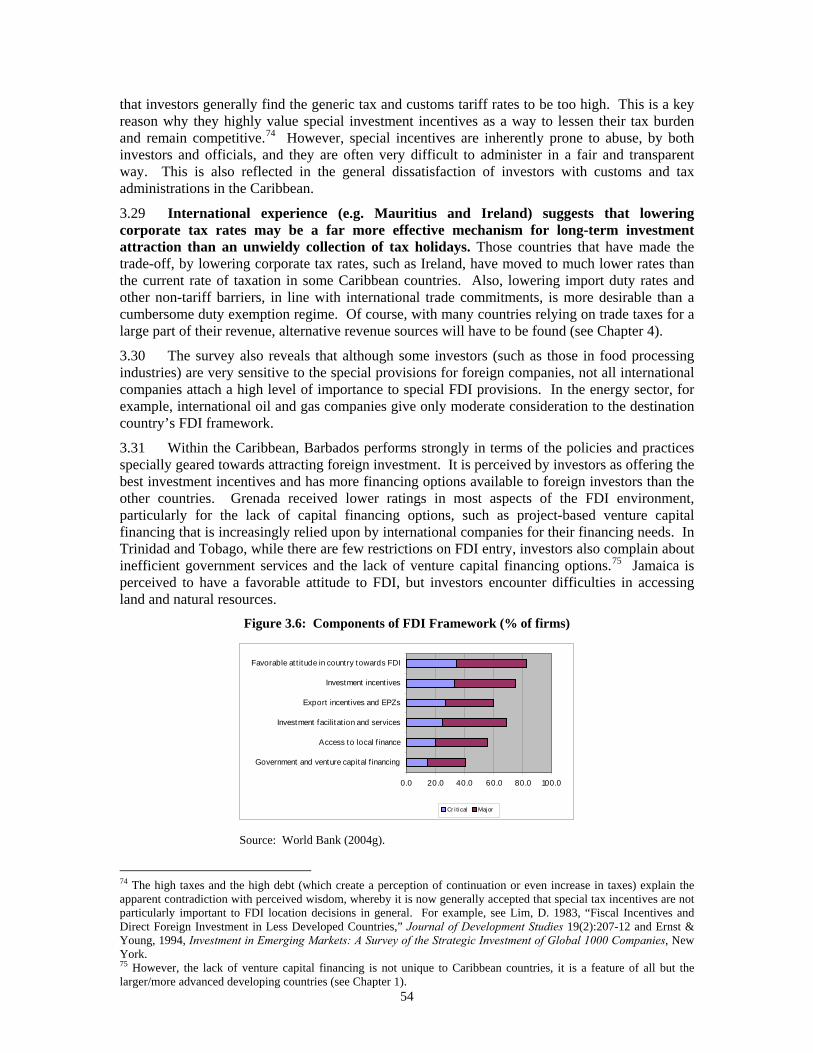
54
that investors generally find the generic tax and customs tariff rates to be too high. This is a key reason why they highly value special investment incentives as a way to lessen their tax burden and remain competitive.74 However, special incentives are inherently prone to abuse, by both investors and officials, and they are often very difficult to administer in a fair and transparent way. This is also reflected in the general dissatisfaction of investors with customs and tax administrations in the Caribbean.
3.29 International experience (e.g. Mauritius and Ireland) suggests that lowering corporate tax rates may be a far more effective mechanism for long-term investment attraction than an unwieldy collection of tax holidays. Those countries that have made the trade-off, by lowering corporate tax rates, such as Ireland, have moved to much lower rates than the current rate of taxation in some Caribbean countries. Also, lowering import duty rates and other non-tariff barriers, in line with international trade commitments, is more desirable than a cumbersome duty exemption regime. Of course, with many countries relying on trade taxes for a large part of their revenue, alternative revenue sources will have to be found (see Chapter 4).
3.30 The survey also reveals that although some investors (such as those in food processing industries) are very sensitive to the special provisions for foreign companies, not all international companies attach a high level of importance to special FDI provisions. In the energy sector, for example, international oil and gas companies give only moderate consideration to the destination country’s FDI framework.
3.31 Within the Caribbean, Barbados performs strongly in terms of the policies and practices specially geared towards attracting foreign investment. It is perceived by investors as offering the best investment incentives and has more financing options available to foreign investors than the other countries. Grenada received lower ratings in most aspects of the FDI environment, particularly for the lack of capital financing options, such as project-based venture capital financing that is increasingly relied upon by international companies for their financing needs. In Trinidad and Tobago, while there are few restrictions on FDI entry, investors also complain about inefficient government services and the lack of venture capital financing options.75 Jamaica is perceived to have a favorable attitude to FDI, but investors encounter difficulties in accessing land and natural resources.
Figure 3.6: Components of FDI Framework (% of firms)
0.0 20.0 40.0 60.0 80.0 100.0
Government and venture capital f inancing
Access to local f inance
Investment facilitat ion and services
Export incent ives and EPZs
Investment incent ives
Favorable at t itude in country towards FDI
Cr i tical Major
Source: World Bank (2004g).
74 The high taxes and the high debt (which create a perception of continuation or even increase in taxes) explain the apparent contradiction with perceived wisdom, whereby it is now generally accepted that special tax incentives are not particularly important to FDI location decisions in general. For example, see Lim, D. 1983, “Fiscal Incentives and Direct Foreign Investment in Less Developed Countries,” Journal of Development Studies 19(2):207-12 and Ernst & Young, 1994, Investment in Emerging Markets: A Survey of the Strategic Investment of Global 1000 Companies, New York. 75 However, the lack of venture capital financing is not unique to Caribbean countries, it is a feature of all but the larger/more advanced developing countries (see Chapter 1).
55
(v) Market Access
3.32 The importance of access to the local market, both for supplies and final products, depends on the market orientation of the firms. Since the majority of the surveyed firms serve only the domestic market, it is counterintuitive that market access is only rated as “moderately important” by these firms (Figure 3.7). However, there are wide variations across firms. For construction companies, which rely on the local market for inputs and only serve the domestic market, being able to penetrate the local market is critical to their success. But to export-oriented firms, such as energy producers and electronics manufacturers, the local market is of only moderate importance. Among the three elements that were used to gauge the importance of market access, the size of the local market is the most important factor. Proximity to a firm’s other operations is relatively less important, largely owing to declining international transportation time and cost. Access to local supply of inputs is particularly important for companies in the agro-processing sector, for example. For an example of a successful agro-exporter who built a business through product differentiation using local materials and brand development, and established strong linkages with suppliers, see Box 3.2.
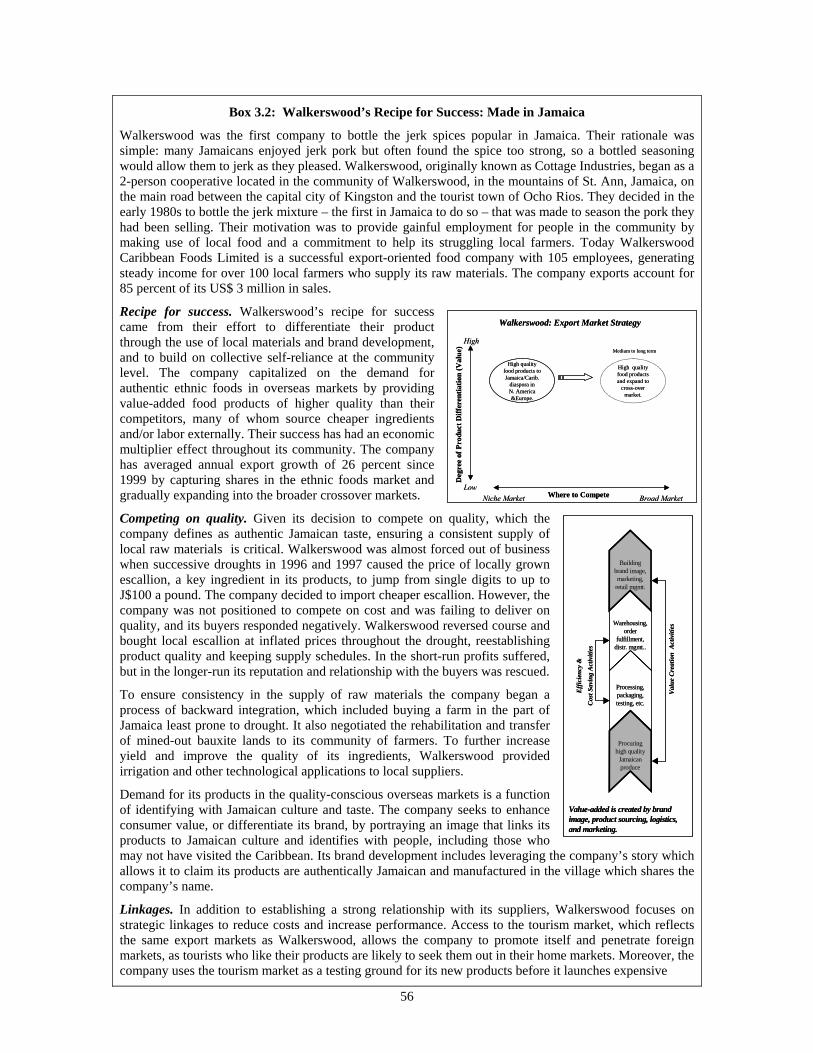
56
Deg
ree
of P
rodu
ct D
iffer
entia
tion
(Val
ue)
High
LowWhere to CompeteNiche Market Broad Market
Walkerswood: Export Market Strategy
High quality food products to Jamaica/Carib.
diaspora in N. America &Europe.
High quality food products and expand to
cross-over market.
Medium to long term
Deg
ree
of P
rodu
ct D
iffer
entia
tion
(Val
ue)
High
LowWhere to CompeteNiche Market Broad Market
Walkerswood: Export Market Strategy
High quality food products to Jamaica/Carib.
diaspora in N. America &Europe.
High quality food products and expand to
cross-over market.
Medium to long term
Procuring high quality
Jamaicanproduce
Processing, packaging, testing, etc.
Warehousing, order
fulfillment, distr. mgmt..
Building brand image, marketing,
retail mgmt.
Val
ue C
reat
ion
Act
iviti
es
Effi
cien
cy &
Cos
t Sav
ing
Act
iviti
es
Value-added is created by brand image, product sourcing, logistics, and marketing.
Box 3.2: Walkerswood’s Recipe for Success: Made in Jamaica
Walkerswood was the first company to bottle the jerk spices popular in Jamaica. Their rationale was simple: many Jamaicans enjoyed jerk pork but often found the spice too strong, so a bottled seasoning would allow them to jerk as they pleased. Walkerswood, originally known as Cottage Industries, began as a 2-person cooperative located in the community of Walkerswood, in the mountains of St. Ann, Jamaica, on the main road between the capital city of Kingston and the tourist town of Ocho Rios. They decided in the early 1980s to bottle the jerk mixture – the first in Jamaica to do so – that was made to season the pork they had been selling. Their motivation was to provide gainful employment for people in the community by making use of local food and a commitment to help its struggling local farmers. Today Walkerswood Caribbean Foods Limited is a successful export-oriented food company with 105 employees, generating steady income for over 100 local farmers who supply its raw materials. The company exports account for 85 percent of its US$ 3 million in sales.
Recipe for success. Walkerswood’s recipe for success came from their effort to differentiate their product through the use of local materials and brand development, and to build on collective self-reliance at the community level. The company capitalized on the demand for authentic ethnic foods in overseas markets by providing value-added food products of higher quality than their competitors, many of whom source cheaper ingredients and/or labor externally. Their success has had an economic multiplier effect throughout its community. The company has averaged annual export growth of 26 percent since 1999 by capturing shares in the ethnic foods market and gradually expanding into the broader crossover markets.
Competing on quality. Given its decision to compete on quality, which the company defines as authentic Jamaican taste, ensuring a consistent supply of local raw materials is critical. Walkerswood was almost forced out of business when successive droughts in 1996 and 1997 caused the price of locally grown escallion, a key ingredient in its products, to jump from single digits to up to J$100 a pound. The company decided to import cheaper escallion. However, the company was not positioned to compete on cost and was failing to deliver on quality, and its buyers responded negatively. Walkerswood reversed course and bought local escallion at inflated prices throughout the drought, reestablishing product quality and keeping supply schedules. In the short-run profits suffered, but in the longer-run its reputation and relationship with the buyers was rescued.
To ensure consistency in the supply of raw materials the company began a process of backward integration, which included buying a farm in the part of Jamaica least prone to drought. It also negotiated the rehabilitation and transfer of mined-out bauxite lands to its community of farmers. To further increase yield and improve the quality of its ingredients, Walkerswood provided irrigation and other technological applications to local suppliers.
Demand for its products in the quality-conscious overseas markets is a function of identifying with Jamaican culture and taste. The company seeks to enhance consumer value, or differentiate its brand, by portraying an image that links its products to Jamaican culture and identifies with people, including those who may not have visited the Caribbean. Its brand development includes leveraging the company’s story which allows it to claim its products are authentically Jamaican and manufactured in the village which shares the company’s name.
Linkages. In addition to establishing a strong relationship with its suppliers, Walkerswood focuses on strategic linkages to reduce costs and increase performance. Access to the tourism market, which reflects the same export markets as Walkerswood, allows the company to promote itself and penetrate foreign markets, as tourists who like their products are likely to seek them out in their home markets. Moreover, the company uses the tourism market as a testing ground for its new products before it launches expensive
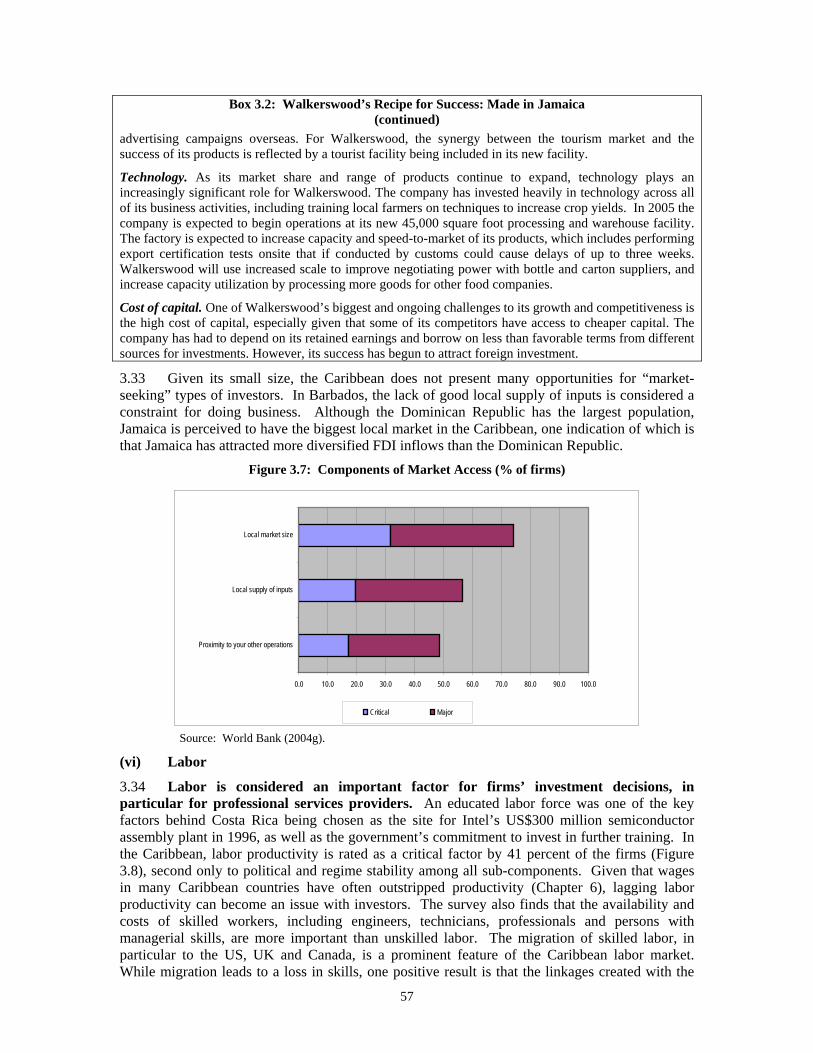
57
Box 3.2: Walkerswood’s Recipe for Success: Made in Jamaica (continued)
advertising campaigns overseas. For Walkerswood, the synergy between the tourism market and the success of its products is reflected by a tourist facility being included in its new facility.
Technology. As its market share and range of products continue to expand, technology plays an increasingly significant role for Walkerswood. The company has invested heavily in technology across all of its business activities, including training local farmers on techniques to increase crop yields. In 2005 the company is expected to begin operations at its new 45,000 square foot processing and warehouse facility. The factory is expected to increase capacity and speed-to-market of its products, which includes performing export certification tests onsite that if conducted by customs could cause delays of up to three weeks. Walkerswood will use increased scale to improve negotiating power with bottle and carton suppliers, and increase capacity utilization by processing more goods for other food companies.
Cost of capital. One of Walkerswood’s biggest and ongoing challenges to its growth and competitiveness is the high cost of capital, especially given that some of its competitors have access to cheaper capital. The company has had to depend on its retained earnings and borrow on less than favorable terms from different sources for investments. However, its success has begun to attract foreign investment.
3.33 Given its small size, the Caribbean does not present many opportunities for “market-seeking” types of investors. In Barbados, the lack of good local supply of inputs is considered a constraint for doing business. Although the Dominican Republic has the largest population, Jamaica is perceived to have the biggest local market in the Caribbean, one indication of which is that Jamaica has attracted more diversified FDI inflows than the Dominican Republic.
Figure 3.7: Components of Market Access (% of firms)
0.0 10.0 20.0 30.0 40.0 50.0 60.0 70.0 80.0 90.0 100.0
Proximity to your other operations
Local supply of inputs
Local market size
Critical Major
Source: World Bank (2004g).
(vi) Labor
3.34 Labor is considered an important factor for firms’ investment decisions, in particular for professional services providers. An educated labor force was one of the key factors behind Costa Rica being chosen as the site for Intel’s US$300 million semiconductor assembly plant in 1996, as well as the government’s commitment to invest in further training. In the Caribbean, labor productivity is rated as a critical factor by 41 percent of the firms (Figure 3.8), second only to political and regime stability among all sub-components. Given that wages in many Caribbean countries have often outstripped productivity (Chapter 6), lagging labor productivity can become an issue with investors. The survey also finds that the availability and costs of skilled workers, including engineers, technicians, professionals and persons with managerial skills, are more important than unskilled labor. The migration of skilled labor, in particular to the US, UK and Canada, is a prominent feature of the Caribbean labor market. While migration leads to a loss in skills, one positive result is that the linkages created with the
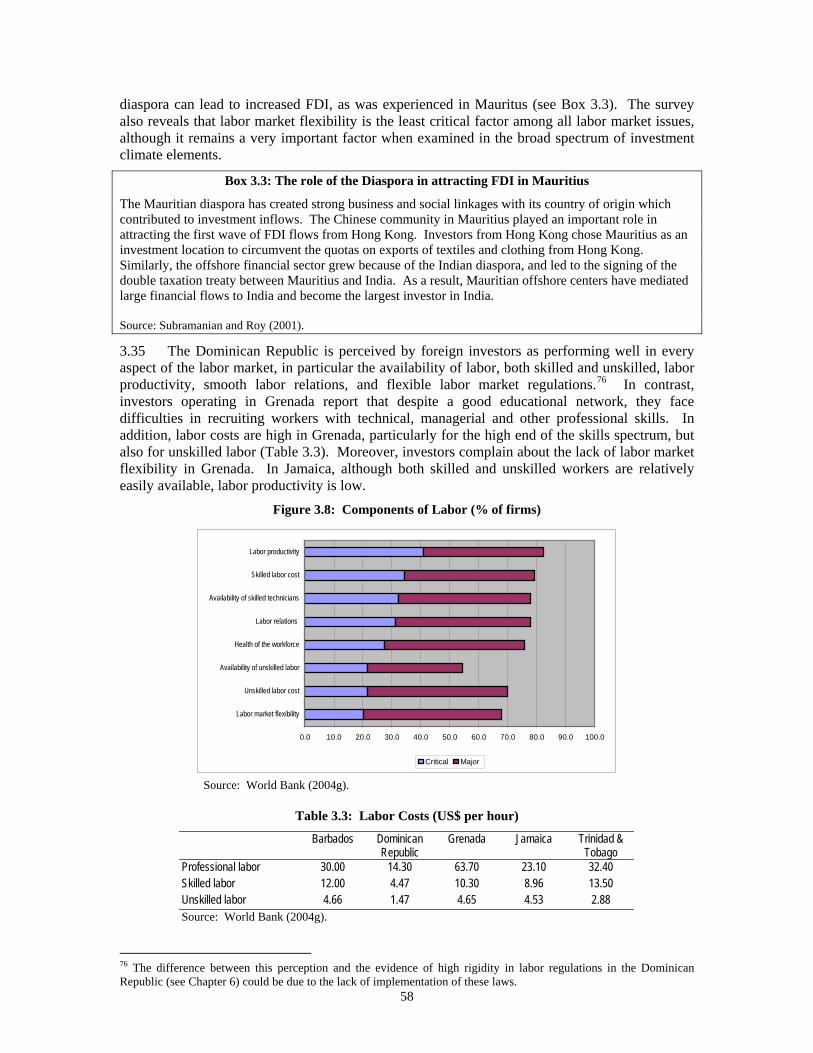
58
diaspora can lead to increased FDI, as was experienced in Mauritus (see Box 3.3). The survey also reveals that labor market flexibility is the least critical factor among all labor market issues, although it remains a very important factor when examined in the broad spectrum of investment climate elements.
Box 3.3: The role of the Diaspora in attracting FDI in Mauritius
The Mauritian diaspora has created strong business and social linkages with its country of origin which contributed to investment inflows. The Chinese community in Mauritius played an important role in attracting the first wave of FDI flows from Hong Kong. Investors from Hong Kong chose Mauritius as an investment location to circumvent the quotas on exports of textiles and clothing from Hong Kong. Similarly, the offshore financial sector grew because of the Indian diaspora, and led to the signing of the double taxation treaty between Mauritius and India. As a result, Mauritian offshore centers have mediated large financial flows to India and become the largest investor in India. Source: Subramanian and Roy (2001).
3.35 The Dominican Republic is perceived by foreign investors as performing well in every aspect of the labor market, in particular the availability of labor, both skilled and unskilled, labor productivity, smooth labor relations, and flexible labor market regulations.76 In contrast, investors operating in Grenada report that despite a good educational network, they face difficulties in recruiting workers with technical, managerial and other professional skills. In addition, labor costs are high in Grenada, particularly for the high end of the skills spectrum, but also for unskilled labor (Table 3.3). Moreover, investors complain about the lack of labor market flexibility in Grenada. In Jamaica, although both skilled and unskilled workers are relatively easily available, labor productivity is low.
Figure 3.8: Components of Labor (% of firms)
0.0 10.0 20.0 30.0 40.0 50.0 60.0 70.0 80.0 90.0 100.0
Labor market flexibility
Unskilled labor cost
Availability of unskilled labor
Health of the workforce
Labor relations
Availability of skilled technicians
Skilled labor cost
Labor productivity
Critical Major
Source: World Bank (2004g).
Table 3.3: Labor Costs (US$ per hour)
Barbados Dominican Republic
Grenada Jamaica Trinidad & Tobago
Professional labor 30.00 14.30 63.70 23.10 32.40 Skilled labor 12.00 4.47 10.30 8.96 13.50 Unskilled labor 4.66 1.47 4.65 4.53 2.88 Source: World Bank (2004g).
76 The difference between this perception and the evidence of high rigidity in labor regulations in the Dominican Republic (see Chapter 6) could be due to the lack of implementation of these laws.
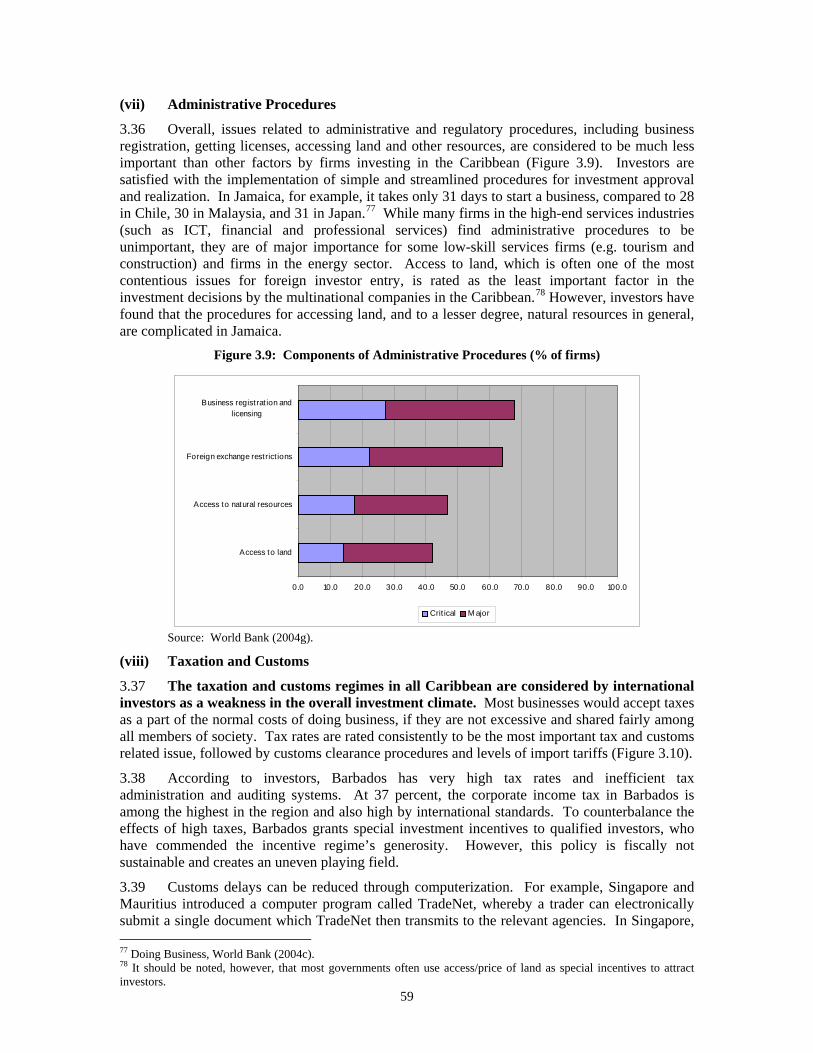
59
(vii) Administrative Procedures
3.36 Overall, issues related to administrative and regulatory procedures, including business registration, getting licenses, accessing land and other resources, are considered to be much less important than other factors by firms investing in the Caribbean (Figure 3.9). Investors are satisfied with the implementation of simple and streamlined procedures for investment approval and realization. In Jamaica, for example, it takes only 31 days to start a business, compared to 28 in Chile, 30 in Malaysia, and 31 in Japan.77 While many firms in the high-end services industries (such as ICT, financial and professional services) find administrative procedures to be unimportant, they are of major importance for some low-skill services firms (e.g. tourism and construction) and firms in the energy sector. Access to land, which is often one of the most contentious issues for foreign investor entry, is rated as the least important factor in the investment decisions by the multinational companies in the Caribbean.78 However, investors have found that the procedures for accessing land, and to a lesser degree, natural resources in general, are complicated in Jamaica.
Figure 3.9: Components of Administrative Procedures (% of firms)
0.0 10.0 20.0 30.0 40.0 50.0 60.0 70.0 80.0 90.0 100.0
Access to land
Access to natural resources
Foreign exchange restrict ions
Business registrat ion andlicensing
Crit ical M ajor
Source: World Bank (2004g).
(viii) Taxation and Customs
3.37 The taxation and customs regimes in all Caribbean are considered by international investors as a weakness in the overall investment climate. Most businesses would accept taxes as a part of the normal costs of doing business, if they are not excessive and shared fairly among all members of society. Tax rates are rated consistently to be the most important tax and customs related issue, followed by customs clearance procedures and levels of import tariffs (Figure 3.10).
3.38 According to investors, Barbados has very high tax rates and inefficient tax administration and auditing systems. At 37 percent, the corporate income tax in Barbados is among the highest in the region and also high by international standards. To counterbalance the effects of high taxes, Barbados grants special investment incentives to qualified investors, who have commended the incentive regime’s generosity. However, this policy is fiscally not sustainable and creates an uneven playing field.
3.39 Customs delays can be reduced through computerization. For example, Singapore and Mauritius introduced a computer program called TradeNet, whereby a trader can electronically submit a single document which TradeNet then transmits to the relevant agencies. In Singapore, 77 Doing Business, World Bank (2004c). 78 It should be noted, however, that most governments often use access/price of land as special incentives to attract investors.
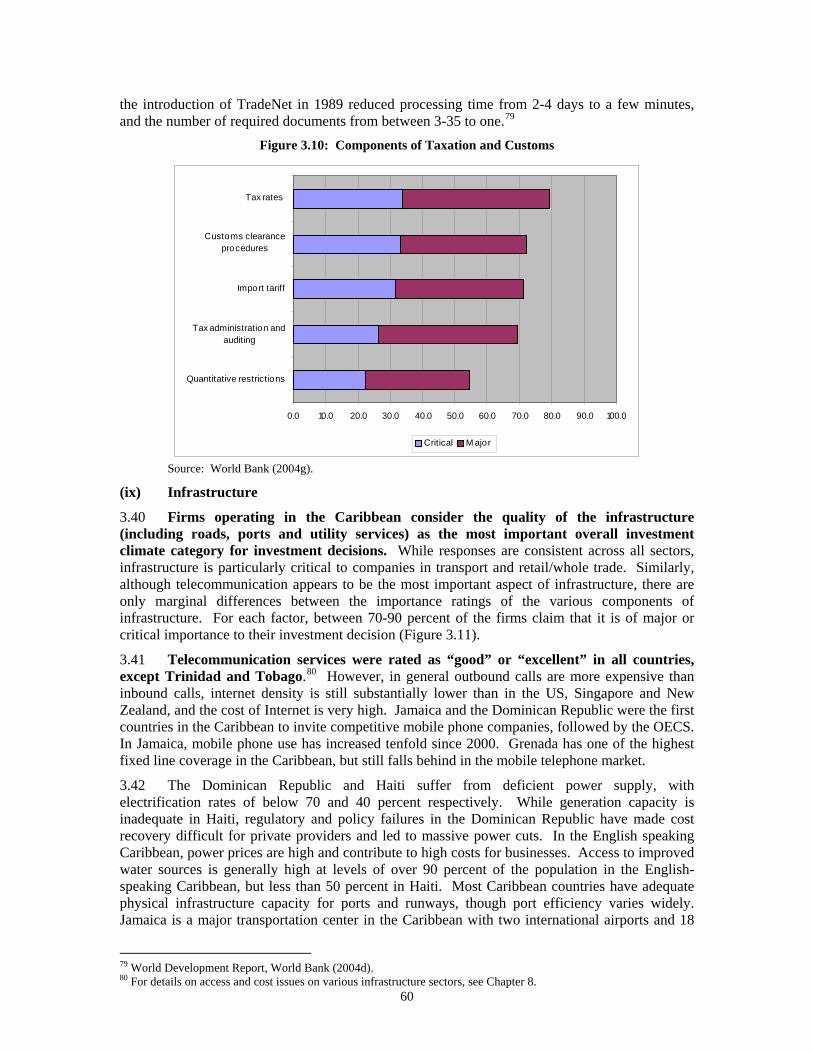
60
the introduction of TradeNet in 1989 reduced processing time from 2-4 days to a few minutes, and the number of required documents from between 3-35 to one.79
Figure 3.10: Components of Taxation and Customs
0.0 10.0 20.0 30.0 40.0 50.0 60.0 70.0 80.0 90.0 100.0
Quantitative restrictions
Tax administration andauditing
Import tariff
Customs clearanceprocedures
Tax rates
Critical M ajor
Source: World Bank (2004g).
(ix) Infrastructure
3.40 Firms operating in the Caribbean consider the quality of the infrastructure (including roads, ports and utility services) as the most important overall investment climate category for investment decisions. While responses are consistent across all sectors, infrastructure is particularly critical to companies in transport and retail/whole trade. Similarly, although telecommunication appears to be the most important aspect of infrastructure, there are only marginal differences between the importance ratings of the various components of infrastructure. For each factor, between 70-90 percent of the firms claim that it is of major or critical importance to their investment decision (Figure 3.11).
3.41 Telecommunication services were rated as “good” or “excellent” in all countries, except Trinidad and Tobago.80 However, in general outbound calls are more expensive than inbound calls, internet density is still substantially lower than in the US, Singapore and New Zealand, and the cost of Internet is very high. Jamaica and the Dominican Republic were the first countries in the Caribbean to invite competitive mobile phone companies, followed by the OECS. In Jamaica, mobile phone use has increased tenfold since 2000. Grenada has one of the highest fixed line coverage in the Caribbean, but still falls behind in the mobile telephone market.
3.42 The Dominican Republic and Haiti suffer from deficient power supply, with electrification rates of below 70 and 40 percent respectively. While generation capacity is inadequate in Haiti, regulatory and policy failures in the Dominican Republic have made cost recovery difficult for private providers and led to massive power cuts. In the English speaking Caribbean, power prices are high and contribute to high costs for businesses. Access to improved water sources is generally high at levels of over 90 percent of the population in the English-speaking Caribbean, but less than 50 percent in Haiti. Most Caribbean countries have adequate physical infrastructure capacity for ports and runways, though port efficiency varies widely. Jamaica is a major transportation center in the Caribbean with two international airports and 18
79 World Development Report, World Bank (2004d). 80 For details on access and cost issues on various infrastructure sectors, see Chapter 8.
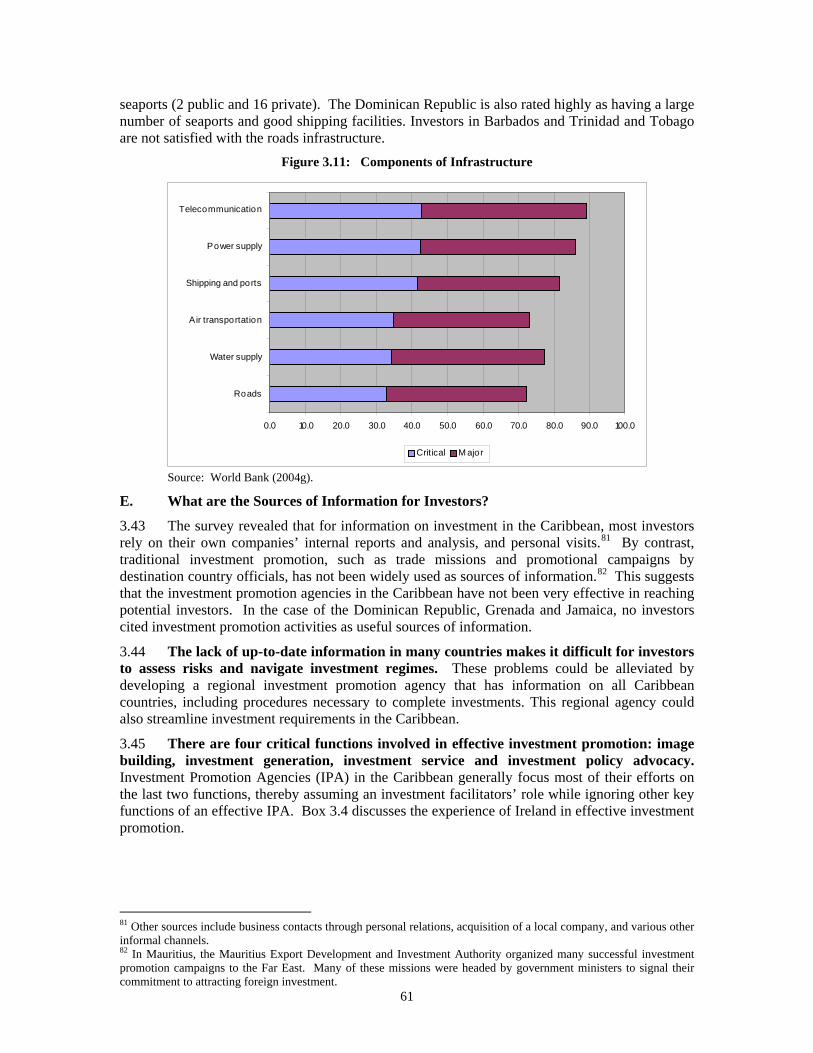
61
seaports (2 public and 16 private). The Dominican Republic is also rated highly as having a large number of seaports and good shipping facilities. Investors in Barbados and Trinidad and Tobago are not satisfied with the roads infrastructure.
Figure 3.11: Components of Infrastructure
0.0 10.0 20.0 30.0 40.0 50.0 60.0 70.0 80.0 90.0 100.0
Roads
Water supply
Air transportation
Shipping and ports
Power supply
Telecommunication
Critical M ajor
Source: World Bank (2004g).
E. What are the Sources of Information for Investors?
3.43 The survey revealed that for information on investment in the Caribbean, most investors rely on their own companies’ internal reports and analysis, and personal visits.81 By contrast, traditional investment promotion, such as trade missions and promotional campaigns by destination country officials, has not been widely used as sources of information.82 This suggests that the investment promotion agencies in the Caribbean have not been very effective in reaching potential investors. In the case of the Dominican Republic, Grenada and Jamaica, no investors cited investment promotion activities as useful sources of information.
3.44 The lack of up-to-date information in many countries makes it difficult for investors to assess risks and navigate investment regimes. These problems could be alleviated by developing a regional investment promotion agency that has information on all Caribbean countries, including procedures necessary to complete investments. This regional agency could also streamline investment requirements in the Caribbean.
3.45 There are four critical functions involved in effective investment promotion: image building, investment generation, investment service and investment policy advocacy. Investment Promotion Agencies (IPA) in the Caribbean generally focus most of their efforts on the last two functions, thereby assuming an investment facilitators’ role while ignoring other key functions of an effective IPA. Box 3.4 discusses the experience of Ireland in effective investment promotion.
81 Other sources include business contacts through personal relations, acquisition of a local company, and various other informal channels. 82 In Mauritius, the Mauritius Export Development and Investment Authority organized many successful investment promotion campaigns to the Far East. Many of these missions were headed by government ministers to signal their commitment to attracting foreign investment.
62
Box 3.4: Ireland- Private Sector Institutions in Action
Ireland, through its Industrial Development Authority (IDA), offers an example of how investment promotion can be effectively carried out. This agency spearheaded the effort to attract foreign companies to invest in Ireland. It touted to multinationals the relatively-cheap but well-skilled, English speaking work force, a low corporate tax rate, and access to the EU. It arranged for company-specific packages of investment support and lobbied the central government for particular infrastructure improvements and education initiatives such as a swift and decisive action in the area of IT. The Irish government was responsive and answered the call. For instance, it pushed forth education reforms that reduced the secondary dropout rate significantly and increased the levels of tertiary education. Moreover, the IDA created an overseas network of offices to establish close relationships with executives in specific companies and compiled what many considered to be the best database of potential investors around the world. It developed and fostered close relationships with executives in firms that fitted the pattern of development sought by the country, and maintained these contacts even when individuals moved to different firms. This information was provided free to interested firms, along with advice on how to proceed with potential deals. By 1998, foreign-owned firms generated approximately 30 percent of Ireland’s GDP and 40 percent of exports. Among the companies setting up major operations in Ireland were IBM, Microsoft, Dell, HP, Apple and Intel. Source: infoDev (2005).
F. Concluding Remarks
3.46 The challenge for the Caribbean going forward will be to maintain private investment rates and even increase them, and to make this investment more productive. In addition, given that productivity has fallen partly because of falling returns in traditional areas of investment, investment needs to be channeled into different segments. It is important, therefore, that the investment climate improve in order to respond to these challenges, giving the right signals, encouraging productivity improvement and investment in non-traditional areas including business and professional services, niche manufacturing and new segments in tourism. Rather than focus on offering generous tax incentives, countries should build a competitive climate which attracts higher quality investment that creates increased spillovers and linkages with the domestic economy. Improving the quality of human and physical capital, developing partnerships with the private sector, and providing efficient public services will help attract FDI in diversified and higher value added sectors.
3.47 Improving the Investment Climate. The foreign investors perceive most components of the investment climate as very important to their investment decisions, but pay particular attention to infrastructure, labor and the policy and legal environment in the Caribbean. The survey also indicates that the performance ratings under infrastructure, policy and legal environment and taxation and customs, in particular, do not meet the investors’ expectations. Within each category, there are some sub-components which are more important to firms than others.
3.48 In order to help improve productivity and encourage diversification, specific aspects of the investment climate need to be strengthened, many of which are analyzed in the report in detail. Some of the important policy initiatives could include addressing the constraints identified including high corporate income tax rates, inefficient customs clearances, shortages of skills in some countries (an increasingly important issue for a knowledge-based production structure), low labor productivity, and some aspects of infrastructure.
3.49 Regional cooperation and integration. The added challenge for the Caribbean countries is dealing with the issue of small market size, which has only been partially overcome by the very open nature of these economies. Accelerating trade integration in the CSME will help to increase ‘domestic’ market size, and moving as quickly as possible towards free movement of labor within the region will ease labor and skills shortages. Harmonization of
63
business regulations will lower transaction costs and uncertainty for investors.83 Single visa and work permits for foreign nationals valid in all Caribbean countries will improve incentives for multi-country investment. Joint promotion by a regional investment promotion center to engage in image-building, provide information and aim to standardize procedures across the region could help attract investment.84
3.50 The focus needs to shift from an subsidy-driven policy to one that provides a conducive investment climate for all potential investors. In this context, the region should seek to reduce and eliminate the damaging tax competition between countries that currently prevails,85 by implementing tax harmonization. In any case, the scope for tax incentives would be constrained by prospective revenue losses arising from possible future tariff liberalization. Also, reducing tax rates in general will make the reduction in special incentives more credible and also more acceptable, which also implies that the fiscal and debt issues will need to be tackled.
3.51 While significant challenges exist, companies and sectors are emerging that have overcome these constraints and expanded their vision beyond the confines of the Caribbean. New sectors have emerged in different areas including aquaculture (e.g. shrimp farming, tilapia, citrus products in Belize), agro-processing (e.g. pepper sauces, juices and soft drinks in Jamaica, Trinidad and Tobago, St. Lucia) and services (e.g. health spas in St. Lucia, ecotourism in Guyana, medical schools in Dominica and Grenada). The companies which been successful have focused on carving out niches in higher value-added products by developing brands based on local characteristics, creating domestic linkages, up-grading technology and investing in training. The emerging entrepreneurial spirit in the Caribbean is reflected in the success stories of these companies. This spirit needs to be awakened at a broader level in the Caribbean, for which an improved investment climate is critical.
83 For example, the harmonization of business law in 16 countries in Africa has been promoted by the Organisation pour l’Harmonisation en Afrique du Droit des Affaires (OHADA). So far, uniform acts have been adopted in the areas of general commercial law, companies, securities, debt recovery, bankruptcy and insolvency, and arbitration. 84 For example, the OECS, assisted by bilateral aid sources, for several years implemented an Eastern Caribbean Investment Promotion Service (ECIPs). The ECIPs was geared to building the investment image of the region and targeting prospective investors, who could then be funneled to the national promotion agencies of the region. Investment promotion is also important at the country level. One successful example is St. Lucia in the 1980s, when it had dedicated promotional representation (consisting of one professional) in the North American market that had an impact on the attraction of investment, in the electronics sector in particular. International experience and the St. Lucian experience suggests that the size of the overseas representation is less important than the professionalism of staff members and the incentives and reporting systems that operate within the organization. 85 For a discussion on the damaging effects of excessive competition and inadequate cooperation see Konrad and Schjelderup, 1999 (with conditions for tax-cooperation to be Pareto-improving), and Razin and Sadka, 2004.
64
Chapter 4 The Changing International Environment for the Caribbean
A. Introduction
4.1 Because of their small size, trade is especially important for the Caribbean countries. And this is why adjusting to the changing international trading environment is perhaps the most fundamental immediate challenge for the Caribbean. Trade preferences are being eroded, tariff revenues are facing the prospect of decline, and, perhaps most damning of all, competitiveness is declining.
4.2 Over the last decade at least, and especially since 1995, the Caribbean has been losing market share, even in the tourism sector, as well as in sugar, bananas, manufacturing and apparel. The reasons for the decline in competitiveness (and for concern about future export and growth prospects) are the subject of much of this report. Reversing the decline in competitiveness will not be easy, and will require tackling, among other things, and in varying degrees in different countries, the fiscal deterioration and associated instability, high and often rising wages, and inadequate skill formation and technology absorption. At the same time, there are also some increasing opportunities, especially in services, which the Caribbean could exploit if the above challenges are addressed and the investment climate improved. Chapter 5 looks at some of these emerging opportunities in the services sector.
4.3 This chapter provides a broad review of some of the major issues that affect Caribbean trade. It is intended to be strategic rather than comprehensive.86 Section B analyzes the Caribbean region’s dependence on trade, trade patterns and the shift to services. In Section C, various indicators show a decline in Caribbean competitiveness. Section D considers barriers to trade within CARICOM and also to trade with the rest of the world, and looks at the likely impact of tariff reductions. Section E explores the issue of transport costs and finds that export freight costs are competitive, at least to the USA. Section F considers the revenue effect of tariff liberalization, and shows that a few countries could suffer significant revenue losses and explores some alternative tax mobilization measures. Sections G and H look at the all-important issues of trade preferences, including in different sectors, and find that preferences may have detracted from trade performance. Section I makes a case for leveraging regional integration and defining a pro-active trade agenda for phasing out preferences, including capacity building and demands for international liberalization. Section J concludes with key policy options.
B. Trade Exposure and Patterns
(i) The Caribbean is highly dependent on trade
4.4 Foreign trade provides access to world markets for both large and small countries, but smaller countries gain more in terms of market size expansion, and so the effect of trade on growth of small countries is significantly larger.87 Openness enhances specialization, which improves the return on investment, which in turn stimulates growth. In addition, trade fosters productivity growth within industries, forcing inefficient firms to perform or exit and allowing the more efficient firms to expand.
4.5 To overcome the disadvantages of size, smaller countries tend to be more open. They rely heavily on imports for consumption because it is not efficient for them to produce small quantities of all products in demand. In addition, in order to exploit economies of scale, small countries must produce more than domestic demand in the goods in which they have a
86 More details on trade performance and regional trade patterns can be found in work done by ECLAC. See, for example, ECLAC, 2003a, 2003c, and 2004a. 87 An increase of one standard deviation in the degree of openness would raise the growth rate of a country the size of Mali by 0.419 percent, but would increase the growth of a much smaller country like Seychelles by 1.4 percent (see Helpman 2004, p. 72).
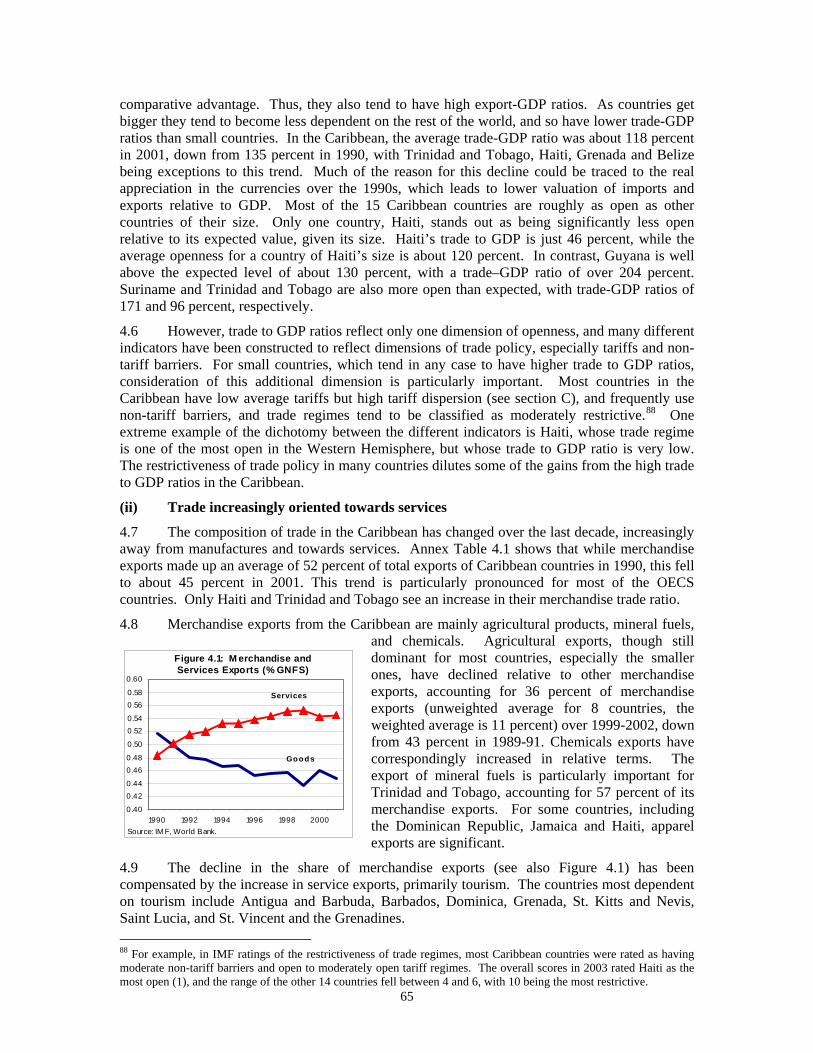
65
Figure 4.1: M erchandise and Services Exports (% GNFS)
0.40
0.420.44
0.460.48
0.50
0.520.54
0.560.58
0.60
1990 1992 1994 1996 1998 2000Source: IM F, World Bank.
Services
Go o d s
comparative advantage. Thus, they also tend to have high export-GDP ratios. As countries get bigger they tend to become less dependent on the rest of the world, and so have lower trade-GDP ratios than small countries. In the Caribbean, the average trade-GDP ratio was about 118 percent in 2001, down from 135 percent in 1990, with Trinidad and Tobago, Haiti, Grenada and Belize being exceptions to this trend. Much of the reason for this decline could be traced to the real appreciation in the currencies over the 1990s, which leads to lower valuation of imports and exports relative to GDP. Most of the 15 Caribbean countries are roughly as open as other countries of their size. Only one country, Haiti, stands out as being significantly less open relative to its expected value, given its size. Haiti’s trade to GDP is just 46 percent, while the average openness for a country of Haiti’s size is about 120 percent. In contrast, Guyana is well above the expected level of about 130 percent, with a trade–GDP ratio of over 204 percent. Suriname and Trinidad and Tobago are also more open than expected, with trade-GDP ratios of 171 and 96 percent, respectively.
4.6 However, trade to GDP ratios reflect only one dimension of openness, and many different indicators have been constructed to reflect dimensions of trade policy, especially tariffs and non-tariff barriers. For small countries, which tend in any case to have higher trade to GDP ratios, consideration of this additional dimension is particularly important. Most countries in the Caribbean have low average tariffs but high tariff dispersion (see section C), and frequently use non-tariff barriers, and trade regimes tend to be classified as moderately restrictive.88 One extreme example of the dichotomy between the different indicators is Haiti, whose trade regime is one of the most open in the Western Hemisphere, but whose trade to GDP ratio is very low. The restrictiveness of trade policy in many countries dilutes some of the gains from the high trade to GDP ratios in the Caribbean.
(ii) Trade increasingly oriented towards services
4.7 The composition of trade in the Caribbean has changed over the last decade, increasingly away from manufactures and towards services. Annex Table 4.1 shows that while merchandise exports made up an average of 52 percent of total exports of Caribbean countries in 1990, this fell to about 45 percent in 2001. This trend is particularly pronounced for most of the OECS countries. Only Haiti and Trinidad and Tobago see an increase in their merchandise trade ratio.
4.8 Merchandise exports from the Caribbean are mainly agricultural products, mineral fuels, and chemicals. Agricultural exports, though still dominant for most countries, especially the smaller ones, have declined relative to other merchandise exports, accounting for 36 percent of merchandise exports (unweighted average for 8 countries, the weighted average is 11 percent) over 1999-2002, down from 43 percent in 1989-91. Chemicals exports have correspondingly increased in relative terms. The export of mineral fuels is particularly important for Trinidad and Tobago, accounting for 57 percent of its merchandise exports. For some countries, including the Dominican Republic, Jamaica and Haiti, apparel exports are significant.
4.9 The decline in the share of merchandise exports (see also Figure 4.1) has been compensated by the increase in service exports, primarily tourism. The countries most dependent on tourism include Antigua and Barbuda, Barbados, Dominica, Grenada, St. Kitts and Nevis, Saint Lucia, and St. Vincent and the Grenadines. 88 For example, in IMF ratings of the restrictiveness of trade regimes, most Caribbean countries were rated as having moderate non-tariff barriers and open to moderately open tariff regimes. The overall scores in 2003 rated Haiti as the most open (1), and the range of the other 14 countries fell between 4 and 6, with 10 being the most restrictive.
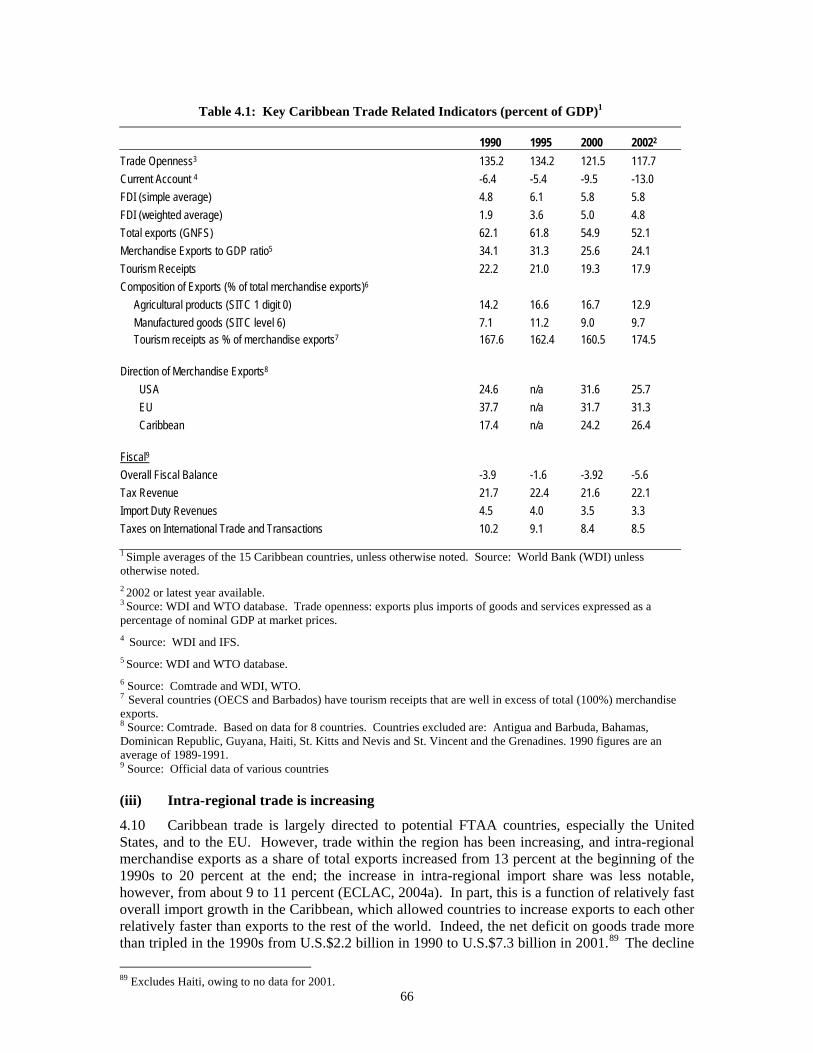
66
Table 4.1: Key Caribbean Trade Related Indicators (percent of GDP)1
1990 1995 2000 20022 Trade Openness3 135.2 134.2 121.5 117.7 Current Account 4 -6.4 -5.4 -9.5 -13.0 FDI (simple average) 4.8 6.1 5.8 5.8 FDI (weighted average) 1.9 3.6 5.0 4.8 Total exports (GNFS) 62.1 61.8 54.9 52.1 Merchandise Exports to GDP ratio5 34.1 31.3 25.6 24.1 Tourism Receipts 22.2 21.0 19.3 17.9 Composition of Exports (% of total merchandise exports)6 Agricultural products (SITC 1 digit 0) 14.2 16.6 16.7 12.9 Manufactured goods (SITC level 6) 7.1 11.2 9.0 9.7 Tourism receipts as % of merchandise exports7 167.6 162.4 160.5 174.5 Direction of Merchandise Exports8 USA 24.6 n/a 31.6 25.7 EU 37.7 n/a 31.7 31.3 Caribbean 17.4 n/a 24.2 26.4 Fiscal9 Overall Fiscal Balance -3.9 -1.6 -3.92 -5.6 Tax Revenue 21.7 22.4 21.6 22.1 Import Duty Revenues 4.5 4.0 3.5 3.3 Taxes on International Trade and Transactions 10.2 9.1 8.4 8.5 1 Simple averages of the 15 Caribbean countries, unless otherwise noted. Source: World Bank (WDI) unless otherwise noted. 2 2002 or latest year available. 3 Source: WDI and WTO database. Trade openness: exports plus imports of goods and services expressed as a percentage of nominal GDP at market prices. 4 Source: WDI and IFS. 5 Source: WDI and WTO database. 6 Source: Comtrade and WDI, WTO. 7 Several countries (OECS and Barbados) have tourism receipts that are well in excess of total (100%) merchandise exports. 8 Source: Comtrade. Based on data for 8 countries. Countries excluded are: Antigua and Barbuda, Bahamas, Dominican Republic, Guyana, Haiti, St. Kitts and Nevis and St. Vincent and the Grenadines. 1990 figures are an average of 1989-1991. 9 Source: Official data of various countries
(iii) Intra-regional trade is increasing
4.10 Caribbean trade is largely directed to potential FTAA countries, especially the United States, and to the EU. However, trade within the region has been increasing, and intra-regional merchandise exports as a share of total exports increased from 13 percent at the beginning of the 1990s to 20 percent at the end; the increase in intra-regional import share was less notable, however, from about 9 to 11 percent (ECLAC, 2004a). In part, this is a function of relatively fast overall import growth in the Caribbean, which allowed countries to increase exports to each other relatively faster than exports to the rest of the world. Indeed, the net deficit on goods trade more than tripled in the 1990s from U.S.$2.2 billion in 1990 to U.S.$7.3 billion in 2001.89 The decline 89 Excludes Haiti, owing to no data for 2001.
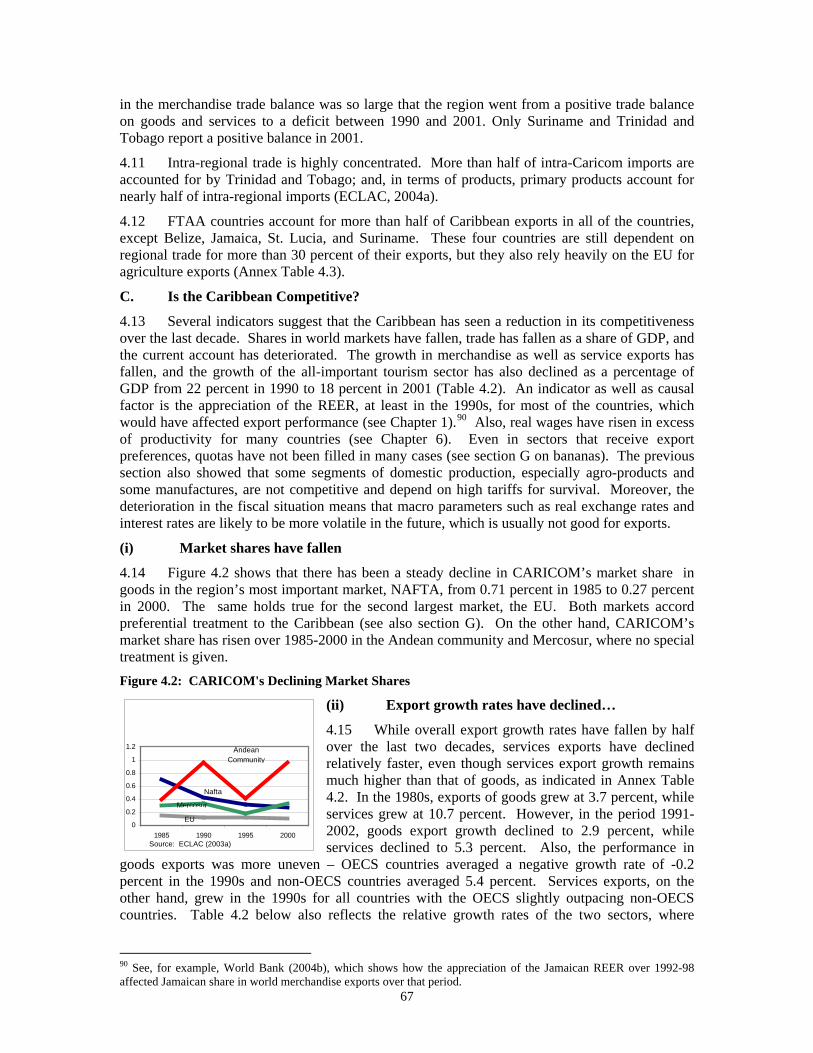
67
in the merchandise trade balance was so large that the region went from a positive trade balance on goods and services to a deficit between 1990 and 2001. Only Suriname and Trinidad and Tobago report a positive balance in 2001.
4.11 Intra-regional trade is highly concentrated. More than half of intra-Caricom imports are accounted for by Trinidad and Tobago; and, in terms of products, primary products account for nearly half of intra-regional imports (ECLAC, 2004a).
4.12 FTAA countries account for more than half of Caribbean exports in all of the countries, except Belize, Jamaica, St. Lucia, and Suriname. These four countries are still dependent on regional trade for more than 30 percent of their exports, but they also rely heavily on the EU for agriculture exports (Annex Table 4.3).
C. Is the Caribbean Competitive?
4.13 Several indicators suggest that the Caribbean has seen a reduction in its competitiveness over the last decade. Shares in world markets have fallen, trade has fallen as a share of GDP, and the current account has deteriorated. The growth in merchandise as well as service exports has fallen, and the growth of the all-important tourism sector has also declined as a percentage of GDP from 22 percent in 1990 to 18 percent in 2001 (Table 4.2). An indicator as well as causal factor is the appreciation of the REER, at least in the 1990s, for most of the countries, which would have affected export performance (see Chapter 1).90 Also, real wages have risen in excess of productivity for many countries (see Chapter 6). Even in sectors that receive export preferences, quotas have not been filled in many cases (see section G on bananas). The previous section also showed that some segments of domestic production, especially agro-products and some manufactures, are not competitive and depend on high tariffs for survival. Moreover, the deterioration in the fiscal situation means that macro parameters such as real exchange rates and interest rates are likely to be more volatile in the future, which is usually not good for exports.
(i) Market shares have fallen
4.14 Figure 4.2 shows that there has been a steady decline in CARICOM’s market share in goods in the region’s most important market, NAFTA, from 0.71 percent in 1985 to 0.27 percent in 2000. The same holds true for the second largest market, the EU. Both markets accord preferential treatment to the Caribbean (see also section G). On the other hand, CARICOM’s market share has risen over 1985-2000 in the Andean community and Mercosur, where no special treatment is given. Figure 4.2: CARICOM's Declining Market Shares
(ii) Export growth rates have declined…
4.15 While overall export growth rates have fallen by half over the last two decades, services exports have declined relatively faster, even though services export growth remains much higher than that of goods, as indicated in Annex Table 4.2. In the 1980s, exports of goods grew at 3.7 percent, while services grew at 10.7 percent. However, in the period 1991-2002, goods export growth declined to 2.9 percent, while services declined to 5.3 percent. Also, the performance in
goods exports was more uneven – OECS countries averaged a negative growth rate of -0.2 percent in the 1990s and non-OECS countries averaged 5.4 percent. Services exports, on the other hand, grew in the 1990s for all countries with the OECS slightly outpacing non-OECS countries. Table 4.2 below also reflects the relative growth rates of the two sectors, where
90 See, for example, World Bank (2004b), which shows how the appreciation of the Jamaican REER over 1992-98 affected Jamaican share in world merchandise exports over that period.
0
0.2
0.4
0.6
0.8
1
1.2
1985 1990 1995 2000
Andean Community
Nafta
EU
Mercosur
Source: ECLAC (2003a)
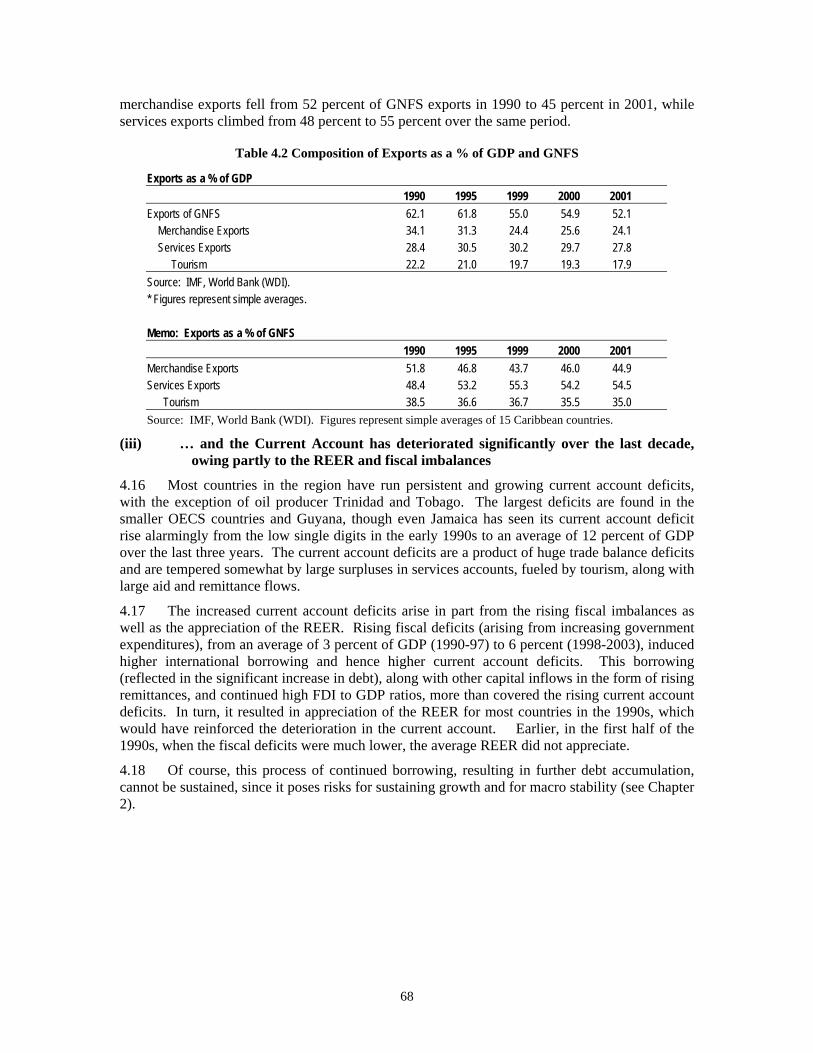
68
merchandise exports fell from 52 percent of GNFS exports in 1990 to 45 percent in 2001, while services exports climbed from 48 percent to 55 percent over the same period.
Table 4.2 Composition of Exports as a % of GDP and GNFS
Exports as a % of GDP 1990 1995 1999 2000 2001 Exports of GNFS 62.1 61.8 55.0 54.9 52.1 Merchandise Exports 34.1 31.3 24.4 25.6 24.1 Services Exports 28.4 30.5 30.2 29.7 27.8 Tourism 22.2 21.0 19.7 19.3 17.9 Source: IMF, World Bank (WDI). * Figures represent simple averages. Memo: Exports as a % of GNFS 1990 1995 1999 2000 2001 Merchandise Exports 51.8 46.8 43.7 46.0 44.9 Services Exports 48.4 53.2 55.3 54.2 54.5 Tourism 38.5 36.6 36.7 35.5 35.0 Source: IMF, World Bank (WDI). Figures represent simple averages of 15 Caribbean countries.
(iii) … and the Current Account has deteriorated significantly over the last decade, owing partly to the REER and fiscal imbalances
4.16 Most countries in the region have run persistent and growing current account deficits, with the exception of oil producer Trinidad and Tobago. The largest deficits are found in the smaller OECS countries and Guyana, though even Jamaica has seen its current account deficit rise alarmingly from the low single digits in the early 1990s to an average of 12 percent of GDP over the last three years. The current account deficits are a product of huge trade balance deficits and are tempered somewhat by large surpluses in services accounts, fueled by tourism, along with large aid and remittance flows.
4.17 The increased current account deficits arise in part from the rising fiscal imbalances as well as the appreciation of the REER. Rising fiscal deficits (arising from increasing government expenditures), from an average of 3 percent of GDP (1990-97) to 6 percent (1998-2003), induced higher international borrowing and hence higher current account deficits. This borrowing (reflected in the significant increase in debt), along with other capital inflows in the form of rising remittances, and continued high FDI to GDP ratios, more than covered the rising current account deficits. In turn, it resulted in appreciation of the REER for most countries in the 1990s, which would have reinforced the deterioration in the current account. Earlier, in the first half of the 1990s, when the fiscal deficits were much lower, the average REER did not appreciate.
4.18 Of course, this process of continued borrowing, resulting in further debt accumulation, cannot be sustained, since it poses risks for sustaining growth and for macro stability (see Chapter 2).
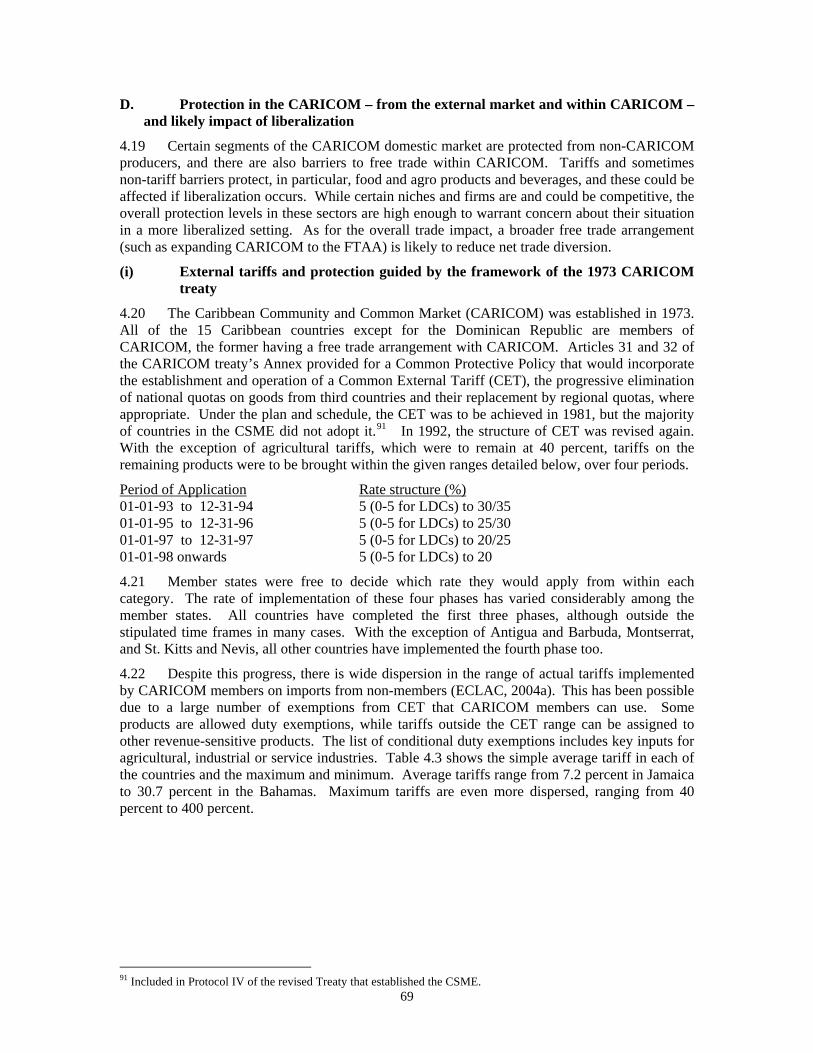
69
D. Protection in the CARICOM – from the external market and within CARICOM – and likely impact of liberalization
4.19 Certain segments of the CARICOM domestic market are protected from non-CARICOM producers, and there are also barriers to free trade within CARICOM. Tariffs and sometimes non-tariff barriers protect, in particular, food and agro products and beverages, and these could be affected if liberalization occurs. While certain niches and firms are and could be competitive, the overall protection levels in these sectors are high enough to warrant concern about their situation in a more liberalized setting. As for the overall trade impact, a broader free trade arrangement (such as expanding CARICOM to the FTAA) is likely to reduce net trade diversion.
(i) External tariffs and protection guided by the framework of the 1973 CARICOM treaty
4.20 The Caribbean Community and Common Market (CARICOM) was established in 1973. All of the 15 Caribbean countries except for the Dominican Republic are members of CARICOM, the former having a free trade arrangement with CARICOM. Articles 31 and 32 of the CARICOM treaty’s Annex provided for a Common Protective Policy that would incorporate the establishment and operation of a Common External Tariff (CET), the progressive elimination of national quotas on goods from third countries and their replacement by regional quotas, where appropriate. Under the plan and schedule, the CET was to be achieved in 1981, but the majority of countries in the CSME did not adopt it.91 In 1992, the structure of CET was revised again. With the exception of agricultural tariffs, which were to remain at 40 percent, tariffs on the remaining products were to be brought within the given ranges detailed below, over four periods.
Period of Application Rate structure (%) 01-01-93 to 12-31-94 5 (0-5 for LDCs) to 30/35 01-01-95 to 12-31-96 5 (0-5 for LDCs) to 25/30 01-01-97 to 12-31-97 5 (0-5 for LDCs) to 20/25 01-01-98 onwards 5 (0-5 for LDCs) to 20
4.21 Member states were free to decide which rate they would apply from within each category. The rate of implementation of these four phases has varied considerably among the member states. All countries have completed the first three phases, although outside the stipulated time frames in many cases. With the exception of Antigua and Barbuda, Montserrat, and St. Kitts and Nevis, all other countries have implemented the fourth phase too.
4.22 Despite this progress, there is wide dispersion in the range of actual tariffs implemented by CARICOM members on imports from non-members (ECLAC, 2004a). This has been possible due to a large number of exemptions from CET that CARICOM members can use. Some products are allowed duty exemptions, while tariffs outside the CET range can be assigned to other revenue-sensitive products. The list of conditional duty exemptions includes key inputs for agricultural, industrial or service industries. Table 4.3 shows the simple average tariff in each of the countries and the maximum and minimum. Average tariffs range from 7.2 percent in Jamaica to 30.7 percent in the Bahamas. Maximum tariffs are even more dispersed, ranging from 40 percent to 400 percent.
91 Included in Protocol IV of the revised Treaty that established the CSME.
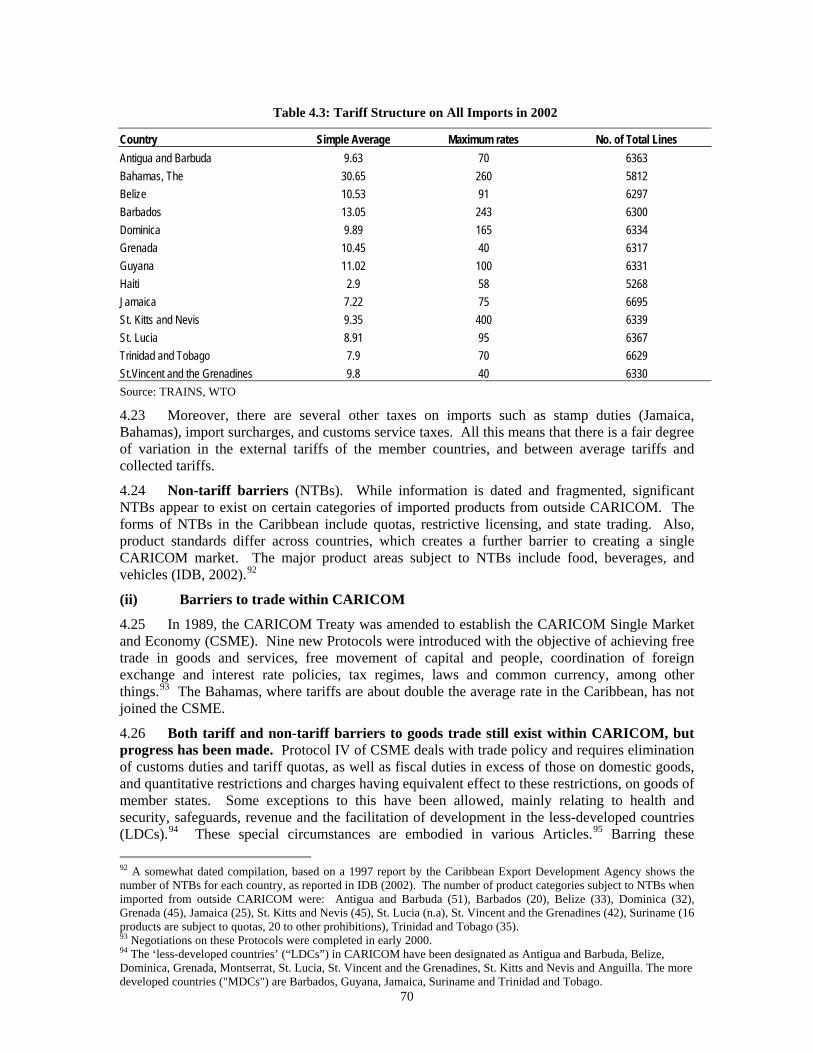
70
4.23 Moreover, there are several other taxes on imports such as stamp duties (Jamaica, Bahamas), import surcharges, and customs service taxes. All this means that there is a fair degree of variation in the external tariffs of the member countries, and between average tariffs and collected tariffs.
4.24 Non-tariff barriers (NTBs). While information is dated and fragmented, significant NTBs appear to exist on certain categories of imported products from outside CARICOM. The forms of NTBs in the Caribbean include quotas, restrictive licensing, and state trading. Also, product standards differ across countries, which creates a further barrier to creating a single CARICOM market. The major product areas subject to NTBs include food, beverages, and vehicles (IDB, 2002).92
(ii) Barriers to trade within CARICOM
4.25 In 1989, the CARICOM Treaty was amended to establish the CARICOM Single Market and Economy (CSME). Nine new Protocols were introduced with the objective of achieving free trade in goods and services, free movement of capital and people, coordination of foreign exchange and interest rate policies, tax regimes, laws and common currency, among other things.93 The Bahamas, where tariffs are about double the average rate in the Caribbean, has not joined the CSME.
4.26 Both tariff and non-tariff barriers to goods trade still exist within CARICOM, but progress has been made. Protocol IV of CSME deals with trade policy and requires elimination of customs duties and tariff quotas, as well as fiscal duties in excess of those on domestic goods, and quantitative restrictions and charges having equivalent effect to these restrictions, on goods of member states. Some exceptions to this have been allowed, mainly relating to health and security, safeguards, revenue and the facilitation of development in the less-developed countries (LDCs).94 These special circumstances are embodied in various Articles.95 Barring these 92 A somewhat dated compilation, based on a 1997 report by the Caribbean Export Development Agency shows the number of NTBs for each country, as reported in IDB (2002). The number of product categories subject to NTBs when imported from outside CARICOM were: Antigua and Barbuda (51), Barbados (20), Belize (33), Dominica (32), Grenada (45), Jamaica (25), St. Kitts and Nevis (45), St. Lucia (n.a), St. Vincent and the Grenadines (42), Suriname (16 products are subject to quotas, 20 to other prohibitions), Trinidad and Tobago (35). 93 Negotiations on these Protocols were completed in early 2000. 94 The ‘less-developed countries’ (“LDCs”) in CARICOM have been designated as Antigua and Barbuda, Belize, Dominica, Grenada, Montserrat, St. Lucia, St. Vincent and the Grenadines, St. Kitts and Nevis and Anguilla. The more developed countries ("MDCs") are Barbados, Guyana, Jamaica, Suriname and Trinidad and Tobago.
Table 4.3: Tariff Structure on All Imports in 2002
Country Simple Average Maximum rates No. of Total Lines Antigua and Barbuda 9.63 70 6363 Bahamas, The 30.65 260 5812 Belize 10.53 91 6297 Barbados 13.05 243 6300 Dominica 9.89 165 6334 Grenada 10.45 40 6317 Guyana 11.02 100 6331 Haiti 2.9 58 5268 Jamaica 7.22 75 6695 St. Kitts and Nevis 9.35 400 6339 St. Lucia 8.91 95 6367 Trinidad and Tobago 7.9 70 6629 St.Vincent and the Grenadines 9.8 40 6330 Source: TRAINS, WTO
71
exceptions, there has been much progress towards free trade in goods in the region. In June 2001, CARICOM reported only a few cases of unauthorized application of trade measures and practices, namely Belize (import duty on rum), Grenada (environmental tax on bottled water), Guyana (environmental tax on certain imported beverages), Dominica (duty on cigarettes) and St. Vincent and the Grenadines (import licenses on malt, stout, toilet paper and garbage bags). Simultaneously, there have been significant efforts to reduce the exceptions.96 A more recent update (October 2004, CARICOM) shows several instances of discriminatory environmental taxes in Antigua and Barbuda, Barbados, Grenada, Belize, Guyana and Dominica, as well as some other abrogations.
(iii) Sectoral and overall trade impact of tariff reductions
4.27 The above discussion means that there are two layers of protection in each CARICOM country, the protection from outside CARICOM through the CET and NTBs, and the other deviations from free trade that allow countries to protect themselves from other CARICOM countries. In this situation, potential reduction of tariff and non-tariff barriers, driven, for example, by FTAA, would affect both layers of protection, and could affect production and employment in the region.97 Annex Table 4.4 shows that at the 1 digit SITC level, average Caribbean tariffs (both simple and weighted averages) are highest in the food and live animals and beverages sectors, as well as animal and vegetable oils, machinery and transport equipment and miscellaneous manufactures. Sectors with high tariffs and high import volume contribute significantly to revenue, and the table shows that the largest share of import duty revenue comes from machinery and transport equipment, food and live animals, and manufactures. Of these, key import-competing sectors are food and live animals and some manufactures, and tariff reductions are likely to have the largest effect in these sectors, depending on the elasticity of demand. In particular, Barbados, Dominica, St. Lucia, St. Vincent and the Grenadines, and Trinidad and Tobago obtain more than 20 percent of their tariff revenue from agriculture duties.
4.28 In addition, the average tariff on beverages and tobacco is very high and imports are very low, indicating that the tariffs are prohibitory, as is the case in many countries. Indeed, the Dominican Republic is the only country with a tariff below 20 percent. A reduction or removal of tariffs on these products could therefore have a large impact on domestic industry—anecdotal evidence suggests that imported beverages are very popular. In contrast, removing import duties on machinery and transport equipment would have little effect on production, as domestic production in this area is very small.
4.29 The above also implies a possibly significant impact on the pattern and volume of intra-CARICOM trade. Currently, trade within the region is heavily concentrated in a few products, and the most important traded commodities are protected by the provision for ineligibility for duty exemptions (ECLAC 2004a). This has led to the formation of regional monopolies with resulting welfare costs. For instance, according to ECLAC, in 2000, over 70 percent of OECS’
95 Article 13 (Exclusion from this Annex) and Schedule I (products excluded from the Annex to the Treaty in pursuance of contractual obligations of Member States); paragraph 5 of Schedule III (reserve list applying to the less developed countries); Article 19 (dumped and subsidized Imports); Article 23 (general exceptions); Article 24 (security exceptions); Article 28 (import restrictions arising from Balance-of-Payment difficulties); Article 29 (difficulties in particular industries); Article 56 (promotion of industrial development in the less developed countries); and Schedule IX (marketing of oils and fats products). 96 (a) The items under Schedule I have been greatly reduced to only 9 products. (b) The list of products under paragraph 5 of Schedule III has also been reduced. (c) The operation of the Protocol contained in Schedule IX has been simplified to ensure that protection is only to ensure the objective of facilitating the trade from the LDCs. (d) Nine product groups benefiting from Article 56 treatment: curry powder, pasta products, candles, industrial gases, wheat flour, aerated beverages, beer, solar water heaters, and furniture of wood and upholstered fabric, are to be phased out in 2004. 97 The issue of tariff reduction on food and agro products, beverages, etc., is hypothetical at this point, since it is not clear if such products would actually be offered for liberalization in the FTAA, and also if the Caribbean would get special dispensation on tariffs for some products.
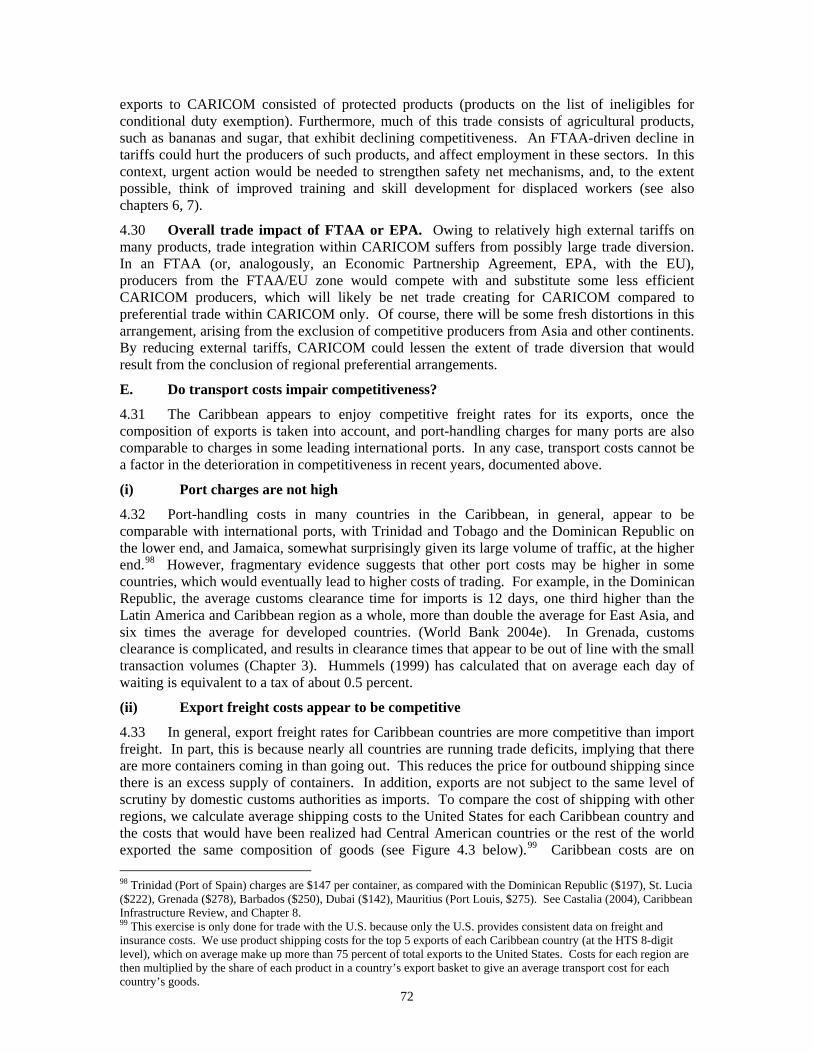
72
exports to CARICOM consisted of protected products (products on the list of ineligibles for conditional duty exemption). Furthermore, much of this trade consists of agricultural products, such as bananas and sugar, that exhibit declining competitiveness. An FTAA-driven decline in tariffs could hurt the producers of such products, and affect employment in these sectors. In this context, urgent action would be needed to strengthen safety net mechanisms, and, to the extent possible, think of improved training and skill development for displaced workers (see also chapters 6, 7).
4.30 Overall trade impact of FTAA or EPA. Owing to relatively high external tariffs on many products, trade integration within CARICOM suffers from possibly large trade diversion. In an FTAA (or, analogously, an Economic Partnership Agreement, EPA, with the EU), producers from the FTAA/EU zone would compete with and substitute some less efficient CARICOM producers, which will likely be net trade creating for CARICOM compared to preferential trade within CARICOM only. Of course, there will be some fresh distortions in this arrangement, arising from the exclusion of competitive producers from Asia and other continents. By reducing external tariffs, CARICOM could lessen the extent of trade diversion that would result from the conclusion of regional preferential arrangements.
E. Do transport costs impair competitiveness?
4.31 The Caribbean appears to enjoy competitive freight rates for its exports, once the composition of exports is taken into account, and port-handling charges for many ports are also comparable to charges in some leading international ports. In any case, transport costs cannot be a factor in the deterioration in competitiveness in recent years, documented above.
(i) Port charges are not high
4.32 Port-handling costs in many countries in the Caribbean, in general, appear to be comparable with international ports, with Trinidad and Tobago and the Dominican Republic on the lower end, and Jamaica, somewhat surprisingly given its large volume of traffic, at the higher end.98 However, fragmentary evidence suggests that other port costs may be higher in some countries, which would eventually lead to higher costs of trading. For example, in the Dominican Republic, the average customs clearance time for imports is 12 days, one third higher than the Latin America and Caribbean region as a whole, more than double the average for East Asia, and six times the average for developed countries. (World Bank 2004e). In Grenada, customs clearance is complicated, and results in clearance times that appear to be out of line with the small transaction volumes (Chapter 3). Hummels (1999) has calculated that on average each day of waiting is equivalent to a tax of about 0.5 percent.
(ii) Export freight costs appear to be competitive
4.33 In general, export freight rates for Caribbean countries are more competitive than import freight. In part, this is because nearly all countries are running trade deficits, implying that there are more containers coming in than going out. This reduces the price for outbound shipping since there is an excess supply of containers. In addition, exports are not subject to the same level of scrutiny by domestic customs authorities as imports. To compare the cost of shipping with other regions, we calculate average shipping costs to the United States for each Caribbean country and the costs that would have been realized had Central American countries or the rest of the world exported the same composition of goods (see Figure 4.3 below).99 Caribbean costs are on 98 Trinidad (Port of Spain) charges are $147 per container, as compared with the Dominican Republic ($197), St. Lucia ($222), Grenada ($278), Barbados ($250), Dubai ($142), Mauritius (Port Louis, $275). See Castalia (2004), Caribbean Infrastructure Review, and Chapter 8. 99 This exercise is only done for trade with the U.S. because only the U.S. provides consistent data on freight and insurance costs. We use product shipping costs for the top 5 exports of each Caribbean country (at the HTS 8-digit level), which on average make up more than 75 percent of total exports to the United States. Costs for each region are then multiplied by the share of each product in a country’s export basket to give an average transport cost for each country’s goods.
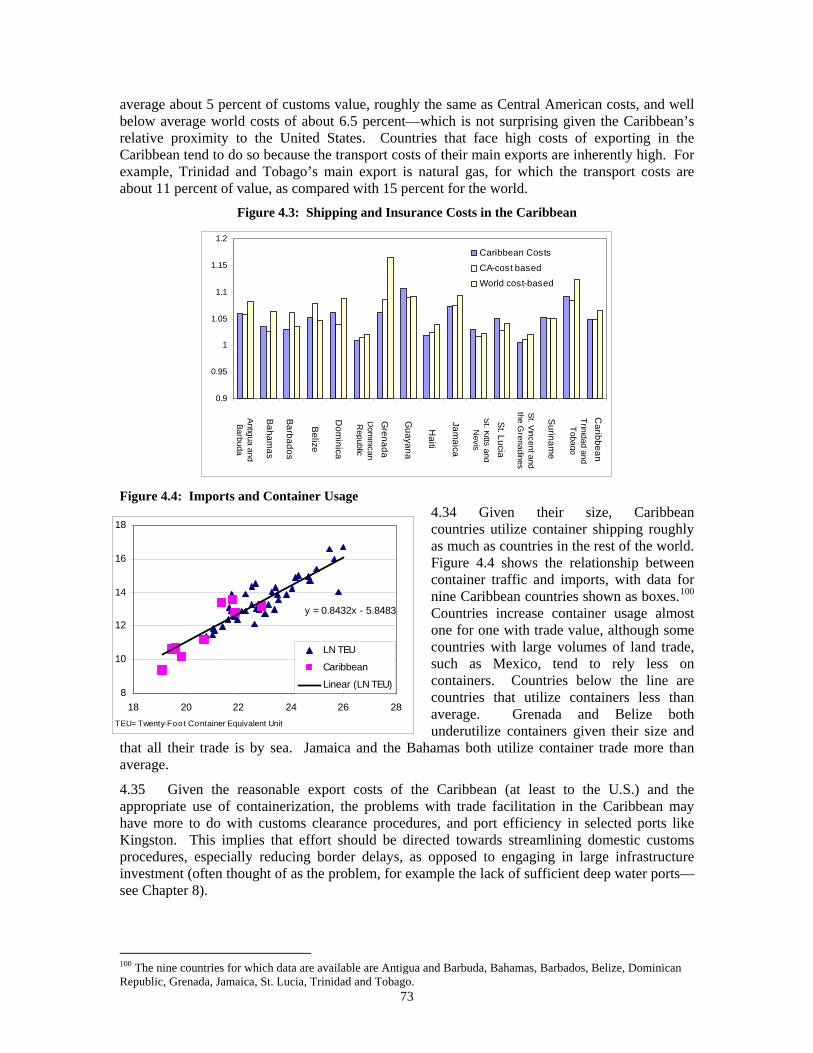
73
average about 5 percent of customs value, roughly the same as Central American costs, and well below average world costs of about 6.5 percent—which is not surprising given the Caribbean’s relative proximity to the United States. Countries that face high costs of exporting in the Caribbean tend to do so because the transport costs of their main exports are inherently high. For example, Trinidad and Tobago’s main export is natural gas, for which the transport costs are about 11 percent of value, as compared with 15 percent for the world.
Figure 4.3: Shipping and Insurance Costs in the Caribbean
0.9
0.95
1
1.05
1.1
1.15
1.2
Antigua Barbuda
Bahamas
Barbados
Belize
Dom
inica Is
Dom
inican Rep
Grenada Is
Guyana
Haiti
Jamaica
St Kitts-Nevis
St Lucia Is
St Vinc & Gren
Suriname
Trin & Tobago
Caribbean
Caribbean Costs
CA-cost based
World cost-based
Caribbean
Belize
Dom
inica
Dom
inican R
e public
Grenada
Guayana
Haiti
Jamaica
St. Kitts and N
evis
St. Lucia
St. Vincent and the G
renadines
Surinam
e
Trinidad and Toba go
Barbados
Baham
as
Antigua and Barbuda
Figure 4.4: Imports and Container Usage
4.34 Given their size, Caribbean countries utilize container shipping roughly as much as countries in the rest of the world. Figure 4.4 shows the relationship between container traffic and imports, with data for nine Caribbean countries shown as boxes.100 Countries increase container usage almost one for one with trade value, although some countries with large volumes of land trade, such as Mexico, tend to rely less on containers. Countries below the line are countries that utilize containers less than average. Grenada and Belize both underutilize containers given their size and
that all their trade is by sea. Jamaica and the Bahamas both utilize container trade more than average.
4.35 Given the reasonable export costs of the Caribbean (at least to the U.S.) and the appropriate use of containerization, the problems with trade facilitation in the Caribbean may have more to do with customs clearance procedures, and port efficiency in selected ports like Kingston. This implies that effort should be directed towards streamlining domestic customs procedures, especially reducing border delays, as opposed to engaging in large infrastructure investment (often thought of as the problem, for example the lack of sufficient deep water ports—see Chapter 8).
100 The nine countries for which data are available are Antigua and Barbuda, Bahamas, Barbados, Belize, Dominican Republic, Grenada, Jamaica, St. Lucia, Trinidad and Tobago.
y = 0.8432x - 5.8483
8
10
12
14
16
18
18 20 22 24 26 28
LN TEU
Caribbean
Linear (LN TEU)
TEU= Twenty-Foot Container Equivalent Unit
74
F. Revenue Effects of Tariff Reduction on Caribbean Countries.
4.36 In general, tariff reduction can affect revenues as well as sectors that are import-competing. Revenues can get affected not only because of duty reduction, but also because some other taxes are levied on the tariff-inclusive value of the product. Tariff reduction can of course raise concern in a country that already suffers from a fiscal problem, which is the case with many of the Caribbean countries, see Chapter 1. As pointed out in ECLAC (2004a), tariff reduction can reduce the space for fiscally-driven industrial and tourism policy, i.e., for providing concessions to attract investment. This would therefore be an opportune time for Caribbean countries to cooperate and try to reduce and eventually do away with ‘race to the bottom’ type policies, which are harmful to all countries in the long run (see Chapters 2, 3).
(i) A few countries may suffer significant revenue losses.
4.37 As the Caribbean countries are planning to extend liberalization through both regional and multilateral initiatives, the fiscal effects of liberalization will need to be dealt with. The tax revenue effects of trade liberalization will be quite large in many countries, especially the Bahamas, the Dominican Republic and Suriname. In general, domestic production in the agriculture and manufacturing sectors may be affected, as nearly 50 percent of revenue on average comes from tariffs on these products (see Annex Table 4.4).
4.38 The focus here is on import duties, which are targeted for reduction under free trade arrangements, and not on other international trade taxes or domestic consumption taxes levied on imports.101 As such, these estimates represent a lower bound, since they do not take into account other trade taxes that could also be removed, or other taxes which are levied on the tariff-inclusive value of the product. To calculate revenue loss, all tariffs on imports from the designated trade partners go to zero and trade shares are assumed to remain constant. Thus, only the direct effect of tariff reduction is calculated.102
4.39 Import duties constitute a significant source of revenue in the Caribbean, averaging more than 3 percent of GDP, as compared to less than 1 percent in LAC (Latin America and the Caribbean) as a whole. Import duties make up an average (unweighted) of about 15 percent of tax revenue (Annex Table 4.6), but the Bahamas obtains nearly half of its tax revenue from import duties, and Antigua and Barbuda, the Dominican Republic, St. Kitts and Nevis, and Suriname all collect more than 15 percent of tax revenue through import duties.
4.40 Annex Table 4.6 shows the direct loss in tariff revenue that each country would experience as a result of complete trade liberalization with the hemisphere and with the USA, as a percentage of tax revenue, and as a percent of GDP. The FTAA would result in an average 11 percent loss in tax revenue (2.4 percent of GDP) for the Caribbean, and an FTA with the United States alone, about an 8 percent loss (1.5 percent of GDP). With the exception of Antigua and Barbuda, all the OECS countries are projected to lose more than 2 percent of GDP as a result of FTAA. Of these, St. Kitts and Nevis, Grenada, and Dominica, who already have debt and fiscal problems, could be particularly affected. The impact on the Bahamas is the highest, and could be nearly 8 percent of GDP. Other countries whose fiscal situation could be strained are Jamaica and the Dominican Republic.
101 While the OECS countries do not have high tariffs relative to the region, they are more dependent on overall international trade taxes, with over 50 percent of revenue coming from such taxes. 102 A lower tariff could lead to more revenue if import expansion exceeds the decline in the tariff. However, to the extent that liberalization favors certain products or countries, the direct effect is likely to be an underestimate of revenue losses since imports will shift to low tariff products or countries.
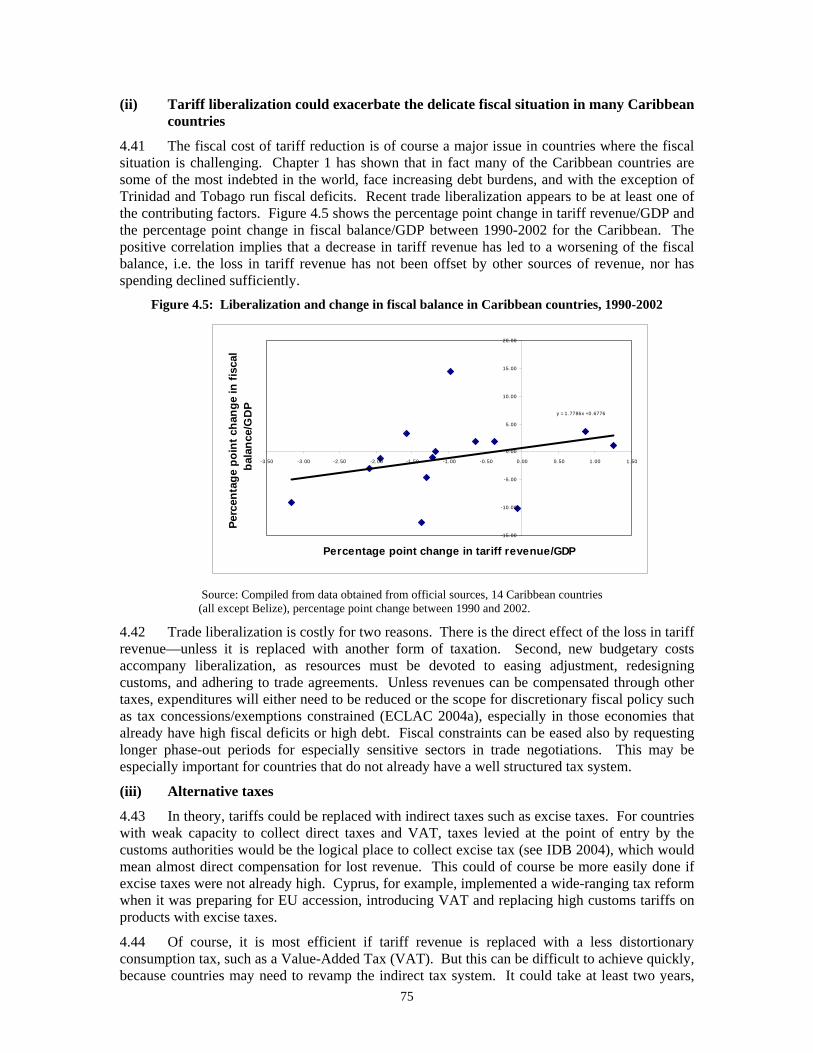
75
(ii) Tariff liberalization could exacerbate the delicate fiscal situation in many Caribbean countries
4.41 The fiscal cost of tariff reduction is of course a major issue in countries where the fiscal situation is challenging. Chapter 1 has shown that in fact many of the Caribbean countries are some of the most indebted in the world, face increasing debt burdens, and with the exception of Trinidad and Tobago run fiscal deficits. Recent trade liberalization appears to be at least one of the contributing factors. Figure 4.5 shows the percentage point change in tariff revenue/GDP and the percentage point change in fiscal balance/GDP between 1990-2002 for the Caribbean. The positive correlation implies that a decrease in tariff revenue has led to a worsening of the fiscal balance, i.e. the loss in tariff revenue has not been offset by other sources of revenue, nor has spending declined sufficiently.
Figure 4.5: Liberalization and change in fiscal balance in Caribbean countries, 1990-2002
y = 1.7786x + 0.6776
-15.00
-10.00
-5.00
0.00
5.00
10.00
15.00
20.00
-3.50 -3.00 -2.50 -2.00 -1.50 -1.00 -0.50 0.00 0.50 1.00 1.50
Percentage point change in tariff revenue/GDP
Perc
enta
ge p
oint
cha
nge
in fi
scal
ba
lanc
e/G
DP
Source: Compiled from data obtained from official sources, 14 Caribbean countries (all except Belize), percentage point change between 1990 and 2002.
4.42 Trade liberalization is costly for two reasons. There is the direct effect of the loss in tariff revenue—unless it is replaced with another form of taxation. Second, new budgetary costs accompany liberalization, as resources must be devoted to easing adjustment, redesigning customs, and adhering to trade agreements. Unless revenues can be compensated through other taxes, expenditures will either need to be reduced or the scope for discretionary fiscal policy such as tax concessions/exemptions constrained (ECLAC 2004a), especially in those economies that already have high fiscal deficits or high debt. Fiscal constraints can be eased also by requesting longer phase-out periods for especially sensitive sectors in trade negotiations. This may be especially important for countries that do not already have a well structured tax system.
(iii) Alternative taxes
4.43 In theory, tariffs could be replaced with indirect taxes such as excise taxes. For countries with weak capacity to collect direct taxes and VAT, taxes levied at the point of entry by the customs authorities would be the logical place to collect excise tax (see IDB 2004), which would mean almost direct compensation for lost revenue. This could of course be more easily done if excise taxes were not already high. Cyprus, for example, implemented a wide-ranging tax reform when it was preparing for EU accession, introducing VAT and replacing high customs tariffs on products with excise taxes.
4.44 Of course, it is most efficient if tariff revenue is replaced with a less distortionary consumption tax, such as a Value-Added Tax (VAT). But this can be difficult to achieve quickly, because countries may need to revamp the indirect tax system. It could take at least two years,
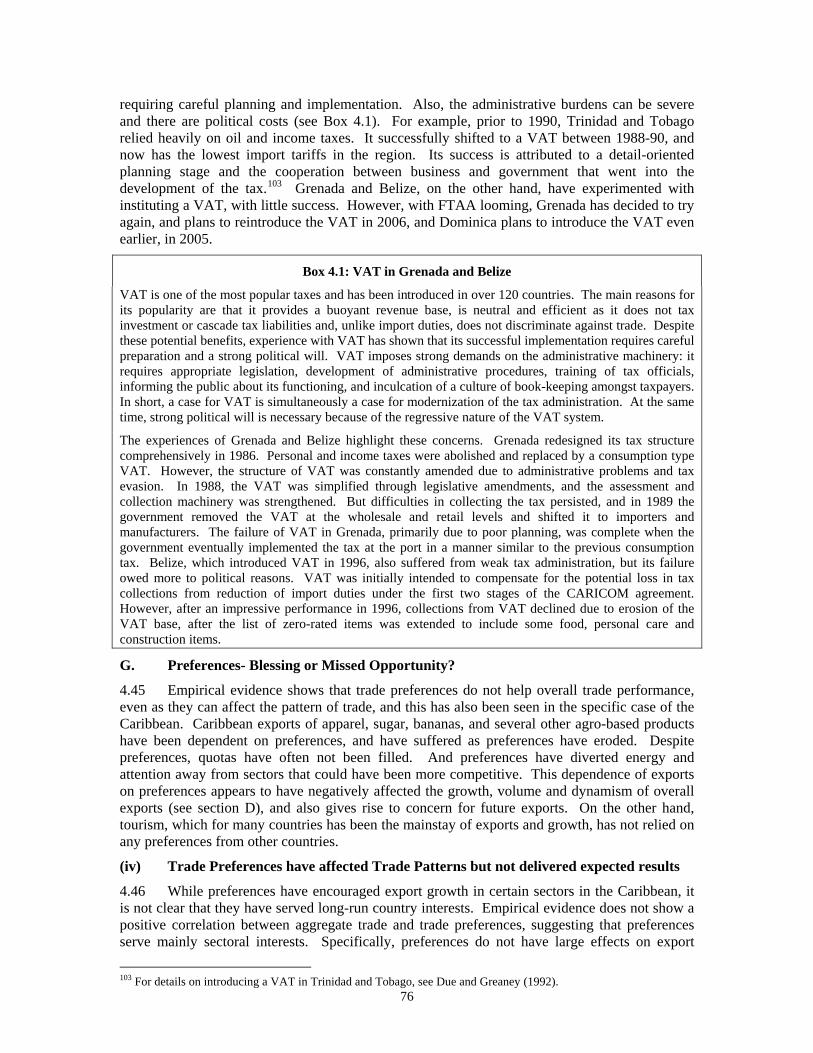
76
requiring careful planning and implementation. Also, the administrative burdens can be severe and there are political costs (see Box 4.1). For example, prior to 1990, Trinidad and Tobago relied heavily on oil and income taxes. It successfully shifted to a VAT between 1988-90, and now has the lowest import tariffs in the region. Its success is attributed to a detail-oriented planning stage and the cooperation between business and government that went into the development of the tax.103 Grenada and Belize, on the other hand, have experimented with instituting a VAT, with little success. However, with FTAA looming, Grenada has decided to try again, and plans to reintroduce the VAT in 2006, and Dominica plans to introduce the VAT even earlier, in 2005.
Box 4.1: VAT in Grenada and Belize
VAT is one of the most popular taxes and has been introduced in over 120 countries. The main reasons for its popularity are that it provides a buoyant revenue base, is neutral and efficient as it does not tax investment or cascade tax liabilities and, unlike import duties, does not discriminate against trade. Despite these potential benefits, experience with VAT has shown that its successful implementation requires careful preparation and a strong political will. VAT imposes strong demands on the administrative machinery: it requires appropriate legislation, development of administrative procedures, training of tax officials, informing the public about its functioning, and inculcation of a culture of book-keeping amongst taxpayers. In short, a case for VAT is simultaneously a case for modernization of the tax administration. At the same time, strong political will is necessary because of the regressive nature of the VAT system.
The experiences of Grenada and Belize highlight these concerns. Grenada redesigned its tax structure comprehensively in 1986. Personal and income taxes were abolished and replaced by a consumption type VAT. However, the structure of VAT was constantly amended due to administrative problems and tax evasion. In 1988, the VAT was simplified through legislative amendments, and the assessment and collection machinery was strengthened. But difficulties in collecting the tax persisted, and in 1989 the government removed the VAT at the wholesale and retail levels and shifted it to importers and manufacturers. The failure of VAT in Grenada, primarily due to poor planning, was complete when the government eventually implemented the tax at the port in a manner similar to the previous consumption tax. Belize, which introduced VAT in 1996, also suffered from weak tax administration, but its failure owed more to political reasons. VAT was initially intended to compensate for the potential loss in tax collections from reduction of import duties under the first two stages of the CARICOM agreement. However, after an impressive performance in 1996, collections from VAT declined due to erosion of the VAT base, after the list of zero-rated items was extended to include some food, personal care and construction items.
G. Preferences- Blessing or Missed Opportunity?
4.45 Empirical evidence shows that trade preferences do not help overall trade performance, even as they can affect the pattern of trade, and this has also been seen in the specific case of the Caribbean. Caribbean exports of apparel, sugar, bananas, and several other agro-based products have been dependent on preferences, and have suffered as preferences have eroded. Despite preferences, quotas have often not been filled. And preferences have diverted energy and attention away from sectors that could have been more competitive. This dependence of exports on preferences appears to have negatively affected the growth, volume and dynamism of overall exports (see section D), and also gives rise to concern for future exports. On the other hand, tourism, which for many countries has been the mainstay of exports and growth, has not relied on any preferences from other countries.
(iv) Trade Preferences have affected Trade Patterns but not delivered expected results
4.46 While preferences have encouraged export growth in certain sectors in the Caribbean, it is not clear that they have served long-run country interests. Empirical evidence does not show a positive correlation between aggregate trade and trade preferences, suggesting that preferences serve mainly sectoral interests. Specifically, preferences do not have large effects on export
103 For details on introducing a VAT in Trinidad and Tobago, see Due and Greaney (1992).
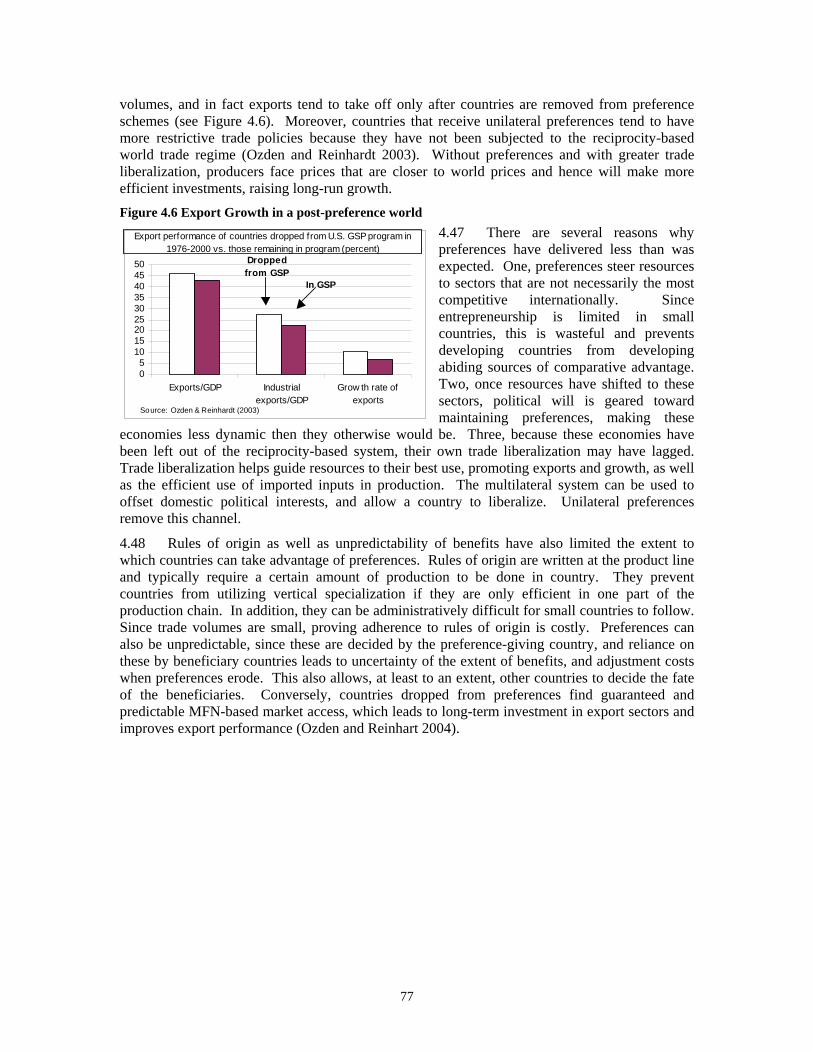
77
05
101520253035404550
Exports/GDP Industrialexports/GDP
Grow th rate ofexports
Dropped from GSP
In GSP
Source: Ozden & Reinhardt (2003)
Export performance of countries dropped from U.S. GSP program in 1976-2000 vs. those remaining in program (percent)
volumes, and in fact exports tend to take off only after countries are removed from preference schemes (see Figure 4.6). Moreover, countries that receive unilateral preferences tend to have more restrictive trade policies because they have not been subjected to the reciprocity-based world trade regime (Ozden and Reinhardt 2003). Without preferences and with greater trade liberalization, producers face prices that are closer to world prices and hence will make more efficient investments, raising long-run growth. Figure 4.6 Export Growth in a post-preference world
4.47 There are several reasons why preferences have delivered less than was expected. One, preferences steer resources to sectors that are not necessarily the most competitive internationally. Since entrepreneurship is limited in small countries, this is wasteful and prevents developing countries from developing abiding sources of comparative advantage. Two, once resources have shifted to these sectors, political will is geared toward maintaining preferences, making these
economies less dynamic then they otherwise would be. Three, because these economies have been left out of the reciprocity-based system, their own trade liberalization may have lagged. Trade liberalization helps guide resources to their best use, promoting exports and growth, as well as the efficient use of imported inputs in production. The multilateral system can be used to offset domestic political interests, and allow a country to liberalize. Unilateral preferences remove this channel.
4.48 Rules of origin as well as unpredictability of benefits have also limited the extent to which countries can take advantage of preferences. Rules of origin are written at the product line and typically require a certain amount of production to be done in country. They prevent countries from utilizing vertical specialization if they are only efficient in one part of the production chain. In addition, they can be administratively difficult for small countries to follow. Since trade volumes are small, proving adherence to rules of origin is costly. Preferences can also be unpredictable, since these are decided by the preference-giving country, and reliance on these by beneficiary countries leads to uncertainty of the extent of benefits, and adjustment costs when preferences erode. This also allows, at least to an extent, other countries to decide the fate of the beneficiaries. Conversely, countries dropped from preferences find guaranteed and predictable MFN-based market access, which leads to long-term investment in export sectors and improves export performance (Ozden and Reinhart 2004).
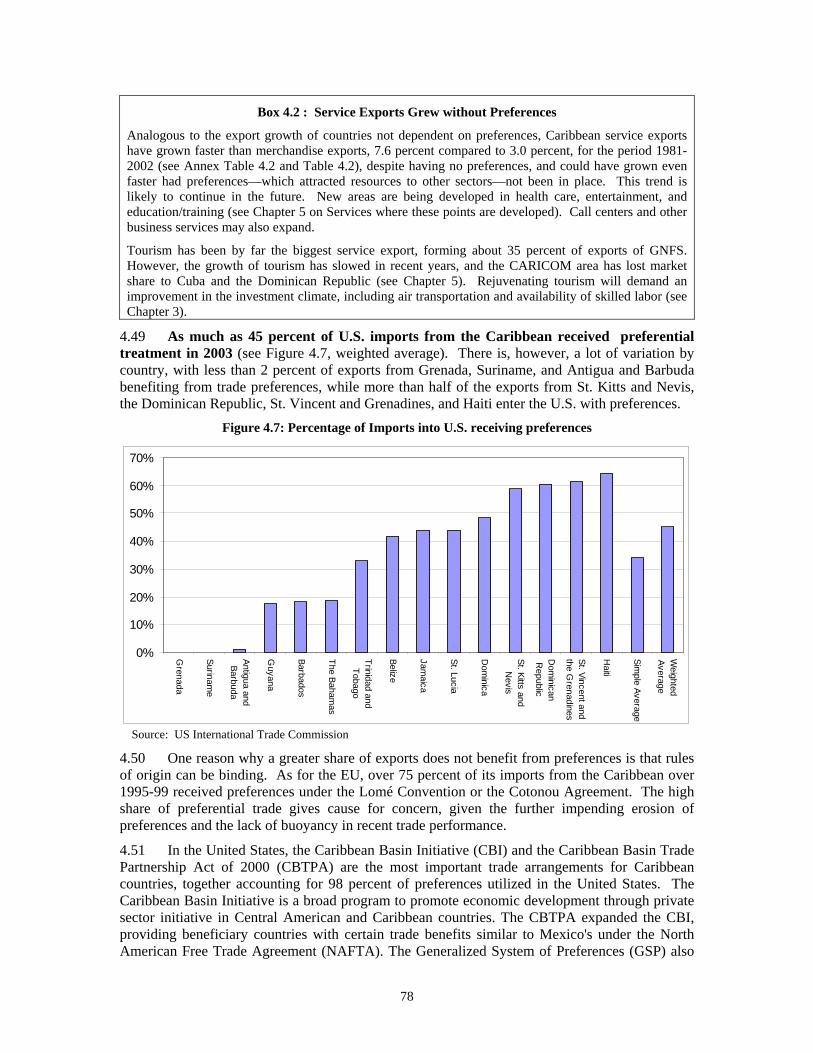
78
Box 4.2 : Service Exports Grew without Preferences
Analogous to the export growth of countries not dependent on preferences, Caribbean service exports have grown faster than merchandise exports, 7.6 percent compared to 3.0 percent, for the period 1981-2002 (see Annex Table 4.2 and Table 4.2), despite having no preferences, and could have grown even faster had preferences—which attracted resources to other sectors—not been in place. This trend is likely to continue in the future. New areas are being developed in health care, entertainment, and education/training (see Chapter 5 on Services where these points are developed). Call centers and other business services may also expand.
Tourism has been by far the biggest service export, forming about 35 percent of exports of GNFS. However, the growth of tourism has slowed in recent years, and the CARICOM area has lost market share to Cuba and the Dominican Republic (see Chapter 5). Rejuvenating tourism will demand an improvement in the investment climate, including air transportation and availability of skilled labor (see Chapter 3).
4.49 As much as 45 percent of U.S. imports from the Caribbean received preferential treatment in 2003 (see Figure 4.7, weighted average). There is, however, a lot of variation by country, with less than 2 percent of exports from Grenada, Suriname, and Antigua and Barbuda benefiting from trade preferences, while more than half of the exports from St. Kitts and Nevis, the Dominican Republic, St. Vincent and Grenadines, and Haiti enter the U.S. with preferences.
Figure 4.7: Percentage of Imports into U.S. receiving preferences
0%
10%
20%
30%
40%
50%
60%
70%
Grenada
Suriname
Antigua andBarbuda
Guyana
Barbados
The Bahamas
Trinidad andTobago
Belize
Jamaica
St. Lucia
Dom
inica
St. Kitts andN
evis
Dom
inicanR
epublic
St. Vincent andthe G
renadines
Haiti
Simple Average
Weighted
Average
Source: US International Trade Commission
4.50 One reason why a greater share of exports does not benefit from preferences is that rules of origin can be binding. As for the EU, over 75 percent of its imports from the Caribbean over 1995-99 received preferences under the Lomé Convention or the Cotonou Agreement. The high share of preferential trade gives cause for concern, given the further impending erosion of preferences and the lack of buoyancy in recent trade performance.
4.51 In the United States, the Caribbean Basin Initiative (CBI) and the Caribbean Basin Trade Partnership Act of 2000 (CBTPA) are the most important trade arrangements for Caribbean countries, together accounting for 98 percent of preferences utilized in the United States. The Caribbean Basin Initiative is a broad program to promote economic development through private sector initiative in Central American and Caribbean countries. The CBTPA expanded the CBI, providing beneficiary countries with certain trade benefits similar to Mexico's under the North American Free Trade Agreement (NAFTA). The Generalized System of Preferences (GSP) also
79
provides preferences to the developing countries in the region, but since the CBI and CBTPA are broader, less than one percent of total imports from the Caribbean entered through GSP.
(v) U.S. preferences helped apparel grow, for a while
4.52 Apparel is one of the main beneficiaries of U.S. preferences. Among the Caribbean countries, Haiti, Jamaica, and the Dominican Republic export significant amount of apparel to the United States. The largest exporter by far is the Dominican Republic, with apparel exports valued at over $2 billion in 2003. Jamaica and Haiti both exported less than $300 million in 2003. Export growth however has been highest in Haiti in recent years, with exports nearly tripling since 1996 although from a low base.
4.53 In contrast, exports from Jamaica have declined sharply in recent years, owing to wage increases in excess of productivity, appreciation of the exchange rate in the 1990s, rising crime (which made it difficult and expensive to run second shifts, and added to overhead costs), and, since 1994, the erosion in preferences arising from NAFTA-induced competition from Mexico (see World Bank 2004b for more details). The decline of Jamaican apparel illustrates the pitfalls of relying on preferences—with no incentives to improve productivity, combined with eroding preferences, the rise of competitors in a footloose industry resulted in the departure of apparel investors from Jamaica.
4.54 Haiti’s export growth is due in part to increased usage of trade preferences. If MFN tariffs had been charged on its apparel exports, on average Haiti would have paid close to 20 percent in tariffs in 2003. But, as a result of preferences, Haiti paid less than 3 percent in tariffs, yielding a preference margin of about 17 percent, well above the average preference margin of 13 percent for the CBI beneficiaries.
4.55 Perhaps more important than tariff preferences are the relaxed quotas that the Caribbean faces as compared with Asia. More than half of Asian exports of apparel to the United States are constrained (Nathan Associates 2002).104 In 2003, neither the Dominican Republic, Haiti, nor Jamaica had any binding quotas. Ozden and Sharma (2004) find that if all textile and apparel quotas were to be removed, average prices would fall by about 24 percent. This shows how much harder it will be for the Caribbean to compete without preferences.
4.56 Moreover, apparel exports from countries restrained by quotas have risen rapidly in those product areas where quotas have been eliminated. China experienced especially rapid growth, particularly among Stage 1, 2, and 3 products (see figure 4.8).105 Exports of these products from the CBI countries declined. Exports from the three main Caribbean exporters in these products declined even more rapidly (Figure 4.9).
104 Constrained is defined as having a quota more than 85 percent full. 105 Under the Uruguay Round trade negotiations, the US agreed to eliminate textile and apparel quotas defined under the MFA over a period of 10 years. The first 3 stages of the gradual phase-out occurred on the first days of January 1995, 1998 and 2002. Dominican apparel exporters sustained significant losses in US market share between 1996 and 2003 (World Bank 2004e).
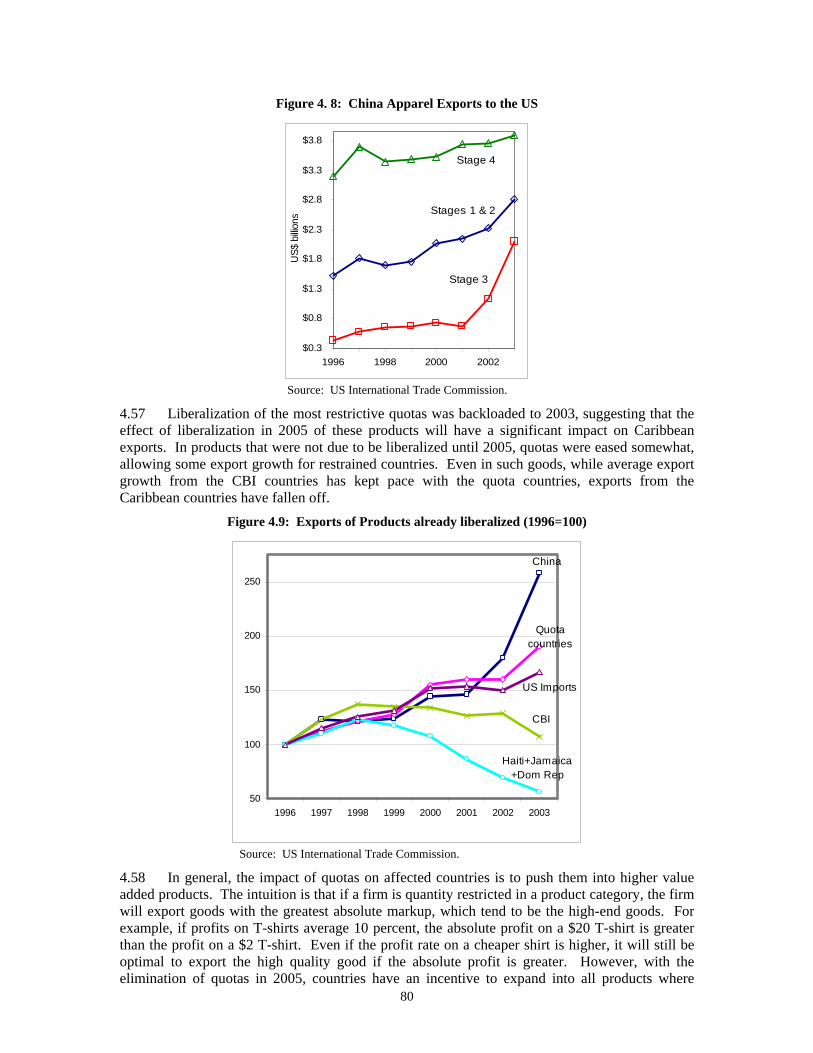
80
Figure 4. 8: China Apparel Exports to the US
$0.3
$0.8
$1.3
$1.8
$2.3
$2.8
$3.3
$3.8
1996 1998 2000 2002
US$
billi
ons
Stage 4
Stages 1 & 2
Stage 3
Source: US International Trade Commission.
4.57 Liberalization of the most restrictive quotas was backloaded to 2003, suggesting that the effect of liberalization in 2005 of these products will have a significant impact on Caribbean exports. In products that were not due to be liberalized until 2005, quotas were eased somewhat, allowing some export growth for restrained countries. Even in such goods, while average export growth from the CBI countries has kept pace with the quota countries, exports from the Caribbean countries have fallen off.
Figure 4.9: Exports of Products already liberalized (1996=100)
50
100
150
200
250
1996 1997 1998 1999 2000 2001 2002 2003
China
Quota countries
US Imports
CBI
Haiti+Jamaica+Dom Rep
Source: US International Trade Commission.
4.58 In general, the impact of quotas on affected countries is to push them into higher value added products. The intuition is that if a firm is quantity restricted in a product category, the firm will export goods with the greatest absolute markup, which tend to be the high-end goods. For example, if profits on T-shirts average 10 percent, the absolute profit on a $20 T-shirt is greater than the profit on a $2 T-shirt. Even if the profit rate on a cheaper shirt is higher, it will still be optimal to export the high quality good if the absolute profit is greater. However, with the elimination of quotas in 2005, countries have an incentive to expand into all products where
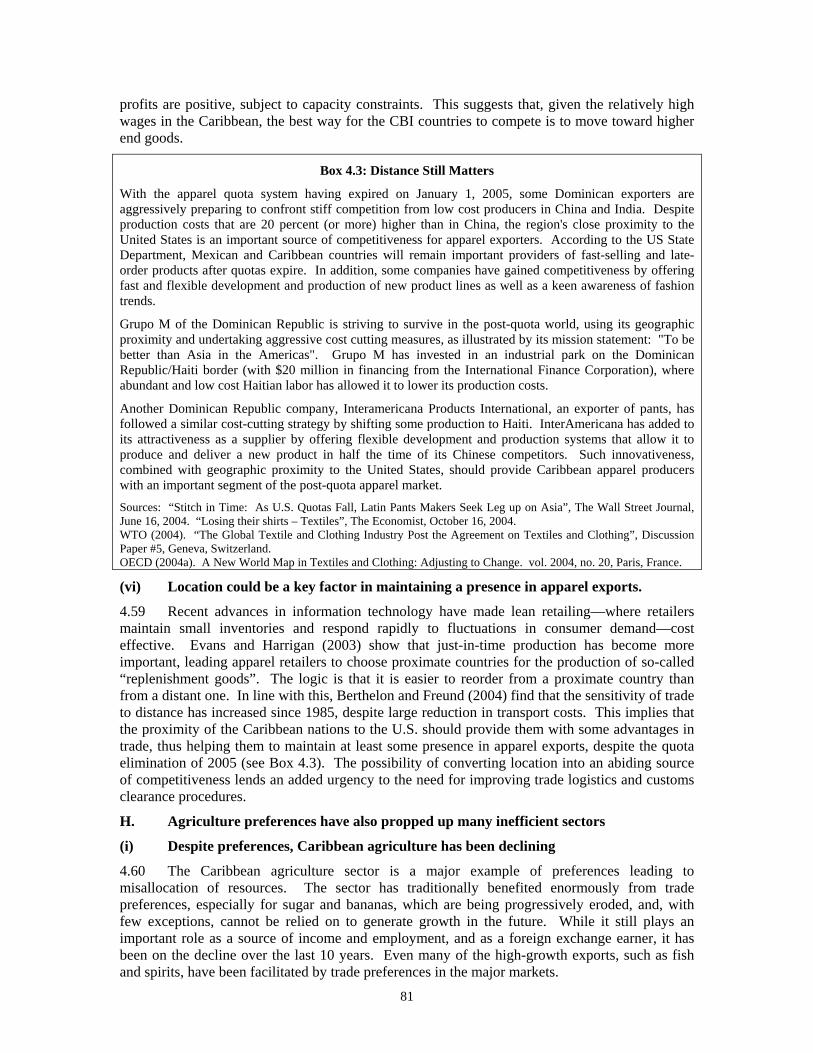
81
profits are positive, subject to capacity constraints. This suggests that, given the relatively high wages in the Caribbean, the best way for the CBI countries to compete is to move toward higher end goods.
Box 4.3: Distance Still Matters
With the apparel quota system having expired on January 1, 2005, some Dominican exporters are aggressively preparing to confront stiff competition from low cost producers in China and India. Despite production costs that are 20 percent (or more) higher than in China, the region's close proximity to the United States is an important source of competitiveness for apparel exporters. According to the US State Department, Mexican and Caribbean countries will remain important providers of fast-selling and late-order products after quotas expire. In addition, some companies have gained competitiveness by offering fast and flexible development and production of new product lines as well as a keen awareness of fashion trends.
Grupo M of the Dominican Republic is striving to survive in the post-quota world, using its geographic proximity and undertaking aggressive cost cutting measures, as illustrated by its mission statement: "To be better than Asia in the Americas". Grupo M has invested in an industrial park on the Dominican Republic/Haiti border (with $20 million in financing from the International Finance Corporation), where abundant and low cost Haitian labor has allowed it to lower its production costs.
Another Dominican Republic company, Interamericana Products International, an exporter of pants, has followed a similar cost-cutting strategy by shifting some production to Haiti. InterAmericana has added to its attractiveness as a supplier by offering flexible development and production systems that allow it to produce and deliver a new product in half the time of its Chinese competitors. Such innovativeness, combined with geographic proximity to the United States, should provide Caribbean apparel producers with an important segment of the post-quota apparel market. Sources: “Stitch in Time: As U.S. Quotas Fall, Latin Pants Makers Seek Leg up on Asia”, The Wall Street Journal, June 16, 2004. “Losing their shirts – Textiles”, The Economist, October 16, 2004. WTO (2004). “The Global Textile and Clothing Industry Post the Agreement on Textiles and Clothing”, Discussion Paper #5, Geneva, Switzerland. OECD (2004a). A New World Map in Textiles and Clothing: Adjusting to Change. vol. 2004, no. 20, Paris, France.
(vi) Location could be a key factor in maintaining a presence in apparel exports.
4.59 Recent advances in information technology have made lean retailing—where retailers maintain small inventories and respond rapidly to fluctuations in consumer demand—cost effective. Evans and Harrigan (2003) show that just-in-time production has become more important, leading apparel retailers to choose proximate countries for the production of so-called “replenishment goods”. The logic is that it is easier to reorder from a proximate country than from a distant one. In line with this, Berthelon and Freund (2004) find that the sensitivity of trade to distance has increased since 1985, despite large reduction in transport costs. This implies that the proximity of the Caribbean nations to the U.S. should provide them with some advantages in trade, thus helping them to maintain at least some presence in apparel exports, despite the quota elimination of 2005 (see Box 4.3). The possibility of converting location into an abiding source of competitiveness lends an added urgency to the need for improving trade logistics and customs clearance procedures.
H. Agriculture preferences have also propped up many inefficient sectors
(i) Despite preferences, Caribbean agriculture has been declining
4.60 The Caribbean agriculture sector is a major example of preferences leading to misallocation of resources. The sector has traditionally benefited enormously from trade preferences, especially for sugar and bananas, which are being progressively eroded, and, with few exceptions, cannot be relied on to generate growth in the future. While it still plays an important role as a source of income and employment, and as a foreign exchange earner, it has been on the decline over the last 10 years. Even many of the high-growth exports, such as fish and spirits, have been facilitated by trade preferences in the major markets.
82
4.61 On average, agriculture makes up about 10 percent of value added in the Caribbean countries, down from 13 percent in 1990 (see Chapter 1). With the exception of Belize, agriculture has become less important in all the economies over the last decade. This largely reflects the decline in traditional products such as bananas and sugar. St. Kitts and Nevis, St. Lucia and St. Vincent and the Grenadines, amongst the smallest in the region, have reduced their dependence on agriculture the most. Still, agriculture remains an important sector of economic activity in a few countries, including Belize, Dominica, and Guyana where it accounts for more than 15 percent of GDP.
4.62 Similarly, agriculture has been an important albeit declining source of employment, accounting on average for about 15 percent of total employment for all the countries over 1991-2001. The average share over 1991-2001 period was above 23 percent in Belize, Dominica, Guyana, Haiti, Jamaica, St. Lucia and St. Vincent and the Grenadines. However, for most of the countries, this share has been declining over the last decade.
4.63 Thanks to preferences, trade has been even more important in Caribbean agriculture than it has been in other sectors such as manufacturing. For example, the ratio of agricultural exports to GDP in 2000 averaged 30.3 percent for the ten countries for which data is available, compared to the corresponding overall merchandise exports to GDP ratio of 23 percent.106 Sugar and bananas, in particular, have received very significant preferences from the EU and the US. Box 4.4 discusses the story of sugar, and indicates the huge costs the Caribbean will now have to bear to phase out from a sector that appears uncompetitive in all countries except perhaps Guyana. Box 4.5 has a similar tale for bananas, where Belize is the most competitive within the region.
4.64 A conscious effort has been made in recent years in most countries to diversify the agricultural export basket, but abiding success has been limited (see next sub-section). Jamaica has had some success in diversification, catering to tourists and export markets, but, like other countries, faces evolving challenges relating to concerns about food safety and plant health risks (Box 4.6). Managing these more stringent SPS standards will complicate diversification efforts for Caribbean countries.
106 The figures are computed using data from WDI and COMTRADE.
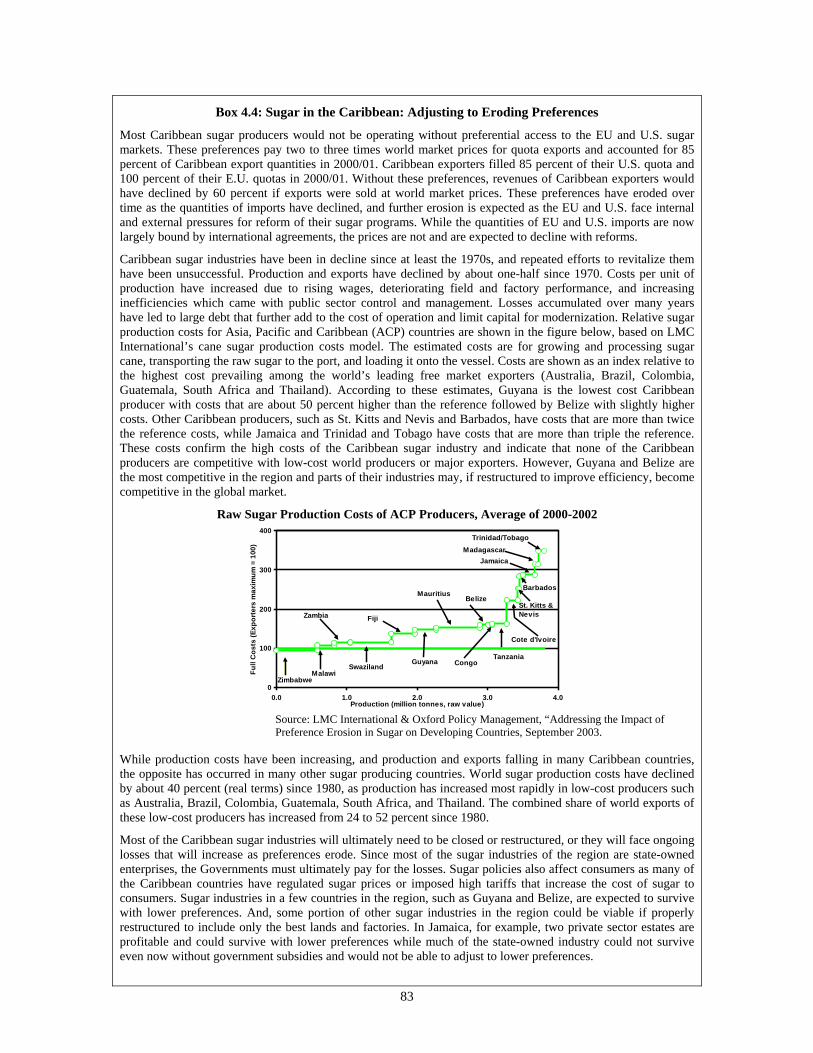
83
Box 4.4: Sugar in the Caribbean: Adjusting to Eroding Preferences
Most Caribbean sugar producers would not be operating without preferential access to the EU and U.S. sugar markets. These preferences pay two to three times world market prices for quota exports and accounted for 85 percent of Caribbean export quantities in 2000/01. Caribbean exporters filled 85 percent of their U.S. quota and 100 percent of their E.U. quotas in 2000/01. Without these preferences, revenues of Caribbean exporters would have declined by 60 percent if exports were sold at world market prices. These preferences have eroded over time as the quantities of imports have declined, and further erosion is expected as the EU and U.S. face internal and external pressures for reform of their sugar programs. While the quantities of EU and U.S. imports are now largely bound by international agreements, the prices are not and are expected to decline with reforms.
Caribbean sugar industries have been in decline since at least the 1970s, and repeated efforts to revitalize them have been unsuccessful. Production and exports have declined by about one-half since 1970. Costs per unit of production have increased due to rising wages, deteriorating field and factory performance, and increasing inefficiencies which came with public sector control and management. Losses accumulated over many years have led to large debt that further add to the cost of operation and limit capital for modernization. Relative sugar production costs for Asia, Pacific and Caribbean (ACP) countries are shown in the figure below, based on LMC International’s cane sugar production costs model. The estimated costs are for growing and processing sugar cane, transporting the raw sugar to the port, and loading it onto the vessel. Costs are shown as an index relative to the highest cost prevailing among the world’s leading free market exporters (Australia, Brazil, Colombia, Guatemala, South Africa and Thailand). According to these estimates, Guyana is the lowest cost Caribbean producer with costs that are about 50 percent higher than the reference followed by Belize with slightly higher costs. Other Caribbean producers, such as St. Kitts and Nevis and Barbados, have costs that are more than twice the reference costs, while Jamaica and Trinidad and Tobago have costs that are more than triple the reference. These costs confirm the high costs of the Caribbean sugar industry and indicate that none of the Caribbean producers are competitive with low-cost world producers or major exporters. However, Guyana and Belize are the most competitive in the region and parts of their industries may, if restructured to improve efficiency, become competitive in the global market.
Raw Sugar Production Costs of ACP Producers, Average of 2000-2002
0
100
200
300
400
0.0 1.0 2.0 3.0 4.0Production (million tonnes, raw value)
Full
Cos
ts (E
xpor
ters
max
imum
= 1
00)
Zambia
MalawiSwaziland
Fiji
CongoGuyana
Belize
Tanzania
Mauritius
Cote d'Ivoire
Madagascar
St. Kitts & Nevis
Jamaica
Barbados
Trinidad/Tobago
Zimbabwe
Source: LMC International & Oxford Policy Management, “Addressing the Impact of Preference Erosion in Sugar on Developing Countries, September 2003.
While production costs have been increasing, and production and exports falling in many Caribbean countries, the opposite has occurred in many other sugar producing countries. World sugar production costs have declined by about 40 percent (real terms) since 1980, as production has increased most rapidly in low-cost producers such as Australia, Brazil, Colombia, Guatemala, South Africa, and Thailand. The combined share of world exports of these low-cost producers has increased from 24 to 52 percent since 1980.
Most of the Caribbean sugar industries will ultimately need to be closed or restructured, or they will face ongoing losses that will increase as preferences erode. Since most of the sugar industries of the region are state-owned enterprises, the Governments must ultimately pay for the losses. Sugar policies also affect consumers as many of the Caribbean countries have regulated sugar prices or imposed high tariffs that increase the cost of sugar to consumers. Sugar industries in a few countries in the region, such as Guyana and Belize, are expected to survive with lower preferences. And, some portion of other sugar industries in the region could be viable if properly restructured to include only the best lands and factories. In Jamaica, for example, two private sector estates are profitable and could survive with lower preferences while much of the state-owned industry could not survive even now without government subsidies and would not be able to adjust to lower preferences.
84
Box 4.4 (continued): Sugar in the Caribbean: Adjusting to Eroding Preferences The Government of Trinidad and Tobago recently began a major restructuring and privatization program of the state-owned sugar company, Caroni Limited, which provides a useful model of reform for other countries in the region. The restructuring program provided for severance payments and retraining for workers, privatization of cane growing, closing of one of the two factories, redevelopment of some sugar cane lands for residential and commercial uses, the sale of non-sugar activities, and the creation of a new sugar company with reduced assets and a more limited scope of activities. Past debts of the sugar company were assumed by the government and will be partially offset by the sale of assets and land of the former company. The cost of the restructuring was estimated at TT$1.5 billion (US$ 240 million), compared with annual losses of TT$0.5 billion (US$ 80 million). Other countries will need to design their own programs to deal with the restructuring of their sugar industries.
Main Policy Options: I. Consider closure or privatization (if buyers can be found) of government sugar industries, or, as a
second best alternative, hiring professional managers. II. Rationalize to lower costs. The costs of production vary greatly between estates and the high-cost
estates should be consolidated or closed to reduce costs. III. Liberalize domestic markets to benefit consumers. Domestic markets should be liberalized so that
consumers do not pay high prices to support inefficient producers. IV. Diversify out of sugar. If countries are to maintain agricultural production, they need to diversify into
other crops. This could center on producing fresh fruits, vegetables, meat and dairy products for the tourist industry.
V. Follow an environmentally sustainable strategy. For some countries, it may be necessary to shift from a production strategy to a preservation strategy by converting the sugar lands into pasture lands for sheep and cattle. This would require much less intensive farming practices and less labor than sugar, but it would still provide both environmental protection for the land and attractive vistas for tourists.
VI. Pay attention to the social dimension of the transition, including conducting periodic social impact analysis, as is being done in Guyana.
Source: Mitchell, D. (2004, background paper for this report).
(ii) Most of the limited export success has depended on preferences
4.65 In the fish-related sector, exports have fluctuated and it is too soon to say if success can be achieved in this area—with the possible exception of shrimps and prawns from Belize. In Belize, the production of farmed shrimp has increased from 1,232 tons in 1997 to 10,118 tons in 2003, a growth of 721 percent. A cluster of competitive firms has emerged, using widely different technologies in a sector that is very risk-prone (because of virus epidemics). These firms have sought to improve technology through, for example, better feed formulation for the shrimp, improved pond linings, and, in one case, investing in the super-intensive system of farming that requires very high capital investments. The potential of this sector is reflected in the significant FDI that it has attracted, beginning in the late 1980s.
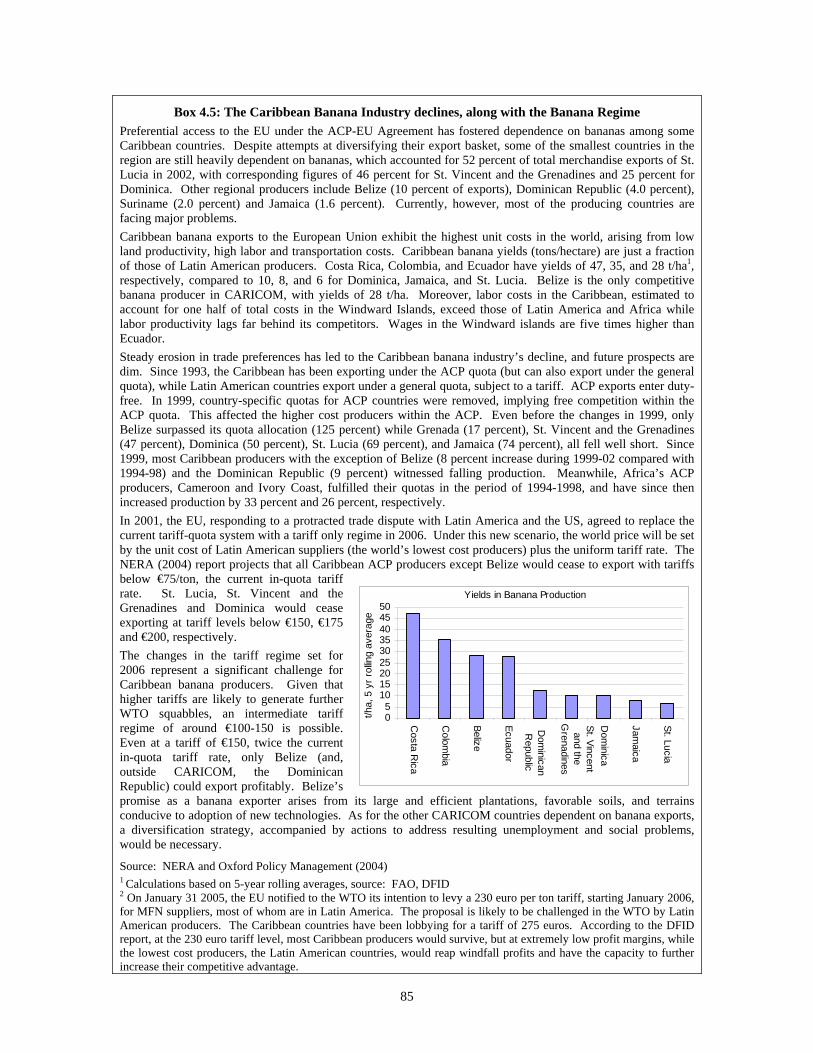
85
Box 4.5: The Caribbean Banana Industry declines, along with the Banana Regime Preferential access to the EU under the ACP-EU Agreement has fostered dependence on bananas among some Caribbean countries. Despite attempts at diversifying their export basket, some of the smallest countries in the region are still heavily dependent on bananas, which accounted for 52 percent of total merchandise exports of St. Lucia in 2002, with corresponding figures of 46 percent for St. Vincent and the Grenadines and 25 percent for Dominica. Other regional producers include Belize (10 percent of exports), Dominican Republic (4.0 percent), Suriname (2.0 percent) and Jamaica (1.6 percent). Currently, however, most of the producing countries are facing major problems. Caribbean banana exports to the European Union exhibit the highest unit costs in the world, arising from low land productivity, high labor and transportation costs. Caribbean banana yields (tons/hectare) are just a fraction of those of Latin American producers. Costa Rica, Colombia, and Ecuador have yields of 47, 35, and 28 t/ha1, respectively, compared to 10, 8, and 6 for Dominica, Jamaica, and St. Lucia. Belize is the only competitive banana producer in CARICOM, with yields of 28 t/ha. Moreover, labor costs in the Caribbean, estimated to account for one half of total costs in the Windward Islands, exceed those of Latin America and Africa while labor productivity lags far behind its competitors. Wages in the Windward islands are five times higher than Ecuador. Steady erosion in trade preferences has led to the Caribbean banana industry’s decline, and future prospects are dim. Since 1993, the Caribbean has been exporting under the ACP quota (but can also export under the general quota), while Latin American countries export under a general quota, subject to a tariff. ACP exports enter duty-free. In 1999, country-specific quotas for ACP countries were removed, implying free competition within the ACP quota. This affected the higher cost producers within the ACP. Even before the changes in 1999, only Belize surpassed its quota allocation (125 percent) while Grenada (17 percent), St. Vincent and the Grenadines (47 percent), Dominica (50 percent), St. Lucia (69 percent), and Jamaica (74 percent), all fell well short. Since 1999, most Caribbean producers with the exception of Belize (8 percent increase during 1999-02 compared with 1994-98) and the Dominican Republic (9 percent) witnessed falling production. Meanwhile, Africa’s ACP producers, Cameroon and Ivory Coast, fulfilled their quotas in the period of 1994-1998, and have since then increased production by 33 percent and 26 percent, respectively. In 2001, the EU, responding to a protracted trade dispute with Latin America and the US, agreed to replace the current tariff-quota system with a tariff only regime in 2006. Under this new scenario, the world price will be set by the unit cost of Latin American suppliers (the world’s lowest cost producers) plus the uniform tariff rate. The NERA (2004) report projects that all Caribbean ACP producers except Belize would cease to export with tariffs below €75/ton, the current in-quota tariff rate. St. Lucia, St. Vincent and the Grenadines and Dominica would cease exporting at tariff levels below €150, €175 and €200, respectively. The changes in the tariff regime set for 2006 represent a significant challenge for Caribbean banana producers. Given that higher tariffs are likely to generate further WTO squabbles, an intermediate tariff regime of around €100-150 is possible. Even at a tariff of €150, twice the current in-quota tariff rate, only Belize (and, outside CARICOM, the Dominican Republic) could export profitably. Belize’s promise as a banana exporter arises from its large and efficient plantations, favorable soils, and terrains conducive to adoption of new technologies. As for the other CARICOM countries dependent on banana exports, a diversification strategy, accompanied by actions to address resulting unemployment and social problems, would be necessary.
Source: NERA and Oxford Policy Management (2004) 1 Calculations based on 5-year rolling averages, source: FAO, DFID 2 On January 31 2005, the EU notified to the WTO its intention to levy a 230 euro per ton tariff, starting January 2006, for MFN suppliers, most of whom are in Latin America. The proposal is likely to be challenged in the WTO by Latin American producers. The Caribbean countries have been lobbying for a tariff of 275 euros. According to the DFID report, at the 230 euro tariff level, most Caribbean producers would survive, but at extremely low profit margins, while the lowest cost producers, the Latin American countries, would reap windfall profits and have the capacity to further increase their competitive advantage.
Yields in Banana Production
05
101520253035404550
Costa R
ica
Colom
bia
Belize
Ecuador
Dom
inica
Jamaica
St. Lucia
t/ha,
5 y
r rol
ling
aver
age
Dom
inican R
epublic
St. Vincent and the
Grenadines
86
4.66 Dominica’s exports of avocados and citrus fruits have been impressive, increasing at an annual rate of 14.6 percent over 1994-2002 period, with their share in total merchandise exports increasing from 2.1 percent in 1994 to 5.3 percent in 2002. Its main markets are the CARICOM region and the EU, in both of which Dominica enjoys preferential access.107
4.67 However, the region does have a success story in Grenada’s nutmegs, although even this is qualified. Grenada (at least until Hurricane Ivan destroyed most of the trees in September 2004) is the world’s second largest producer and exporter of nutmeg after Indonesia.108 Export earnings from nutmeg product have increased at an average annual rate of 37 percent over 1995-2002, but growth has been volatile, partly been due to fluctuations in domestic production and partly due to variations in world demand, and its share in total exports of Grenada have not grown much over 1995-2001.109 It is however noteworthy that trade preferences have not been a big factor in the success of this product, since MFN tariffs in the US and EU have either been zero or very low.110
4.68 Prior to Hurricane Ivan, various suggestions had been made to improve product yield and explore opportunities for adding more value to the product. Grenada’s yield of 4872 hg/ha (hectogram per hectare) over 1990-02 compared well with Indonesia’s 4821 hg/ha (although the growth in yield over the period was minimal, FAO data). However, with only one small nutmeg-processing plant in the country, Grenada did little with its nutmegs other than sell the raw material to European markets. With the sector devastated by the hurricane, the opportunity now presents itself to upgrade yields significantly through planting of better yield trees, organizational changes, etc.
107 In CARICOM, the MFN rate, i.e., the Common External Tariff (weighted) for avocados was 33.78 percent in 2002 and the corresponding rate for grapefruit was 33.12 percent, while CARICOM members enjoy duty free access. In the EU, the weighted tariff for grapefruit in 2002 on Dominica was 5.2 percent as compared to the weighted MFN rate of 9.41 percent. 108 Nutmeg was introduced to Grenada in the 18th century—suggesting that defining a market in niche products is difficult and dependent at least partially on history. The official story is that in the late 18th century, sugar production was the main activity. Natural disasters paved the way for the introduction of other crops. In 1782, Sir Joseph Banks, the botanical adviser to King George III, introduced nutmeg to Grenada. The island's soil was ideal for growing the spice and because Grenada was a closer source of spices for Europe than the Dutch East Indies, the island assumed a new importance for European traders. 109 Despite this apparently impressive performance, nutmeg growth has not been driving export growth, and its share in total exports has not grown much over the years: starting at 24 percent in 1995 it increased to 29 percent in 1999 and then fell to 25 percent in 2001. The figure was exceptionally high at 37.8 percent in 2002 due to a 40 percent decrease in Grenada’s total export earnings. The high volatility is indicated by an increase of 78 percent in export earnings in 1994, decline of 25 percent in 1995, increase of 57 percent in 1997, and a decrease of 21 percent in 2000 and 9 percent in 2002. 110 The main export markets for the product are EU and US. For the 1995-02 period, the MFN tariff in the US has been zero while in the EU, it fell from 5 percent in 1995 to 0 in 2000.
87
Box 4.6: Non-Traditional Food Exports Encounter More Stringent Trade Partner SPS Standards
The decline in Jamaica’s major traditional agricultural exports has been partially offset by enhanced trade in a more diversified set of agro-food products over the past decade. This trade has featured a broad array of fruits, vegetables, and tubers traditional to the Jamaican diet, as well as other Jamaican ‘non-traditional exports’ including fish and fishery products, and a broad range of processed food products. In recent years, these ‘non-traditional’ food exports have reached $80 million annually, a total which now exceeds Jamaica’s sugar exports.
For many of these non-traditional exports, Jamaican suppliers are encountering significant competitiveness and market access challenges, the latter relating to concerns about food safety and/or plant heath risks. Both in North America and Europe, Jamaica’s non-traditional agro-food exports are being subjected to increasingly stringent official food safety and plant health regulations as well as more rigorous private sector sourcing requirements. This has impaired market access due to problems associated with pesticide residues, plant pests, food facility hygiene, and food additives or contamination.
Jamaica’s system of food safety and plant health management has not sufficiently evolved in response to changes in international standards, requirements of major trading partners and the shift in composition of its agricultural and food exports. The problem is not institutional, nor one of capacity, but results from an inadequate commitment of resources to meet the needs of the export sector. Jamaica has mostly addressed SPS challenges in a ‘reactive’ mode, developing plans of action and modified regulations after market access has already been cut off or restricted due to SPS/trade partner problems. In some cases, technical and administrative solutions have been found, albeit with a delay. Much of the existing SPS management capacity in Jamaica remains embedded in the public sector with only some progressive exporters of non-traditional fruits and vegetables beginning to make changes. This in part reflects overall uncertainties about export growth potential and a perception that overseas standards are either unfair or too complex. It also reflects the highly fragmented nature of the pertinent export trade and supply chains, the aging agrarian population, the lack of pressures for change from overseas buyers, and the still predominant domestic market outlets for the featured commodities (where few standards are enforced). These conditions result in inabilities to realize economies of scale and to induce changes in farmer agronomic and record-keeping practices. Many of Jamaica’s non-traditional agro-food exports face a broad range of competitiveness constraints, related to inconsistent raw material production, high post-harvest losses, relatively high cost and limited availability of labor, macroeconomic factors and intensified regional and other competition. Market access problems related to SPS materials have exacerbated and reinforced these constraints, reducing the profitability and raising the risks associated with the conduct of these trades. The resolution of such SPS constraints is necessary although not sufficient for improving the competitiveness of Jamaica’s non-traditional agro-food exports. Recommendations: Two donor-supported quality control and SPS management projects, currently under implementation, need to be extended to achieve adequate inter-governmental SPS management coordination. It is likely that future export development will require private investment in (medium-scale) export-dedicated production for which rising quality, food safety and plant health standards are factored into production, post-harvest and overall management systems. It is not certain that these activities are sufficiently profitable to induce such investment, whether by Jamaicans or others with prior experience and market linkages. Future export development can also involve efforts to expand sales in sauces, seasonings and other value-added processed food products. Rather than a fragmented, company-specific approach to these challenges, there is scope for a more coordinated approach involving joint investment in product R&D, food hygiene training, and market development. Source: World Bank (forthcoming).
4.69 Export of cereals is restricted to St. Vincent and the Grenadines and Guyana. These are mainly rice products. St. Vincent and the Grenadines exports semi-milled or wholly milled rice and husked (brown) rice mainly to other Caribbean countries with a miniscule proportion exported to the US. However, the export value of both these products has been declining. In the case of Guyana, rice exports consist mainly of husked (brown) rice. About half of it is exported to the EU and the remaining to the Caribbean countries. Currently, Guyana enjoys preferential access in both these markets. According to the Ministry of Agriculture, the future of Guyana’s rice industry will rely heavily on advances in research, the development of value-added products, and improvements in its global competitiveness.
88
4.70 Beverage exports of many Caribbean countries have seen impressive growth since the 1990s. However, much of it has been achieved under preferential access to US and EU. For example, St. Lucia’s exports of beer grew at 6.2 percent annually over 1992-2002, but over 98 percent of the exports are destined for other Caribbean countries, where they enjoy protection from non-Caribbean imports. Currently, US beer imports amount to US$ 2.8 billion (in 2002) which represents a huge potential opportunity for St. Lucia. For the Bahamas, rum and tafia grew at an annual average rate of 31 percent over 1997-2001, with almost 90 percent exported to the EU market, where they enjoy preferential access under the ACP-EU Agreement. In the case of Barbados, rum and tafia exports rose at an average annual rate of 5.6 percent over 1997-2002, thanks to preferential access in its key markets of the US and the EU, under the ACP and CBI programs. For Jamaica, the main beverages exported are undenatured ethyl alcohol and rum and tafia, the former growing at 5.8 percent over 1996-2002, and the latter at an annual average of 30.5 percent (while Jamaica’s goods exports were declining during the same period at an annual rate of 3.3 percent). The main export markets for Jamaica’s rum and tafia are EU, Mexico, US and Canada where, on average, over 1996-2002, these accounted for 30, 19, 18 and 11 percent, respectively, of total exports of the product. The main market for exports of undenatured ethyl alcohol is the US, where it enjoys preferential access under the CBI program.
4.71 Sections G and H have shown that preferences have not worked well for the Caribbean. Preferences have reduced incentives for productivity improvement, so that, with erosion of preferences, quota utilization has declined and exports have otherwise suffered. The quotas have also reduced incentives for entrepreneurship, as investors have sought to maximize quota rents.
4.72 Beyond preferences. With erosion of preferences in the future, as well as greater competition in the domestic markets arising from regional and multilateral liberalization, the future clearly lies in looking beyond preferences. At least some firms in the region are seeking to create market niches, trying to differentiate their products and making them less price-sensitive (since wages are relatively high, the Caribbean cannot in general compete on prices). Some of the better known brands in the region include El Dorado (rum) of Guyana, Angostura (rum, sauces) and Chubby (soft drink for kids) of Trinidad and Tobago and Appleton (rum) of Jamaica.
I. The Way Forward: Leveraging Regional Integration and a Pro-Active Vision for Competitiveness
4.73 The trade-related agenda in the Caribbean has so far focused on regional integration within CARICOM and maintaining trade preferences. Regional integration within the Caribbean could be useful if countries are able to take advantage of labor mobility, more open trade, joint investment promotion, the functioning of institutions, regulatory cooperation, etc. However, integration is far from complete, and there is a significant agenda ahead. Moreover, on trade, the benefits of regional integration could be enhanced through the reduction of external tariffs, which would reduce trade diversion.
4.74 On the other issue of preferences, it was shown that the benefits of receiving unilateral preferences are questionable. It would be in the Caribbean’s own interest to negotiate an orderly phase-out strategy for preferences (which are likely to decline anyway), with accompanying technical and financial assistance to help in the transition, including taking care of the displaced labor. Making a smooth transition will be one of the major challenges for the Caribbean—the existence of preferences for a long period has itself led to inertia and resistance to change, as well as reduced capacity for diversification as resources were devoted to seeking rents in products with preferences rather than to potentially competitive segments.
89
(i) CARICOM Regional Integration needs to be accelerated
4.75 The Caribbean is more integrated than before, but a significant agenda remains in implementing the CARICOM agreements.111 While the commitments on CSME are extensive, implementation has lagged. This is due to a lack of political integration, divergence in economic performance, the large number of members, mainly small countries, too many alternative agreements, a fear of loss of sovereignty, and a lack of conviction on the part of the members. In addition, given that implementation of the CSME requires significant changes and additions to existing legislation, it also “…requires extensive institutional development, and policy and administrative reforms at the national level”.112
4.76 Permitted exceptions to free trade need to be progressively eliminated. While there has been progress toward free trade in the region (section D), some work still remains to be done in eliminating the list of exceptions to free trade. Prominent obstacles to free trade in the region include a number of agricultural products excluded from the common tariff reduction scheme, and a system of managed trade (quotas) implemented through quotas on imports of vegetable oils, copra and derivatives. In terms of the overall picture, import licenses, typically in 10 or more product categories, are still required in all the countries with the exception of Dominica and Jamaica.113 Import duties are employed by Dominica (on cigarettes, rum and motor vehicles on imports from the more developed countries, MDCs, within CARICOM), Jamaica (on milk and cream and steel re-bars), St. Lucia and St. Vincent and the Grenadines (on rum imports from MDCs), and Trinidad and Tobago (on selected products). Further progress towards free trade will require eliminating these obstacles.
4.77 There has been some progress in liberalizing trade in labor services. Some progress has been made on trade in labor services to allow free movement for graduates, media workers, musicians, artists and sportspersons, in all member states of CARICOM except Antigua and Barbuda and St. Kitts and Nevis. Jamaica, Trinidad and Tobago and Barbados have ratified early implementation of some aspects of CSME, starting January 1, 2005, including extending free movement of labor to architects and engineers. The full CSME is scheduled to come on stream in 2008, with the eventual goal of complete dismantling of restrictions on labor movement within CARICOM.
4.78 Other areas of integration. Progress on other aspects of integration has, however, been more limited. According to a recent CARICOM progress report on the status of the CSME,114 many CARICOM members have yet to implement agreements on the removal of restrictions in the provision of services. A schedule for the removal of restrictions on the free movement of capital and right of establishment is currently being implemented. In other areas, though, including harmonization of customs, intellectual property rights, and standards, little progress has been made.
4.79 Accelerating regional integration is an imperative. Looking forward, the region’s leaders fully recognize that a regional approach to development would be the most fruitful. Indeed, many have emphasized that CARICOM has no choice but to integrate more fully.115 This report also points to greater integration as being one of the center-pieces of an economic strategy to address the significant economic challenges confronting the region.
111 This section will focus largely on the key trade issues in the regional agenda—extensive analysis on each aspect of the overall integration agenda can be found in the CARICOM web site, www.caricom.org. 112 Carryl (2004), Draft Work Program on CSME, Fifth Draft. 113 Information for Suriname is not available. 114 Source: Establishment of the CARICOM Single Market and Economy: Summary of Status of Key Elements, http://www.caricom.org/, Oct. 30, 2004. 115 For example, Prime Minister Owen Arthur of Barbados stated recently that the Caribbean must integrate or otherwise find itself in jeopardy (address to the Barbados Labor Party Annual Conference, Barbados Advocate, November 1, 2004). Also, the communiqué from the Heads of Government of CARICOM meeting, held in Port-of-Spain on November 8-9, 2004, emphasized the need to accelerate the regional integration movement.
90
(ii) A CARICOM-driven, pro-active agenda for trade is in the Caribbean interest
4.80 A joint trade position and strategy is needed in CARICOM. Currently, the region is involved in several negotiations on trade, including the multilateral negotiations at the WTO; the hemispheric FTAA negotiation; a broad partnership agreement with the European Union; and many bilateral negotiations with the US, Canada, etc. This is a big agenda even for a large country, and means that the only approach likely to succeed for the Caribbean is a well-formulated, common regional approach to dealing with the outside world. This of course implies that CARICOM needs to first sort out its own positions, at least on key issues, which requires progress on regional integration through the CSME agenda.
4.81 Regional approaches—deciding on a regional agenda and pooling resources—work best if the negotiating body is also regional, since even the combined weight of the region in trade negotiations is limited; it also avoids confusion and problems of coordination if only one voice is empowered to represent all countries. The Caribbean does not follow the full logic of this approach. Currently, the Caribbean Regional Negotiating Machinery (RNM) seeks to formulate a joint position and agenda for the region, but is not empowered to negotiate and represent the region. Individual countries make their own representations, which strains their capacity and resources, besides presenting problems of coordinating a joint position. Making RNM the only negotiating body for the region would give it more accountability and give all CARICOM countries more bargaining power. It also makes it easier for the Caribbean to deepen alliances with other countries/regions on shared interests. This is also the approach followed by the EU, where, despite some countries being large and powerful, all member countries are represented by the EU’s Directorate General of Trade Development.
4.82 Building capacity. The region still has a long way to go in terms of having adequate capacity to negotiate and implement agreements, and this is further strained by the individualistic drive of member countries. Pooling of resources and capacity under the RNM would be a start, but capacity building would need to go further with training, donor assistance, etc. The RNM would need to be backed strongly by all the country governments and by the CARICOM secretariat, which could also enable it to push the CSME trade agenda, and so help to better define regional trade positions.
4.83 A Caribbean-driven trade agenda would be a desirable goal. It was seen that trade preferences and high levels of domestic protection have not helped overall export growth, since they led to investments being locked into uncompetitive areas, created no incentives for TFP growth, and diverted scarce government and entrepreneurial resources. Accordingly, this report argues that the Caribbean would find its interests best served by articulating its own agenda on special and differential treatment (SDT). 116 This ‘new’ form of SDT would include a time period for phase-out of preferences of different products and enhanced technical as well as financial assistance from industrial countries (more than is being contemplated or delivered currently), including for social safety nets.117 Since preferences are likely to decline anyway, this stance seeks to convert the de facto situation to the Caribbean’s advantage, and it is possible it may encounter greater support from the international community, implying greater flow of funds and assistance. Of course, the phasing out of preferences and domestic protection would be different for different products and countries. For example, countries fiscally strained by liberalization would need more time to redesign tax systems; longer transition periods for some sensitive goods would help to ease the pains of adjustment; and budgetary support to design and enhance
116 In the WTO, three options are being contemplated to deal with preferences: granting further preferential access to the small and poor countries; relieving them of financially costly and welfare-deteriorating obligations; and even relieving them of obligations that may be in the interests of these countries. According to Mattoo and Subramanian (2004), this is unfortunate because providing small and poor countries with further financial and technical assistance and with further non-preferential access is more likely to be beneficial for them in the long run. 117 Currently, support is being provided by the EU under its Economic Partnership Agreements, and by the FTAA under the Hemispheric Cooperation Program.
91
unemployment benefits/insurance schemes/social safety nets would also help to improve the political acceptability of a phase-out strategy. In addition, because the countries are small, easing rules of origin may make a large difference in what they can produce competitively. Finally, enhanced technical assistance will be vital during the adjustment, especially for the poorer countries in the regions.
4.84 There are some issues with respect to sequencing of agreements as well. The Cotonou agreement requires that all benefits extended to other developed countries be granted to the EU. This means that if the FTAA negotiations precede the second phase of the ACP-EU negotiations, Caribbean countries could be made to extend equivalent preferences to the EU. One suggestion is to request a moratorium on implementation of the FTAA agreement to Canada and the United States, until the EU deal is completed (Davenport et. al 2002). Of course, to the extent that non-preferential liberalization is advanced, sequencing becomes less of an issue.
(iii) International trade liberalization possibilities
4.85 With respect to trade liberalization in the rest of the world, the most important gains are likely to arise from actions, primarily by developed countries, in the following areas:
• Easing of restrictions on temporary movement of labor, such as has occurred between the Caribbean and Canada. Bilateral agreements on temporary migration offer an alternative means to realize the gains from labor mobility without suffering either the costs of brain drain or foreign hostility to permanent migration (see Chapter 6).
• Allowing portability of insurance coverage, so that health treatment outside the home country is reimbursable (Chapter 5).
• Mutual recognition of standards and qualifications, that would, for example, allow students trained in the Caribbean to gain access to jobs in the FTAA area (starting with the US); allow goods and services certified by designated Caribbean organizations to have free access to the FTAA and EU markets (for instance, to the growing market for organic fruits and vegetables). This also helps define a practical agenda for technical assistance, for example to upgrade standards and help in standard-setting. In this context, CARICOM should seek recognition and capacity building for the Caribbean Regional Organization on Standards and Quality (CROSQ) with the US and EU, both for goods as well as services.118
• Not discouraging fragmentation in the delivery of services, for example in the provision of education, where students could get trained in different countries at different stages of the education cycle, including the possibility of studying for one degree in different countries. (This issue is somewhat analogous to the issue of rules of origin for goods).
• Removal of tariff peaks and tariff escalation in industrial countries. While the Caribbean has been somewhat sheltered from these barriers via preferences, many still bite, especially in processed foods.
J. Actions and Implementation
4.86 The Caribbean region needs to take note of changing realities in the international environment, and address issues relating to both the losses as well as gains that are likely to emerge from the process of change. The likely losses include a decline in revenue arising from trade liberalization, and a further decline in output and market share in some sectors in agriculture and manufacturing. Opportunities could exist from greater exploitation of location in trade, which may help survival in industries such as in apparel. Other gains are likely from liberalization in services, but these opportunities could be enhanced if the region negotiates with one voice, and with one position. And, to take advantage of these opportunities, the region will
118 The Inter-American Development Bank has recently launched a technical assistance facility for promotion of national and regional standards, working with CROSQ and national standards bodies.
92
need to improve its investment climate (Chapter 3), increase flexibility of labor markets (Chapter 6), and enhance skills so that the work force is better able to absorb technology (Chapter 7).
4.87 The revenue effects of liberalization, regional or multilateral, are likely to be large in many countries in the region. To combat revenue loss, these countries will need to institute or expand VAT or other alternative tax systems, and may also need to reduce tax incentives. Moreover, the impending revenue loss could provide an impetus for regional cooperation to avoid a fiscally damaging race to the bottom, which would also improve tax collections.
4.88 Given high protection levels, reduction in tariffs on agriculture and manufactures will have the largest impact on revenue and on employment. These would need to be handled by strengthening social protection, on the one hand, and improving the investment climate to encourage investment and redeployment, on the other.
4.89 Within agriculture, with a few exceptions, traditional sectors are unlikely to drive export growth in the future. In the case of sugar, governments would need to close down their sugar industries, and/or establish general enabling conditions that encourage diversification out of sugar—for example, into fresh fruits, vegetables, meat and dairy products for the tourist industry, as has been done in Jamaica and the Dominican Republic to some extent. Given high labor costs, other options would center around higher value-added products, such as fisheries (where Belize has had some success) and organic vegetables.
4.90 In the apparel sector, too, some high-value products may survive the dismantling of the MFA arrangement, especially where timeliness and hence location are important, but it is not likely to be a growth sector for the future—except potentially in Haiti and the Dominican Republic, where costs are low. In this case, countries which improve logistics and customs procedures will have an edge over others. This will also help niche manufacturing that exploits local raw materials or other unique attributes.
4.91 Evidence shows that preferential access and domestic protection for trade do not help overall trade performance, even as they affect trade patterns. In the Caribbean, too, trade preferences have diverted resources and attention to less efficient sectors, which suffered over time, and limited expansion of potentially more competitive sectors. In any case, even if the arguments against preferences are ignored, there can be no doubting that the Caribbean has not been able to use the preferences to its advantage, and has not performed well under the various preferential regimes under which it operates.
4.92 This report suggests that the Caribbean articulate its own vision on trade, including a pro-active vision for preference reduction, a phased decline in the external tariffs to reduce trade diversion, and use of the FTAA as a stepping stone to multilateral liberalization:
a) Unilateral preferences: Given the unclear long-term effects of unilateral preferences, the region could pre-empt the future erosion of preferences by negotiating an orderly dismantling of preferences in return for enhanced technical and financial assistance. This would be the Caribbean’s pro-active trade agenda, and its own version of a “new SDT.”
b) CSME: Integration within CARICOM suffers from possibly large trade diversion, owing to still relatively high external tariffs on many products. To improve benefits from CSME’s trade agenda, the Common External Tariff (CET) could be lowered further, towards the goal of low and uniform duties, and remaining quantitative restrictions could be removed. Other aspects of CSME could impart economies of scale and should be pursued with vigor, especially labor, investment promotion, and training.
c) FTAA or EPA: As above, favorable market access i.e. preferences, is likely to lead to only transient gains (in any case more likely in services, since goods trade already enjoys significant preferences), and there are likely trade diversion costs of granting favorable access, in this case possibly excluding competitive producers from Asia. However, since
93
the CSME already exists, and diverts trade, the FTAA or EPA producers will compete with and substitute some less efficient CSME producers, which would mean net trade creation. To the extent that the CET is reduced (unilaterally or multilaterally), the remaining trade diversion may be reduced further. The latter action would of course mean further erosion of customs revenue, which will require remedial action.
d) WTO: The logic of the above means that in the longer-term, the most abiding gains for the Caribbean are likely to come from reduction of its external tariffs. Under multilateral liberalization, i.e., under the WTO, this could also mean some enhanced market access for all countries. It is important, of course, to recognize that the Caribbean’s small size reduces the scope for reciprocity-based negotiations. In these conditions, domestic reforms should not be allowed to depend on successful international negotiations. In any case, the unilateral reduction of tariffs would help to reduce the costs of trade diversion that may result from the conclusion of regional preferential arrangements.
4.93 In terms of improved access in FTAA as well as the WTO, the Caribbean should seek to focus on services in negotiations, especially in improved temporary movement of labor, as well as better access in other areas such as offshore education, health services and professional services.
4.94 Trade negotiations are likely to be more successful, if, like the EU, the region speaks with one voice and with one unified position. The RNM should be empowered to negotiate on behalf of CARICOM at all regional and multilateral forums, which will improve CARICOM’s bargaining power.
4.95 Accelerating the implementation of the CARICOM regional integration agenda, meaning the process embraced by the CSME, especially those aspects related to trade, labor, FDI, capital mobility, and regional standards, is a key priority which would make the Caribbean a more attractive investment destination for both domestic as well as foreign capital and thus enable it to take advantage of the opportunities offered by regional and multilateral trade liberalization.
94
Chapter 5 Emerging Opportunities for the Caribbean
A. Introduction
5.1 Services have been the most important driver of growth in the Caribbean, with an average growth rate of almost 5 percent per year from 1961-2000. As a result, their share in GDP increased from 50 percent in the 1960s to 62 percent in the 1990s (Chapter 1). Now, with the reduction in growth of the traditional tourism sector, and the erosion in trade preferences, new growth sectors are needed.
5.2 Given relatively high wages, most countries in the Caribbean are not competitive in labor-intensive manufacturing or in agriculture, and will find it hard to compete in a more open market regime. However, there are several sectors, especially in services, where small economies can be competitive, and the examples of Ireland, Singapore and Cyprus present dramatic illustrations of the possibilities. While some diversification has already taken place, including in niche manufacturing and various service sectors, this process needs to be accelerated to reverse the growth decline of the 1990s in a sustainable way. In creating successful service and niche manufacturing exports, the Caribbean can leverage its geographical location, its largely English speaking population, its alluring natural beauty, and rich culture. There are numerous examples of service exporters that have successfully exploited these advantages, including Sandals resorts, health and wellness centers, and the burgeoning off-shore education industry.
5.3 This report explores illustrative case studies of ICT (Information and Communication Technology) services and ICT-enabled products and services (Section B), higher-end tourism (Section C), offshore education (Section D), and health services (Section E). While these sectors present opportunities, they are meant to be illustrative of the issues and constraints facing all firms in the sub-region, especially those in services. As the case studies demonstrate, success in moving to higher-end services requires high skill levels, and underscores the emphasis in the report on improving the quality and cost effectiveness of human resources. It also requires reducing costs of connectivity and increasing collaboration among industry actors. In addition, governments need to play a critical role in coordinating private and public sector efforts and establishing the standards and certifications that raise the quality of service.
5.4 Given the potential of the services sector, Caribbean governments could consider investors’ priorities as a way to prioritize their own policy actions to improve the investment climate. It is worth pointing out that this is different from picking winners, since it only creates an enabling environment that may allow investment in certain services sectors in the Caribbean. For example, telecommunications is usually a top priority if a country sees potential in ICT-enabled services and in medical services (see Annex Table 3.1), and would point to the need to bring telecom facilities up to the requisite cost and quality standards. This would, of course, help all business, since telecom is a key aspect of infrastructure.
B. ICT Services and ICT-enabled Products and Services119
(i) Low-end ICT Clusters have been unsuccessful in the Caribbean
5.5 The perception of ICT (telephones, mobile devices, the Internet) as a high-growth sector has led many countries to attempt to replicate successful international experiences. These include those in Bangalore and Singapore, where high technology firms came together in clusters and had a positive developmental effect on the economy. This approach has been attempted frequently in the Caribbean, with almost universally poor results, due partly to the choice of low wage-dependent clusters such as call centers, as well as the failure to link foreign investment to local skills.
119 This section is based largely on a background paper prepared for infoDev (infoDev, 2005).
95
5.6 Outsourced business processes began in the Caribbean in the 1980s, with multinationals seeking low-cost markets near shore. While some businesses, such as Caribbean Data Services from American Airlines, were initially successful, they eventually relocated to lower cost centers such as India and the Philippines. As services demanded became more complex, the Caribbean’s ability to compete faltered due to poor technological and communication infrastructure and lagging skill levels. Instead, almost every Caribbean country experimented with subsidized telemarketing call centers (see Box 5.1), which in the end competed on low labor costs and low cost connectivity, neither of which the Caribbean could supply.
Box 5.1: Demystifying the Call Center Trend
Call Centers Antigua Limited (CCAL) was a joint venture between the Government of Antigua and Barbuda and Caribbean Information Technologies (CIT). The government invested US$1.1million for a 40 percent stake in the call center, with the goal of creating an IT-skilled workforce of 850. Offering wages of US$110-150 per week compared to manufacturing jobs that paid close to US$200, and high tech jobs in Internet gaming of US$750/week, the center essentially became the temporary holding place for those in-between jobs looking for better opportunities. CCAL, which had promised to create more than 800 jobs, only employed close to 200 people, and eventually closed. Jamaica had a similar experience. A fund was created from the proceeds of telecom spectrum sales, to encourage the development of international call centers. The funds were lent at highly concessionary rates, and invested with varying results. Most investors became frustrated with the skill shortages of the local labor force and inadequacy of local business rules and regulations.
5.7 Free Trade Zones (FTZ) and cyber parks have also been established throughout the Caribbean in the hope of attracting foreign investment, providing employment and technological spillovers, but have not been able to replicate successes in other countries. The Dominican Republic’s cyber park experiment cost US$30 million and failed to live up to expectations due to a lack of political will and inadequate management. Similar cyber parks have also been conceived throughout the Caribbean and have met with the same end. This is because the decisions to establish cyber parks have been ad-hoc, rather than based on planning and a strategic vision of the role of these facilities in overall development. Cyber parks in other parts of the world, such as in Indonesia, Malaysia and the Philippines, have seen their success underpinned by two key factors: (i) integrating technologically modern facilities with technical universities, research centers, business incubators and other support services; and (ii) a long-term commitment by the government to provide the expensive infrastructure, sustained intellectual capital through learning institutions, and skilled management to integrate the many components.
5.8 The software industry is another ICT cluster that has yet to take off in the Caribbean, notwithstanding the opportunities that exist in programming in Open Source Software (OSS)120 for local companies, which could expand to industry-specific software. Companies like BP in Trinidad, for example, outsourced US$500 million in geological services and software from Houston because Trinidad and Tobago lacked the technological capabilities. Digisolv, an OSS company, has partnered with the government in St. Lucia and The Open Group121 to organize awareness seminars for the private sector on the benefits of OSS.
(ii) However, ICT’s strong forward linkages can enable competitive clusters across different products and services
5.9 Effective use of ICT can enable productive firms and clusters (ICT-enabled products and services). Despite the mixed results of ICT clusters per se, the role of ICT goes well beyond the ICT sector itself. In today’s modernized world, ICT plays a key role in
120 Open Source Software is software for which the underlying programming code is available to the users so that they may read it, make changes to it, and build new versions of the software incorporating their changes. 121 The Open Group is an international OSS vendor and technology-neutral consortium. www.opengroup.org.
96
economic development, providing invaluable tools and inputs for firms, and enabling the average citizen to participate more actively in the economy. The effective use of ICT, as discussed below, can improve productivity and innovation by allowing for more cost-effective and fluid communication with customers; improve logistics; overcome distance; and help firms understand their competitive positioning. Governments are also using ICT to enhance transparency and public sector efficiency.
5.10 Communicating with customers and implementing a forward integration strategy. Properly executed business strategy begins with the customers’ needs. Successful firms are those that are able to identify unmet demand and swiftly develop methods to effectively service those customers. Firms compete by embedding unique insights into the products they produce and the channels through which they sell those products. Those insights can be captured through interactions with, and feedback from, customers. ICT provides a quick and cost effective way to ensure that communication is both active and ongoing. This ability is key in sectors such as tourism, which is critical to every Caribbean country.
5.11 Unique Jamaica, a cluster of 100 small hoteliers and attractions in Jamaica, has successfully exploited ICT through a collaborate initiative of joint marketing and upgrading efforts. Working collectively, this cluster of businesses devised a vision to attract adventure and nature tourists, and created several customized tour packages around the themes of nature, culture, and culinary arts. ICT allowed them to launch a cost-effective marketing campaign, to communicate amongst the members, and develop an interactive web-based booking engine. Another example, Bermuda Escapes, founded by Axiom Computer, has demonstrated how a simple technical solution of cataloging and coordinating tourism experiences through a single back-end database can make an important difference in the tourists’ experiences. Concierges are able to arrange complete itineraries for their guests, and the service provider has first-hand, reliable data on what visitors value. Some small hoteliers that have upgraded their IT systems, such as CocoLaPalm in Jamaica, have seen a 30 percent increase in return visitors, using technology to reorganize key business processes, such as inventory, cash control and room allocation and thus providing more seamless services. A scaled-up marketing and promotional effort to allow booking and vacation planning through the internet and more responsive customer contact has also enhanced their visibility and bottom line.
5.12 The benefits of ICT in communication are also important in manufacturing. Chef Pepper, a start-up in the Dominican Republic that supplies hotels, restaurants and households with imported high quality meat products, has seen its sales increase by 20 percent per month since it started an e-mail marketing campaign. Its success is directly correlated to the significant internet penetration rates in the high income segments of the Dominican Republic population. Country Traders, a Blue Mountain coffee distributor in Jamaica, has also bean able to successfully use the internet as a sales channel. Previously selling bulk green beans to overseas buyers who then roasted and branded the beans, it captured very little value. By selling branded finished product through a simple online ordering service and using a local courier, the company has found new markets, reduced the number of intermediaries and increased sales. Similar small-scale ventures are emerging throughout the region in hot sauces, crafts, etc., which are utilizing ICT to expand markets, customize products and more effectively communicate with customers.
5.13 Improving logistics and efficiency. When used both inside the organization and along the value chain, ICT can improve efficiency dramatically by, for example, reducing delivery times and coordinating stock levels through improved coordination of supply and demand, which in turn, enhance customer service. Given the large intra-Caribbean business and dispersed nature of the Caribbean islands, the efficient use of ICT can be a key competitive strategy for regional companies. Companies like insurer Sagicor can now reply to claims from all over the Caribbean in 2 days instead of 2 weeks, the average turnaround time prior to their offices being digitally connected. Even in agriculture, where many of the producers are small and fragmented, there is an important benefit to eliminating information asymmetries: a recent pilot project sending voice
97
messaging to convey market prices to farmers in Jamaica has been very popular, given the very high penetration of mobiles in the island. Gale Force Windows, a manufacturer of hurricane- resistant windows in Antigua, is able to provide immediate price quotes by analyzing the AutoCAD drawings sent by architects and developers throughout the Caribbean.
5.14 Making distance irrelevant. ICT can create significant value by bridging the distance between the islands, allowing the free and instant transport of digitized knowledge and products. Some Caribbean companies are using ICT to expand their market base and overcome geographic distances (see Boxes 5.2 and 5.3).
Box 5.2: Telemedicine in Action
To support the Wellness Center Industry, Telemedicine offers an attractive solution to address the lack of medical specialists in the Caribbean, and as a source of second opinions and specialized diagnosis. Telemedicine is medicine offered at a distance. This entails the use of audio, video or computer technology to investigate, monitor and manage patients who are geographically separated from a medical specialist. Companies like the Caribbean Medical Imaging Center (CMIC), a privately owned radiology center in St. Vincent and the Grenadines, are already using this technology effectively. Using digital cameras and a DSL connection, CMIC can send X-rays, CT scans and ultrasound imaging to specialists around the world to provide a more reliable diagnosis. Although the costs of wireless internet access and buying and maintaining equipment have kept CMIC from being a profitable company, the increasing availability and affordability of technology infrastructure and the expansion of wellness centers in the Caribbean creates the right conditions to leverage telemedicine in a more cost-effective manner.
Box 5.3: ICT Opening Markets for SMEs
Small and medium size companies, like Erica’s Country-Style in St. Vincent and the Grenadines, have been able to benefit from the internet to introduce their products to new markets. With annual sales of US$ 200,000, Erica’s Country-Style offers pepper sauces and food snacks to the Caribbean and US markets. After the launch of its website, Erica’s began to receive orders from the US market, which now account for 10 percent of revenues. This growth has prompted the use of a US distributor to save on shipping charges.
5.15 Understanding and improving competitive positioning. Globalization has reduced significantly the physical barriers between markets and competitors. Previously, large firms with significant financial resources were not only able to make the most informed decisions, but also maintain certain levels of control over suppliers and buyers within their industries. ICT, however, has leveled the playing field to a large extent, allowing firms of all sizes improved access to market intelligence, and reducing entry barriers. Members of the music industry in Jamaica used access to such information and online surveys to reposition themselves, finding customers around the world interested in recording music in Jamaica. A new organization, “Jamaica Signature Beats” (see Annex 5.1) is working to remove previous barriers for the development of these services (such as fragmentation, low trust and lack of professionalism in the industry) by performing joint marketing activities and creating certification and training for professional studios. Similarly, in manufacturing, SM Jaleel - a soft drink company in Trinidad and Tobago, was one of the early innovators that realized it was competing in a global market. Through in-depth research of the global market, it identified the untapped segment of 4-10 year olds, and has built a global brand, “Chubby”, now sold by major US retailers (see Box 7.8 for the detailed case study).
5.16 Governments are also using ICT to enhance transparency and efficiency. ICT can help governments improve the efficiency and transparency of their services. From broadly available information, downloadable forms to transactional capabilities, government services can become increasingly efficient, which in fact is extremely important given the large size of governments in the Caribbean (see Chapter 2). The Antiguan Office of Technology has managed to create a local loop to connect all government buildings, and has already provided every
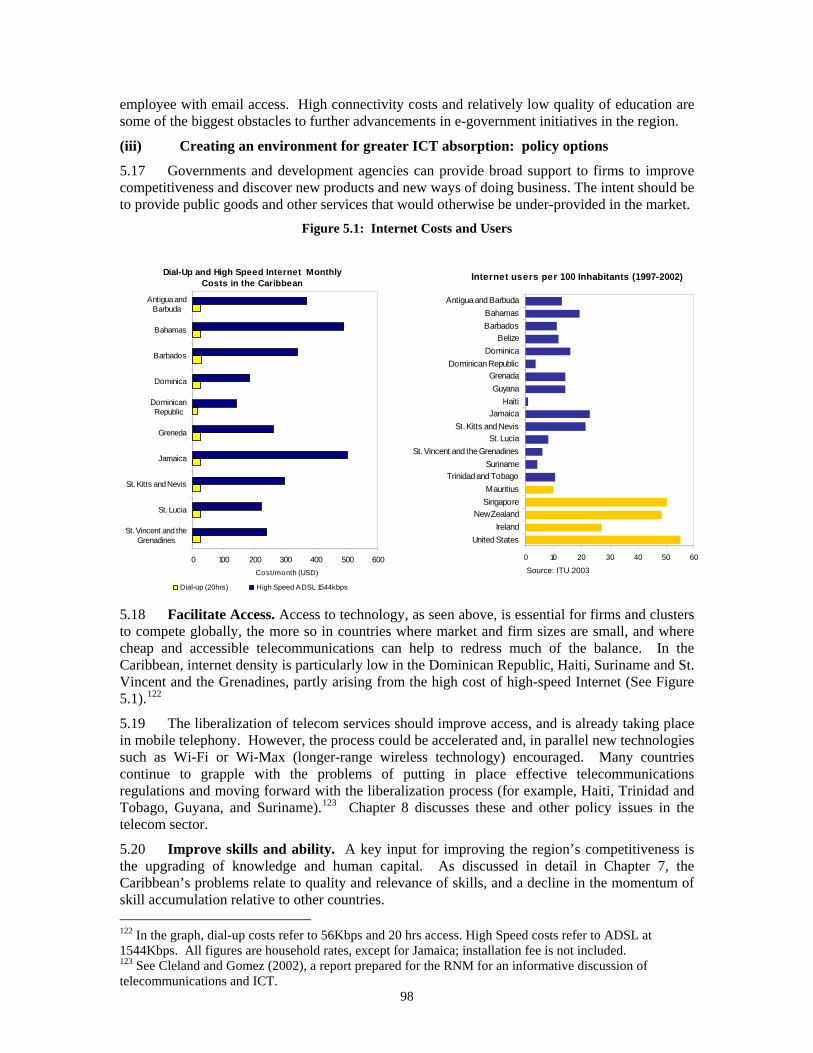
98
employee with email access. High connectivity costs and relatively low quality of education are some of the biggest obstacles to further advancements in e-government initiatives in the region.
(iii) Creating an environment for greater ICT absorption: policy options
5.17 Governments and development agencies can provide broad support to firms to improve competitiveness and discover new products and new ways of doing business. The intent should be to provide public goods and other services that would otherwise be under-provided in the market.
Figure 5.1: Internet Costs and Users
Dial-Up and High Speed Internet Monthly
Costs in the Caribbean
0 100 200 300 400 500 600
St. Vincent and theGrenadines
St. Lucia
St. Kitts and Nevis
Jamaica
Greneda
DominicanRepublic
Dominica
Barbados
Bahamas
Antigua andBarbuda
Cost/month (USD)
Dial-up (20hrs) High Speed ADSL 1544kbps 5.18 Facilitate Access. Access to technology, as seen above, is essential for firms and clusters to compete globally, the more so in countries where market and firm sizes are small, and where cheap and accessible telecommunications can help to redress much of the balance. In the Caribbean, internet density is particularly low in the Dominican Republic, Haiti, Suriname and St. Vincent and the Grenadines, partly arising from the high cost of high-speed Internet (See Figure 5.1).122
5.19 The liberalization of telecom services should improve access, and is already taking place in mobile telephony. However, the process could be accelerated and, in parallel new technologies such as Wi-Fi or Wi-Max (longer-range wireless technology) encouraged. Many countries continue to grapple with the problems of putting in place effective telecommunications regulations and moving forward with the liberalization process (for example, Haiti, Trinidad and Tobago, Guyana, and Suriname).123 Chapter 8 discusses these and other policy issues in the telecom sector.
5.20 Improve skills and ability. A key input for improving the region’s competitiveness is the upgrading of knowledge and human capital. As discussed in detail in Chapter 7, the Caribbean’s problems relate to quality and relevance of skills, and a decline in the momentum of skill accumulation relative to other countries. 122 In the graph, dial-up costs refer to 56Kbps and 20 hrs access. High Speed costs refer to ADSL at 1544Kbps. All figures are household rates, except for Jamaica; installation fee is not included. 123 See Cleland and Gomez (2002), a report prepared for the RNM for an informative discussion of telecommunications and ICT.
Source: ITU 2003
Internet users per 100 Inhabitants (1997-2002)
0 10 20 30 40 50 60
United StatesIreland
New ZealandSingaporeMauritius
Trinidad and TobagoSuriname
St. Vincent and the GrenadinesSt. Lucia
St. Kitts and NevisJamaica
HaitiGuyana
GrenadaDominican Republic
DominicaBelize
BarbadosBahamas
Antigua and Barbuda
99
5.21 Channel support through existing and incipient clusters. Formal and informal interaction among firms is a critical element in diffusion of learning and technology, and this interaction is greatly enhanced through sectoral clusters. While it is not clear as to how successful clusters can be developed, evidence does indicate that government support for technological development of firms is best provided through existing and incipient sectoral clusters. Governments and development agencies should restrict their interventions to those that have strong public goods characteristics, and not normally provided by the private sector, either because of the small size and fragmentation of an industry, or the limited private returns to investing in knowledge. Examples of such interventions would include funding feasibility studies and helping provide information on best practices applicable to promising clusters, and providing some incentives for training and research.
5.22 On a more motivational level, governments should help to galvanize entrepreneurship, a commodity in limited supply in the Caribbean, partly owing to the long history of protection and trade preferences. This can be done by publicizing, rewarding and disseminating successful entrepreneurial activity to demonstrate the possibilities. Strong entrepreneurship would be key to moving away from a rent-seeking approach to one that focuses on competition as the driver of innovation and growth.
5.23 Accelerate regional harmonization in key policy areas related to ICT. The legal enforcement of electronic documents, protection of intellectual property and privacy, further liberalization of the telecommunications market, development of a framework to support electronic transactions, and enforcement of electronic documents and contracts are amongst the priorities in this realm. Laws on intellectual property as they relate to the internet—in code, data, music or other content have important implications for businesses selling into a multi-jurisdictional world. Keeping abreast of these changes and providing up-to-date, enforceable legislation will affect the region’s ability to transact with and attract foreign businesses. Mauritius, for example, has been a leader in this field in Africa and has convinced Microsoft, Hewlett Packard, and IBM to set their regional headquarters in the island.
5.24 A regional approach to these reforms will be useful, but has not yet taken off. A regional approach would, firstly, constitute an immediate step towards regional harmonization of practices and legislation, which will help international compatibility in e-practices and attempts at replicating best-practices. Secondly, it allows individual governments to move more swiftly in the reform process, as each country focuses on facilitation and execution rather than on drafting country-specific legislation. Thirdly, a regional approach would help maximize the use of scarce expertise in a fast-evolving area. So far, however, issues such as intellectual property and e-enabling legislation (e-commerce regulation, electronic signatures, internet banking and transactions and internet crime) have not been tackled regionally.
5.25 As the CSME process advances, it is important that regulators be trained in technical aspects and participate in international ICT/telecommunications workshops to remain informed of the latest trends in international standards, and appropriately customize them to the region’s challenges. This is an area where development agencies can help, connecting networks on the topics and encouraging the transfer of knowledge in these fast moving areas.
100
Box 5.4: Promoting Knowledge Exchange
Norway has been at the fore front of e-legislation. For instance, the Norwegian government has put in place an initiative to use digital signatures in electronic interaction with and within public administration. Furthermore, Norway is sharing its initial success with developing countries as it relates to e-legislation. The Norwegian Agency for Development (NORAD) in partnership with UNDP has worked in countries like Bosnia to support the development of e-legislation. For example, people from the public and private sector in Bosnia have participated in study trip exchanges to Norway to review best practices in the area of e-legislation and other ICT-related fields.124 Such knowledge exchanges can be easily replicated in the Caribbean and hold important potential.
C. Tourism in the Caribbean125
5.26 With numerous competitive advantages including its natural beauty, largely English speaking population, and proximity to North America, the CARICOM tourism sector’s performance has, in recent years, not lived up to expectations. While firms have made profits, tourism has failed to create strong linkages with national economies, and few Caribbean-owned tourism businesses have flourished. The region’s traditional tourism product, beach resorts, has matured and faces challenges from competitors in other regions such as Asia, and the rapidly changing nature of global tourism demand. However, the strong growth projected in global tourism and the emergence of new market segments have created the possibility for reinvigorating tourism. In order to realize this potential, the region will need to update its strategy for managing and marketing the sector, focus public interventions and expenditures more closely on addressing skills shortages, coordinating with the private sector, and managing regional cooperation more effectively. Tourism can still help drive growth, but perhaps to a lesser extent than in the past, and only if the tourism product evolves to meet the ongoing challenges. This section reviews the status of the tourism industry, the sources of possible growth, and discusses some critical constraints to further growth.
(i) Tourism is a critical sector for the Caribbean, but growth has slowed since the 1990s
5.27 World recognition of its sun, sea and sand product and relaxed lifestyle has positioned the Caribbean as one of the world's great destinations for many decades. The World Travel and Tourism Council (WTTC) reports that the Caribbean is the most tourism intensive region in the world. The region hosted over 30 million stay-over and cruise visitors in 2003, and the direct and indirect impacts of tourism account for 18 percent of total GDP and generate 34 percent of total employment.126 The economic impact varies significantly across the region, accounting for 74.4 percent of GDP and 89.4 percent of employment in Antigua and Barbuda, but only 4.9 percent of GDP and 3.9 percent of employment for Haiti.
5.28 Tourist arrivals in the Caribbean have grown an average by 2.9 percent in the period 1990-2002, much slower than overall world tourism growth of 3.7 percent. Preliminary data on arrivals for 2003 and 2004 show the Caribbean region has recovered from the post-September 11 slowdown, with arrivals growing at 7.5 percent in 2003 after two consecutive years of declines, and 8 percent over the first eight months of 2004.
124 UNDP http://unpan1.un.org/intradoc/groups/public/documents/UNTC/UNPAN018493.pdf 125 This section draws considerably from a background paper prepared by DMRussell Consulting Inc. (2004), “A Competitiveness Agenda for the Caribbean Tourism Sector”. August 2004. 126 WTTC (2003) and World Bank, simple averages, data for entire Caribbean region. WTTC’s data on travel and tourism economy and employment measure the direct and indirect impacts of tourism on the economy.
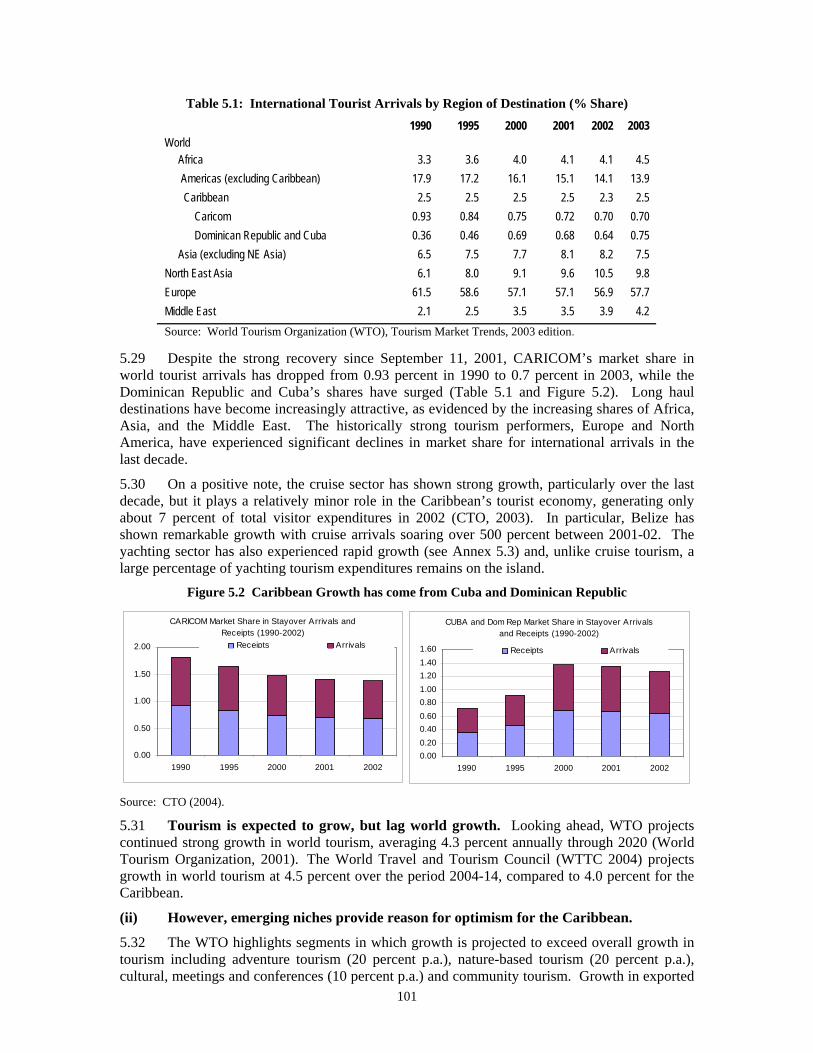
101
Table 5.1: International Tourist Arrivals by Region of Destination (% Share)
1990 1995 2000 2001 2002 2003 World Africa 3.3 3.6 4.0 4.1 4.1 4.5 Americas (excluding Caribbean) 17.9 17.2 16.1 15.1 14.1 13.9 Caribbean 2.5 2.5 2.5 2.5 2.3 2.5 Caricom 0.93 0.84 0.75 0.72 0.70 0.70 Dominican Republic and Cuba 0.36 0.46 0.69 0.68 0.64 0.75 Asia (excluding NE Asia) 6.5 7.5 7.7 8.1 8.2 7.5 North East Asia 6.1 8.0 9.1 9.6 10.5 9.8 Europe 61.5 58.6 57.1 57.1 56.9 57.7 Middle East 2.1 2.5 3.5 3.5 3.9 4.2 Source: World Tourism Organization (WTO), Tourism Market Trends, 2003 edition.
5.29 Despite the strong recovery since September 11, 2001, CARICOM’s market share in world tourist arrivals has dropped from 0.93 percent in 1990 to 0.7 percent in 2003, while the Dominican Republic and Cuba’s shares have surged (Table 5.1 and Figure 5.2). Long haul destinations have become increasingly attractive, as evidenced by the increasing shares of Africa, Asia, and the Middle East. The historically strong tourism performers, Europe and North America, have experienced significant declines in market share for international arrivals in the last decade.
5.30 On a positive note, the cruise sector has shown strong growth, particularly over the last decade, but it plays a relatively minor role in the Caribbean’s tourist economy, generating only about 7 percent of total visitor expenditures in 2002 (CTO, 2003). In particular, Belize has shown remarkable growth with cruise arrivals soaring over 500 percent between 2001-02. The yachting sector has also experienced rapid growth (see Annex 5.3) and, unlike cruise tourism, a large percentage of yachting tourism expenditures remains on the island.
Figure 5.2 Caribbean Growth has come from Cuba and Dominican Republic
CARICOM Market Share in Stayover Arrivals and Receipts (1990-2002)
0.00
0.50
1.00
1.50
2.00
1990 1995 2000 2001 2002
Receipts Arrivals
CUBA and Dom Rep Market Share in Stayover Arrivals and Receipts (1990-2002)
0.000.200.400.600.801.001.201.401.60
1990 1995 2000 2001 2002
Receipts Arrivals
Source: CTO (2004).
5.31 Tourism is expected to grow, but lag world growth. Looking ahead, WTO projects continued strong growth in world tourism, averaging 4.3 percent annually through 2020 (World Tourism Organization, 2001). The World Travel and Tourism Council (WTTC 2004) projects growth in world tourism at 4.5 percent over the period 2004-14, compared to 4.0 percent for the Caribbean.
(ii) However, emerging niches provide reason for optimism for the Caribbean.
5.32 The WTO highlights segments in which growth is projected to exceed overall growth in tourism including adventure tourism (20 percent p.a.), nature-based tourism (20 percent p.a.), cultural, meetings and conferences (10 percent p.a.) and community tourism. Growth in exported
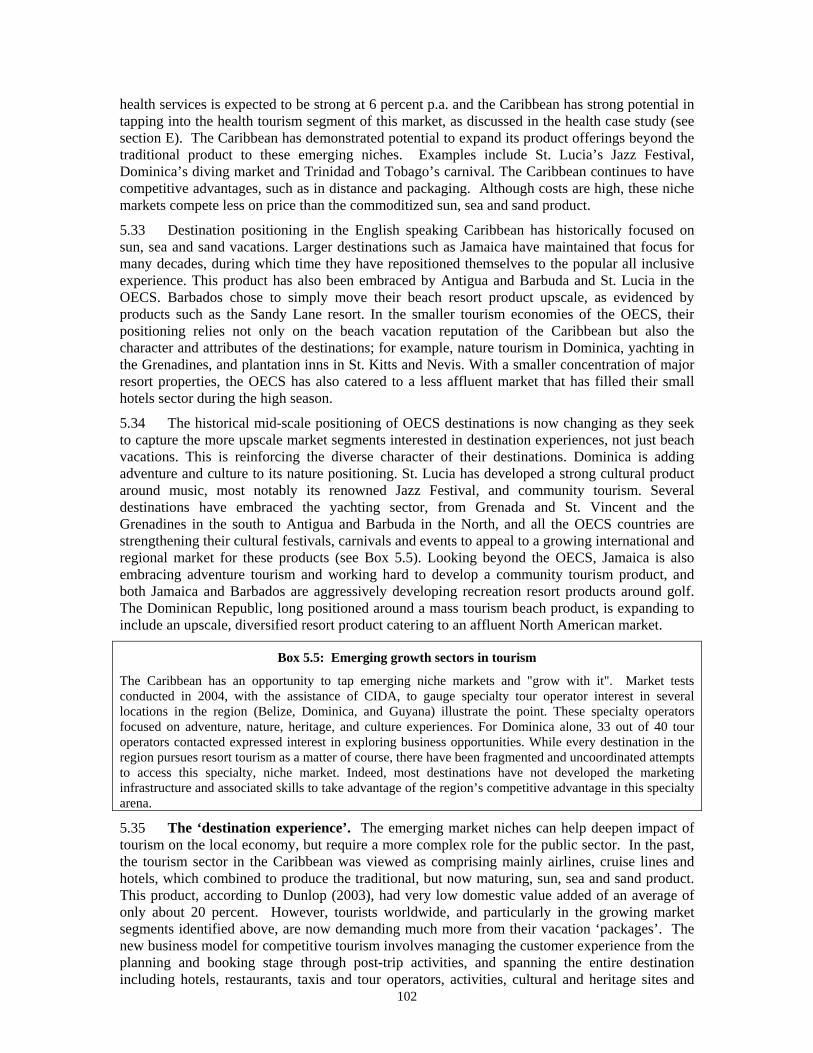
102
health services is expected to be strong at 6 percent p.a. and the Caribbean has strong potential in tapping into the health tourism segment of this market, as discussed in the health case study (see section E). The Caribbean has demonstrated potential to expand its product offerings beyond the traditional product to these emerging niches. Examples include St. Lucia’s Jazz Festival, Dominica’s diving market and Trinidad and Tobago’s carnival. The Caribbean continues to have competitive advantages, such as in distance and packaging. Although costs are high, these niche markets compete less on price than the commoditized sun, sea and sand product.
5.33 Destination positioning in the English speaking Caribbean has historically focused on sun, sea and sand vacations. Larger destinations such as Jamaica have maintained that focus for many decades, during which time they have repositioned themselves to the popular all inclusive experience. This product has also been embraced by Antigua and Barbuda and St. Lucia in the OECS. Barbados chose to simply move their beach resort product upscale, as evidenced by products such as the Sandy Lane resort. In the smaller tourism economies of the OECS, their positioning relies not only on the beach vacation reputation of the Caribbean but also the character and attributes of the destinations; for example, nature tourism in Dominica, yachting in the Grenadines, and plantation inns in St. Kitts and Nevis. With a smaller concentration of major resort properties, the OECS has also catered to a less affluent market that has filled their small hotels sector during the high season.
5.34 The historical mid-scale positioning of OECS destinations is now changing as they seek to capture the more upscale market segments interested in destination experiences, not just beach vacations. This is reinforcing the diverse character of their destinations. Dominica is adding adventure and culture to its nature positioning. St. Lucia has developed a strong cultural product around music, most notably its renowned Jazz Festival, and community tourism. Several destinations have embraced the yachting sector, from Grenada and St. Vincent and the Grenadines in the south to Antigua and Barbuda in the North, and all the OECS countries are strengthening their cultural festivals, carnivals and events to appeal to a growing international and regional market for these products (see Box 5.5). Looking beyond the OECS, Jamaica is also embracing adventure tourism and working hard to develop a community tourism product, and both Jamaica and Barbados are aggressively developing recreation resort products around golf. The Dominican Republic, long positioned around a mass tourism beach product, is expanding to include an upscale, diversified resort product catering to an affluent North American market.
Box 5.5: Emerging growth sectors in tourism
The Caribbean has an opportunity to tap emerging niche markets and "grow with it". Market tests conducted in 2004, with the assistance of CIDA, to gauge specialty tour operator interest in several locations in the region (Belize, Dominica, and Guyana) illustrate the point. These specialty operators focused on adventure, nature, heritage, and culture experiences. For Dominica alone, 33 out of 40 tour operators contacted expressed interest in exploring business opportunities. While every destination in the region pursues resort tourism as a matter of course, there have been fragmented and uncoordinated attempts to access this specialty, niche market. Indeed, most destinations have not developed the marketing infrastructure and associated skills to take advantage of the region’s competitive advantage in this specialty arena.
5.35 The ‘destination experience’. The emerging market niches can help deepen impact of tourism on the local economy, but require a more complex role for the public sector. In the past, the tourism sector in the Caribbean was viewed as comprising mainly airlines, cruise lines and hotels, which combined to produce the traditional, but now maturing, sun, sea and sand product. This product, according to Dunlop (2003), had very low domestic value added of an average of only about 20 percent. However, tourists worldwide, and particularly in the growing market segments identified above, are now demanding much more from their vacation ‘packages’. The new business model for competitive tourism involves managing the customer experience from the planning and booking stage through post-trip activities, and spanning the entire destination including hotels, restaurants, taxis and tour operators, activities, cultural and heritage sites and
103
scenic locations. While this model has the potential to create more linkages with the economy as a whole, it also means that successful management of the tourism sector, and by extension the role of the public sector, is a much more complex proposition than earlier.
5.36 This interest of visitors in experiencing more of the destination as a whole has deepened the public good factor in the tourism production function. The entire destination has become the tourism plant. As such, the management of tourism needs to embrace a host of new areas such as environmental protection (see Box 5.6) and solid waste management, land use planning to ensure the maintenance of scenic views, policies to protect and showcase culture and heritage, establishment of quality standards in a broad range of services, and ensuring a legal framework for consumer protection.
(iii) Strategies to improve competitiveness
5.37 Owing to high costs, the traditional commoditized model of tourism in the Caribbean is becoming increasingly uncompetitive. The way forward lies in making improvements in product and service quality and in moving up-market. This will require improving human resources, focusing on infrastructure rather than providing investor-specific incentives, working through national and regional tourism clusters to improve and expand product standards and certification, and including the small enterprises in the overall strategic effort.
5.38 High costs contribute to lack of competitiveness in commoditized tourism, implying the need to go up-market. In many parts of the Caribbean, tourism is characterized as an undifferentiated commodity market with extreme price competition. WTO describes the sun, sea, and sand markets as “approaching the mature/saturation stage for the product life cycle” (WTO 2001). A World Bank report found that tourism in the Caribbean exhibits very high price elasticity.127 Following the terrorist attacks in the US in 2001, resorts were able to substantially dampen the contraction in demand in the 2001-02 winter season through price discounting. During the 1990s, the expansion of lower cost sun, sea and sand offerings combined with mass marketing techniques by emerging destinations, mainly the Dominican Republic, the Cancun/Cozumel region in Mexico and more recently Cuba, resulted in increased market share for these destinations at the expense of both the OECS and broader CARICOM destinations. In addition, with the decline in transportation costs worldwide, long haul destinations have become increasingly attractive, as evidenced by the rising share of tourists worldwide traveling to Africa, Asia, and the Middle East. Other factors contributing to the Caribbean’s lack of price competitiveness (see Figure 5.3 below) are high cost of labor and utilities (see Chapters 6 and 8). Targeting the new high growth segments of the tourism market would enable a focus on the less price elastic and higher price part of the demand curve, as a way to offset high cost. However, without real improvements in product and service quality to justify the higher spending by visitors, this strategy is unlikely to succeed.
127 Maloney, W. and Rojas, G. (forthcoming). “How Elastic are Sea, Sand and Sun?”
104
Box 5.6: Achieving Environmentally Sustainable Tourism in the OECS Sub-Region
The environment is a key asset for the OECS countries (as well as for the Caribbean as a whole) to grow and remain competitive in the tourism sector. The tourism sector remains highly concentrated in the coastal zones, also the principal sites for human settlements and industrial development. Poorly planned development activities, including tourism projects, pose a growing risk to the "health" of the environment, on which much of the sector depends. In seeking economic growth, the region needs to ensure that environmental quality is not undermined, cheapening the Caribbean tourism “brand” in the face of increasing competition.
From the perspective of sustainable tourism development, key environmental problems faced in the OECS region are: degradation of coral reefs and other highly productive coastal and near-shore marine habitats, loss of marine biodiversity, decline in the environmental quality of beaches and adjacent waters, and slowly diminishing beauty of the landscape.
The main causes of environmental degradation impacting the tourism industry include lack of wastewater treatment, agro-industrial pollution, agricultural run-off and soil erosion, solid waste pollution and the lack of systematic land use and landscape planning. These impacts derive largely from increased migration to and expansion in urban zones against a backdrop of poor urban planning, diversification into non-traditional economic sectors (including some light industry), poor sanitation management, and overall economic growth, leading to greater consumption and waste generation. While agricultural run-off and erosion may be diminishing, increased residential construction in turn is now creating soil erosion and reducing the beauty of the landscape.
While there is no evidence that the OECS countries are involved in a “race to the bottom”, as defined by countries competing with each other to obtain tourist income at the expense of the environment, there is anecdotal evidence of ‘fast-tracking” environmental regulations to attract tourism investment. In this context, countries need to remind themselves that relaxation of environmental standards to maximize investment in the short run could threaten the viability of the tourism product in the long run.
Because of their small size, mass tourism is not a real option in the OECS, since the natural environment would not be able to sustain it, and a degraded environment would turn tourists away from the area in favor of countries with a healthier environment. As an alternative, the Eastern Caribbean could focus on the higher end of the tourism market by conserving the beauty of its pristine natural environment and providing a complete “environmental experience” to the longer-term stay-over visitors - health tourists (such as rejuvenation clubs and spas), yachting, exclusive time-share arrangements, eco-tourism - as well as residential settlement of affluent retirees. This market would also provide important backward linkages to domestic horticulture, small scale industry, construction, as well as medical and other service sectors.
Adoption of such a strategy would require an active public role. From the environmental point of view, it will need: (i) strict enforcement of environmental policies for land use planning, urban-rural zoning regulations and landscaping; (ii) conservation and expansion of natural areas; (iii) strict monitoring of the quality of coastal waters and beaches; and (iv) additional efforts in solid waste management, waste water treatment and water and air pollution control. Source: World Bank (2005d). “Achieving Environmentally Sustainable Tourism in the OECS Sub-Region”.
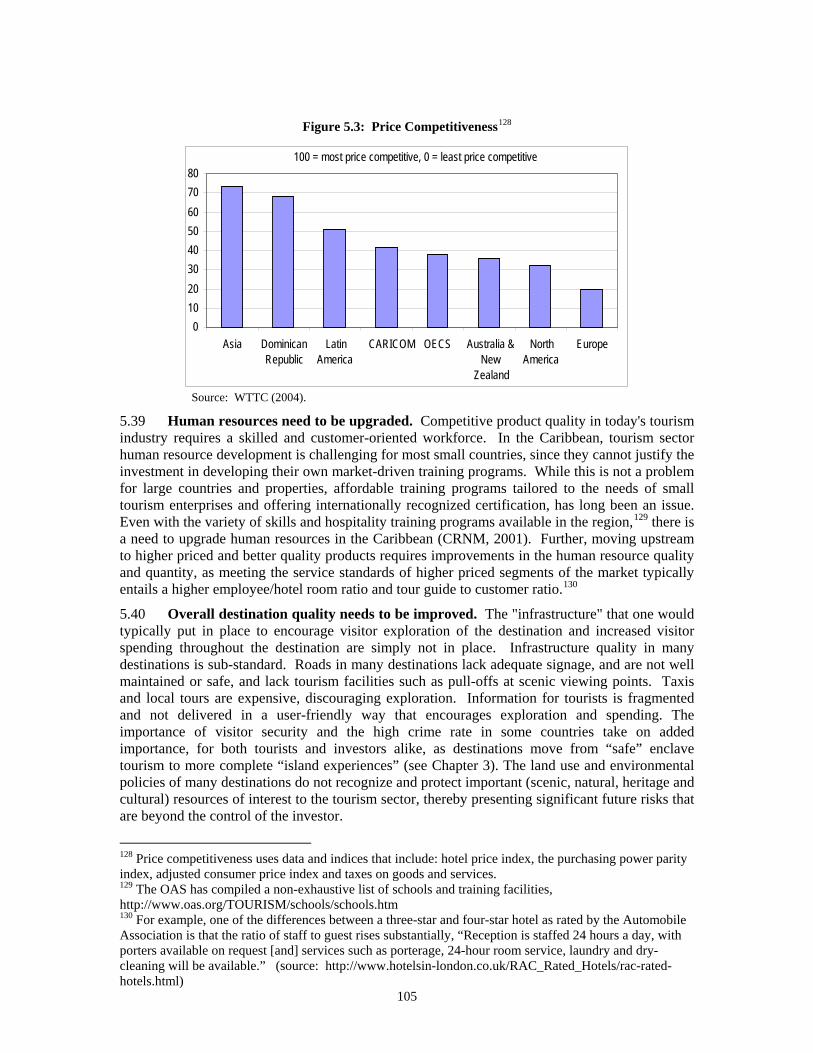
105
Figure 5.3: Price Competitiveness128
Source: WTTC (2004).
5.39 Human resources need to be upgraded. Competitive product quality in today's tourism industry requires a skilled and customer-oriented workforce. In the Caribbean, tourism sector human resource development is challenging for most small countries, since they cannot justify the investment in developing their own market-driven training programs. While this is not a problem for large countries and properties, affordable training programs tailored to the needs of small tourism enterprises and offering internationally recognized certification, has long been an issue. Even with the variety of skills and hospitality training programs available in the region,129 there is a need to upgrade human resources in the Caribbean (CRNM, 2001). Further, moving upstream to higher priced and better quality products requires improvements in the human resource quality and quantity, as meeting the service standards of higher priced segments of the market typically entails a higher employee/hotel room ratio and tour guide to customer ratio.130
5.40 Overall destination quality needs to be improved. The "infrastructure" that one would typically put in place to encourage visitor exploration of the destination and increased visitor spending throughout the destination are simply not in place. Infrastructure quality in many destinations is sub-standard. Roads in many destinations lack adequate signage, and are not well maintained or safe, and lack tourism facilities such as pull-offs at scenic viewing points. Taxis and local tours are expensive, discouraging exploration. Information for tourists is fragmented and not delivered in a user-friendly way that encourages exploration and spending. The importance of visitor security and the high crime rate in some countries take on added importance, for both tourists and investors alike, as destinations move from “safe” enclave tourism to more complete “island experiences” (see Chapter 3). The land use and environmental policies of many destinations do not recognize and protect important (scenic, natural, heritage and cultural) resources of interest to the tourism sector, thereby presenting significant future risks that are beyond the control of the investor.
128 Price competitiveness uses data and indices that include: hotel price index, the purchasing power parity index, adjusted consumer price index and taxes on goods and services. 129 The OAS has compiled a non-exhaustive list of schools and training facilities, http://www.oas.org/TOURISM/schools/schools.htm 130 For example, one of the differences between a three-star and four-star hotel as rated by the Automobile Association is that the ratio of staff to guest rises substantially, “Reception is staffed 24 hours a day, with porters available on request [and] services such as porterage, 24-hour room service, laundry and dry-cleaning will be available.” (source: http://www.hotelsin-london.co.uk/RAC_Rated_Hotels/rac-rated-hotels.html)
010 20 30 40 50 60 70 80
Asia Dominican Republic
LatinAmerica
CARICOM OECS Australia &New
Zealand
NorthAmerica
Europe
100 = most price competitive, 0 = least price competitive
106
5.41 Competitive product and certification need to be developed further and universally applied. Many of the pioneer resort areas of the Caribbean – Negril in Jamaica, Rocky Beach in Barbados, depended heavily on a repeat customer business that is dying out. For properties that did not adjust to the expectations of new markets, business has been declining.131 Tourism markets are placing increasing reliance on branding, rating, and other product quality assurance signals to assist the consumer with these choices. While larger properties have few problems in these areas, smaller tourism enterprises, which include most Caribbean-owned properties and tourism related products, struggle with substandard product quality.132 Destinations in the region are beginning to examine the question of accommodation standards for small properties more closely, recognizing the gaps that exist. For example, Dominica is collaborating with its Bureau of Standards to strengthen accommodation standards and implement certification programs. Similar standards development and strengthening efforts are underway in several Caribbean countries including Antigua and Barbuda, St. Vincent and the Grenadines, St. Kitts and Nevis, St. Lucia (particularly in the area of heritage tourism), Guyana, Suriname and Belize. Jamaica has long been the leader in promulgating standards for non-hotel tourism experiences. Many countries have looked to Jamaica's standards as a guide to develop their own in recent years.
5.42 At least in the area of environmental conservation – one of the early areas of this type of branding and certification – a growing number of hotels are using international standards. In a survey of 180 hotel operators undertaken in 2004 for a recent World Bank report (2005d) on the environmental sustainability in OECS tourism sector, just under 20 percent of the respondents reported participating in voluntary environmental certification schemes. However, another 43 percent saw no benefits for their operation. Notably, Dominica is currently undertaking the process of becoming the first full destination, rather than property, to be certified by Green Globe 21.133
5.43 Destination marketing needs to be more strategic. Marketing of Caribbean tourism is undertaken at the regional level by the CTO, at the national level by tourism agencies and at the product sales level by private sector suppliers. The traditional marketing model in the Caribbean relies heavily on the large resort and hotel properties driving business through their tour operator relationships and reservations systems. The CTO provides Caribbean brand awareness and national tourism agencies engage in cooperative marketing programs with their respective industries. Weaknesses in the marketing system, however, compromise results. Many countries have neither a strategic marketing plan nor the marketing infrastructure necessary to compete in today’s marketplace. Effective use of the internet to support marketing strategies is rare.
5.44 Small tourism enterprises are not well integrated into national marketing strategies. Faced with high unit marketing costs and little effective support from national campaigns, this segment of the industry continues to languish. The growing specialty market niches such as culture, heritage, nature and adventure are less price sensitive than most and are particularly well matched to the products and services of small tourism enterprises. The strong growth of these niches has spawned a growing number of travel intermediaries who are constantly looking for new products to deliver to their customers. Yet most destinations in the region are not well equipped to successfully market to these niches. Marketing success for these niches demands an approach
131 In a CPEC-sponsored workshop on destination marketing held in February 2004 with Negril hoteliers, the small hotel community within Negril confirmed that their repeat business is declining, as their older customers stop travelling and they find it very difficult to develop new business, given product quality issues. 132 Anecdotal evidence in the region indicated that the small hotels sector (75 rooms or less, the Caribbean Hotel Association’s definition of small hotels) has been consistently underperforming since the 1970s with average occupancies ranging from 45-55 percent. 133 Green Globe 21 is a worldwide benchmarking and certification program for sustainable tourism. It is based on Agenda 21 and principles for Sustainable Development endorsed by 182 governments at the United Nations Rio de Janeiro Earth Summit in 1992.
107
markedly different than current methods, involving building relationships with specialty tour operators and travel agents, providing destination information tailored to their interests, and ensuring that destination suppliers have the skills, capabilities and systems to engage with the international travel trade.
5.45 Policy regimes need to focus on public goods like infrastructure rather than on incentives. Caribbean governments have long relied on the use of incentives to attract foreign investment in the tourism industry, sometimes granting preferential treatment to larger international investors. Today, investment regimes throughout the region offer quite similar provisions including tax holidays, duty-free imports on construction and refurbishment, profit repatriation, and various provisions for waiving fees based on the public interest. However, as seen in Chapters 2 and 3, tax incentives are not an effective way to attract investors in high tax environments, and have difficulties in offsetting the macroeconomic situation. Moreover, tax incentives are usually discretionary, which has created uncertainty for foreign and domestic investors alike. Studies suggest that factors other than tax incentives—infrastructure, law and order, transparency and the macroeconomic situation—can be more important. Public resources allocated to tax incentives, guarantees and investor-specific infrastructure raise the return to a single private operator, as opposed to spending on destination marketing, training, infrastructure, and development of standards which raise the return to the entire sector.
5.46 Trade-related constraints to tourism need to be addressed. While there are relatively few barriers to trade in tourism, the CRNM (Dunlop, 2003) has identified some emerging issues that can be dealt with at a regional, bilateral and multilateral level.
• Travel within the Caribbean is hampered by restrictions including taxes and visas, which could be facilitated by a CARICOM passport.
• Mode 2 restrictions on “consumption abroad”, consisting of various types of travel taxes imposed by the source countries on their residents when they travel abroad,134
• Very low levels of duty-free exemptions for EU, US, and Canadian residents returning from CARICOM countries, which encourage cruise and stayover passengers to make purchases in the US Virgin Islands where exemptions are substantially higher.
• Mode 4 barriers135 on the movement of tourism professionals and students hamper the Caribbean’s marketing efforts and limit educational opportunities for its tourism students.
5.47 Overall, national and regional policies should focus on provision of public goods and increasing the partnership between the public and private sectors in the overall development of the sector.
• A business model approach for destination management. The size of national tourism sectors in the region range from about US$45 million to over US$2.5 billion. These are all significant businesses in their own right and require investment in marketing, product development, product quality standards and certification, management of the external environment to the extent possible, management of distribution channels and strategic partnering relationships, and performance monitoring.
• Strengthening industry clusters at the national and regional levels will help. Channeling of support to the industry through these clusters will help in many of the areas identified above, such as in the provision of training, much greater involvement of the private sector in strategic planning, and development and expansion of product quality standards and certification. At the same time, there is need to strengthen monitoring of the performance of national and regional tourism associations and hold them more accountable.
134 According to WTTC President, taxes and other costs can amount to 30 percent for Europeans. 135 The temporary movement of service providing persons.
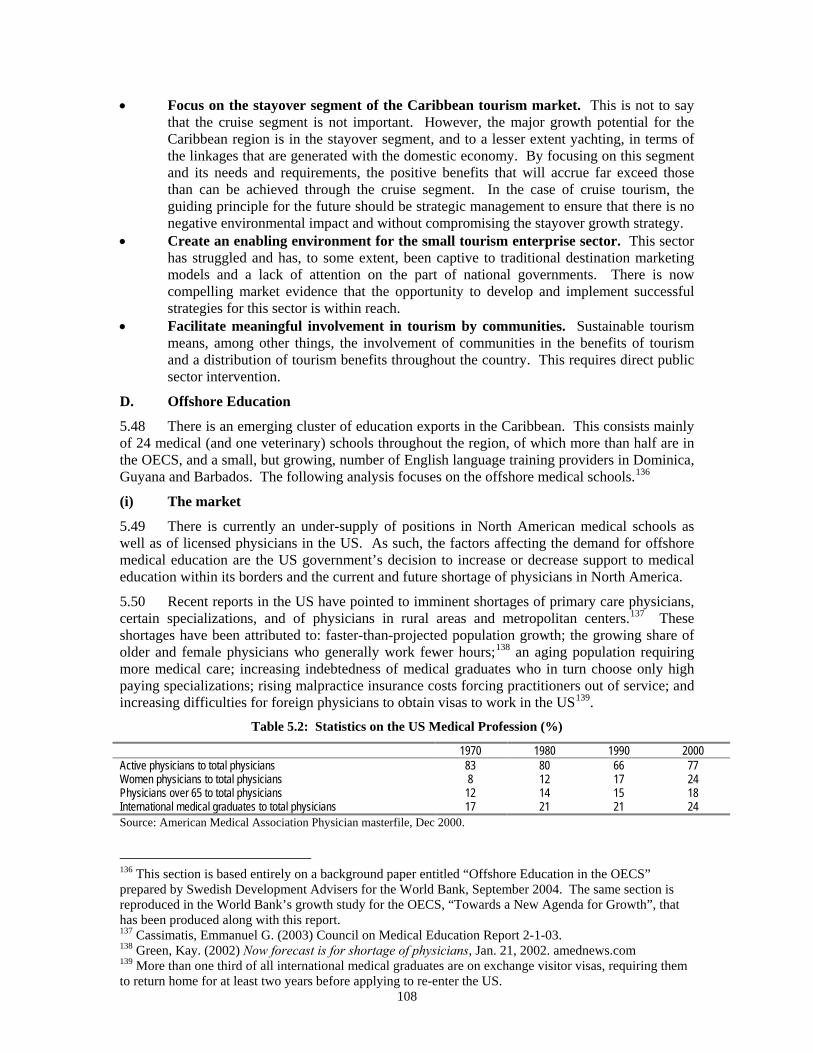
108
• Focus on the stayover segment of the Caribbean tourism market. This is not to say that the cruise segment is not important. However, the major growth potential for the Caribbean region is in the stayover segment, and to a lesser extent yachting, in terms of the linkages that are generated with the domestic economy. By focusing on this segment and its needs and requirements, the positive benefits that will accrue far exceed those than can be achieved through the cruise segment. In the case of cruise tourism, the guiding principle for the future should be strategic management to ensure that there is no negative environmental impact and without compromising the stayover growth strategy.
• Create an enabling environment for the small tourism enterprise sector. This sector has struggled and has, to some extent, been captive to traditional destination marketing models and a lack of attention on the part of national governments. There is now compelling market evidence that the opportunity to develop and implement successful strategies for this sector is within reach.
• Facilitate meaningful involvement in tourism by communities. Sustainable tourism means, among other things, the involvement of communities in the benefits of tourism and a distribution of tourism benefits throughout the country. This requires direct public sector intervention.
D. Offshore Education
5.48 There is an emerging cluster of education exports in the Caribbean. This consists mainly of 24 medical (and one veterinary) schools throughout the region, of which more than half are in the OECS, and a small, but growing, number of English language training providers in Dominica, Guyana and Barbados. The following analysis focuses on the offshore medical schools.136
(i) The market
5.49 There is currently an under-supply of positions in North American medical schools as well as of licensed physicians in the US. As such, the factors affecting the demand for offshore medical education are the US government’s decision to increase or decrease support to medical education within its borders and the current and future shortage of physicians in North America.
5.50 Recent reports in the US have pointed to imminent shortages of primary care physicians, certain specializations, and of physicians in rural areas and metropolitan centers.137 These shortages have been attributed to: faster-than-projected population growth; the growing share of older and female physicians who generally work fewer hours;138 an aging population requiring more medical care; increasing indebtedness of medical graduates who in turn choose only high paying specializations; rising malpractice insurance costs forcing practitioners out of service; and increasing difficulties for foreign physicians to obtain visas to work in the US139.
Table 5.2: Statistics on the US Medical Profession (%)
1970 1980 1990 2000 Active physicians to total physicians 83 80 66 77 Women physicians to total physicians 8 12 17 24 Physicians over 65 to total physicians 12 14 15 18 International medical graduates to total physicians 17 21 21 24 Source: American Medical Association Physician masterfile, Dec 2000.
136 This section is based entirely on a background paper entitled “Offshore Education in the OECS” prepared by Swedish Development Advisers for the World Bank, September 2004. The same section is reproduced in the World Bank’s growth study for the OECS, “Towards a New Agenda for Growth”, that has been produced along with this report. 137 Cassimatis, Emmanuel G. (2003) Council on Medical Education Report 2-1-03. 138 Green, Kay. (2002) Now forecast is for shortage of physicians, Jan. 21, 2002. amednews.com 139 More than one third of all international medical graduates are on exchange visitor visas, requiring them to return home for at least two years before applying to re-enter the US.
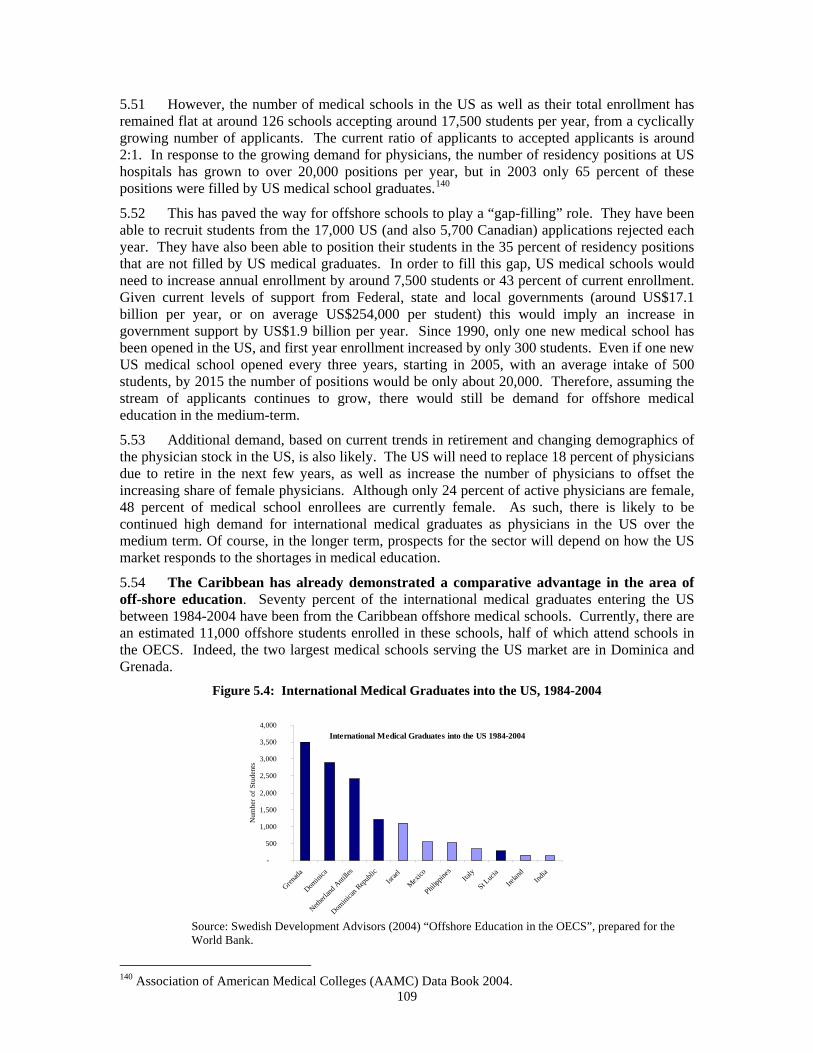
109
5.51 However, the number of medical schools in the US as well as their total enrollment has remained flat at around 126 schools accepting around 17,500 students per year, from a cyclically growing number of applicants. The current ratio of applicants to accepted applicants is around 2:1. In response to the growing demand for physicians, the number of residency positions at US hospitals has grown to over 20,000 positions per year, but in 2003 only 65 percent of these positions were filled by US medical school graduates.140
5.52 This has paved the way for offshore schools to play a “gap-filling” role. They have been able to recruit students from the 17,000 US (and also 5,700 Canadian) applications rejected each year. They have also been able to position their students in the 35 percent of residency positions that are not filled by US medical graduates. In order to fill this gap, US medical schools would need to increase annual enrollment by around 7,500 students or 43 percent of current enrollment. Given current levels of support from Federal, state and local governments (around US$17.1 billion per year, or on average US$254,000 per student) this would imply an increase in government support by US$1.9 billion per year. Since 1990, only one new medical school has been opened in the US, and first year enrollment increased by only 300 students. Even if one new US medical school opened every three years, starting in 2005, with an average intake of 500 students, by 2015 the number of positions would be only about 20,000. Therefore, assuming the stream of applicants continues to grow, there would still be demand for offshore medical education in the medium-term.
5.53 Additional demand, based on current trends in retirement and changing demographics of the physician stock in the US, is also likely. The US will need to replace 18 percent of physicians due to retire in the next few years, as well as increase the number of physicians to offset the increasing share of female physicians. Although only 24 percent of active physicians are female, 48 percent of medical school enrollees are currently female. As such, there is likely to be continued high demand for international medical graduates as physicians in the US over the medium term. Of course, in the longer term, prospects for the sector will depend on how the US market responds to the shortages in medical education.
5.54 The Caribbean has already demonstrated a comparative advantage in the area of off-shore education. Seventy percent of the international medical graduates entering the US between 1984-2004 have been from the Caribbean offshore medical schools. Currently, there are an estimated 11,000 offshore students enrolled in these schools, half of which attend schools in the OECS. Indeed, the two largest medical schools serving the US market are in Dominica and Grenada.
Figure 5.4: International Medical Graduates into the US, 1984-2004
International Medical Graduates into the US 1984-2004
-
500
1,000
1,500
2,000
2,500
3,000
3,500
4,000
Grenad
a
Domini
ca
Netherl
and A
ntille
s
Domini
can R
epubli
cIsr
ael
Mexico
Philipp
ines
Italy
St Luci
a
Irelan
dInd
ia
Num
ber o
f Stu
dent
s
Source: Swedish Development Advisors (2004) “Offshore Education in the OECS”, prepared for the World Bank.
140 Association of American Medical Colleges (AAMC) Data Book 2004.
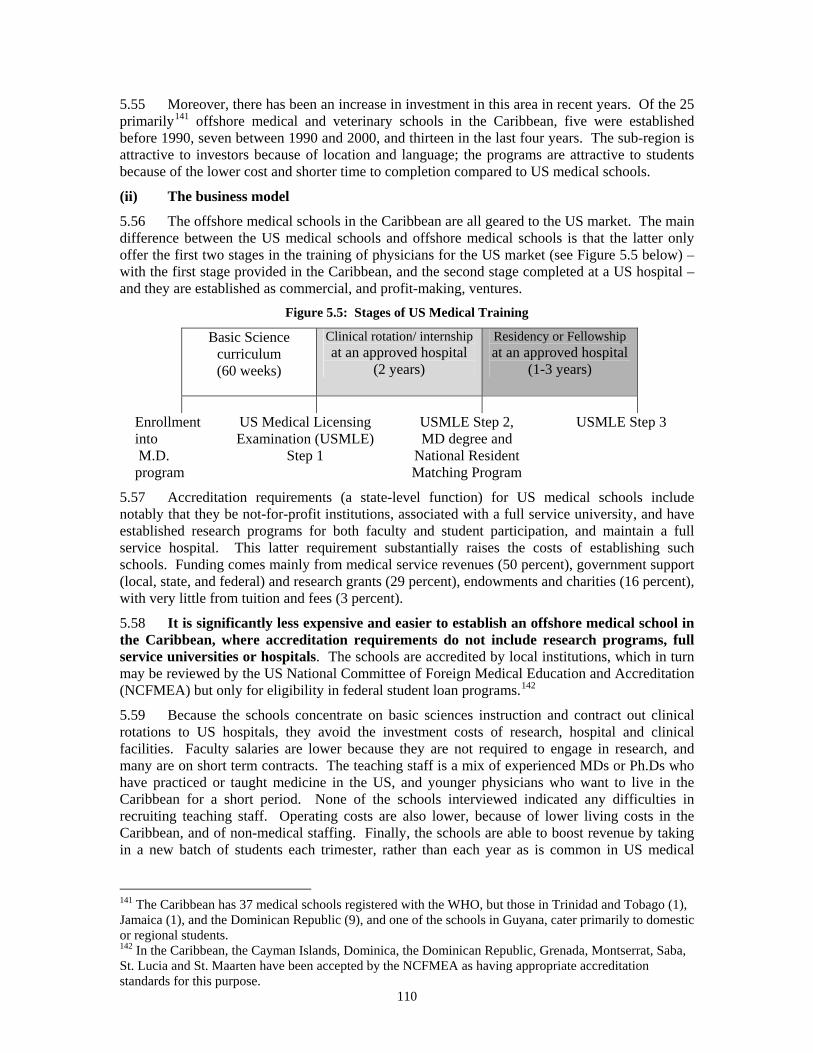
110
5.55 Moreover, there has been an increase in investment in this area in recent years. Of the 25 primarily141 offshore medical and veterinary schools in the Caribbean, five were established before 1990, seven between 1990 and 2000, and thirteen in the last four years. The sub-region is attractive to investors because of location and language; the programs are attractive to students because of the lower cost and shorter time to completion compared to US medical schools.
(ii) The business model
5.56 The offshore medical schools in the Caribbean are all geared to the US market. The main difference between the US medical schools and offshore medical schools is that the latter only offer the first two stages in the training of physicians for the US market (see Figure 5.5 below) – with the first stage provided in the Caribbean, and the second stage completed at a US hospital – and they are established as commercial, and profit-making, ventures.
Figure 5.5: Stages of US Medical Training
Basic Science curriculum (60 weeks)
Clinical rotation/ internship at an approved hospital
(2 years)
Residency or Fellowship at an approved hospital
(1-3 years)
Enrollment into M.D. program
US Medical Licensing Examination (USMLE)
Step 1
USMLE Step 2, MD degree and
National Resident Matching Program
USMLE Step 3
5.57 Accreditation requirements (a state-level function) for US medical schools include notably that they be not-for-profit institutions, associated with a full service university, and have established research programs for both faculty and student participation, and maintain a full service hospital. This latter requirement substantially raises the costs of establishing such schools. Funding comes mainly from medical service revenues (50 percent), government support (local, state, and federal) and research grants (29 percent), endowments and charities (16 percent), with very little from tuition and fees (3 percent).
5.58 It is significantly less expensive and easier to establish an offshore medical school in the Caribbean, where accreditation requirements do not include research programs, full service universities or hospitals. The schools are accredited by local institutions, which in turn may be reviewed by the US National Committee of Foreign Medical Education and Accreditation (NCFMEA) but only for eligibility in federal student loan programs.142
5.59 Because the schools concentrate on basic sciences instruction and contract out clinical rotations to US hospitals, they avoid the investment costs of research, hospital and clinical facilities. Faculty salaries are lower because they are not required to engage in research, and many are on short term contracts. The teaching staff is a mix of experienced MDs or Ph.Ds who have practiced or taught medicine in the US, and younger physicians who want to live in the Caribbean for a short period. None of the schools interviewed indicated any difficulties in recruiting teaching staff. Operating costs are also lower, because of lower living costs in the Caribbean, and of non-medical staffing. Finally, the schools are able to boost revenue by taking in a new batch of students each trimester, rather than each year as is common in US medical
141 The Caribbean has 37 medical schools registered with the WHO, but those in Trinidad and Tobago (1), Jamaica (1), and the Dominican Republic (9), and one of the schools in Guyana, cater primarily to domestic or regional students. 142 In the Caribbean, the Cayman Islands, Dominica, the Dominican Republic, Grenada, Montserrat, Saba, St. Lucia and St. Maarten have been accepted by the NCFMEA as having appropriate accreditation standards for this purpose.
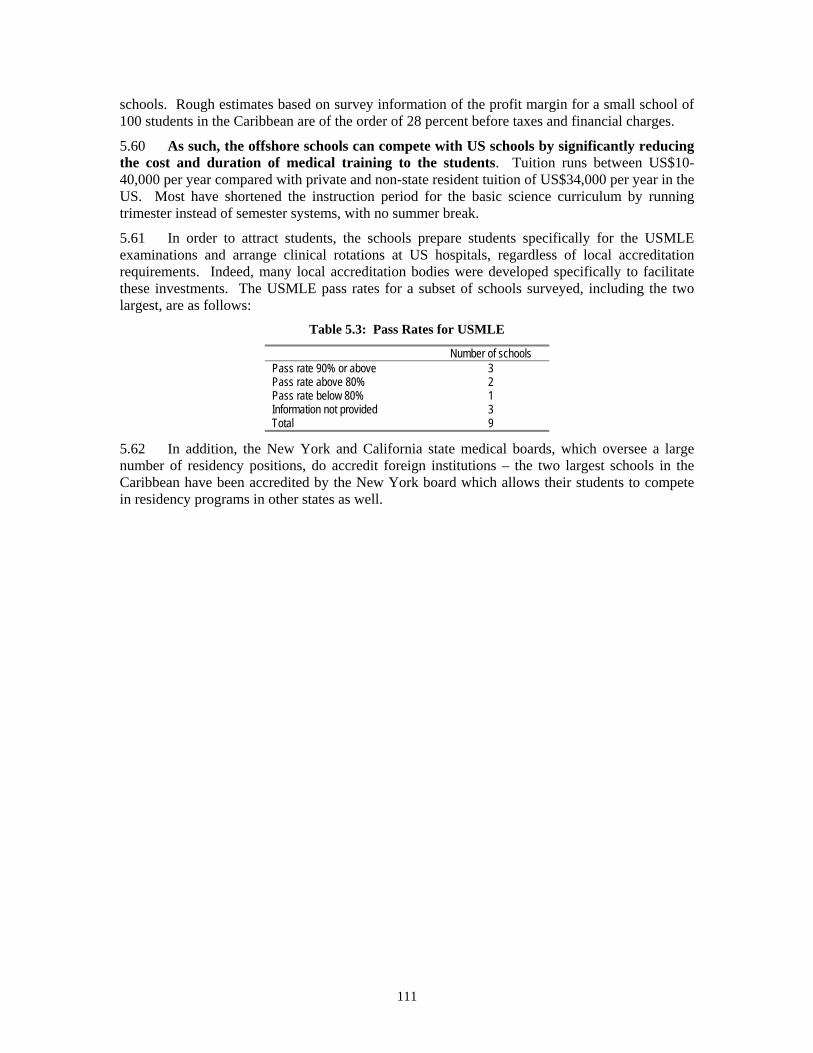
111
schools. Rough estimates based on survey information of the profit margin for a small school of 100 students in the Caribbean are of the order of 28 percent before taxes and financial charges.
5.60 As such, the offshore schools can compete with US schools by significantly reducing the cost and duration of medical training to the students. Tuition runs between US$10-40,000 per year compared with private and non-state resident tuition of US$34,000 per year in the US. Most have shortened the instruction period for the basic science curriculum by running trimester instead of semester systems, with no summer break.
5.61 In order to attract students, the schools prepare students specifically for the USMLE examinations and arrange clinical rotations at US hospitals, regardless of local accreditation requirements. Indeed, many local accreditation bodies were developed specifically to facilitate these investments. The USMLE pass rates for a subset of schools surveyed, including the two largest, are as follows:
Table 5.3: Pass Rates for USMLE
Number of schools Pass rate 90% or above 3 Pass rate above 80% 2 Pass rate below 80% 1 Information not provided 3 Total 9
5.62 In addition, the New York and California state medical boards, which oversee a large number of residency positions, do accredit foreign institutions – the two largest schools in the Caribbean have been accredited by the New York board which allows their students to compete in residency programs in other states as well.
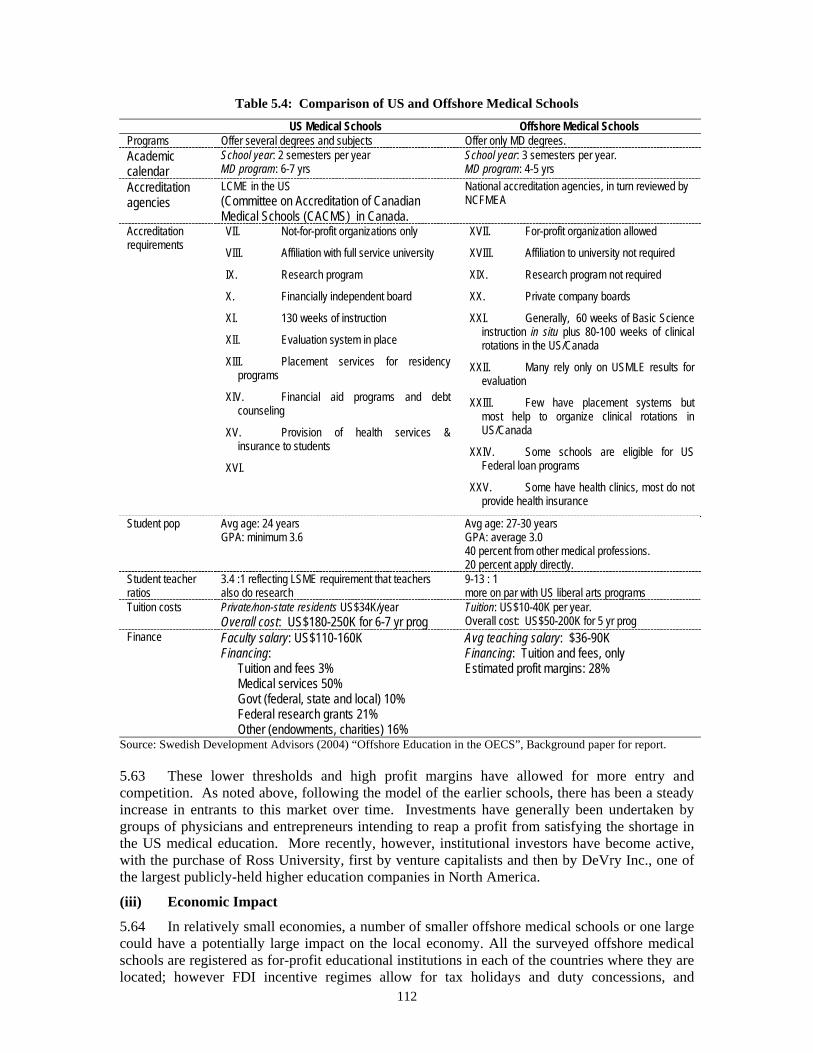
112
Table 5.4: Comparison of US and Offshore Medical Schools
US Medical Schools Offshore Medical Schools Programs Offer several degrees and subjects Offer only MD degrees. Academic calendar
School year: 2 semesters per year MD program: 6-7 yrs
School year: 3 semesters per year. MD program: 4-5 yrs
Accreditation agencies
LCME in the US (Committee on Accreditation of Canadian Medical Schools (CACMS) in Canada.
National accreditation agencies, in turn reviewed by NCFMEA
Accreditation requirements
VII. Not-for-profit organizations only
VIII. Affiliation with full service university
IX. Research program
X. Financially independent board
XI. 130 weeks of instruction
XII. Evaluation system in place
XIII. Placement services for residency programs
XIV. Financial aid programs and debt counseling
XV. Provision of health services & insurance to students
XVI.
XVII. For-profit organization allowed
XVIII. Affiliation to university not required
XIX. Research program not required
XX. Private company boards
XXI. Generally, 60 weeks of Basic Science instruction in situ plus 80-100 weeks of clinical rotations in the US/Canada
XXII. Many rely only on USMLE results for evaluation
XXIII. Few have placement systems but most help to organize clinical rotations in US/Canada
XXIV. Some schools are eligible for US Federal loan programs
XXV. Some have health clinics, most do not provide health insurance
Student pop Avg age: 24 years GPA: minimum 3.6
Avg age: 27-30 years GPA: average 3.0 40 percent from other medical professions. 20 percent apply directly.
Student teacher ratios
3.4 :1 reflecting LSME requirement that teachers also do research
9-13 : 1 more on par with US liberal arts programs
Tuition costs Private/non-state residents US$34K/year Overall cost: US$180-250K for 6-7 yr prog
Tuition: US$10-40K per year. Overall cost: US$50-200K for 5 yr prog
Finance Faculty salary: US$110-160K Financing:
Tuition and fees 3% Medical services 50% Govt (federal, state and local) 10% Federal research grants 21% Other (endowments, charities) 16%
Avg teaching salary: $36-90K Financing: Tuition and fees, only Estimated profit margins: 28%
Source: Swedish Development Advisors (2004) “Offshore Education in the OECS”, Background paper for report.
5.63 These lower thresholds and high profit margins have allowed for more entry and competition. As noted above, following the model of the earlier schools, there has been a steady increase in entrants to this market over time. Investments have generally been undertaken by groups of physicians and entrepreneurs intending to reap a profit from satisfying the shortage in the US medical education. More recently, however, institutional investors have become active, with the purchase of Ross University, first by venture capitalists and then by DeVry Inc., one of the largest publicly-held higher education companies in North America.
(iii) Economic Impact
5.64 In relatively small economies, a number of smaller offshore medical schools or one large could have a potentially large impact on the local economy. All the surveyed offshore medical schools are registered as for-profit educational institutions in each of the countries where they are located; however FDI incentive regimes allow for tax holidays and duty concessions, and
113
repatriation of profits, dividends and imported capital. The regimes vary not only across countries, but also between schools in the same country. In all but two of the countries surveyed, the schools were exempt from corporate tax, whereas in others schools enjoyed concessional income tax rates. Foreign instructors are also generally exempt from local income taxes and all the schools received either reduced duty or duty exemptions on imports of intermediate goods. Instead, most countries levy an annual per student tax or fixed annual fees on schools, but these also vary by country and institution. The annual fiscal yield ranged from US$50,000 to US$300,000 per year. Recognizing the non-transparent and discriminatory treatment of different schools, one country reported plans to harmonize the tax treatment across institutions.
5.65 Estimates of annual spending by students range from US$6,500 to US$21,000 for the countries surveyed. The nine surveyed schools employed some 710 local staff, paying higher than average wages in the domestic market. The ratio of students to local non-medical staff ranges from 1-30, the ratio decreasing for the larger schools. The smallest schools typically have more persons employed in the US, tasked with recruitment and enrollment, marketing and finance. As they grow, these tasks are often transferred to the islands, but offset by the reduced ratio of support staff to students.
5.66 Overall, the estimated direct impact on the economy ranges from 0.2 percent of GDP in St. Lucia to 8.3 percent in Dominica. The indirect impact however is substantially larger. First, the schools have an impact on local health care institutions to which they provide a range of support in terms of financial and equipment donations in exchange for clinical exposure for their students, and incidental training for local medical professionals. Most of the schools offer a few scholarships to local students. One school has diversified into other areas of post-secondary training and is targeting the local and regional tertiary education market which is notably underserved.
(iv) Policy Options
5.67 The growing number of schools being established in the Caribbean (including by DeVry) is evidence of the market’s outlook for further potential for growth in this area. Lobbying and accrediting agencies in the US and Canada have begun to take notice. New entrants are beginning to differentiate their instructional approaches – one school has started a distance learning program, while another is focusing on a wholistic approach to training a “good” doctor with links to similar-minded clinical and residency programs in the US. Earlier entrants have achieved direct accreditation by state medical boards and established reputations with competitive residency programs. However, the growth encouraged by strong demand and the low entry requirements (both in terms of finance and accreditation) has been accompanied by increased churning, as some new entrants succeed and others fail, which can risk damaging the reputation of a country if one operator misleads students and provides substandard services.
5.68 Countries can encourage the appropriate types of investments by raising accreditation standards to allow for NCFMEA, federal loan program, and key state board accreditations. This may also help to diffuse negative attention from US associations that may lobby for expansion of domestic education in response to challenges on quality. Costs of such a body could be minimized by supporting a regional, rather than national, accreditation agency.
5.69 A harmonized, transparent and non-discriminatory investment regime would be more appropriate to position the region for continued flows of investment. Given the demonstrated supply of investors, it would be unfortunate for the Caribbean countries to engage in tax competition to attract entrants.
5.70 The success can be built upon. With a significant cluster having emerged, cross-country experience shows that this success can be built upon, including expanding education exports in non-medical areas. US imports of education services, for example, have been growing
114
on average at 11 percent per year since 1984. The emergence of an English-training cluster is a notable development in this regard.
E. Health Services in the Caribbean
5.71 Worldwide, there is increasing globalization of health care, as evidenced by growing cross-border delivery of health services and an increasing number of joint ventures. It has been estimated that by 2005, the global health services sector will amount to $4 trillion, and that the value of exported (traded) health services will be approximately five percent of the global market ($140 billion). Growth in exported health services is expected to be around six percent annually, but given the growth in information and communications technology and greater openness of health systems, it may grow at much higher rates.
5.72 Many developing countries are recognizing the potential benefits of trade in health services. There appear to be three different approaches that countries have taken with respect to trade in such services. The first approach (government-led) is based on a national policy or strategy of export-promotion to pursue medical or health tourism as a means of generating needed revenues for the health sector. Countries such as Cuba, Jordan, and Singapore are examples of such approaches. In the second approach (private-sector led), countries have left development of medical tourism to private entrepreneurship, with governments developing the legal and regulatory enabling environment necessary for private investment and private sector expansion. India is an example of this approach. Finally, there are some countries which have both adopted national policies or strategies and have also enabled private sector growth in this area (mixed). Countries of Latin America and East Asia fall generally in this category.
5.73 The objective of this section is to examine the opportunities and challenges for increased trade in health and health-related services in the English-speaking Caribbean, as a means towards greater economic growth and development. The focus is on health tourism, or movement of consumers from outside the Caribbean to use Caribbean health and wellness services (Mode 2).143
(i) Current situation
5.74 The English-speaking Caribbean has several characteristics which make it an appealing destination for visitors seeking health services, including its proximity to North American markets; climate and ambient environment; excellent hotel and tourism services; an educated population; and, well-trained health practitioners and established health and medical service industries in both public and private sectors.
5.75 There are currently many examples of health tourism in the Caribbean. These include health and wellness services (such as Le Sport in St. Lucia, see Box 5.5); rehabilitation services (such as Island Dialysis in Barbados and The Crossroads Center in Antigua); plastic surgery; some types of medical treatment, such as eye surgery, performed mostly in the private sector. The CARICOM countries also engage in cross-border movement of patients through shared service arrangements between major hospitals and the smaller island economies of the region.
143 Further details can be found in Brenzel, L. et al, “Opportunities and Challenges for Expanding Trade in Health Services in the Caribbean,” November 2004; and Gonzales, et al, 2001.
115
Box 5.7: Le Sport, St. Lucia
As one of the world’s most acclaimed health spas, Le Sport combines a great beach vacation with the pleasure of personalized spa services. Currently owned by Sun Swept Resorts based in St. Lucia (which also has facilities in the US, Canada, UK and Europe), Le Sport is located on what was once a large, family-owned coconut estate on the former site of the Malabar Hotel.
Le Sport’s BodyHoliday is not a single experience, but can be tailor-made from Scuba to exotic Ayurvedic treatments to fulfill specific needs and expectations. European readers of Condé Nast Traveller recently named The BodyHoliday the Number One Destination Spa in the world and one of the 100 Best Of The Best in Travel. Le Sport offers a wide range of aesthetic and medical spa services from yoga, Tai Chi, meditation, aerobics, stress management, fitness with personal trainers, stress and tone classes, aromatherapy, hydrotherapy, Thalassotherapy, Swedish and Shiatsu massage, Ayurvedic treatments, Acupuncture and Acupressure, Reflexology, and skin clinic. Staff are primarily from St. Lucia and the Caribbean and have received training in treatments and therapies.
Le Sport caters primarily to couples, but has facilities for families and those traveling alone. It targets the European market, primarily UK and Germany. The facility has 154 rooms and relatively high occupancy rates. Visitors pay for an all-inclusive package to encourage guests to avail themselves of the full range of services offered.
5.76 Despite health being one of the areas where countries have made the least commitments under the GATS, more than 70 countries have made at least some type of commitment with respect to health-related services. The CARICOM countries have also so far made limited commitments in the health sector in the GATS, and most of these have been made regarding professional services, rather than health-related services, such as hospitals.
(ii) Potential benefits and costs of trade in health services for the Caribbean
5.77 Potential benefits of trade in health services will derive from:
• additional revenues for the public sector (including foreign exchange) that can ease the pressure on public health budgets to provide quality health services for the local population;
• productive use of current excess capacity in the public and private health sectors; • return migration and increased retention of skilled health workers through increased
employment opportunities and mitigation of the brain-drain of health care professionals; • establishment of linkages with medical centers outside the region, and greater access to
medical technology, equipment, and practices; • additional health benefits for local populations related to a wider range of health care
providers and services; • private sector innovation and revenue generation; and • additional revenues and diversification of other sectors, including tourism, transportation,
etc.
5.78 Unfortunately, there is limited quantitative information worldwide on the costs of increased trade in health services. At a minimum, investment related to increased regulation to assure adequate quality and standards of service delivery would be required, regardless of whether trade in health services is actually promoted through government agencies or left to private sector development.
(iii) Findings of country case studies
5.79 As part of this research, in-depth case studies were conducted in Trinidad and Tobago and St. Lucia relating to the potential opportunities and constraints in expanding health tourism.
5.80 Policy stance: The policy stance towards medical tourism varied both between countries and within countries. In general, the private sector in both countries felt that medical tourism was
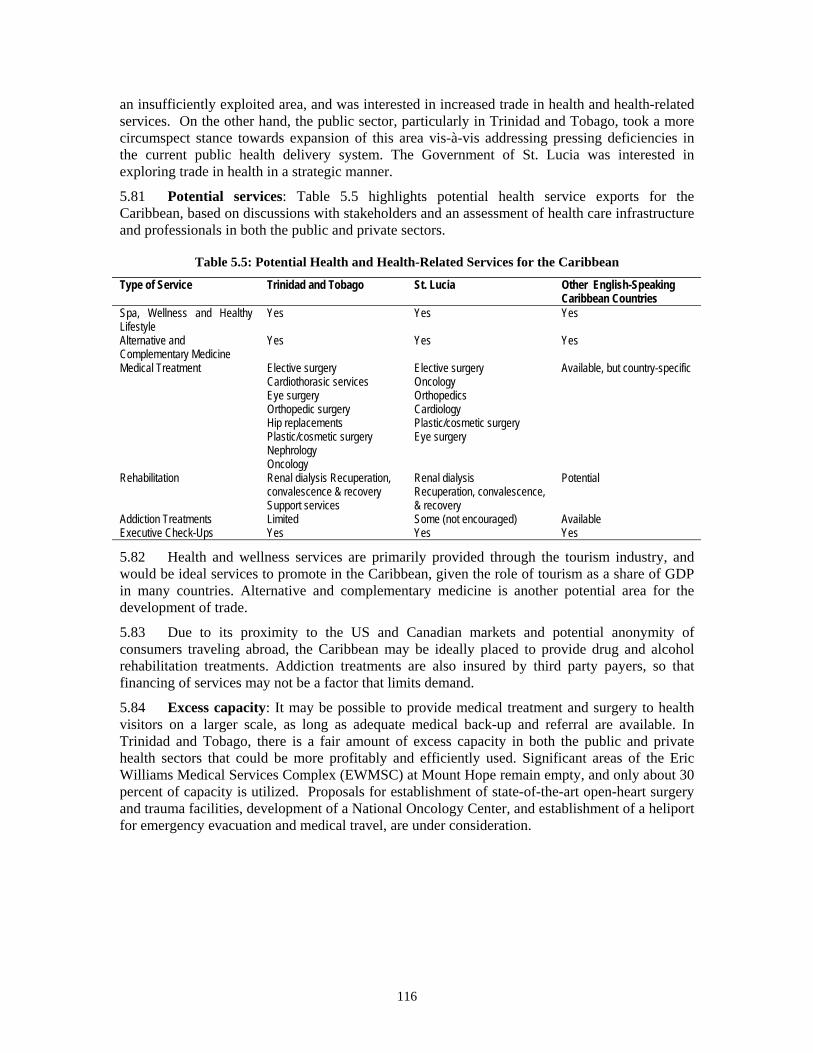
116
an insufficiently exploited area, and was interested in increased trade in health and health-related services. On the other hand, the public sector, particularly in Trinidad and Tobago, took a more circumspect stance towards expansion of this area vis-à-vis addressing pressing deficiencies in the current public health delivery system. The Government of St. Lucia was interested in exploring trade in health in a strategic manner.
5.81 Potential services: Table 5.5 highlights potential health service exports for the Caribbean, based on discussions with stakeholders and an assessment of health care infrastructure and professionals in both the public and private sectors.
Table 5.5: Potential Health and Health-Related Services for the Caribbean
Type of Service Trinidad and Tobago St. Lucia Other English-Speaking Caribbean Countries
Spa, Wellness and Healthy Lifestyle
Yes Yes Yes
Alternative and Complementary Medicine
Yes Yes Yes
Medical Treatment Elective surgery Cardiothorasic services Eye surgery Orthopedic surgery Hip replacements Plastic/cosmetic surgery Nephrology Oncology
Elective surgery Oncology Orthopedics Cardiology Plastic/cosmetic surgery Eye surgery
Available, but country-specific
Rehabilitation Renal dialysis Recuperation, convalescence & recovery Support services
Renal dialysis Recuperation, convalescence, & recovery
Potential
Addiction Treatments Limited Some (not encouraged) Available Executive Check-Ups Yes Yes Yes
5.82 Health and wellness services are primarily provided through the tourism industry, and would be ideal services to promote in the Caribbean, given the role of tourism as a share of GDP in many countries. Alternative and complementary medicine is another potential area for the development of trade.
5.83 Due to its proximity to the US and Canadian markets and potential anonymity of consumers traveling abroad, the Caribbean may be ideally placed to provide drug and alcohol rehabilitation treatments. Addiction treatments are also insured by third party payers, so that financing of services may not be a factor that limits demand.
5.84 Excess capacity: It may be possible to provide medical treatment and surgery to health visitors on a larger scale, as long as adequate medical back-up and referral are available. In Trinidad and Tobago, there is a fair amount of excess capacity in both the public and private health sectors that could be more profitably and efficiently used. Significant areas of the Eric Williams Medical Services Complex (EWMSC) at Mount Hope remain empty, and only about 30 percent of capacity is utilized. Proposals for establishment of state-of-the-art open-heart surgery and trauma facilities, development of a National Oncology Center, and establishment of a heliport for emergency evacuation and medical travel, are under consideration.
117
5.85 Main Findings: In general, it seems clear that a “one size fits all” approach to developing trade in health services will not be a viable strategy for the region. The opportunities identified from the case studies are as follows:
• There are significant opportunities to harness the global demand for health and wellness services in the English-speaking Caribbean.
• Expansion of trade in health services will need to be a predominantly private-sector led process, and mechanisms will be needed to support entrepreneurship in this area.
• The range of health and health-related services to be promoted will depend upon the role of the tourism sector (conducive for spa and wellness services), as well as the extent of high quality, accredited medical services through which to promote curative and rehabilitative services through private or public health facilities.
• The public sector facilities can become more involved in areas where there are excess capacities and relevant partnerships with the private sector. Niche markets remain to be identified and explored.
(iv) Issues and Policy Options
5.86 Policy, regulatory, institutional and legislative barriers to both foreign investment and movement of professionals within the Caribbean may limit the pace and extent of trade in health services in the region in the future. While there have been efforts to significantly liberalize the foreign investment environment, regulations or facilities have not been developed specifically for the health sector. Also, Ministries of Health are not well informed about the details of negotiations during rounds of the GATS, and how commitments there might affect health service delivery and financing locally. There is greater need to bring trade, commerce and health sectors together in preparation for negotiations, and the Regional Negotiating Machinery could play a greater role in this regard.
5.87 As a way forward, it is suggested that an incremental approach to expanding trade in health services be adopted initially, on a country-by-country basis. In some countries, expansion of trade in health services will need to proceed as a largely private sector-led initiative. Government’s role would be to develop an enabling legal and regulatory framework, and technical and financial assistance could be sought from the multilaterals to support this. In other countries, a more government-led approach may be more appropriate, particularly for countries which are interested in developing national policies and strategies in this area. The type of health tourism that could be developed will be different based on the role of the tourist sector and institutional capacity to provide services. In either case, government should seek to strengthen industry clusters and hold them accountable (see earlier case studies in this chapter).
5.88 Several steps need to be taken in order to improve the benefits accruing from health services, and to ensure spinoffs from health exports to improved domestic health care. These are discussed below.
5.89 Harmonize regulations and standards within the region. For example, developing common standards for accreditation and licensing would help to unify the regional market, and would help to reduce variation or gaps in quality of care provided in both the public and private sectors in the Caribbean. Trinidad and Tobago has taken the lead in national accreditation and licensing and other countries in the region are looking closely at this example. The Caribbean Association of Medical Councils could play a pivotal role in this area, working through the Joint Commission International (JCI), which launched its international accreditation program in 1999. These efforts should also aim to generate linkages with care management companies (see below).
5.90 Push for an increase in the portability of health insurance. Few health insurance plans offer clients insurance coverage for non-emergency medical treatments obtained overseas. The need to pay out-of-pocket for services provided abroad could limit the market for services to those who can afford to pay for themselves. Discussions with key informants in insurance and
118
care management organizations suggest that portability of health insurance has, in some cases, been overcome through innovations in case management across international borders. For example, Canadian Medical Network/Care Management Network enters into contractual arrangements with governments, insurance companies, physicians, specialists and hospitals in more than 130 countries and seeks to advocate, facilitate and manage health care for the international patient. This network is in the process of expanding its presence in the Caribbean. Nevertheless, the portability issue needs also to be addressed at the negotiating level, since many prospective health care customers including retirees in OECD countries and United States are still constrained by lack of insurance portability.
5.91 Maximize synergies between the development of the offshore and domestic health markets. Governments are responsible for providing good quality care to their citizens, and policies and strategies to expand and foster greater trade in this area should support, and be complementary to national health care efforts. National and regional bodies should identify and implement mechanisms that prevent the development of a dual and inequitable health system with enclaves of high quality health facilities catering to foreign visitors. One area where significant synergies are possible lies in training and retaining of health personnel in both the public and private sectors. Creation of linkages between education and health care could generate greater economies of scale, improving both quality of health care for local populations as well as quality of medical education. The expansion of both the sectors could, in turn, encourage return migration of health professionals and also induce lower migration.
5.92 Improve data collection. Because of the dearth of information regarding the number, origin, expenditures, and characteristics of tourists who may be coming to the Caribbean for health and health-related services, a tracking system is necessary. This could be developed, implemented, and maintained either by CARICOM, with the support of PAHO/CPC and CDB or another appropriate regional agency such as the CTO. As part of this effort, it may be useful to establish a health tourism desk at the national level to collect and evaluate data.
5.93 Establish a system to address legal liabilities associated with treating foreign visitors. Consumers will have less of an incentive to go abroad for treatments if legal recourse is difficult. Given that obtaining malpractice insurance through US-based firms may be prohibitively expensive for Caribbean-based medical practitioners, another option would for CAMC to explore developing liability and malpractice up to an international standard within the Caribbean.
5.94 Strengthen marketing of health tourism. In this, the Caribbean might be informed by the experiences of other countries, particularly from Apollo Health Services in India, which caters to both national and international consumers.
119
Chapter 6 Improving Labor Markets to Support Growth and Employment
A. Introduction
6.1 The preceding analysis considers the growth trends in the Caribbean region over the past four decades, the contributing roles of the various sectors, and the competitive position of the Caribbean vis-à-vis the rest of the world. This chapter explores the links between growth and competitiveness on the one hand and employment creation on the other hand. Labor and the functioning of labor markets are key factors in boosting the economic growth and international competitiveness of a country’s production. Recent theoretical and empirical research emphasizes the critical role that human resources development (that is, the supply of skilled labor) plays in the process of growth and development. The ability of individuals to invest in human capital formation (especially education and training) and of firms to absorb such human resources at optimal levels of compensation are important to the expansion of productive capacity in a country. For small developing countries, like those in the Caribbean, the competitiveness of goods and services in international markets is critical to economic growth. The main issues this analysis seeks to understand are the degree to which Caribbean labor is competitive with other developing countries, how experience varies across the countries of the Caribbean, and whether the region is well-placed to compete in the global economy in the years ahead.
6.2 To address these issues, we need to examine the characteristics of the labor market by considering the types of jobs being created, the types of skills sought by employers and available in the labor market, the characteristics of those workers left behind, and how labor market institutions aid or impede competitiveness. This chapter assesses labor demand from the perspectives of sector, education, skill, wage policies, and productivity, which will shed light on the employment-productivity-growth linkages. This is complemented by an assessment of the characteristics of labor supply and the functioning of the labor market, including the extent and nature of unemployment and migration. Because institutional and other non-economic factors contribute to the ability of the labor market to fulfill its role in enhancing economic growth and welfare, this report also examines labor legislation and the role of trade unions (in this chapter), and educational and training policies and the institutional environment supporting technological change (in Chapter 7), all crucial to the functioning of the labor market and the pay-off for growth. Taken together, these components tell a story of the strengths and weaknesses of Caribbean labor and labor markets, providing a better understanding of labor competitiveness in the past and prospects for the future.144
6.3 The empirical analysis undertaken in this chapter examines various aspects of the Caribbean labor market using data from the period 1990-2003. One of the challenges associated with labor market analysis in the Caribbean and elsewhere is the incomplete and sometimes inconsistent nature of the data, and this data gap needs to be addressed at the national and regional levels. Only Barbados, Dominican Republic, Jamaica, Trinidad and Tobago and, to a lesser extent, the Bahamas, Belize, Suriname and St. Lucia, have collected data on the labor force, employment and unemployment on a consistent basis over the past 2-3 decades. These countries have instituted regular formal labor force surveys. Labor market data for the other countries is obtained from population censuses and special one-off labor force surveys. Data on wages, salaries and earnings are generally difficult to obtain on a consistent basis. In this chapter, we utilize micro-level labor force survey data where available – namely for Barbados, Dominican Republic, Guyana, Jamaica, St. Lucia, and Trinidad and Tobago – to gain greater insight into the determinants of wages, and the characteristics of labor force participation and unemployment. Although this analysis attempts to draw conclusions for the Caribbean region as a whole,
144 This chapter draws from background papers by Andrew Downes (2004), Elizabeth Thomas-Hope (2004) and Lawrence Nurse (2004).
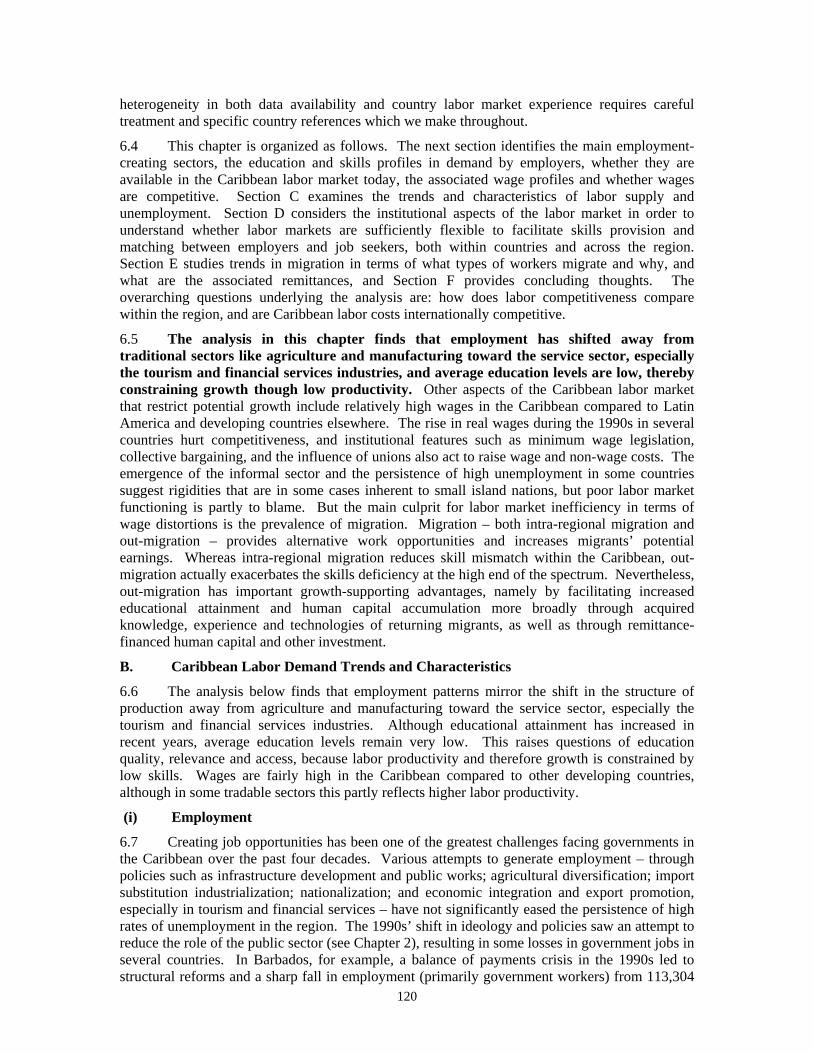
120
heterogeneity in both data availability and country labor market experience requires careful treatment and specific country references which we make throughout.
6.4 This chapter is organized as follows. The next section identifies the main employment-creating sectors, the education and skills profiles in demand by employers, whether they are available in the Caribbean labor market today, the associated wage profiles and whether wages are competitive. Section C examines the trends and characteristics of labor supply and unemployment. Section D considers the institutional aspects of the labor market in order to understand whether labor markets are sufficiently flexible to facilitate skills provision and matching between employers and job seekers, both within countries and across the region. Section E studies trends in migration in terms of what types of workers migrate and why, and what are the associated remittances, and Section F provides concluding thoughts. The overarching questions underlying the analysis are: how does labor competitiveness compare within the region, and are Caribbean labor costs internationally competitive.
6.5 The analysis in this chapter finds that employment has shifted away from traditional sectors like agriculture and manufacturing toward the service sector, especially the tourism and financial services industries, and average education levels are low, thereby constraining growth though low productivity. Other aspects of the Caribbean labor market that restrict potential growth include relatively high wages in the Caribbean compared to Latin America and developing countries elsewhere. The rise in real wages during the 1990s in several countries hurt competitiveness, and institutional features such as minimum wage legislation, collective bargaining, and the influence of unions also act to raise wage and non-wage costs. The emergence of the informal sector and the persistence of high unemployment in some countries suggest rigidities that are in some cases inherent to small island nations, but poor labor market functioning is partly to blame. But the main culprit for labor market inefficiency in terms of wage distortions is the prevalence of migration. Migration – both intra-regional migration and out-migration – provides alternative work opportunities and increases migrants’ potential earnings. Whereas intra-regional migration reduces skill mismatch within the Caribbean, out-migration actually exacerbates the skills deficiency at the high end of the spectrum. Nevertheless, out-migration has important growth-supporting advantages, namely by facilitating increased educational attainment and human capital accumulation more broadly through acquired knowledge, experience and technologies of returning migrants, as well as through remittance-financed human capital and other investment.
B. Caribbean Labor Demand Trends and Characteristics
6.6 The analysis below finds that employment patterns mirror the shift in the structure of production away from agriculture and manufacturing toward the service sector, especially the tourism and financial services industries. Although educational attainment has increased in recent years, average education levels remain very low. This raises questions of education quality, relevance and access, because labor productivity and therefore growth is constrained by low skills. Wages are fairly high in the Caribbean compared to other developing countries, although in some tradable sectors this partly reflects higher labor productivity.
(i) Employment
6.7 Creating job opportunities has been one of the greatest challenges facing governments in the Caribbean over the past four decades. Various attempts to generate employment – through policies such as infrastructure development and public works; agricultural diversification; import substitution industrialization; nationalization; and economic integration and export promotion, especially in tourism and financial services – have not significantly eased the persistence of high rates of unemployment in the region. The 1990s’ shift in ideology and policies saw an attempt to reduce the role of the public sector (see Chapter 2), resulting in some losses in government jobs in several countries. In Barbados, for example, a balance of payments crisis in the 1990s led to structural reforms and a sharp fall in employment (primarily government workers) from 113,304
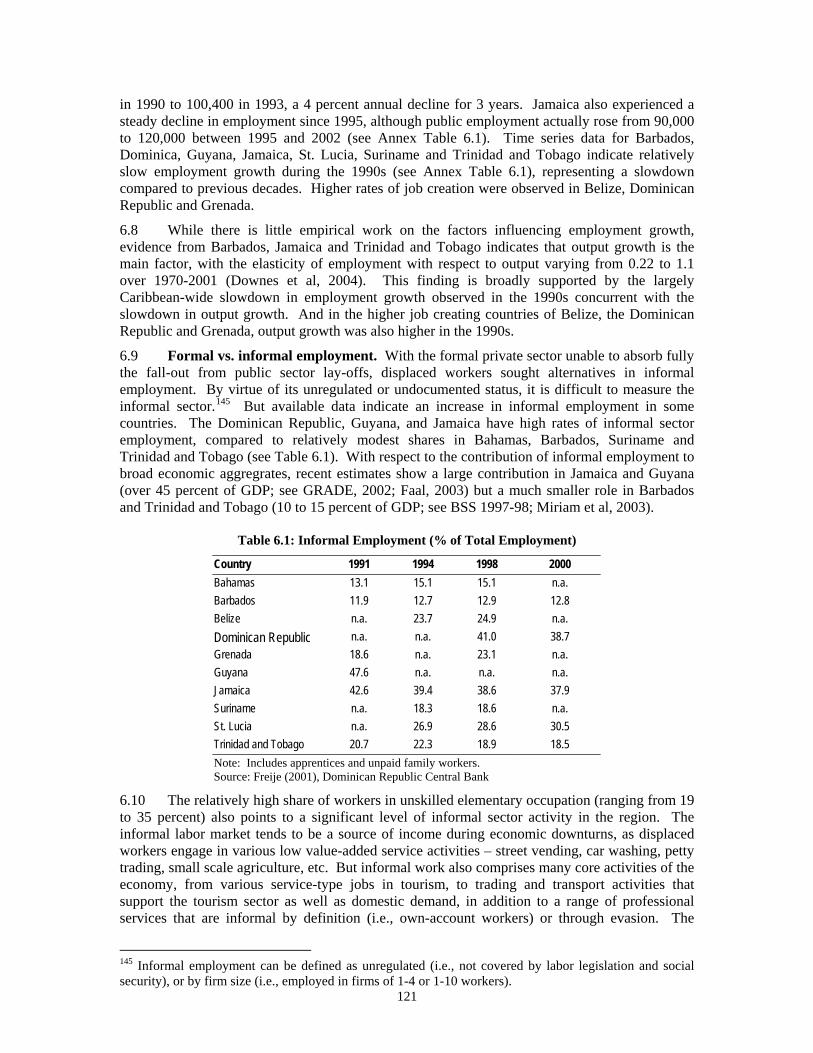
121
in 1990 to 100,400 in 1993, a 4 percent annual decline for 3 years. Jamaica also experienced a steady decline in employment since 1995, although public employment actually rose from 90,000 to 120,000 between 1995 and 2002 (see Annex Table 6.1). Time series data for Barbados, Dominica, Guyana, Jamaica, St. Lucia, Suriname and Trinidad and Tobago indicate relatively slow employment growth during the 1990s (see Annex Table 6.1), representing a slowdown compared to previous decades. Higher rates of job creation were observed in Belize, Dominican Republic and Grenada.
6.8 While there is little empirical work on the factors influencing employment growth, evidence from Barbados, Jamaica and Trinidad and Tobago indicates that output growth is the main factor, with the elasticity of employment with respect to output varying from 0.22 to 1.1 over 1970-2001 (Downes et al, 2004). This finding is broadly supported by the largely Caribbean-wide slowdown in employment growth observed in the 1990s concurrent with the slowdown in output growth. And in the higher job creating countries of Belize, the Dominican Republic and Grenada, output growth was also higher in the 1990s.
6.9 Formal vs. informal employment. With the formal private sector unable to absorb fully the fall-out from public sector lay-offs, displaced workers sought alternatives in informal employment. By virtue of its unregulated or undocumented status, it is difficult to measure the informal sector.145 But available data indicate an increase in informal employment in some countries. The Dominican Republic, Guyana, and Jamaica have high rates of informal sector employment, compared to relatively modest shares in Bahamas, Barbados, Suriname and Trinidad and Tobago (see Table 6.1). With respect to the contribution of informal employment to broad economic aggregrates, recent estimates show a large contribution in Jamaica and Guyana (over 45 percent of GDP; see GRADE, 2002; Faal, 2003) but a much smaller role in Barbados and Trinidad and Tobago (10 to 15 percent of GDP; see BSS 1997-98; Miriam et al, 2003).
Table 6.1: Informal Employment (% of Total Employment)
Country 1991 1994 1998 2000 Bahamas 13.1 15.1 15.1 n.a. Barbados 11.9 12.7 12.9 12.8 Belize n.a. 23.7 24.9 n.a. Dominican Republic n.a. n.a. 41.0 38.7 Grenada 18.6 n.a. 23.1 n.a. Guyana 47.6 n.a. n.a. n.a. Jamaica 42.6 39.4 38.6 37.9 Suriname n.a. 18.3 18.6 n.a. St. Lucia n.a. 26.9 28.6 30.5 Trinidad and Tobago 20.7 22.3 18.9 18.5 Note: Includes apprentices and unpaid family workers. Source: Freije (2001), Dominican Republic Central Bank
6.10 The relatively high share of workers in unskilled elementary occupation (ranging from 19 to 35 percent) also points to a significant level of informal sector activity in the region. The informal labor market tends to be a source of income during economic downturns, as displaced workers engage in various low value-added service activities – street vending, car washing, petty trading, small scale agriculture, etc. But informal work also comprises many core activities of the economy, from various service-type jobs in tourism, to trading and transport activities that support the tourism sector as well as domestic demand, in addition to a range of professional services that are informal by definition (i.e., own-account workers) or through evasion. The
145 Informal employment can be defined as unregulated (i.e., not covered by labor legislation and social security), or by firm size (i.e., employed in firms of 1-4 or 1-10 workers).
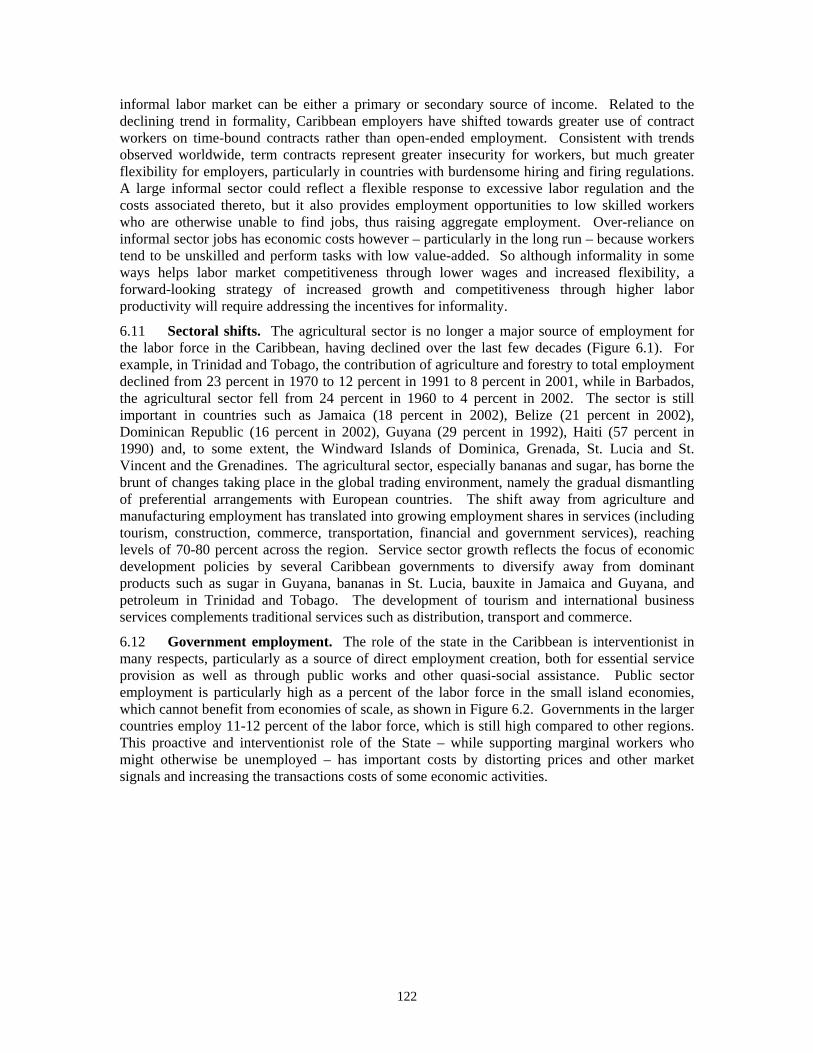
122
informal labor market can be either a primary or secondary source of income. Related to the declining trend in formality, Caribbean employers have shifted towards greater use of contract workers on time-bound contracts rather than open-ended employment. Consistent with trends observed worldwide, term contracts represent greater insecurity for workers, but much greater flexibility for employers, particularly in countries with burdensome hiring and firing regulations. A large informal sector could reflect a flexible response to excessive labor regulation and the costs associated thereto, but it also provides employment opportunities to low skilled workers who are otherwise unable to find jobs, thus raising aggregate employment. Over-reliance on informal sector jobs has economic costs however – particularly in the long run – because workers tend to be unskilled and perform tasks with low value-added. So although informality in some ways helps labor market competitiveness through lower wages and increased flexibility, a forward-looking strategy of increased growth and competitiveness through higher labor productivity will require addressing the incentives for informality.
6.11 Sectoral shifts. The agricultural sector is no longer a major source of employment for the labor force in the Caribbean, having declined over the last few decades (Figure 6.1). For example, in Trinidad and Tobago, the contribution of agriculture and forestry to total employment declined from 23 percent in 1970 to 12 percent in 1991 to 8 percent in 2001, while in Barbados, the agricultural sector fell from 24 percent in 1960 to 4 percent in 2002. The sector is still important in countries such as Jamaica (18 percent in 2002), Belize (21 percent in 2002), Dominican Republic (16 percent in 2002), Guyana (29 percent in 1992), Haiti (57 percent in 1990) and, to some extent, the Windward Islands of Dominica, Grenada, St. Lucia and St. Vincent and the Grenadines. The agricultural sector, especially bananas and sugar, has borne the brunt of changes taking place in the global trading environment, namely the gradual dismantling of preferential arrangements with European countries. The shift away from agriculture and manufacturing employment has translated into growing employment shares in services (including tourism, construction, commerce, transportation, financial and government services), reaching levels of 70-80 percent across the region. Service sector growth reflects the focus of economic development policies by several Caribbean governments to diversify away from dominant products such as sugar in Guyana, bananas in St. Lucia, bauxite in Jamaica and Guyana, and petroleum in Trinidad and Tobago. The development of tourism and international business services complements traditional services such as distribution, transport and commerce.
6.12 Government employment. The role of the state in the Caribbean is interventionist in many respects, particularly as a source of direct employment creation, both for essential service provision as well as through public works and other quasi-social assistance. Public sector employment is particularly high as a percent of the labor force in the small island economies, which cannot benefit from economies of scale, as shown in Figure 6.2. Governments in the larger countries employ 11-12 percent of the labor force, which is still high compared to other regions. This proactive and interventionist role of the State – while supporting marginal workers who might otherwise be unemployed – has important costs by distorting prices and other market signals and increasing the transactions costs of some economic activities.
123
Figure 6.1: Employment Share by Sector Figure 6.2: Public Employment (% of Labor Force)
0%10%20%30%40%50%60%70%80%90%
100%
Barb
ados
Beliz
e
Dom
inic
a
Dom
inic
anR
epub
lic
Gre
nada
Jam
aica
Surin
ame
St. L
ucia
Agriculture Manufacturing Services
Trin
idad
an
d To
bago
0%5%
10%15%20%25%30%35%
Antig
uaan
dBa
rbud
aSt
. Kitt
san
d N
evis
Dom
inic
a
Dom
inic
anR
epub
lic
Gre
nada
Jam
aica
St. L
ucia
St. V
ince
nt
and
the
Gre
nadi
nes
Source: IM F and World Bank (2005c). 6.13 Skill mix. Despite a general improvement in educational attainment in recent years, 75-90 percent of jobs are in mid- and low-level occupations. Figure 6.3 illustrates the education breakdown of employed workers in Dominica, Dominican Republic and St. Vincent and the Grenadines, where about 60 percent of the employed labor force has less than a secondary education, and only 9 percent of the employed in Dominica, 19 percent in Dominican Republic and 15 percent in St. Vincent and the Grenadines has some tertiary education. The cadre of professional, technical and managerial personnel is relatively small and more prone to migrate to meet excess demand for their skills in neighboring countries. Downes and Henry (1994) find that professional level occupations accounted for 61 percent of total work permits granted in Jamaica and 83 percent in Barbados during the 1996-97 period. As more women enter the labor market, we observe a rise in female employment in the traditional areas of clerical, sales and services, although there is evidence of increasing numbers of women working in professional, administrative and technical occupations, especially in Barbados, Dominican Republic, Jamaica and Trinidad and Tobago. Figure 6.3: Education Breakdown of Employment in Dominica, Dominican Republic and St. Vincent
and the Grenadines
0%10%20%30%40%50%60%70%80%90%
100%
Dominica DominicanRepublic
St. Vincent and theGrenadines
Tertiary
Vocational
Secondary
Primary
<Primary
Source: National labor force surveys
6.14 Welfare implications. The concentration of jobs in the lower end of the skills spectrum raises concerns about the quality of employment. Employment does not guarantee an escape from poverty, as persons engaged in low wage jobs may still be poor or vulnerable to shocks that could lead them back into poverty. The phenomenon of the ‘working poor’ – namely those whose labor income is inadequate to meet basic consumption needs – is evident in the region.
124
Available data indicates rates of 8.5 percent and 3.5 percent of total employment for Jamaica in 1986 and 1997, respectively, and rates of 11-14 percent in Trinidad and Tobago (Majid 2001). A recent review of the relationship between poverty and labor market status in the Caribbean (Barbados, Belize, Grenada, Guyana, Jamaica, St. Lucia, St. Vincent and the Grenadines and Trinidad and Tobago) observed the following features of the poverty-labor market nexus (Downes 2000a): the human capital base of the poor is low, resulting in low-skilled, low-paying jobs (elementary occupations, small-scale enterprises and informal sector activities); where poverty is concentrated in identifiable communities, including ethnic communities, there is some evidence of stigmatization which results in employment discrimination and labor segmentation; the seasonal pattern of production and employment (for example, in agriculture, tourism and construction) affects the degree of poverty in households; minimum wage legislation has been used to alleviate poverty in some countries, notably Jamaica, Trinidad and Tobago and Guyana; and individuals in poor households take advantage of migrant worker programs in the US and Canada, targeted to agriculture and hospitality sector jobs.
(ii) Wages and Productivity
6.15 The preceding analysis of the composition of employment and its evolution over time sheds light on the derived demand for labor. But labor demand is very much tied to wages, so it is essential to consider the level and evolution of real wages in the Caribbean, not only from the growth perspective but also from the angle of competitiveness. Nominal wages in many countries of the region generally rose faster than inflation during the 1990s, effectively depressing the demand for labor through higher unit labor costs. On the other hand, real wage increases could reflect productivity gains in which increases in output/worker are remunerated with higher pay.
6.16 Although data constraints make it difficult to determine the relationship between wages, prices and productivity in the Caribbean, aggregate level data on wages, earnings and productivity in Barbados, Dominican Republic, Jamaica and Trinidad and Tobago enable this type of analysis. Downes (2004) concludes that real wages in Barbados, Jamaica and Trinidad and Tobago increased faster than labor productivity during the 1990s. In the Dominican Republic, real wages rose slightly faster than productivity during 1996-99, but fell thereafter while productivity increased (see Annex Figure 6.1; World Bank 2004e). These trends – with the exception of recent experience in the Dominican Republic – have implications for international price competitiveness; the observed increases in real unit labor cost (i.e., the ratio of the real wage to labor productivity) in the 1990s imply that Barbados, Jamaica and Trinidad and Tobago have lost competitiveness over the past decade, while the Dominican Republic actually improved its competitiveness, primarily in 2003 and 2004 as the result of a sharp currency depreciation.146
6.17 These findings suggest that wage adjustments are not driven by productivity but rather by other pressures, namely expectations linked to inflation. Nominal wage increases in the Caribbean are largely set within the collective bargaining process or via legislation in the form of minimum wages for certain occupational categories or the country as a whole. For example, Barbados, Belize, Dominican Republic, Guyana, St. Kitts and Nevis, St. Lucia, and St. Vincent and the Grenadines have minimum wages for certain categories or sectors of workers, while Jamaica and Trinidad and Tobago have a national minimum wage in place. Where workers are not effectively covered by collective bargaining agreements or minimum wages, internal labor market rules (i.e., supply and demand) dictate wages. Within the Caribbean, some governments set the tone for wage increases by settling wage negotiations ahead of private enterprises, effectively setting wages for the country as a whole. And given that in several Caribbean countries the public sector wage premium is positive (discussed further below), this form of
146 Downes and Leon (1994) found some evidence that in Barbados during 1955-1990, labor productivity changes were the main determinants of real wage increases: a one percent increase in labor productivity resulted in a 0.27 percent increase in real wages.
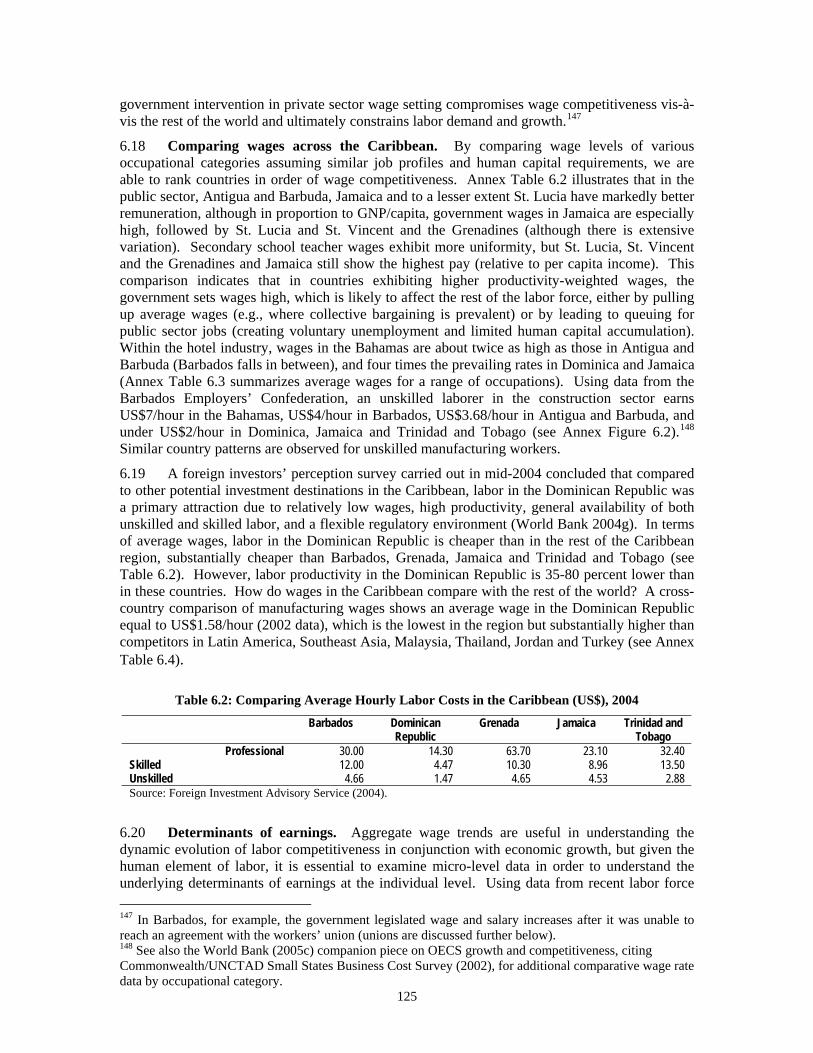
125
government intervention in private sector wage setting compromises wage competitiveness vis-à-vis the rest of the world and ultimately constrains labor demand and growth.147
6.18 Comparing wages across the Caribbean. By comparing wage levels of various occupational categories assuming similar job profiles and human capital requirements, we are able to rank countries in order of wage competitiveness. Annex Table 6.2 illustrates that in the public sector, Antigua and Barbuda, Jamaica and to a lesser extent St. Lucia have markedly better remuneration, although in proportion to GNP/capita, government wages in Jamaica are especially high, followed by St. Lucia and St. Vincent and the Grenadines (although there is extensive variation). Secondary school teacher wages exhibit more uniformity, but St. Lucia, St. Vincent and the Grenadines and Jamaica still show the highest pay (relative to per capita income). This comparison indicates that in countries exhibiting higher productivity-weighted wages, the government sets wages high, which is likely to affect the rest of the labor force, either by pulling up average wages (e.g., where collective bargaining is prevalent) or by leading to queuing for public sector jobs (creating voluntary unemployment and limited human capital accumulation). Within the hotel industry, wages in the Bahamas are about twice as high as those in Antigua and Barbuda (Barbados falls in between), and four times the prevailing rates in Dominica and Jamaica (Annex Table 6.3 summarizes average wages for a range of occupations). Using data from the Barbados Employers’ Confederation, an unskilled laborer in the construction sector earns US$7/hour in the Bahamas, US$4/hour in Barbados, US$3.68/hour in Antigua and Barbuda, and under US$2/hour in Dominica, Jamaica and Trinidad and Tobago (see Annex Figure 6.2).148 Similar country patterns are observed for unskilled manufacturing workers.
6.19 A foreign investors’ perception survey carried out in mid-2004 concluded that compared to other potential investment destinations in the Caribbean, labor in the Dominican Republic was a primary attraction due to relatively low wages, high productivity, general availability of both unskilled and skilled labor, and a flexible regulatory environment (World Bank 2004g). In terms of average wages, labor in the Dominican Republic is cheaper than in the rest of the Caribbean region, substantially cheaper than Barbados, Grenada, Jamaica and Trinidad and Tobago (see Table 6.2). However, labor productivity in the Dominican Republic is 35-80 percent lower than in these countries. How do wages in the Caribbean compare with the rest of the world? A cross-country comparison of manufacturing wages shows an average wage in the Dominican Republic equal to US$1.58/hour (2002 data), which is the lowest in the region but substantially higher than competitors in Latin America, Southeast Asia, Malaysia, Thailand, Jordan and Turkey (see Annex Table 6.4).
Table 6.2: Comparing Average Hourly Labor Costs in the Caribbean (US$), 2004
Barbados Dominican Republic
Grenada Jamaica Trinidad and Tobago
Professional 30.00 14.30 63.70 23.10 32.40 Skilled 12.00 4.47 10.30 8.96 13.50 Unskilled 4.66 1.47 4.65 4.53 2.88 Source: Foreign Investment Advisory Service (2004).
6.20 Determinants of earnings. Aggregate wage trends are useful in understanding the dynamic evolution of labor competitiveness in conjunction with economic growth, but given the human element of labor, it is essential to examine micro-level data in order to understand the underlying determinants of earnings at the individual level. Using data from recent labor force 147 In Barbados, for example, the government legislated wage and salary increases after it was unable to reach an agreement with the workers’ union (unions are discussed further below). 148 See also the World Bank (2005c) companion piece on OECS growth and competitiveness, citing Commonwealth/UNCTAD Small States Business Cost Survey (2002), for additional comparative wage rate data by occupational category.
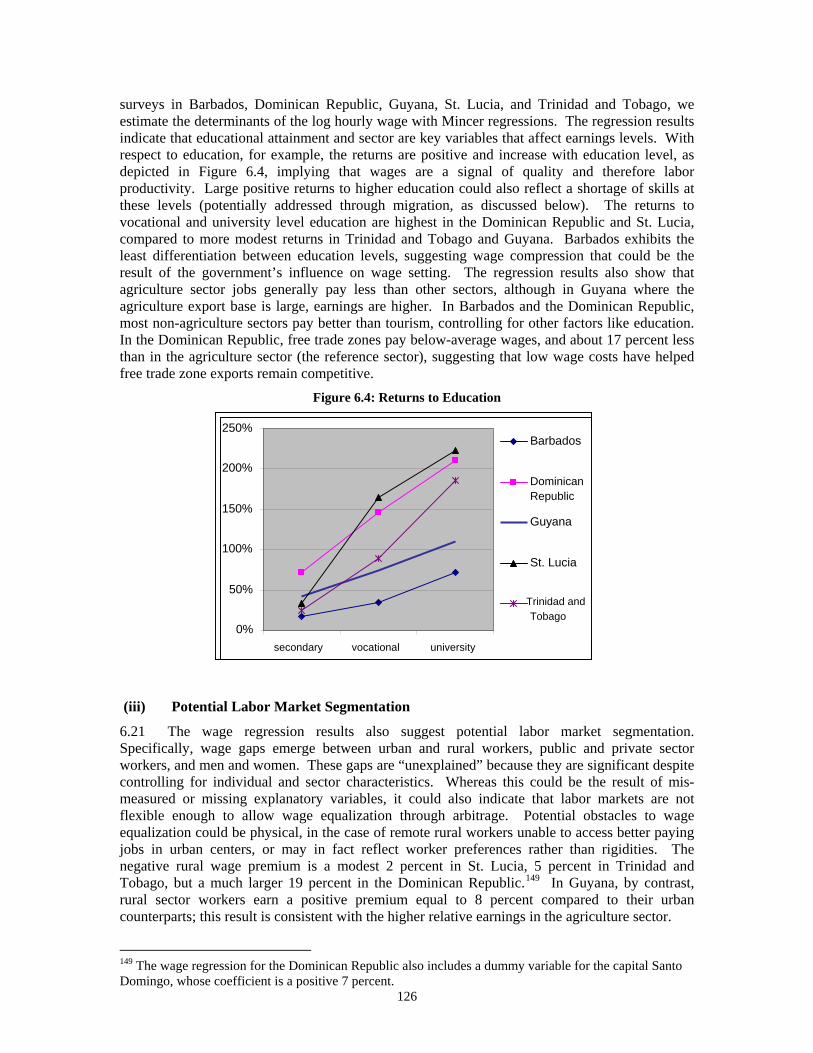
126
surveys in Barbados, Dominican Republic, Guyana, St. Lucia, and Trinidad and Tobago, we estimate the determinants of the log hourly wage with Mincer regressions. The regression results indicate that educational attainment and sector are key variables that affect earnings levels. With respect to education, for example, the returns are positive and increase with education level, as depicted in Figure 6.4, implying that wages are a signal of quality and therefore labor productivity. Large positive returns to higher education could also reflect a shortage of skills at these levels (potentially addressed through migration, as discussed below). The returns to vocational and university level education are highest in the Dominican Republic and St. Lucia, compared to more modest returns in Trinidad and Tobago and Guyana. Barbados exhibits the least differentiation between education levels, suggesting wage compression that could be the result of the government’s influence on wage setting. The regression results also show that agriculture sector jobs generally pay less than other sectors, although in Guyana where the agriculture export base is large, earnings are higher. In Barbados and the Dominican Republic, most non-agriculture sectors pay better than tourism, controlling for other factors like education. In the Dominican Republic, free trade zones pay below-average wages, and about 17 percent less than in the agriculture sector (the reference sector), suggesting that low wage costs have helped free trade zone exports remain competitive.
Figure 6.4: Returns to Education
(iii) Potential Labor Market Segmentation
6.21 The wage regression results also suggest potential labor market segmentation. Specifically, wage gaps emerge between urban and rural workers, public and private sector workers, and men and women. These gaps are “unexplained” because they are significant despite controlling for individual and sector characteristics. Whereas this could be the result of mis-measured or missing explanatory variables, it could also indicate that labor markets are not flexible enough to allow wage equalization through arbitrage. Potential obstacles to wage equalization could be physical, in the case of remote rural workers unable to access better paying jobs in urban centers, or may in fact reflect worker preferences rather than rigidities. The negative rural wage premium is a modest 2 percent in St. Lucia, 5 percent in Trinidad and Tobago, but a much larger 19 percent in the Dominican Republic.149 In Guyana, by contrast, rural sector workers earn a positive premium equal to 8 percent compared to their urban counterparts; this result is consistent with the higher relative earnings in the agriculture sector.
149 The wage regression for the Dominican Republic also includes a dummy variable for the capital Santo Domingo, whose coefficient is a positive 7 percent.
0%
50%
100%
150%
200%
250%
secondary vocational university
Barbados
DominicanRepublic
Guyana
St. Lucia
Trinidad and Tobago
127
6.22 Alternatively, wage gaps could be the result of discrimination in pay policies. As discussed above, Caribbean employment is characterized by a large public sector and an interventionist approach by the Government to wage setting. Several countries in the Caribbean exhibit a positive public sector wage premium, controlling for individual characteristics such as education and sector, which explains why workers prefer public to private sector jobs and may queue for civil service openings, possibly working in interim or informal activities during this wait period or remaining unemployed. The magnitude of the public sector wage premium – which reflects the degree to which public pay policies are distorted and/or the separate labor supply behavior vis-à-vis the public and private sectors – ranges from 12 percent in St. Lucia, to 27 percent in Barbados, to a remarkable 37 percent in Trinidad and Tobago. Not all government workers in the Caribbean earn above-average wages however: both Dominican Republic and Guyana exhibit a negative public sector wage premium of around 11-12 percent. The gender wage gap observed in the Caribbean may reflect inaccurate measurement of women’s actual work experience (i.e., not adequately accounting for women’s time out of the labor force), although it could also imply explicit wage discrimination. The influx of women into the labor market could have depressed wages for women, but it should have depressed men’s wages as well, assuming that men and women are not strictly confined to separate occupations. Nevertheless we observe gender trends tied to sectors and occupations; women still dominate traditional occupations such as clerical, service and sales workers (despite rising educational attainment), while males work primarily in elementary, professional, craft, construction and assembly occupations. But the unexplained gender wage gap already controls for sector- and occupation-specific effects. The negative wage premium for women in the Caribbean hovers between 23 and 28 percent, and is slightly lower in the Dominican Republic (18 percent).150
6.23 Caribbean labor markets have been described in the literature as being segmented or composed of distinct sectors (see Anderson 1987; Doeringer 1988; Panton 1993). Anderson (1987) notes differences in the age structure of various segments of the labor market, with the formal primary, central government and secondary sectors being dominated by better educated workers under age 40, while the informal sector consists of older, less educated persons. World Bank (1994) provides evidence of labor market segmentation in Trinidad and Tobago, where workers in unionized firms in the manufacturing sector earned over twice as much per hour as workers in non-unionized firms, average wages in the public sector were higher than in the private and informal sectors, compensation at the higher professional levels in the public sector was lower than in the private sector, but at lower levels, wages were higher than in the private sector, urban wages were generally higher than in rural areas, and males were paid more than females in the same occupational class. The segmentation observed in Caribbean labor markets – most strikingly in terms of public-private segmentation – suggests inefficient wage setting, where rigidities constrain the potential for arbitrage, thus keeping wages unnecessarily high. But the available data do not permit us to draw solid conclusions as to whether distorted pay policies – including government wage setting – are the main drivers of high unemployment in the Caribbean rather than structural issues such as migration-induced voluntary unemployment, for example (discussed below).
C. Labor Supply and Mismatch
6.24 Despite the recent influx of women, the Caribbean labor force has grown slowly and is characterized by low education levels, thus constraining labor productivity. Skills mismatch and other labor market inefficiencies – including distorted wage setting – have led to high unemployment, hurting Caribbean competitiveness and limiting future growth prospects.
150 In Trinidad and Tobago, the regression estimated male-female wage gap was 18 percent in 1992, compared to 25 percent in 1997, indicating a significant rise in discrimination.
128
(i) Characteristics of the Labor Market
6.25 Using the data available, Caribbean countries exhibited relatively low rates of population and labor force growth over the period 1996-2002 (see Annex Figure 6.3). With the exception of Belize, Haiti, Dominican Republic, St. Lucia and St. Kitts and Nevis, the population growth rates averaged less than 1 percent per year. Analyzing population distribution by age group provides some evidence of the ageing of the population over the past four decades. In this period of steady or slightly declining labor force participation among Caribbean men, women entered the labor force at increasing rates since 1990. For example, in Barbados, the female labor force participation rate rose from 60 percent in 1990 to 64 percent in 2002, while the male rate remained steady at 76 percent. In Trinidad and Tobago, female participation rose from 42 percent in 1991 to 47 percent in 1999, compared to 75 percent for men in both periods. Jamaica recorded a decline in both rates over the 1991-2000 period: the male rate declined from 75 percent to 73 percent while the female rate fell from 62 to 54 percent. Belize and Dominican Republic recorded relatively low, but increasing, female participation rates (less than 40 percent) and relatively high but constant, male participation rates during the 1990s. Female participation rates in St. Lucia were relatively high and increasing during the 1990s (62 percent in 1999) while the male rates declined slightly. The evidence suggests that although labor markets have been male-oriented in nature, the rise in female participation can be attributed to: improved educational and training opportunities; the expansion of activities in selected areas of the economy providing employment for females (e.g., information services, banking and financial services, tourism, and free trade zones); the self-actualization of women and the drive for financial independence; the decline in fertility rates and average household size; and the establishment of day-care services and the increase in modern household production technology and services, which helped to release women from traditional household production activities.
6.26 The education patterns of the labor force indicate a general increase in the formal educational base. There are however significant skill deficiencies in the Caribbean labor market. For example, over 70 percent of the Jamaican population report no formal educational qualification (2001 data). In Barbados, which requires compulsory education up to 17 years of age, approximately 63 percent of the adult population had no certification in 1990, declining to 57 percent by 2000. In the Dominican Republic, 10 percent of adults report no education, and 60 percent have a primary education or less (2003 data). Past policies that focus on skills deficiency include: requiring school attendance up to age 17, as in Barbados; expanding resources and access to primary education, as in the Dominican Republic; establishing various technical and vocational education programs (HEART in Jamaica, SERVOL in Trinidad and Tobago); and skills training programs in Barbados, St. Lucia, Dominican Republic and Grenada (Downes 2000; Lochan 2000). Available survey evidence for Barbados, Dominican Republic and Jamaica indicates that employers also undertake significant on-the-job training in order to overcome the problems associated with the skill deficiencies of new and incumbent employees. Whereas skill formation is important, longer-term strategic investment in labor quality and productivity to support competitiveness and growth should focus on education (Chapter 7 contains additional discussion).
6.27 Many of the labor supply characteristics described above using aggregate level data are corroborated by micro-level analysis on the determinants of labor force participation using probabalistic regression techniques (e.g., Probits; results are summarized in Annex Table 6.5). Many factors influence the decision to enter the labor market, including: age, education level, household size, gender, marital status and other socio-economic elements. The probability of entering the labor market increases with age (in a quadratic relationship), although there are gender differences, as women tend to take time out of the workforce for childbearing. Other gender differences emerge with respect to marital status: married men are more likely than their single counterparts to be in the labor market, but married women in Dominican Republic, Guyana and Trinidad and Tobago are less likely to work (the results are insignificant in the other
129
countries). With respect to education, men at the lower and higher ends of the education spectrum are more likely to enter the labor force, with slightly lower entry rates for men with post-university education. Women, by contrast, have highest participation among those with at least a university education. Rural women in Guyana are more likely to enter, while they are less likely in Dominican Republic and St. Lucia. Household size and dependency ratio do not seem to affect the likelihood of entering the labor force, but household headship affects women’s participation (namely, women in female-headed households are more like to be in the labor market). Finally, the regression results for St. Lucia and Dominican Republic indicate that members of households that receive remittances from abroad are less likely to enter the labor force.
(ii) Labor Market Efficiency and Unemployment
6.28 The term “matching” refers to the process of bringing together job seekers and employers – in other words matching supply and demand. A shortfall in demand results in unemployment, which reflects a degree of inefficiency in the functioning of the labor market and creates significant economic costs. Most fundamentally, unemployed workers do not contribute to national production, thereby limiting GDP growth. Therefore, when high distorted wages reduce labor demand, the resulting unemployment reduces growth. If unemployment arises from a mismatch in skills demanded by employers and those supplied by job seekers, then firms are unable to acquire the necessary inputs to be competitive and must settle for a sub-optimal skill mix. Unemployment can also result from a mismatch between expectations of school leavers and the realities of the job market. And finally, poor job matching due to lack of information or other obstacles in the job search/hiring processes that inhibit employers and workers from finding each other increases search costs for both employers and workers, which also hurts competitiveness.151
6.29 Unemployment is one of the most challenging economic problems facing the Caribbean.152 The volatility in unemployment rates reflects both economic shocks as well as long-run growth trends observed in each country. Unemployment fluctuated widely within countries during the 1990s (as shown in Annex Table 6.6), although there is a general trend of declining unemployment.153 For instance, the unemployment rate in Barbados fluctuated from a high of 24 percent in 1993 to 9 percent in 2000, while in Trinidad and Tobago, unemployment fell from 20 percent in 1990 to 11 percent in 2001. Unemployment was relatively stable in Jamaica, hovering around 15-16 percent. Among OECS countries, Grenada and Dominica had periods of very high unemployment (29 percent and 23 percent, respectively), and despite improvement elsewhere, St. Lucia continues to register high rates of unemployment of around 20 percent.
6.30 High unemployment in the Caribbean reflects a combination of pressures, including the underdevelopment of the skills, knowledge and talent of the labor force – i.e., weaknesses in the education and training systems – and, to a lesser degree, the underutilization of human capacity, for example in the commerce and tourism sectors.154 The contraction in the agriculture and manufacturing sectors and the concurrent shift toward 151 The hiring processes required of employers in the Caribbean are not particularly burdensome. Moreover, the small size of most countries means that identifying job openings and potential candidates is relatively easy, although this also introduces risks of cronyism which could lead to sub-optimal matching and therefore lower productivity. 152 It is important to clarify the specific definition of unemployment we have in mind. Most of the Caribbean countries define unemployment consistent with the ILO definition, which requires active job search over a certain reference period (Jamaica is an exception); in the Caribbean, this period ranges from the survey week to 3 months prior to the survey. See Annex 6.1 for comprehensive discussion. 153 The concurrent slowdown in job creation implies slower labor force growth as more workers remain outside the labor force, many while queuing for good jobs, either at home or abroad. 154 Underutilization of skills is not widely supported by the data which indicate generally low educational attainment and inadequate supply of workers in professional and technical occupations.
130
services implies a radical change in the skills needed in the new service-oriented economy. In the Windward Islands, for example, the decline in the fortunes of the banana industry drove up unemployment in Dominica and St. Lucia in particular. But because labor as a factor input has a human element, workers cannot immediately acquire the necessary human capital appropriate to jobs in tourism, commerce, financial services and construction, for example. This paradigm shift caught many workers off-guard, as displaced agriculture and manufacturing workers had to scramble to find alternative employment (many went into unskilled jobs in the service industries). There is also a disconnect between education curricula and skills demand in the private sector, which was exacerbated by the economic shift, given that formal education systems are slow to change. Technical and vocational education programs and skills training for those already in the labor market play a potentially central role in enabling human capital accumulation in specialties better suited to the demands of the modern economy, although even these can be slow to respond to changes in employer demands. Open unemployment is also explained by structural factors such as the increasing use of modern labor-saving techniques in the production process, the permanent shift in the demand for goods and services, including higher local demand for imported goods, and significant downsizing in some countries arising from public sector restructurings (in Barbados, for example, the unemployment rate exceeded 24 percent during the implementation of a structural adjustment program during the 1990s).
6.31 Characteristics of the unemployed. The characteristics of the unemployed are similar across the region. The unemployed tend to be young, disproportionately female, and poorly educated. High levels of open urban unemployment prevail in the larger countries (Jamaica, Guyana, Dominican Republic, Trinidad and Tobago) while rural unemployment and underemployment exist in the OECS. The duration of unemployment is generally longer for women. Young people account for a very large share of the total unemployed population. For youth ages 20-24, the share ranges from 22 to 30 percent of total unemployment, and for those age 15-24, the share jumps to 40 to 56 percent of the total unemployment pool (Downes 2004). Youth unemployment rates in the Caribbean generally exceed 20 percent, with female youth unemployment varying between 30 and 45 percent in the 1990s.155 And even though male youth unemployment is lower than among females, it is still very high, and brings with it major social problems, with young males often being the victims as well as perpetrators of violent crime, and involved in drugs, both trafficking and consumption.
6.32 In most countries in the region, the female unemployment rate is higher than the male rate (as illustrated in Figure 6.5), with the exception of St. Kitts and Nevis and St. Vincent and the Grenadines. This reflects inadequate demand to absorb the influx of women into the labor market. An important feature of the unemployed is their low level of educational and training attainment compared to the employed. Unemployment tends to be low or non-existent among those with tertiary level or university education (except in the Dominican Republic). Professional, technical and managerial occupations exhibit low or zero levels of unemployment, reflecting the scarcity of skilled labor. The bulk of the unemployed generally report that their usual occupation is sales/clerical, elementary production or general production. Regression analysis of the likelihood of being unemployed in Barbados, Dominican Republic, Guyana, St. Lucia and Trinidad and Tobago corroborates these observations on the characteristics of unemployment (see Annex Table 6.7), namely that the likelihood of unemployment tends to increase with age in a quadratic relationship; education is a key element in the probability of
155 The ILO (1996) identifies the following determinants of youth unemployment in the Caribbean: inadequate aggregate demand to absorb new entrants to the labor market; inappropriate education and training which do not match the requirements of the workplace; lack of work experience when entering the labor market; absence of well-functioning vocational guidance and placement facilities; poor attitudes toward work and limited work aspirations; high reservation wages, particularly regarding low status jobs, leading to queuing for better paying jobs while being supported by family and friends; and reduced labor demand resulting from flexible contracts, multi-skilling and outsourcing.
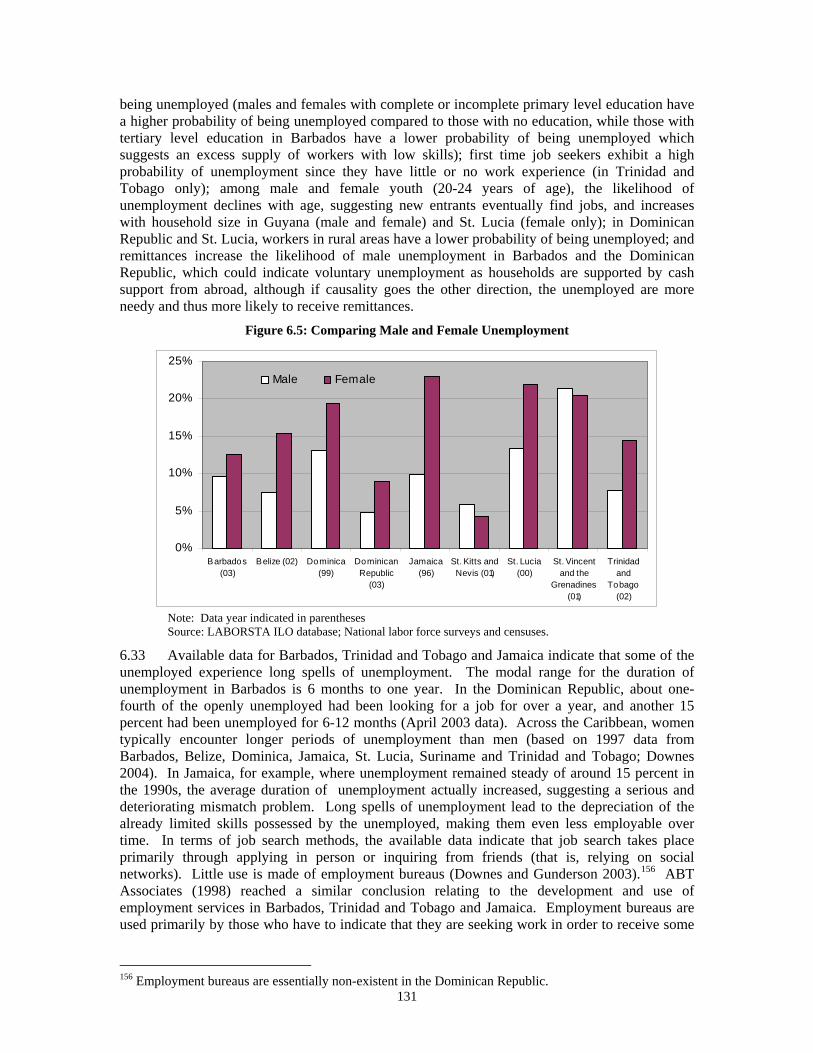
131
being unemployed (males and females with complete or incomplete primary level education have a higher probability of being unemployed compared to those with no education, while those with tertiary level education in Barbados have a lower probability of being unemployed which suggests an excess supply of workers with low skills); first time job seekers exhibit a high probability of unemployment since they have little or no work experience (in Trinidad and Tobago only); among male and female youth (20-24 years of age), the likelihood of unemployment declines with age, suggesting new entrants eventually find jobs, and increases with household size in Guyana (male and female) and St. Lucia (female only); in Dominican Republic and St. Lucia, workers in rural areas have a lower probability of being unemployed; and remittances increase the likelihood of male unemployment in Barbados and the Dominican Republic, which could indicate voluntary unemployment as households are supported by cash support from abroad, although if causality goes the other direction, the unemployed are more needy and thus more likely to receive remittances.
Figure 6.5: Comparing Male and Female Unemployment
0%
5%
10%
15%
20%
25%
Barbados(03)
Belize (02) Dominica(99)
DominicanRepublic
(03)
Jamaica(96)
St. Kitts andNevis (01)
St. Lucia(00)
St. Vincentand the
Grenadines(01)
Trinidadand
Tobago(02)
Male Female
Note: Data year indicated in parentheses Source: LABORSTA ILO database; National labor force surveys and censuses.
6.33 Available data for Barbados, Trinidad and Tobago and Jamaica indicate that some of the unemployed experience long spells of unemployment. The modal range for the duration of unemployment in Barbados is 6 months to one year. In the Dominican Republic, about one-fourth of the openly unemployed had been looking for a job for over a year, and another 15 percent had been unemployed for 6-12 months (April 2003 data). Across the Caribbean, women typically encounter longer periods of unemployment than men (based on 1997 data from Barbados, Belize, Dominica, Jamaica, St. Lucia, Suriname and Trinidad and Tobago; Downes 2004). In Jamaica, for example, where unemployment remained steady of around 15 percent in the 1990s, the average duration of unemployment actually increased, suggesting a serious and deteriorating mismatch problem. Long spells of unemployment lead to the depreciation of the already limited skills possessed by the unemployed, making them even less employable over time. In terms of job search methods, the available data indicate that job search takes place primarily through applying in person or inquiring from friends (that is, relying on social networks). Little use is made of employment bureaus (Downes and Gunderson 2003).156 ABT Associates (1998) reached a similar conclusion relating to the development and use of employment services in Barbados, Trinidad and Tobago and Jamaica. Employment bureaus are used primarily by those who have to indicate that they are seeking work in order to receive some
156 Employment bureaus are essentially non-existent in the Dominican Republic.
132
form of assistance (e.g., unemployment insurance) or who register to go on external labor programs.
6.34 Whereas the preceding analysis focuses on unemployment defined to include job search requirements, a comprehensive understanding of the nature of unemployment and labor supply decisions extends to consideration of discouraged workers as well, namely those who have effectively exited the labor force and no longer engage in job search. Recent research on the behavior of unemployed persons in Trinidad and Tobago concludes that the “chronically unemployed (i.e., discouraged workers) showed a consistent lack of up-to-date knowledge of the labor market, whereas those who were successful in finding employment did have this type of information, through ‘weak ties’ based on family and previously established labor market links” and “while affiliation with the formal economy could strengthen an individual’s position in the labor market, association with the informal sector did not seem to give any better advantages in finding employment” (p. 171 in Valtonen 2001). Strobl and Walsh (2003) and Strobl and Byrne (2002) examined job search strategies in Trinidad and Tobago, concluding that (i) for non-employed males, the decision of whether to search for a job is related to cyclical conditions, that is, in bad times more men are discouraged from actively seeking employment; (ii) the incidence of non-search among the non-employed has increased over time; and (iii) the concept of job search may not be meaningful or important for rural men because of the seasonality of work, the higher cost of job search due to the remoteness of rural areas, and the higher unemployment rate in the rural areas.
D. Labor Legislation and the Role of Unions
6.35 The persistence of high unemployment and growing informal employment observed across the Caribbean – and much of the world – suggests rigidities or potential obstacles to smooth matching of labor supply and demand. This section concludes that existing labor legislation and the influence of unions and the government in collective bargaining impede Caribbean competitiveness somewhat, but other structural issues, namely migration opportunities, have a much larger effect.
(i) Labor Laws and Legislation Effectiveness
6.36 Although labor legislation is not uniform across the Caribbean, there are broad similarities stemming from the nature of the social contract conceived by these former colonies, many in the British tradition. Extensive regulations in the national labor codes guide the rules of work (e.g., work hours, vacation), hiring (anti-discrimination), firing (lay-off criteria, advance notice period, severance pay), safety and protections (work place accidents, maternity leave), and worker representation and organization (freedom of association, dispute settlement and arbitration). Additional laws address pay through minimum wage rules. Caribbean countries started to join the International Labor Organization (ILO) in 1962, with members ratifying nearly all of the ILO’s fundamental conventions.157 Of a total 71 conventions, Guyana has ratified 45, Belize 42, Barbados 39, Dominican Republic 35 (see Annex Table 6.8 for a complete table). With the exception of Belize, Guyana and Suriname, there has been less success with the ratification of essential labor administration conventions. Many of these conventions have given rise to various forms of national labor legislation aimed at enforcing these conventions (see Annex Table 6.9).
6.37 Measuring and comparing the extent of labor regulation across countries is challenging, and past attempts to construct indices of labor rigidity have generated conflicting results. For example, the index of labor market rigidity developed by Rama (1995) indicates that Caribbean countries exhibit a lower degree of labor market rigidity and employment protection than Latin
157 The fundamental ILO conventions are: forced labor (1930); freedom of association and the right to organize (1998); right to organize and collective bargaining (1949); equal remuneration (1958); minimum age (1973) and the worst forms of child labor (1999).
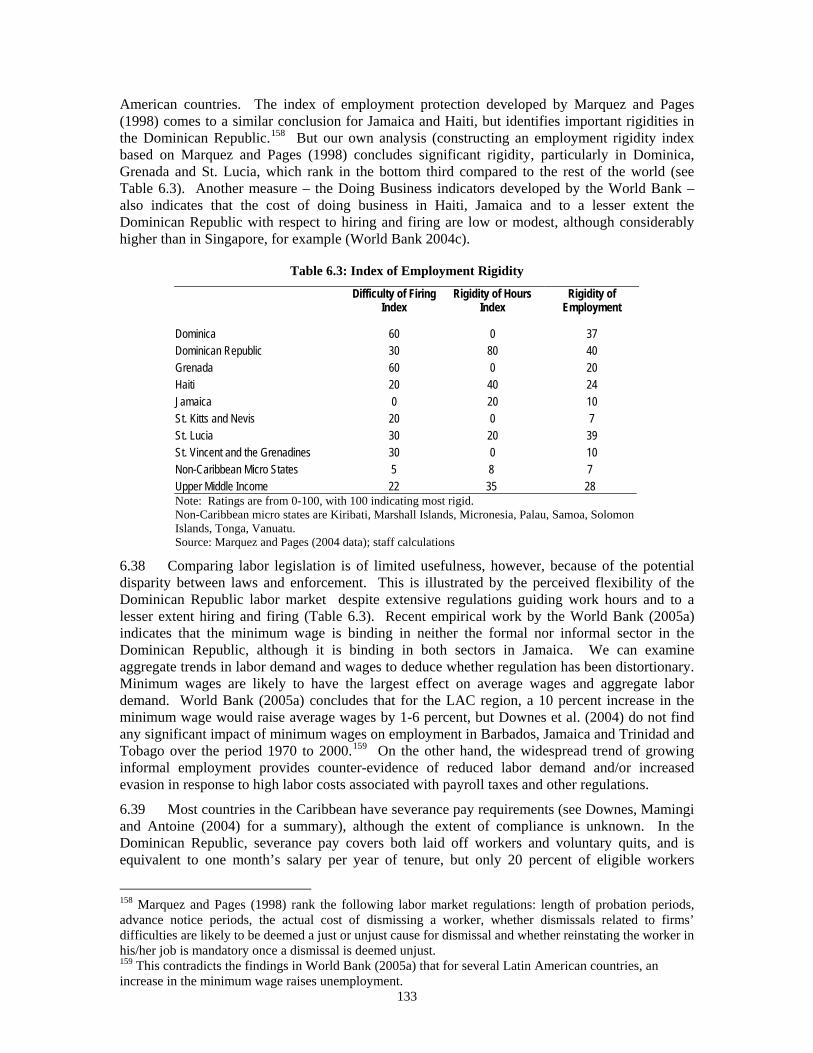
133
American countries. The index of employment protection developed by Marquez and Pages (1998) comes to a similar conclusion for Jamaica and Haiti, but identifies important rigidities in the Dominican Republic.158 But our own analysis (constructing an employment rigidity index based on Marquez and Pages (1998) concludes significant rigidity, particularly in Dominica, Grenada and St. Lucia, which rank in the bottom third compared to the rest of the world (see Table 6.3). Another measure – the Doing Business indicators developed by the World Bank – also indicates that the cost of doing business in Haiti, Jamaica and to a lesser extent the Dominican Republic with respect to hiring and firing are low or modest, although considerably higher than in Singapore, for example (World Bank 2004c).
Table 6.3: Index of Employment Rigidity
Difficulty of Firing Index
Rigidity of Hours Index
Rigidity of Employment
Dominica 60 0 37 Dominican Republic 30 80 40 Grenada 60 0 20 Haiti 20 40 24 Jamaica 0 20 10 St. Kitts and Nevis 20 0 7 St. Lucia 30 20 39 St. Vincent and the Grenadines 30 0 10 Non-Caribbean Micro States 5 8 7 Upper Middle Income 22 35 28 Note: Ratings are from 0-100, with 100 indicating most rigid. Non-Caribbean micro states are Kiribati, Marshall Islands, Micronesia, Palau, Samoa, Solomon Islands, Tonga, Vanuatu. Source: Marquez and Pages (2004 data); staff calculations
6.38 Comparing labor legislation is of limited usefulness, however, because of the potential disparity between laws and enforcement. This is illustrated by the perceived flexibility of the Dominican Republic labor market despite extensive regulations guiding work hours and to a lesser extent hiring and firing (Table 6.3). Recent empirical work by the World Bank (2005a) indicates that the minimum wage is binding in neither the formal nor informal sector in the Dominican Republic, although it is binding in both sectors in Jamaica. We can examine aggregate trends in labor demand and wages to deduce whether regulation has been distortionary. Minimum wages are likely to have the largest effect on average wages and aggregate labor demand. World Bank (2005a) concludes that for the LAC region, a 10 percent increase in the minimum wage would raise average wages by 1-6 percent, but Downes et al. (2004) do not find any significant impact of minimum wages on employment in Barbados, Jamaica and Trinidad and Tobago over the period 1970 to 2000.159 On the other hand, the widespread trend of growing informal employment provides counter-evidence of reduced labor demand and/or increased evasion in response to high labor costs associated with payroll taxes and other regulations.
6.39 Most countries in the Caribbean have severance pay requirements (see Downes, Mamingi and Antoine (2004) for a summary), although the extent of compliance is unknown. In the Dominican Republic, severance pay covers both laid off workers and voluntary quits, and is equivalent to one month’s salary per year of tenure, but only 20 percent of eligible workers
158 Marquez and Pages (1998) rank the following labor market regulations: length of probation periods, advance notice periods, the actual cost of dismissing a worker, whether dismissals related to firms’ difficulties are likely to be deemed a just or unjust cause for dismissal and whether reinstating the worker in his/her job is mandatory once a dismissal is deemed unjust. 159 This contradicts the findings in World Bank (2005a) that for several Latin American countries, an increase in the minimum wage raises unemployment.
134
actually received payment from employers in 2003. A new social security law in the early stages of implementation includes provisions for unemployment assistance, but the question of whether employers are still required to pay severance remains in dispute. Only Barbados has an unemployment insurance scheme, which covers salaried workers between the ages of 16 and 64 years (excluding the self-employed and government employees) and is financed by payroll contributions (currently 3 percent of payroll).
(ii) Role of Unions in the Caribbean
6.40 Any discussion on labor regulation and labor market functioning must take account of the role of unions, particularly in the Caribbean where they have played a historic role and continue to influence the labor market today. Trade unionism was not a direct response to industrialization and workers’ discontent with economic conditions, as was the case in Europe and the US, but rather emerged in conjunction with the independence movements in the Caribbean. In fact, aspiring political leaders were attracted to unions as instruments to build the political base necessary to achieve the goal of independence. This led to the formation of indigenous political parties and general workers’ unions linked to these parties. Following independence, unions not only were very strong but were integrally linked to the political parties in power and in the opposition. Even today, union ties reside both with the ruling and opposition parties throughout most of the Caribbean.160 Annex 6.2 contains more detail.
6.41 Through its mediating role between workers, employers and government, unions can be effective not only in improving working conditions and productivity (e.g., through worker safety and other protections) but also by creating industrial peace and stability, thereby helping employers achieve their business objectives. On the other hand, unions can be an impediment to efficient labor market functioning by raising wages above productivity considerations and representing the narrow interests of members to the detriment of workers in the larger labor market. For much of the 20th century, labor relations in the Caribbean were adversarial in nature, although there has been a shift toward consultation and collaboration with employers and government, largely in response to the challenges of globalization and the need for international competitiveness essential to survival.
6.42 Some unions have embraced social partnership and dialogue to help manage workplace relations in this new environment, with heightened concern over productivity and the development of productivity-based payment systems (see Box 6.1 for a discussion of the social protocol in Barbados). The grave fiscal situation in Jamaica led unions to enter into a Memorandum of Understanding with the Government in early 2004. These cooperative approaches are based on extensive information disclosure, trust, commitment to the consultative process, and taking a broader view of the objectives and potential gains. Economic developments and emerging labor market issues such as employment insecurity, contract flexibility, and significant inter-sectoral labor shifts challenge unions to address members’ concerns while sustaining labor demand and employment. In the last decade, wage bargaining has seen a moderation of wage demands, especially in ailing industries such as sugar in Barbados, and the time-span of collective agreements has also been shortened to reflect the uncertainty of the economic climate.
6.43 Although these developments denote a more flexible environment, union demands typically raise labor costs and diminish aggregate labor demand, hurting competitiveness and at the same time depressing total employment. And despite the availability of dispute avoidance procedures, strikes occur with some frequency in much of the Caribbean, reducing output and productivity (see Nurse 2004). Historically, Trinidad and Tobago and Jamaica have had a high incidence of strikes, although the number and severity have declined (see Annex 6.2
160 Dominican Republic is an exception: Dominican unions have a relatively small role and little leverage (with the exception of the transport workers and dock workers unions).
135
for a description of a recent episode). But union influence is dissipating. An important challenge facing unions in the 1990s and today is maintaining membership. Union membership worldwide has suffered in the past three decades.161 The Caribbean is no exception, driven in part by the employment shift away from traditionally unionized sectors such as manufacturing, as well as the perceived inability to garner adequate gains in terms of high wages and employment protection to justify membership.162 Nevertheless, despite falling memberships, unions still have an impact, since collective bargaining agreements apply sector-wide, regardless of union affiliation (as is the case for the hotel sector, for example). Moreover, an additional large share of the workforce is indirectly affected because their terms of employment are sensitive to wages and conditions of service in the unionized sectors (Fashoyin 2001).
6.44 The role of government as a major (and in many cases largest) employer is coupled with its regulatory function of creating the legal and institutional framework for industrial relations as well as its obligation to provide sound economic management. These multiple conflicting functions help explain the extent of the government’s influence in national labor policies, as described above, namely through its interventionist role in wage setting through collective bargaining with unions, which typically guides the outcomes of private sector collective bargaining agreements.
6.45 This assessment demonstrates that despite declining influence, unions in the Caribbean are still relevant to labor market conditions and wage-setting. Looking ahead to the challenges of competing in the globalizing economy, it will be crucial to build on some of the successful social pacts in the Caribbean with the aim of limiting the destructive pressures that unions – as well as Governments – can exert through higher labor costs unrelated to productivity, and instead foster consultative and productive tripartite dialogue that takes account of broader issues of competitiveness.
161 Between 1980 and 1990, trade union density in 35 countries fell by more than 20 percent, and half of a 92-country sample had union rates under 20 percent (Fairbrother and Griffin 2002). 162 Data on union membership is scarce and partial. In Trinidad and Tobago, where unionized sectors account for only a quarter of total employment, union membership among eight major trade unions fell from 119,000 in 1980 to only 66,000 in 1998 (14 percent of total employment) (Moonilal 1998). In Barbados, union density (i.e., membership/total employment) fell during the 1990s – exacerbated by layoffs in the public sector – to an estimated 34 percent in 2002. Union density also fell sharply in Jamaica and St. Vincent and the Grenadines, to 24 percent and less than 20 percent, respectively. Belize and St. Lucia have very low union density (6 and 13 percent respectively in 1997), while Dominica and Guyana are relatively highly unionized (with densities of 27 and 29 percent respectively in 1997).
Box 6.1: Barbados Protocol for the Implementation of a Prices and Incomes Policy
The structural adjustment program undertaken by the Government of Barbados in 1991 included a provision to freeze basic wages and salaries. Tripartite discussions between employers, unions and the Government led to the 1993 signing of the Protocol for the Implementation of a Prices and Incomes Policy, under which the signatories agreed to maintain a fixed exchange rate (BDS$2/US$), promote international competitiveness, improve productivity and efficiency, and raise wages only on the basis of performance, profit-sharing or productivity gains. The latter measure – although short-lived – represented a major shift from the historical wage bargaining focus on increasing the time rates of wages. The Protocol also created a framework to protect workers’ tenure and reduce labor disputes.
Three subsequent Protocols have been agreed – the latest of which was Protocol Four (2001-04) – giving rise to a Social Partnership and Social Compact aimed at jointly achieving industrial harmony and improving competitiveness through a very broad set of measures. Although collective bargaining is no longer solely productivity-linked, the Protocol has improved the industrial relations environment, evidenced by the fact that demand for conciliation services has fallen by half.
Source: Nurse (2004)
136
E. Intra-Regional and Extra-Regional Labor Mobility
6.46 Wage differentials between migrant sending and receiving countries and unmet labor demand exacerbated by small economic size create incentives for Caribbean workers to pursue more lucrative work opportunities outside their home countries. South-North and intra-regional migration have long been a feature of Caribbean labor markets and have had a mixed effect on labor market efficiency and labor competitiveness. Promoting intra-regional labor market integration through increased labor mobility within the Caribbean would improve skills matching and wage arbitrage. The flip side of migration includes skills loss in the short run through brain-drain, but this negative effect is offset by large remittance inflows and other non-financial support to Caribbean economies from expatriates.
(i) Migration Incentives
6.47 The labor market provides the main source of income for a very large part of the adult population in the Caribbean. Workers seek employment opportunities in their own countries, but also in other countries in the Caribbean as well as North America and Europe. High levels of domestic unemployment and low wages relative to other countries, and the prospects of better opportunities elsewhere have created incentives for migration, which in many cases are complemented by supportive immigration policies in the receiving countries (see Annex 6.3 for a discussion of the regulatory environment guiding migration). Anecdotal evidence indicates that nurses in Jamaica earned US$9-17,000 per year in Jamaica in 2002-03 compared to median salaries ranging from US$45,000 to US$54,000 in the US (in Florida and New York, respectively). For lower skilled occupations (e.g., carpenters, mechanics and electricians), the wage gap is on the order of 1:6 (Thomas-Hope 2004). But quality of life concerns are also determinant, through potentially higher living standards. The culture of migration is long-standing in the Caribbean, but large-scale organized migration to the US, UK and Canada effectively ended in the 1960s. This nevertheless had the effect of creating large expatriate communities of Caribbeans in these countries, which in turn supported the social networks that continue to be central to facilitating migration today. The social capital in place in the receiving countries provides both the incentive to migrate, for example by easing the transition and facilitating knowledge flows about job and housing opportunities, but networks also can provide the means to migrate, namely through access to visas for family reunification.
6.48 A third category of incentives to migrate involves active recruitment for jobs in receiving countries. Whereas early-20th century recruitment focused on unskilled labor, recent trends target English-speaking skilled workers (e.g., nurses, teachers and hotel waiters) as well as students. There are also temporary guest-worker programs for farm and tourism jobs (see Box 6.2); Caribbean governments have negotiated special labor schemes with American and Canadian employers whereby workers are contracted to work on farms and in the services sector (e.g., hotels) as seasonal workers.163 The final category of migration addressed here is return migrants, i.e., Caribbeans returning to their home countries. Recognizing the gains from return migrants in financial and human capital terms, several governments have instituted programs to encourage either permanent or temporary returns.164
163 Whereas temporary employment programs in the US were large in the 1980s, employing some 10-20,000 Caribbean migrants annually, primarily for sugar cane harvest, the number of jobs dropped dramatically to 137 agriculture jobs and 2,009 non-agriculture jobs, 63 percent of which were held by Jamaicans and 25 percent by migrants from Dominican Republic (US Immigration and Naturalization Service 1997). 164 Jamaica’s Overseas Department provides information to expatriate Jamaicans, a data bank to prospective Jamaican employers, duty exemptions on imports of household goods, and specific financial incentives to highly skilled professionals to fill vacancies in the public sector (under the Return of Talent Program). Barbados created a Facilitation Unit for Returning Nationals to assist the re-integration of return migrants into society and promote the development of a retirement industry, inter alia. St. Kitts and Nevis
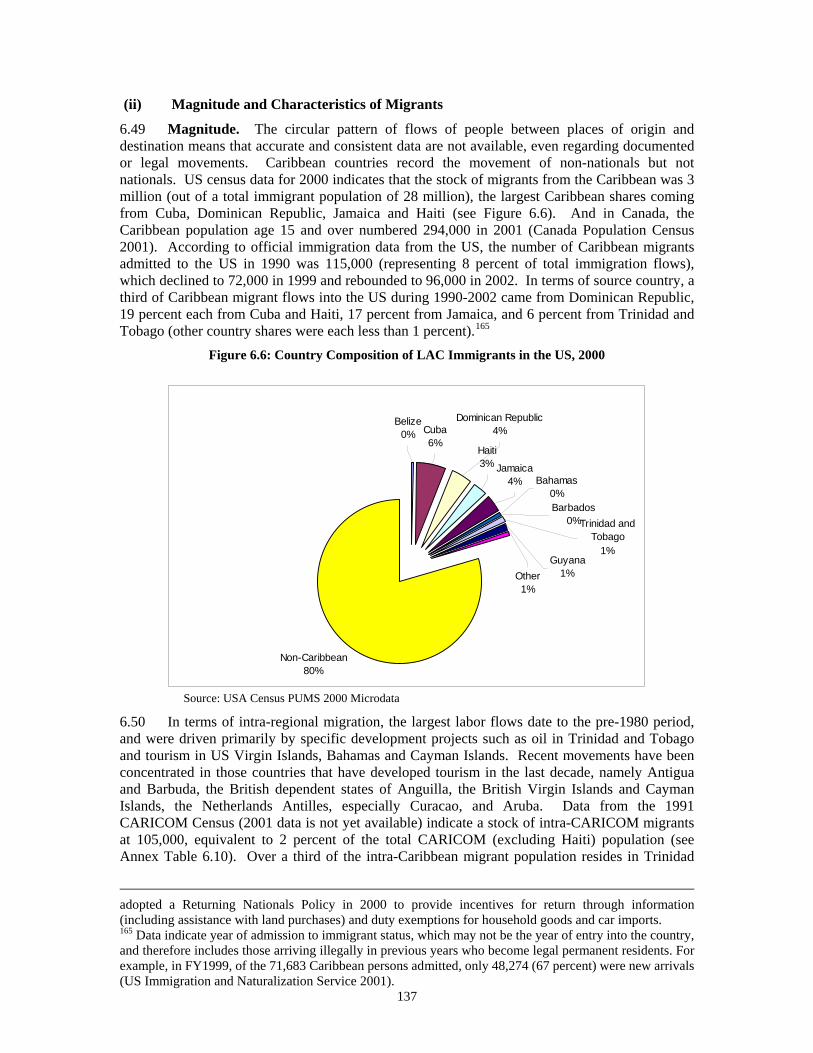
137
(ii) Magnitude and Characteristics of Migrants
6.49 Magnitude. The circular pattern of flows of people between places of origin and destination means that accurate and consistent data are not available, even regarding documented or legal movements. Caribbean countries record the movement of non-nationals but not nationals. US census data for 2000 indicates that the stock of migrants from the Caribbean was 3 million (out of a total immigrant population of 28 million), the largest Caribbean shares coming from Cuba, Dominican Republic, Jamaica and Haiti (see Figure 6.6). And in Canada, the Caribbean population age 15 and over numbered 294,000 in 2001 (Canada Population Census 2001). According to official immigration data from the US, the number of Caribbean migrants admitted to the US in 1990 was 115,000 (representing 8 percent of total immigration flows), which declined to 72,000 in 1999 and rebounded to 96,000 in 2002. In terms of source country, a third of Caribbean migrant flows into the US during 1990-2002 came from Dominican Republic, 19 percent each from Cuba and Haiti, 17 percent from Jamaica, and 6 percent from Trinidad and Tobago (other country shares were each less than 1 percent).165
Figure 6.6: Country Composition of LAC Immigrants in the US, 2000
Non-Caribbean80%
Bahamas0%
Jamaica4%
Barbados0%
Haiti3%
Trinidad and Tobago
1%Guyana
1%Other1%
Dominican Republic4%Cuba
6%
Belize0%
Source: USA Census PUMS 2000 Microdata
6.50 In terms of intra-regional migration, the largest labor flows date to the pre-1980 period, and were driven primarily by specific development projects such as oil in Trinidad and Tobago and tourism in US Virgin Islands, Bahamas and Cayman Islands. Recent movements have been concentrated in those countries that have developed tourism in the last decade, namely Antigua and Barbuda, the British dependent states of Anguilla, the British Virgin Islands and Cayman Islands, the Netherlands Antilles, especially Curacao, and Aruba. Data from the 1991 CARICOM Census (2001 data is not yet available) indicate a stock of intra-CARICOM migrants at 105,000, equivalent to 2 percent of the total CARICOM (excluding Haiti) population (see Annex Table 6.10). Over a third of the intra-Caribbean migrant population resides in Trinidad
adopted a Returning Nationals Policy in 2000 to provide incentives for return through information (including assistance with land purchases) and duty exemptions for household goods and car imports. 165 Data indicate year of admission to immigrant status, which may not be the year of entry into the country, and therefore includes those arriving illegally in previous years who become legal permanent residents. For example, in FY1999, of the 71,683 Caribbean persons admitted, only 48,274 (67 percent) were new arrivals (US Immigration and Naturalization Service 2001).
138
and Tobago, 22 percent in the US Virgin Islands and 12 percent in Barbados. The main source countries are Grenada (18 percent), St. Vincent and the Grenadines (17 percent) and Guyana (13 percent). It is notable that although Trinidad and Tobago has the highest share of in-migrants, it also accounts for 8 percent of out-migrants.
6.51 Although no data are available to describe intra-regional migration trends over the last decade, partial evidence shows that large numbers of Guyanese emigrants have settled in the Eastern Caribbean, and a certain number of emigrants from the Dominican Republic have settled in St. Kitts and Nevis under citizenship entitlements based on the nationality of their grandparents who had migrated from St. Kitts and Nevis to the Dominican Republic as labor migrants in the 1920s and 1930s. These figures do not include Haitian migrants to the Dominican Republic, estimated between 500,000 and one million. Intra-regional migration has played an important role in meeting excess demand for unskilled labor and keeping wages low, as witnessed by the large number of Haitians working in the Dominican agriculture sector and Guyanese employed in the Barbados construction industry (largely illegal migration). 6.52 CARICOM member states are seeking to improve the movement of labor within the region, a process begun in 1992 with the agreement for free movement of university graduates, artists, media persons, athletes and musicians, and is being implemented by all countries except Antigua and Barbuda and St. Kitts and Nevis. This has been extended in 2005 to architects and engineers by Jamaica, Trinidad and Tobago and Barbados, and will be implemented in a phased manner by all countries. The ultimate goal of the CSME is free movement of all CARICOM nationals within member countries at all skill levels, and when achieved, would increase the efficiency of the Caribbean labor market through better skills matching and wage arbitrage. 6.53 Characteristics. In fiscal year 2002, 28 percent of Caribbean-born migrants admitted to the US entered under family-sponsored preferences, 38 percent as immediate relatives (spouses, children, parents) of US citizens, 27 percent as refugee and asylum adjustments (mainly from Cuba), and only 2 percent under employment-based preferences. The bulk of Caribbean-US migrants are between age 20 and 44, and fairly evenly split between men and women. The education level of migrants tends to be high, and much higher than population averages: 61 percent of migrants from the British Commonwealth Caribbean (i.e., excluding Cuba, Dominican Republic, Haiti and Suriname) in the US had at least some tertiary education, and another 25 percent had completed secondary education.166 This can be compared with Mexican migrants to the US in 2000, a much larger migration stream compared to the Dominicans or Jamaicans, of which 48 percent had primary education, 38 percent secondary and only 14 percent tertiary (US Census Bureau, cited in Richard Adams 2003). Despite the relatively high education levels, however, two-thirds of Caribbean immigrants to the US are employed in blue-collar and service occupations, 16 percent in sales and administrative support, and 21 percent in skilled occupations. This evidence implies a degree of brain-drain, which is not surprising given the limited economic size and opportunities for skilled workers in small island economies, and reduces Caribbean labor competitiveness as less productive workers are left behind. At the same time, out-migration increases unmet demand for high skills locally, raising the returns to education and thus incentivizing higher educational attainment among those who would otherwise remain semi-skilled. Also, the very prospect of overseas employment would increase the demand for education. Moreover, brain-drain costs to the regional economy have to be weighed against large remittances and other financial and non-financial contributions of migrants that stimulate Caribbean economic growth, as discussed below.
6.54 The occupational distribution of intra-Caribbean migrants partly reflects the economic growth sectors that encourage immigration – primarily tourism. For example, in the Bahamas and the British Virgin Islands, most non-nationals are involved in unskilled work. However, the
166 ECLAC (2000) reports that 54 percent of Cuban migrants to the US, 43 percent of Dominicans and 58 percent of Haitians has at least 12 years of schooling.
139
second most significant category is professionals, followed by craft and service activities. By contrast, most of the non-nationals in Jamaica are in the professional (46 percent), managerial (16 percent) and technical (12 percent) categories, suggesting that in-migration from elsewhere in the Caribbean has replaced the out-migration of skilled Jamaicans to North America. Data on work permits granted to Caribbean in-migrants points to a shortage of professional, technical, administrative and managerial workers (engineering, nursing, teaching). Some countries – Antigua and Barbuda, Bahamas, Grenada, St. Kitts and Nevis– have depended more on CARICOM for certain categories of workers than others. The intra-Caribbean migration situation remains highly dynamic and depends on external shocks and economic developments that give rise to demand for an increased workforce of a particular type which cannot be met domestically due to the islands’ small size and capacity.
(iii) Remittances
6.55 Migrants – whether permanent or temporary – are responsible for the very large levels of remittances to Caribbean countries, which amounted to an estimated US$4 billion in 2002. Over 1998-2003, remittances represented an average of 6 percent of regional GDP, with much higher shares in Haiti, Jamaica, the Dominican Republic, and St. Kitts and Nevis. Remittances resulting from permanent migration and special labor programs have played a critical role in the survival of households in the Caribbean through consumption-smoothing, particularly given that migrant wages are considerably higher than local earnings (LeFranc and Downes, 2001 provide evidence from Jamaica during the 1990s). At 6 percent of regional GDP, remittances are now double the level of net Overseas Development Assistance, and are also more stable (see Annex Table 1.8). Return migrants also bring enormous quantities of goods, which increase the welfare of local recipients. And of course remittances and other financial resources from Caribbean expatriates constitute a significant contribution to local investment; Mexico has even sought to channel remittances into development projects through matching incentives. Large remittance inflows can have a negative impact on the labor market, however, by raising the reservation wages of workers who may delay labor force entry or queue for better paying government jobs, thus reducing labor output. For example, a worker may prefer to remain unemployed and supported by relatives rather than take a job at a local sugar plantation. On the other hand, that same worker would willingly accept a similar job in Florida, at a much higher wage.
140
Box 6.2: Temporary Worker Programs—Gains without Pains
The Caribbean countries have had a long history of emigration to the UK, Netherlands, France, Canada and the USA. This pattern continues today, fuelled by large income differentials between the Caribbean and industrial countries, and facilitated by a growing Caribbean diaspora. However, the benefits from migration must be set-off against the costs of brain-drain to the sending countries. And migration itself may be threatened by restrictive immigration policies in the receiving countries.
Bilateral agreements on temporary migration offer an alternative means to realize the gains from labor mobility without suffering either the costs of brain drain or foreign hostility to permanent migration. Furthermore, it is unlikely that there will be much progress in this area in multilateral or hemispheric negotiations, so the bilateral route may well be the only feasible one. The Caribbean has already concluded several bilateral agreements with destination countries on short-term temporary worker programs. Examples are the Farm Worker Program (USA), Hotel Worker Program (USA), Farm Worker Program (Canada), and Factory Worker Program (Canada).
Such bilateral agreements have several advantages. It is possible for the Caribbean countries to offer certain critical forms of reassurance, and assume certain obligations that are difficult to negotiate multilaterally and that may induce host countries to be more open. Such obligations include: effective screening of emigrants by the Caribbean governments to ensure that their emigrants do not impose any security threat to the destination countries; coordination with destination countries to combat illegal migration; and a commitment to accept their nationals back if and when asked to return by the destination country, to ensure that temporary migration schemes targeted to low skilled workers remain truly temporary. On the other hand, bilateral agreements contain at least an implicit commitment to repatriation on the part of the destination country, converting brain-drain into a brain-gain through experience acquired abroad. These suggestions are not new to the Caribbean region, and the bilateral agreements that are already in place address one or more of these concerns. The recommendation is to build on these agreements, and widen their scope both in terms of types of workers covered and the range of destination country.
6.56 Overall Impact. This migration analysis illustrates that temporary and permanent labor flows within the Caribbean and between the Caribbean and northern destinations are an important feature of the labor market and of the broader Caribbean culture. Historical patterns of out-migration have shifted in recent years, but the magnitudes remain large. The emergence of transnational households – that is, a sort of permanent migration relationship – complicates the classification of migrants as temporary or permanent, and the purpose for which migration is undertaken, since these categorizations are often overlapping. Intra-Caribbean labor flows are also significant, and should increase once the mobility of labor is liberalized under the CARICOM Single Market and Economy, which is expected to reduce labor cost differentials within the region. At present, there is harmonization of social security systems in the region, a key pre-condition for facilitating greater intra-regional labor mobility.167 The net welfare impact of Caribbean migration is difficult to assess. The associated brain-drain reduces the human capital resources available to support regional development, but the increased human capital accumulation and financial resources of return migrants or remitters contribute enormously to local consumption and economic development. Furthermore, the Caribbean expatriate community makes significant non-financial contributions that increase Caribbean competitiveness, such as through technology and knowledge transfer and market contacts (which helps niche trade development). The goal of policy should be to reduce the costs of brain-drain (such as by increasing fees for higher education scholarships, see Chapter 7), seek to improve the linkages with and flow of benefits from overseas residents, encourage further reduction in the 167 The CARICOM Social Security Agreement seeks to protect the entitlement of individuals to long-term benefits and to provide for the equality of treatment as individuals move from one country to another. The Agreement covers five areas of social security, invalidity, old age or retirement, survivors and disablement pensions and death benefits in the form of pensions. Under the Agreement arrangements are made for the pooling of insurance periods served in various countries as well as for the payment of benefits by one or more of the schemes once an individual has qualified.
141
cost of transferring remittances, better leverage remittances for investment purposes, and push for easing restrictions on temporary movement of labor (see Box 6.2).
F. Conclusions
6.57 The labor market is key to understanding the past determinants of and future prospects for growth and competitiveness in the Caribbean. The shift in the structure of production away from the traditional sectors of agriculture and manufacturing toward the service sector, especially the tourism industry, is mirrored in the patterns of job creation and destruction. This shift was accompanied by increasing educational attainment, although average education levels remain low in most Caribbean countries. But a very large proportion of recent job creation was in low-level skills in tourism and related activities and in the informal sector. With respect to worker education and training, issues of curriculum relevance and quality pose a challenge to efficient labor market functioning, competitiveness and economic development, due to the mismatch of skills supplied and those in demand. The observed skills deficiency at the high end of the spectrum is exacerbated by out-migration, given that the average education level of migrating workers is far above the population average.
6.58 The analysis in this chapter identifies other aspects of the labor market that restrict potential growth by skewing labor demand and reducing labor competitiveness. For instance, wages in the Caribbean are relatively high compared to Latin America and developing countries elsewhere, although in some tradables sectors this partly reflects higher labor productivity. Concurrent with slower economic growth in the 1990s, real wages rose in several countries of the region, causing a decline in competitiveness. The presence of minimum wages and the extensive use of sector-wide collective bargaining – particularly the wage-setting role of many governments which effectively reinforce inflation rather than tying wage increases to productivity gains – also diminishes labor demand and the prospects for increasing international competitiveness. Other aspects of labor regulation as well as the non-negligible influence of unions make Caribbean labor less attractive for foreign investors (with the exception of the Dominican Republic). Although it is difficult to assess the real impact of labor regulation, the emergence of the informal sector throughout the region suggests that non-wage labor costs may be important. Another indication of poor labor market functioning is the persistence of high rates of unemployment in some countries. The positive public wage premium may contribute to unemployment by encouraging queuing for civil service openings, and reliance on migration and large remittances may also raise the reservation wage, thereby increasing voluntary unemployment. Some unemployment is structural in nature, of course, driven by changing economic production and internal and external demand.
6.59 The small size of most Caribbean islands exacerbates skill deficiencies, but intra-regional migration helped respond to these constraints, as workers migrated to fill unmet labor demand at both the low and high ends of the skill spectrum. Out-migration has played an even larger role in the evolution of the labor market and the current structure of employment, but entails both costs (such as brain-drain and lower aggregate labor productivity) and benefits (increased demand for education and higher incomes). Both types of migration allow workers greater flexibility to respond to insufficient labor demand at home and improve the efficiency of the Caribbean labor market. Furthermore, migration brings new resources into the Caribbean – through remittance-financed consumption and investment and technology and knowledge transfer – which in turn could increase productivity and growth as well as strengthen the financial sector through increased financial intermediation, given a conducive policy environment.
6.60 Looking forward, future competitiveness will necessitate sustainable increases in labor productivity. And although the rigidities of the current labor environment are not insurmountable, they create non-wage labor costs that reduce labor demand, implying a need to modernize labor regulations to increase employers’ flexibility, which would be beneficial to workers in the medium and long run and should help stem the shift from formal to informal
142
employment. Another potential way to reduce distortions in the labor market is through public sector compensation policies, which could be more closely aligned with merit and productivity criteria, thereby reducing the positive public sector wage premium. As the region moves towards the creation of a CARICOM Single Market and Economy, labor mobility issues will become increasingly important to individuals and firms. A fully integrated Caribbean labor market is necessary to increase labor market efficiency through better skills matching and provide incentives and opportunities for increased human capital accumulation, thus raising labor productivity in the long run. Countries of the region will need to focus on human resources development to increase the quality of the work force and enable firms to engage in new production areas. Education and training policies should focus on developing the knowledge and skills of current and future workers especially in the application of new technologies used by international firms. Unifying labor regulations across the Caribbean would facilitate increased labor mobility, and harmonized education and training certification would increase transparency in job search and skills matching, and at the same time support specialization and greater scale economies for specific skill development in particular countries. Increasing the competitiveness of Caribbean labor will require increasing labor productivity, which in turn will translate into higher but non-distorted wages. Complementary measures to enhance productivity could include profit-sharing schemes that are linked to productivity increases.
6.61 This analysis of labor markets in the Caribbean points to several areas of weakness that will need to be addressed in order for the labor market to play a key role in the economic transformation process. The stakeholders – Government, private sector firms and unions – need to work together to increase labor market efficiency and flexibility in conjunction with efforts to support increased labor productivity in the region.
143
Chapter 7 Building Skills for Knowledge-driven Growth
A. Introduction
7.1 It has been shown that in order to sustain and improve upon past growth, the Caribbean needs to improve productivity and diversify into higher-end products, given the reduction in productivity growth and prospects in traditional activities. The high wages relative to productivity documented in Chapter 6 make productivity improvement an imperative. Productivity improvement is also demanded by the high degree of openness of Caribbean economies, their dependence on exports for sustained growth, and the fact that many non-tradable activities are now becoming increasingly tradable, thus increasing the sphere of competition. A skilled and adaptable labor force is one of the most critical determinants of productivity enhancement and diversification. Indeed, a skilled work force stands out as an indispensable requirement for continual improvements in productivity, technology and innovation.168 A flexible, open and well-articulated education and training system is the main vehicle to promote the development of such a work force.
7.2 The English-speaking countries have followed international best practices and emphasized broad-based access to primary and secondary education, which has resulted in a remarkably equitable distribution of years of schooling. However, it is possible that the push to expand access may have come at the expense of quality. While there are pockets of excellence, overall learning outcomes are mixed, and not commensurate with the resources devoted to education and training. All available information points to the existence of a serious challenge of quality – the students attend school, but do not imbibe the expected and required skills, nor, in many cases, are the expected skills the right ones to meet the challenges of the twenty first century. Over the years, this has affected both the quality of the work force and its relevance.
7.3 Investors in the Caribbean have cited skill availability to be a critical factor in their investment decisions. However, data from cross-country studies, firm questionnaires and labor market surveys shows that skill shortages are becoming a major constraint in many countries. This is corroborated by supply-side data on build up of skills, where countries in the Caribbean have seen an increase in the education gap between themselves and Latin America as well as average world stocks of skills.
7.4 This chapter presents an assessment of the region’s education and training policies, and examines whether the institutions provide the desired learning opportunities and outcomes. Section B examines why skills matter for competitiveness, while sections C and D assess the quantitative and qualitative outcomes of the education and training system. Section E prioritizes policy recommendations around three themes of improving quality of education, increasing access to tertiary education through greater private involvement, and producing skills demanded by employers. Sections F to H present the details substantiating each of the policy options. The chapter makes the case that the Caribbean can realize very significant gains from changing its approach to education and training. Section I presents some general directions for encouraging investment in new products/technologies, based on recent work done in the Latin America and Caribbean region of the World Bank. (One caveat, which pertains largely to section C on quantitative outcomes, is the lack of data for some countries, which makes generalization for the Caribbean as a whole difficult. In such cases, reference will be made to the ‘Caribbean sub-sample’ of countries.)
168 See de Ferranti et al (2002) and de Ferranti et al (2003).
144
B. Why Skills are essential for Competitiveness
7.5 Cross-country variation in competitiveness, productivity and income are profoundly linked with differences in skills and technology. Indeed, scholars are moving away from the concept of a knowledge economy, and increasingly emphasize that knowledge quickly becomes obsolete, while “learning” takes center stage. “Learning” workers, “learning” firms and “learning” regions are winners in the planet-wide, technology-driven, hyper-competitive economy (Lundvall et al, 2002).
7.6 This section first examines the nexus between education and economic growth. Second, it presents indications on just how important skills are for the competitiveness of Caribbean countries and firms.169
7.7 The relationship between skills and competitiveness is long-term. This is because: (i) pay-offs to human capital investments through the traditional education system (pre-primary, primary, secondary and tertiary) take place over long time horizons (Hanushek, 2002). For example, it takes 15 to 20 years before investments in pre-primary education affect the productivity of firms. Other education and training policies have a short lead time to impact economic conditions, such as job-training for workers, and (ii) it takes decades to build specialized knowledge and training institutions, such as universities and training facilities, to support a region’s specialized economic sectors (Porter, 2001). Adapting education institutions through reform of curricula, innovations in course offerings, investment in specialized equipment and formation of education-business networks, is a lengthy but necessary process to ensure availability of cutting-edge, specialized competencies to local enterprises. Hence, improved education policies today may not provide immediate impetus to today’s economy, but they will undoubtedly help the economy tomorrow. Consistency and persistency in policymaking together with a commensurate long term funding policy are a sine qua non for training, education, and R&D funding.
7.8 A strong skills base facilitates firms and government improvement in other growth- contributing areas, notably technology adoption, quality of government and corporate governance. The complementarities between technology and skills are particularly strong. This is manifested through at least three channels. First, skilled workers are needed to implement new technologies because they are more adept at dealing with change. Having mastered a trade/technique, these workers are more capable of further learning. In this sense, skills and knowledge are cumulative factors. The second is the phenomenon of “directed” technological change—the availability of more skilled workers in developed countries has created incentives for firms to develop new technologies that are more skill-intensive (Acemoglu, 2001). Directed technical change requires an even greater need for speed in the upgrading of education systems in developing countries, as the skill-biased nature of technological change is poised to continue. Third, skilled workers, engineers, and scientists are required to produce significant adaptations of existing technologies. Even simple adoption and diffusion of existing technologies require a minimum general level of education of the work force (at least some secondary education), and of training and R&D in firms. The strong complementarities imply that skill and technology policies need to be synchronized (de Ferranti et al, 2003). Further, it is important to recognize that since it is the firm that makes the choice on the appropriate skill and technology needed for maintaining competitiveness, much of worker training takes place within firms. As shown later, government policies towards training, to be effective, need to be rooted in the firm and in the demands from firms.
7.9 Skills have contributed significantly to economic growth in the Caribbean countries in the past, given the early expansion of primary and secondary education (see Chapter 1). 169 This chapter mainly approaches skills from an instrumental point of view, analyzing their impact on long-term economic growth and competitiveness. However, education also has intrinsic value, being an integral part of personal development, and an undeniable right of each individual.
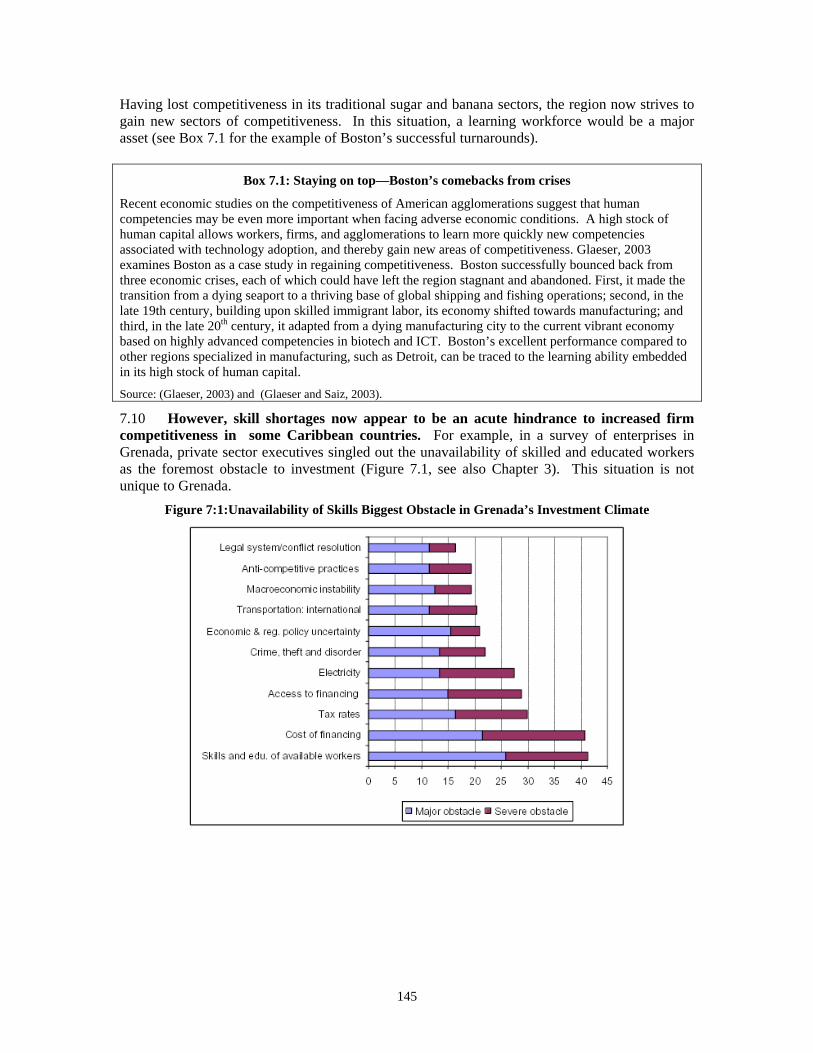
145
Having lost competitiveness in its traditional sugar and banana sectors, the region now strives to gain new sectors of competitiveness. In this situation, a learning workforce would be a major asset (see Box 7.1 for the example of Boston’s successful turnarounds).
7.10 However, skill shortages now appear to be an acute hindrance to increased firm competitiveness in some Caribbean countries. For example, in a survey of enterprises in Grenada, private sector executives singled out the unavailability of skilled and educated workers as the foremost obstacle to investment (Figure 7.1, see also Chapter 3). This situation is not unique to Grenada.
Figure 7:1:Unavailability of Skills Biggest Obstacle in Grenada’s Investment Climate
Box 7.1: Staying on top—Boston’s comebacks from crises
Recent economic studies on the competitiveness of American agglomerations suggest that human competencies may be even more important when facing adverse economic conditions. A high stock of human capital allows workers, firms, and agglomerations to learn more quickly new competencies associated with technology adoption, and thereby gain new areas of competitiveness. Glaeser, 2003 examines Boston as a case study in regaining competitiveness. Boston successfully bounced back from three economic crises, each of which could have left the region stagnant and abandoned. First, it made the transition from a dying seaport to a thriving base of global shipping and fishing operations; second, in the late 19th century, building upon skilled immigrant labor, its economy shifted towards manufacturing; and third, in the late 20th century, it adapted from a dying manufacturing city to the current vibrant economy based on highly advanced competencies in biotech and ICT. Boston’s excellent performance compared to other regions specialized in manufacturing, such as Detroit, can be traced to the learning ability embedded in its high stock of human capital. Source: (Glaeser, 2003) and (Glaeser and Saiz, 2003).
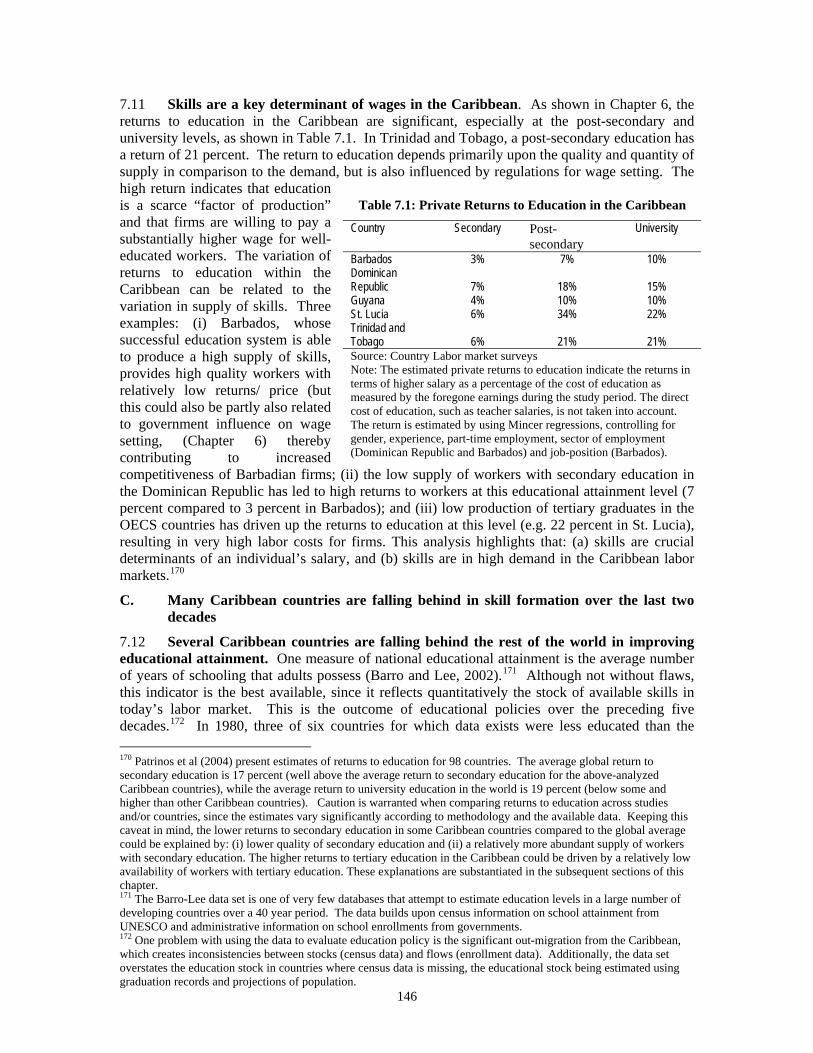
146
7.11 Skills are a key determinant of wages in the Caribbean. As shown in Chapter 6, the returns to education in the Caribbean are significant, especially at the post-secondary and university levels, as shown in Table 7.1. In Trinidad and Tobago, a post-secondary education has a return of 21 percent. The return to education depends primarily upon the quality and quantity of supply in comparison to the demand, but is also influenced by regulations for wage setting. The high return indicates that education is a scarce “factor of production” and that firms are willing to pay a substantially higher wage for well-educated workers. The variation of returns to education within the Caribbean can be related to the variation in supply of skills. Three examples: (i) Barbados, whose successful education system is able to produce a high supply of skills, provides high quality workers with relatively low returns/ price (but this could also be partly also related to government influence on wage setting, (Chapter 6) thereby contributing to increased competitiveness of Barbadian firms; (ii) the low supply of workers with secondary education in the Dominican Republic has led to high returns to workers at this educational attainment level (7 percent compared to 3 percent in Barbados); and (iii) low production of tertiary graduates in the OECS countries has driven up the returns to education at this level (e.g. 22 percent in St. Lucia), resulting in very high labor costs for firms. This analysis highlights that: (a) skills are crucial determinants of an individual’s salary, and (b) skills are in high demand in the Caribbean labor markets.170
C. Many Caribbean countries are falling behind in skill formation over the last two decades
7.12 Several Caribbean countries are falling behind the rest of the world in improving educational attainment. One measure of national educational attainment is the average number of years of schooling that adults possess (Barro and Lee, 2002).171 Although not without flaws, this indicator is the best available, since it reflects quantitatively the stock of available skills in today’s labor market. This is the outcome of educational policies over the preceding five decades.172 In 1980, three of six countries for which data exists were less educated than the 170 Patrinos et al (2004) present estimates of returns to education for 98 countries. The average global return to secondary education is 17 percent (well above the average return to secondary education for the above-analyzed Caribbean countries), while the average return to university education in the world is 19 percent (below some and higher than other Caribbean countries). Caution is warranted when comparing returns to education across studies and/or countries, since the estimates vary significantly according to methodology and the available data. Keeping this caveat in mind, the lower returns to secondary education in some Caribbean countries compared to the global average could be explained by: (i) lower quality of secondary education and (ii) a relatively more abundant supply of workers with secondary education. The higher returns to tertiary education in the Caribbean could be driven by a relatively low availability of workers with tertiary education. These explanations are substantiated in the subsequent sections of this chapter. 171 The Barro-Lee data set is one of very few databases that attempt to estimate education levels in a large number of developing countries over a 40 year period. The data builds upon census information on school attainment from UNESCO and administrative information on school enrollments from governments. 172 One problem with using the data to evaluate education policy is the significant out-migration from the Caribbean, which creates inconsistencies between stocks (census data) and flows (enrollment data). Additionally, the data set overstates the education stock in countries where census data is missing, the educational stock being estimated using graduation records and projections of population.
Table 7.1: Private Returns to Education in the Caribbean
Country Secondary Post-secondary
University
Barbados 3% 7% 10% Dominican Republic 7% 18% 15% Guyana 4% 10% 10% St. Lucia 6% 34% 22% Trinidad and Tobago 6% 21% 21% Source: Country Labor market surveys Note: The estimated private returns to education indicate the returns in terms of higher salary as a percentage of the cost of education as measured by the foregone earnings during the study period. The direct cost of education, such as teacher salaries, is not taken into account. The return is estimated by using Mincer regressions, controlling for gender, experience, part-time employment, sector of employment (Dominican Republic and Barbados) and job-position (Barbados).
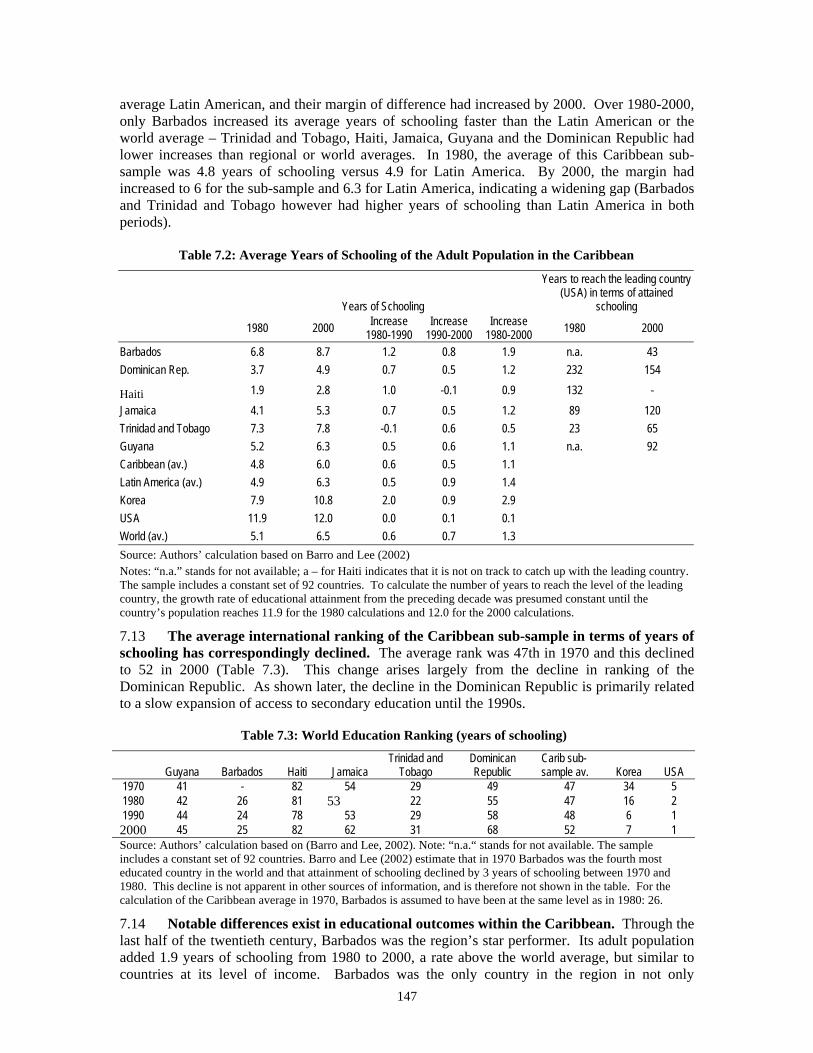
147
average Latin American, and their margin of difference had increased by 2000. Over 1980-2000, only Barbados increased its average years of schooling faster than the Latin American or the world average – Trinidad and Tobago, Haiti, Jamaica, Guyana and the Dominican Republic had lower increases than regional or world averages. In 1980, the average of this Caribbean sub-sample was 4.8 years of schooling versus 4.9 for Latin America. By 2000, the margin had increased to 6 for the sub-sample and 6.3 for Latin America, indicating a widening gap (Barbados and Trinidad and Tobago however had higher years of schooling than Latin America in both periods).
Table 7.2: Average Years of Schooling of the Adult Population in the Caribbean
Years of Schooling
Years to reach the leading country (USA) in terms of attained
schooling
1980 2000 Increase 1980-1990
Increase 1990-2000
Increase 1980-2000 1980 2000
Barbados 6.8 8.7 1.2 0.8 1.9 n.a. 43 Dominican Rep. 3.7 4.9 0.7 0.5 1.2 232 154
Haiti 1.9 2.8 1.0 -0.1 0.9 132 - Jamaica 4.1 5.3 0.7 0.5 1.2 89 120 Trinidad and Tobago 7.3 7.8 -0.1 0.6 0.5 23 65 Guyana 5.2 6.3 0.5 0.6 1.1 n.a. 92 Caribbean (av.) 4.8 6.0 0.6 0.5 1.1 Latin America (av.) 4.9 6.3 0.5 0.9 1.4 Korea 7.9 10.8 2.0 0.9 2.9 USA 11.9 12.0 0.0 0.1 0.1 World (av.) 5.1 6.5 0.6 0.7 1.3 Source: Authors’ calculation based on Barro and Lee (2002) Notes: “n.a.” stands for not available; a – for Haiti indicates that it is not on track to catch up with the leading country. The sample includes a constant set of 92 countries. To calculate the number of years to reach the level of the leading country, the growth rate of educational attainment from the preceding decade was presumed constant until the country’s population reaches 11.9 for the 1980 calculations and 12.0 for the 2000 calculations.
7.13 The average international ranking of the Caribbean sub-sample in terms of years of schooling has correspondingly declined. The average rank was 47th in 1970 and this declined to 52 in 2000 (Table 7.3). This change arises largely from the decline in ranking of the Dominican Republic. As shown later, the decline in the Dominican Republic is primarily related to a slow expansion of access to secondary education until the 1990s.
Table 7.3: World Education Ranking (years of schooling)
Guyana Barbados Haiti Jamaica Trinidad and
Tobago Dominican Republic
Carib sub-sample av. Korea USA
1970 41 - 82 54 29 49 47 34 5 1980 42 26 81 53 22 55 47 16 2 1990 44 24 78 53 29 58 48 6 1 2000 45 25 82 62 31 68 52 7 1 Source: Authors’ calculation based on (Barro and Lee, 2002). Note: “n.a.“ stands for not available. The sample includes a constant set of 92 countries. Barro and Lee (2002) estimate that in 1970 Barbados was the fourth most educated country in the world and that attainment of schooling declined by 3 years of schooling between 1970 and 1980. This decline is not apparent in other sources of information, and is therefore not shown in the table. For the calculation of the Caribbean average in 1970, Barbados is assumed to have been at the same level as in 1980: 26.
7.14 Notable differences exist in educational outcomes within the Caribbean. Through the last half of the twentieth century, Barbados was the region’s star performer. Its adult population added 1.9 years of schooling from 1980 to 2000, a rate above the world average, but similar to countries at its level of income. Barbados was the only country in the region in not only
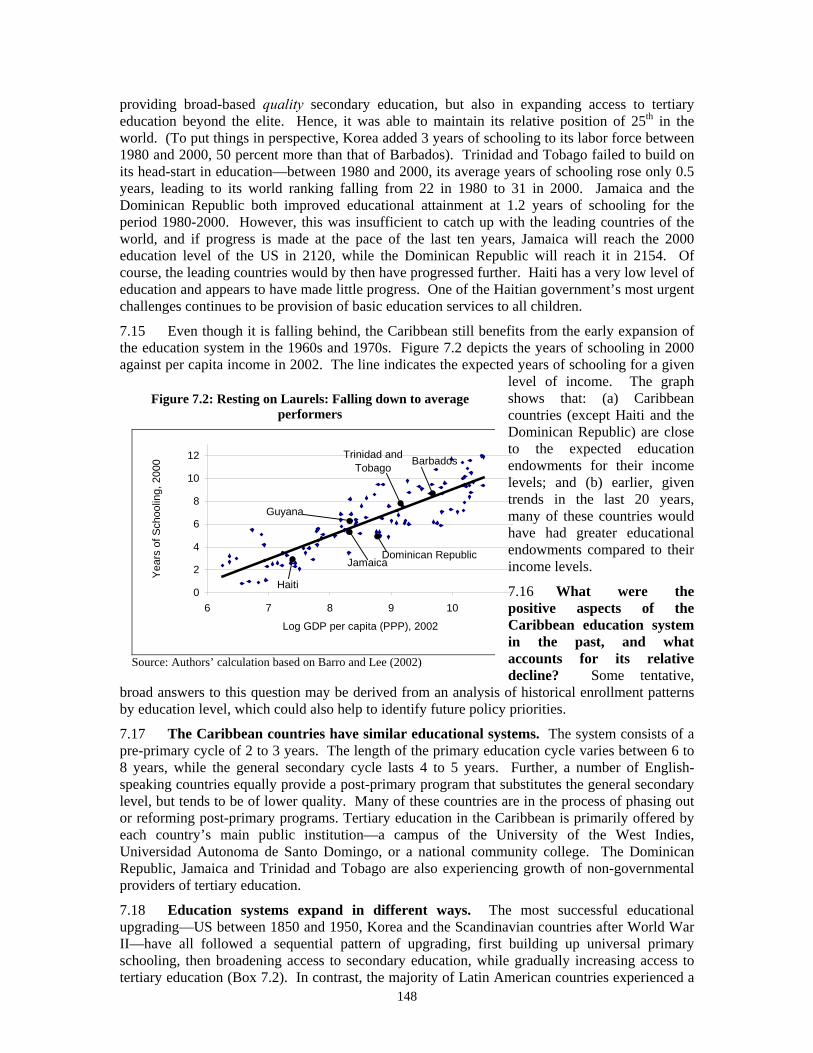
148
providing broad-based quality secondary education, but also in expanding access to tertiary education beyond the elite. Hence, it was able to maintain its relative position of 25th in the world. (To put things in perspective, Korea added 3 years of schooling to its labor force between 1980 and 2000, 50 percent more than that of Barbados). Trinidad and Tobago failed to build on its head-start in education—between 1980 and 2000, its average years of schooling rose only 0.5 years, leading to its world ranking falling from 22 in 1980 to 31 in 2000. Jamaica and the Dominican Republic both improved educational attainment at 1.2 years of schooling for the period 1980-2000. However, this was insufficient to catch up with the leading countries of the world, and if progress is made at the pace of the last ten years, Jamaica will reach the 2000 education level of the US in 2120, while the Dominican Republic will reach it in 2154. Of course, the leading countries would by then have progressed further. Haiti has a very low level of education and appears to have made little progress. One of the Haitian government’s most urgent challenges continues to be provision of basic education services to all children.
7.15 Even though it is falling behind, the Caribbean still benefits from the early expansion of the education system in the 1960s and 1970s. Figure 7.2 depicts the years of schooling in 2000 against per capita income in 2002. The line indicates the expected years of schooling for a given
level of income. The graph shows that: (a) Caribbean countries (except Haiti and the Dominican Republic) are close to the expected education endowments for their income levels; and (b) earlier, given trends in the last 20 years, many of these countries would have had greater educational endowments compared to their income levels. 7.16 What were the positive aspects of the Caribbean education system in the past, and what accounts for its relative decline? Some tentative,
broad answers to this question may be derived from an analysis of historical enrollment patterns by education level, which could also help to identify future policy priorities.
7.17 The Caribbean countries have similar educational systems. The system consists of a pre-primary cycle of 2 to 3 years. The length of the primary education cycle varies between 6 to 8 years, while the general secondary cycle lasts 4 to 5 years. Further, a number of English-speaking countries equally provide a post-primary program that substitutes the general secondary level, but tends to be of lower quality. Many of these countries are in the process of phasing out or reforming post-primary programs. Tertiary education in the Caribbean is primarily offered by each country’s main public institution—a campus of the University of the West Indies, Universidad Autonoma de Santo Domingo, or a national community college. The Dominican Republic, Jamaica and Trinidad and Tobago are also experiencing growth of non-governmental providers of tertiary education.
7.18 Education systems expand in different ways. The most successful educational upgrading—US between 1850 and 1950, Korea and the Scandinavian countries after World War II—have all followed a sequential pattern of upgrading, first building up universal primary schooling, then broadening access to secondary education, while gradually increasing access to tertiary education (Box 7.2). In contrast, the majority of Latin American countries experienced a
Figure 7.2: Resting on Laurels: Falling down to average performers
0
2
4
6
8
10
12
6 7 8 9 10
Log GDP per capita (PPP), 2002
Year
s of
Sch
oolin
g, 2
000
Trinidad and Tobago
Jamaica
Barbados
Haiti
Dominican Republic
Guyana
Source: Authors’ calculation based on Barro and Lee (2002)
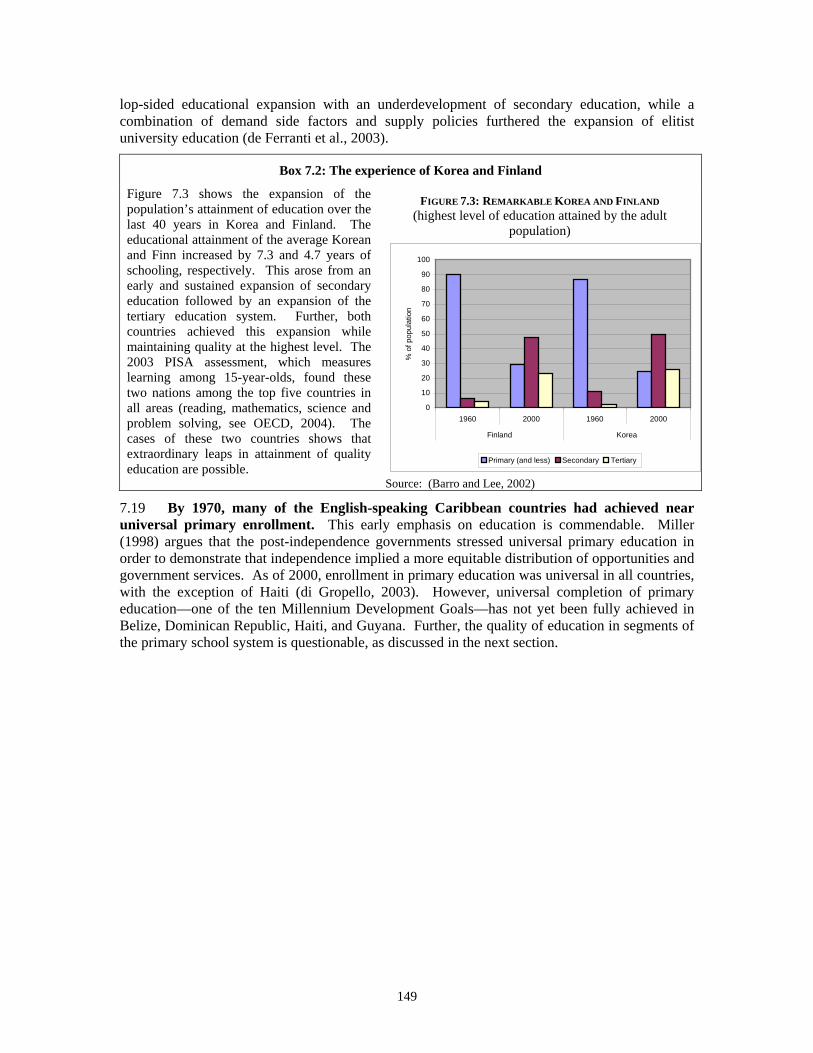
149
lop-sided educational expansion with an underdevelopment of secondary education, while a combination of demand side factors and supply policies furthered the expansion of elitist university education (de Ferranti et al., 2003).
Box 7.2: The experience of Korea and Finland
Figure 7.3 shows the expansion of the population’s attainment of education over the last 40 years in Korea and Finland. The educational attainment of the average Korean and Finn increased by 7.3 and 4.7 years of schooling, respectively. This arose from an early and sustained expansion of secondary education followed by an expansion of the tertiary education system. Further, both countries achieved this expansion while maintaining quality at the highest level. The 2003 PISA assessment, which measures learning among 15-year-olds, found these two nations among the top five countries in all areas (reading, mathematics, science and problem solving, see OECD, 2004). The cases of these two countries shows that extraordinary leaps in attainment of quality education are possible.
FIGURE 7.3: REMARKABLE KOREA AND FINLAND (highest level of education attained by the adult
population)
0
10
20
30
40
50
60
70
80
90
100
1960 2000 1960 2000
Finland Korea
% o
f pop
ulat
ion
Primary (and less) Secondary Tertiary
Source: (Barro and Lee, 2002) 7.19 By 1970, many of the English-speaking Caribbean countries had achieved near universal primary enrollment. This early emphasis on education is commendable. Miller (1998) argues that the post-independence governments stressed universal primary education in order to demonstrate that independence implied a more equitable distribution of opportunities and government services. As of 2000, enrollment in primary education was universal in all countries, with the exception of Haiti (di Gropello, 2003). However, universal completion of primary education—one of the ten Millennium Development Goals—has not yet been fully achieved in Belize, Dominican Republic, Haiti, and Guyana. Further, the quality of education in segments of the primary school system is questionable, as discussed in the next section.
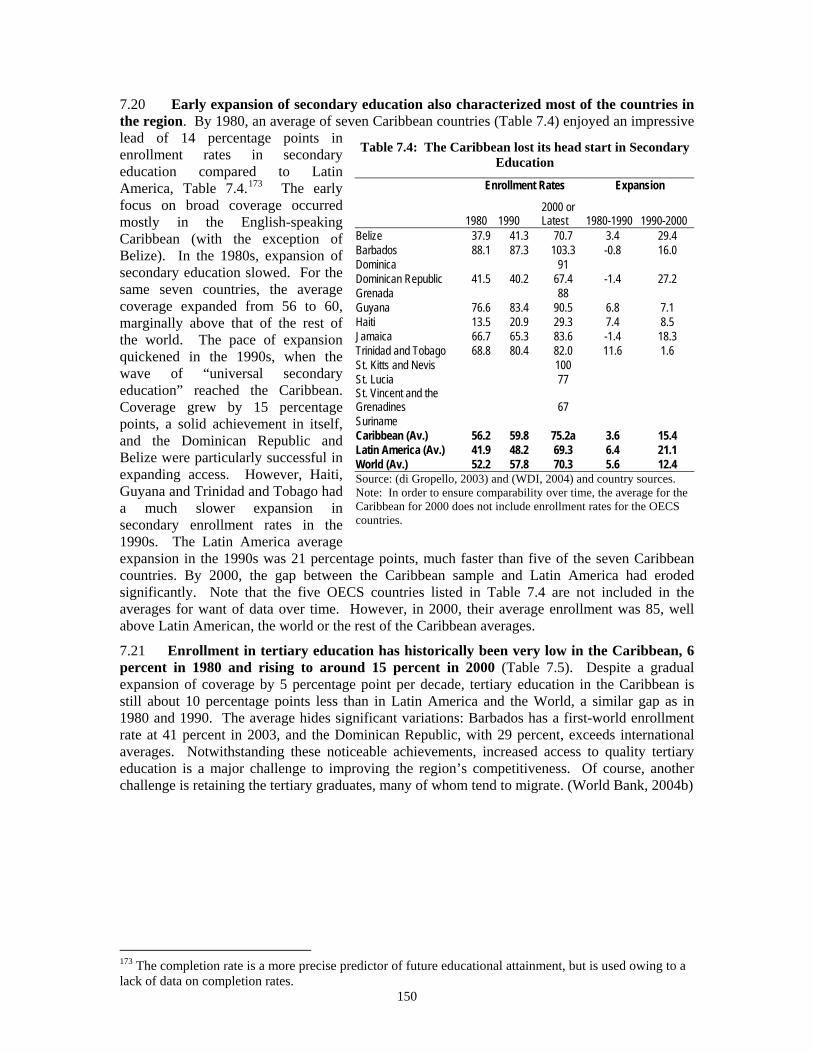
150
7.20 Early expansion of secondary education also characterized most of the countries in the region. By 1980, an average of seven Caribbean countries (Table 7.4) enjoyed an impressive lead of 14 percentage points in enrollment rates in secondary education compared to Latin America, Table 7.4.173 The early focus on broad coverage occurred mostly in the English-speaking Caribbean (with the exception of Belize). In the 1980s, expansion of secondary education slowed. For the same seven countries, the average coverage expanded from 56 to 60, marginally above that of the rest of the world. The pace of expansion quickened in the 1990s, when the wave of “universal secondary education” reached the Caribbean. Coverage grew by 15 percentage points, a solid achievement in itself, and the Dominican Republic and Belize were particularly successful in expanding access. However, Haiti, Guyana and Trinidad and Tobago had a much slower expansion in secondary enrollment rates in the 1990s. The Latin America average expansion in the 1990s was 21 percentage points, much faster than five of the seven Caribbean countries. By 2000, the gap between the Caribbean sample and Latin America had eroded significantly. Note that the five OECS countries listed in Table 7.4 are not included in the averages for want of data over time. However, in 2000, their average enrollment was 85, well above Latin American, the world or the rest of the Caribbean averages.
7.21 Enrollment in tertiary education has historically been very low in the Caribbean, 6 percent in 1980 and rising to around 15 percent in 2000 (Table 7.5). Despite a gradual expansion of coverage by 5 percentage point per decade, tertiary education in the Caribbean is still about 10 percentage points less than in Latin America and the World, a similar gap as in 1980 and 1990. The average hides significant variations: Barbados has a first-world enrollment rate at 41 percent in 2003, and the Dominican Republic, with 29 percent, exceeds international averages. Notwithstanding these noticeable achievements, increased access to quality tertiary education is a major challenge to improving the region’s competitiveness. Of course, another challenge is retaining the tertiary graduates, many of whom tend to migrate. (World Bank, 2004b)
173 The completion rate is a more precise predictor of future educational attainment, but is used owing to a lack of data on completion rates.
Table 7.4: The Caribbean lost its head start in Secondary Education
Enrollment Rates Expansion
1980 1990 2000 or Latest 1980-1990 1990-2000
Belize 37.9 41.3 70.7 3.4 29.4 Barbados 88.1 87.3 103.3 -0.8 16.0 Dominica 91 Dominican Republic 41.5 40.2 67.4 -1.4 27.2 Grenada 88 Guyana 76.6 83.4 90.5 6.8 7.1 Haiti 13.5 20.9 29.3 7.4 8.5 Jamaica 66.7 65.3 83.6 -1.4 18.3 Trinidad and Tobago 68.8 80.4 82.0 11.6 1.6 St. Kitts and Nevis 100 St. Lucia 77 St. Vincent and the Grenadines 67 Suriname Caribbean (Av.) 56.2 59.8 75.2a 3.6 15.4 Latin America (Av.) 41.9 48.2 69.3 6.4 21.1 World (Av.) 52.2 57.8 70.3 5.6 12.4 Source: (di Gropello, 2003) and (WDI, 2004) and country sources. Note: In order to ensure comparability over time, the average for the Caribbean for 2000 does not include enrollment rates for the OECS countries.
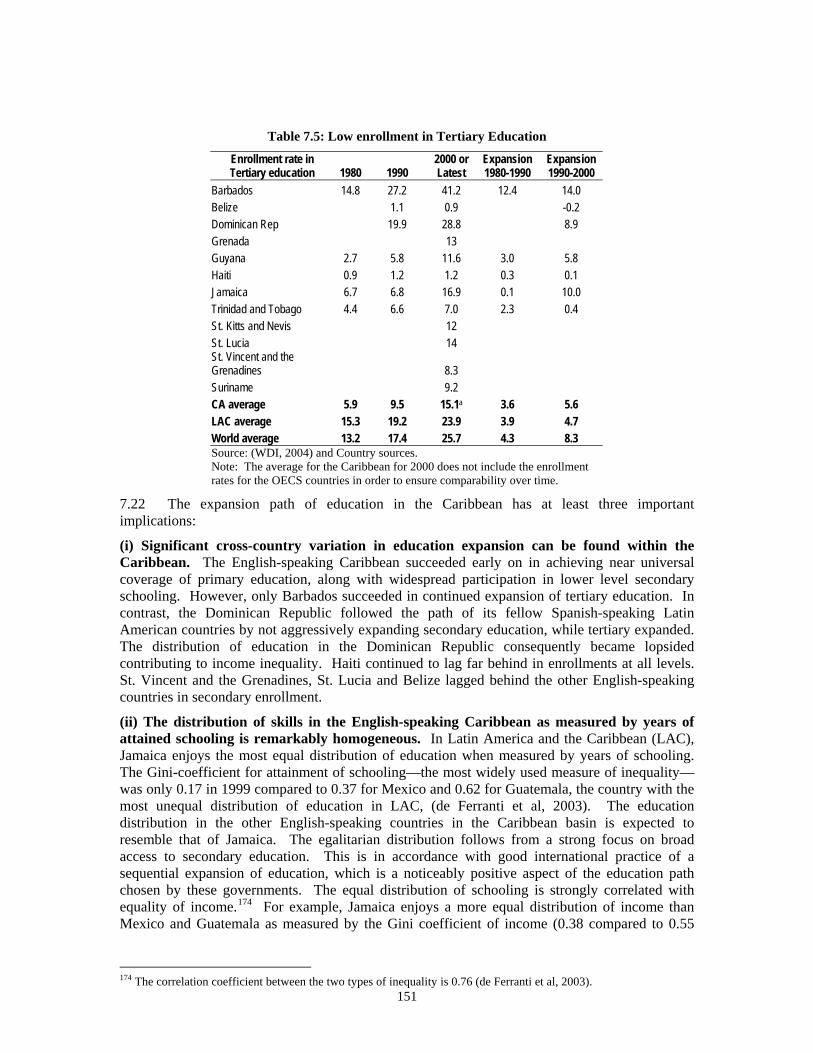
151
Table 7.5: Low enrollment in Tertiary Education
Enrollment rate in Tertiary education 1980 1990
2000 or Latest
Expansion 1980-1990
Expansion 1990-2000
Barbados 14.8 27.2 41.2 12.4 14.0 Belize 1.1 0.9 -0.2 Dominican Rep 19.9 28.8 8.9 Grenada 13 Guyana 2.7 5.8 11.6 3.0 5.8 Haiti 0.9 1.2 1.2 0.3 0.1 Jamaica 6.7 6.8 16.9 0.1 10.0 Trinidad and Tobago 4.4 6.6 7.0 2.3 0.4 St. Kitts and Nevis 12 St. Lucia 14 St. Vincent and the Grenadines 8.3 Suriname 9.2 CA average 5.9 9.5 15.1a 3.6 5.6 LAC average 15.3 19.2 23.9 3.9 4.7 World average 13.2 17.4 25.7 4.3 8.3 Source: (WDI, 2004) and Country sources. Note: The average for the Caribbean for 2000 does not include the enrollment rates for the OECS countries in order to ensure comparability over time.
7.22 The expansion path of education in the Caribbean has at least three important implications:
(i) Significant cross-country variation in education expansion can be found within the Caribbean. The English-speaking Caribbean succeeded early on in achieving near universal coverage of primary education, along with widespread participation in lower level secondary schooling. However, only Barbados succeeded in continued expansion of tertiary education. In contrast, the Dominican Republic followed the path of its fellow Spanish-speaking Latin American countries by not aggressively expanding secondary education, while tertiary expanded. The distribution of education in the Dominican Republic consequently became lopsided contributing to income inequality. Haiti continued to lag far behind in enrollments at all levels. St. Vincent and the Grenadines, St. Lucia and Belize lagged behind the other English-speaking countries in secondary enrollment.
(ii) The distribution of skills in the English-speaking Caribbean as measured by years of attained schooling is remarkably homogeneous. In Latin America and the Caribbean (LAC), Jamaica enjoys the most equal distribution of education when measured by years of schooling. The Gini-coefficient for attainment of schooling—the most widely used measure of inequality—was only 0.17 in 1999 compared to 0.37 for Mexico and 0.62 for Guatemala, the country with the most unequal distribution of education in LAC, (de Ferranti et al, 2003). The education distribution in the other English-speaking countries in the Caribbean basin is expected to resemble that of Jamaica. The egalitarian distribution follows from a strong focus on broad access to secondary education. This is in accordance with good international practice of a sequential expansion of education, which is a noticeably positive aspect of the education path chosen by these governments. The equal distribution of schooling is strongly correlated with equality of income.174 For example, Jamaica enjoys a more equal distribution of income than Mexico and Guatemala as measured by the Gini coefficient of income (0.38 compared to 0.55
174 The correlation coefficient between the two types of inequality is 0.76 (de Ferranti et al, 2003).
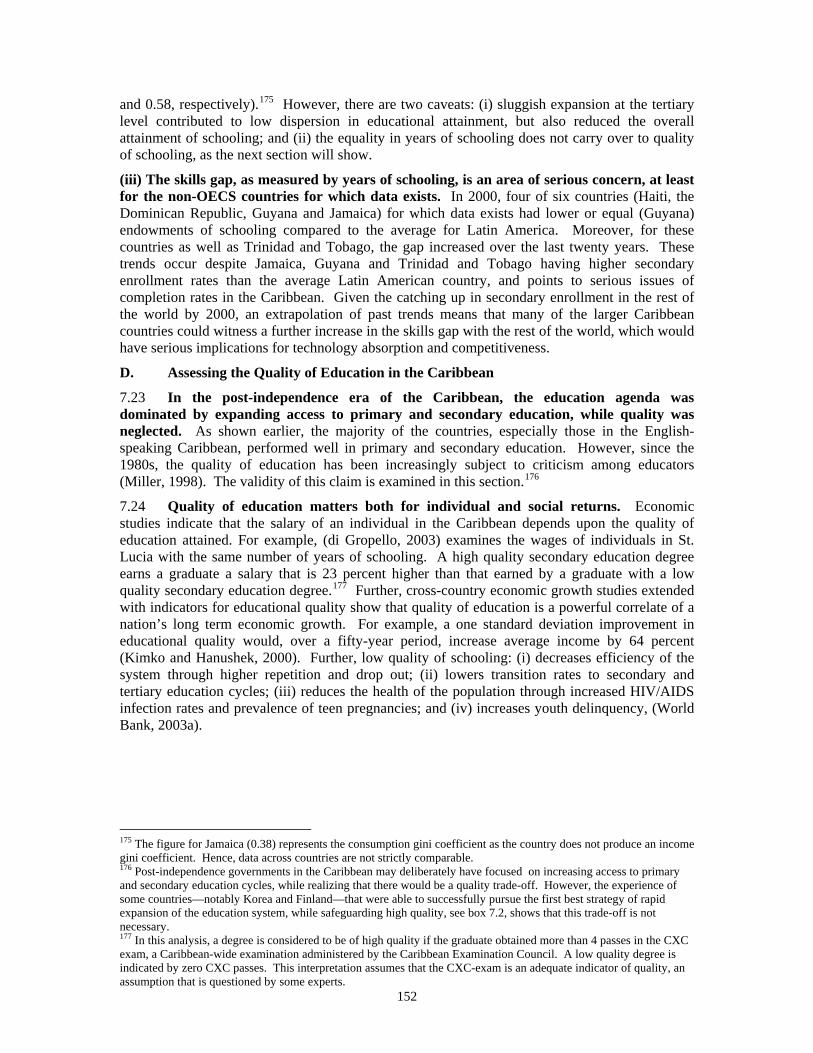
152
and 0.58, respectively).175 However, there are two caveats: (i) sluggish expansion at the tertiary level contributed to low dispersion in educational attainment, but also reduced the overall attainment of schooling; and (ii) the equality in years of schooling does not carry over to quality of schooling, as the next section will show.
(iii) The skills gap, as measured by years of schooling, is an area of serious concern, at least for the non-OECS countries for which data exists. In 2000, four of six countries (Haiti, the Dominican Republic, Guyana and Jamaica) for which data exists had lower or equal (Guyana) endowments of schooling compared to the average for Latin America. Moreover, for these countries as well as Trinidad and Tobago, the gap increased over the last twenty years. These trends occur despite Jamaica, Guyana and Trinidad and Tobago having higher secondary enrollment rates than the average Latin American country, and points to serious issues of completion rates in the Caribbean. Given the catching up in secondary enrollment in the rest of the world by 2000, an extrapolation of past trends means that many of the larger Caribbean countries could witness a further increase in the skills gap with the rest of the world, which would have serious implications for technology absorption and competitiveness.
D. Assessing the Quality of Education in the Caribbean
7.23 In the post-independence era of the Caribbean, the education agenda was dominated by expanding access to primary and secondary education, while quality was neglected. As shown earlier, the majority of the countries, especially those in the English-speaking Caribbean, performed well in primary and secondary education. However, since the 1980s, the quality of education has been increasingly subject to criticism among educators (Miller, 1998). The validity of this claim is examined in this section.176
7.24 Quality of education matters both for individual and social returns. Economic studies indicate that the salary of an individual in the Caribbean depends upon the quality of education attained. For example, (di Gropello, 2003) examines the wages of individuals in St. Lucia with the same number of years of schooling. A high quality secondary education degree earns a graduate a salary that is 23 percent higher than that earned by a graduate with a low quality secondary education degree.177 Further, cross-country economic growth studies extended with indicators for educational quality show that quality of education is a powerful correlate of a nation’s long term economic growth. For example, a one standard deviation improvement in educational quality would, over a fifty-year period, increase average income by 64 percent (Kimko and Hanushek, 2000). Further, low quality of schooling: (i) decreases efficiency of the system through higher repetition and drop out; (ii) lowers transition rates to secondary and tertiary education cycles; (iii) reduces the health of the population through increased HIV/AIDS infection rates and prevalence of teen pregnancies; and (iv) increases youth delinquency, (World Bank, 2003a).
175 The figure for Jamaica (0.38) represents the consumption gini coefficient as the country does not produce an income gini coefficient. Hence, data across countries are not strictly comparable. 176 Post-independence governments in the Caribbean may deliberately have focused on increasing access to primary and secondary education cycles, while realizing that there would be a quality trade-off. However, the experience of some countries—notably Korea and Finland—that were able to successfully pursue the first best strategy of rapid expansion of the education system, while safeguarding high quality, see box 7.2, shows that this trade-off is not necessary. 177 In this analysis, a degree is considered to be of high quality if the graduate obtained more than 4 passes in the CXC exam, a Caribbean-wide examination administered by the Caribbean Examination Council. A low quality degree is indicated by zero CXC passes. This interpretation assumes that the CXC-exam is an adequate indicator of quality, an assumption that is questioned by some experts.
153
7.25 The available information supports the claim of many educators that quality of education in the Caribbean is below world standards. It must be noted, however, that systematic comparison of schooling quality in the region against international standards is lacking. The Dominican Republic is the only Caribbean country to participate in an international assessment extending beyond the region.178 The 1997 OREAL-UNESCO exam tested pupils in LAC. Among 4th graders from 12 countries, those in the Dominican Republic scored the lowest in Language and 3rd lowest in Math, (Carnoy, 2002). Results among 3rd graders were equally poor. Another indicator of the region’s seemingly low quality of education comes from a study of returns to education of migrants to the US, (Bratsberg and Terrell, 2002). Since only those migrants who attended school in their own country are selected in the sample, the return to schooling could be a proxy for the quality of education in the migrant’s country. As presented in Table 7.6, the return to Caribbean migrants is lower than for the average migrant, thus indicating lower pay for the same job or lack of access to higher quality jobs on account of lower quality of education.179
7.26 Considerable variation in learning outcomes exists between the English-speaking Caribbean nations, as measured by the CXC exams. The Caribbean Examination Council administers, on a voluntary basis, the CXC exam to English-speaking secondary school leavers in the Caribbean. The students’ performance gives an indication of quality of instruction. However, given that only a portion of the age cohort sits for the exam—either due to restricted access to secondary education or not being present at the exam—caution should be used when interpreting the results. In 2003, the pass rates in English varied from a little over 35 percent among Guyanese students to more than 65 percent among students from Dominica (Figure 7.4). The pattern remains fairly stable over time, thus suggesting that permanent differences lie behind the disparity in learning. The low pass rate is cause for concern for multiple reasons: (i) the failure of more than 50 percent in the key subjects is either a result of an overly ambitious exam or a failing education system; (ii) post-secondary education institutions in the Caribbean generally require three to four CXC passes, including English and Math, as conditions for entry, hence less than half of the graduates of secondary education qualify for further studies; and (iii) future job-training requires a fundamental ability to learn.
178 The lack of international assessment of learning outcomes and schooling quality in the Caribbean reduces the available information to educators, parents and regulators. It risks hiding a low standard of quality for years. Governments could consider participating in the 2006 Program for International Student Assessment administered by the OECD. 179 The relatively low returns to education for Caribbean migrants in the U.S. labor market is not inconsistent with the high returns to education in the Caribbean labor market shown in Table 7.1. The estimated rates of return are not comparable, since the rates of return estimated in the Caribbean labor market, Table 7.1, are by education level, while the rates of return calculated by Bratsberg and Terrell are the average return across all education levels. Further, the difference can be explained by differences in demand.
Table 7.6:Returns to education for Caribbean Migrants in the US
Country Rate of Return (%)
Dominican Republic 2.1 Haiti 2.0 Jamaica 3.5 Trinidad and Tobago 3.8 Caribbean (av.) 2.9 Central America (av.) 2.8 South America (av.) 4.8 Europe (av.) 5.9 World (av.) 4.9 Source: (Bratsberg and Terrell , 2002) based on US census 1990. Note: The rate of return is the average return to one additional year of schooling.
154
E. The Policy Agenda
7.27 The previous two sections briefly summarized the status of the Caribbean education systems. The following three sections propose three priorities for the region’s education and training policy agenda. Given the region’s heterogeneity in economic and social development, the policy agenda is not common to all Caribbean countries. In countries where universal completion of primary education and broad–based access to secondary education has yet to be achieved, access goals take priority. This is, for example, the case for primary education in Haiti and secondary education in the Dominican Republic. In general, the multiplicity of desired goals for the education sector implies that a strong prioritization of education investments is necessary to achieve results. This chapter proposes three priorities that are structured around the three education pillars of quality, access and relevance:
• First priority: Improving Quality of Education. This is a first priority, because quality primary and secondary education is the foundation upon which all future skill-building takes place. It would not be rational for firms or individuals to invest in further upgrading of skills if the population does not possess the adequate prior skills.
• Second priority: Increasing Access to Tertiary Education through greater private investments. Expanding the pool of knowledge workers with general problem- solving competencies as developed through tertiary education is critical for improving the skill base of the Caribbean economies. Caribbean enterprises will not be able to increasingly apply scientific, technological and managerial know-how to strengthen competitiveness of existing sectors or develop new competitive sectors without these knowledge workers.
• Third priority: Producing Skills Demanded by Employers. Caribbean firms require specialized skills to be able to diversify into new and emerging sectors. The development of these more relevant skills will demand substantially improved interaction between the training and education institutions and the employers. Further, increased relevance of education will reduce migration of skilled labor, by improving matching of demand and supply.
F. Improving Quality of Education
7.28 What can be done to improve the quality of education? A series of complex and interlinked factors explain the region’s learning gap, such as accountability, efficiency, school management, teacher training and motivation, community involvement, and educational culture. Each country faces some particular bottlenecks. Most countries except the Dominican Republic
Figure 7.4:Quality of Instruction within the Caribbean (the pass rate of Math and English at the CXC exam)
0%
10%
20%
30%
40%
50%
60%
70% English A
M ath
Source: Caribbean Examination Council 2003.
155
already invest a significant amount of resources in education (see Chapter 2 and Box 7.3). In fact, Chapter 2 even examined some possibilities for reduction in education spending. Thus, the key concern in the Caribbean relates to the system’s ability to translate these resources into acceptable educational outcomes. For illustrative purposes, this process can be broken into: (i) financial and efficiency-oriented education policies, which are summarized in Box 7.3; and (ii) teaching-oriented education policies, which are treated below.
7.29 Identifying the location and characteristics of the low performing students is key to understanding which initiatives most effectively improve learning. Implementation of policies to strengthen learning among the lowest performing students would not only have a significant impact on the average capabilities of a graduate in the Caribbean, but also reduce the inequality in learning by reducing the learning gap between the bottom and top performers. Further, there is a need to enhance collection and diffusion of detailed educational information, such as learning achievement, completion rates, costs, and drop out rates at the school and community level. This would empower students, parents, teachers, and principals with the ability to compare performance with neighboring schools, detect shortcomings, and take actions where most needed.
7.30 Improving learning at the low performing schools. Many schools in the Caribbean have excellent learning outcomes with world-class graduates, brilliant pupils and highly educated and committed teachers. However, learning outcomes differ greatly between schools (much less so within the same school, World Bank, 2003e, 2004 k-m, forthcoming b), rendering average learning outcomes poor. The case from St. Vincent and the Grenadines in Box 7.4 provides a telling example. The large variation between schools could arise from: (i) system-based factors, such as early streaming of students into different types of school, which is the case in Jamaica where five different types of secondary schools exist; (ii) school-based factors, such as differences in teacher qualifications; and (iii) environment-based factors, including differences in socio-economic background of the school population. Policymakers need to increase their focus on, and resources to, the poor performing schools. At a minimum, the system should provide equal access to learning materials and infrastructure, such as laboratories and libraries, and ensure that teachers are equally qualified. Furthermore, a good system would focus additional resources on low performing schools to provide student counseling, early detection of learning difficulties and remedial classes to slow learners.
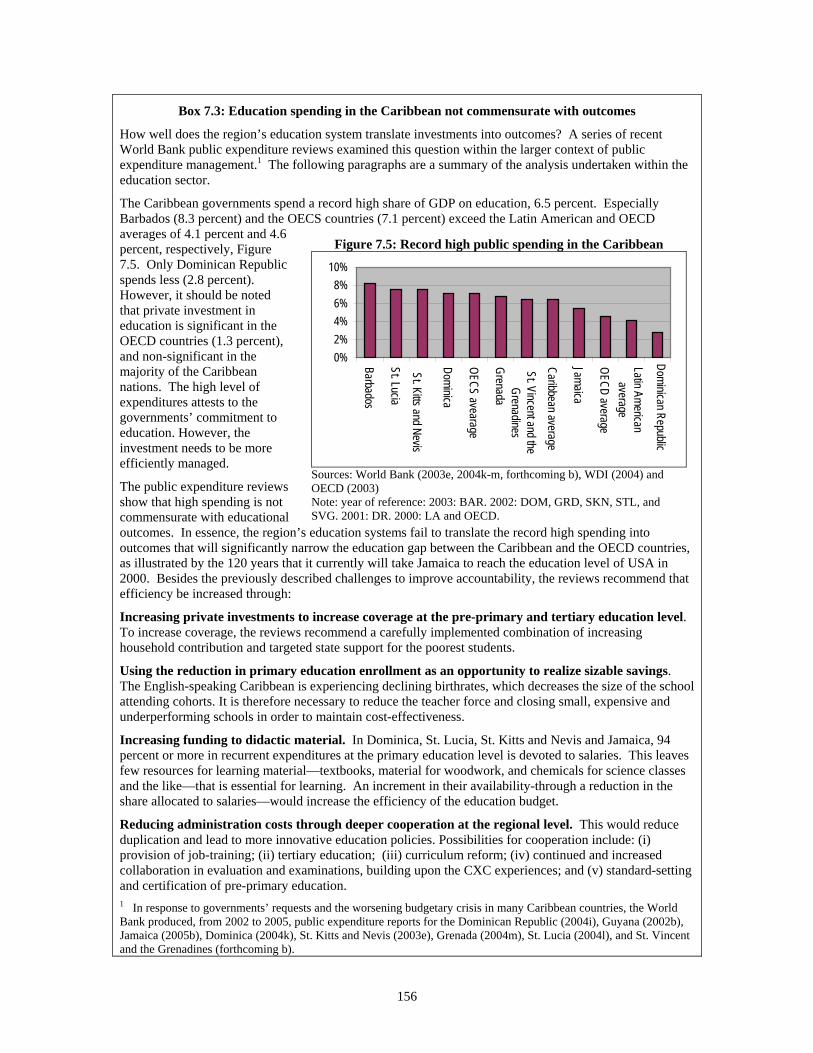
156
Box 7.3: Education spending in the Caribbean not commensurate with outcomes
How well does the region’s education system translate investments into outcomes? A series of recent World Bank public expenditure reviews examined this question within the larger context of public expenditure management.1 The following paragraphs are a summary of the analysis undertaken within the education sector.
The Caribbean governments spend a record high share of GDP on education, 6.5 percent. Especially Barbados (8.3 percent) and the OECS countries (7.1 percent) exceed the Latin American and OECD averages of 4.1 percent and 4.6 percent, respectively, Figure 7.5. Only Dominican Republic spends less (2.8 percent). However, it should be noted that private investment in education is significant in the OECD countries (1.3 percent), and non-significant in the majority of the Caribbean nations. The high level of expenditures attests to the governments’ commitment to education. However, the investment needs to be more efficiently managed.
The public expenditure reviews show that high spending is not commensurate with educational outcomes. In essence, the region’s education systems fail to translate the record high spending into outcomes that will significantly narrow the education gap between the Caribbean and the OECD countries, as illustrated by the 120 years that it currently will take Jamaica to reach the education level of USA in 2000. Besides the previously described challenges to improve accountability, the reviews recommend that efficiency be increased through:
Increasing private investments to increase coverage at the pre-primary and tertiary education level. To increase coverage, the reviews recommend a carefully implemented combination of increasing household contribution and targeted state support for the poorest students.
Using the reduction in primary education enrollment as an opportunity to realize sizable savings. The English-speaking Caribbean is experiencing declining birthrates, which decreases the size of the school attending cohorts. It is therefore necessary to reduce the teacher force and closing small, expensive and underperforming schools in order to maintain cost-effectiveness.
Increasing funding to didactic material. In Dominica, St. Lucia, St. Kitts and Nevis and Jamaica, 94 percent or more in recurrent expenditures at the primary education level is devoted to salaries. This leaves few resources for learning material—textbooks, material for woodwork, and chemicals for science classes and the like—that is essential for learning. An increment in their availability-through a reduction in the share allocated to salaries—would increase the efficiency of the education budget.
Reducing administration costs through deeper cooperation at the regional level. This would reduce duplication and lead to more innovative education policies. Possibilities for cooperation include: (i) provision of job-training; (ii) tertiary education; (iii) curriculum reform; (iv) continued and increased collaboration in evaluation and examinations, building upon the CXC experiences; and (v) standard-setting and certification of pre-primary education. 1 In response to governments’ requests and the worsening budgetary crisis in many Caribbean countries, the World Bank produced, from 2002 to 2005, public expenditure reports for the Dominican Republic (2004i), Guyana (2002b), Jamaica (2005b), Dominica (2004k), St. Kitts and Nevis (2003e), Grenada (2004m), St. Lucia (2004l), and St. Vincent and the Grenadines (forthcoming b).
Figure 7.5: Record high public spending in the Caribbean
0%2%4%6%8%
10%
Barbados
St. Lucia
Dominica
OECS avearage
Grenada
Caribbean average
Jamaica
OECD average
Latin Americanaverage
St. Kitts and Nevis
St. Vincent and the Grenadines
Dominican Republic
Sources: World Bank (2003e, 2004k-m, forthcoming b), WDI (2004) and OECD (2003) Note: year of reference: 2003: BAR. 2002: DOM, GRD, SKN, STL, and SVG. 2001: DR. 2000: LA and OECD.
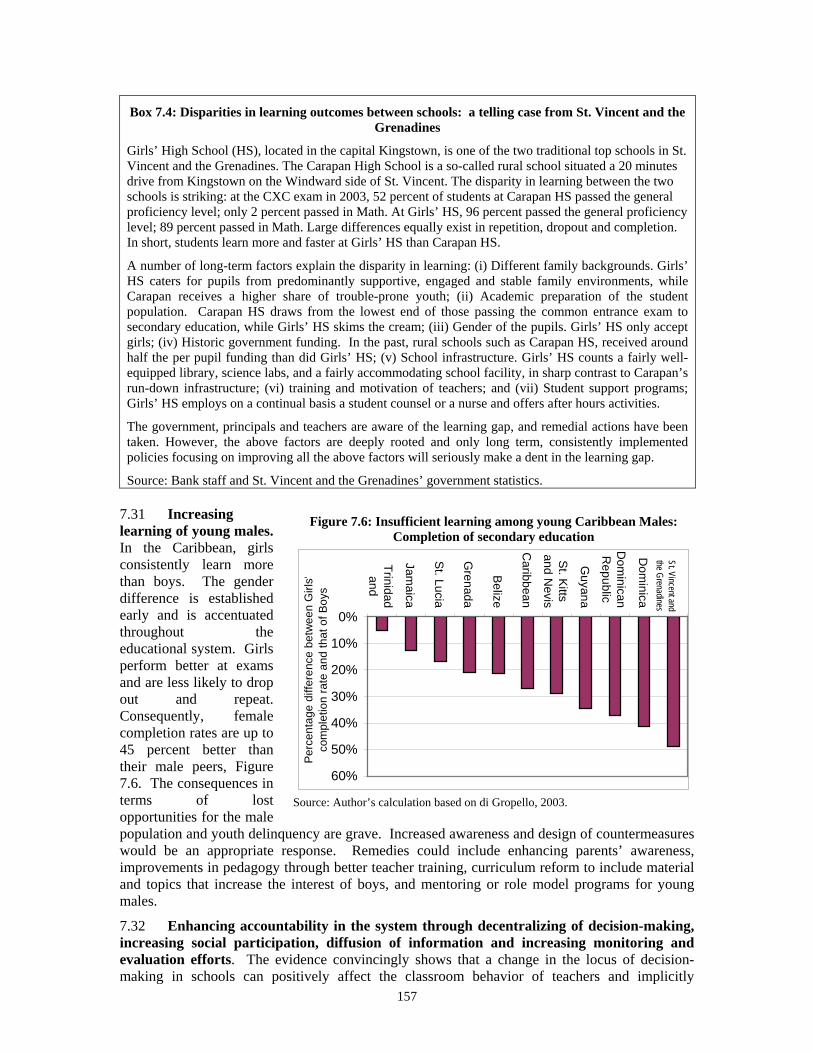
157
Box 7.4: Disparities in learning outcomes between schools: a telling case from St. Vincent and the Grenadines
Girls’ High School (HS), located in the capital Kingstown, is one of the two traditional top schools in St. Vincent and the Grenadines. The Carapan High School is a so-called rural school situated a 20 minutes drive from Kingstown on the Windward side of St. Vincent. The disparity in learning between the two schools is striking: at the CXC exam in 2003, 52 percent of students at Carapan HS passed the general proficiency level; only 2 percent passed in Math. At Girls’ HS, 96 percent passed the general proficiency level; 89 percent passed in Math. Large differences equally exist in repetition, dropout and completion. In short, students learn more and faster at Girls’ HS than Carapan HS.
A number of long-term factors explain the disparity in learning: (i) Different family backgrounds. Girls’ HS caters for pupils from predominantly supportive, engaged and stable family environments, while Carapan receives a higher share of trouble-prone youth; (ii) Academic preparation of the student population. Carapan HS draws from the lowest end of those passing the common entrance exam to secondary education, while Girls’ HS skims the cream; (iii) Gender of the pupils. Girls’ HS only accept girls; (iv) Historic government funding. In the past, rural schools such as Carapan HS, received around half the per pupil funding than did Girls’ HS; (v) School infrastructure. Girls’ HS counts a fairly well-equipped library, science labs, and a fairly accommodating school facility, in sharp contrast to Carapan’s run-down infrastructure; (vi) training and motivation of teachers; and (vii) Student support programs; Girls’ HS employs on a continual basis a student counsel or a nurse and offers after hours activities.
The government, principals and teachers are aware of the learning gap, and remedial actions have been taken. However, the above factors are deeply rooted and only long term, consistently implemented policies focusing on improving all the above factors will seriously make a dent in the learning gap.
Source: Bank staff and St. Vincent and the Grenadines’ government statistics. 7.31 Increasing learning of young males. In the Caribbean, girls consistently learn more than boys. The gender difference is established early and is accentuated throughout the educational system. Girls perform better at exams and are less likely to drop out and repeat. Consequently, female completion rates are up to 45 percent better than their male peers, Figure 7.6. The consequences in terms of lost opportunities for the male population and youth delinquency are grave. Increased awareness and design of countermeasures would be an appropriate response. Remedies could include enhancing parents’ awareness, improvements in pedagogy through better teacher training, curriculum reform to include material and topics that increase the interest of boys, and mentoring or role model programs for young males.
7.32 Enhancing accountability in the system through decentralizing of decision-making, increasing social participation, diffusion of information and increasing monitoring and evaluation efforts. The evidence convincingly shows that a change in the locus of decision-making in schools can positively affect the classroom behavior of teachers and implicitly
Figure 7.6: Insufficient learning among young Caribbean Males: Completion of secondary education
0%
10%
20%
30%
40%
50%
60%
Trinidadand
Jamaica
St. Lucia
Grenada
Belize
Caribbean
St. K
ittsand N
evis
Guyana
Dom
inicanR
epublic
Dom
inica
Perc
enta
ge d
iffer
ence
bet
wee
n G
irls'
com
plet
ion
rate
and
that
of B
oys
St. Vincent and the Grenadines
Source: Author’s calculation based on di Gropello, 2003.
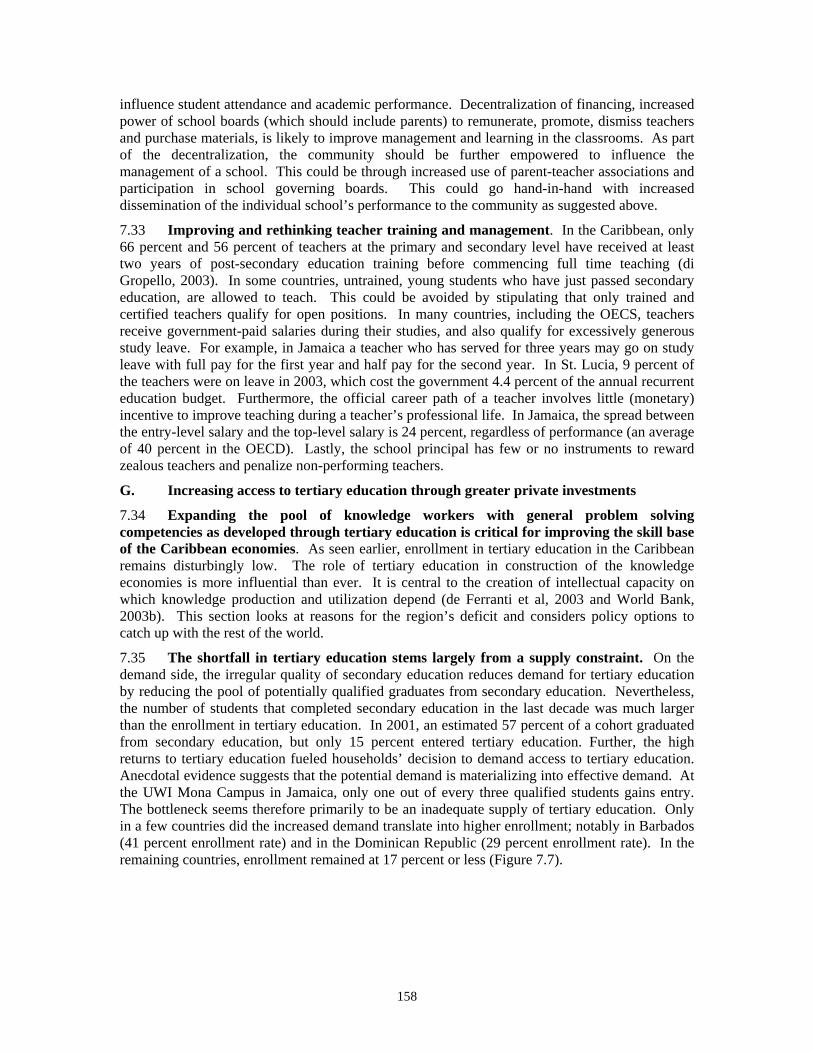
158
influence student attendance and academic performance. Decentralization of financing, increased power of school boards (which should include parents) to remunerate, promote, dismiss teachers and purchase materials, is likely to improve management and learning in the classrooms. As part of the decentralization, the community should be further empowered to influence the management of a school. This could be through increased use of parent-teacher associations and participation in school governing boards. This could go hand-in-hand with increased dissemination of the individual school’s performance to the community as suggested above.
7.33 Improving and rethinking teacher training and management. In the Caribbean, only 66 percent and 56 percent of teachers at the primary and secondary level have received at least two years of post-secondary education training before commencing full time teaching (di Gropello, 2003). In some countries, untrained, young students who have just passed secondary education, are allowed to teach. This could be avoided by stipulating that only trained and certified teachers qualify for open positions. In many countries, including the OECS, teachers receive government-paid salaries during their studies, and also qualify for excessively generous study leave. For example, in Jamaica a teacher who has served for three years may go on study leave with full pay for the first year and half pay for the second year. In St. Lucia, 9 percent of the teachers were on leave in 2003, which cost the government 4.4 percent of the annual recurrent education budget. Furthermore, the official career path of a teacher involves little (monetary) incentive to improve teaching during a teacher’s professional life. In Jamaica, the spread between the entry-level salary and the top-level salary is 24 percent, regardless of performance (an average of 40 percent in the OECD). Lastly, the school principal has few or no instruments to reward zealous teachers and penalize non-performing teachers.
G. Increasing access to tertiary education through greater private investments
7.34 Expanding the pool of knowledge workers with general problem solving competencies as developed through tertiary education is critical for improving the skill base of the Caribbean economies. As seen earlier, enrollment in tertiary education in the Caribbean remains disturbingly low. The role of tertiary education in construction of the knowledge economies is more influential than ever. It is central to the creation of intellectual capacity on which knowledge production and utilization depend (de Ferranti et al, 2003 and World Bank, 2003b). This section looks at reasons for the region’s deficit and considers policy options to catch up with the rest of the world.
7.35 The shortfall in tertiary education stems largely from a supply constraint. On the demand side, the irregular quality of secondary education reduces demand for tertiary education by reducing the pool of potentially qualified graduates from secondary education. Nevertheless, the number of students that completed secondary education in the last decade was much larger than the enrollment in tertiary education. In 2001, an estimated 57 percent of a cohort graduated from secondary education, but only 15 percent entered tertiary education. Further, the high returns to tertiary education fueled households’ decision to demand access to tertiary education. Anecdotal evidence suggests that the potential demand is materializing into effective demand. At the UWI Mona Campus in Jamaica, only one out of every three qualified students gains entry. The bottleneck seems therefore primarily to be an inadequate supply of tertiary education. Only in a few countries did the increased demand translate into higher enrollment; notably in Barbados (41 percent enrollment rate) and in the Dominican Republic (29 percent enrollment rate). In the remaining countries, enrollment remained at 17 percent or less (Figure 7.7).
159
Figure 7.7: Tertiary Education: How Investment and Enrollment relate
0.0%
0.5%
1.0%
1.5%
2.0%
2.5%
3.0%
Barb
ados
Domi
nican
Repu
blic
Carib
bean
aver
age
St. L
ucia
Gren
ada
St. K
itts an
dNe
vis OECS
avea
rage
Domi
nica
St. V
incen
tan
d the
Gren
adine
sInves
tmen
t in T
ertia
ry ed
ucati
on (%
of
GDP)
0%
10%
20%
30%
40%
Enro
lmen
t rate
in T
ertia
ry ed
ucati
onPrivate investment (left scale)Public investment (left scale)Enrolment rate (right scale)
Source: Authors’ own calculation based on UNESCO and country sources.
7.36 The enrollment variation reflects strikingly different approaches towards financing of tertiary education. Until recently, the English-speaking Caribbean relied exclusively on public financing and provision of tertiary education. A part of this funding is allocated to the University of the West Indies – one of the best examples of the potential and challenges of regional collaborations, Box 7.5. It is only lately that non-governmental providers have emerged as significant players in Jamaica (30 percent of enrollment in 2002, World Bank, 2003c). A distressed fiscal situation in the bulk of the countries is often blamed for the severely constrained resources to expand tertiary education. (However, in line with good practice, governments maintained funding of primary and secondary education during the periods where fiscal restraints were necessary). This has benefited low and middle-income segments of the population. The group of countries with low private participation in tertiary education (OECS, Jamaica, Belize, Guyana and Trinidad and Tobago) invests around one percent of GDP in tertiary education, almost exclusively public funds. The exception in the English-speaking Caribbean is Barbados, which invests a record share on education (8.3 percent of GDP), allowing it to channel 2.4 percent of GDP to tertiary education. In contrast, the Dominican Republic relies predominantly on private financing—the public sector devotes only 0.3 percent of GDP to tertiary education, while households invest a total of 1 percent of GDP (Liz, 2003).
160
Box 7.5: The University of West Indies: The potential and challenge of cooperation
The University of the West Indies (UWI) was established in 1962. It is an autonomous regional institution supported by and serving 15 different countries in the West Indies. It is governed by a Pan-Caribbean University Council. The university’s raison d’être is the existence of economies of scale in tertiary education and science, that cannot be realized at the national level in the Caribbean. In other words, the region needs a critical mass of intellectual capacity that can fuel the region’s development through skill formation and knowledge. As is the case for other areas of cooperation, cooperation in tertiary education is not without difficulties. Although it is by far the region’s best-known multiple- faculty university, it is not well-known for academic excellence outside the region. Further, it has not been able to address the region’s low enrollment in tertiary education.
These problems could be partially caused by the region’s inability to overcome difficulties related to cooperation, such as: (i) lack of clear accountability and financing mechanism between the member states and the institution; (ii) complications related to differences in needs between smaller and larger member nations; and (iii) the necessity of serving local needs (partially facilitated in the case of UWI through decentralization into three semi-autonomous campuses). Continued reform aiming, among other things, to increase accountability, seems appropriate. On the whole, UWI exemplifies that cooperation is necessary, worthwhile and indeed the way forward.
7.37 Increasing private financing is critical for expansion of tertiary education in the Caribbean. Public spending on higher education is well known to be highly regressive, since the majority of students come from well-off families. For example, in Jamaica, 77 percent of all tertiary students come from the richest quintile of the population. Further, few of the region’s governments have additional resources of the magnitude that Barbados has. For example, an increase of one to 1.5 percent of GDP is required for bringing investment in tertiary education to the level of Barbados. Additionally, a significant share of graduates leaves the country. As shown in chapter 6 of this report, workers with tertiary education are most likely to take up employment outside of the region. This leads to at least a temporary brain drain and reduction in skills for local development, implying that the sending countries are subsidizing the human capital formation of the advanced countries. The large outflow of graduates reduces the economic benefits to the state from public investment in education, since the benefits from education in terms of taxes and higher ability to assist firms in the adoption of new technology do not accrue to the country. Therefore, migration outflow should further propel governments to shift the costs of tertiary education towards households. This would reduce the loss to the state, should the graduate decide to leave. Overall, continued reliance on public finance for expanding tertiary education appears to be an unsustainable and unattractive policy.
7.38 Given the high returns to tertiary education, increased private financing could be sustainable in the long run, if facilitated by student loans, and scholarships for the most needy. Reliable financial aid programs would be necessary to assist low-income households in lowering the immediate burden of tuition fees and reducing the financial risks from possible dropout and unemployment. Other nations have increased private investment in tertiary education by: (i) encouraging non-governmental providers to invest; (ii) ensuring a host of financial support programs are available to low and middle-income students ranging from pure scholarships to unsubsidized student loans; (iii) stimulating quality improvements of non-governmental providers; (iv) informing and encouraging prospective students to enroll; and (v) reforming tuition fees. Box 6 summarizes successful tertiary education financing reforms in Australia and the UK.
161
Box 7.6: Gradually reforming Higher Education Financing: The Australian and British reforms
Both the UK and Australia have over the last fifteen years gradually reformed financing of tertiary education to accommodate expansion and more directly align costs and benefits of tertiary education, with the benefits going to students while costs being shouldered by taxpayers. The reforms consist of two main elements:
• Increasing decentralization of fee decisions. First, a uniform tuition fee was introduced. Second, fees were differentiated into brackets based on cost of discipline and future benefits. Third, a new adjustment in UK foresees a decentralization of the fee decision to the university (equally discussed in Australia). Further, the adjustments gradually raised student fees. Finally, the fees collected go directly to the university.
• Income-contingent Student Loan support. The student chooses to either defer the payment via an automatically approved, state-financed loan or paying the commencement fee up-front (with a 15 percent discount). Repayment of the loan is income contingent implying that repayment is only compulsory above a certain income threshold, and the amount is proportional to income (3-5 percent). Consequently, the state assumes the financial risks associated with higher education and only successful, capable graduates are required to repay.
The reforms did not happen overnight, but were more a process of continual adjustments guided by constant evaluation, public debate and government proposals. In the Australian case, at least 6 adjustments were made during the first 10 years. The latest adjustment in UK was propelled by the Blair government in April 2004 proposing, among other adjustments, increased tuition fees, decentralization of the fee decision to the institutions, and higher grants for low-income students. Considerable public debate and controversy surround these measures. When the reforms were introduced opponents claimed that the reform would deter students from pursuing tertiary education, especially those from disadvantaged backgrounds. An Australian evaluation report concluded that the reforms did not appear to limit equal access (GoAu, 2001). The reforms greatly increased private investment into higher education. In Australia, private investment amounted to 0.7 percent of GDP in 2000, and facilitated an expansion of 30 percent of the tertiary education system during the 1990s. Further, the introduction of fees increased pressures on institutions to meet students’ needs, including higher quality and relevance. Sources: LaRocque, 2003, GoAu, 2001, GoGB, 2004.
7.39 Developing a strong private sector for tertiary education could pose greater difficulties in the Caribbean than in larger countries. The smallness of the individual islands and the multi-country setting is likely to reduce the region’s attractiveness to private providers, since delivery of tertiary education entails significant economies of scale and requires regulatory stability. This would partially explain why private providers have shown greater responsiveness in the Dominican Republic than in the smaller English-speaking nations.180 Such a situation would call for a greater public effort to attract private providers. One line of action could be financial incentives to seek greater public-private partnerships. An example is the partnership between Grenada’s Community College and the private St. George University. This partnership allows local youth to benefit from the quality programs offered by one of many offshore universities (i.e. institutions which are located in the Caribbean but catering to students from the US). Another option is the development of distance learning programs using the Caribbean Knowledge and Learning Network (CKLN). The use of information and communication technology (ICT) through the CKLN not only facilitates increased cooperation among Caribbean education providers, but also offers economies of scale to attract private investment, that would, in turn, help improve the quality and relevance of courses. Since numerous learning programs are already available all over the world, the challenge for governments is to mobilize the necessary private investment for these to be provided to tertiary level students in the Caribbean.
180 With the notable exception of private providers located in the OECS, but catering almost exclusively to US students, such as Ross Medical University (see Chapter 5).
162
7.40 While facilitating private investment in tertiary education, it is equally important to ensure that public funding for tertiary education is applied efficiently and according to clear criteria. For this purpose, the Ministries of Education could consider breaking with past funding policies, and demand greater transparency and accountability regarding tertiary level institutions’ use of public funds. This would entail a mix of: (i) introducing performance-based contracts between the government and the providers; (ii) instituting transparent competitive funding; and/or (iii) financing institutions based on a funding formula (Thorn et al, 2004 describes common funding practices in the OECD). Furthermore, actions to diversify the revenue base of public institutions are needed, such as sale of consultancy services, commercialization of R&D and encouragement of donations.
H. Producing Skills Demanded by Employers
7.41 The preceding two sections discussed outcomes and policies related to the quality of, and access to, education. This section analyzes the relevance of acquired skills. It argues that the education and training system needs to produce workers with skills more closely aligned with the demand from employers. It looks at the two elements of the education and training system that should have the closest links with the labor market: (i) Job training and (ii) Tertiary education.
Financing and Providing Job training to Match Demand
7.42 The aim of job training is to build upon existing abilities of the worker, providing learning opportunities for acquiring new competencies directly related to creation of value-added within companies. Training should be seen as a complementary policy to education and technology, since firms choose to train employees if: (i) their employees are well educated; (ii) new technologies are introduced; and (iii) financial incentives for training are provided. Training therefore often has an incremental character with a specific learning objective to be acquired in a relatively short period. The decisions regarding training—work routines, skills to be taught, length and provider of training—should take place at the firm level to ensure relevance and impact of training. International evaluations (summarized in Gill and Dar, 2003) confirm this logic by empirically demonstrating the marked difference in outcomes between privately-financed training and publicly-decided courses, even when controlling for other factors. It is therefore critical that job training be highly demand-driven in order to improve employee/plant productivity and job-placement for unemployed.
7.43 Caribbean firms train their workers less than firms in Latin America. Marquez (2002) find that 85 percent of firms in the Dominican Republic provide training to their employees on a yearly basis, which compares with 65 percent in Belize, 54 percent in Haiti and 41 percent in Trinidad and Tobago. A country specific survey for Jamaica indicates that over 90 percent of firms in Jamaica train their workers. These numbers suggest that in many Caribbean countries, including Trinidad and Tobago, one of the regional leaders in manufacturing, firm-initiated incidence of training is below the regional average for Latin America (75 percent). Analysis in this report suggests that the relative shortfall in training occurs in spite of a relatively high share of workers with secondary education, because of the low tendency of firms to innovate through technology upgrading, and the lack of incentive programs for firm-based training.
7.44 Job training is a poor substitute for education. Job training overwhelmingly benefits the medium and high skilled workers. In both Jamaica and the Dominican Republic, more than three quarters of recipients of training held a secondary education diploma (McArdler, 2004). Further, Marquez (2002) finds that in all surveyed countries (Trinidad and Tobago, Haiti, the Dominican Republic and Belize) technicians, supervisors and skilled workers are around twice as likely to receive training as unskilled workers. Ashton (2000) confirms the same ratio for Barbados. Hence, as is the case in the rest of the world, low-skilled workers are not “investment-grade”. They tend to lack the foundations for learning, thus rendering training costly and ineffective. Training should therefore not be seen as a substitute for education or a placement for
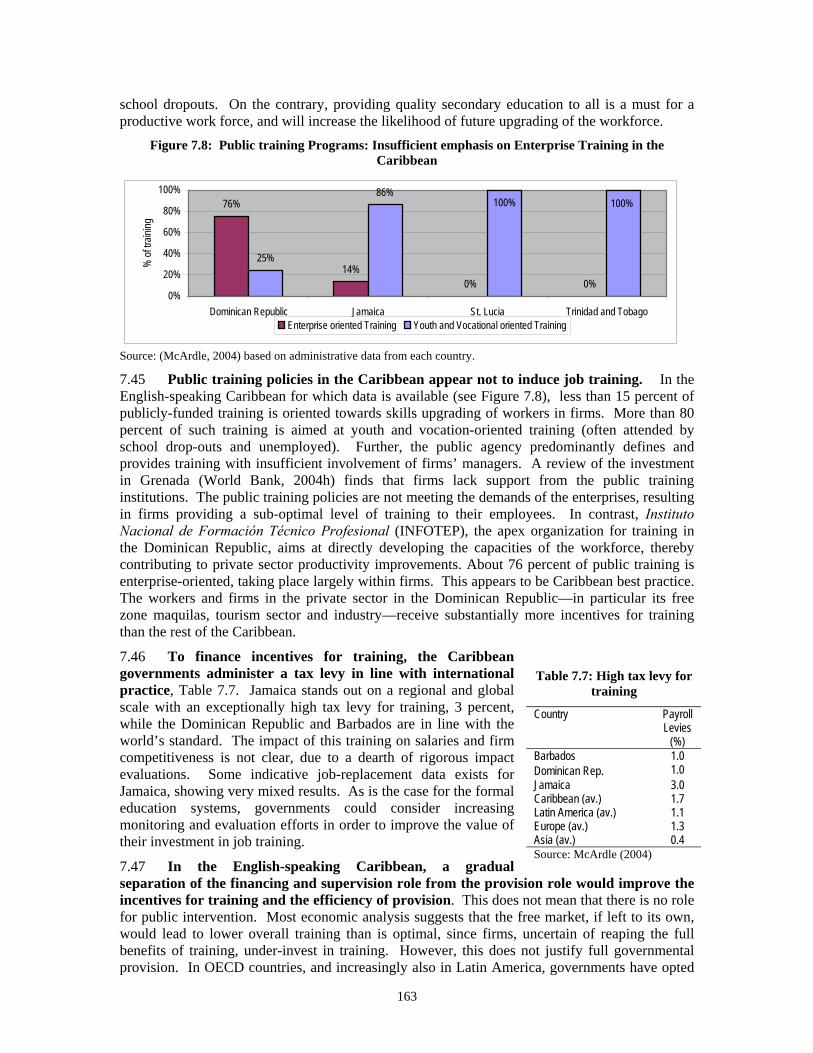
163
school dropouts. On the contrary, providing quality secondary education to all is a must for a productive work force, and will increase the likelihood of future upgrading of the workforce.
Figure 7.8: Public training Programs: Insufficient emphasis on Enterprise Training in the Caribbean
76%
14%0% 0%
25%
86%100%100%
0%
20%
40%
60%
80%
100%
Dominican Republic Jamaica St. Lucia Trinidad and Tobago
% of
train
ing
Enterprise oriented Training Youth and Vocational oriented Training
Source: (McArdle, 2004) based on administrative data from each country.
7.45 Public training policies in the Caribbean appear not to induce job training. In the English-speaking Caribbean for which data is available (see Figure 7.8), less than 15 percent of publicly-funded training is oriented towards skills upgrading of workers in firms. More than 80 percent of such training is aimed at youth and vocation-oriented training (often attended by school drop-outs and unemployed). Further, the public agency predominantly defines and provides training with insufficient involvement of firms’ managers. A review of the investment in Grenada (World Bank, 2004h) finds that firms lack support from the public training institutions. The public training policies are not meeting the demands of the enterprises, resulting in firms providing a sub-optimal level of training to their employees. In contrast, Instituto Nacional de Formación Técnico Profesional (INFOTEP), the apex organization for training in the Dominican Republic, aims at directly developing the capacities of the workforce, thereby contributing to private sector productivity improvements. About 76 percent of public training is enterprise-oriented, taking place largely within firms. This appears to be Caribbean best practice. The workers and firms in the private sector in the Dominican Republic—in particular its free zone maquilas, tourism sector and industry—receive substantially more incentives for training than the rest of the Caribbean.
7.46 To finance incentives for training, the Caribbean governments administer a tax levy in line with international practice, Table 7.7. Jamaica stands out on a regional and global scale with an exceptionally high tax levy for training, 3 percent, while the Dominican Republic and Barbados are in line with the world’s standard. The impact of this training on salaries and firm competitiveness is not clear, due to a dearth of rigorous impact evaluations. Some indicative job-replacement data exists for Jamaica, showing very mixed results. As is the case for the formal education systems, governments could consider increasing monitoring and evaluation efforts in order to improve the value of their investment in job training.
7.47 In the English-speaking Caribbean, a gradual separation of the financing and supervision role from the provision role would improve the incentives for training and the efficiency of provision. This does not mean that there is no role for public intervention. Most economic analysis suggests that the free market, if left to its own, would lead to lower overall training than is optimal, since firms, uncertain of reaping the full benefits of training, under-invest in training. However, this does not justify full governmental provision. In OECD countries, and increasingly also in Latin America, governments have opted
Table 7.7: High tax levy for training
Country Payroll Levies
(%) Barbados 1.0 Dominican Rep. 1.0 Jamaica 3.0 Caribbean (av.) 1.7 Latin America (av.) 1.1 Europe (av.) 1.3 Asia (av.) 0.4 Source: McArdle (2004)
164
to move out of provision, owing to disappointing results with publicly-provided programs. More sophisticated interventions are preferred, such as reliance on a private market for training, with regulation of providers combined with incentive schemes for training. In the Caribbean, most programs are publicly provided by a state training institute (HEART/NTA in Jamaica, Barbados TVET, National Training Agency of Trinidad and Tobago) or the Ministry of Education, as is the case in the OECS countries. Only the Dominican Republic and Barbados allocate a significant portion of their budget towards demand-driven and incentive-based training schemes, where the firm is the central decision maker. Box 7.8 presents international good practice of an incentive–based scheme from Mexico.
Box 7.7: Mexican experiences in support of SMEs
Established in 1988 under the direction of the Ministry of Labor, CIMO (Programa Calidad Integral y Modernización, Integral Quality and Modernization Program) assists SMEs to upgrade worker skills, improve the quality of production, and raise overall productivity.
CIMO works with interested small and medium-sized enterprises through a government subsidized cost-sharing program that provides training assistance and helps to conduct an initial diagnostic evaluation of the participating firm. Based on the diagnostic, CIMO staff members organize workshops on training and technical assistance services, identify potential local and regional training consultants, and actively seek out SMEs for collaborative endeavors.
The empirical evidence suggests that Mexico’s CIMO program of integrated training and technical assistance has been effective at improving the performance of SMEs. Compared to the control group, CIMO firms increased investments in worker training, had higher rates of capacity utilization, and were more likely to adopt quality control practices. The evidence suggests that these improved intermediate outcomes were associated with increased productivity growth among CIMO participants, and were especially strong in the 1991-93 period. It is important to note that the productivity impact of CIMO was not initially apparent in the 1993-95 period, when the economy experienced a major crisis. However, when the data was re-examined using difference in difference methods, the program’s impact on firm productivity turned positive. This evidence on the productivity impact of CIMO is particularly noteworthy when it is recognized that the program tends to attract weaker, lower performing micro and small enterprises, and that the training and technical assistance provided to these firms are effective in narrowing their productivity disadvantage relative to better performing non-participants. Source: World Bank 2004f.
7.48 The establishment of a regional market for training providers would improve the value of training to the Caribbean workers and firms. The governments of the Caribbean could increase regional cooperation by creating a common market for training services. Such a market would allow training providers to compete for training of workers—financed by public and private resources. It would (i) enhance the quality of training offered to the employee and the company through increased competition and specialization; (ii) increase efficiency through realization of economies of scale, such as fewer purchases of apparatus and training equipment; and (iii) create a framework for mutual recognition of training certificates that would facilitate the flow of labor within the Caribbean. An industry like tourism that is manpower intensive and Caribbean-wide could benefit from such a common market for training services. Several countries in the English-speaking Caribbean including Barbados, Jamaica, the OECS, and Trinidad and Tobago have joined the Caribbean Association of National Training Agencies, CANTA. This organization seeks to share occupational standards, ensure mutual recognition of technical and vocational certificates, and facilitate the implementation of the goal of free movement of skilled labor within the Caribbean Single Market and Economy (CSME). The governments could consider building upon CANTA to create a single market for training services within the region, and also to ensure international portability of the occupational standards and certification.
165
Reforming Tertiary Education to Increase Responsiveness to National Needs
7.49 In the past, tertiary education consisted exclusively of universities seeking to advance understanding for its own intellectual value. Nowadays, with the advent of knowledge as a key production factor, the pure, publicly-financed research institution needs to change to better serve the needs of the economy. Universities, Technology Institutes and Community Colleges need to create “knowledge workers” that can be productively employed, and create and communicate knowledge relevant to local, regional and national needs. Further, increased linkages between educational institutions and enterprises would increase informal contacts, so important for finding jobs and shortening the job-search period. This would also improve the employment situation of recent graduates, thus leading to a reduction in the brain drain.
7.50 The available information suggests that the region’s tertiary level institutions could improve their service to the private sector. The Global Competitiveness Report 2003 asked companies for their views on the state of University-Industry collaboration. The Dominican Republic was the only country in the region scoring above the world average, 3.7 on a scale of 7; other Caribbean countries surveyed were Jamaica (3.3), Trinidad and Tobago (3.0) and Haiti (1.9). It is also useful to analyze the mission and governance structures of institutions. On this account, the two flagship institutions of the Caribbean, the University of the West Indies (UWI) and Universidad Autόnoma de Santo Domingo (UASD) seem slow to adopt the new paradigm. UWI mission’s includes a reference to servicing local needs; nevertheless the 2002-2007 strategic plan appears to lack key initiatives for enhancing outreach to the productive sector. Similarly, the mission of UASD lacks reference to the need to communicate and interact with the business community for the economic benefit of the region (UASD, 2004). Further, both institutions have a majority of academics in the governing board and a strong tradition for management by the faculty; both features are prone to lead to academic inwardness. This could explain why experts in the region are concerned with the lack of relevance. For example, Liz (2003) points to an over-supply of social and commercial graduates in the Dominican Republic. In contrast, Barbados Community College provides a good example of accommodating the needs of the private sector, Box 7.7. Obviously, the above is only indicative. In-depth studies are required to assess how Caribbean tertiary institutions respond to local, regional and national needs.181
181 At the same time, a pro-active engagement by companies of education providers would help. Companies and employers’ associations are critically dependent upon the quality and relevance of the skills of the workforce and therefore should increasingly seek to engage in dialogue with education providers. Without private sector interest in workforce formation and in public research, the outreach will remain ineffective.
Box 7.8: How the Barbados Community College Accommodates the Needs of Firms
The Barbados Community College could be one of the region’s best examples of bridge-building with the productive sector. It has put into action several strategies to ensure that teaching is relevant to the nation’s needs: 1. An external governing board that counts seven private sector representatives out of nine members, and the members represent the major sectors that college graduates work in (Retail, Banking, Oil, Manufacturing, Legal, Health, Education/Culture and the IT sector). 2. Advisory committees for each division of the College, which consist of professionals directly related to the sectors represented by the division. The committees meet at least every semester. 3. Sale of training and consulting services to firms, often carried out via an industry service unit located in the industrial area of Bridgetown. 4. Facilitation of staff exchanges/attachments with firms through flexible staff rules. These activities not only contribute to the provision of relevant skills and business services, but also augment the college revenue by more than 5 percent.
Source: Barbados Community College.
166
7.51 A reform of the governance and funding of public universities also seems warranted. Most high-income countries, notably Australia, Britain, Netherlands, and the US, are undertaking reforms to improve the service of tertiary level providers (OECD, 2004b). The Caribbean could consider following in their footsteps by implementing similar initiatives—appropriately adapted to the region’s needs—such as: (i) studying the education sector to analyze the obstacles to cooperation between institutions of higher learning and the productive sector, and the value of such cooperation; (ii) instituting external boards with private sector participation; (iii) increasing accountability of outreach; and (iv) introducing competitive funding programs to provide seed-money for innovation and responsiveness, such as for new courses critical to local competitiveness, or other initiatives linking education and business. International evidence suggests such reforms of public institutions are more likely to succeed if (a) the reforms are preceded by public debate and involvement of the educational institutions; (b) institutions enjoy a high level of autonomy that allows them to credibly plan and implement actions; and (c) there exist periodic external evaluations to ensure strong accountability for public funds.
I. Facilitating the development of Technology in the Caribbean
7.52 In developing countries, and especially in small developing countries, introduction of new products/services is normally done through a process of importing existing technology, or copying existing ideas.182 This is a process of experimentation and ‘discovery’, since conditions in each country are very different, and each firm, in fact, develops a unique method of production (an ‘idiosyncratic production function’) in the process of implementing an existing technology. Even though the technology is not new, the process of experimentation, adaptation and optimization for local conditions can be costly. And yet, these outcomes (learning what can be produced) can be easily copied, leading to the under-supply of entrepreneurship that produces such outcomes, since the returns to such investments cannot be fully appropriated. In turn, this will delay diversification and economic transformation of economies.
7.53 In order to facilitate investments in such learning, governments try to reduce the risks associated with such investments, which can be done by reducing costs or by increasing appropriability. At the same time, a competitive environment is needed in order to induce entrepreneurs to take risks in the first place.
7.54 Appropriability can be increased through increased protection from foreign competition, but as seen in Chapter 4, this kind of protection in the Caribbean has led to complacency and exploitation of rents, and under-supply of entrepreneurship. Also, protection does not protect the first mover from domestic imitators. Patents are, of course, not applicable to copied products. Even if the foreign technology is licensed, the product is vulnerable to competition from domestic imitators, and in any case patent enforcement is often weak.
7.55 Reducing costs of greater investment in product diversification by firms has been, implicitly or explicitly, the subject of much of this report. A simple scheme that captures the essence of this and the overall ‘National Innovation System’ is reproduced in Figure 7.9.
182 This draws on Hausmann and Rodrik (2003). See also Chapter 3.
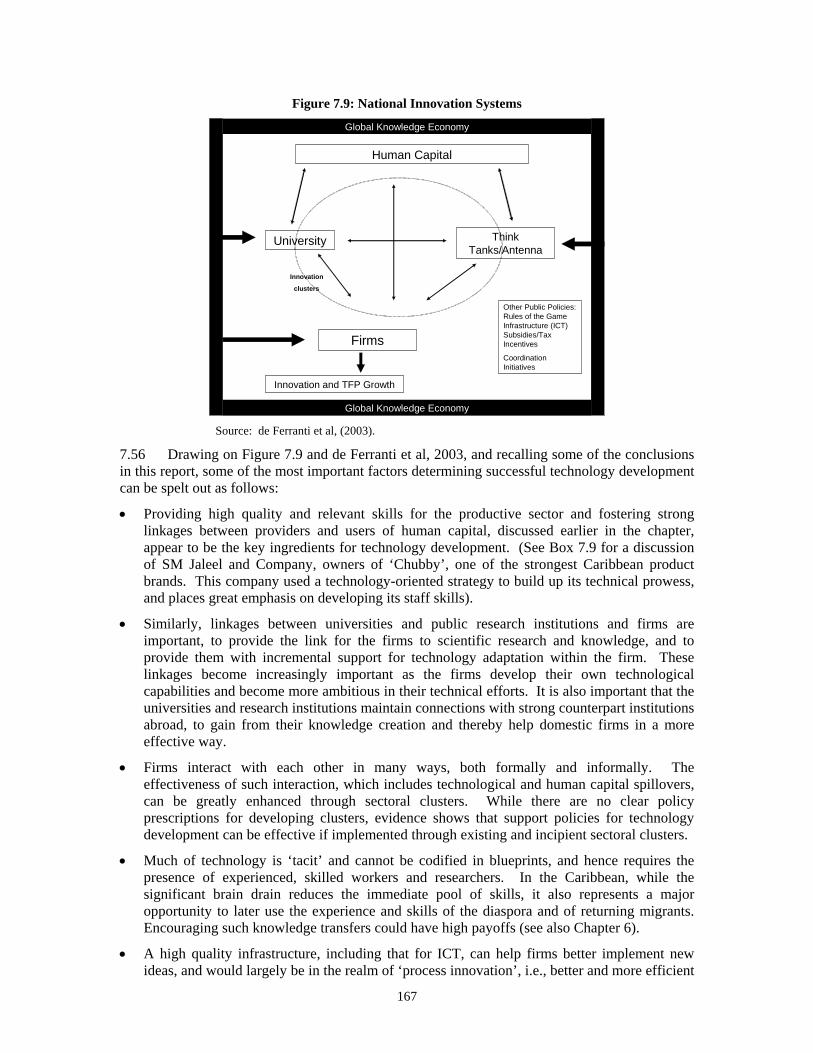
167
Figure 7.9: National Innovation Systems
Firms
Innovation and TFP Growth
Other Public Policies: Rules of the Game Infrastructure (ICT) Subsidies/Tax Incentives
Coordination Initiatives
University
Human Capital
Think Tanks/Antenna
Global Knowledge Economy
Global Knowledge Economy
Innovation
clusters
Source: de Ferranti et al, (2003).
7.56 Drawing on Figure 7.9 and de Ferranti et al, 2003, and recalling some of the conclusions in this report, some of the most important factors determining successful technology development can be spelt out as follows:
• Providing high quality and relevant skills for the productive sector and fostering strong linkages between providers and users of human capital, discussed earlier in the chapter, appear to be the key ingredients for technology development. (See Box 7.9 for a discussion of SM Jaleel and Company, owners of ‘Chubby’, one of the strongest Caribbean product brands. This company used a technology-oriented strategy to build up its technical prowess, and places great emphasis on developing its staff skills).
• Similarly, linkages between universities and public research institutions and firms are important, to provide the link for the firms to scientific research and knowledge, and to provide them with incremental support for technology adaptation within the firm. These linkages become increasingly important as the firms develop their own technological capabilities and become more ambitious in their technical efforts. It is also important that the universities and research institutions maintain connections with strong counterpart institutions abroad, to gain from their knowledge creation and thereby help domestic firms in a more effective way.
• Firms interact with each other in many ways, both formally and informally. The effectiveness of such interaction, which includes technological and human capital spillovers, can be greatly enhanced through sectoral clusters. While there are no clear policy prescriptions for developing clusters, evidence shows that support policies for technology development can be effective if implemented through existing and incipient sectoral clusters.
• Much of technology is ‘tacit’ and cannot be codified in blueprints, and hence requires the presence of experienced, skilled workers and researchers. In the Caribbean, while the significant brain drain reduces the immediate pool of skills, it also represents a major opportunity to later use the experience and skills of the diaspora and of returning migrants. Encouraging such knowledge transfers could have high payoffs (see also Chapter 6).
• A high quality infrastructure, including that for ICT, can help firms better implement new ideas, and would largely be in the realm of ‘process innovation’, i.e., better and more efficient
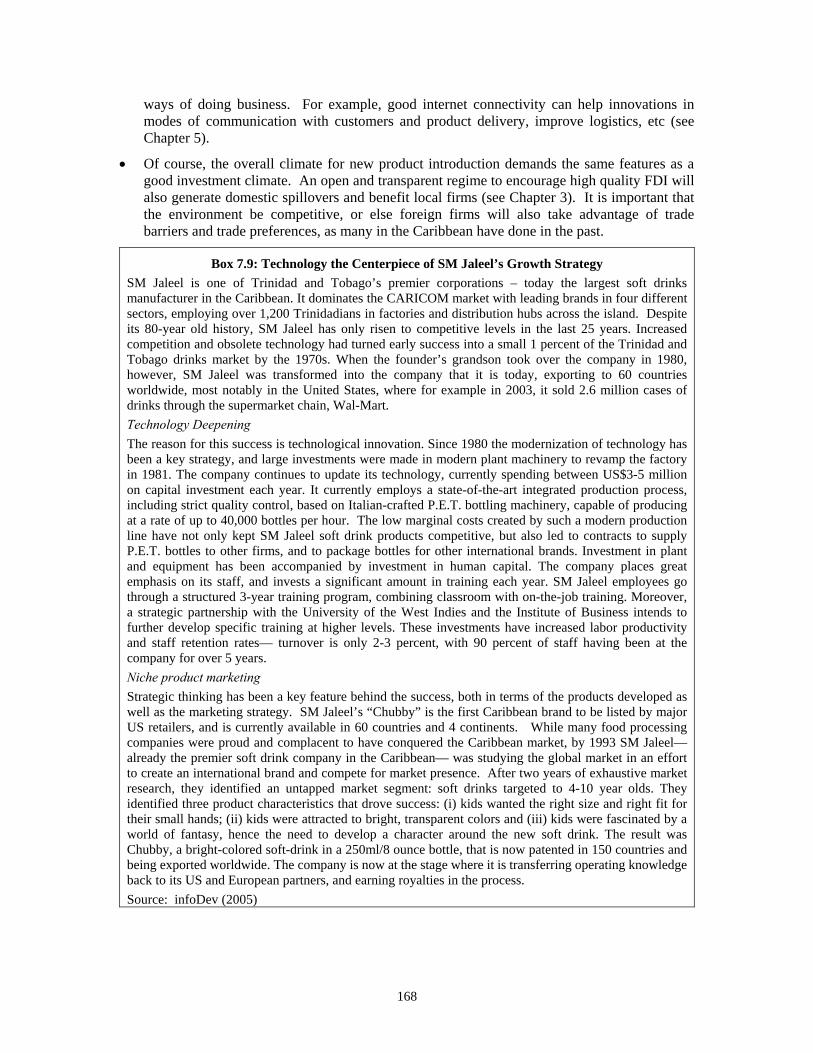
168
ways of doing business. For example, good internet connectivity can help innovations in modes of communication with customers and product delivery, improve logistics, etc (see Chapter 5).
• Of course, the overall climate for new product introduction demands the same features as a good investment climate. An open and transparent regime to encourage high quality FDI will also generate domestic spillovers and benefit local firms (see Chapter 3). It is important that the environment be competitive, or else foreign firms will also take advantage of trade barriers and trade preferences, as many in the Caribbean have done in the past.
Box 7.9: Technology the Centerpiece of SM Jaleel’s Growth Strategy SM Jaleel is one of Trinidad and Tobago’s premier corporations – today the largest soft drinks manufacturer in the Caribbean. It dominates the CARICOM market with leading brands in four different sectors, employing over 1,200 Trinidadians in factories and distribution hubs across the island. Despite its 80-year old history, SM Jaleel has only risen to competitive levels in the last 25 years. Increased competition and obsolete technology had turned early success into a small 1 percent of the Trinidad and Tobago drinks market by the 1970s. When the founder’s grandson took over the company in 1980, however, SM Jaleel was transformed into the company that it is today, exporting to 60 countries worldwide, most notably in the United States, where for example in 2003, it sold 2.6 million cases of drinks through the supermarket chain, Wal-Mart. Technology Deepening The reason for this success is technological innovation. Since 1980 the modernization of technology has been a key strategy, and large investments were made in modern plant machinery to revamp the factory in 1981. The company continues to update its technology, currently spending between US$3-5 million on capital investment each year. It currently employs a state-of-the-art integrated production process, including strict quality control, based on Italian-crafted P.E.T. bottling machinery, capable of producing at a rate of up to 40,000 bottles per hour. The low marginal costs created by such a modern production line have not only kept SM Jaleel soft drink products competitive, but also led to contracts to supply P.E.T. bottles to other firms, and to package bottles for other international brands. Investment in plant and equipment has been accompanied by investment in human capital. The company places great emphasis on its staff, and invests a significant amount in training each year. SM Jaleel employees go through a structured 3-year training program, combining classroom with on-the-job training. Moreover, a strategic partnership with the University of the West Indies and the Institute of Business intends to further develop specific training at higher levels. These investments have increased labor productivity and staff retention rates— turnover is only 2-3 percent, with 90 percent of staff having been at the company for over 5 years. Niche product marketing Strategic thinking has been a key feature behind the success, both in terms of the products developed as well as the marketing strategy. SM Jaleel’s “Chubby” is the first Caribbean brand to be listed by major US retailers, and is currently available in 60 countries and 4 continents. While many food processing companies were proud and complacent to have conquered the Caribbean market, by 1993 SM Jaleel— already the premier soft drink company in the Caribbean— was studying the global market in an effort to create an international brand and compete for market presence. After two years of exhaustive market research, they identified an untapped market segment: soft drinks targeted to 4-10 year olds. They identified three product characteristics that drove success: (i) kids wanted the right size and right fit for their small hands; (ii) kids were attracted to bright, transparent colors and (iii) kids were fascinated by a world of fantasy, hence the need to develop a character around the new soft drink. The result was Chubby, a bright-colored soft-drink in a 250ml/8 ounce bottle, that is now patented in 150 countries and being exported worldwide. The company is now at the stage where it is transferring operating knowledge back to its US and European partners, and earning royalties in the process. Source: infoDev (2005)
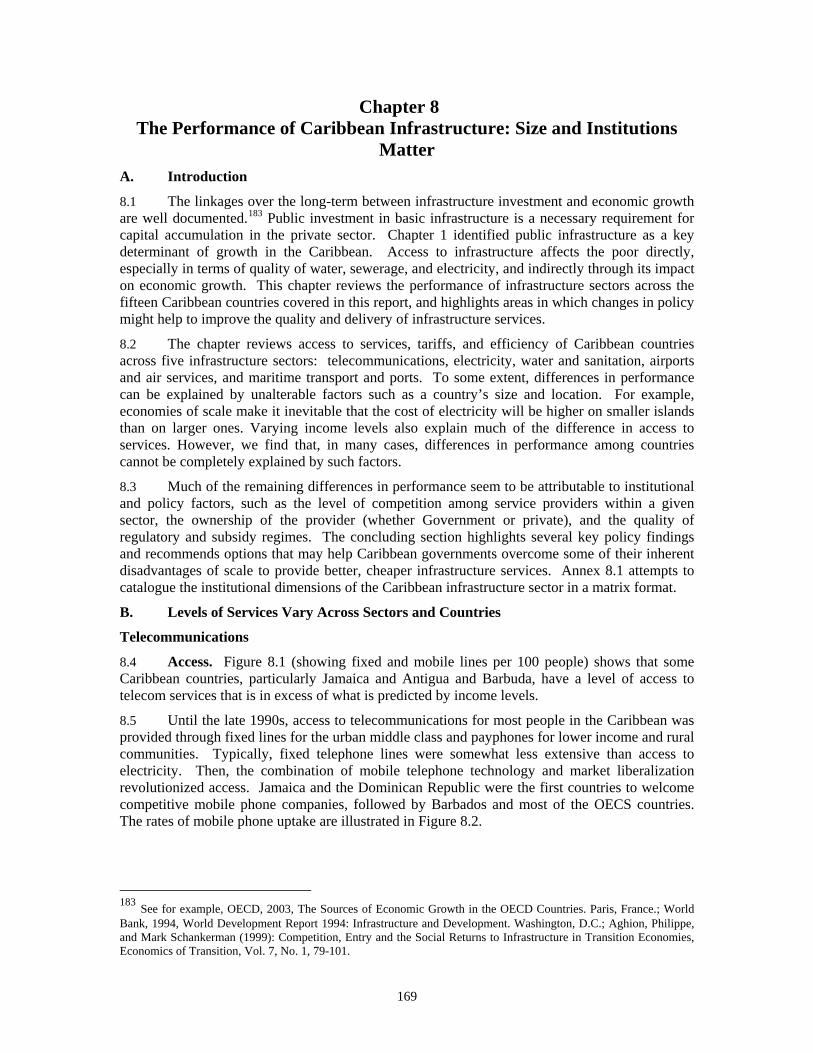
169
Chapter 8 The Performance of Caribbean Infrastructure: Size and Institutions
Matter A. Introduction
8.1 The linkages over the long-term between infrastructure investment and economic growth are well documented.183 Public investment in basic infrastructure is a necessary requirement for capital accumulation in the private sector. Chapter 1 identified public infrastructure as a key determinant of growth in the Caribbean. Access to infrastructure affects the poor directly, especially in terms of quality of water, sewerage, and electricity, and indirectly through its impact on economic growth. This chapter reviews the performance of infrastructure sectors across the fifteen Caribbean countries covered in this report, and highlights areas in which changes in policy might help to improve the quality and delivery of infrastructure services.
8.2 The chapter reviews access to services, tariffs, and efficiency of Caribbean countries across five infrastructure sectors: telecommunications, electricity, water and sanitation, airports and air services, and maritime transport and ports. To some extent, differences in performance can be explained by unalterable factors such as a country’s size and location. For example, economies of scale make it inevitable that the cost of electricity will be higher on smaller islands than on larger ones. Varying income levels also explain much of the difference in access to services. However, we find that, in many cases, differences in performance among countries cannot be completely explained by such factors.
8.3 Much of the remaining differences in performance seem to be attributable to institutional and policy factors, such as the level of competition among service providers within a given sector, the ownership of the provider (whether Government or private), and the quality of regulatory and subsidy regimes. The concluding section highlights several key policy findings and recommends options that may help Caribbean governments overcome some of their inherent disadvantages of scale to provide better, cheaper infrastructure services. Annex 8.1 attempts to catalogue the institutional dimensions of the Caribbean infrastructure sector in a matrix format.
B. Levels of Services Vary Across Sectors and Countries
Telecommunications
8.4 Access. Figure 8.1 (showing fixed and mobile lines per 100 people) shows that some Caribbean countries, particularly Jamaica and Antigua and Barbuda, have a level of access to telecom services that is in excess of what is predicted by income levels.
8.5 Until the late 1990s, access to telecommunications for most people in the Caribbean was provided through fixed lines for the urban middle class and payphones for lower income and rural communities. Typically, fixed telephone lines were somewhat less extensive than access to electricity. Then, the combination of mobile telephone technology and market liberalization revolutionized access. Jamaica and the Dominican Republic were the first countries to welcome competitive mobile phone companies, followed by Barbados and most of the OECS countries. The rates of mobile phone uptake are illustrated in Figure 8.2.
183 See for example, OECD, 2003, The Sources of Economic Growth in the OECD Countries. Paris, France.; World Bank, 1994, World Development Report 1994: Infrastructure and Development. Washington, D.C.; Aghion, Philippe, and Mark Schankerman (1999): Competition, Entry and the Social Returns to Infrastructure in Transition Economies, Economics of Transition, Vol. 7, No. 1, 79-101.
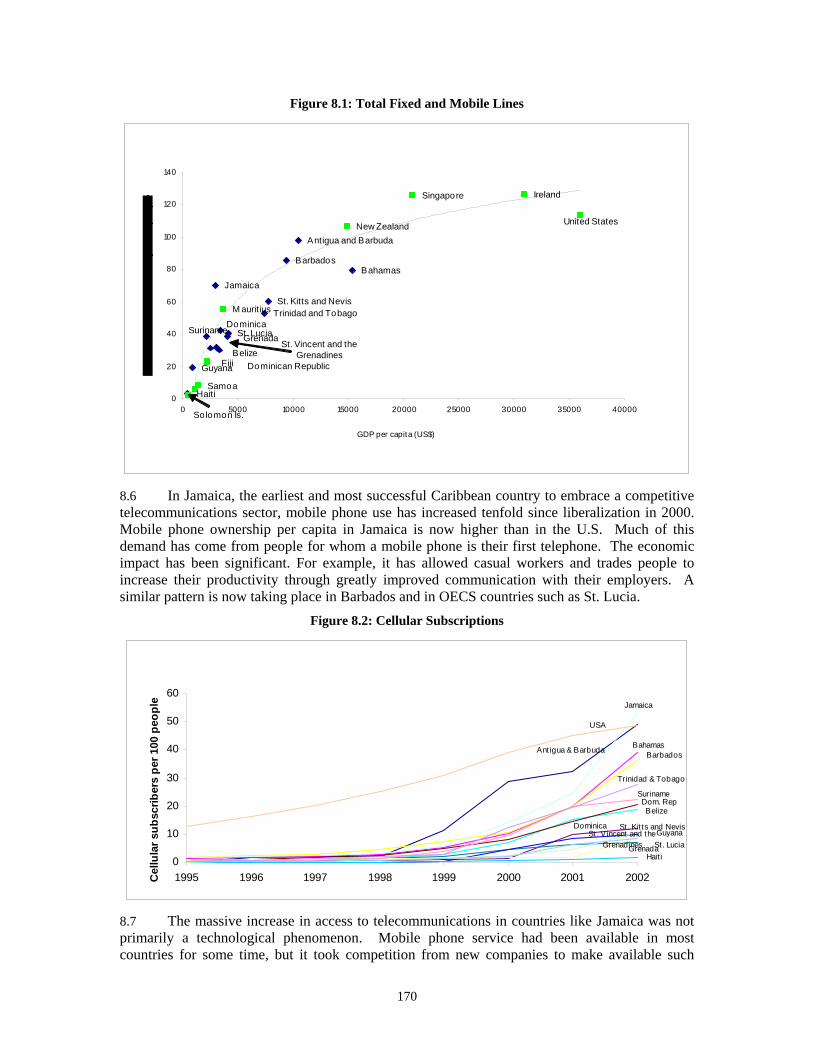
170
Figure 8.1: Total Fixed and Mobile Lines
St. Lucia
St. Kitts and Nevis
Jamaica
Haiti
Guyana
Trinidad and Tobago
Grenada
Antigua and Barbuda
SurinameSt. Vincent and the
Grenadines
BahamasBarbados
Belize
Dominica
Dominican Republic
United States
Solomon Is.
Fiji
Samoa
M auritius
IrelandSingapore
New Zealand
0
20
40
60
80
100
120
140
0 5000 10000 15000 20000 25000 30000 35000 40000
GDP per capita (US$)
8.6 In Jamaica, the earliest and most successful Caribbean country to embrace a competitive telecommunications sector, mobile phone use has increased tenfold since liberalization in 2000. Mobile phone ownership per capita in Jamaica is now higher than in the U.S. Much of this demand has come from people for whom a mobile phone is their first telephone. The economic impact has been significant. For example, it has allowed casual workers and trades people to increase their productivity through greatly improved communication with their employers. A similar pattern is now taking place in Barbados and in OECS countries such as St. Lucia.
Figure 8.2: Cellular Subscriptions
Ant igua & Barbuda BahamasBarbados
Belize
Dominica
Dom. Rep
Grenada
Guyana
Hait i
Jamaica
St. Kit ts and Nevis
St. LuciaSt. Vincent and the
Grenadines
Suriname
Trinidad & Tobago
USA
0
10
20
30
40
50
60
1995 1996 1997 1998 1999 2000 2001 2002Cel
lula
r sub
scrib
ers
per 1
00 p
eopl
e
8.7 The massive increase in access to telecommunications in countries like Jamaica was not primarily a technological phenomenon. Mobile phone service had been available in most countries for some time, but it took competition from new companies to make available such
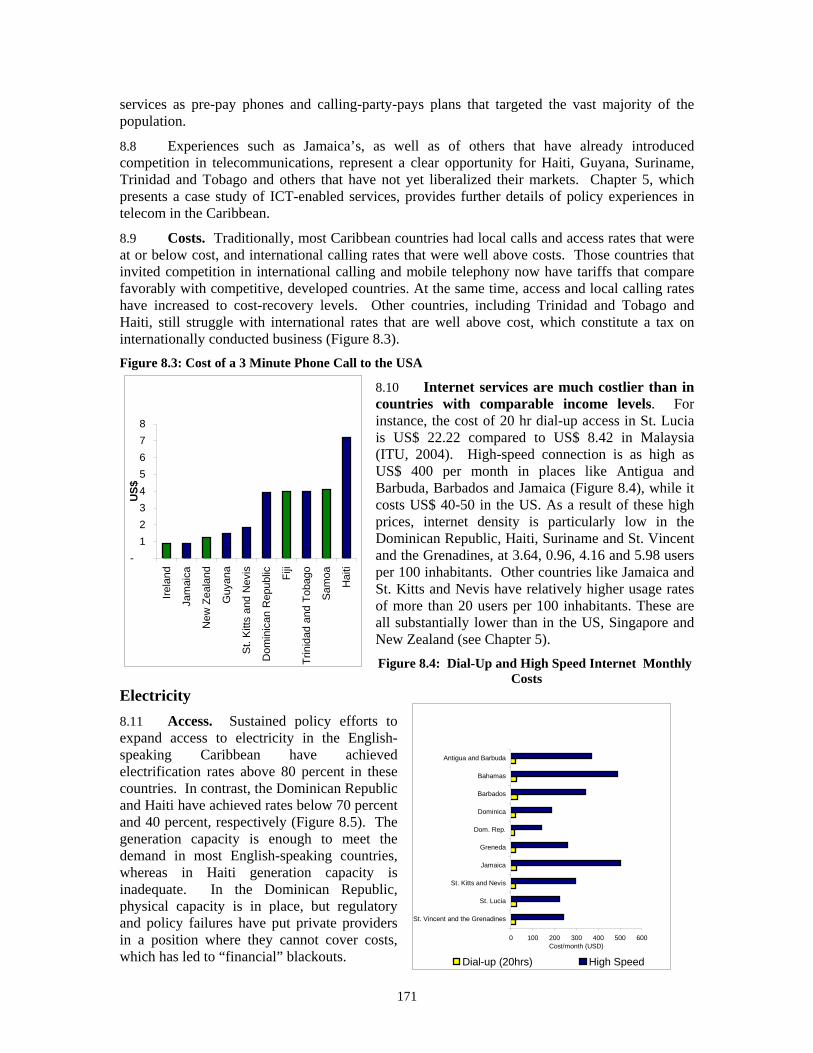
171
services as pre-pay phones and calling-party-pays plans that targeted the vast majority of the population.
8.8 Experiences such as Jamaica’s, as well as of others that have already introduced competition in telecommunications, represent a clear opportunity for Haiti, Guyana, Suriname, Trinidad and Tobago and others that have not yet liberalized their markets. Chapter 5, which presents a case study of ICT-enabled services, provides further details of policy experiences in telecom in the Caribbean.
8.9 Costs. Traditionally, most Caribbean countries had local calls and access rates that were at or below cost, and international calling rates that were well above costs. Those countries that invited competition in international calling and mobile telephony now have tariffs that compare favorably with competitive, developed countries. At the same time, access and local calling rates have increased to cost-recovery levels. Other countries, including Trinidad and Tobago and Haiti, still struggle with international rates that are well above cost, which constitute a tax on internationally conducted business (Figure 8.3). Figure 8.3: Cost of a 3 Minute Phone Call to the USA
8.10 Internet services are much costlier than in countries with comparable income levels. For instance, the cost of 20 hr dial-up access in St. Lucia is US$ 22.22 compared to US$ 8.42 in Malaysia (ITU, 2004). High-speed connection is as high as US$ 400 per month in places like Antigua and Barbuda, Barbados and Jamaica (Figure 8.4), while it costs US$ 40-50 in the US. As a result of these high prices, internet density is particularly low in the Dominican Republic, Haiti, Suriname and St. Vincent and the Grenadines, at 3.64, 0.96, 4.16 and 5.98 users per 100 inhabitants. Other countries like Jamaica and St. Kitts and Nevis have relatively higher usage rates of more than 20 users per 100 inhabitants. These are all substantially lower than in the US, Singapore and New Zealand (see Chapter 5). Figure 8.4: Dial-Up and High Speed Internet Monthly
Costs Electricity 8.11 Access. Sustained policy efforts to expand access to electricity in the English-speaking Caribbean have achieved electrification rates above 80 percent in these countries. In contrast, the Dominican Republic and Haiti have achieved rates below 70 percent and 40 percent, respectively (Figure 8.5). The generation capacity is enough to meet the demand in most English-speaking countries, whereas in Haiti generation capacity is inadequate. In the Dominican Republic, physical capacity is in place, but regulatory and policy failures have put private providers in a position where they cannot cover costs, which has led to “financial” blackouts.
0 100 200 300 400 500 600
St. Vincent and the Grenadines
St. Lucia
St. Kitts and Nevis
Jamaica
Greneda
Dom. Rep.
Dominica
Barbados
Bahamas
Antigua and Barbuda
Cost/month (USD)
Dial-up (20hrs) High Speed
-12345678
Irela
nd
Jam
aica
New
Zea
land
Guy
ana
St.
Kitt
s an
d N
evis
Dom
inic
an R
epub
lic Fiji
Trin
idad
and
Tob
ago
Sam
oa
Hai
ti
US$
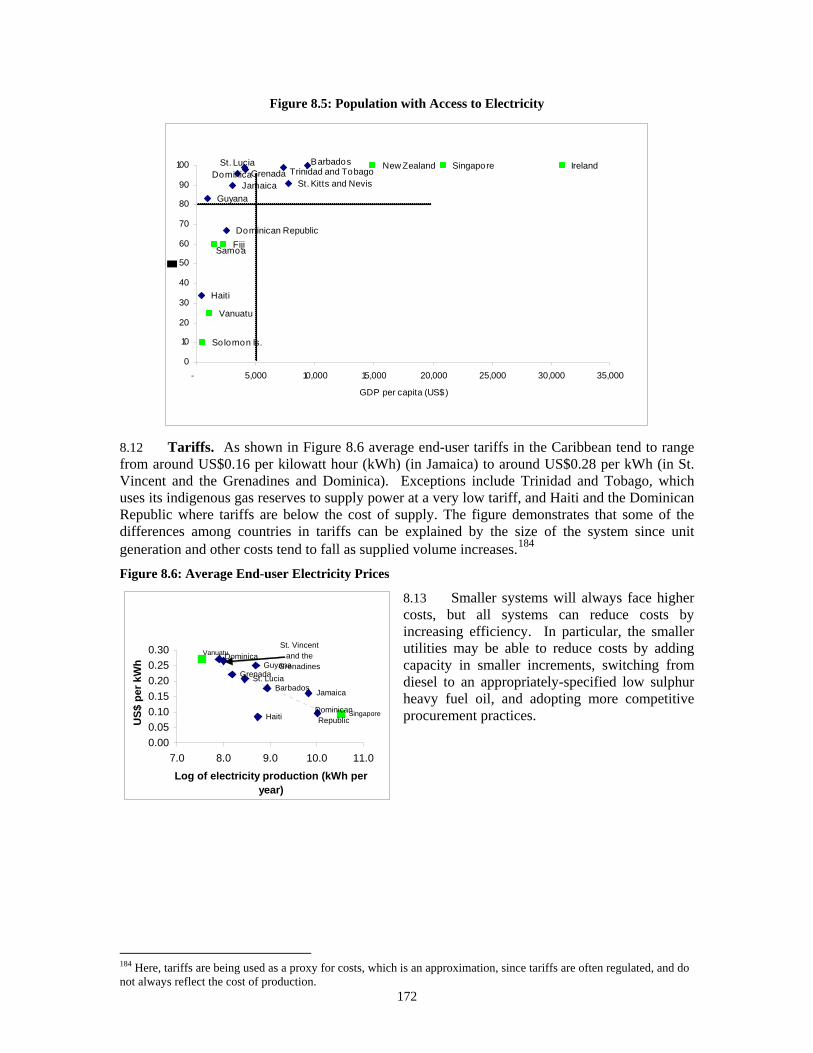
172
Figure 8.5: Population with Access to Electricity
Dominican Republic
DominicaBarbados
Grenada Trinidad and Tobago
Guyana
Haiti
Jamaica St. Kitts and Nevis
St. Lucia New Zealand Singapore Ireland
Vanuatu
SamoaFiji
Solomon Is.
0
10
20
30
40
50
60
70
80
90
100
- 5,000 10,000 15,000 20,000 25,000 30,000 35,000
GDP per capita (US$)
8.12 Tariffs. As shown in Figure 8.6 average end-user tariffs in the Caribbean tend to range from around US$0.16 per kilowatt hour (kWh) (in Jamaica) to around US$0.28 per kWh (in St. Vincent and the Grenadines and Dominica). Exceptions include Trinidad and Tobago, which uses its indigenous gas reserves to supply power at a very low tariff, and Haiti and the Dominican Republic where tariffs are below the cost of supply. The figure demonstrates that some of the differences among countries in tariffs can be explained by the size of the system since unit generation and other costs tend to fall as supplied volume increases.184
Figure 8.6: Average End-user Electricity Prices
8.13 Smaller systems will always face higher costs, but all systems can reduce costs by increasing efficiency. In particular, the smaller utilities may be able to reduce costs by adding capacity in smaller increments, switching from diesel to an appropriately-specified low sulphur heavy fuel oil, and adopting more competitive procurement practices.
184 Here, tariffs are being used as a proxy for costs, which is an approximation, since tariffs are often regulated, and do not always reflect the cost of production.
St. Vincent and the
GrenadinesSt. Lucia
Jamaica
Haiti
GuyanaGrenada
Barbados
Dominica
Dominican Republic
Vanuatu
Singapore
0.000.050.100.150.200.250.30
7.0 8.0 9.0 10.0 11.0
Log of electricity production (kWh per year)
US$
per
kW
h
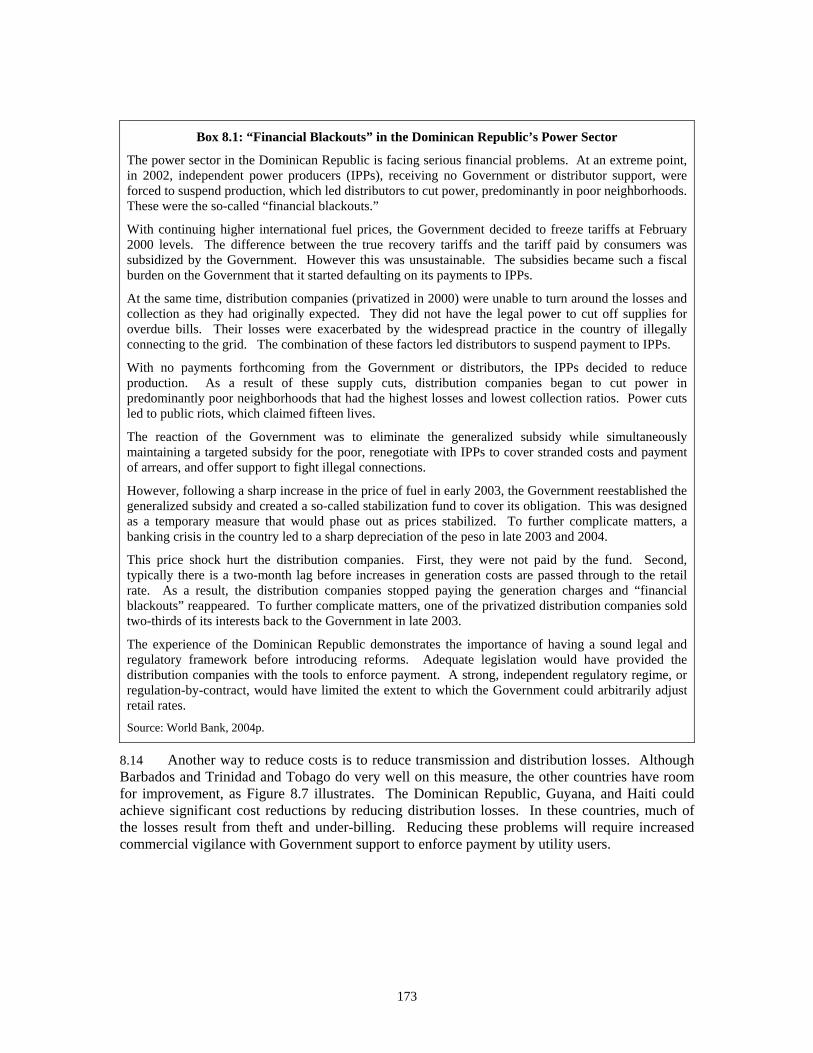
173
Box 8.1: “Financial Blackouts” in the Dominican Republic’s Power Sector
The power sector in the Dominican Republic is facing serious financial problems. At an extreme point, in 2002, independent power producers (IPPs), receiving no Government or distributor support, were forced to suspend production, which led distributors to cut power, predominantly in poor neighborhoods. These were the so-called “financial blackouts.”
With continuing higher international fuel prices, the Government decided to freeze tariffs at February 2000 levels. The difference between the true recovery tariffs and the tariff paid by consumers was subsidized by the Government. However this was unsustainable. The subsidies became such a fiscal burden on the Government that it started defaulting on its payments to IPPs.
At the same time, distribution companies (privatized in 2000) were unable to turn around the losses and collection as they had originally expected. They did not have the legal power to cut off supplies for overdue bills. Their losses were exacerbated by the widespread practice in the country of illegally connecting to the grid. The combination of these factors led distributors to suspend payment to IPPs.
With no payments forthcoming from the Government or distributors, the IPPs decided to reduce production. As a result of these supply cuts, distribution companies began to cut power in predominantly poor neighborhoods that had the highest losses and lowest collection ratios. Power cuts led to public riots, which claimed fifteen lives.
The reaction of the Government was to eliminate the generalized subsidy while simultaneously maintaining a targeted subsidy for the poor, renegotiate with IPPs to cover stranded costs and payment of arrears, and offer support to fight illegal connections.
However, following a sharp increase in the price of fuel in early 2003, the Government reestablished the generalized subsidy and created a so-called stabilization fund to cover its obligation. This was designed as a temporary measure that would phase out as prices stabilized. To further complicate matters, a banking crisis in the country led to a sharp depreciation of the peso in late 2003 and 2004.
This price shock hurt the distribution companies. First, they were not paid by the fund. Second, typically there is a two-month lag before increases in generation costs are passed through to the retail rate. As a result, the distribution companies stopped paying the generation charges and “financial blackouts” reappeared. To further complicate matters, one of the privatized distribution companies sold two-thirds of its interests back to the Government in late 2003.
The experience of the Dominican Republic demonstrates the importance of having a sound legal and regulatory framework before introducing reforms. Adequate legislation would have provided the distribution companies with the tools to enforce payment. A strong, independent regulatory regime, or regulation-by-contract, would have limited the extent to which the Government could arbitrarily adjust retail rates.
Source: World Bank, 2004p.
8.14 Another way to reduce costs is to reduce transmission and distribution losses. Although Barbados and Trinidad and Tobago do very well on this measure, the other countries have room for improvement, as Figure 8.7 illustrates. The Dominican Republic, Guyana, and Haiti could achieve significant cost reductions by reducing distribution losses. In these countries, much of the losses result from theft and under-billing. Reducing these problems will require increased commercial vigilance with Government support to enforce payment by utility users.
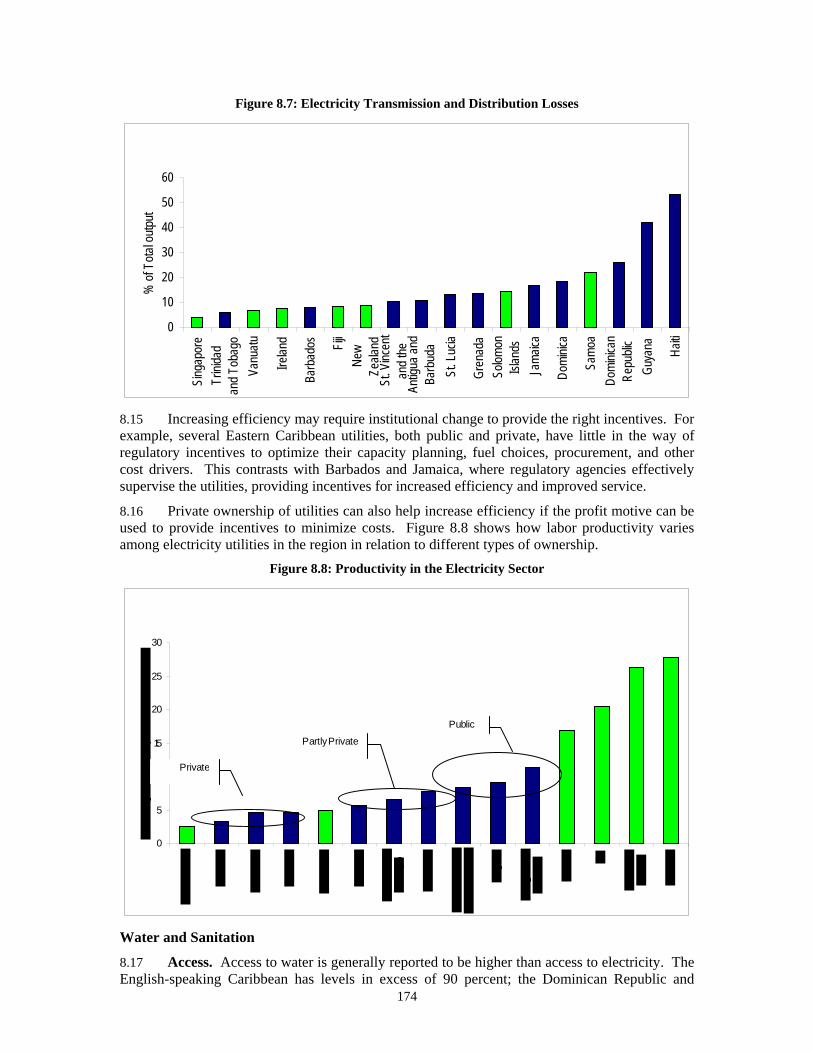
174
Figure 8.7: Electricity Transmission and Distribution Losses
0
10
20
30
40
50
60Sin
gapo
reTr
inida
dan
d Tob
ago
Vanu
atu
Irelan
d
Barb
ados Fij
iNe
wZe
aland
St. V
incen
tan
d the
Antig
ua an
dBa
rbud
aSt
. Luc
ia
Gren
ada
Solom
onIsl
ands
Jama
ica
Domi
nica
Samo
aDo
minic
anRe
publi
cGu
yana Ha
iti
% of
Tota
l outp
ut
8.15 Increasing efficiency may require institutional change to provide the right incentives. For example, several Eastern Caribbean utilities, both public and private, have little in the way of regulatory incentives to optimize their capacity planning, fuel choices, procurement, and other cost drivers. This contrasts with Barbados and Jamaica, where regulatory agencies effectively supervise the utilities, providing incentives for increased efficiency and improved service.
8.16 Private ownership of utilities can also help increase efficiency if the profit motive can be used to provide incentives to minimize costs. Figure 8.8 shows how labor productivity varies among electricity utilities in the region in relation to different types of ownership.
Figure 8.8: Productivity in the Electricity Sector
0
5
10
15
20
25
30
Private
Partly Private
Public
Water and Sanitation
8.17 Access. Access to water is generally reported to be higher than access to electricity. The English-speaking Caribbean has levels in excess of 90 percent; the Dominican Republic and
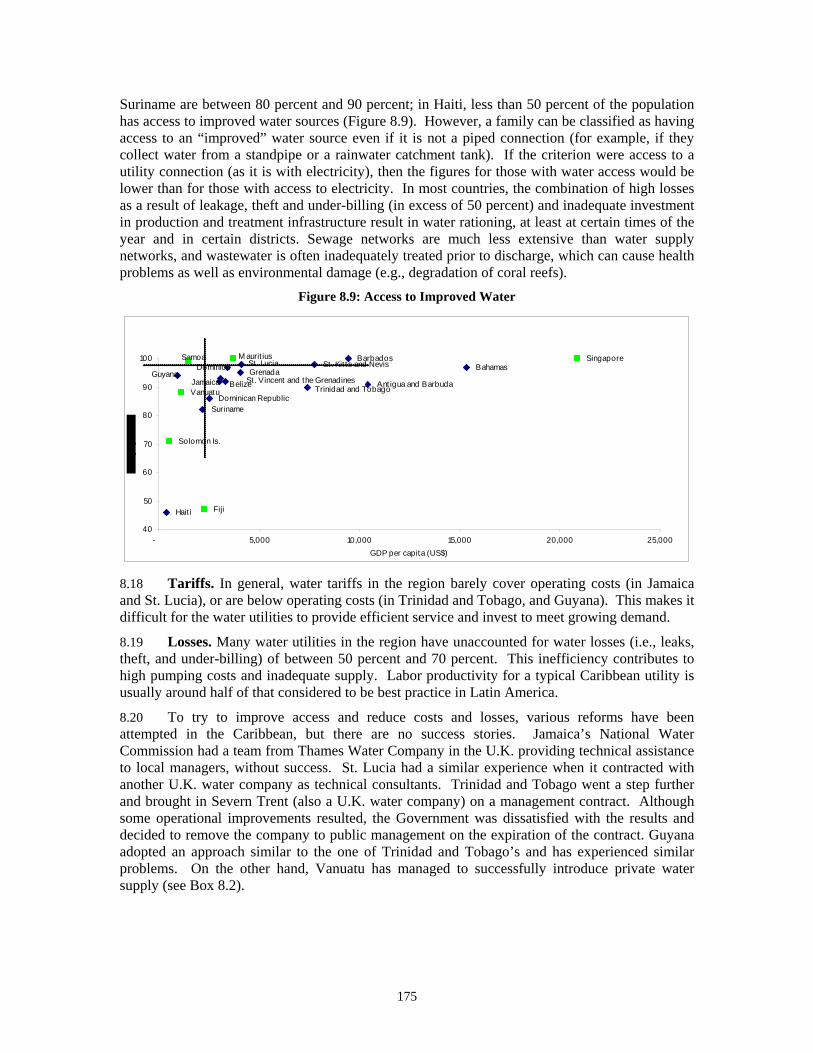
175
Suriname are between 80 percent and 90 percent; in Haiti, less than 50 percent of the population has access to improved water sources (Figure 8.9). However, a family can be classified as having access to an “improved” water source even if it is not a piped connection (for example, if they collect water from a standpipe or a rainwater catchment tank). If the criterion were access to a utility connection (as it is with electricity), then the figures for those with water access would be lower than for those with access to electricity. In most countries, the combination of high losses as a result of leakage, theft and under-billing (in excess of 50 percent) and inadequate investment in production and treatment infrastructure result in water rationing, at least at certain times of the year and in certain districts. Sewage networks are much less extensive than water supply networks, and wastewater is often inadequately treated prior to discharge, which can cause health problems as well as environmental damage (e.g., degradation of coral reefs).
Figure 8.9: Access to Improved Water
St. Lucia St. Kit ts and Nevis
Jamaica
Hait i
Guyana
Trinidad and Tobago
GrenadaAnt igua and Barbuda
Suriname
BahamasBarbados
Belize
Dominica
Dominican Republic
Solomon Is.
Fiji
Samoa
Vanuatu
M aurit ius Singapore
40
50
60
70
80
90
100
- 5,000 10,000 15,000 20,000 25,000GDP per capita (US$)
St. Vincent and the Grenadines
8.18 Tariffs. In general, water tariffs in the region barely cover operating costs (in Jamaica and St. Lucia), or are below operating costs (in Trinidad and Tobago, and Guyana). This makes it difficult for the water utilities to provide efficient service and invest to meet growing demand.
8.19 Losses. Many water utilities in the region have unaccounted for water losses (i.e., leaks, theft, and under-billing) of between 50 percent and 70 percent. This inefficiency contributes to high pumping costs and inadequate supply. Labor productivity for a typical Caribbean utility is usually around half of that considered to be best practice in Latin America.
8.20 To try to improve access and reduce costs and losses, various reforms have been attempted in the Caribbean, but there are no success stories. Jamaica’s National Water Commission had a team from Thames Water Company in the U.K. providing technical assistance to local managers, without success. St. Lucia had a similar experience when it contracted with another U.K. water company as technical consultants. Trinidad and Tobago went a step further and brought in Severn Trent (also a U.K. water company) on a management contract. Although some operational improvements resulted, the Government was dissatisfied with the results and decided to remove the company to public management on the expiration of the contract. Guyana adopted an approach similar to the one of Trinidad and Tobago’s and has experienced similar problems. On the other hand, Vanuatu has managed to successfully introduce private water supply (see Box 8.2).
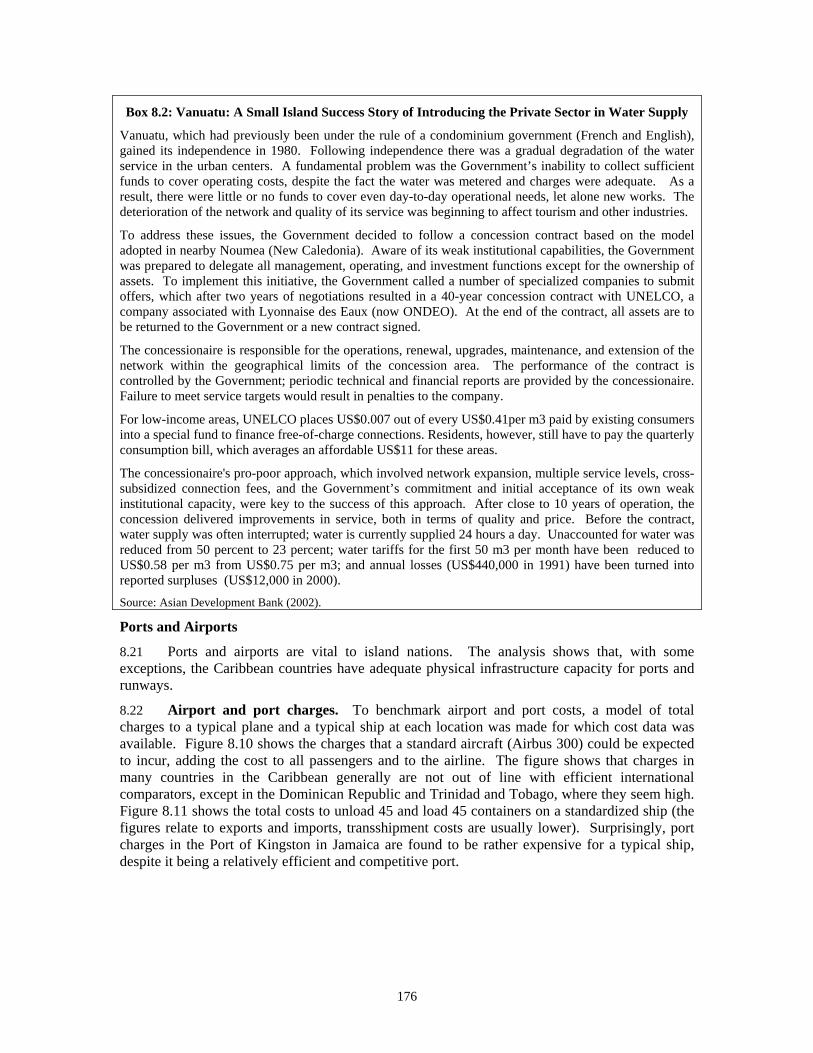
176
Box 8.2: Vanuatu: A Small Island Success Story of Introducing the Private Sector in Water Supply
Vanuatu, which had previously been under the rule of a condominium government (French and English), gained its independence in 1980. Following independence there was a gradual degradation of the water service in the urban centers. A fundamental problem was the Government’s inability to collect sufficient funds to cover operating costs, despite the fact the water was metered and charges were adequate. As a result, there were little or no funds to cover even day-to-day operational needs, let alone new works. The deterioration of the network and quality of its service was beginning to affect tourism and other industries.
To address these issues, the Government decided to follow a concession contract based on the model adopted in nearby Noumea (New Caledonia). Aware of its weak institutional capabilities, the Government was prepared to delegate all management, operating, and investment functions except for the ownership of assets. To implement this initiative, the Government called a number of specialized companies to submit offers, which after two years of negotiations resulted in a 40-year concession contract with UNELCO, a company associated with Lyonnaise des Eaux (now ONDEO). At the end of the contract, all assets are to be returned to the Government or a new contract signed.
The concessionaire is responsible for the operations, renewal, upgrades, maintenance, and extension of the network within the geographical limits of the concession area. The performance of the contract is controlled by the Government; periodic technical and financial reports are provided by the concessionaire. Failure to meet service targets would result in penalties to the company.
For low-income areas, UNELCO places US$0.007 out of every US$0.41per m3 paid by existing consumers into a special fund to finance free-of-charge connections. Residents, however, still have to pay the quarterly consumption bill, which averages an affordable US$11 for these areas.
The concessionaire's pro-poor approach, which involved network expansion, multiple service levels, cross-subsidized connection fees, and the Government’s commitment and initial acceptance of its own weak institutional capacity, were key to the success of this approach. After close to 10 years of operation, the concession delivered improvements in service, both in terms of quality and price. Before the contract, water supply was often interrupted; water is currently supplied 24 hours a day. Unaccounted for water was reduced from 50 percent to 23 percent; water tariffs for the first 50 m3 per month have been reduced to US$0.58 per m3 from US$0.75 per m3; and annual losses (US$440,000 in 1991) have been turned into reported surpluses (US$12,000 in 2000).
Source: Asian Development Bank (2002).
Ports and Airports
8.21 Ports and airports are vital to island nations. The analysis shows that, with some exceptions, the Caribbean countries have adequate physical infrastructure capacity for ports and runways.
8.22 Airport and port charges. To benchmark airport and port costs, a model of total charges to a typical plane and a typical ship at each location was made for which cost data was available. Figure 8.10 shows the charges that a standard aircraft (Airbus 300) could be expected to incur, adding the cost to all passengers and to the airline. The figure shows that charges in many countries in the Caribbean generally are not out of line with efficient international comparators, except in the Dominican Republic and Trinidad and Tobago, where they seem high. Figure 8.11 shows the total costs to unload 45 and load 45 containers on a standardized ship (the figures relate to exports and imports, transshipment costs are usually lower). Surprisingly, port charges in the Port of Kingston in Jamaica are found to be rather expensive for a typical ship, despite it being a relatively efficient and competitive port.
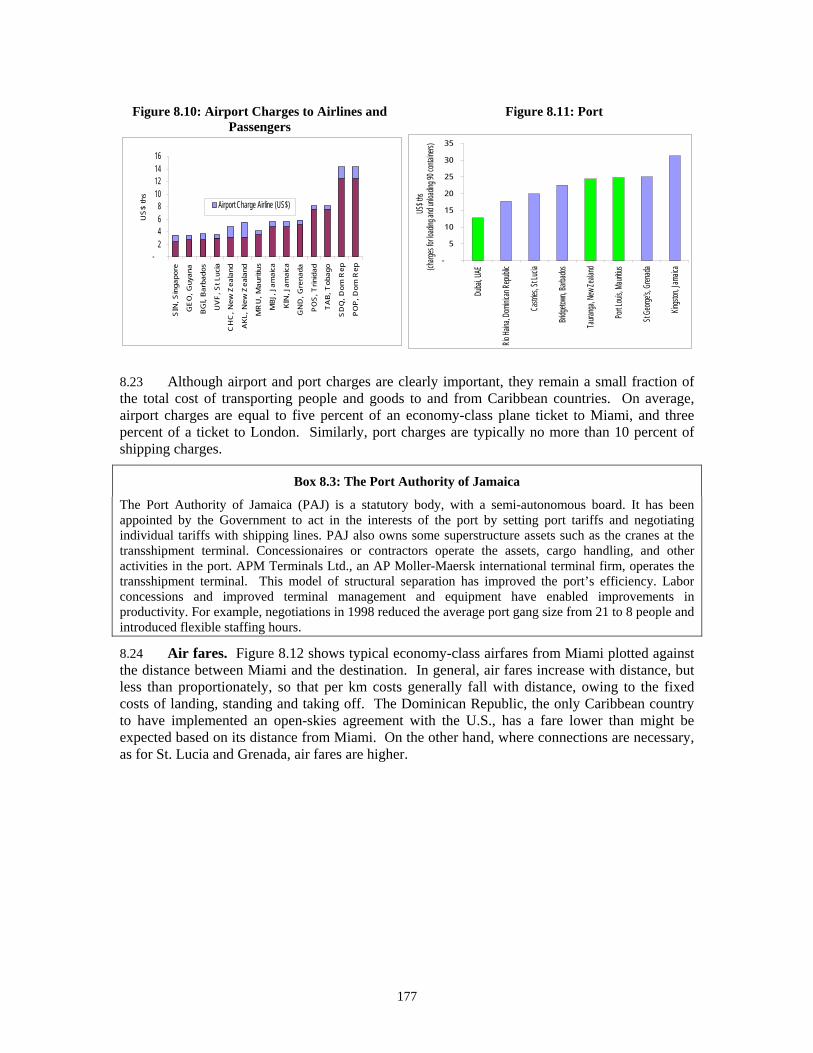
177
Figure 8.10: Airport Charges to Airlines and Passengers
Figure 8.11: Port
8.23 Although airport and port charges are clearly important, they remain a small fraction of the total cost of transporting people and goods to and from Caribbean countries. On average, airport charges are equal to five percent of an economy-class plane ticket to Miami, and three percent of a ticket to London. Similarly, port charges are typically no more than 10 percent of shipping charges.
Box 8.3: The Port Authority of Jamaica
The Port Authority of Jamaica (PAJ) is a statutory body, with a semi-autonomous board. It has been appointed by the Government to act in the interests of the port by setting port tariffs and negotiating individual tariffs with shipping lines. PAJ also owns some superstructure assets such as the cranes at the transshipment terminal. Concessionaires or contractors operate the assets, cargo handling, and other activities in the port. APM Terminals Ltd., an AP Moller-Maersk international terminal firm, operates the transshipment terminal. This model of structural separation has improved the port’s efficiency. Labor concessions and improved terminal management and equipment have enabled improvements in productivity. For example, negotiations in 1998 reduced the average port gang size from 21 to 8 people and introduced flexible staffing hours.
8.24 Air fares. Figure 8.12 shows typical economy-class airfares from Miami plotted against the distance between Miami and the destination. In general, air fares increase with distance, but less than proportionately, so that per km costs generally fall with distance, owing to the fixed costs of landing, standing and taking off. The Dominican Republic, the only Caribbean country to have implemented an open-skies agreement with the U.S., has a fare lower than might be expected based on its distance from Miami. On the other hand, where connections are necessary, as for St. Lucia and Grenada, air fares are higher.
-2468
10121416
SIN
, Sin
gapo
re
GE
O, G
uyan
a
BG
I, B
arba
dos
UV
F, S
t Luc
ia
CH
C, N
ew Z
eala
nd
AK
L, N
ew Z
eala
nd
MR
U, M
aurit
ius
MB
J, J
amai
ca
KIN
, Jam
aica
GN
D, G
rena
da
PO
S, T
rinid
ad
TA
B, T
obag
o
SD
Q, D
om R
ep
PO
P, D
om R
ep
US
$ th
s
Airport Charge Airline (US$)
-
5
10
15
20
25
30
35
Duba
i, UAE
Rio Ha
ina, D
ominic
an Re
public
Castr
ies, S
t Luci
a
Bridg
etown
, Barb
ados
Taura
nga,
New Z
ealan
d
Port L
ouis,
Mauri
tius
St Ge
orge's
, Gren
ada
Kingst
on, Ja
maica
US$ t
hs(ch
arges
for loa
ding a
nd un
loadin
g 90 c
ontain
ers)
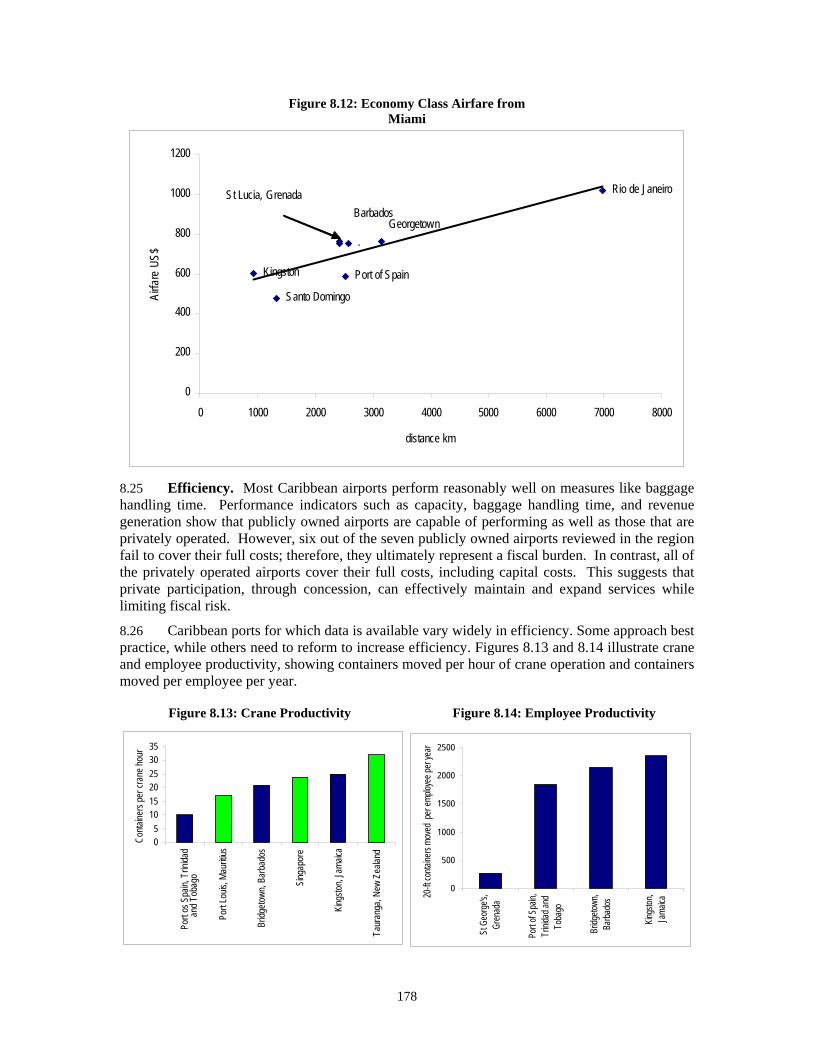
178
Figure 8.12: Economy Class Airfare from Miami
Kingston
Santo Domingo
..
Port of Spain
.Georgetown
Rio de Janeiro
0
200
400
600
800
1000
1200
0 1000 2000 3000 4000 5000 6000 7000 8000
distance km
Airfa
re U
S$
St Lucia, Grenada Barbados
8.25 Efficiency. Most Caribbean airports perform reasonably well on measures like baggage handling time. Performance indicators such as capacity, baggage handling time, and revenue generation show that publicly owned airports are capable of performing as well as those that are privately operated. However, six out of the seven publicly owned airports reviewed in the region fail to cover their full costs; therefore, they ultimately represent a fiscal burden. In contrast, all of the privately operated airports cover their full costs, including capital costs. This suggests that private participation, through concession, can effectively maintain and expand services while limiting fiscal risk.
8.26 Caribbean ports for which data is available vary widely in efficiency. Some approach best practice, while others need to reform to increase efficiency. Figures 8.13 and 8.14 illustrate crane and employee productivity, showing containers moved per hour of crane operation and containers moved per employee per year.
Figure 8.13: Crane Productivity Figure 8.14: Employee Productivity
05
101520253035
Port
os S
pain,
Trin
idad
Port
Louis
, Mau
ritius
Bridg
etown
, Bar
bado
s
Singa
pore
Kings
ton, J
amaic
a
Taur
anga
, New
Zea
land
Conta
iners
per c
rane
hour
and T
obag
o
0
500
1000
1500
2000
2500
St G
eorg
e's,
Gren
ada
Port
of Sp
ain,
Trini
dad a
ndTo
bago
Bridg
etown
,Ba
rbado
s
Kings
ton,
Jama
ica
20-ft
conta
iners
move
d pe
r emp
loyee
per y
ear
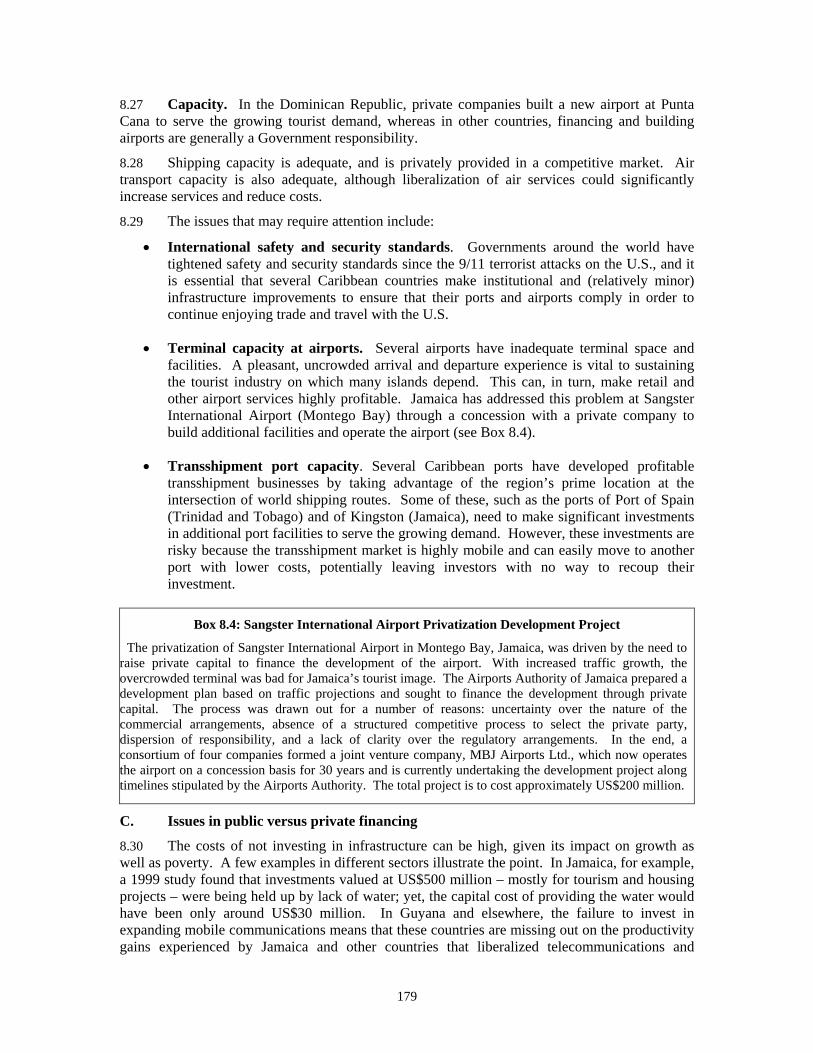
179
8.27 Capacity. In the Dominican Republic, private companies built a new airport at Punta Cana to serve the growing tourist demand, whereas in other countries, financing and building airports are generally a Government responsibility.
8.28 Shipping capacity is adequate, and is privately provided in a competitive market. Air transport capacity is also adequate, although liberalization of air services could significantly increase services and reduce costs.
8.29 The issues that may require attention include:
• International safety and security standards. Governments around the world have tightened safety and security standards since the 9/11 terrorist attacks on the U.S., and it is essential that several Caribbean countries make institutional and (relatively minor) infrastructure improvements to ensure that their ports and airports comply in order to continue enjoying trade and travel with the U.S.
• Terminal capacity at airports. Several airports have inadequate terminal space and facilities. A pleasant, uncrowded arrival and departure experience is vital to sustaining the tourist industry on which many islands depend. This can, in turn, make retail and other airport services highly profitable. Jamaica has addressed this problem at Sangster International Airport (Montego Bay) through a concession with a private company to build additional facilities and operate the airport (see Box 8.4).
• Transshipment port capacity. Several Caribbean ports have developed profitable transshipment businesses by taking advantage of the region’s prime location at the intersection of world shipping routes. Some of these, such as the ports of Port of Spain (Trinidad and Tobago) and of Kingston (Jamaica), need to make significant investments in additional port facilities to serve the growing demand. However, these investments are risky because the transshipment market is highly mobile and can easily move to another port with lower costs, potentially leaving investors with no way to recoup their investment.
Box 8.4: Sangster International Airport Privatization Development Project
The privatization of Sangster International Airport in Montego Bay, Jamaica, was driven by the need to raise private capital to finance the development of the airport. With increased traffic growth, the overcrowded terminal was bad for Jamaica’s tourist image. The Airports Authority of Jamaica prepared a development plan based on traffic projections and sought to finance the development through private capital. The process was drawn out for a number of reasons: uncertainty over the nature of the commercial arrangements, absence of a structured competitive process to select the private party, dispersion of responsibility, and a lack of clarity over the regulatory arrangements. In the end, a consortium of four companies formed a joint venture company, MBJ Airports Ltd., which now operates the airport on a concession basis for 30 years and is currently undertaking the development project along timelines stipulated by the Airports Authority. The total project is to cost approximately US$200 million.
C. Issues in public versus private financing
8.30 The costs of not investing in infrastructure can be high, given its impact on growth as well as poverty. A few examples in different sectors illustrate the point. In Jamaica, for example, a 1999 study found that investments valued at US$500 million – mostly for tourism and housing projects – were being held up by lack of water; yet, the capital cost of providing the water would have been only around US$30 million. In Guyana and elsewhere, the failure to invest in expanding mobile communications means that these countries are missing out on the productivity gains experienced by Jamaica and other countries that liberalized telecommunications and
180
attracted additional investment. In Haiti, the lack of power, water, and other infrastructure makes it difficult for businesses to succeed and grow.
(i) High Debt Overhang Limits Options for Government Investment
8.31 However, despite the infrastructure gaps and the importance of infrastructure, Caribbean governments often cannot afford to borrow for infrastructure investment. As seen earlier (Chapters 1, & 2), many Caribbean Governments have debts which are at or approaching unsustainable levels. High debt levels mean that traditional Government borrowing to finance infrastructure is no longer sustainable for highly indebted countries like St. Kitts and Nevis, Jamaica, Antigua and Barbuda, Dominica and Grenada. Most infrastructure investment will need to be either self-financing, or, to the extent that it is not, generate rapid and significant economic growth which can generate increased tax revenues to allow the debt to be serviced.
8.32 This is not how infrastructure investment is generally analyzed. Normally roads, bridges, ports and the like generate returns over decades, and the cost benefit calculus is one of economic cost and benefits, not fiscal costs and benefits. Unfortunately, in many Caribbean countries the fiscal situation means that this approach is no longer possible.
This has a number of implications:
• Most new infrastructure finance will need to be serviced from user-charges or higher taxes.
• There should be bias toward financing of infrastructure by private providers, for two main reasons:
(i) The evidence in the Caribbean is clear that private infrastructure providers are generally able to operate on a cost recovery basis, while government providers generally are not;
(ii) Keeping borrowing off the books will help keep interest rates down, since rating agencies and financial markets find it difficult to assess the likelihood that particular investments will generate returns, and tend to regard all borrowing by a highly indebted country as negative, regardless of the actual financial and economic implications of the borrowing; and
• Justifying public investment in infrastructure will require demonstration of higher IRRs and quicker payback periods than usual.
(ii) Addressing private sector incentives to invest
8.33 To address infrastructure bottlenecks, and to maintain and improve access to infrastructure services, countries will need to make significant investments. It is possible, however, to minimize Government intervention and mitigate fiscal risk through a careful assessment of risks and financial structuring.
8.34 The sectors and utilities that perform best tend to be those that can charge a cost-recovery tariff and are privately financed, such as island-based mobile phone companies and electricity companies.
8.35 The importance of investment for growth means that Governments could consider allowing service providers to recover their costs through a cost-recovery tariff or, if this proves socially unacceptable, for the Government to provide explicit subsidies to cover the difference between tariffs and costs.
8.36 The main areas of concern are those sectors, such as water, that traditionally have difficulty achieving cost-reflective tariffs and privately-financed investments, and those countries like Haiti, Suriname, and Guyana where low incomes and low institutional capacity make both cost recovery and attracting investment difficult.
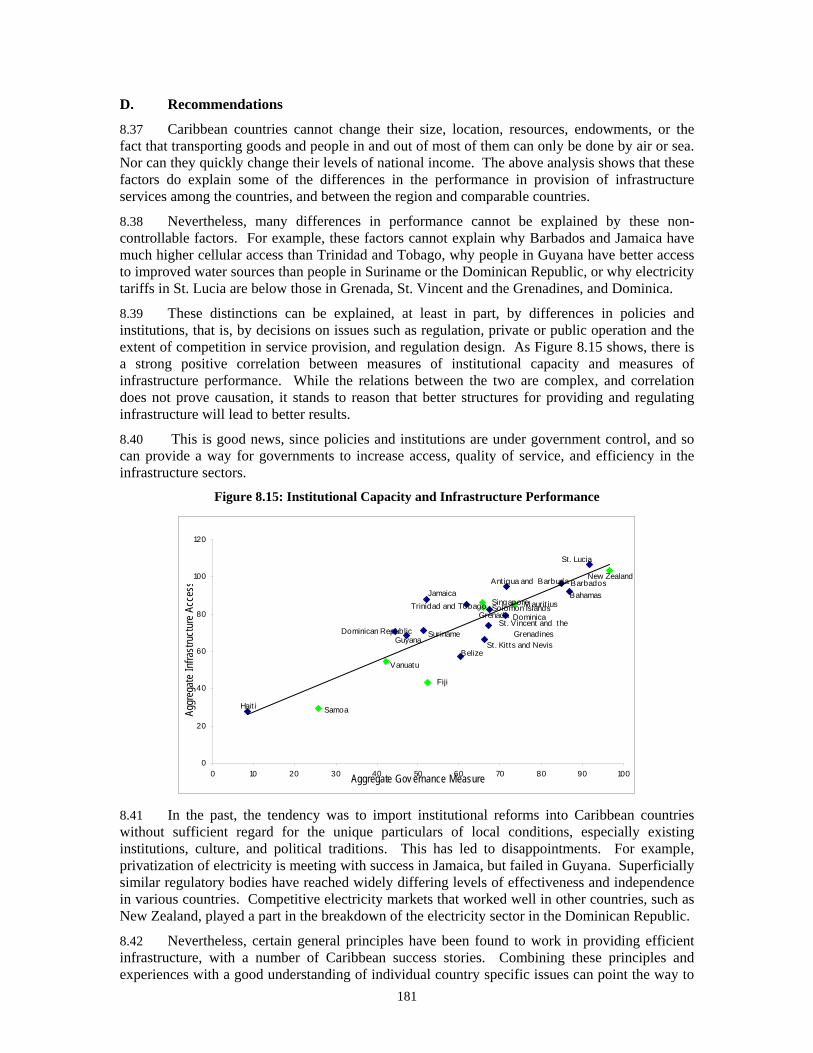
181
D. Recommendations
8.37 Caribbean countries cannot change their size, location, resources, endowments, or the fact that transporting goods and people in and out of most of them can only be done by air or sea. Nor can they quickly change their levels of national income. The above analysis shows that these factors do explain some of the differences in the performance in provision of infrastructure services among the countries, and between the region and comparable countries.
8.38 Nevertheless, many differences in performance cannot be explained by these non-controllable factors. For example, these factors cannot explain why Barbados and Jamaica have much higher cellular access than Trinidad and Tobago, why people in Guyana have better access to improved water sources than people in Suriname or the Dominican Republic, or why electricity tariffs in St. Lucia are below those in Grenada, St. Vincent and the Grenadines, and Dominica.
8.39 These distinctions can be explained, at least in part, by differences in policies and institutions, that is, by decisions on issues such as regulation, private or public operation and the extent of competition in service provision, and regulation design. As Figure 8.15 shows, there is a strong positive correlation between measures of institutional capacity and measures of infrastructure performance. While the relations between the two are complex, and correlation does not prove causation, it stands to reason that better structures for providing and regulating infrastructure will lead to better results.
8.40 This is good news, since policies and institutions are under government control, and so can provide a way for governments to increase access, quality of service, and efficiency in the infrastructure sectors.
Figure 8.15: Institutional Capacity and Infrastructure Performance
M aurit ius
St. Vincent and the Grenadines
Grenada
St. Lucia
Belize
Fiji
Suriname
Jamaica
Dominica
Samoa
Dominican RepublicGuyana
Vanuatu
St. Kit ts and Nevis
Trinidad and Tobago
BarbadosAnt igua and Barbuda
Bahamas
New Zealand
SingaporeSolomon Islands
Hait i
0
20
40
60
80
100
120
0 10 20 30 40 50 60 70 80 90 100Aggregate Gov ernance Measure
Aggr
egat
e In
frast
ruct
ure
Acce
ss
8.41 In the past, the tendency was to import institutional reforms into Caribbean countries without sufficient regard for the unique particulars of local conditions, especially existing institutions, culture, and political traditions. This has led to disappointments. For example, privatization of electricity is meeting with success in Jamaica, but failed in Guyana. Superficially similar regulatory bodies have reached widely differing levels of effectiveness and independence in various countries. Competitive electricity markets that worked well in other countries, such as New Zealand, played a part in the breakdown of the electricity sector in the Dominican Republic.
8.42 Nevertheless, certain general principles have been found to work in providing efficient infrastructure, with a number of Caribbean success stories. Combining these principles and experiences with a good understanding of individual country specific issues can point the way to
182
institutional reforms that may improve performance. The rest of this section reviews key issues in each sector, and suggests possible reform strategies.
(i) Increasing Access to Infrastructure Services
8.43 Governments are concerned that a largely commercial approach to infrastructure could lead to diminished levels of service to poor and rural households. Until recently, the overriding approach to providing widespread service in all sectors has been to require the incumbent monopoly, whether public or private, to expand service to underserved areas. Financing came from cross-subsidies (for telecommunications and electricity) or Government capital subsidies (for water and sanitation). However, as telecommunications liberalization grows, the old model becomes unworkable for that sector. Other sectors may also benefit from considering new approaches to broadening service. Interesting models include:
• Dominican Republic Telecommunications Development Fund. As part of the country’s telecommunications sector liberalization, the Government created a fund that was financed by a subscriber levy collected from telecommunications companies. The fund is used to provide communication services to rural areas, community tele-centers, pay phones, e-learning, and tele-medicine. Projects initiated under the fund are awarded through a public bidding process.
• Jamaica Rural Electrification Program, Ltd. In 1975, the Government established the Rural Electrification Company separate from the utility, to create a vehicle for borrowing from multilateral funding agencies to finance line extensions and wiring for low-income households. Actual installation was contracted out, and the total cost of the wiring was incorporated as a loan to the homeowner to be repaid along with the electric bill in monthly installments over five years. This model allowed the power utility to retain a commercial focus while simultaneously meeting the Government’s social objectives.
(ii) Liberalization
8.44 The telecommunications liberalization model developed in Jamaica and applied in Barbados and most OECS countries has worked very well. By increasing access and lowering the price of many services, liberalization made a significant contribution to economic efficiency. Countries that have not yet liberalized their telecommunications sectors, including Haiti, Trinidad and Tobago, Guyana, and Suriname, should consider adopting this model.
8.45 Part of the reason for successful telecommunications liberalization in the OECS countries was the formation of the Eastern Caribbean Telecommunications Authority (ECTEL), a regional telecom regulatory agency (see Box 8.5). Such regional regulatory approaches promote effective regulation despite limited national capacity, and could be adapted with positive results to the water and electricity sectors.
8.46 The greatest gain to international transport in the region would come through rapid liberalization of air services and the cessation of Government support for national and regional carriers. So far, only the Dominican Republic has an operational “open skies” agreement with the U.S. Jamaica has negotiated an open skies agreement with the U.S., but it is not yet operational. Other Caricom countries are negotiating open skies deals with the U.S. on a regional basis. The international experience is that liberalization can significantly reduce fares and increase volume, providing a major boost to business and tourism, and it is recommended that all countries reach open skies agreements with the U.S. and European countries.
8.47 The main barrier to liberalization is governments' desire to protect national and regional flag carriers, such as LIAT, BWIA and Air Jamaica (the recent takeover of Air Jamaica, in December 2004, from the private sector is one of the failed privatizations in the region). An objective analysis shows that these carriers, whether in public or private hands, are financial liabilities, not assets and that the objective of lowering prices has by and large not been achieved.
183
The governments should consider ceasing support to airlines, allowing them to prosper or fail as the market dictates.
8.48 The governments are rightly concerned about their ability to ensure reliable and adequate air services, and worry that a purely market-based approach could be too risky. This concern could be addressed by asking airlines to bid on non-exclusive contracts, under which they would commit to provide specific capacities and schedules on key routes in exchange for a subsidy. Awarding such contracts competitively would assure governments that services would be provided while simultaneously engaging lower and more certain subsidies than the alternative of supporting national and regional carriers.
8.49 Just as telecommunications liberalization was initially greeted with skepticism by Caribbean governments, and is now seen as an obvious step toward social and economic advancement, it is possible that aviation liberalization overcomes initial resistance to deliver significant benefits to small countries that depend so much on the movement of people and goods by air.
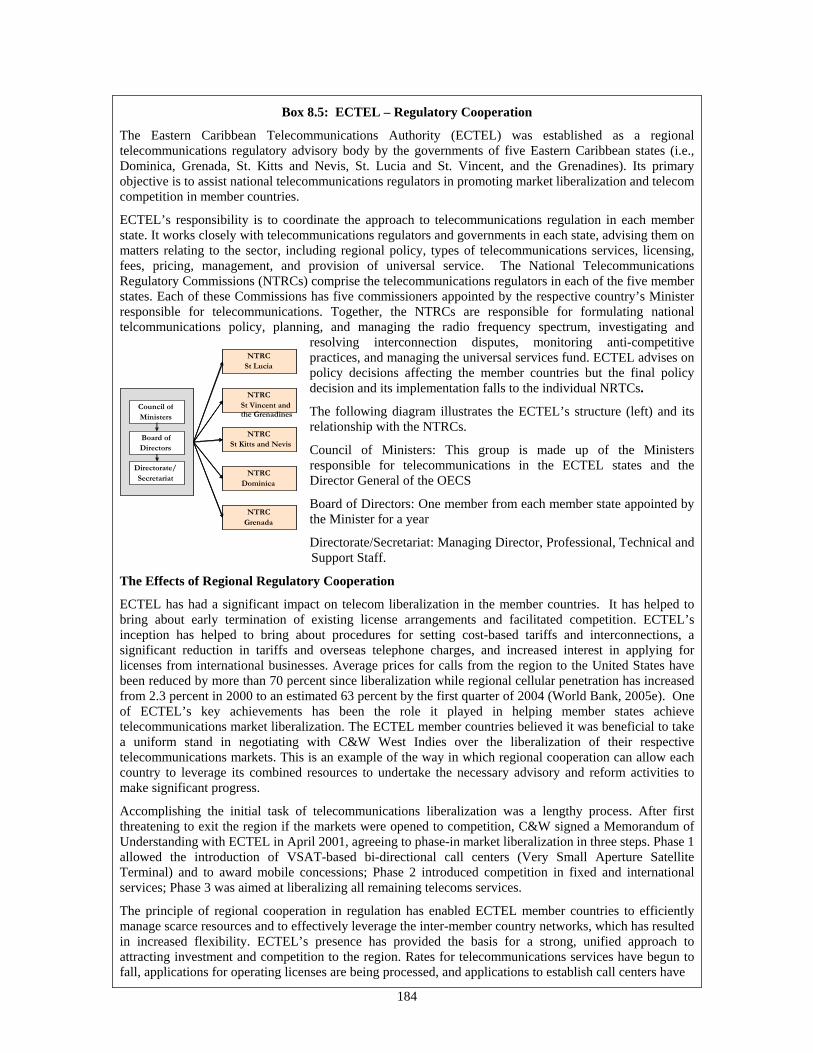
184
Council of Ministers Board of Directors
Directorate/ Secretariat
NTRC St Lucia
NTRC St Kitts & Nevis
NTRC Dominica
NTRC Grenada
NTRC St Vincent Council of
Ministers Board of Directors
Directorate/ Secretariat
NTRC St Lucia
NTRC St Kitts and Nevis
NTRC Dominica
NTRC Grenada
NTRC St Vincent and the Grenadines
Box 8.5: ECTEL – Regulatory Cooperation
The Eastern Caribbean Telecommunications Authority (ECTEL) was established as a regional telecommunications regulatory advisory body by the governments of five Eastern Caribbean states (i.e., Dominica, Grenada, St. Kitts and Nevis, St. Lucia and St. Vincent, and the Grenadines). Its primary objective is to assist national telecommunications regulators in promoting market liberalization and telecom competition in member countries.
ECTEL’s responsibility is to coordinate the approach to telecommunications regulation in each member state. It works closely with telecommunications regulators and governments in each state, advising them on matters relating to the sector, including regional policy, types of telecommunications services, licensing, fees, pricing, management, and provision of universal service. The National Telecommunications Regulatory Commissions (NTRCs) comprise the telecommunications regulators in each of the five member states. Each of these Commissions has five commissioners appointed by the respective country’s Minister responsible for telecommunications. Together, the NTRCs are responsible for formulating national telcommunications policy, planning, and managing the radio frequency spectrum, investigating and
resolving interconnection disputes, monitoring anti-competitive practices, and managing the universal services fund. ECTEL advises on policy decisions affecting the member countries but the final policy decision and its implementation falls to the individual NRTCs.
The following diagram illustrates the ECTEL’s structure (left) and its relationship with the NTRCs.
Council of Ministers: This group is made up of the Ministers responsible for telecommunications in the ECTEL states and the Director General of the OECS
Board of Directors: One member from each member state appointed by the Minister for a year
Directorate/Secretariat: Managing Director, Professional, Technical and Support Staff.
The Effects of Regional Regulatory Cooperation
ECTEL has had a significant impact on telecom liberalization in the member countries. It has helped to bring about early termination of existing license arrangements and facilitated competition. ECTEL’s inception has helped to bring about procedures for setting cost-based tariffs and interconnections, a significant reduction in tariffs and overseas telephone charges, and increased interest in applying for licenses from international businesses. Average prices for calls from the region to the United States have been reduced by more than 70 percent since liberalization while regional cellular penetration has increased from 2.3 percent in 2000 to an estimated 63 percent by the first quarter of 2004 (World Bank, 2005e). One of ECTEL’s key achievements has been the role it played in helping member states achieve telecommunications market liberalization. The ECTEL member countries believed it was beneficial to take a uniform stand in negotiating with C&W West Indies over the liberalization of their respective telecommunications markets. This is an example of the way in which regional cooperation can allow each country to leverage its combined resources to undertake the necessary advisory and reform activities to make significant progress.
Accomplishing the initial task of telecommunications liberalization was a lengthy process. After first threatening to exit the region if the markets were opened to competition, C&W signed a Memorandum of Understanding with ECTEL in April 2001, agreeing to phase-in market liberalization in three steps. Phase 1 allowed the introduction of VSAT-based bi-directional call centers (Very Small Aperture Satellite Terminal) and to award mobile concessions; Phase 2 introduced competition in fixed and international services; Phase 3 was aimed at liberalizing all remaining telecoms services.
The principle of regional cooperation in regulation has enabled ECTEL member countries to efficiently manage scarce resources and to effectively leverage the inter-member country networks, which has resulted in increased flexibility. ECTEL’s presence has provided the basis for a strong, unified approach to attracting investment and competition to the region. Rates for telecommunications services have begun to fall, applications for operating licenses are being processed, and applications to establish call centers have
185
Box 8.5 (continued): ECTEL – Regulatory Cooperation
been received. Where possible, ECTEL endeavors to enact identical regulations in member states and to consistently implement them. This has reduced the burden on individual regulators and has helped attract investment.
Source: World Bank (2004j), ECTEL web sites.
(iii) New Models for Public Private Partnerships
8.50 In most Caribbean countries electricity is supplied by private companies. There is some evidence that private provision is more efficient than public provision in the Caribbean, in no small part because private provision can reduce the government’s fiscal risk. For example, Jamaica largely decided to privatize its electricity company in 2001 to stop it from being a drain on the fiscal budget. In contrast, in Guyana, the state-owned power company is incurring losses that will worsen the Government’s fiscal position.
8.51 Several Eastern Caribbean countries, including St. Lucia, have private providers regulated by license, but no effective government body to oversee the license. This is in contrast to the effective regulation of the electricity sector by independent regulators in Jamaica and Barbados. Establishing a regional regulator similar to ECTEL will help exert additional pressure to come up to efficiency standards on electricity companies that are not currently subject to regulatory oversight.
8.52 The Dominican Republic combined privatization with creation of a wholesale electricity market. The electricity sector has now run into serious problems that are not necessarily attributable to the decision to adopt a competitive market but rather the failure to put adequate regulatory and supervisory mechanisms in place (see Box 8.1). But in any case, it seems unlikely that any other country in the region possesses the scale and diversity in electricity generation to benefit from a competitive power market.
8.53 A better model may be to subject the incumbent utilities’ generation-capacity expansion plans to public and regulatory scrutiny, and to require them to purchase power from independent providers in cases where it can be shown to lower total system costs. This approach could result in lower tariffs and increased opportunities for co-generation and use of renewable resources. Jamaica is now implementing this approach.
8.54 Several countries in the region, including Haiti and Guyana, have poorly performing public utilities. These utilities’ problems can be largely attributed to a lack of commercial discipline in areas such as loss reduction, theft prevention, and procurement. It is difficult to achieve commercial discipline in public utilities in countries where the institutional structure lacks rigor. Privatizing utility operation may help, although this also is difficult to achieve. In one example, Guyana sold its power company, but the private company was unable to make a financial success of the business, in part because of problems with the regulatory regime, and ended up withdrawing from the business and returning the company to public ownership. For the same reason, few investors would be willing to risk significant capital in Haiti. Management contracts potentially could fail to provide the oversight team with enough power or incentive to effectively improve the company.
8.55 It would be worth considering models in which the private company takes on the risk of operating the company, but investment remains a public sector responsibility, perhaps supported by the multilateral development banks (MDBs). Such models could be adapted from the lease/affermage contracts that are internationally used in the water sector. In these arrangements, the regulatory rules are not written into government or private bylaws but into each individual contract between the company and the government. The contract can also specify precise subsidy and financing terms. MDBs can guarantee the government’s performance under the contract, reducing the private company’s risk to acceptable levels.
186
8.56 Of the utility sectors reviewed, water offers the most scope for improvement, as is the case in most countries. Access to improved water and sanitation services is generally lower than access to electricity and telecommunications. The water service providers throughout the Caribbean are owned and operated by government. They are generally inefficient, with unaccounted for water losses (from leakage, theft, and under-billing) equal to more than 50 percent of production. They are generally overstaffed, financially weak, and unable to finance even routine operations and maintenance and new investment to improve and extend services. Poor performance in the water sector is largely due to institutional problems. Caribbean countries are not short of engineering know-how, and other utilities, such as electricity and telecommunications, are generally able to provide an adequate level of service and to generate finance to expand the network tariffs. Water utilities under perform for a variety of reasons. In some countries, the water utility’s expansion plans, hiring, and tariff decisions are largely dictated by political considerations. In many countries, strong unions have placed labor issues ahead of customer service in the utility’s priorities. Even when utility managers try to adopt a business-like approach, they are stymied by tariffs that are too low to recover costs, and a lack of finance for investment.
8.57 Various attempts to improve utility performance in water have been tried, including bringing in private companies on management contracts, but have not succeeded. An alternative trend is toward independent regulation of the state-owned water utilities. Jamaica, Barbados, Trinidad and Tobago, and Guyana are all experimenting with it. Regulatory oversight may help provide transparency in setting tariffs and stepping up pressure for efficiency, but it is not yet clear whether regulation of state-owned (as opposed to private) utilities can lead to fundamental or lasting improvements.
8.58 Reform of the water sector has an inherent political dimension, and suggested solutions should recognize this fact. Some options could be:
• Private participation through operating (lease/affermage)-type contracts that give private firms true management control; require to meet defined targets; and lock-in well-designed tariff and subsidy regimes.
• Explicit, targeted subsidies paid for provision of outputs, to address social concerns in water pricing, and to expand access.
• Development agency finance of capital expenditure, either directly, or through loans to establish subsidy funds.
• Government responsibility for financing some or all investments, either directly or through paying of output-based subsidies to expand service.
• Performance-based contracts for defined elements of the service, such as meter reading, billing and collections, or reduction of water losses, could also be tried.
8.59 Promising new developments in the water sector are the hybrid lease/concession contract currently under development by the St. Lucia Government, the success of service contracts for specific functions in parts of the Dominican Republic, and Trinidad and Tobago’s proposal to investigate private participation in meter installation and reading.
8.60 The transport of goods by sea is clearly vital to island economies. Maritime services are provided by international shipping lines, which are competitive and privately owned and operated.
8.61 Most container and general cargo ports in the Caribbean are owned by government corporations. However, in the most successful ports, the ownership and operation of terminals, cranes, and other functions are contracted out to the private sector. This “Landlord Model” has helped the Port of Kingston, Jamaica, become one of the leading ports in the region. Port of Spain, in Trinidad and Tobago is in the process of transforming itself from a “Public Service”
187
port (in which all functions are carried out in the public sector) into a Landlord port in order to better compete with new private ports in the country.
8.62 Allowing new ports in Trinidad and Tobago and the Dominican Republic, partially privately-owned, develop and compete with existing ports has succeeded in improving efficiency and reducing costs. Separating regulatory and operational functions and liberalizing entry into the port sector can promote this trend, at least in larger economies.
8.63 The Caribbean is at the crossroads of world trades routes, including east-west routes through the Panama Canal and north-south from South America to North America. Several Caribbean ports, including Freeport in the Bahamas and Kingston in Jamaica, have capitalized on this location to develop successful international transshipment businesses whose volumes of traffic far exceed their domestic trade volumes.
8.64 Transshipment is a highly competitive business, with shipping lines able to move their transshipment hubs from one port to another in response to changing prices and service levels. Although market demand is growing, governments should be cautious about investing taxpayer funds in long-lived infrastructure that serve footloose foreign clients. A good risk mitigation strategy would be for governments to seek private companies willing to take on the majority of the investment risk of any major additions to transshipment infrastructure. If private investors are unwilling to take such a risk, it is a signal to the government that the expected investment returns are not sufficient to offset the risk.
8.65 Most airports in the region are government-owned corporations, with some services within the airports provided by private companies, often on a competitive basis. Although, on the whole, the publicly owned airports have adequate capacity and efficiency, most of them operate at a deficit. The experience of Jamaica and the Dominican Republic as well as comparator countries like New Zealand, shows that private operation of, and investment in, airports can deliver service at least at the same level without burdening government finances. Private involvement can also make it easier for airports to attract financing for expansion when needed, as Sangster International in Jamaica and Punta Cana in the Dominican Republic were able to do.
188
Box 8.6: Mauritius Port
Mauritius is a small island nation similar to many Caribbean states. Its port once had a solely local role, but with Government reform and a goal to increase “non-captive” traffic, it has grown dramatically.
Mauritius expanded its port at Port Louis through a 1989 development plan. Between 1996-2001, it undertook a project to restructure the port with the support of the World Bank. This restricted the role of the Mauritius Port Authority to a Landlord Model port that owned land, buildings, superstructures, and quay cranes, and worked through competitive concession contracts. The major concessionaire is the Cargo Handling Corporation Ltd. (CHCL), which remains a publicly owned body, although the port authority is no longer a shareholder. A private shareholding arrangement is possible in the future.
The CHCL has substantially improved efficiency and costs with fewer staff, new working hours, labor flexibility, and, consequently, increased productivity. Crane productivity has been up to 19 moves per hour, which is a reasonably good figure internationally, although recently it has diminished from congestion.
There has been significant growth in traffic through the port. It handled 5m tons in 2002-03, up 11 percent from the previous year. Containers, which make up 38 percent of the traffic, were up 50 percent from the previous year. Transshipment traffic grew even faster, by 625 percent, up from 10,174 TEU (Twenty-Foot Container Equivalent Unit) to 73,389 in one year. In 2001, it totaled only 3,874 TEU. By the end of December 2003, the transshipment traffic was 102,282 TEU. About half of all container throughputs are now transshipment traffic.
Container traffic, in terms of total TEU handled, is 246,699, but total throughput is 318,553 (counting both in and out legs of transshipment legs). In 1992, before the productivity improvements and the development of transshipment only 80,000 TEU were handled. This growth is such that it is outstripping the capacity of the expansion plan. Vessel waiting time has increased to 24 hours. A new plan is being developed.
Two new container cranes are being acquired, but by lease rather than purchase in explicit recognition of the volatility and risk involved in the transshipment business.
Improving port productivity has borne fruit: three major shipping lines are now using Port Louis as a transshipment hub: Maersk-Sealand, Mediterranean Shipping Co., and P&O Nedlloyd/Mitsui. Transshipment trade attracts a significant discount on port charges. Some transshipment is for regional ports (i.e., on Madagascar and Reunion), but it is also between intersecting trade lanes among Africa-Mediterranean-Europe services, services to Australia and New Zealand, and among Asia, South Africa, and South America. Mauritius had the foresight to recognize the potential of its location and build an export product around it. Source: Castalia and Associates (2004).
(iv) Regional Cooperation
8.66 Regional cooperation is an excellent way to overcome the problems of small size and the resulting lack of economies of scale and capacity. One of the most successful regional approaches has been achieved by C&W’s Caribbean operation, providing high-level management services on a regional basis. Digicel, a provider of mobile phone services in several islands, has a similar approach. The governments could adopt this approach by also removing barriers to cooperation in other infrastructure services. For example, allowing cross-border mergers of electrical companies, or adopting standardized approaches to private participation in water, ports, and airports could provide private companies with the opportunity to build successful regional businesses, which might achieve economies of scale.
8.67 On the other hand, inter-government cooperation in the actual provision of infrastructure services is difficult to achieve in practice. For example, cooperation attempted to protect regional airlines has slowed liberalization in some countries. Cooperation among transshipment ports is doubtful since it is unlikely that one country would agree to reduce its own port’s role in order to boost another country’s. Although the consolidation of ports and airlines might be desirable, it will generally be accomplished more speedily and effectively if driven by market forces and private businesses than through inter-government arrangements.
189
8.68 Governments may benefit from cooperation in regional approaches to regulatory issues, especially in meeting transport safety and security standards.
8.69 ECTEL has shown the benefits of a regional approach to provision of economic regulatory capacity. There may well be a role for increased regulatory supervision of water and electricity providers in a number of countries that currently do not have regulators. These countries should evaluate jointly establishing a regional regulatory agency for water and power modeled after ECTEL.
8.70 Sharing information on service standards, tariffs, and efficiency could help all Caribbean infrastructure firms improve. There is definitely room for water and electricity utilities, ports, and airports to improve their performance by sharing information. One option is to join existing international benchmarking initiatives. Since all regulators in the region can benefit from comparative performance data, a regional benchmarking coordinated by the Organization of Caribbean Utility Regulators could also be an option.
(v) Financing Infrastructure
8.71 A key problem in Caribbean infrastructure is the finance of new investments. This is not easy to solve, given the governments’ already high debt levels, and concerns that user costs will be unacceptably high if they are sufficient to compensate investors for risks of political interventions, devaluations (which raise the user charges that must be charged to cover foreign currency based contracts), and natural disasters. Experience over the last few years with these issues in various developing countries, from Brazil to Indonesia to India, to the Dominican Republic, have reduced external investors’ interest in financing infrastructure projects directly. Contracts to cover these risks, even with current low interest rates, are likely to involve user charges that are unsustainable from a political standpoint.
8.72 Given these constraints, one option is to continue to rely on government for much of infrastructure finance, which de facto means the government absorbs the risk premium. As discussed in Chapter 2, many Caribbean governments still have fairly large capital expenditures. More funds could be made available for infrastructure by increasing government saving. A key issue is to use the capital funds well, allocating them to projects with high returns, and carrying out the projects and managing them with procedures that limit costs and improve service. Again as discussed in Chapter 2, this will entail good procurement and contracting procedures and substantial reliance on private construction firms to build and to operate the infrastructure.
8.73 At the margin, there may be some possibility of building up finance for infrastructure within the Caribbean, on a regional basis. Regional insurance companies and pension funds, which need long-lived investments with only moderate risk, may be interested. Trinidad and Tobago is emerging as a supplier of capital to the rest of the region, and is well placed to do this since Trinidadian financiers understand the conditions and risks in the other Caribbean countries better than would investors from the USA or Europe. In some cases, some of the risks noted above may be less for Caribbean investors. However, risks remain an issue for Caribbean investors as well as those outside the region—plenty of investment opportunities are available that carry lower risk.
8.74 Government infrastructure finance may use some techniques that will reduce its cost. For example, Governments may find the costs lower if they assign the revenues and the bonds of an infrastructure agency or fund. Costs might also be lower if funds are invested by private sources or the private sector arms of the World Bank Group and the Inter-American Development Bank. Government may also wish to give enhancements or guarantees, but these should be transparent and well specified to make clear any conditional liability that is being assumed. Pooling infrastructure bonds from various countries may result in a reduction in risk and thus a lower interest cost, but obstacles regarding definition of the liability of the underlying bond issuers and any government enhancements would have to be dealt with.
190
8.75 Development of catastrophe insurance would also lower risks and costs. Indeed, the vulnerability of Caribbean infrastructure providers to natural disasters, especially hurricanes, makes effective catastrophe insurance vital.
191
Bibliography ABT Associates (1998). “Workers and Labor Markets in the Caribbean”, report prepared for the IADB, Washington, D.C.
Acemoglu, D. (2001). “Factor Prices and Technical Change: From Induced Innovations to Recent Debates”, Massachusetts Institute of Technology.
Asian Development Bank (2002). “Beyond Boundaries : Extending Services to the Urban Poor”, Manilla, Philippines.
Alesina, A. and R. Wacziarg (1997). “Openness, Country Size and Government,” Journal of Public Economics 69: 305-321.
Alesina, A. (2003). “The Size of Countries: Does it Matter?” Journal of the European Economic Association, 1, 2-3, 310-316.
Anderson P.Y. (1987). “Informal Sector or Modern Labor Market? Towards a Synthesis”, SES, vol 36(3), Sept 1987, pp 149-176.
Artana, D. and F. Navajas (2002). “Fiscal Policy Issues in Jamaica: Budgetary Institutions, the Tax System and Public Administration”, InterAmerican Development Bank, processed.
Ashton, D. (2000). “Training and Development in Barbados”. Technical and Vocational Education and Training (TVET) Council, Barbados, 2000.
Barbados Employers’ Confederation (2002). Training and Development Needs Survey 2001 Report, (St Michael, Barbados).
Barbados Statistical Service (1997/98): Informal Sector Survey (Bridgetown, Barbados). (Ch. 6)
Barro, R.. (2001). “Economic Growth in East Asia Before and After the Financial Crisis”, National Bureau of Economic Research, Cambridge, MA, Working Paper 8330.
Barro, Robert J & Lee, Jong Wha (1996). "International Measures of Schooling Years and Schooling Quality”, American Economic Review, American Economic Association, vol. 86(2), pages 218-23.
Bercuson, K., ed. (1995). Singapore. A Case Study in Rapid Development. International Monetary Fund. Washington DC, Feb. 1995.
Berthelon, M. and C. Freund (2004). “On the Conservation of Distance in Trade” World Bank Working Paper # 3293.
Borenzstein, E., J. De Gregorio and J-W. Lee (1998). “How Does Foreign Direct Investment Affect Economic Growth?,” Journal of International Economics, 45, 115-135.
Bosworth, B. and S. Collins (2003). The Empirics of Growth: An Update, processed.
Bratsberg B. and D. Terrell (2002). “School Quality and Returns to Education of U.S. Immigrants,” Economic Inquiry, 40, 177-98.
Brenzel, L. Clarke, K. and Le Franc, E.. (2004). “Opportunities and Challenges for Expanding Trade in Health Services in the Caribbean,” Background paper prepared for this report, Processed.
Briguglio, L. (2004). “Economic Vulnerability and Resilience: Concepts and Measurements”, Paper presented at the International Workshop on “Vulnerability and Resilience of Small States” organized by the Commonwealth Secretariat and the University of Malta, University Gozo Centre, Malta.
Briguglio, L and W. Galea (2004). “Updating and Augmenting the Economic Vulnerability Index”, Processed.
192
Caribbean Tourism Organization. Statistical Report 2000-2003, St. Michael, Barbados. Carnoy, M. (2002). “Is Latin American Education Preparing its Workforce for the 21st Century Economies”, UNESCO.
Carryl, I. (2004). “Work Programme to Complete Establishment of the CARICOM Single Market and Economy”, prepared for CARICOM Secretariat.
Castalia and Associates (2004). “Caribbean Infrastructure Review,” Background Paper for this Report, Processed.
Chaitoo, R. (2000). “Electronic Commerce and CARICOM Countries: Strategic Considerations for Governments”, Report prepared for Caribbean Regional Negotiating Machinery (CRNM), Christ Church, Barbados.
Chakrabarti, A. (2001). “The Determinants of Foreign Direct Investment: Sensitivity Analyses of Cross-Country Regressions”, KYKLOS, 54, pp. 89-114.
Cleland and Gomez (2003). “Prospects for CARICOM Services Exports in Information and Communications Technology: Trade and Investment Issues”, Report prepared for Caribbean Regional Negotiating Machinery (CRNM), Christ Church, Barbados.
Costrell, R. (1997). “Can centralized educational standards raise welfare?”, Journal of Public Economics, 65; 271-93.
CRNM (2001). “Improving Competitiveness for Caribbean Development”, Report of the Caribbean Trade and Adjustment Group prepared at the request of the Regional Negotiating Machinery and the Caribbean Community Secretariat.
CRNM (2002). “A Review of Proposals on Autonomous Liberalization in Services”, Caribbean Regional Negotiating Machinery, Christ Church, Barbados.
CTAG (2001). “Improving Competitiveness for Caribbean Development”, Report of the Caribbean Trade and Adjustment Group prepared at the request of the Regional Negotiating Machinery and the Caribbean Community Secretariat (CRNM/CTAG/Final Report/Rev2/08/01, Christ Church, Barbados.
Davenport, M, C. Kirton, N. Plaiser, and H. Poot (2002) “Caribbean Perspectives on Trade Regional Integration, and Strategic and Global Planning”, Report for the European Commission.
De Gregorio, J. (1992). “Economic Growth in Latin America,” Journal of Development Economics, 39, 58-84.
DFES (2004). “Student Finance – Future Arrangement”. Government of United Kingdom,
de Ferranti, D., G. Perry, D. Lederman and W. Maloney (2002). “From Natural Resources to the Knowledge Economy.” World Bank Latin America and Caribbean Studies. World Bank, Washington, D.C.
de Ferranti, D., G. Perry, F. Ferreira, M. Walton (2004). “Inequality in Latin America and the Caribbean Breaking with History?” World Bank Latin American and Caribbean Studies. World Bank, Washington, D.C.
de Ferranti, D., G. Perry, I. Gil, J.L. Guasch, W. Maloney, C. Sanchez-Paramo, N. Schady (2003). “Closing the Gap in Education and Technology.” World Bank Latin America and Caribbean Studies. World Bank, Washington, D.C.
di Gropello, E. (2003). “Monitoring Educational Performance in the Caribbean.” World Bank Working Paper No. 6
DMRussell Consulting Inc. (2004). “A Competitiveness Agenda for the Caribbean Tourism Sector”. Background paper prepared for this report, August 2004. The World Bank, Washington, D.C.
193
Doeringer P.B. (1988). “Market Structure, Jobs and Productivity: Observations from Jamaica”, World Development, vol 16, no 4, April, pp 465-482.
Dollar, D. and A. Kraay (2002). “Inequality Is No Myth”, Foreign Affairs, July/August 2002, Vol 81, Number 4.
Downes A.S. (1998). “An Economic Analysis of Unemployment in Trinidad and Tobago”, Latin American Research Network, W.P, no 381, IADB, Washington, DC.
Downes A.S. (2000a). “Poverty and Labor Market Status in the Caribbean”, Report prepared for the Caribbean Development Bank.
Downes A.S. (2000b). “Human Resources Development in the Caribbean: Overcoming the Unemployment Problem”, Journal of Education and Development in the Caribbean, vol 4, no 1.
Downes, A.S. (2004). “The Labor Market in the Caribbean: Implications for Growth and Competitiveness”, Background Paper prepared for this report, processed.
Downes A.S. and Henry R. (1994). “Labor Market Issues in Caribbean Monetary Union” in T. Farrell and D. Worrell (eds): Caribbean Monetary Integration (Trinidad and Tobago, Caribbean Information Systems and Services Ltd), pp 144-172.
Downes A. S., Mamingi N and Antoine R. (2004). “Labor Market Regulation and Employment in the Caribbean” in J. Heckman and C. Pages (eds): Law and Employment: Lessons from Latin America and the Caribbean (Chicago, University of Chicago Press), pp 517-551.
Downes A.S. and Gunderson M (2003). “Job Search and Labor Market Information in Latin America and the Caribbean” in W. Kosanovich (ed): Improving Labor Market Opportunities and Security for Workers in Developing Countries (Washington, D.C., US Department of Labor), pp 107-136.
Due, J. and F. Greaney (1992). “The Introduction of a Value-Added Tax in Trinidad and Tobago” in R. Bird and M. Casanegra de Jantscher Eds. Improving Tax Administration in Developing Countries, IMF.
Dunlop, A. (2003). “Tourism Services Negotiations Issues: Implications for Cariforum Countries”, Report prepared for Caribbean Regional Negotiating Machinery (CRNM), Christ Church, Barbados.
Easterly, W. (2001). “The Lost Decades: Developing Countries: Stagnation in Spite of Policy Reform 1980-1998”, The World Bank, processed.
Easterly, W. & A. Kraay (2000). "Small States, Small Problems? Income, Growth, and Volatility in Small States," World Development, Elsevier, vol. 28(11), pages 2013-2027, 11.
ECLAC (2000). Demographic Bulletin: International Migration in Latin America, Economic Commission for Latin America and the Caribbean, Santiago, Chile, XXXIII: 65.
ECLAC (2001). “Trade and investment flows between the Caribbean and the rest of the hemisphere in the context of the FTAA”. Report No. LC/CAR/G.664, Economic Commission for Latin America and the Caribbean, Port-of-Spain, Trinidad and Tobago.
ECLAC (2003a). “Fiscal trends and policy issues and implications for the Caribbean”, Report No. LC/CAR/G.771, Economic Commission for Latin America and the Caribbean, Port-of-Spain, Trinidad and Tobago.
ECLAC (2003b). “Progress made in the implementation of the CARICOM single market and economy,” Report No. LC/CAR/G.770, Economic Commission for Latin America and the Caribbean, Port-of-Spain, Trinidad and Tobago.
194
ECLAC (2003c). “Special and Differential Treatment: Effects and Implications for Small Open Developing Economies”. Report delivered to ASSA Meetings, Washington, DC, January 3-5, 2003.
ECLAC (2003d). “The Impact of Foreign Direct Investment on Patterns of Specialisation in the Caribbean”, Economic Commission for Latin America and the Caribbean, Port-of-Spain, Trinidad and Tobago.
ECLAC (2004a). “Issues, effects and implications of the Free Trade Area of the Americas (FTAA) agreement for CARICOM economies,” No. LC/CAR/G.773, Economic Commission for Latin America and the Caribbean, Port-of-Spain, Trinidad and Tobago.
ECLAC (2004b). “Yachting in the Eastern Caribbean: A regional overview”, No. LC/CAR/G.775, Economic Commission for Latin America and the Caribbean, Port-of-Spain, Trinidad and Tobago.
Eskeland, G., D. Nikitin, E. Villanger, and I. Kostad (2004). “The Role of the State”, background paper for this report, CICERO, (Center for International Climate and Environmental Research, Oslo, Norway.
Evans, C. and J. Harrigan (2003). “Distance, Time and Specialization”, NBER Working Paper # 9729.
Faal E. (2003). “Currency Demand, the Underground Economy, and Tax Evasion: The Case of Guyana”, IMF Working Paper, WP/03/7, Washington, D.C.
Fairbanks, M. and S. Lindsay (1997). Plowing the Sea: Nurturing the Hidden Sources of Growth in the Developing World, Harvard Business School Press, Boston, MA.
Fairbrother, P. and G. Griffin (2002). “Introduction: Trade Unions Facing the Future” in P. Fairbrother & G. Griffin, eds, CHANGING PROSPECTS FOR TRADE UNIONISM: COMPARISON BETWEEN SIX COUNTRIES, Continuum, London & New York.
Fajnzylber, P. and D. Lederman (1999). “Economic Reforms and Total Factor Productivity Growth in Latin America and the Caribbean, 1950-95: An Empirical Note”, World Bank Policy Research Working Paper, WPS2114.
Fashoyin T. (2001). “Fostering Economic Development Through Social Partnership in Barbados, International Labour Office, Geneva.
Favaro, E. (2004). Managing Volatility in Small States. The World Bank, Washington, DC.
Freije S. (2001). “Informal Employment in Latin America and the Caribbean: Causes, Consequences and Policy Recommendations”, Inter-American Development Bank, Washington, D.C.
Ghosh, S. R. and A. Kraay (2000). “Measuring Growth in Total Factor Productivity”, PREM Notes No.42. The World Bank.
Gill, Indermit S, A. Dar, and F. Fluitman (eds.) (2000). “Vocational Education and Training Reform: Matching Skills to Markets and Budgets”, New York: Oxford University Press.
Glaeser, E.L. (2003). “Reinventing Boston”, 1640-2003 NBER Working Papers Series no. 10166.
Glaeser, E.L. and A. Saiz (2003). “The Rise of the Skilled City”, NBER Working Papers Series no. 10191
GoAu (2001). “The National Report on Higher Education in Australia” available at Australian Government Education Portal.
GRADE (2002). “Informal Sector Study for Jamaica”, Report prepared for the Inter-American Development Bank, Washington, D.C.
195
Grover N., M. Ciurea, A. Downes (1998). “Trinidad and Tobago Labor Market Study: Final Report”, Prepared for the IADB, Washington, D.C.
Hanson, J., P. Honohan, and G. Majnoni, eds. (2003). “Globalization and National Financial Systems: Issues of Integration and Size”. In J. Hanson, P. Honohan, and G. Majnoni, eds. Globalization and National Financial Systems, Oxford University Press and the World Bank, pp. 1-32.
Hanushek, A. and A. Eric (2002). “The Long Run Importance of School Quality.” NBER Working Papers Series, Working Paper 9071, National Bureau of Economic Research, Cambridge, MA.
Hanushek, E. and D. Kimko (2000). "Schooling, Labor Force Quality, and the Growth of Nations", American Economic Review, (December 2000), pp. 1184-1208.
Hausmann, R. and D. Rodrik. (2003). “Economic Development as Self-Discovery”, Harvard University, Cambridge, MA.
Helpman, E. (2004). The Mystery of Economic Growth. Cambridge: Belknap, Cambridge, MA.
Hummels, D. (1999). “Time as a Trade Barrier”, processed, Purdue University.
infoDev (2005). "Improving Competitiveness and Increasing Economic Diversification in the Caribbean: The Role of ICT," Prepared by the consulting firm OTF Group.
I.L.O. (1996). “Youth Unemployment: A Caribbean Challenge” in I.L.O.: Digest of Caribbean Labor Statistics (Port-of-Spain, Trinidad and Tobago), pp 16-29.
IMF (2004). “Eastern Caribbean Currency Union Financial Sector Stability Assessment”, Country Report No. 04/335, Washington D.C.
IMF. International Financial Statistics. Various editions, Washington, DC.
IMF (2005). “Stabilization, Debt, and Fiscal Policy in the Caribbean”, IMF Working Paper (WP/05/26).
Inter-American Development Bank (IDB) (2002). “CARICOM Report No. 1”, INTAL – Integration and Regional Programs Department, Buenos Aires, Argentina.
Inter-American Development Bank (IDB) (2004). “Fiscal Impact of Trade Liberalization in the Americas,” Periodic Note, January 2004.
Klinger, B. and Lederman, D. (2004). “Discovery and Development: An Empirical Exploration of ‘New’ Product”, World Bank Policy Research Working Paper 3450, November 2004, World Bank, Washington DC.
Kolstad, I. and E. Villanger (2004). “Promoting Investment in Small Caribbean States”, Chr. Michelsen Institute, Working Paper 2004:9.
LaRocque, N. (2003). “HECS: Not the bad hex it was made out to be”, Review - Institute of Public Affairs. Jolimont: Sep 2003. Vol. 55, Issue 3; pg. 32.
Le Franc E. and A.S. Downes (2001). “Measuring Human Development in Countries with Invisible Economies: Challenges Posed by the Informal and Remittance Sector in Jamaica, Social and Economic Studies (SES), vol 50, no 1, March, pp 169-198.
Levine, R. and D. Renelt (1992). "A Sensitivity Analysis of Cross-Country Growth Regressions," American Economic Review, American Economic Association, vol. 82(4), pages 942-63.
196
Lim, E. (2001). “Determinants of, and the Relation Between, Foreign Direct Investment and Growth: A Summary of the Recent Literature”, IMF Working Paper 01/175, IMF, Washington D.C.
Liz, R.E. (2003). “Diagnostico Sobre el Financiamiento y Los Costos de la Educación Superior En la Republica Dominicana,” World Bank commissioned background paper.
Loayza, N., P. Fajnzylber, and C. Calderon (2002). “Economic Growth in Latin America and The Caribbean: Stylized Facts, Explanations, and Forecasts”, The World Bank, processed.
Lochan S. (2000). “Education and Work: Case Studies of Trinidad and Tobago, Jamaica and Barbados, Port-of-Spain, ILO, Caribbean Office.
Lora, Eduardo (2001). “Structural Reforms in Latin America: What has Been Reformed and How to Measure it”, Working Paper 348, Inter-American Development Bank, Washington, DC.
Lundvall, B., B. Johnson, E. S. Andersen, and B. Dalum (2002). “National Systems of Production, Innovation and Competence Building”, Research Policy 31(2002): 213-31.
Maloney, W. and G. Rojas (forthcoming). “How Elastic are Sea, Sand and Sun?”, World Bank, processed.
Majid, N. (2001). “The Working Poor in Developing Countries”, International Labor Review, vol 140, no 3, pp 271-291.
Marques, G. and C. Pages (1998). “Ties that Bind: Employment Protection and Labor Market Outcomes in Latin America”, Inter-American Development Bank, Washington, DC.
Marquez, Gustavo (2002). “Training the Workforce in Latin America” What Needs to be Done?” Inter-American Development Bank, Washington DC, USA.
Mattoo, A. and A. Subramanian (2004). “The WTO and the Poorest Countries: The Starkest Reality”, IMF Working Paper (04/81).
McArdle, T. (2004). “Firm and Worker Training in the Caribbean”, Background Paper prepared for this report, Washington DC, USA and Kingston, Jamaica.
McCarthy, D. (2001). “Social Policy and Macroeconomics: The Irish Experience”. PRWP #2736, The World Bank, Washington, DC.
Miller, E. ed. (1998). “Educational Reform in the Commonwealth Caribbean.”, Inter-American Council for Integral Development, Organization of American States, Washington, DC.
Mitchell, D. (2004). “Sugar in the Caribbean: Adjusting to Eroding Preferences”, Background Paper prepared for this report, Washington, D.C.
Moonilal, R. (1998). “Changing Labour Relations and the Future of Trade Unions: A Case Study of Trinidad and Tobago”, PH.D. Thesis, The Institute of Social Studies, The Hague, The Netherlands.
Musgrave, R., (1959). The Theory of Public Finance, McGraw-Hill, New York.
Nathan Associates (2002). “Changes in Global Trade Rules for Textiles and Apparel”, Research Report, Washington DC.
NERA and Oxford Policy Management (2004). “Addressing the Impact of Preference Erosion in Bananas on Caribbean Countries”, Report prepared for Department for International Development (DFID).
Nurse, L. (2004). “Trade Unions and Industrial Relations in the Caribbean”, background paper prepared for this report, processed.
197
OECD (2004a). A New World Map in Textiles and Clothing: Adjusting to Change. vol. 2004, no. 20, Organisation for Economic Co-operation and Development, Paris, France.
OECD (2004b). “First Results from PISA 2003”, Organisation for Economic Co-operation and Development, Paris, France.
OECS (2004). “Public Sector Transformation”, Eastern Caribbean Central Bank, 11-12 November 2004, Paper No. OECS/AUT/04/40/22.
Ozden C. and E. Reinhardt (2003). “The Perversity of Preferences,” World Bank Working Paper # 2955, Washington, D.C..
Ozden C. and E. Reinhardt (2004). “First Do No Harm: The Effect of Unilateral Trade Preferences on Developing Country Exports”, Processed, World Bank.
Ozden C. and G. Sharma (2004). “Price Effects of Preferential Market Access: The Caribbean Basin Initiative and the Apparel Sector”, World Bank Working Paper 3244.
Palmade,. V. and A. Anayiotas (2004). “FDI Trends: Looking beyond the Current Gloom in Developing Countries”, Public Policy Journal Note No 273, FIAS, World Bank.
Panton, D. (1993). “Dual Labor Markets and Unemployment in Jamaica: A Modern Synthesis”, SES, vol 42 (1), March, pp 75-118.
Patrinos, H. and G. Psacharopoulos (2004). "Returns to Investment in Education: A Further Update," Education Economics, Taylor and Francis Journals, vol. 12(2), pages 111-134.
Porter, Michael E. (2001). “Clusters of Innovation: Regional Foundations of U.S. Competitiveness.” Clusters of Innovation Initiative, Monitor Group On the Frontier Council on Competitiveness.
Rama, M. (1995). “Do Labor Market Policies and Institutions Matter? The Adjustment Experience in Latin America and the Caribbean”, Labor, Special Issue 1995, pp S244-S268.
Rasmussen, T.N. (2004). “Macroeconomic Implications of Natural Disasters in the Caribbean”, IMF Working Paper (WP/04/224).
Riddle, D. (2002). “Issues Regarding Small Service Suppliers in the Context of the FTAA, 2002”. Report prepared for Caribbean Regional Negotiating Machinery (CRNM), Christ Church, Barbados.
Rodrik, D. (1998). “Why Do More Open Economies Have Bigger Governments?” The Journal of Political Economy, Vol. 106, No.5, 997-1032.
Shah, A. and S. Thomas (2003). “Securities Market Efficiency”. in J. Hanson, P. Honohan, and G. Majnoni, eds. Globalization and National Financial Systems, Oxford University Press and the World Bank, pp. 145-174.
Shatz, H. and A.J. Venables (2000). “The Geography of International Investment”, World Bank Policy Research Working Paper No. 2338.
Stern, N. (2002). “A Strategy for Development”, World Bank, Washington DC.
Strobl, E. and D. Byrne (2002). "Defining Unemployment in Developing Countries: Evidence from Trinidad and Tobago," IZA Discussion Papers 659, Institute for the Study of Labor (IZA).
Strobl E. and Walsh F. (2003). “Minimum Wages and Compliance: The Case of Trinidad and Tobago”, Economic Development and Cultural Change, vol 51, no 2, Jan, pp 427-450.
Subramanian, A. and D. Roy (2001). “Who Can Explain The Mauritian Miracle: Meade, Romer, Sachs, or Rodrik?” Paper Presented at the Conference on “Analytical Country Studies on Growth”, http://ksghome.harvard.edu/~.drodrik.academic.ksg/growthprogram.html.
198
Swedish Development Advisers (2004). “Offshore Education in OECS”, Background Paper prepared by for this report, The World Bank, Washington, DC.
Thomas-Hope, E. (2004). “Migration Issues in the Caribbean Region”, Background Paper prepared by for this report, processed.
Thorn, K., L. Holm-Nielsen and J. S. Jeppesen (2004). “Approaches to Results-Based Funding in Tertiary Education; Identifying Finance Reform Options for Chile”. World Bank Policy Research Working Paper N#3436, Washington D.C.
UASD “Estatuto Orgánico UASD”, Santo Domingo, Dominican Republic
UNCTAD (2004). World Investment Report: The Shift Towards Services, UNCTAD, New York and Geneva.
UNDP (2003). “Caribbean Regional Report on the Implementation of the Millenium Devevelopment Goals (MDGs)”, New York, NY. Prepared for the United Nations Development Programme (UNDP) by the University of the West Indies, Mona.
UNDP (2004). Human Development Report 2004: Cultural Liberty in Today’s Diverse World. United Nations Development Programme, New York, NY.
US Immigration and Naturalization Service (1997, 1999, 2003). Statistical Yearbook of the Immigration and Naturalization Service. Washington D.C.
USAID (2004). “Caribbean Financial Sector Assessment”, prepared by Deloitte, Touche Tohmatsu, Washington, DC.
UWI (2003). “The University of the West Indies Strategic Plan II – 2002-2007”, Office of Planning.
Valtonen K (2001). “Job-seeking Strategies in Trinidad and Tobago”, Cepal Review 73, pp 171-183.
World Bank (1994). Caribbean Countries. Policies for Private Sector Development, Report No 12617LAC.
World Bank (1996). “Public Sector Modernization in the Caribbean”, #15185-CRG.
World Bank (1998). ‘Wider Caribbean Financial Sector Review. Increasing Competitiveness and Financial Resource Management for Economic Growth’, Report No. 17556-LAC.
World Bank (2001). “Dominican Republic Poverty Assessment.” Poverty in a High-Growth Economy (1986-2000). (In Two Volumes) Volume I: Main Report.
World Bank (2002a). “Monitoring Educational Performance in the Caribbean”, Report No. 24337, Washington, D.C.
World Bank (2002b). “Guyana Public Expenditure Review”, Report No. 20151-GUA, Washington, D.C.
World Bank (2003a). Caribbean Economic Overview 2002: Macroeconomic Volatility, Household Vulnerability, and Institutional and Policy Responses. The World Bank. Report No. 24165-LAC.
World Bank (2003b). Caribbean Youth Development: Issues and Policy Directions. World Bank Country Study, Washington, D.C: World Bank.
World Bank (2003c). “Constructing Knowledge Societies: New Challenges for Tertiary Education”, Directions in Development, Washington DC, USA
World Bank (2003d). Guyana Development Policy Review: The Challenge of Governance and Growth. Report No. 25640, Washington, DC.
199
World Bank (2003e) “OECS Fiscal Issues - St. Kitts and Nevis”, Public Expenditure Review No. 25185-LAC, Washington D.C., USA.
World Bank (2004a). “Transitional Support Strategy for the Republic of Haiti”. Report No. 30541-LCR. Washington, D.C.
World Bank (2004b). The Road to Sustained Growth in Jamaica. World Bank Country Study. Washington, D.C.: World Bank.
World Bank (2004c). Doing Business 2004: Understanding Regulations (Washington, D.C.).
World Bank (2004d). A Better Investment Climate for Everyone, World Bank, Washington D.C.
World Bank (2004e). “Dominican Republic: Review of Trade and Labor Competitiveness”, Report no. 30542 DO, Washington, D.C.
World Bank (2004f). “How well do SME Programs Work? Evaluating Mexico’s SME Programs Using Panel Firm Data”. Washington DC: The World Bank. Processed.
World Bank (2004g). “Benchmarking the FDI Environment in the Caribbean”, FIAS, World Bank, Washington D.C.
World Bank (2004h). “Grenada: A Diagnostic Review of the Investment Climate”, FIAS, World Bank, Washington D.C.
World Bank (2004i). “Dominican Republic Public Expenditure Review, Reforming Institutions for a More Efficient Public Expenditure Management,” Washington DC, USA.
World Bank (2004j). “Caribbean Infrastructure Assessment”, background paper prepared for this report, Report No. 29680.
World Bank (2004k). “OECS Fiscal Issues - Dominica”, Public Expenditure Review No. 27467-DOM, Washington D.C., USA.
World Bank (2004l) “OECS Fiscal Issues - St. Lucia”, Public Expenditure Review No.29685-LC, Washington D.C., USA.
World Bank (2004m).“OECS Fiscal Issues - Grenada”, Public Expenditure Review No.28334-GRD, Washington D.C., USA.
World Bank (2004n). “Project Appraisal Document – Dominican Republic Power Sector Technical Assistance Project,” Washington, D.C. Report No. 26186, Washington, DC.
World Bank (2004o). World Development Indicators. World Bank. Washington, DC.
World Bank (2004p). Global Development Finance 2004: Harnessing Cyclical Gains for Development. World Bank. Washington, DC.
World Bank (2005a). “Minimum Wages in Latin America and the Caribbean: the Impact on Employment, Inequality and Povery”, LAC Regional Paper, processed.
World Bank (2005b). “Jamaica Fiscal Consolidation For Growth And Poverty Reduction”. Public Expenditure Review No. 29546-JM, Washington D.C.
World Bank (2005c). “Organization of Eastern Caribbean States: Towards a New Agenda for Growth”, Report No. 31863-LAC, Washington, D.C.
World Bank (2005d). “Achieving Environmentally Sustainable Tourism in the OECS Sub-Region”, Washington, DC.
World Bank (2005e). “OECS Telecommunications and ICT Development Project”, Project Appraisal Document, Report No. 31395-LAC.
200
World Bank (forthcoming a). “Non-Traditional Food Exports Encounter More Stringent Trade Partner SPS Standards”, Washington D.C., USA.
World Bank (forthcoming b).“OECS Fiscal Issues - St. Vincent and the Grenadines”, Public Expenditure Review No.30885-SVG, Washington D.C., USA.
World Tourism Organization (2001). “Tourism 2020 Vision: Global Forecasts and Profiles of Market Segments”, Madrid, Spain.
WTTC (2004). “The Caribbean: The Impact of Travel & Tourism on Jobs and the Economy”, World Travel & Tourism Council, London, United Kingdom.

201
ANNEXES
202
Annex 1.1: Methodology Used to Obtain Alternative Measures of TFP
The measurement of TFP is notoriously difficult, and sensitive to the assumptions and procedures used for the estimation. We therefore use three alternative approaches to estimating the contributions of TFP: (i) the Solow residual, (ii) the regression estimate of TFP, and (iii) the regression estimate of TFP adjusted for business-cycle. We focus on the last two decades (1981-2002), because of data limitations.
Solow Residual (TFP1) We assume a constant returns to scale production function
αα −= 1tttt LKAY [A1]
where tY is the real GDP, tA is the index of TFP, tK is the capital input, tL is the labor input, and α and α−1 are the measures of the capital and labor shares in output, respectively.
[A1] can be expressed in terms of growth rates
( ) ( ) ( ) ( ) ( )1111 ln1lnlnln −−−− −−−= tttttttt LLKKYYAA αα [A2]
or
( )tttt LKYA gggg αα −−−= 1 [A3]
where xg is the growth rate of the variable x .
Yg is given by the data on real GDP growth rate for each country. Kg is calculated using the perpetual inventory method
ttt IdKK +−= − )1(1
where tI is the investment series and d , the depreciation rate, equals 0.05. This data is constructed by Nehru and Dareshwar (1993), extended by various authors up to 2000, and is available in WDI. Lg is calculated using the data on population aged between 16 to 64. The measure of α is given by the average share of gross investment in GDP of each country (i.e., jα ,
for country j ), instead of assuming some fixed number for α for all countries.185 Thus given the data on the growth rates of Y, K, L, and α, we can obtain the estimate of TFP growth ( Ag ) as the difference between output growth and the weighted average of growth in inputs. The result is reported in Annex Table 1.3.
Regression Estimates (TFP2)
An alternative to the growth accounting approach is the direct estimation of the aggregate production function given in [A1] . Usually, the approach expresses [A1] in per worker terms, dividing both sides by tL ,
185 This approach of estimating jα , for country j using the data on gross investment share is proposed by Mankiew, Romer, and Weil (1992) “A contribution to the Empirics of Economic Growth,” Quarterly Journal o f Economics, 107(2): 407-438.
203
α
α
tttt
tt
t
t kAyLKA
LY
=⇒⎟⎟⎠
⎞⎜⎜⎝
⎛= .
Taking logs and a first-difference we have
( ) ( ) ( )111 lnlnln −−− += tttttt kkAAyy α .
This leads to an equation that can be empirically estimated:
( ) ( ) ttttt kkyy εαλ ++= −− 11 lnln
wherein the rate of growth of TFP is estimated by a constant ( )λ plus an error term ( )ε .186 The estimates of λ for each country in the Caribbean are reported in Annex Table 1.4.
Regression Estimate of TFP adjusted for business-cycle fluctuations (TFP3)
The third method that we have used deals with the impact of short-term fluctuations. To remove the cyclical component of TFP, we have followed the simple approach proposed by Fajnzylber and Lederman (1999). It involves using a dummy variables for each country, defined =1 for the years of recession, and =0 otherwise. The recession in our context is defined as the years in which the actual growth rate per worker, ty , falls below the “trend” ty , and the latter is estimated using the HP filter. The estimated equation under this approach takes the following form:
( ) ( ) tttttt DRECkkyy εαλ +++= −− 11 ln~ln
where tDREC is the dummy variable defined as above. The estimates of λ~ are reported in Annex Tables 1.5 and 1.6.
The Results
The first measure of TFP (TFP1), the accounting measure known as Solow residual, has the advantage of availability of comparable estimates for Latin America (Loayza, et al. 2002). Based on this measure of TFP, growth in the Caribbean region seems to have been driven more by growth in TFP than by individual factor accumulation (labor and capital). Furthermore, the Caribbean experienced a faster growth in TFP relative to Latin America. Also, the slowdown in growth in the Caribbean during the 1990s can be attributed to slowdown in TFP growth.
The second measure of TFP (TFP2), obtained from the regression estimate of a production function on a country-by-country basis, has the advantage of permitting a direct estimation of TFP growth (At term in the Cobb-Douglas production function), along with the standard error of the estimate to determine how much confidence can be attached to the estimated TFP growth in each country. Using this second approach, a similar pattern can be observed as the first in the evolution of TFP growth over the last two decades: a strong contribution of TFP growth in the 1980s, and a significant slowdown in TFP growth in the 1990s. Indeed, the second measure suggest an overall negative TFP growth in the region during the 1990s.
The third measure of TFP (TFP3) adjusts for the short-run cyclical fluctuations. Both Solow residuals and the unadjusted regression estimates of TFP suffer from the fact that the evolution of 186 Fajnzylber and Lederman (1999) “Economic Reforms and Total Factor Productivity Growth in Latin America and the Caribbean, 1950-95: An Empirical Note,” World Bank Policy Research Working Paper, WPS2114.
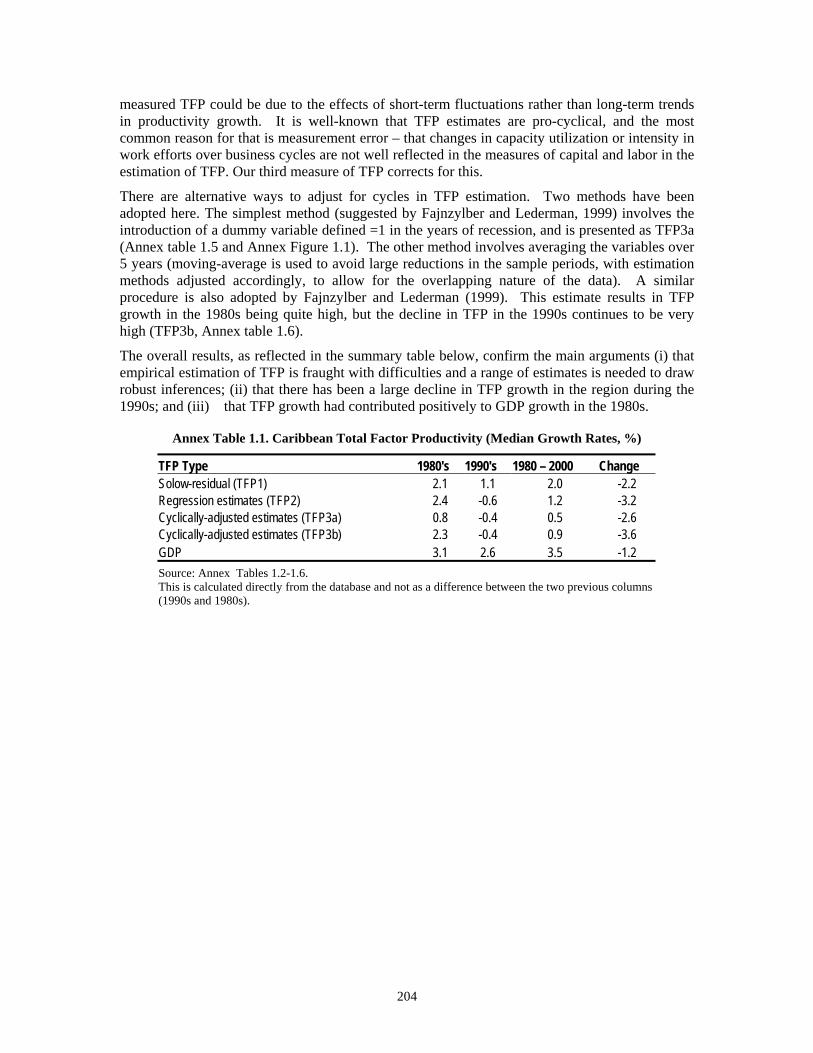
204
measured TFP could be due to the effects of short-term fluctuations rather than long-term trends in productivity growth. It is well-known that TFP estimates are pro-cyclical, and the most common reason for that is measurement error – that changes in capacity utilization or intensity in work efforts over business cycles are not well reflected in the measures of capital and labor in the estimation of TFP. Our third measure of TFP corrects for this.
There are alternative ways to adjust for cycles in TFP estimation. Two methods have been adopted here. The simplest method (suggested by Fajnzylber and Lederman, 1999) involves the introduction of a dummy variable defined =1 in the years of recession, and is presented as TFP3a (Annex table 1.5 and Annex Figure 1.1). The other method involves averaging the variables over 5 years (moving-average is used to avoid large reductions in the sample periods, with estimation methods adjusted accordingly, to allow for the overlapping nature of the data). A similar procedure is also adopted by Fajnzylber and Lederman (1999). This estimate results in TFP growth in the 1980s being quite high, but the decline in TFP in the 1990s continues to be very high (TFP3b, Annex table 1.6).
The overall results, as reflected in the summary table below, confirm the main arguments (i) that empirical estimation of TFP is fraught with difficulties and a range of estimates is needed to draw robust inferences; (ii) that there has been a large decline in TFP growth in the region during the 1990s; and (iii) that TFP growth had contributed positively to GDP growth in the 1980s.
Annex Table 1.1. Caribbean Total Factor Productivity (Median Growth Rates, %)
TFP Type 1980's 1990's 1980 – 2000 Change Solow-residual (TFP1) 2.1 1.1 2.0 -2.2 Regression estimates (TFP2) 2.4 -0.6 1.2 -3.2 Cyclically-adjusted estimates (TFP3a) 0.8 -0.4 0.5 -2.6 Cyclically-adjusted estimates (TFP3b) 2.3 -0.4 0.9 -3.6 GDP 3.1 2.6 3.5 -1.2 Source: Annex Tables 1.2-1.6. This is calculated directly from the database and not as a difference between the two previous columns (1990s and 1980s).
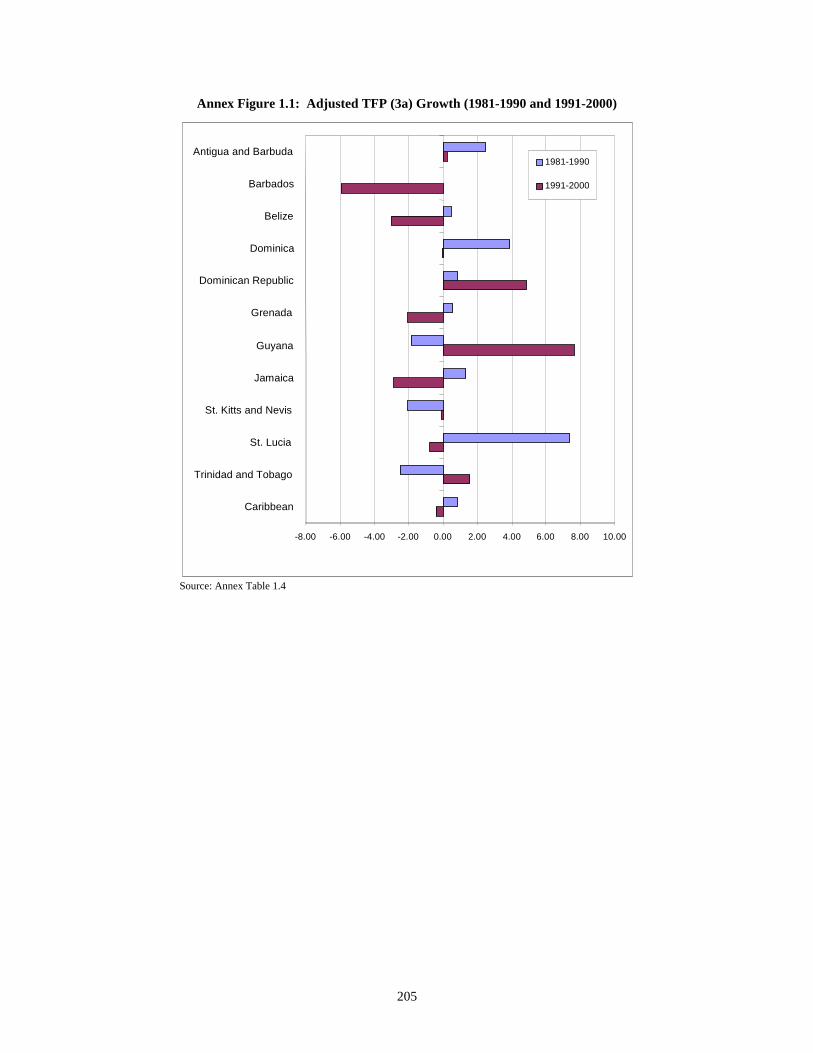
205
Annex Figure 1.1: Adjusted TFP (3a) Growth (1981-1990 and 1991-2000)
-8.00 -6.00 -4.00 -2.00 0.00 2.00 4.00 6.00 8.00 10.00
Caribbean
Trinidad and Tobago
St. Lucia
St. Kitts and Nevis
Jamaica
Guyana
Grenada
Dominican Republic
Dominica
Belize
Barbados
Antigua and Barbuda 1981-1990 1991-2000
Source: Annex Table 1.4
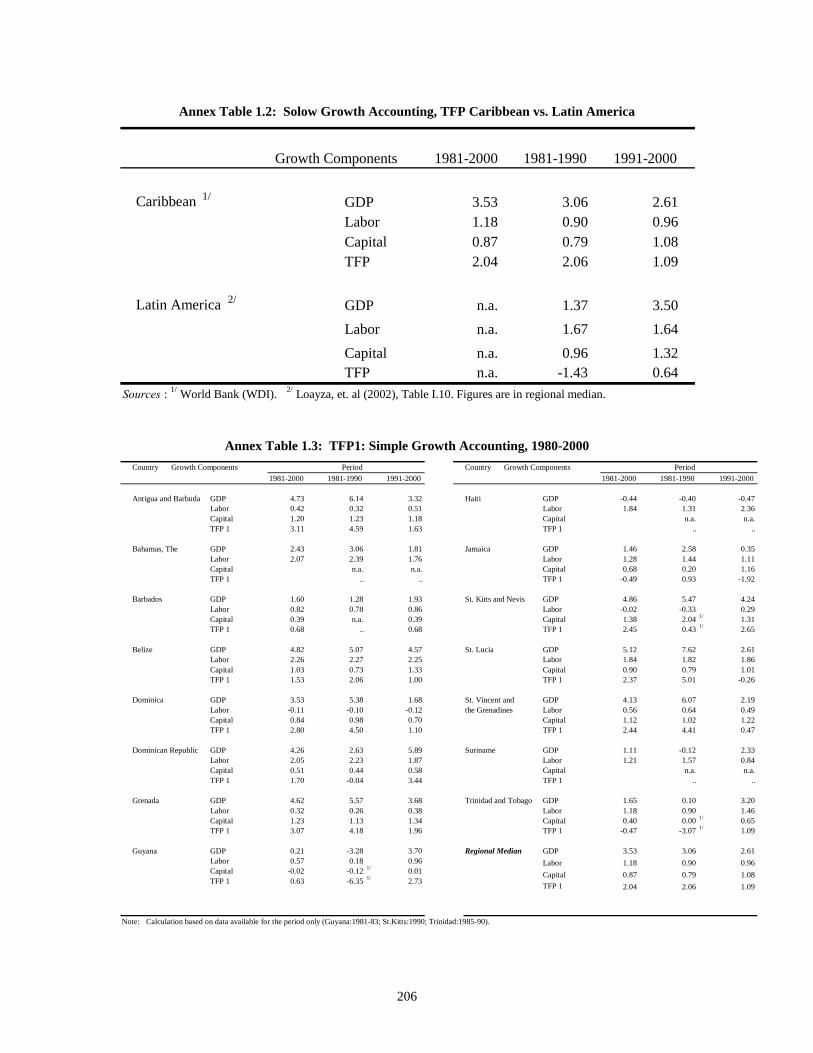
206
Annex Table 1.2: Solow Growth Accounting, TFP Caribbean vs. Latin America
Growth Components 1981-2000 1981-1990 1991-2000
Caribbean 1/ GDP 3.53 3.06 2.61Labor 1.18 0.90 0.96Capital 0.87 0.79 1.08TFP 2.04 2.06 1.09
Latin America 2/ GDP n.a. 1.37 3.50Labor n.a. 1.67 1.64Capital n.a. 0.96 1.32TFP n.a. -1.43 0.64
Sources : 1/ World Bank (WDI). 2/ Loayza, et. al (2002), Table I.10. Figures are in regional median.
Annex Table 1.3: TFP1: Simple Growth Accounting, 1980-2000 Country Growth Components Period Country Growth Components Period
1981-2000 1981-1990 1991-2000 1981-2000 1981-1990 1991-2000
Antigua and Barbuda GDP 4.73 6.14 3.32 Haiti GDP -0.44 -0.40 -0.47Labor 0.42 0.32 0.51 Labor 1.84 1.31 2.36Capital 1.20 1.23 1.18 Capital n.a. n.a.TFP 1 3.11 4.59 1.63 TFP 1 .. ..
Bahamas, The GDP 2.43 3.06 1.81 Jamaica GDP 1.46 2.58 0.35Labor 2.07 2.39 1.76 Labor 1.28 1.44 1.11Capital n.a. n.a. Capital 0.68 0.20 1.16TFP 1 .. .. TFP 1 -0.49 0.93 -1.92
Barbados GDP 1.60 1.28 1.93 St. Kitts and Nevis GDP 4.86 5.47 4.24Labor 0.82 0.78 0.86 Labor -0.02 -0.33 0.29Capital 0.39 n.a. 0.39 Capital 1.38 2.04 1/ 1.31TFP 1 0.68 .. 0.68 TFP 1 2.45 0.43 1/ 2.65
Belize GDP 4.82 5.07 4.57 St. Lucia GDP 5.12 7.62 2.61Labor 2.26 2.27 2.25 Labor 1.84 1.82 1.86Capital 1.03 0.73 1.33 Capital 0.90 0.79 1.01TFP 1 1.53 2.06 1.00 TFP 1 2.37 5.01 -0.26
Dominica GDP 3.53 5.38 1.68 St. Vincent and GDP 4.13 6.07 2.19Labor -0.11 -0.10 -0.12 the Grenadines Labor 0.56 0.64 0.49Capital 0.84 0.98 0.70 Capital 1.12 1.02 1.22TFP 1 2.80 4.50 1.10 TFP 1 2.44 4.41 0.47
Dominican Republic GDP 4.26 2.63 5.89 Suriname GDP 1.11 -0.12 2.33Labor 2.05 2.23 1.87 Labor 1.21 1.57 0.84Capital 0.51 0.44 0.58 Capital n.a. n.a.TFP 1 1.70 -0.04 3.44 TFP 1 .. ..
Grenada GDP 4.62 5.57 3.68 Trinidad and Tobago GDP 1.65 0.10 3.20Labor 0.32 0.26 0.38 Labor 1.18 0.90 1.46Capital 1.23 1.13 1.34 Capital 0.40 0.00 1/ 0.65TFP 1 3.07 4.18 1.96 TFP 1 -0.47 -3.07 1/ 1.09
Guyana GDP 0.21 -3.28 3.70Labor 0.57 0.18 0.96Capital -0.02 -0.12 1/ 0.01TFP 1 0.63 -6.35 1/ 2.73
Regional Median GDP 3.53 3.06 2.61Labor 1.18 0.90 0.96Capital 0.87 0.79 1.08TFP 1 2.04 2.06 1.09
Note: Calculation based on data available for the period only (Guyana:1981-83; St.Kitts:1990; Trinidad:1985-90).
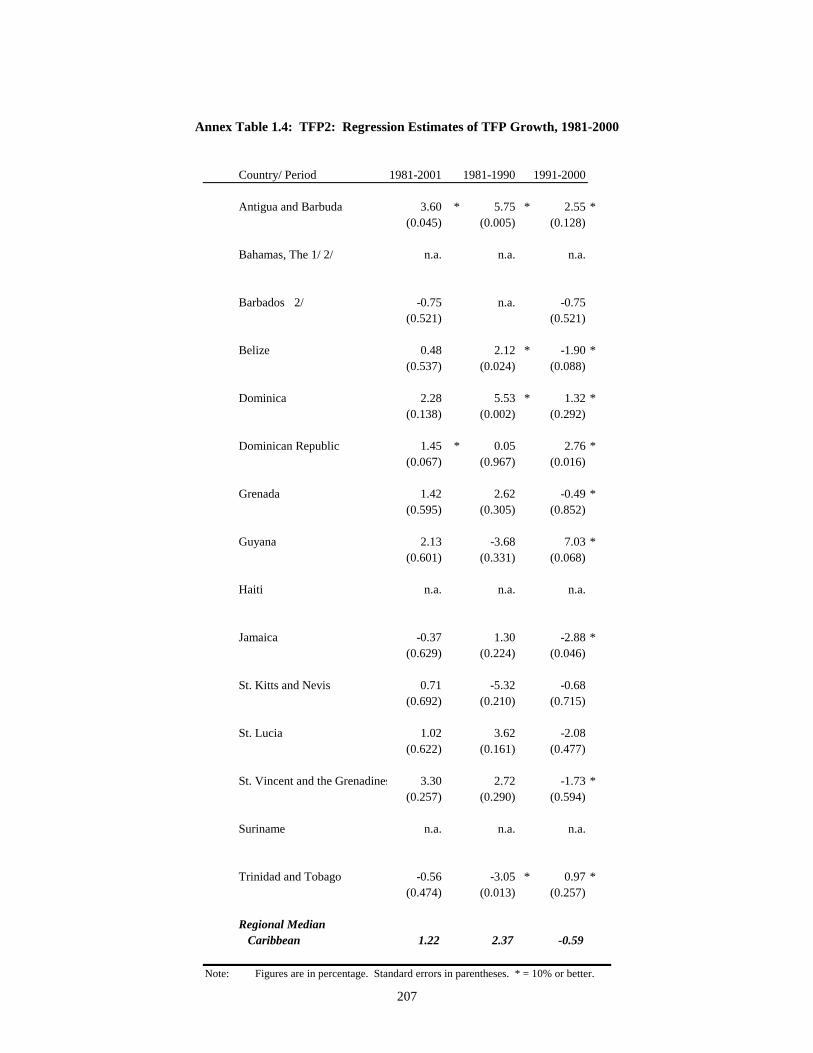
207
Annex Table 1.4: TFP2: Regression Estimates of TFP Growth, 1981-2000
Country/ Period 1981-2001 1981-1990 1991-2000
Antigua and Barbuda 3.60 * 5.75 * 2.55 *(0.045) (0.005) (0.128)
Bahamas, The 1/ 2/ n.a. n.a. n.a.
Barbados 2/ -0.75 n.a. -0.75
(0.521) (0.521)
Belize 0.48 2.12 * -1.90 *(0.537) (0.024) (0.088)
Dominica 2.28 5.53 * 1.32 *
(0.138) (0.002) (0.292)
Dominican Republic 1.45 * 0.05 2.76 *(0.067) (0.967) (0.016)
Grenada 1.42 2.62 -0.49 *
(0.595) (0.305) (0.852)
Guyana 2.13 -3.68 7.03 *(0.601) (0.331) (0.068)
Haiti n.a. n.a. n.a.
Jamaica -0.37 1.30 -2.88 *
(0.629) (0.224) (0.046)
St. Kitts and Nevis 0.71 -5.32 -0.68(0.692) (0.210) (0.715)
St. Lucia 1.02 3.62 -2.08
(0.622) (0.161) (0.477)
St. Vincent and the Grenadines 3.30 2.72 -1.73 *(0.257) (0.290) (0.594)
Suriname n.a. n.a. n.a.
Trinidad and Tobago -0.56 -3.05 * 0.97 *
(0.474) (0.013) (0.257)
Regional Median Caribbean 1.22 2.37 -0.59
Note: Figures are in percentage. Standard errors in parentheses. * = 10% or better.
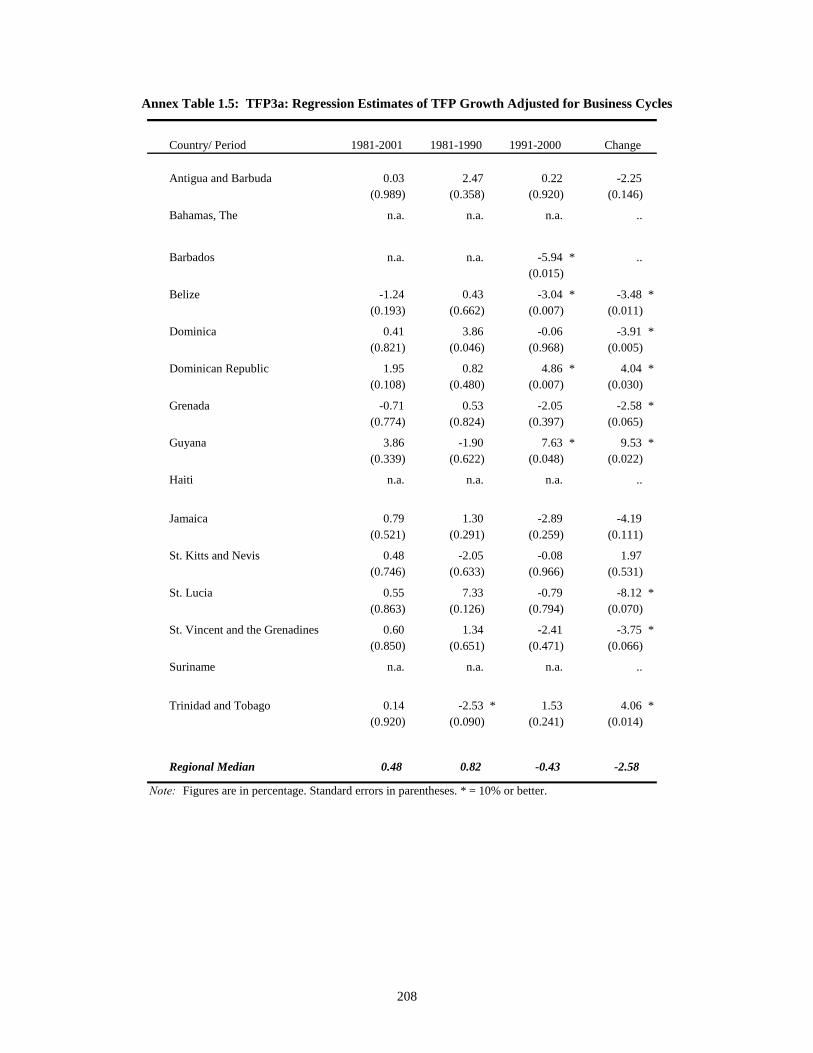
208
Annex Table 1.5: TFP3a: Regression Estimates of TFP Growth Adjusted for Business Cycles
Country/ Period 1981-2001 1981-1990 1991-2000 Change
Antigua and Barbuda 0.03 2.47 0.22 -2.25 (0.989) (0.358) (0.920) (0.146)
Bahamas, The n.a. n.a. n.a. ..
Barbados n.a. n.a. -5.94 * .. (0.015)
Belize -1.24 0.43 -3.04 * -3.48 *(0.193) (0.662) (0.007) (0.011)
Dominica 0.41 3.86 -0.06 -3.91 *(0.821) (0.046) (0.968) (0.005)
Dominican Republic 1.95 0.82 4.86 * 4.04 *(0.108) (0.480) (0.007) (0.030)
Grenada -0.71 0.53 -2.05 -2.58 *(0.774) (0.824) (0.397) (0.065)
Guyana 3.86 -1.90 7.63 * 9.53 *(0.339) (0.622) (0.048) (0.022)
Haiti n.a. n.a. n.a. ..
Jamaica 0.79 1.30 -2.89 -4.19 (0.521) (0.291) (0.259) (0.111)
St. Kitts and Nevis 0.48 -2.05 -0.08 1.97 (0.746) (0.633) (0.966) (0.531)
St. Lucia 0.55 7.33 -0.79 -8.12 *(0.863) (0.126) (0.794) (0.070)
St. Vincent and the Grenadines 0.60 1.34 -2.41 -3.75 *(0.850) (0.651) (0.471) (0.066)
Suriname n.a. n.a. n.a. ..
Trinidad and Tobago 0.14 -2.53 * 1.53 4.06 *(0.920) (0.090) (0.241) (0.014)
Regional Median 0.48 0.82 -0.43 -2.58
Note: Figures are in percentage. Standard errors in parentheses. * = 10% or better.
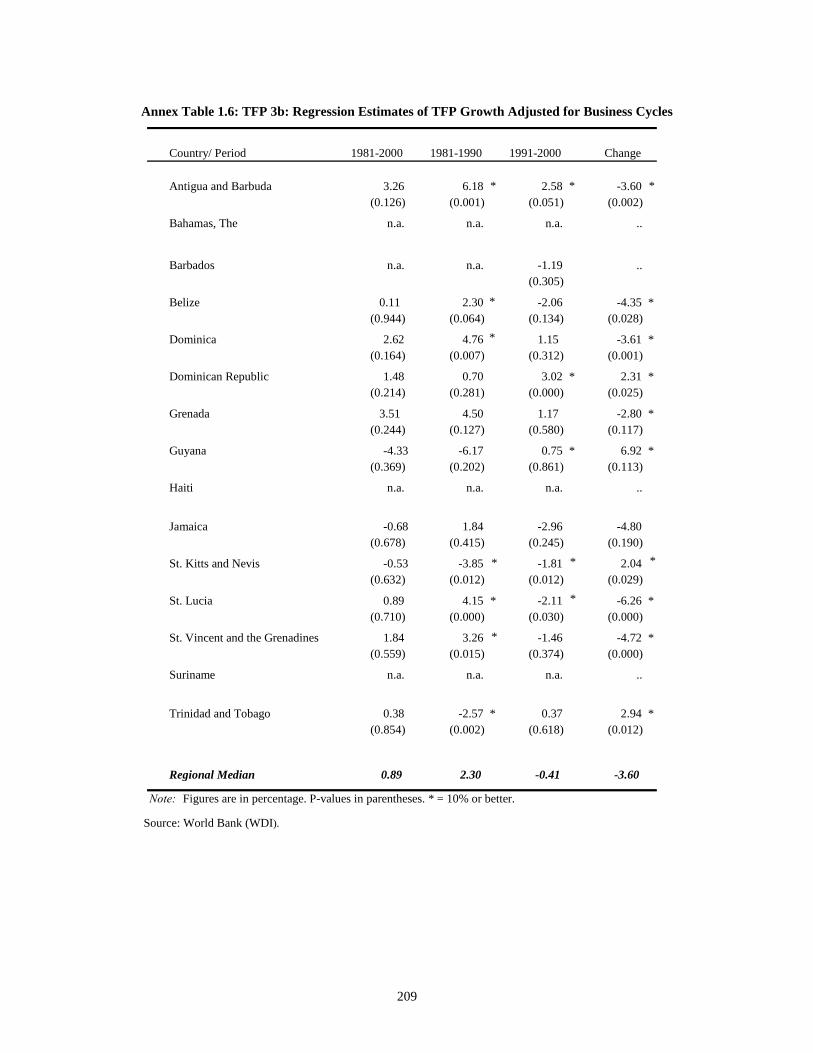
209
Annex Table 1.6: TFP 3b: Regression Estimates of TFP Growth Adjusted for Business Cycles
Country/ Period 1981-2000 1981-1990 1991-2000 Change
Antigua and Barbuda 3.26 6.18 2.58 -3.60 (0.126) (0.001) (0.051) (0.002)
Bahamas, The n.a. n.a. n.a. ..
Barbados n.a. n.a. -1.19 .. (0.305)
Belize 0.11 2.30 -2.06 -4.35 *(0.944) (0.064) (0.134) (0.028)
Dominica 2.62 4.76 1.15 -3.61 *(0.164) (0.007) (0.312) (0.001)
Dominican Republic 1.48 0.70 3.02 * 2.31 *(0.214) (0.281) (0.000) (0.025)
Grenada 3.51 4.50 1.17 -2.80 *(0.244) (0.127) (0.580) (0.117)
Guyana -4.33 -6.17 0.75 * 6.92 *(0.369) (0.202) (0.861) (0.113)
Haiti n.a. n.a. n.a. ..
Jamaica -0.68 1.84 -2.96 -4.80 (0.678) (0.415) (0.245) (0.190)
St. Kitts and Nevis -0.53 -3.85 -1.81 2.04 (0.632) (0.012) (0.012) (0.029)
St. Lucia 0.89 4.15 -2.11 -6.26 *(0.710) (0.000) (0.030) (0.000)
St. Vincent and the Grenadines 1.84 3.26 -1.46 -4.72 *(0.559) (0.015) (0.374) (0.000)
Suriname n.a. n.a. n.a. ..
Trinidad and Tobago 0.38 -2.57 * 0.37 2.94 *(0.854) (0.002) (0.618) (0.012)
Regional Median 0.89 2.30 -0.41 -3.60
Note: Figures are in percentage. P-values in parentheses. * = 10% or better.
* * *
*
*
* * *
* *
*
Source: World Bank (WDI).
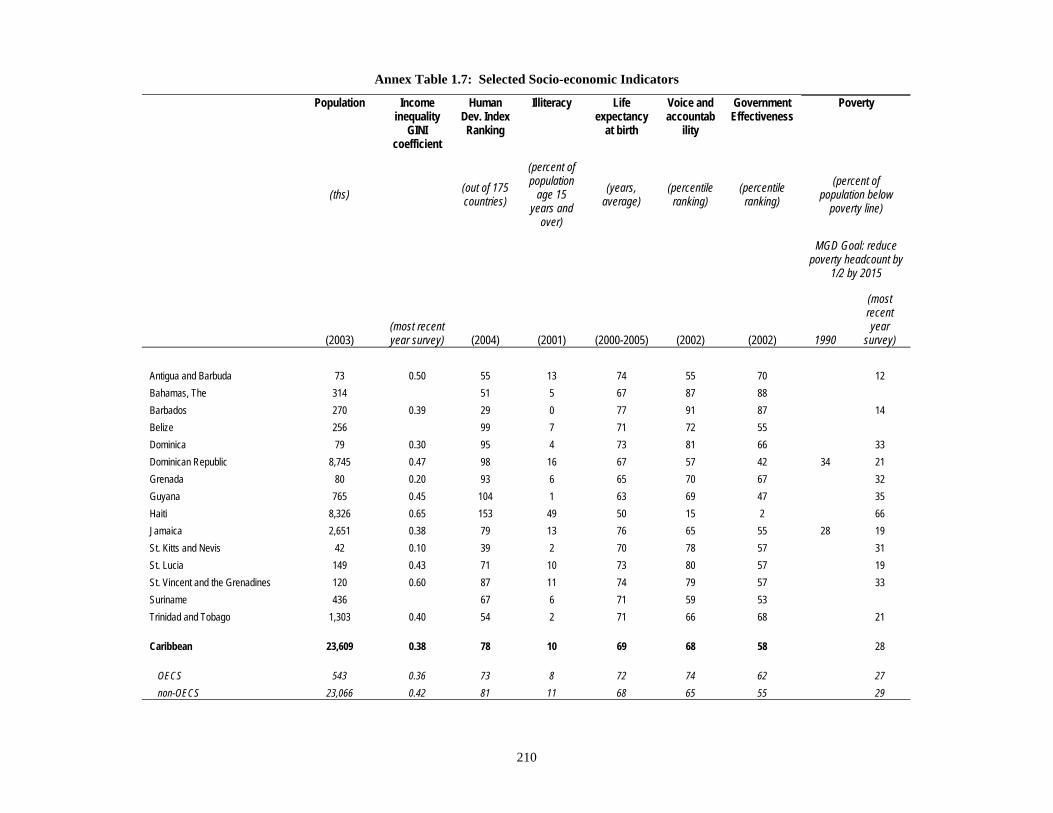
210
Annex Table 1.7: Selected Socio-economic Indicators
Population Income inequality
GINI coefficient
Human Dev. Index Ranking
Illiteracy Life expectancy
at birth
Voice and accountab
ility
Government Effectiveness
Poverty
(ths) (out of 175 countries)
(percent of population
age 15 years and
over)
(years, average)
(percentile ranking)
(percentile ranking)
(percent of population below
poverty line)
MGD Goal: reduce
poverty headcount by 1/2 by 2015
(2003) (most recent year survey) (2004) (2001) (2000-2005) (2002) (2002) 1990
(most recent year
survey) Antigua and Barbuda 73 0.50 55 13 74 55 70 12 Bahamas, The 314 51 5 67 87 88 Barbados 270 0.39 29 0 77 91 87 14 Belize 256 99 7 71 72 55 Dominica 79 0.30 95 4 73 81 66 33 Dominican Republic 8,745 0.47 98 16 67 57 42 34 21 Grenada 80 0.20 93 6 65 70 67 32 Guyana 765 0.45 104 1 63 69 47 35 Haiti 8,326 0.65 153 49 50 15 2 66 Jamaica 2,651 0.38 79 13 76 65 55 28 19 St. Kitts and Nevis 42 0.10 39 2 70 78 57 31 St. Lucia 149 0.43 71 10 73 80 57 19 St. Vincent and the Grenadines 120 0.60 87 11 74 79 57 33 Suriname 436 67 6 71 59 53 Trinidad and Tobago 1,303 0.40 54 2 71 66 68 21 Caribbean 23,609 0.38 78 10 69 68 58 28
OECS 543 0.36 73 8 72 74 62 27 non-OECS 23,066 0.42 81 11 68 65 55 29
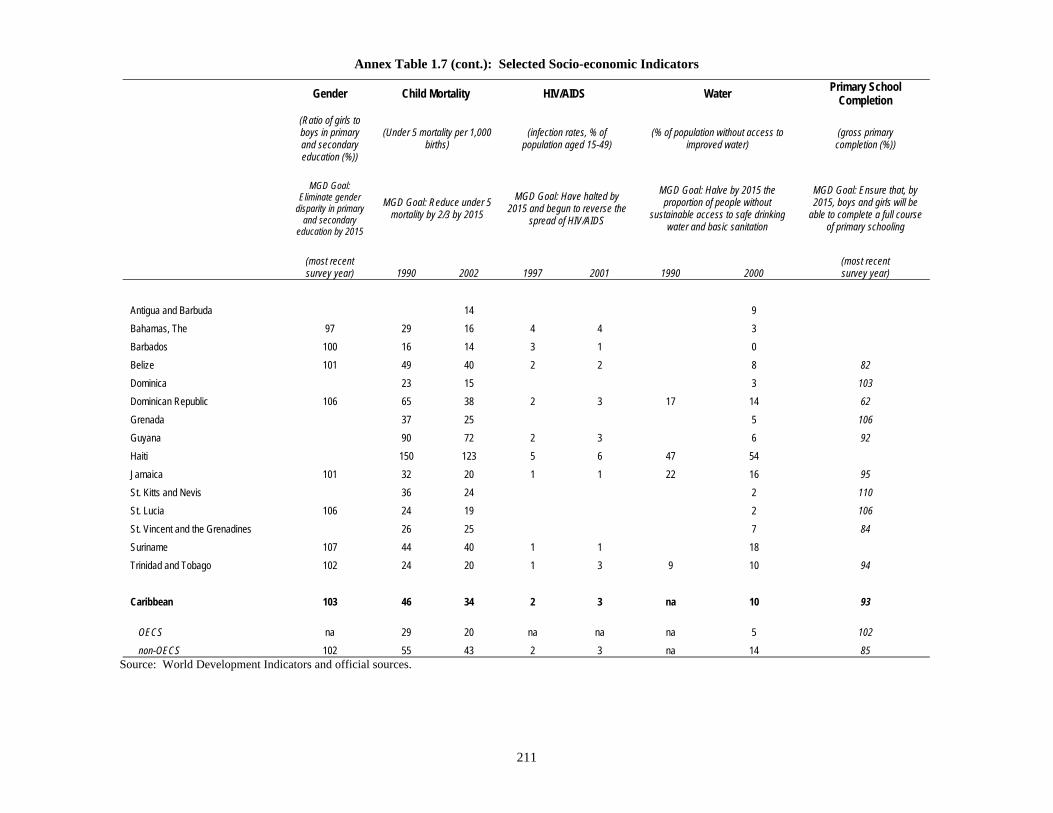
211
Annex Table 1.7 (cont.): Selected Socio-economic Indicators Gender Child Mortality HIV/AIDS Water Primary School
Completion
(Ratio of girls to boys in primary and secondary education (%))
(Under 5 mortality per 1,000 births)
(infection rates, % of population aged 15-49)
(% of population without access to improved water)
(gross primary completion (%))
MGD Goal: Eliminate gender
disparity in primary and secondary
education by 2015
MGD Goal: Reduce under 5 mortality by 2/3 by 2015
MGD Goal: Have halted by 2015 and begun to reverse the
spread of HIV/AIDS
MGD Goal: Halve by 2015 the proportion of people without
sustainable access to safe drinking water and basic sanitation
MGD Goal: Ensure that, by 2015, boys and girls will be
able to complete a full course of primary schooling
(most recent survey year) 1990 2002 1997 2001 1990 2000
(most recent survey year)
Antigua and Barbuda 14 9
Bahamas, The 97 29 16 4 4 3
Barbados 100 16 14 3 1 0
Belize 101 49 40 2 2 8 82
Dominica 23 15 3 103
Dominican Republic 106 65 38 2 3 17 14 62
Grenada 37 25 5 106
Guyana 90 72 2 3 6 92
Haiti 150 123 5 6 47 54
Jamaica 101 32 20 1 1 22 16 95
St. Kitts and Nevis 36 24 2 110
St. Lucia 106 24 19 2 106
St. Vincent and the Grenadines 26 25 7 84
Suriname 107 44 40 1 1 18
Trinidad and Tobago 102 24 20 1 3 9 10 94
Caribbean 103 46 34 2 3 na 10 93
OECS na 29 20 na na na 5 102
non-OECS 102 55 43 2 3 na 14 85 Source: World Development Indicators and official sources.
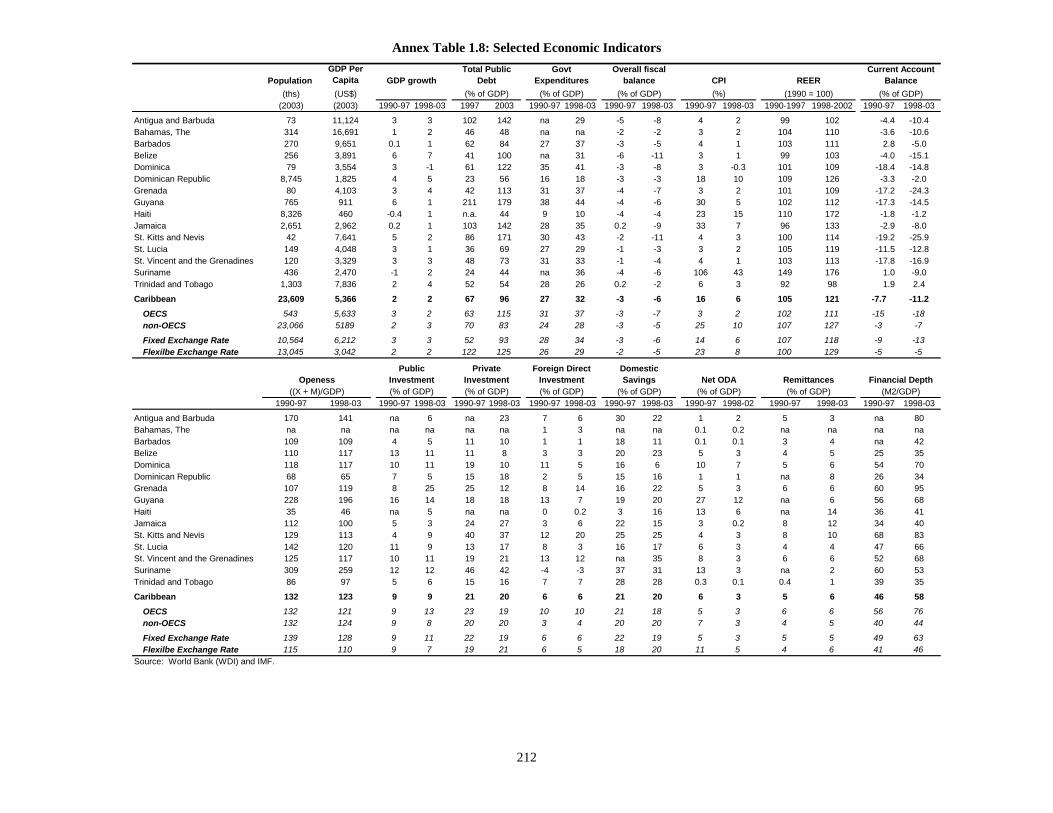
212
Annex Table 1.8: Selected Economic Indicators
Population GDP Per Capita
(ths) (US$)(2003) (2003) 1990-97 1998-03 1997 2003 1990-97 1998-03 1990-97 1998-03 1990-97 1998-03 1990-1997 1998-2002 1990-97 1998-03
Antigua and Barbuda 73 11,124 3 3 102 142 na 29 -5 -8 4 2 99 102 -4.4 -10.4Bahamas, The 314 16,691 1 2 46 48 na na -2 -2 3 2 104 110 -3.6 -10.6Barbados 270 9,651 0.1 1 62 84 27 37 -3 -5 4 1 103 111 2.8 -5.0Belize 256 3,891 6 7 41 100 na 31 -6 -11 3 1 99 103 -4.0 -15.1Dominica 79 3,554 3 -1 61 122 35 41 -3 -8 3 -0.3 101 109 -18.4 -14.8Dominican Republic 8,745 1,825 4 5 23 56 16 18 -3 -3 18 10 109 126 -3.3 -2.0Grenada 80 4,103 3 4 42 113 31 37 -4 -7 3 2 101 109 -17.2 -24.3Guyana 765 911 6 1 211 179 38 44 -4 -6 30 5 102 112 -17.3 -14.5Haiti 8,326 460 -0.4 1 n.a. 44 9 10 -4 -4 23 15 110 172 -1.8 -1.2Jamaica 2,651 2,962 0.2 1 103 142 28 35 0.2 -9 33 7 96 133 -2.9 -8.0St. Kitts and Nevis 42 7,641 5 2 86 171 30 43 -2 -11 4 3 100 114 -19.2 -25.9St. Lucia 149 4,048 3 1 36 69 27 29 -1 -3 3 2 105 119 -11.5 -12.8St. Vincent and the Grenadines 120 3,329 3 3 48 73 31 33 -1 -4 4 1 103 113 -17.8 -16.9Suriname 436 2,470 -1 2 24 44 na 36 -4 -6 106 43 149 176 1.0 -9.0Trinidad and Tobago 1,303 7,836 2 4 52 54 28 26 0.2 -2 6 3 92 98 1.9 2.4
Caribbean 23,609 5,366 2 2 67 96 27 32 -3 -6 16 6 105 121 -7.7 -11.2OECS 543 5,633 3 2 63 115 31 37 -3 -7 3 2 102 111 -15 -18non-OECS 23,066 5189 2 3 70 83 24 28 -3 -5 25 10 107 127 -3 -7
Fixed Exchange Rate 10,564 6,212 3 3 52 93 28 34 -3 -6 14 6 107 118 -9 -13Flexilbe Exchange Rate 13,045 3,042 2 2 122 125 26 29 -2 -5 23 8 100 129 -5 -5
1990-97 1998-03 1990-97 1998-03 1990-97 1998-03 1990-97 1998-03 1990-97 1998-03 1990-97 1998-02 1990-97 1998-03 1990-97 1998-03
Antigua and Barbuda 170 141 na 6 na 23 7 6 30 22 1 2 5 3 na 80Bahamas, The na na na na na na 1 3 na na 0.1 0.2 na na na naBarbados 109 109 4 5 11 10 1 1 18 11 0.1 0.1 3 4 na 42Belize 110 117 13 11 11 8 3 3 20 23 5 3 4 5 25 35Dominica 118 117 10 11 19 10 11 5 16 6 10 7 5 6 54 70Dominican Republic 68 65 7 5 15 18 2 5 15 16 1 1 na 8 26 34Grenada 107 119 8 25 25 12 8 14 16 22 5 3 6 6 60 95Guyana 228 196 16 14 18 18 13 7 19 20 27 12 na 6 56 68Haiti 35 46 na 5 na na 0 0.2 3 16 13 6 na 14 36 41Jamaica 112 100 5 3 24 27 3 6 22 15 3 0.2 8 12 34 40St. Kitts and Nevis 129 113 4 9 40 37 12 20 25 25 4 3 8 10 68 83St. Lucia 142 120 11 9 13 17 8 3 16 17 6 3 4 4 47 66St. Vincent and the Grenadines 125 117 10 11 19 21 13 12 na 35 8 3 6 6 52 68Suriname 309 259 12 12 46 42 -4 -3 37 31 13 3 na 2 60 53Trinidad and Tobago 86 97 5 6 15 16 7 7 28 28 0.3 0.1 0.4 1 39 35
Caribbean 132 123 9 9 21 20 6 6 21 20 6 3 5 6 46 58OECS 132 121 9 13 23 19 10 10 21 18 5 3 6 6 56 76non-OECS 132 124 9 8 20 20 3 4 20 20 7 3 4 5 40 44
Fixed Exchange Rate 139 128 9 11 22 19 6 6 22 19 5 3 5 5 49 63Flexilbe Exchange Rate 115 110 9 7 19 21 6 5 18 20 11 5 4 6 41 46
Source: World Bank (WDI) and IMF.
REER (1990 = 100)
Current Account Balance
(% of GDP)
Financial Depth (M2/GDP)
Domestic Savings Net ODA
(% of GDP) (% of GDP)Remittances (% of GDP)
Openess((X + M)/GDP)
Foreign Direct Investment (% of GDP)
Public Investment (% of GDP)
Private Investment(% of GDP)
Overall fiscal balance CPI
(% of GDP) (% of GDP) (%)
Govt Expenditures
(% of GDP)GDP growth
Total Public Debt
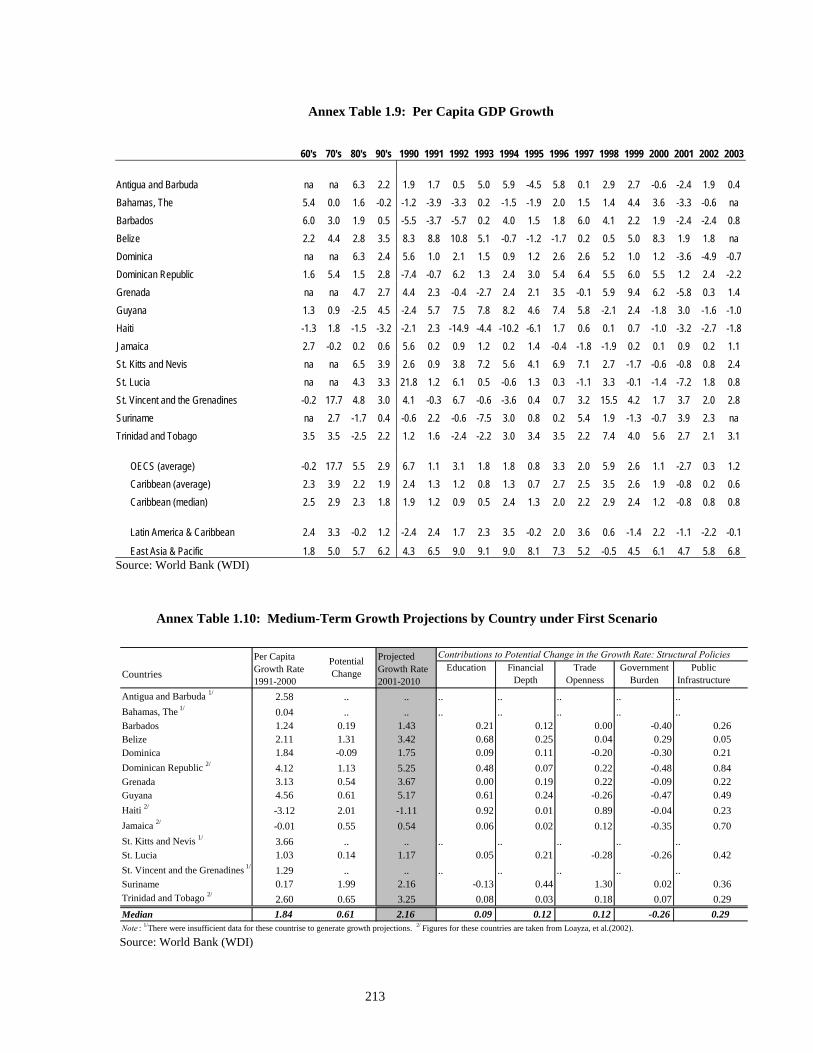
213
Annex Table 1.9: Per Capita GDP Growth
60's 70's 80's 90's 1990 1991 1992 1993 1994 1995 1996 1997 1998 1999 2000 2001 2002 2003 Antigua and Barbuda na na 6.3 2.2 1.9 1.7 0.5 5.0 5.9 -4.5 5.8 0.1 2.9 2.7 -0.6 -2.4 1.9 0.4 Bahamas, The 5.4 0.0 1.6 -0.2 -1.2 -3.9 -3.3 0.2 -1.5 -1.9 2.0 1.5 1.4 4.4 3.6 -3.3 -0.6 na Barbados 6.0 3.0 1.9 0.5 -5.5 -3.7 -5.7 0.2 4.0 1.5 1.8 6.0 4.1 2.2 1.9 -2.4 -2.4 0.8 Belize 2.2 4.4 2.8 3.5 8.3 8.8 10.8 5.1 -0.7 -1.2 -1.7 0.2 0.5 5.0 8.3 1.9 1.8 na Dominica na na 6.3 2.4 5.6 1.0 2.1 1.5 0.9 1.2 2.6 2.6 5.2 1.0 1.2 -3.6 -4.9 -0.7 Dominican Republic 1.6 5.4 1.5 2.8 -7.4 -0.7 6.2 1.3 2.4 3.0 5.4 6.4 5.5 6.0 5.5 1.2 2.4 -2.2 Grenada na na 4.7 2.7 4.4 2.3 -0.4 -2.7 2.4 2.1 3.5 -0.1 5.9 9.4 6.2 -5.8 0.3 1.4 Guyana 1.3 0.9 -2.5 4.5 -2.4 5.7 7.5 7.8 8.2 4.6 7.4 5.8 -2.1 2.4 -1.8 3.0 -1.6 -1.0 Haiti -1.3 1.8 -1.5 -3.2 -2.1 2.3 -14.9 -4.4 -10.2 -6.1 1.7 0.6 0.1 0.7 -1.0 -3.2 -2.7 -1.8 Jamaica 2.7 -0.2 0.2 0.6 5.6 0.2 0.9 1.2 0.2 1.4 -0.4 -1.8 -1.9 0.2 0.1 0.9 0.2 1.1 St. Kitts and Nevis na na 6.5 3.9 2.6 0.9 3.8 7.2 5.6 4.1 6.9 7.1 2.7 -1.7 -0.6 -0.8 0.8 2.4 St. Lucia na na 4.3 3.3 21.8 1.2 6.1 0.5 -0.6 1.3 0.3 -1.1 3.3 -0.1 -1.4 -7.2 1.8 0.8 St. Vincent and the Grenadines -0.2 17.7 4.8 3.0 4.1 -0.3 6.7 -0.6 -3.6 0.4 0.7 3.2 15.5 4.2 1.7 3.7 2.0 2.8 Suriname na 2.7 -1.7 0.4 -0.6 2.2 -0.6 -7.5 3.0 0.8 0.2 5.4 1.9 -1.3 -0.7 3.9 2.3 na Trinidad and Tobago 3.5 3.5 -2.5 2.2 1.2 1.6 -2.4 -2.2 3.0 3.4 3.5 2.2 7.4 4.0 5.6 2.7 2.1 3.1
OECS (average) -0.2 17.7 5.5 2.9 6.7 1.1 3.1 1.8 1.8 0.8 3.3 2.0 5.9 2.6 1.1 -2.7 0.3 1.2 Caribbean (average) 2.3 3.9 2.2 1.9 2.4 1.3 1.2 0.8 1.3 0.7 2.7 2.5 3.5 2.6 1.9 -0.8 0.2 0.6 Caribbean (median) 2.5 2.9 2.3 1.8 1.9 1.2 0.9 0.5 2.4 1.3 2.0 2.2 2.9 2.4 1.2 -0.8 0.8 0.8
Latin America & Caribbean 2.4 3.3 -0.2 1.2 -2.4 2.4 1.7 2.3 3.5 -0.2 2.0 3.6 0.6 -1.4 2.2 -1.1 -2.2 -0.1
East Asia & Pacific 1.8 5.0 5.7 6.2 4.3 6.5 9.0 9.1 9.0 8.1 7.3 5.2 -0.5 4.5 6.1 4.7 5.8 6.8 Source: World Bank (WDI)
Annex Table 1.10: Medium-Term Growth Projections by Country under First Scenario
Contributions to Potential Change in the Growth Rate: Structural Policies
Antigua and Barbuda 1/ 2.58 .. .. .. .. .. .. .. Bahamas, The 1/ 0.04 .. .. .. .. .. .. .. Barbados 1.24 0.19 1.43 0.21 0.12 0.00 -0.40 0.26Belize 2.11 1.31 3.42 0.68 0.25 0.04 0.29 0.05Dominica 1.84 -0.09 1.75 0.09 0.11 -0.20 -0.30 0.21Dominican Republic 2/ 4.12 1.13 5.25 0.48 0.07 0.22 -0.48 0.84Grenada 3.13 0.54 3.67 0.00 0.19 0.22 -0.09 0.22Guyana 4.56 0.61 5.17 0.61 0.24 -0.26 -0.47 0.49Haiti 2/ -3.12 2.01 -1.11 0.92 0.01 0.89 -0.04 0.23Jamaica 2/ -0.01 0.55 0.54 0.06 0.02 0.12 -0.35 0.70St. Kitts and Nevis 1/ 3.66 .. .. .. .. .. .. ..St. Lucia 1.03 0.14 1.17 0.05 0.21 -0.28 -0.26 0.42St. Vincent and the Grenadines 1/ 1.29 .. .. .. .. .. .. ..Suriname 0.17 1.99 2.16 -0.13 0.44 1.30 0.02 0.36Trinidad and Tobago 2/ 2.60 0.65 3.25 0.08 0.03 0.18 0.07 0.29Median 1.84 0.61 2.16 0.09 0.12 0.12 -0.26 0.29
Projected Growth Rate 2001-2010
EducationCountries
Note : 1/There were insufficient data for these countrise to generate growth projections. 2/ Figures for these countries are taken from Loayza, et al.(2002).
Financial Depth
Trade Openness
Government Burden
Public Infrastructure
Per Capita Growth Rate 1991-2000
Potential Change
Source: World Bank (WDI)
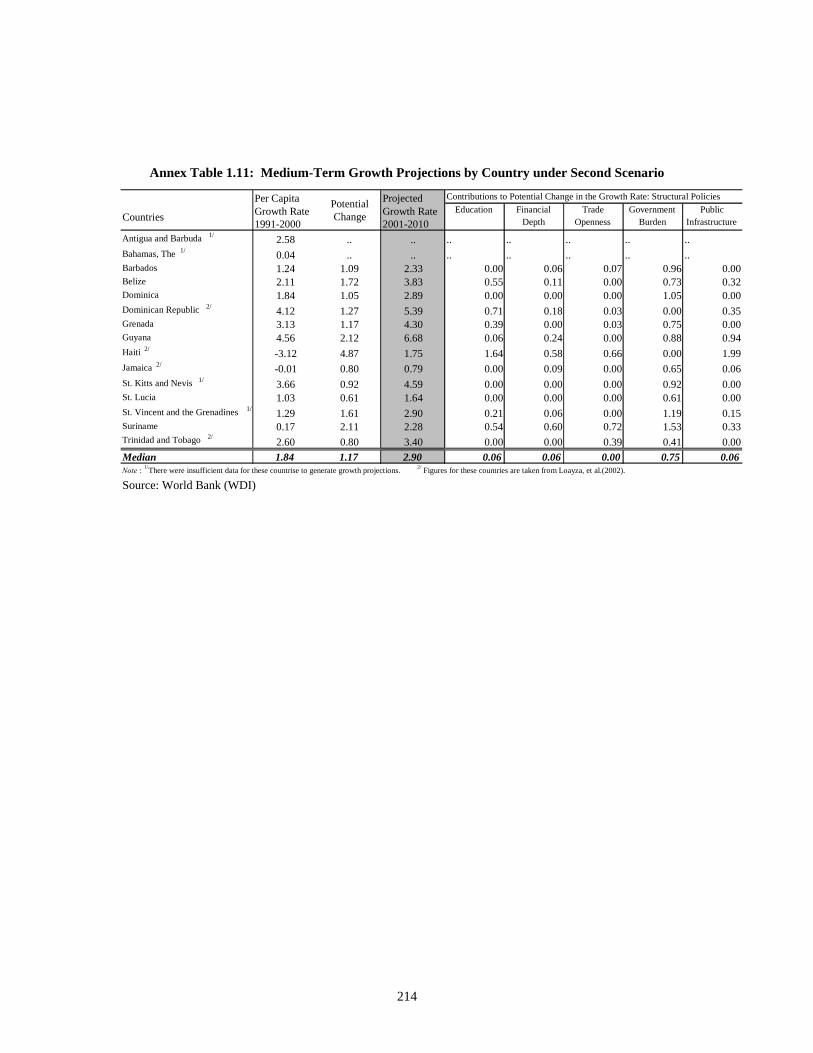
214
Annex Table 1.11: Medium-Term Growth Projections by Country under Second Scenario
Contributions to Potential Change in the Growth Rate: Structural Policies
Antigua and Barbuda 1/ 2.58 .. .. .. .. .. .. ..Bahamas, The 1/ 0.04 .. .. .. .. .. .. ..Barbados 1.24 1.09 2.33 0.00 0.06 0.07 0.96 0.00Belize 2.11 1.72 3.83 0.55 0.11 0.00 0.73 0.32Dominica 1.84 1.05 2.89 0.00 0.00 0.00 1.05 0.00Dominican Republic 2/ 4.12 1.27 5.39 0.71 0.18 0.03 0.00 0.35Grenada 3.13 1.17 4.30 0.39 0.00 0.03 0.75 0.00Guyana 4.56 2.12 6.68 0.06 0.24 0.00 0.88 0.94Haiti 2/ -3.12 4.87 1.75 1.64 0.58 0.66 0.00 1.99Jamaica 2/ -0.01 0.80 0.79 0.00 0.09 0.00 0.65 0.06St. Kitts and Nevis 1/ 3.66 0.92 4.59 0.00 0.00 0.00 0.92 0.00St. Lucia 1.03 0.61 1.64 0.00 0.00 0.00 0.61 0.00St. Vincent and the Grenadines 1/ 1.29 1.61 2.90 0.21 0.06 0.00 1.19 0.15Suriname 0.17 2.11 2.28 0.54 0.60 0.72 1.53 0.33Trinidad and Tobago 2/ 2.60 0.80 3.40 0.00 0.00 0.39 0.41 0.00Median 1.84 1.17 2.90 0.06 0.06 0.00 0.75 0.06Note : 1/ There were insufficient data for these countrise to generate growth projections. 2/ Figures for these countries are taken from Loayza, et al.(2002).
Public Infrastructure
Education Financial Depth
Trade Openness
Government BurdenCountries
Per Capita Growth Rate 1991-2000
Potential Change
Projected Growth Rate 2001-2010
Source: World Bank (WDI)
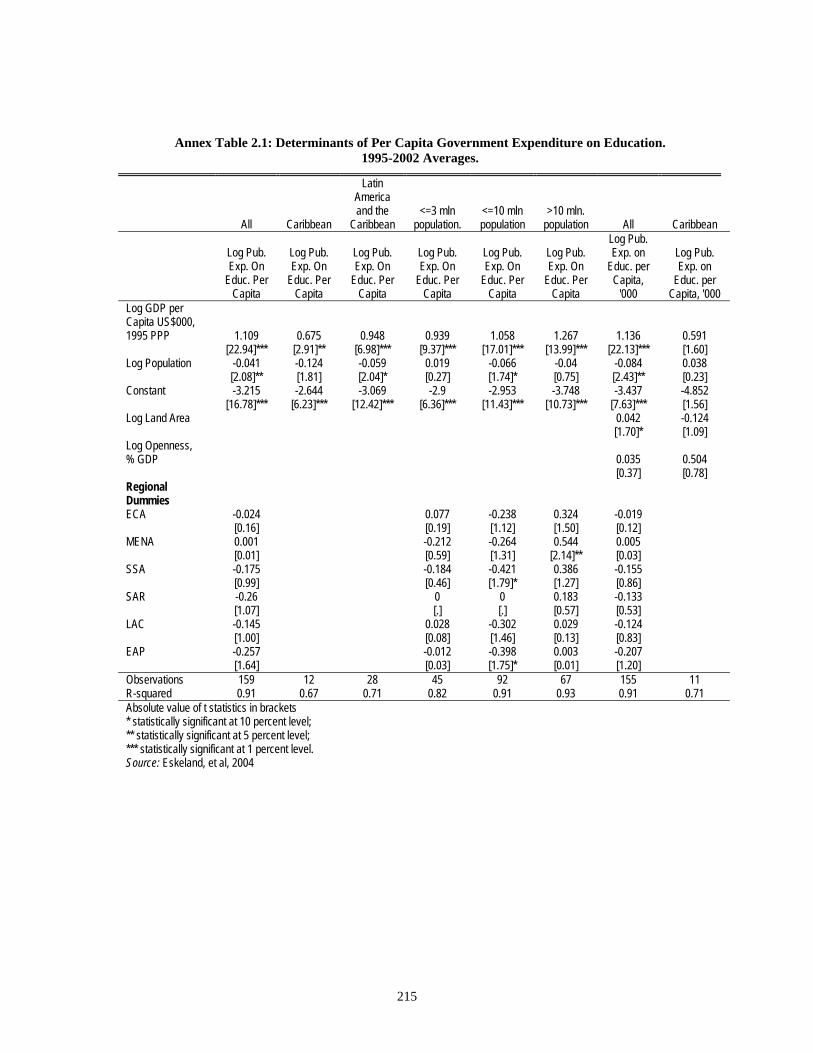
215
Annex Table 2.1: Determinants of Per Capita Government Expenditure on Education. 1995-2002 Averages.
All Caribbean
Latin America and the
Caribbean <=3 mln
population. <=10 mln population
>10 mln. population All Caribbean
Log Pub. Exp. On
Educ. Per Capita
Log Pub. Exp. On
Educ. Per Capita
Log Pub. Exp. On
Educ. Per Capita
Log Pub. Exp. On
Educ. Per Capita
Log Pub. Exp. On
Educ. Per Capita
Log Pub. Exp. On
Educ. Per Capita
Log Pub. Exp. on
Educ. per Capita,
'000
Log Pub. Exp. on
Educ. per Capita, '000
Log GDP per Capita US$000, 1995 PPP 1.109 0.675 0.948 0.939 1.058 1.267 1.136 0.591 [22.94]*** [2.91]** [6.98]*** [9.37]*** [17.01]*** [13.99]*** [22.13]*** [1.60] Log Population -0.041 -0.124 -0.059 0.019 -0.066 -0.04 -0.084 0.038 [2.08]** [1.81] [2.04]* [0.27] [1.74]* [0.75] [2.43]** [0.23] Constant -3.215 -2.644 -3.069 -2.9 -2.953 -3.748 -3.437 -4.852 [16.78]*** [6.23]*** [12.42]*** [6.36]*** [11.43]*** [10.73]*** [7.63]*** [1.56] Log Land Area 0.042 -0.124 [1.70]* [1.09] Log Openness, % GDP 0.035 0.504 [0.37] [0.78] Regional Dummies ECA -0.024 0.077 -0.238 0.324 -0.019 [0.16] [0.19] [1.12] [1.50] [0.12] MENA 0.001 -0.212 -0.264 0.544 0.005 [0.01] [0.59] [1.31] [2.14]** [0.03] SSA -0.175 -0.184 -0.421 0.386 -0.155 [0.99] [0.46] [1.79]* [1.27] [0.86] SAR -0.26 0 0 0.183 -0.133 [1.07] [.] [.] [0.57] [0.53] LAC -0.145 0.028 -0.302 0.029 -0.124 [1.00] [0.08] [1.46] [0.13] [0.83] EAP -0.257 -0.012 -0.398 0.003 -0.207 [1.64] [0.03] [1.75]* [0.01] [1.20] Observations 159 12 28 45 92 67 155 11 R-squared 0.91 0.67 0.71 0.82 0.91 0.93 0.91 0.71 Absolute value of t statistics in brackets * statistically significant at 10 percent level; ** statistically significant at 5 percent level; *** statistically significant at 1 percent level. Source: Eskeland, et al, 2004
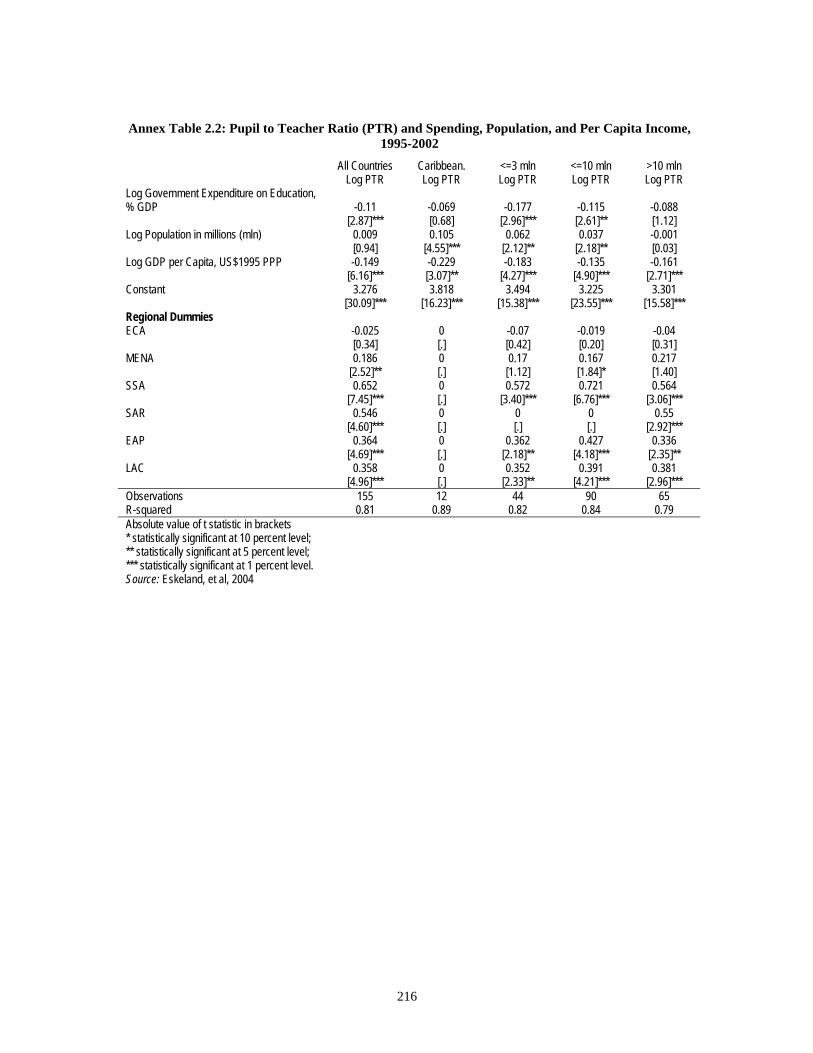
216
Annex Table 2.2: Pupil to Teacher Ratio (PTR) and Spending, Population, and Per Capita Income,
1995-2002
All Countries Caribbean. <=3 mln <=10 mln >10 mln Log PTR Log PTR Log PTR Log PTR Log PTR Log Government Expenditure on Education, % GDP -0.11 -0.069 -0.177 -0.115 -0.088 [2.87]*** [0.68] [2.96]*** [2.61]** [1.12] Log Population in millions (mln) 0.009 0.105 0.062 0.037 -0.001 [0.94] [4.55]*** [2.12]** [2.18]** [0.03] Log GDP per Capita, US$1995 PPP -0.149 -0.229 -0.183 -0.135 -0.161 [6.16]*** [3.07]** [4.27]*** [4.90]*** [2.71]*** Constant 3.276 3.818 3.494 3.225 3.301 [30.09]*** [16.23]*** [15.38]*** [23.55]*** [15.58]*** Regional Dummies ECA -0.025 0 -0.07 -0.019 -0.04 [0.34] [.] [0.42] [0.20] [0.31] MENA 0.186 0 0.17 0.167 0.217 [2.52]** [.] [1.12] [1.84]* [1.40] SSA 0.652 0 0.572 0.721 0.564 [7.45]*** [.] [3.40]*** [6.76]*** [3.06]*** SAR 0.546 0 0 0 0.55 [4.60]*** [.] [.] [.] [2.92]*** EAP 0.364 0 0.362 0.427 0.336 [4.69]*** [.] [2.18]** [4.18]*** [2.35]** LAC 0.358 0 0.352 0.391 0.381 [4.96]*** [.] [2.33]** [4.21]*** [2.96]*** Observations 155 12 44 90 65 R-squared 0.81 0.89 0.82 0.84 0.79 Absolute value of t statistic in brackets * statistically significant at 10 percent level; ** statistically significant at 5 percent level; *** statistically significant at 1 percent level. Source: Eskeland, et al, 2004
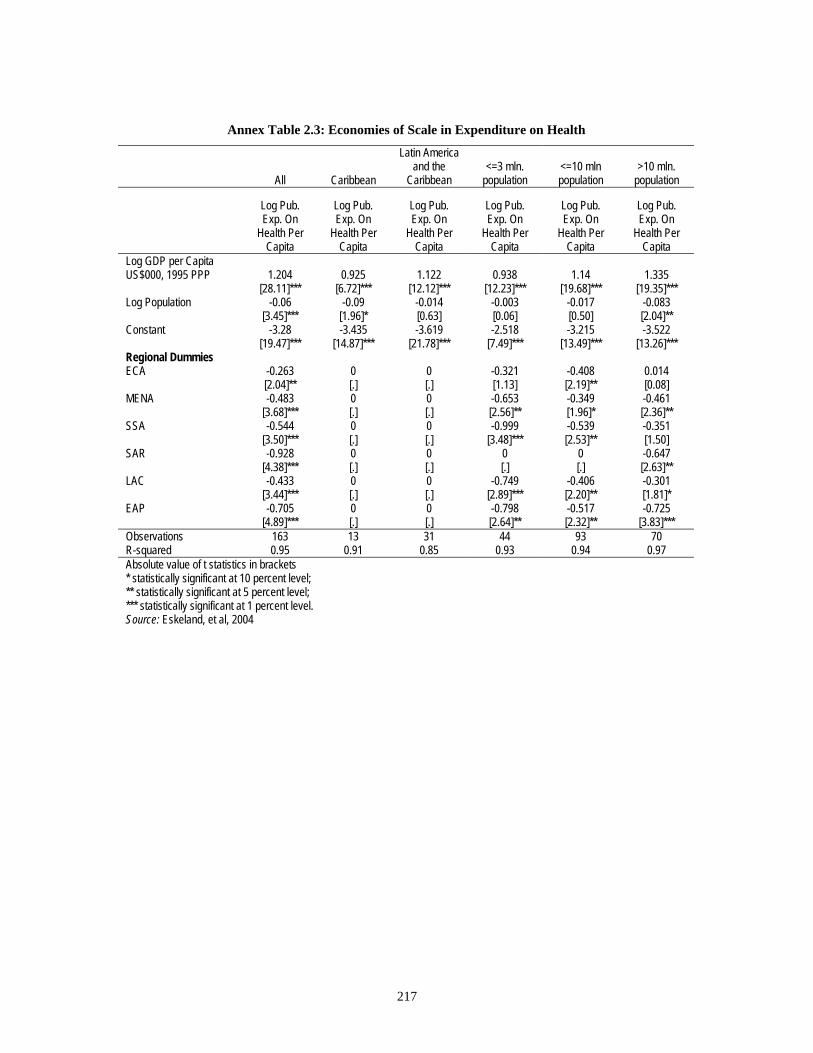
217
Annex Table 2.3: Economies of Scale in Expenditure on Health
All Caribbean
Latin America and the
Caribbean <=3 mln.
population <=10 mln population
>10 mln. population
Log Pub. Exp. On
Health Per Capita
Log Pub. Exp. On
Health Per Capita
Log Pub. Exp. On
Health Per Capita
Log Pub. Exp. On
Health Per Capita
Log Pub. Exp. On
Health Per Capita
Log Pub. Exp. On
Health Per Capita
Log GDP per Capita US$000, 1995 PPP 1.204 0.925 1.122 0.938 1.14 1.335 [28.11]*** [6.72]*** [12.12]*** [12.23]*** [19.68]*** [19.35]*** Log Population -0.06 -0.09 -0.014 -0.003 -0.017 -0.083 [3.45]*** [1.96]* [0.63] [0.06] [0.50] [2.04]** Constant -3.28 -3.435 -3.619 -2.518 -3.215 -3.522 [19.47]*** [14.87]*** [21.78]*** [7.49]*** [13.49]*** [13.26]*** Regional Dummies ECA -0.263 0 0 -0.321 -0.408 0.014 [2.04]** [.] [.] [1.13] [2.19]** [0.08] MENA -0.483 0 0 -0.653 -0.349 -0.461 [3.68]*** [.] [.] [2.56]** [1.96]* [2.36]** SSA -0.544 0 0 -0.999 -0.539 -0.351 [3.50]*** [.] [.] [3.48]*** [2.53]** [1.50] SAR -0.928 0 0 0 0 -0.647 [4.38]*** [.] [.] [.] [.] [2.63]** LAC -0.433 0 0 -0.749 -0.406 -0.301 [3.44]*** [.] [.] [2.89]*** [2.20]** [1.81]* EAP -0.705 0 0 -0.798 -0.517 -0.725 [4.89]*** [.] [.] [2.64]** [2.32]** [3.83]*** Observations 163 13 31 44 93 70 R-squared 0.95 0.91 0.85 0.93 0.94 0.97 Absolute value of t statistics in brackets * statistically significant at 10 percent level; ** statistically significant at 5 percent level; *** statistically significant at 1 percent level. Source: Eskeland, et al, 2004
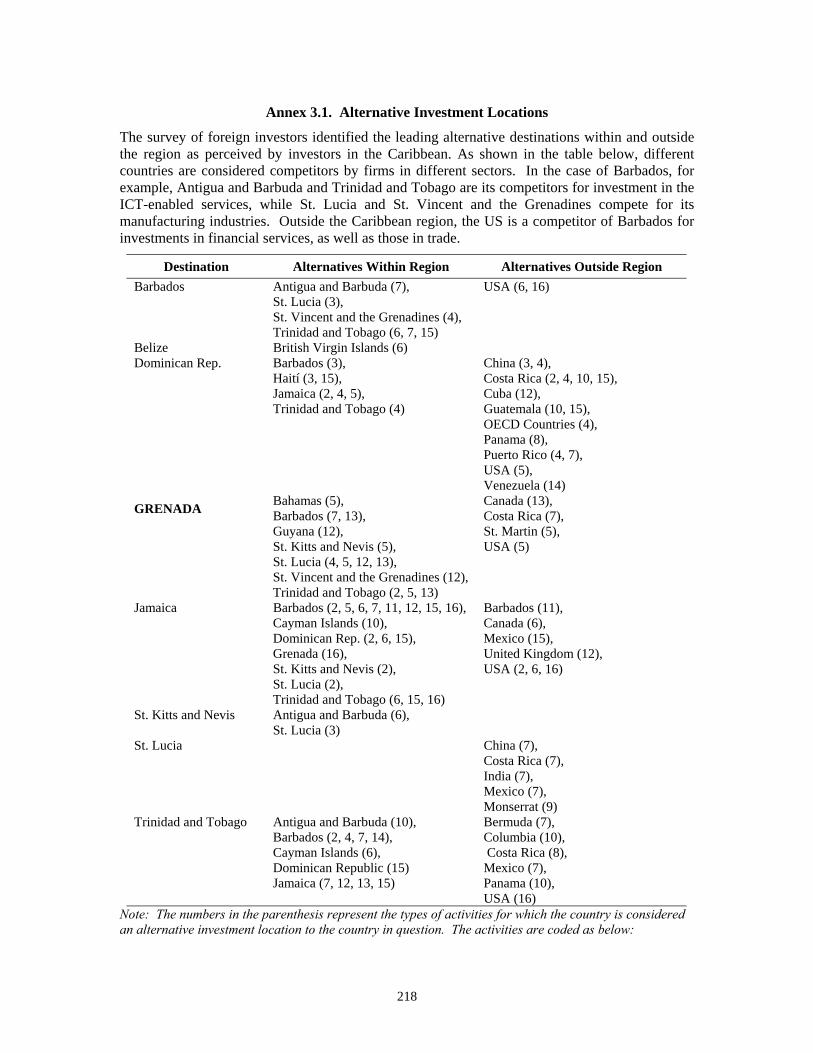
218
Annex 3.1. Alternative Investment Locations
The survey of foreign investors identified the leading alternative destinations within and outside the region as perceived by investors in the Caribbean. As shown in the table below, different countries are considered competitors by firms in different sectors. In the case of Barbados, for example, Antigua and Barbuda and Trinidad and Tobago are its competitors for investment in the ICT-enabled services, while St. Lucia and St. Vincent and the Grenadines compete for its manufacturing industries. Outside the Caribbean region, the US is a competitor of Barbados for investments in financial services, as well as those in trade.
Destination Alternatives Within Region Alternatives Outside Region Barbados Antigua and Barbuda (7),
St. Lucia (3), St. Vincent and the Grenadines (4), Trinidad and Tobago (6, 7, 15)
USA (6, 16)
Belize British Virgin Islands (6) Dominican Rep. Barbados (3),
Haití (3, 15), Jamaica (2, 4, 5), Trinidad and Tobago (4)
China (3, 4), Costa Rica (2, 4, 10, 15), Cuba (12), Guatemala (10, 15), OECD Countries (4), Panama (8), Puerto Rico (4, 7), USA (5), Venezuela (14)
GRENADA Bahamas (5), Barbados (7, 13), Guyana (12), St. Kitts and Nevis (5), St. Lucia (4, 5, 12, 13), St. Vincent and the Grenadines (12), Trinidad and Tobago (2, 5, 13)
Canada (13), Costa Rica (7), St. Martin (5), USA (5)
Jamaica Barbados (2, 5, 6, 7, 11, 12, 15, 16), Cayman Islands (10), Dominican Rep. (2, 6, 15), Grenada (16), St. Kitts and Nevis (2), St. Lucia (2), Trinidad and Tobago (6, 15, 16)
Barbados (11), Canada (6), Mexico (15), United Kingdom (12), USA (2, 6, 16)
St. Kitts and Nevis Antigua and Barbuda (6), St. Lucia (3)
St. Lucia China (7), Costa Rica (7), India (7), Mexico (7), Monserrat (9)
Trinidad and Tobago Antigua and Barbuda (10), Barbados (2, 4, 7, 14), Cayman Islands (6), Dominican Republic (15) Jamaica (7, 12, 13, 15)
Bermuda (7), Columbia (10), Costa Rica (8), Mexico (7), Panama (10), USA (16)
Note: The numbers in the parenthesis represent the types of activities for which the country is considered an alternative investment location to the country in question. The activities are coded as below:

219
1 = Agriculture 9 = Education 2 = Food processing 10 = Medical services 3 = Textile and garment 11 = Labor services 4 = Electric and electronics 12 = Other professional services 5 = Tourism 13 = Construction 6 = Financial services 14 = Energy 7 = ICT-enabled services 15 = Other manufacturing/industry 8 = Transport 16 = Retail/wholesale trade
220
Annex 3.2. Jamaica’s Business Environment187
Analyses focused on Jamaica indicate some specific competitiveness issues. A survey of several sectors conducted in 2001 shows mixed results in terms of their meeting international best practices of efficiency and productivity—in tourism, hotels met international best practices (not surprising given their links to international firms), but in agro-processing companies, there is substantial deviation from international best practices.
Exchange rate. Companies surveyed generally favored an exchange rate that was stable and competitive. In terms of competitiveness of the exchange rate, several companies in the hotel and agro-processing sectors indicated that in the mid-1990s high local cost increases and a constant nominal exchange rate had reduced their profitability, as they were not able to pass on cost increases to final customers (recall the significant real appreciation between 1994 and 1998). Also, the depreciation of the euro vis-à-vis the dollar in the late 1990s hurt the competitiveness of Jamaica’s products and services in the European market.
Quality and costs of workers. The main problem here appears to be the wage costs. The survey indicates that there is generally no problem in attracting workers, except for those with specialized skills. Companies are generally satisfied with the commitment and work attitudes of their workers, and with the workers trained at HEART academies, especially in the IT and hotel sectors. In manufacturing, companies prefer workers with previous experience in manufacturing, which may pose a problem if manufacturing contracts further.
Wage costs have increased substantially, exceeding productivity increases every year between 1992 and 1998, except 1994. Between 1994-98, wages rose an average of 19 percent in US dollar terms every year. Over these years, unit labor costs rose faster than the GDP deflator, implying a decline in the profitability of domestic production. Although wage increases have been marginally lower than GDP inflation recently, the level of the wage-based REER (and the CPI- based REER) remains substantially higher than in the mid 1990s. The behavior of wages also demonstrates the lack of flexibility in the labor market.
Labor relations from the companies’ viewpoint are generally better with non-unionized workers, since it facilitates the introduction of more flexible conditions. Changes in ownership in some firms (for example, in the agro-processing industry) in the past few years have been used to forge new relations with employees. In addition, some firms have decided to bear the high cost of redundancy in an effort to negotiate new relations with a new set of employees or even old employees willing to agree to the new terms. Productivity-based compensation is being introduced in some firms. Some firms complained about regulations regarding worker layoffs, but these are not generally shared.
Finance. The larger companies financed a considerable part of their investments from their own cash flows, which in some cases had been augmented by disposal of assets. Moreover, larger companies have easy access to subsidized credit lines (Development Bank of Jamaica, ExIm Bank) and offshore finance. However, smaller companies, as well as potential entrants into exports, have difficulties in accessing credit. Banks consider them too risky for channeling subsidized DBJ funds, and charge higher interest rates and subject them to stricter capital requirements. These considerations would have become even more important after the financial crisis of 1995. For small and medium companies, the costs of capital could be reduced if banks could make better judgments about their credit risk including that of new borrowers. Establishment of credit registries can help in this process.
Access to inputs. Companies in the agro-processing sector often had difficulties accessing raw materials in the right quantities and in a timely fashion. Packaging is a particularly thorny issue.
187 Extracted from: The Road to Sustained Growth in Jamaica, World Bank (2004b).
221
With the closure of the local glass factory, most bottles (a major cost factor in beverage industries, particularly rum) have to be imported. In other beverage industries, bottles have been replaced by plastics materials, particularly PET bottles. These are produced locally, often by the users, though the environmental effects of plastic bottles still need to be addressed. For industries producing sauces, bottles are still used and have to be imported. Also, most other packaging material is being imported. Delays due to slow customs procedures increase the cost of imported materials and require that larger inventories be kept. The hotel industry is increasingly using local foods and other inputs, though local quality and timely delivery can pose problems. Thus, as in many countries, the customs procedures need to be streamlined so imports can flow easily into exportables.
The costs of utilities, including energy, water and telecommunications, are considered high and their reliability low. In the survey, it was seen that several companies are investing in energy and water-saving technologies and at the same time in stand-by electricity production to ensure access in case of interruption in public supply. High utility costs are one of the many factors that have contributed to the decision of some companies to relocate production capacity abroad, even if this is a marketing disadvantage as in the case of rum (rum bottled in Jamaica has a better image in markets).
A study of Jamaica’s infrastructure finds that there have been marked improvements in telecommunications and ports, but there are significant weaknesses in other areas of infrastructure, especially water and roads. Also, unreliability of power supply and high electricity costs constrain business operation. In telecommunications, privatization and liberalization since 2000 have served to encourage significant private sector investment, resulting in improvements in coverage and access. The penetration of mobile phones is very high, at almost 50 per 100 people, while that for fixed line services, at 18 per 100 people, exceeds what may be expected based on GDP (PPP). In addition, tariff rates have fallen, and the reliability of service has improved, but lags most developed countries.
The continuous implementation of a strategic development plan for Jamaica’s sea ports has helped to keep the ports functioning relatively efficiently, and the Ports Authority of Jamaica is widely regarded as one of the better performing publicly-owned infrastructure providers. The two major airports have fared less well, as their facilities are below international standards despite the importance of tourism to Jamaica. Recent private participation in the operation of the Sangster’s International Airport (the airport with the largest tourist throughput) is expected to raise and maintain the service level to an internationally acceptable standard.
The water and sewerage infrastructure in Jamaica is inadequate, inefficiently operated (unaccounted for water is 65 percent, high by international standards) and unevenly distributed. Significant investments in several sectors including tourism, manufacturing and real estate may have been jeopardized due to the National Water Commission’s inability to provide water for the proposed developments. Current tariff levels, though high, are inadequate to cover operating costs, much less to provide for the significant investment required to expand and improve the service.
Although Jamaica has an extensive network of roads, most roads, particularly rural roads, are inadequately maintained and in poor condition. The resultant high cost of transport of goods and persons adversely affects the competitiveness of several sectors, particularly agriculture, tourism and manufacturing. In an attempt to improve road infrastructure, the government has invited private participation through Build-Own-Operate (BOO) concessions to operate toll roads on some of the major thoroughfares.
Crime. The need to strengthen security as a result of increasing crime is a major issue for most companies. In the agro-processing industry, increasing costs are being incurred to ensure that export shipments are not contaminated with drugs. For export shipments, security costs are sometimes estimated as high as 5 percent of sales, and for the economy as a whole, static costs of
222
crime are at least 4 percent of GDP annually. High and increasing crime and extortion have necessitated the use of security companies in and around plants. Crime also limits the possibility and raises the costs of multiple shift operations, by increasing the costs of transporting night-shift workers and requiring higher night pay differentials. It may even limit operations to a single shift. These cost-of-crime issues are particularly important for industries such as call centers, information technology, and textile producers, where multiple shifts are the norm internationally. Crime can also raise the costs of distribution by making access to crime-prone areas more difficult. For the tourism industry, crime adversely affects the number of visitors and requires more expenditure on marketing and promotion, and on provision of security.
Overview. In sum, the firm survey suggests that not only has the real exchange rate led to a loss of competitiveness, but that competitiveness has been reduced by rising labor costs (in excess of productivity improvements), finance costs (for smaller firms), access to inputs, and crime. It is no surprise that Jamaica’s export performance has suffered in the 1990s, and it has come to rely more and more on its natural resource based advantages, primarily tourism and bauxite-alumina.
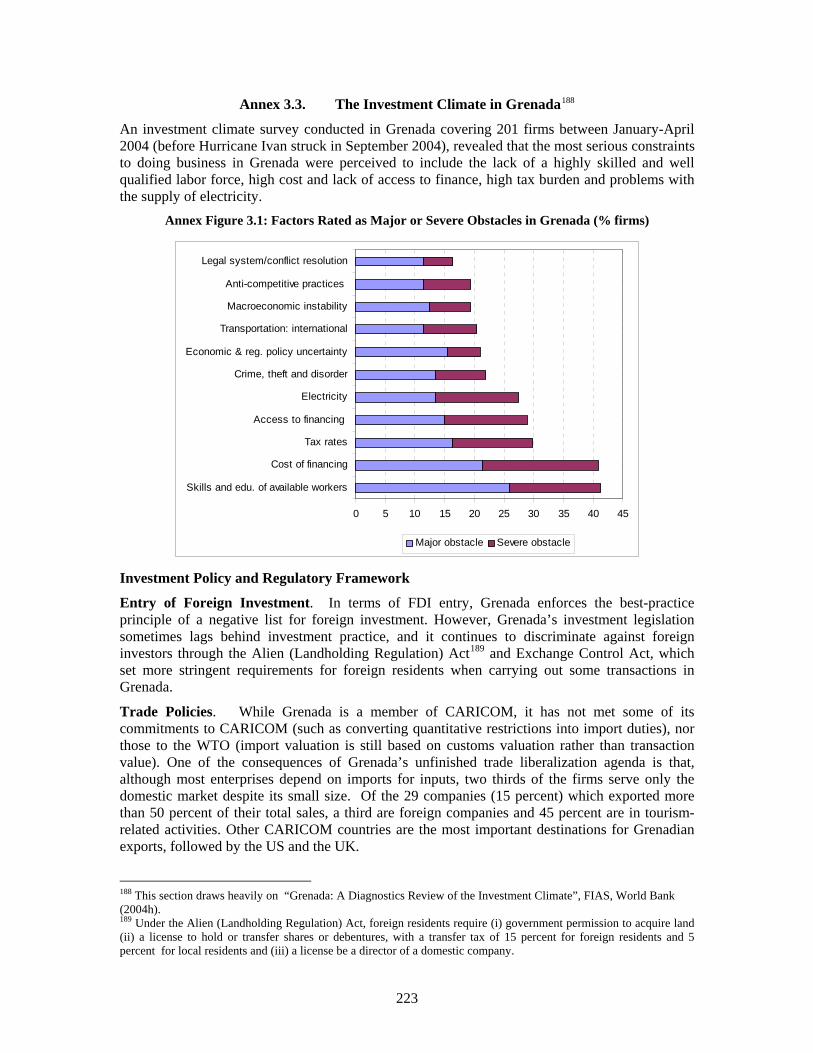
223
Annex 3.3. The Investment Climate in Grenada188
An investment climate survey conducted in Grenada covering 201 firms between January-April 2004 (before Hurricane Ivan struck in September 2004), revealed that the most serious constraints to doing business in Grenada were perceived to include the lack of a highly skilled and well qualified labor force, high cost and lack of access to finance, high tax burden and problems with the supply of electricity.
Annex Figure 3.1: Factors Rated as Major or Severe Obstacles in Grenada (% firms)
0 5 10 15 20 25 30 35 40 45
Skills and edu. of available workers
Cost of financing
Tax rates
Access to financing
Electricity
Crime, theft and disorder
Economic & reg. policy uncertainty
Transportation: international
Macroeconomic instability
Anti-competitive practices
Legal system/conflict resolution
Major obstacle Severe obstacle
Investment Policy and Regulatory Framework
Entry of Foreign Investment. In terms of FDI entry, Grenada enforces the best-practice principle of a negative list for foreign investment. However, Grenada’s investment legislation sometimes lags behind investment practice, and it continues to discriminate against foreign investors through the Alien (Landholding Regulation) Act189 and Exchange Control Act, which set more stringent requirements for foreign residents when carrying out some transactions in Grenada.
Trade Policies. While Grenada is a member of CARICOM, it has not met some of its commitments to CARICOM (such as converting quantitative restrictions into import duties), nor those to the WTO (import valuation is still based on customs valuation rather than transaction value). One of the consequences of Grenada’s unfinished trade liberalization agenda is that, although most enterprises depend on imports for inputs, two thirds of the firms serve only the domestic market despite its small size. Of the 29 companies (15 percent) which exported more than 50 percent of their total sales, a third are foreign companies and 45 percent are in tourism-related activities. Other CARICOM countries are the most important destinations for Grenadian exports, followed by the US and the UK.
188 This section draws heavily on “Grenada: A Diagnostics Review of the Investment Climate”, FIAS, World Bank (2004h). 189 Under the Alien (Landholding Regulation) Act, foreign residents require (i) government permission to acquire land (ii) a license to hold or transfer shares or debentures, with a transfer tax of 15 percent for foreign residents and 5 percent for local residents and (iii) a license be a director of a domestic company.
224
Investment Incentives. Tax rates are considered high and a key constraint to business growth. Furthermore, Grenada administers a complex and opaque investment incentives regime. The Government has recognized these problems and established a Fiscal Incentive Review Committee to look into the various issues.190
Regulations. Regulations with respect to the establishment of businesses, such as business registration and obtaining licenses and permits, are not considered a big problem in Grenada by the large majority of the enterprises. Of the 31 companies having registered a business in the last three years, for example, 12 accomplished this within a week, another 8 within a month, while 3 of the firms spent a year to complete all the related steps.
The most serious administrative constraint is the customs regulations. Although the customs delay is not significantly out of line by regional standards, businesses expect faster port clearance in Grenada because of smaller total transaction volumes. On average, it takes about 1.5 to 2 days for exports to clear the customs. Clearance of imports is more time-consuming, with a median duration of 4 days, and has resulted in incidents of bribery of customs officials, although such incidents continue to be generally rare in Grenada.
Physical and Financial Infrastructure
Infrastructure. One of the key elements influencing Grenada’s prospect for attracting investment is the high cost of utilities. Electricity costs, in particular, are much higher than comparable costs in large mainland territories, such as the United States, and in energy-producing countries such as Trinidad and Tobago (this is partly due to poor regulation of power in the OECS). Electricity outages are frequent and affect more than half of the firms. Access to water and telecommunications is perceived to be less of a problem, but water stoppages do occur and appear to be more costly than power outages because they tend to last longer.
Port delays and infrequent/unreliable ship services to other islands and beyond are the key problems related to international transportation. More than a quarter of the companies have to wait for a week or more before their shipments are released from the ports. The low trade volume and lack of economy of scale are also partially responsible for the high costs of freight, insurance costs and handling charges that many companies find burdensome. As an example, a 20-ft container costs more than US$2,000 in Grenada, compared to US$900 in Trinidad and Tobago. As a result, inventory is substantial in Grenada. Two thirds of the firms keep stocks for more than one month and 10 percent of them have inventory periods that last as long as half a year.
Finance. More firms rated the cost of financing as a severe obstacle to their businesses than any other factors considered. There is a general perception that that the local banking sector is underdeveloped and that commercial banks, in particular, do not provide the venture and project support required of many companies. Own funds and retained earnings are by far the most important sources of financing (among the 131 firms that provided information on how their working capital needs are met, 85 percent reported using own funds and retained earnings, of which 40 percent relied on this source exclusively). Yet, firms are satisfied about working with local commercial banks, which provide the working capital to 57 percent of the domestic firms and 36 percent of the foreign companies.
190 Survey results in Grenada show that tax holidays are in particular accessed by manufacturing companies, of which more than a quarter are making use of incentives, and hotels and restaurants, of which more than 50 percent have accessed tax holidays. On the other hand, only one of the 26 tourism-related (other than hotels and restaurants) firms in the sample have access to tax holidays. In addition, foreign firms benefit more from tax holidays than domestic firms, and the proportion of firms enjoying them increases steadily with firm size category.
225
Labor and Innovation
Labor. Despite the public-sector-led nature of Grenada’s growth in recent years, employment in the private sector expanded by 8.6 percent between 2001-03, especially in information and communication, financial services and tourism related activities. Employment growth is also more significant in small and medium sized companies, and in domestic establishments than foreign firms. Temporary employment is also on the rise (making up 8 percent of the total workforce in the private sector).
Reflecting Grenada’s educational system, the workforce is reasonably well educated with 61 percent of the workers having secondary or higher education. Nevertheless, issues related to inadequate skills and education levels of the workforce are ranked as the largest constraint to business growth. The key skills missing are technical skills such as industrial engineering, and to a lesser degree, managerial capacities. To remedy the skills shortage problem, half of the companies indicate that they offer formal training to employees. Public training institutions are not meeting the demands of the enterprises as the large majority of the training is provided internally by the companies, or by private training facilities.
Wages and compensation, as expected, rise with skills, and are generally higher in the manufacturing firms and foreign companies. There is also a considerable difference between wages and compensation, reflecting supplementary benefits for the workers paid for by the companies. Depending on the skills category, the median compensation benefit ranges between 3-30 percent of base wages. Such benefits may be another indication of the skills shortage in Grenada as they are the largest for people with managerial skills. It is also a sign of protective labor regulation, which is considered to be a serious constraint second only to customs regulation.
Capacity and Innovation. In Grenada, capacity utilization rates vary significantly between firms. While some firms are running at full capacity, others have left idle as much as 90 percent of their productive capacity. Overall, however, the capacity of Grenada’s private sector is well utilized at 77 percent. Although more firms reported increases in their capacity utilization rates between 2001 and 2003 than those which reported a decline, about half of the companies saw no change during this time. Such stagnation in productivity and resource use is more noticeable among domestic firms than their foreign counterparts.
Most companies reported little innovative activity in terms of introducing new products. The most predominant innovative initiative is the upgrading of an existing product line, which was reported by almost half of the companies. The most important way of acquiring new technology is through new machinery and equipment, while actual expenditure on R&D is limited. Nearly 60 percent of the firms reported re-investing in their establishments for product and technology upgrading during the last 12 months. The median amount of investment as a percentage of net profit is a staggering 78 percent, and close to a quarter of the firms reported that they reinvested 100 percent of their profits in the companies for better product quality and higher growth.
Customers are generally the most significant influence to reduce production costs and to develop new products and services. Competition is also important. For domestic and micro firms, local competition is the most important force behind taking cost reduction measures and improving product and service qualities. Manufacturing firms, on the other hand, are heavily influenced by international competition.
226
Annex 3.4. Foreign Investor Perception Survey
A foreign investor perception survey of 201 (159 effective) international firms operating in the Caribbean was conducted by FIAS191 between February - May 2004. The objective was to gauge the relative importance of the various factors influencing foreign investors’ location decisions in the Caribbean region, as well as the attractiveness of different countries for FDI.
Instrument. The questionnaire was designed to collect information on key firm characteristics, the firm’s evaluation of 42 factors in 8 categories that constitute a country’s investment climate, the firm’s assessment of the country where it had invested and of the alternatives considered. The 8 categories of factors include policy and legal environment, FDI framework, market access, labor characteristics, administrative procedures, taxation and customs, infrastructure and quality of life. Information was also collected on the sources firms relied on to form their views of the countries in Caribbean, which should be of interest to the investment promotion institutions of the region. The survey was conducted primarily via telephone with the Chief Executive Officers and/or Chief Financial Officers of the subsidiaries in the Caribbean.
Sample Selection. The sample was selected from an extensive list of firms obtained from the investment promotion agencies and chambers of commerce in the Caribbean. Of 1,400 actual and potential investors compiled from these sources, 650 companies were selected as interview candidates. These firms were selected because they have international investments, represent a wide variety of sectors, and provide a fair representation of the different countries in the Caribbean.
In total, 201 companies were interviewed. Of these, 20 firms have headquarters in the Caribbean and are potential investors in another country in the region. However, the data collected from these investors is inadequate for an in-depth analysis. In addition, 22 enterprises were removed from the analysis because upon close scrutiny their investment should be classified as 100 percent local. Therefore, most of the analysis in the report is based on the information provided by 159 firms.
While one of the aims was to include firms at different stages of investment, information on past and prospective investments was difficult to obtain as very few enterprises are willing to discuss their future projects, or past failed efforts. Thus, with the exception of a few cases, information collected reflects the views of the enterprises that have that have invested in at least one country in the Caribbean.
Sources of investment. Firms with headquarters in North America account for the largest share of firms, at 45 percent of the total. Latin American and the Caribbean firms account for 40 percent of the firms. The remaining 15 percent of the surveyed firms originate from Europe and one from Japan. Over a third of the firms have a global workforce of less than 100 people, but 23 percent of the firms have more than 10,000 workers globally.
Size of investments. The majority of the foreign firms in the Caribbean are small in scale: 22 percent of the firms are micro businesses (1-10 employees), and 40 percent are small and medium enterprises (11–100 employees) account for another 40 percent of total firms. Correspondingly, the realized investments are also limited in size, with more than a third of the firms making investments of less than US$1 million.
Characteristics of the Caribbean Subsidiaries. Regardless of the investors’ countries of origin or the location of the Caribbean establishments, most of the companies (52 percent) are privately-held companies with limited liabilities. Publicly listed companies account for
191 Foreign Investment Advisory Service (World Bank/IFC, 2004g).
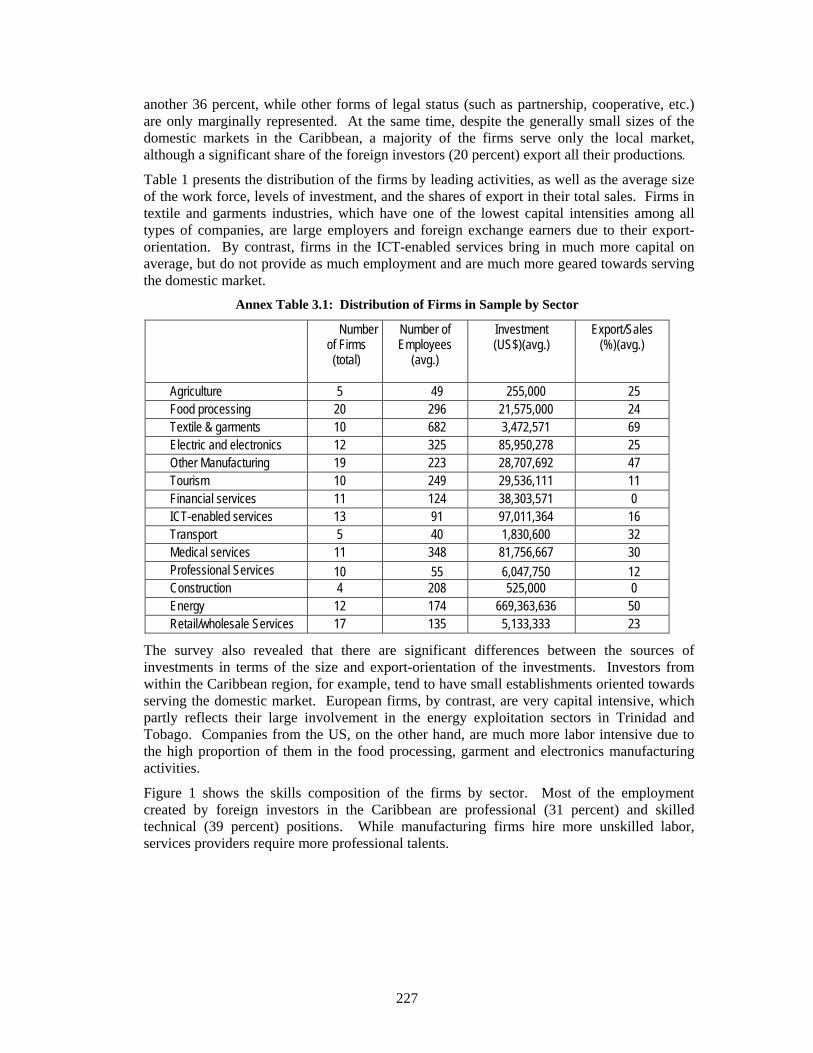
227
another 36 percent, while other forms of legal status (such as partnership, cooperative, etc.) are only marginally represented. At the same time, despite the generally small sizes of the domestic markets in the Caribbean, a majority of the firms serve only the local market, although a significant share of the foreign investors (20 percent) export all their productions.
Table 1 presents the distribution of the firms by leading activities, as well as the average size of the work force, levels of investment, and the shares of export in their total sales. Firms in textile and garments industries, which have one of the lowest capital intensities among all types of companies, are large employers and foreign exchange earners due to their export-orientation. By contrast, firms in the ICT-enabled services bring in much more capital on average, but do not provide as much employment and are much more geared towards serving the domestic market.
Annex Table 3.1: Distribution of Firms in Sample by Sector
Number of Firms (total)
Number of Employees
(avg.)
Investment (US$)(avg.)
Export/Sales (%)(avg.)
Agriculture 5 49 255,000 25 Food processing 20 296 21,575,000 24 Textile & garments 10 682 3,472,571 69 Electric and electronics 12 325 85,950,278 25 Other Manufacturing 19 223 28,707,692 47 Tourism 10 249 29,536,111 11 Financial services 11 124 38,303,571 0 ICT-enabled services 13 91 97,011,364 16 Transport 5 40 1,830,600 32 Medical services 11 348 81,756,667 30 Professional Services 10 55 6,047,750 12 Construction 4 208 525,000 0 Energy 12 174 669,363,636 50 Retail/wholesale Services 17 135 5,133,333 23
The survey also revealed that there are significant differences between the sources of investments in terms of the size and export-orientation of the investments. Investors from within the Caribbean region, for example, tend to have small establishments oriented towards serving the domestic market. European firms, by contrast, are very capital intensive, which partly reflects their large involvement in the energy exploitation sectors in Trinidad and Tobago. Companies from the US, on the other hand, are much more labor intensive due to the high proportion of them in the food processing, garment and electronics manufacturing activities.
Figure 1 shows the skills composition of the firms by sector. Most of the employment created by foreign investors in the Caribbean are professional (31 percent) and skilled technical (39 percent) positions. While manufacturing firms hire more unskilled labor, services providers require more professional talents.
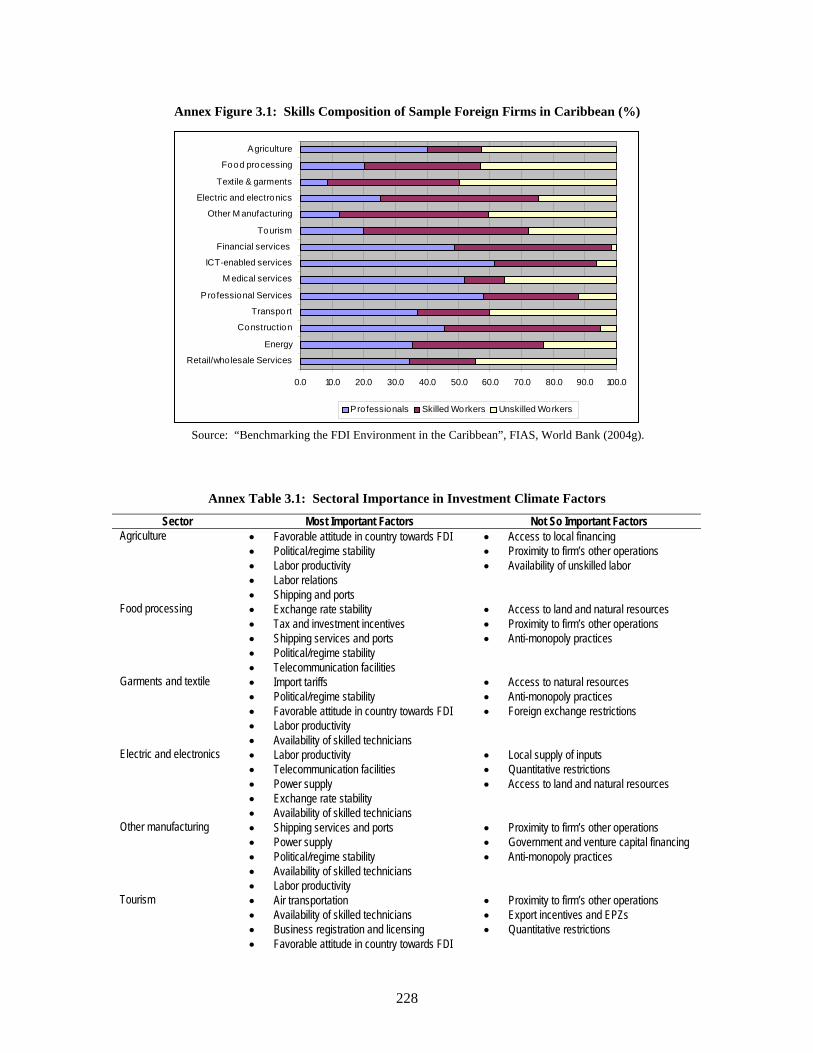
228
Annex Figure 3.1: Skills Composition of Sample Foreign Firms in Caribbean (%)
0.0 10.0 20.0 30.0 40.0 50.0 60.0 70.0 80.0 90.0 100.0
Retail/wholesale Services
Energy
Construction
Transport
Professional Services
M edical services
ICT-enabled services
Financial services
Tourism
Other M anufacturing
Electric and electronics
Textile & garments
Food processing
Agriculture
Professionals Skilled Workers Unskilled Workers
Source: “Benchmarking the FDI Environment in the Caribbean”, FIAS, World Bank (2004g).
Annex Table 3.1: Sectoral Importance in Investment Climate Factors
Sector Most Important Factors Not So Important Factors Agriculture • Favorable attitude in country towards FDI
• Political/regime stability • Labor productivity • Labor relations • Shipping and ports
• Access to local financing • Proximity to firm’s other operations • Availability of unskilled labor
Food processing • Exchange rate stability • Tax and investment incentives • Shipping services and ports • Political/regime stability • Telecommunication facilities
• Access to land and natural resources • Proximity to firm’s other operations • Anti-monopoly practices
Garments and textile • Import tariffs • Political/regime stability • Favorable attitude in country towards FDI • Labor productivity • Availability of skilled technicians
• Access to natural resources • Anti-monopoly practices • Foreign exchange restrictions
Electric and electronics • Labor productivity • Telecommunication facilities • Power supply • Exchange rate stability • Availability of skilled technicians
• Local supply of inputs • Quantitative restrictions • Access to land and natural resources
Other manufacturing • Shipping services and ports • Power supply • Political/regime stability • Availability of skilled technicians • Labor productivity
• Proximity to firm’s other operations • Government and venture capital financing • Anti-monopoly practices
Tourism • Air transportation • Availability of skilled technicians • Business registration and licensing • Favorable attitude in country towards FDI
• Proximity to firm’s other operations • Export incentives and EPZs • Quantitative restrictions
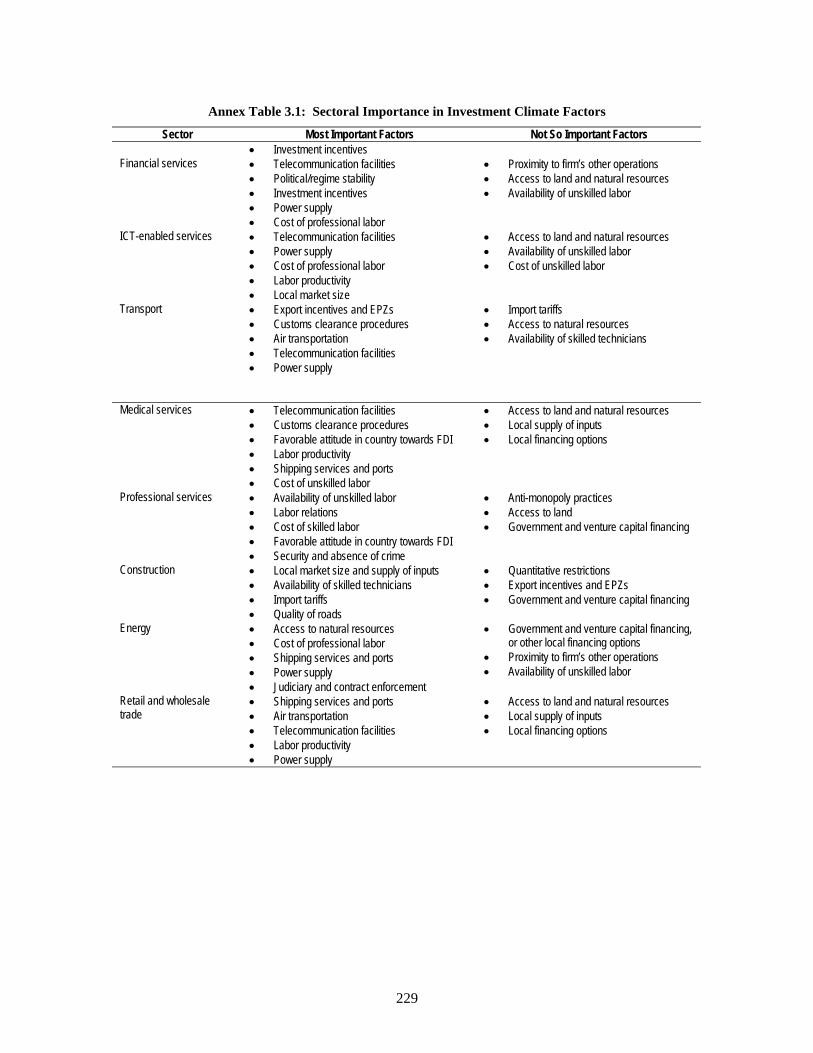
229
Annex Table 3.1: Sectoral Importance in Investment Climate Factors
Sector Most Important Factors Not So Important Factors • Investment incentives
Financial services • Telecommunication facilities • Political/regime stability • Investment incentives • Power supply • Cost of professional labor
• Proximity to firm’s other operations • Access to land and natural resources • Availability of unskilled labor
ICT-enabled services • Telecommunication facilities • Power supply • Cost of professional labor • Labor productivity • Local market size
• Access to land and natural resources • Availability of unskilled labor • Cost of unskilled labor
Transport • Export incentives and EPZs • Customs clearance procedures • Air transportation • Telecommunication facilities • Power supply
• Import tariffs • Access to natural resources • Availability of skilled technicians
Medical services • Telecommunication facilities • Customs clearance procedures • Favorable attitude in country towards FDI • Labor productivity • Shipping services and ports • Cost of unskilled labor
• Access to land and natural resources • Local supply of inputs • Local financing options
Professional services • Availability of unskilled labor • Labor relations • Cost of skilled labor • Favorable attitude in country towards FDI • Security and absence of crime
• Anti-monopoly practices • Access to land • Government and venture capital financing
Construction • Local market size and supply of inputs • Availability of skilled technicians • Import tariffs • Quality of roads
• Quantitative restrictions • Export incentives and EPZs • Government and venture capital financing
Energy • Access to natural resources • Cost of professional labor • Shipping services and ports • Power supply • Judiciary and contract enforcement
• Government and venture capital financing, or other local financing options
• Proximity to firm’s other operations • Availability of unskilled labor
Retail and wholesale trade
• Shipping services and ports • Air transportation • Telecommunication facilities • Labor productivity • Power supply
• Access to land and natural resources • Local supply of inputs • Local financing options
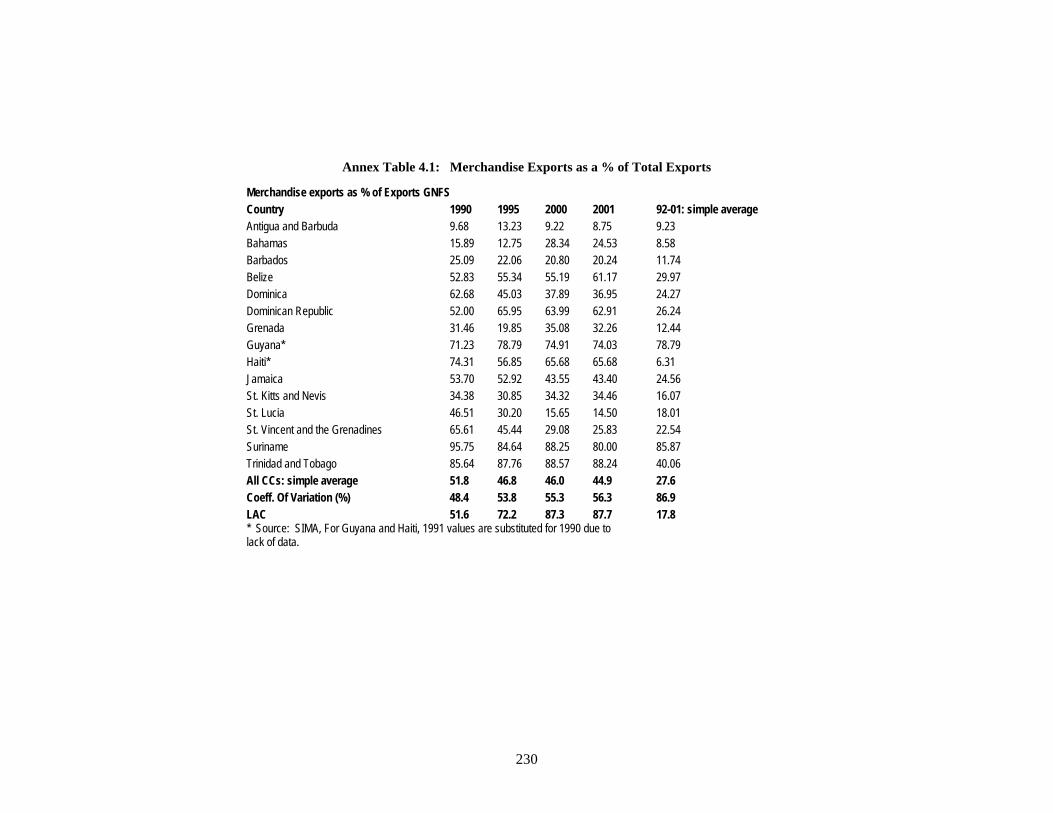
230
Annex Table 4.1: Merchandise Exports as a % of Total Exports
Merchandise exports as % of Exports GNFS Country 1990 1995 2000 2001 92-01: simple average Antigua and Barbuda 9.68 13.23 9.22 8.75 9.23 Bahamas 15.89 12.75 28.34 24.53 8.58 Barbados 25.09 22.06 20.80 20.24 11.74 Belize 52.83 55.34 55.19 61.17 29.97 Dominica 62.68 45.03 37.89 36.95 24.27 Dominican Republic 52.00 65.95 63.99 62.91 26.24 Grenada 31.46 19.85 35.08 32.26 12.44 Guyana* 71.23 78.79 74.91 74.03 78.79 Haiti* 74.31 56.85 65.68 65.68 6.31 Jamaica 53.70 52.92 43.55 43.40 24.56 St. Kitts and Nevis 34.38 30.85 34.32 34.46 16.07 St. Lucia 46.51 30.20 15.65 14.50 18.01 St. Vincent and the Grenadines 65.61 45.44 29.08 25.83 22.54 Suriname 95.75 84.64 88.25 80.00 85.87 Trinidad and Tobago 85.64 87.76 88.57 88.24 40.06 All CCs: simple average 51.8 46.8 46.0 44.9 27.6 Coeff. Of Variation (%) 48.4 53.8 55.3 56.3 86.9 LAC 51.6 72.2 87.3 87.7 17.8 * Source: SIMA, For Guyana and Haiti, 1991 values are substituted for 1990 due to lack of data.
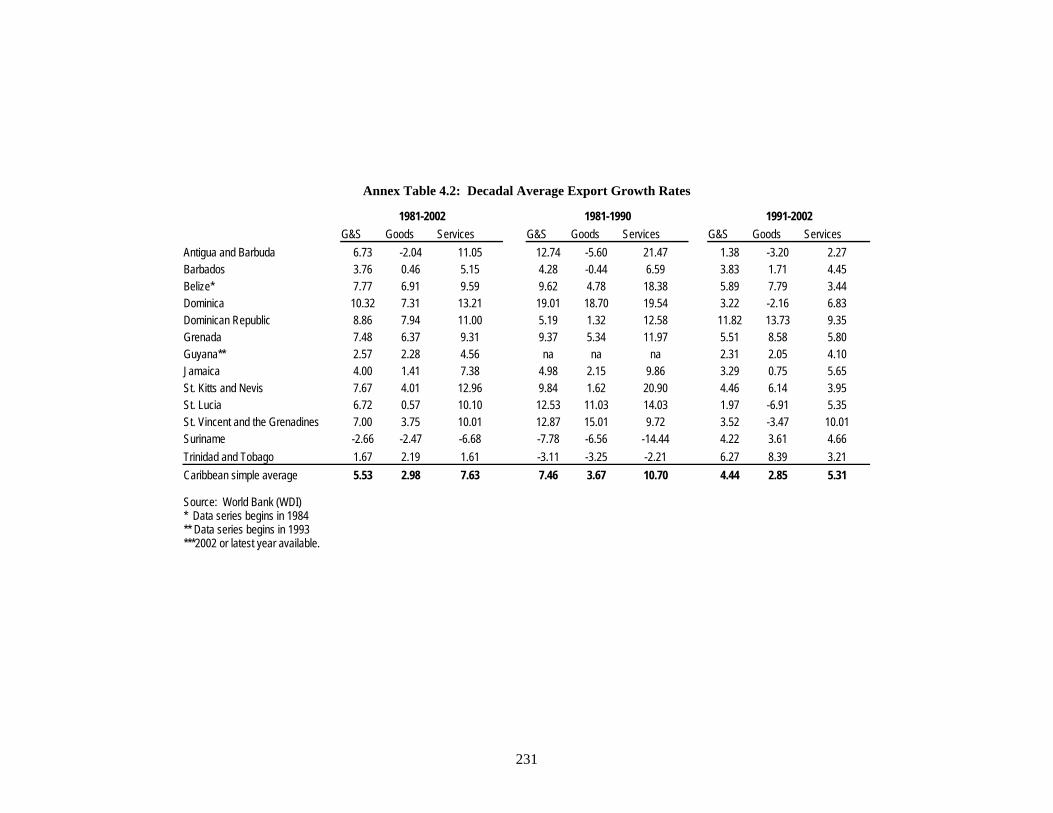
231
Annex Table 4.2: Decadal Average Export Growth Rates
1981-2002 1981-1990 1991-2002 G&S Goods Services G&S Goods Services G&S Goods Services Antigua and Barbuda 6.73 -2.04 11.05 12.74 -5.60 21.47 1.38 -3.20 2.27 Barbados 3.76 0.46 5.15 4.28 -0.44 6.59 3.83 1.71 4.45 Belize* 7.77 6.91 9.59 9.62 4.78 18.38 5.89 7.79 3.44 Dominica 10.32 7.31 13.21 19.01 18.70 19.54 3.22 -2.16 6.83 Dominican Republic 8.86 7.94 11.00 5.19 1.32 12.58 11.82 13.73 9.35 Grenada 7.48 6.37 9.31 9.37 5.34 11.97 5.51 8.58 5.80 Guyana** 2.57 2.28 4.56 na na na 2.31 2.05 4.10 Jamaica 4.00 1.41 7.38 4.98 2.15 9.86 3.29 0.75 5.65 St. Kitts and Nevis 7.67 4.01 12.96 9.84 1.62 20.90 4.46 6.14 3.95 St. Lucia 6.72 0.57 10.10 12.53 11.03 14.03 1.97 -6.91 5.35 St. Vincent and the Grenadines 7.00 3.75 10.01 12.87 15.01 9.72 3.52 -3.47 10.01 Suriname -2.66 -2.47 -6.68 -7.78 -6.56 -14.44 4.22 3.61 4.66 Trinidad and Tobago 1.67 2.19 1.61 -3.11 -3.25 -2.21 6.27 8.39 3.21 Caribbean simple average 5.53 2.98 7.63 7.46 3.67 10.70 4.44 2.85 5.31
Source: World Bank (WDI) * Data series begins in 1984 ** Data series begins in 1993 ***2002 or latest year available.
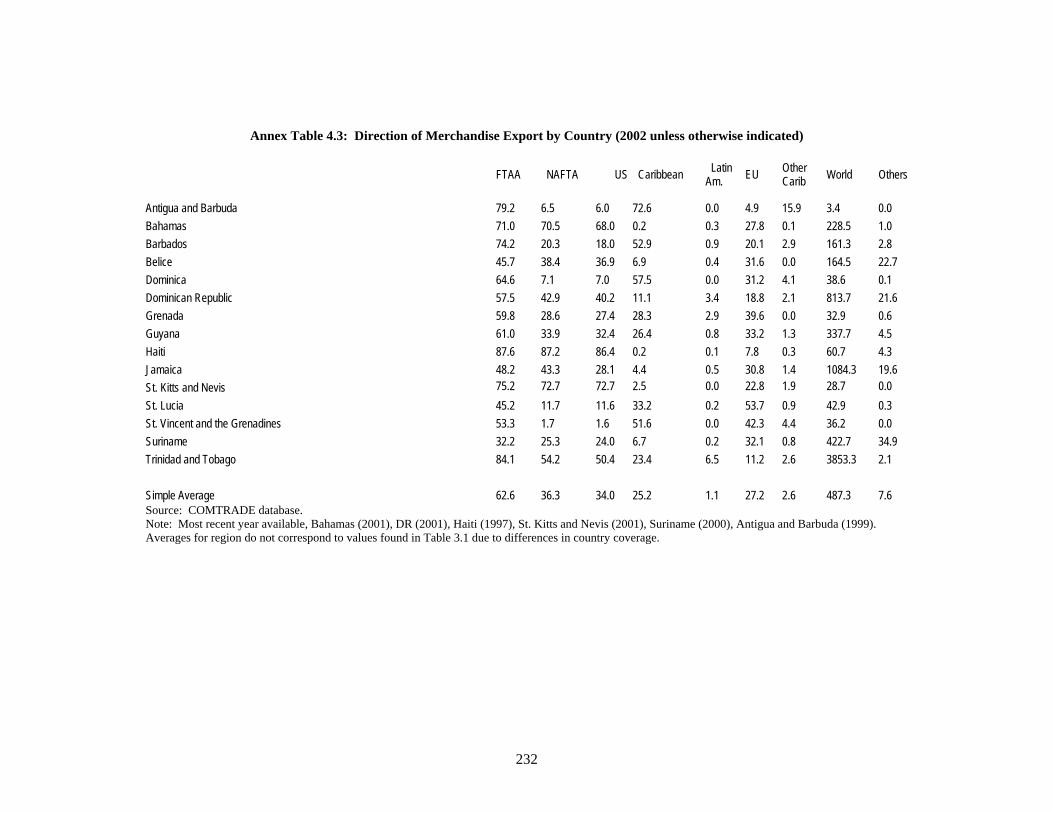
232
Annex Table 4.3: Direction of Merchandise Export by Country (2002 unless otherwise indicated)
FTAA NAFTA US Caribbean Latin
Am. EU Other Carib World Others
Antigua and Barbuda 79.2 6.5 6.0 72.6 0.0 4.9 15.9 3.4 0.0 Bahamas 71.0 70.5 68.0 0.2 0.3 27.8 0.1 228.5 1.0 Barbados 74.2 20.3 18.0 52.9 0.9 20.1 2.9 161.3 2.8 Belice 45.7 38.4 36.9 6.9 0.4 31.6 0.0 164.5 22.7 Dominica 64.6 7.1 7.0 57.5 0.0 31.2 4.1 38.6 0.1 Dominican Republic 57.5 42.9 40.2 11.1 3.4 18.8 2.1 813.7 21.6 Grenada 59.8 28.6 27.4 28.3 2.9 39.6 0.0 32.9 0.6 Guyana 61.0 33.9 32.4 26.4 0.8 33.2 1.3 337.7 4.5 Haiti 87.6 87.2 86.4 0.2 0.1 7.8 0.3 60.7 4.3 Jamaica 48.2 43.3 28.1 4.4 0.5 30.8 1.4 1084.3 19.6 St. Kitts and Nevis 75.2 72.7 72.7 2.5 0.0 22.8 1.9 28.7 0.0 St. Lucia 45.2 11.7 11.6 33.2 0.2 53.7 0.9 42.9 0.3 St. Vincent and the Grenadines 53.3 1.7 1.6 51.6 0.0 42.3 4.4 36.2 0.0 Suriname 32.2 25.3 24.0 6.7 0.2 32.1 0.8 422.7 34.9 Trinidad and Tobago 84.1 54.2 50.4 23.4 6.5 11.2 2.6 3853.3 2.1 Simple Average 62.6 36.3 34.0 25.2 1.1 27.2 2.6 487.3 7.6 Source: COMTRADE database. Note: Most recent year available, Bahamas (2001), DR (2001), Haiti (1997), St. Kitts and Nevis (2001), Suriname (2000), Antigua and Barbuda (1999). Averages for region do not correspond to values found in Table 3.1 due to differences in country coverage.
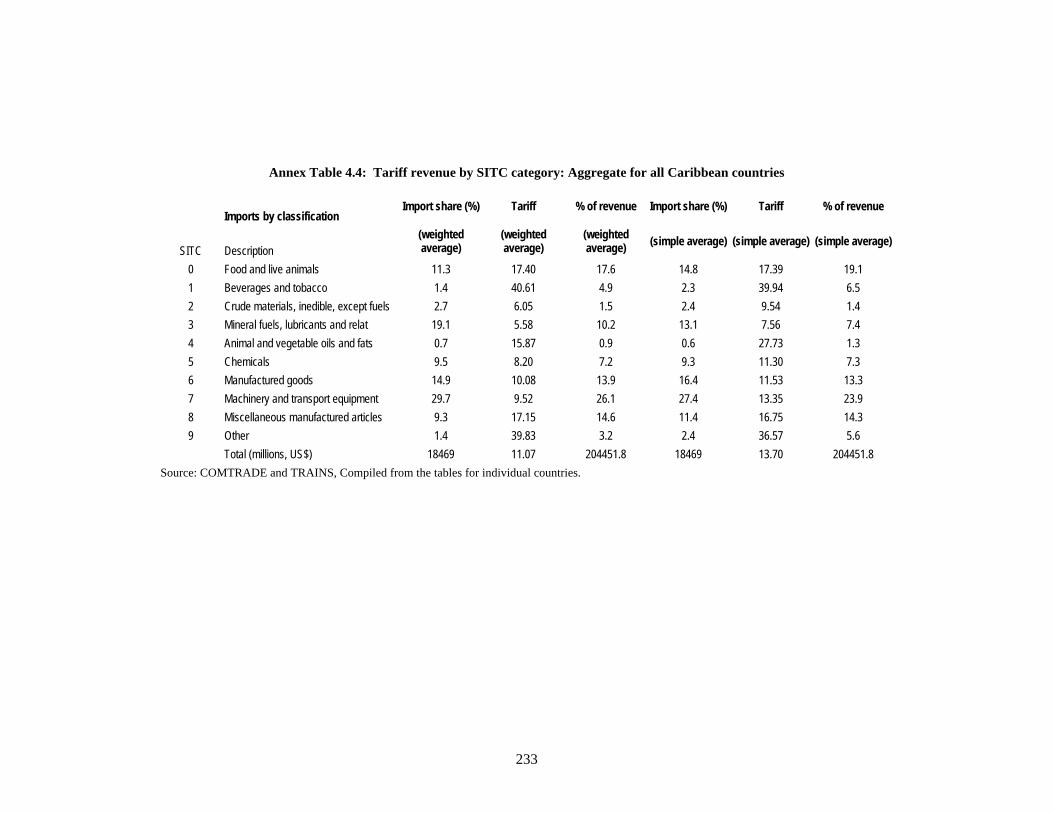
233
Annex Table 4.4: Tariff revenue by SITC category: Aggregate for all Caribbean countries
Imports by classification Import share (%) Tariff % of revenue Import share (%) Tariff % of revenue
SITC Description (weighted average)
(weighted average)
(weighted average) (simple average) (simple average) (simple average)
0 Food and live animals 11.3 17.40 17.6 14.8 17.39 19.1 1 Beverages and tobacco 1.4 40.61 4.9 2.3 39.94 6.5 2 Crude materials, inedible, except fuels 2.7 6.05 1.5 2.4 9.54 1.4 3 Mineral fuels, lubricants and relat 19.1 5.58 10.2 13.1 7.56 7.4 4 Animal and vegetable oils and fats 0.7 15.87 0.9 0.6 27.73 1.3 5 Chemicals 9.5 8.20 7.2 9.3 11.30 7.3 6 Manufactured goods 14.9 10.08 13.9 16.4 11.53 13.3 7 Machinery and transport equipment 29.7 9.52 26.1 27.4 13.35 23.9 8 Miscellaneous manufactured articles 9.3 17.15 14.6 11.4 16.75 14.3 9 Other 1.4 39.83 3.2 2.4 36.57 5.6
Total (millions, US$) 18469 11.07 204451.8 18469 13.70 204451.8 Source: COMTRADE and TRAINS, Compiled from the tables for individual countries.
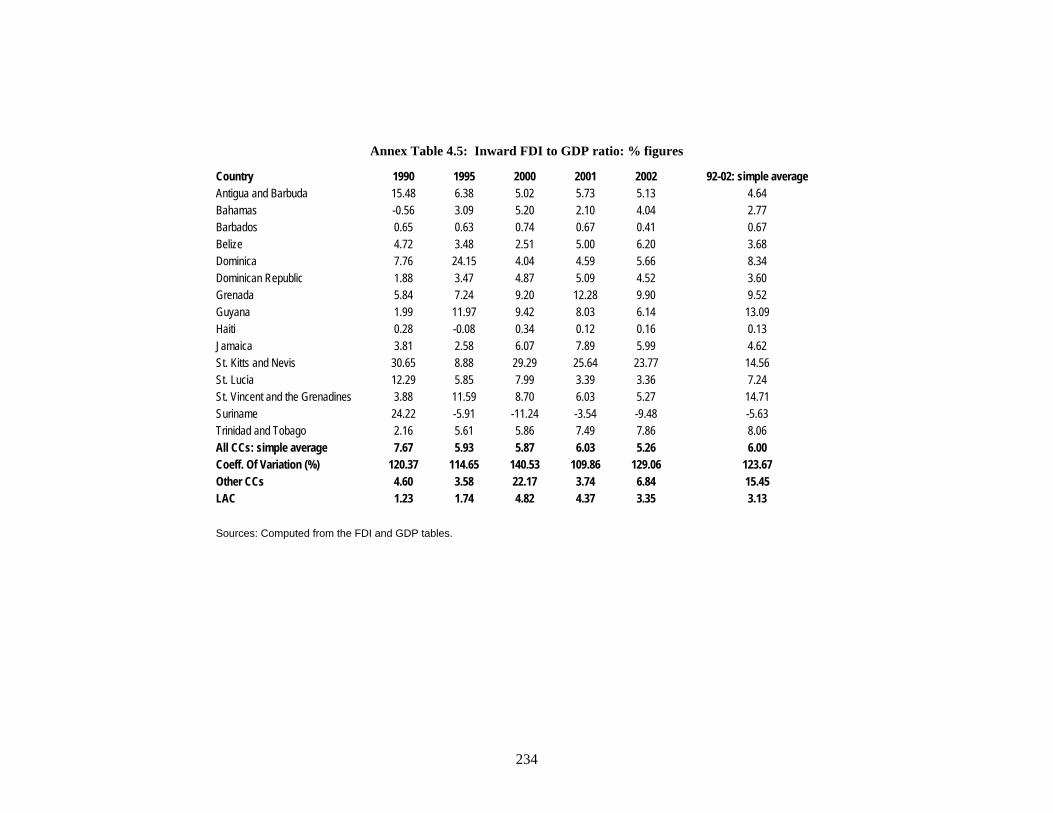
234
Annex Table 4.5: Inward FDI to GDP ratio: % figures
Country 1990 1995 2000 2001 2002 92-02: simple average Antigua and Barbuda 15.48 6.38 5.02 5.73 5.13 4.64 Bahamas -0.56 3.09 5.20 2.10 4.04 2.77 Barbados 0.65 0.63 0.74 0.67 0.41 0.67 Belize 4.72 3.48 2.51 5.00 6.20 3.68 Dominica 7.76 24.15 4.04 4.59 5.66 8.34 Dominican Republic 1.88 3.47 4.87 5.09 4.52 3.60 Grenada 5.84 7.24 9.20 12.28 9.90 9.52 Guyana 1.99 11.97 9.42 8.03 6.14 13.09 Haiti 0.28 -0.08 0.34 0.12 0.16 0.13 Jamaica 3.81 2.58 6.07 7.89 5.99 4.62 St. Kitts and Nevis 30.65 8.88 29.29 25.64 23.77 14.56 St. Lucia 12.29 5.85 7.99 3.39 3.36 7.24 St. Vincent and the Grenadines 3.88 11.59 8.70 6.03 5.27 14.71 Suriname 24.22 -5.91 -11.24 -3.54 -9.48 -5.63 Trinidad and Tobago 2.16 5.61 5.86 7.49 7.86 8.06 All CCs: simple average 7.67 5.93 5.87 6.03 5.26 6.00 Coeff. Of Variation (%) 120.37 114.65 140.53 109.86 129.06 123.67 Other CCs 4.60 3.58 22.17 3.74 6.84 15.45 LAC 1.23 1.74 4.82 4.37 3.35 3.13 Sources: Computed from the FDI and GDP tables.
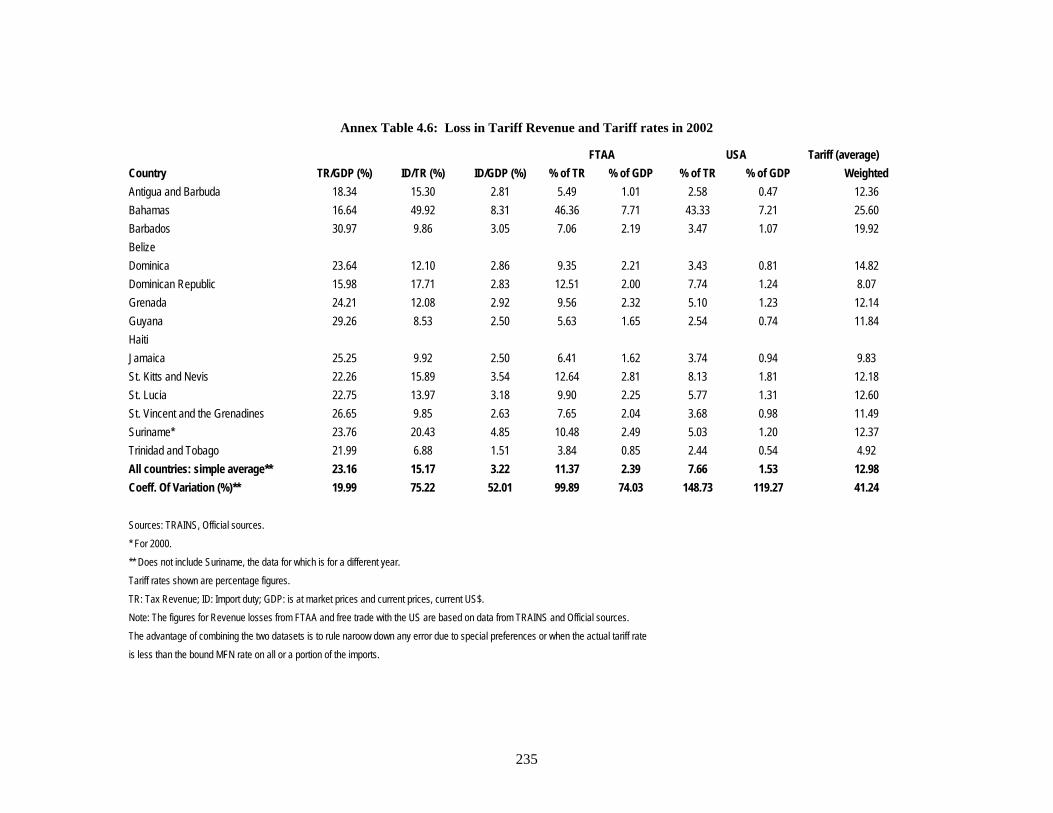
235
Annex Table 4.6: Loss in Tariff Revenue and Tariff rates in 2002
FTAA USA Tariff (average) Country TR/GDP (%) ID/TR (%) ID/GDP (%) % of TR % of GDP % of TR % of GDP Weighted Antigua and Barbuda 18.34 15.30 2.81 5.49 1.01 2.58 0.47 12.36 Bahamas 16.64 49.92 8.31 46.36 7.71 43.33 7.21 25.60 Barbados 30.97 9.86 3.05 7.06 2.19 3.47 1.07 19.92 Belize Dominica 23.64 12.10 2.86 9.35 2.21 3.43 0.81 14.82 Dominican Republic 15.98 17.71 2.83 12.51 2.00 7.74 1.24 8.07 Grenada 24.21 12.08 2.92 9.56 2.32 5.10 1.23 12.14 Guyana 29.26 8.53 2.50 5.63 1.65 2.54 0.74 11.84 Haiti Jamaica 25.25 9.92 2.50 6.41 1.62 3.74 0.94 9.83 St. Kitts and Nevis 22.26 15.89 3.54 12.64 2.81 8.13 1.81 12.18 St. Lucia 22.75 13.97 3.18 9.90 2.25 5.77 1.31 12.60 St. Vincent and the Grenadines 26.65 9.85 2.63 7.65 2.04 3.68 0.98 11.49 Suriname* 23.76 20.43 4.85 10.48 2.49 5.03 1.20 12.37 Trinidad and Tobago 21.99 6.88 1.51 3.84 0.85 2.44 0.54 4.92 All countries: simple average** 23.16 15.17 3.22 11.37 2.39 7.66 1.53 12.98 Coeff. Of Variation (%)** 19.99 75.22 52.01 99.89 74.03 148.73 119.27 41.24
Sources: TRAINS, Official sources.
* For 2000. ** Does not include Suriname, the data for which is for a different year.
Tariff rates shown are percentage figures.
TR: Tax Revenue; ID: Import duty; GDP: is at market prices and current prices, current US$. Note: The figures for Revenue losses from FTAA and free trade with the US are based on data from TRAINS and Official sources.
The advantage of combining the two datasets is to rule naroow down any error due to special preferences or when the actual tariff rate
is less than the bound MFN rate on all or a portion of the imports.
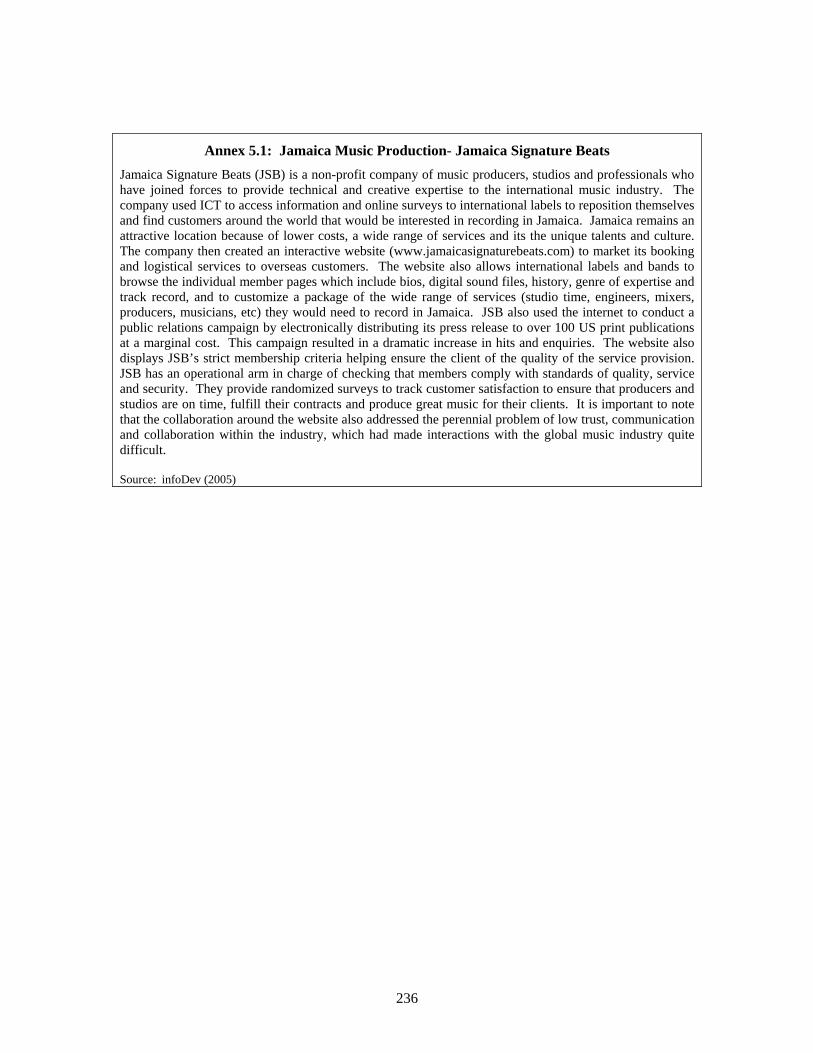
236
Annex 5.1: Jamaica Music Production- Jamaica Signature Beats Jamaica Signature Beats (JSB) is a non-profit company of music producers, studios and professionals who have joined forces to provide technical and creative expertise to the international music industry. The company used ICT to access information and online surveys to international labels to reposition themselves and find customers around the world that would be interested in recording in Jamaica. Jamaica remains an attractive location because of lower costs, a wide range of services and its the unique talents and culture. The company then created an interactive website (www.jamaicasignaturebeats.com) to market its booking and logistical services to overseas customers. The website also allows international labels and bands to browse the individual member pages which include bios, digital sound files, history, genre of expertise and track record, and to customize a package of the wide range of services (studio time, engineers, mixers, producers, musicians, etc) they would need to record in Jamaica. JSB also used the internet to conduct a public relations campaign by electronically distributing its press release to over 100 US print publications at a marginal cost. This campaign resulted in a dramatic increase in hits and enquiries. The website also displays JSB’s strict membership criteria helping ensure the client of the quality of the service provision. JSB has an operational arm in charge of checking that members comply with standards of quality, service and security. They provide randomized surveys to track customer satisfaction to ensure that producers and studios are on time, fulfill their contracts and produce great music for their clients. It is important to note that the collaboration around the website also addressed the perennial problem of low trust, communication and collaboration within the industry, which had made interactions with the global music industry quite difficult. Source: infoDev (2005)

237
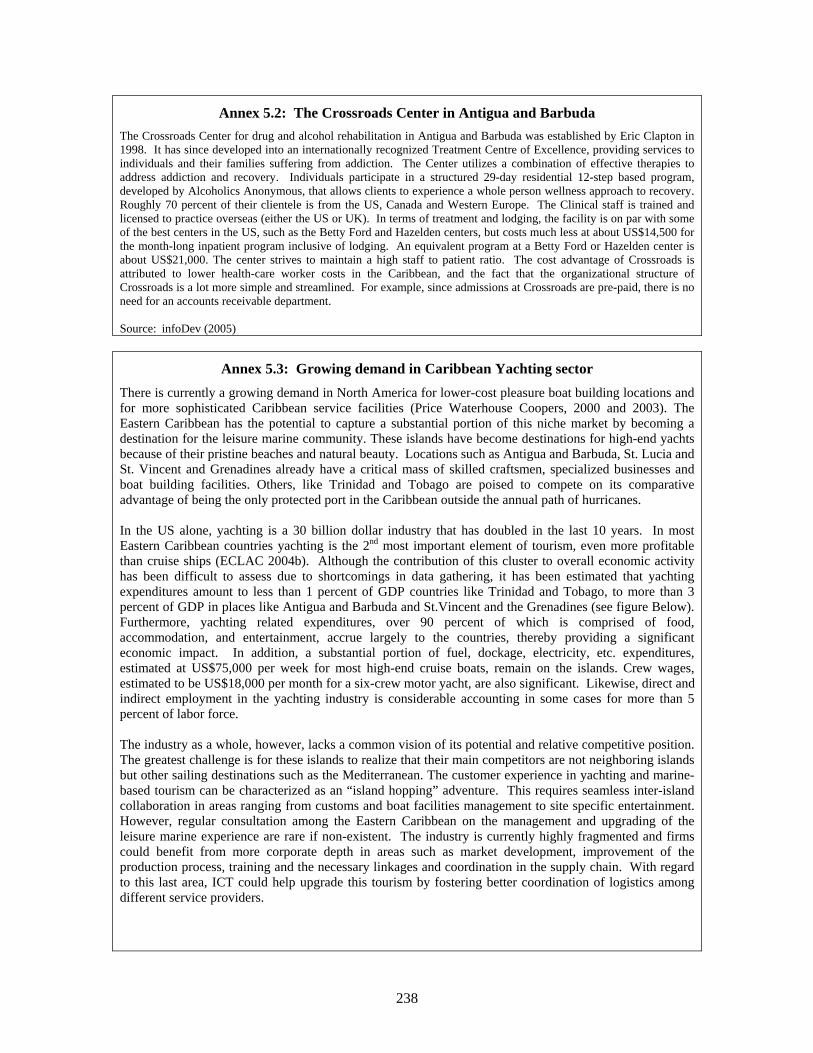
238
Annex 5.2: The Crossroads Center in Antigua and Barbuda The Crossroads Center for drug and alcohol rehabilitation in Antigua and Barbuda was established by Eric Clapton in 1998. It has since developed into an internationally recognized Treatment Centre of Excellence, providing services to individuals and their families suffering from addiction. The Center utilizes a combination of effective therapies to address addiction and recovery. Individuals participate in a structured 29-day residential 12-step based program, developed by Alcoholics Anonymous, that allows clients to experience a whole person wellness approach to recovery. Roughly 70 percent of their clientele is from the US, Canada and Western Europe. The Clinical staff is trained and licensed to practice overseas (either the US or UK). In terms of treatment and lodging, the facility is on par with some of the best centers in the US, such as the Betty Ford and Hazelden centers, but costs much less at about US$14,500 for the month-long inpatient program inclusive of lodging. An equivalent program at a Betty Ford or Hazelden center is about US$21,000. The center strives to maintain a high staff to patient ratio. The cost advantage of Crossroads is attributed to lower health-care worker costs in the Caribbean, and the fact that the organizational structure of Crossroads is a lot more simple and streamlined. For example, since admissions at Crossroads are pre-paid, there is no need for an accounts receivable department. Source: infoDev (2005)
Annex 5.3: Growing demand in Caribbean Yachting sector There is currently a growing demand in North America for lower-cost pleasure boat building locations and for more sophisticated Caribbean service facilities (Price Waterhouse Coopers, 2000 and 2003). The Eastern Caribbean has the potential to capture a substantial portion of this niche market by becoming a destination for the leisure marine community. These islands have become destinations for high-end yachts because of their pristine beaches and natural beauty. Locations such as Antigua and Barbuda, St. Lucia and St. Vincent and Grenadines already have a critical mass of skilled craftsmen, specialized businesses and boat building facilities. Others, like Trinidad and Tobago are poised to compete on its comparative advantage of being the only protected port in the Caribbean outside the annual path of hurricanes. In the US alone, yachting is a 30 billion dollar industry that has doubled in the last 10 years. In most Eastern Caribbean countries yachting is the 2nd most important element of tourism, even more profitable than cruise ships (ECLAC 2004b). Although the contribution of this cluster to overall economic activity has been difficult to assess due to shortcomings in data gathering, it has been estimated that yachting expenditures amount to less than 1 percent of GDP countries like Trinidad and Tobago, to more than 3 percent of GDP in places like Antigua and Barbuda and St.Vincent and the Grenadines (see figure Below). Furthermore, yachting related expenditures, over 90 percent of which is comprised of food, accommodation, and entertainment, accrue largely to the countries, thereby providing a significant economic impact. In addition, a substantial portion of fuel, dockage, electricity, etc. expenditures, estimated at US$75,000 per week for most high-end cruise boats, remain on the islands. Crew wages, estimated to be US$18,000 per month for a six-crew motor yacht, are also significant. Likewise, direct and indirect employment in the yachting industry is considerable accounting in some cases for more than 5 percent of labor force. The industry as a whole, however, lacks a common vision of its potential and relative competitive position. The greatest challenge is for these islands to realize that their main competitors are not neighboring islands but other sailing destinations such as the Mediterranean. The customer experience in yachting and marine-based tourism can be characterized as an “island hopping” adventure. This requires seamless inter-island collaboration in areas ranging from customs and boat facilities management to site specific entertainment. However, regular consultation among the Eastern Caribbean on the management and upgrading of the leisure marine experience are rare if non-existent. The industry is currently highly fragmented and firms could benefit from more corporate depth in areas such as market development, improvement of the production process, training and the necessary linkages and coordination in the supply chain. With regard to this last area, ICT could help upgrade this tourism by fostering better coordination of logistics among different service providers.
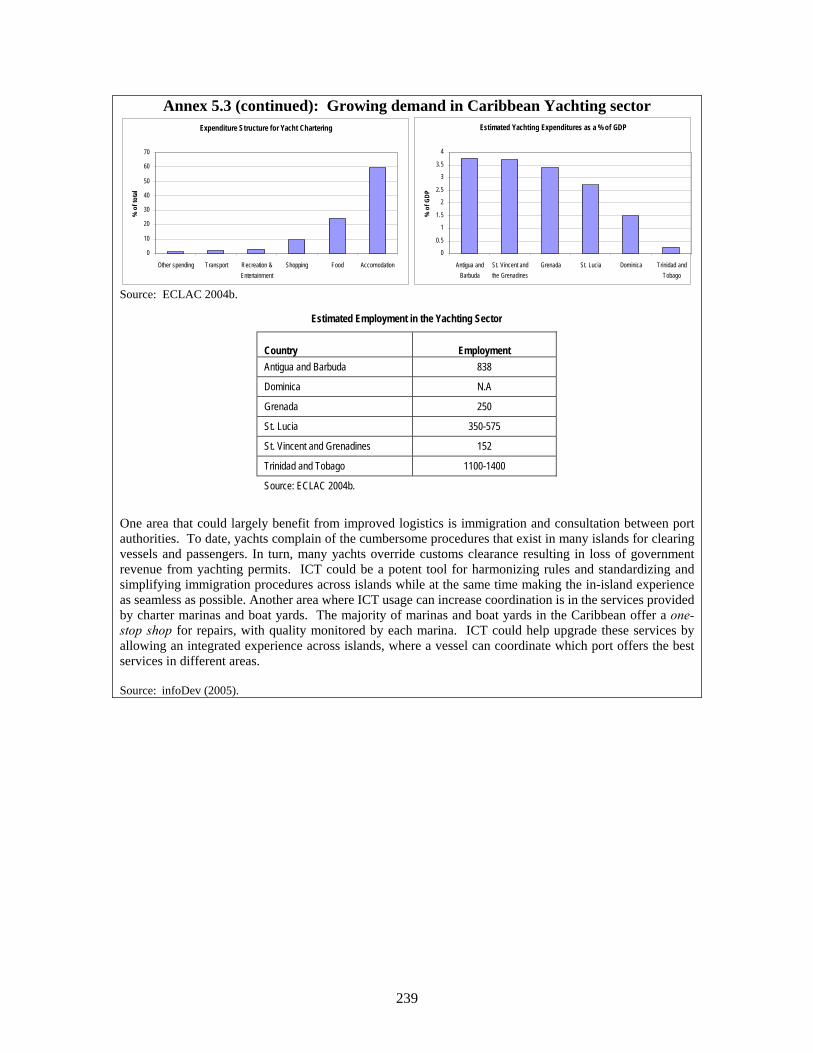
239
Annex 5.3 (continued): Growing demand in Caribbean Yachting sector
Source: ECLAC 2004b. One area that could largely benefit from improved logistics is immigration and consultation between port authorities. To date, yachts complain of the cumbersome procedures that exist in many islands for clearing vessels and passengers. In turn, many yachts override customs clearance resulting in loss of government revenue from yachting permits. ICT could be a potent tool for harmonizing rules and standardizing and simplifying immigration procedures across islands while at the same time making the in-island experience as seamless as possible. Another area where ICT usage can increase coordination is in the services provided by charter marinas and boat yards. The majority of marinas and boat yards in the Caribbean offer a one-stop shop for repairs, with quality monitored by each marina. ICT could help upgrade these services by allowing an integrated experience across islands, where a vessel can coordinate which port offers the best services in different areas. Source: infoDev (2005).
Estimated Employment in the Yachting Sector
Country
Employment
Antigua and Barbuda 838
Dominica N.A
Grenada 250
St. Lucia 350-575
St. Vincent and Grenadines 152
Trinidad and Tobago 1100-1400
Source: ECLAC 2004b.
Expenditure Structure for Yacht Chartering
0
10
20
30
40
50
60
70
Other spending Transport Recreation &Entertainment
Shopping Food Accomodation
% o
f tot
alEstimated Yachting Expenditures as a % of GDP
0
0.5
1
1.5
2
2.5
3
3.5
4
Antigua andBarbuda
St. Vincent andthe Grenadines
Grenada St. Lucia Dominica Trinidad andTobago
% o
f GDP
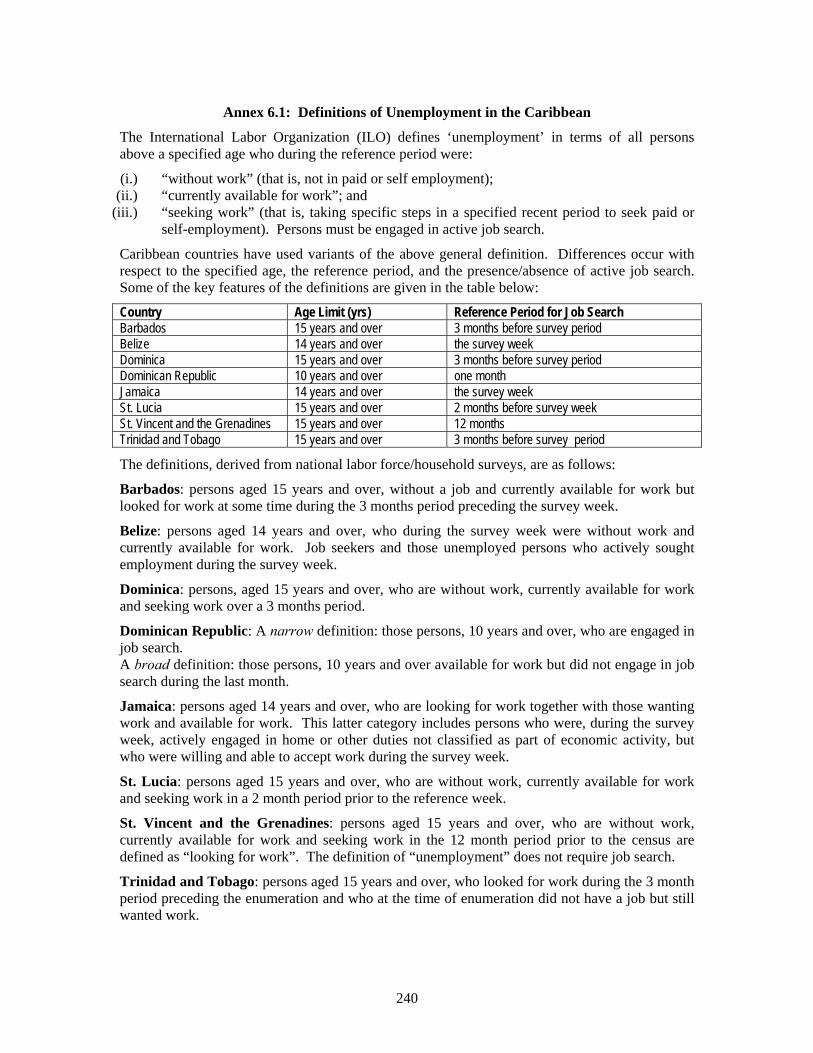
240
Annex 6.1: Definitions of Unemployment in the Caribbean
The International Labor Organization (ILO) defines ‘unemployment’ in terms of all persons above a specified age who during the reference period were:
(i.) “without work” (that is, not in paid or self employment); (ii.) “currently available for work”; and
(iii.) “seeking work” (that is, taking specific steps in a specified recent period to seek paid or self-employment). Persons must be engaged in active job search.
Caribbean countries have used variants of the above general definition. Differences occur with respect to the specified age, the reference period, and the presence/absence of active job search. Some of the key features of the definitions are given in the table below:
Country Age Limit (yrs) Reference Period for Job Search Barbados 15 years and over 3 months before survey period Belize 14 years and over the survey week Dominica 15 years and over 3 months before survey period Dominican Republic 10 years and over one month Jamaica 14 years and over the survey week St. Lucia 15 years and over 2 months before survey week St. Vincent and the Grenadines 15 years and over 12 months Trinidad and Tobago 15 years and over 3 months before survey period
The definitions, derived from national labor force/household surveys, are as follows:
Barbados: persons aged 15 years and over, without a job and currently available for work but looked for work at some time during the 3 months period preceding the survey week.
Belize: persons aged 14 years and over, who during the survey week were without work and currently available for work. Job seekers and those unemployed persons who actively sought employment during the survey week.
Dominica: persons, aged 15 years and over, who are without work, currently available for work and seeking work over a 3 months period.
Dominican Republic: A narrow definition: those persons, 10 years and over, who are engaged in job search. A broad definition: those persons, 10 years and over available for work but did not engage in job search during the last month.
Jamaica: persons aged 14 years and over, who are looking for work together with those wanting work and available for work. This latter category includes persons who were, during the survey week, actively engaged in home or other duties not classified as part of economic activity, but who were willing and able to accept work during the survey week.
St. Lucia: persons aged 15 years and over, who are without work, currently available for work and seeking work in a 2 month period prior to the reference week.
St. Vincent and the Grenadines: persons aged 15 years and over, who are without work, currently available for work and seeking work in the 12 month period prior to the census are defined as “looking for work”. The definition of “unemployment” does not require job search.
Trinidad and Tobago: persons aged 15 years and over, who looked for work during the 3 month period preceding the enumeration and who at the time of enumeration did not have a job but still wanted work.
241
Annex 6.2: Trade Unions in the Caribbean
The primary objective and function of trade unions is to engage in collective bargaining to address issues of employment relations (including compensation), but they also provide important dispute resolution services – through grievance procedures, conciliation and arbitration – as well as member services (e.g., job counseling and placement, credit union facilities and medical plans) and education and training through labor colleges. There are six established labor colleges (or educational institutes) in the Caribbean, which provide varied curricula offerings to union members including training in union and labor-management relations, supervisory management, computer applications, project design and implementation, as well as general interest seminars on issues such as investment, gender, and stress management, for example. Unions also play a role in lobbying for social and labor legislation such as workmen’s compensation, occupational safety and health, social security, hours of work, and of course minimum wage, which effectively establish minimum work standards that apply to all workers, not just those in the unionized sectors.
Unions can be effective not only in improving working conditions but also by creating industrial peace and stability through industrial democracy, thereby helping employers achieve their business objectives. The pre-conditions necessary for trade unions to be effective include: (i) a high level of effective organization of workers, especially in key sectors; (ii) professional leadership and demonstrated expertise in industrial relations; (iii) “depth of recognition” as opposed to superficial recognition by employers; (iv) a facilitating legal and institutional framework; (v) an appreciation of the union role in society; (vi) willingness on the part of employers to commit to the practice of and engage in good faith bargaining, and to honor the results; (vii) the existence of mechanisms for effective joint consultation over issues that affect workers and society as a whole; and (viii) the relative absence of destructive inter-union rivalry that saps the energy of union leaders and dilutes the effectiveness of unionism (see Nurse 2004).
A recent example of a strike in Trinidad and Tobago. A wage dispute was resolved in April 2004 after a 10 week stalemate between workers and employers of the Atlantic LNG group, a contractor of Bechtel International (The Trinidad Guardian, April 17, 2004). Atlantic LNG subcontracted with some 14 companies on the construction of the Bechtel LNG plant in Trinidad. Despite a lack of union representation, workers coordinated to walk off the job to demand higher wages. This action emerged from disappointment at the Government’s refusal to fulfill its pledge to raise the minimum wage in the “heavy construction” sector from T$8 to T$18 per hour. The proposal to adopt minimum wage legislation for this sector (i.e., employees of multinational corporations) distinct from the domestic construction sector attracted broad support, both by unions and the Government.
The length of the strike was prolonged by several factors: workers were employed by 14 different subcontractors who did not have the bargaining authority to change their contract terms to Atlantic LNG; contract workers were not represented by any union; and the parent organization Bechtel distanced itself from the talks, even though an eventual resolution would require their involvement. The work delays resulted in T$190 million in standby costs for the T$1.4 billion project. Unions joined the cause by representing non-member workers in the negotiations and threatening a general strike. The Government – which stood to gain from wage increases by reducing criticism over its failed pledge and directly through higher tax receipts – chose a non-interventionist stance until the very end when a visit by the Prime Minister indirectly spurred a resolution by the parties. The final agreement involved a 22 percent increase in wages and allowances amounting to T$88 million.
242
Annex 6.3: Regulatory Environment for Migration
Visa regulations and the ease of entry and/or obtaining work permits, residence or citizenship status act as incentives or constraints to the migration of the relevant groups that fall into the various preferred or prohibited categories of migrants in the countries of immigration.
South-North migration. Under current US immigration law, for example, immigrants are divided into those who may obtain legal permanent residence status without numerical limitation, and those who are restricted by an annual limitation on the number of persons who may enter as permanent residents, the latter sub-divided into family sponsored immigrants, employment based immigrants, and diversity immigrants (i.e., the ‘green card’ lottery). There are numerical limitations for each category of immigrant visa as well as limits on the number of immigrant visas per year which can be issued to natives of any single country. The visa categories currently in effect in the US are non-immigrant, student and for work.
Visas to Canada may be obtained for initial entry to Canada under a number of classes of entry and while on any one of these visas, application may be made for a change in status including permanent immigration status. The Canadian immigration department has developed very systematic immigration criteria to recruit economic class immigrants, which includes skilled workers and business class immigrants. There are three categories for permanent migration to Canada, the independent class (for professional class or skilled workers), the entrepreneur, investor or self-employed class, and the family class for close relatives of current residents. Once in Canada, anyone may apply for any of the following types of visas (which could lead to a permanent immigration visa): (i) conventional refugee, also known as political asylum; (ii) live-in-caregiver, also known as nanny or domestic help or au pair; (iii) immigrant visa of Canada as spouse; (iv) humanitarian and compassionate reasons.
The United Kingdom recently tightened the criteria for temporary visa holders and students in non-degree programs, to strengthen the UK’s selective admission policies and restrict temporary migrants from switching to permanent visa categories such as the Highly Skilled Migrant Program (HSMP) and Innovator scheme. The change will help ensure that migrants possess work permits before leaving the Caribbean.
Intra-Caribbean migration. The free movement of skills within the Caribbean – agreed in 1992 – applies only to CARICOM member states and to specific skill categories (university graduates, artists, media, athletes and musicians). This policy’s objective is to optimize human resource allocation within the Caribbean Single Market and Economy (CSME), but governments have been reluctant to allow free movement of all categories of labor within the region. CARICOM Member States, with the exception of Barbados, used this model to enact legislation at the national level. In the case of Barbados, the previously existing Immigration Act was amended in 1996. In Guyana, there are three laws dealing with the free movement of skills, namely the Immigration (Amendment) Act of 1992, the Caribbean Community (Free Entry of Skilled Nationals) Act of 1996, and the Immigration (Free Movement of Persons) Order of 2003. Dominica passed the Caribbean Community Skilled Nationals Act in 1995. St. Lucia and Trinidad and Tobago passed the Caribbean Community Skilled Nationals Act in 1996, and Antigua and Barbuda, Jamaica, St. Kitts and Nevis, and St. Vincent and the Grenadines passed the Caribbean Community Skilled Nationals Act in 1997. CARICOM plans to develop a Skills Register after the completion of the US Department of Labor (USDOL) Labor Market Information System and Labor Exchange Project, which Member States signed and will execute bilaterally with the USDOL. In the interim, member states agreed to advertise vacancies regionally so that skilled persons from the region can apply. Despite the absence of legislation, significant intra-regional migration of teachers, nurses, police and other non-degree professionals and para-professionals exists today.
243
Throughout the Caribbean, all skilled and unskilled immigrants require work permits in order to work in the host country, subject to the absence of qualified/competent nationals. Work permits have to be requested by the company or organization hiring the migrant and associated fees paid.192 Procedures are repeated on an annual basis until the applicant becomes a citizen of the country.193
192 Fees for immigration into St. Lucia range from EC$2,000 for Commonwealth Caribbean or CARICOM nationals, EC$4,000/year for Canadians, and EC$5,000/year for US citizens, Mexicans, Cubans, and Venezuelans (St. Lucia, Ministry of Labour Relations, unpublished data). 193 In St. Lucia, the only persons exempted from obtaining work permits are nurses and teachers.

244
Annex Table 6.1: Employment in the Caribbean 1991-2001 (thousands)
Country 1990 1991 1992 1993 1994 1995 1996 1997 1998 1999 2000 2001 Average Growth
Antigua and Barbuda
27.8
Barbados 113.3 107.1 101.7 100.4 105.6 110.1 114.4 116.4 121.8 124.9 128.8 130.8 2.0% Belize 62.1 62.4 62.6 65 70.7 73.3 77.7 3.8% Dominica 23.8 25.7 28 2.3% Dominican Republic
2251.7 2406.4 2416.6 2400.6 2400.7 2523.8 2652.0 2889.0 2979.5 3190.5 3176.5 3.5%
Grenada 23.9 30.4 35 34.8 5.5% Guyana 245.5 239.8 -0.5% Jamaica 896.3 907.7 905.7 906.3 923.1 963.3 959.8 946.9 953.6 943.9 933.5 939.4 0.3% St. Kitts & Nevis
16.9 16.2 -0.4%
St. Lucia 52.5 52.3 55.9 56.7 55.9 56.4 59.8 63.5 2.8% St. Vincent and Grenadines
33.4 34.5
Suriname 87.9 79.1 77.9 82.4 87.2 82.8 88.2 0.1% Trinidad and Tobago
374.1 401 405.9 404.6 415.6 431.6 444.2 459.8 479.3 489.4 503.4 514.1 2.5%
Source: ILO Digest of Caribbean Labor Statistics, Dominican Republic Central Bank
Annex Table 6.2: Comparative Annual Salaries of Selected Occupations in the Caribbean, 2000/1 (US$)
Cabinet Minister Clerk of Parliament Secondary School Teacher Senior Lawyer in Civil Service
Country Nominal GNP/cap weighted
Nominal GNP/cap weighted
Nominal GNP/cap weighted
Nominal GNP/cap weighted
Antigua and Barbuda 44,445 5.2 20,097 2.3 11,843 1.4 23,925 2.8 Belize 14,619 4.6 25,334 7.9 7,584 2.4 21,084 6.6 Dominica 19,555 5.8 14,855 4.4 9,529 2.8 19.31 0.0 Grenada 19,778 5.6 19,444 5.5 10,298 2.9 16,484 4.7 Jamaica 37,005 13.7 42,055 15.5 9,697 - 10,837
3.5-4.0 33,675 – 42,056
12.4-15.5
St. Lucia 34,497 9.1 21,118 5.6 13,597 – 16,836
3.6-4.4
32,000 8.5
St. Vincent and the Grenadines
24,983 8.4 18,298 6.2 13,682 4.6 26,809 9.1
Trinidad and Tobago 23,568 3.9 22,448 3.7 11,210 1.9 15,220 2.5 N.B. In some cases, the given hourly or weekly rates are annualized using a 40 hour week and a 52 week year Source: Commonwealth Parliamentary Association: Commonwealth Parliamentary Salaries and Allowances 2000-2001; WDI
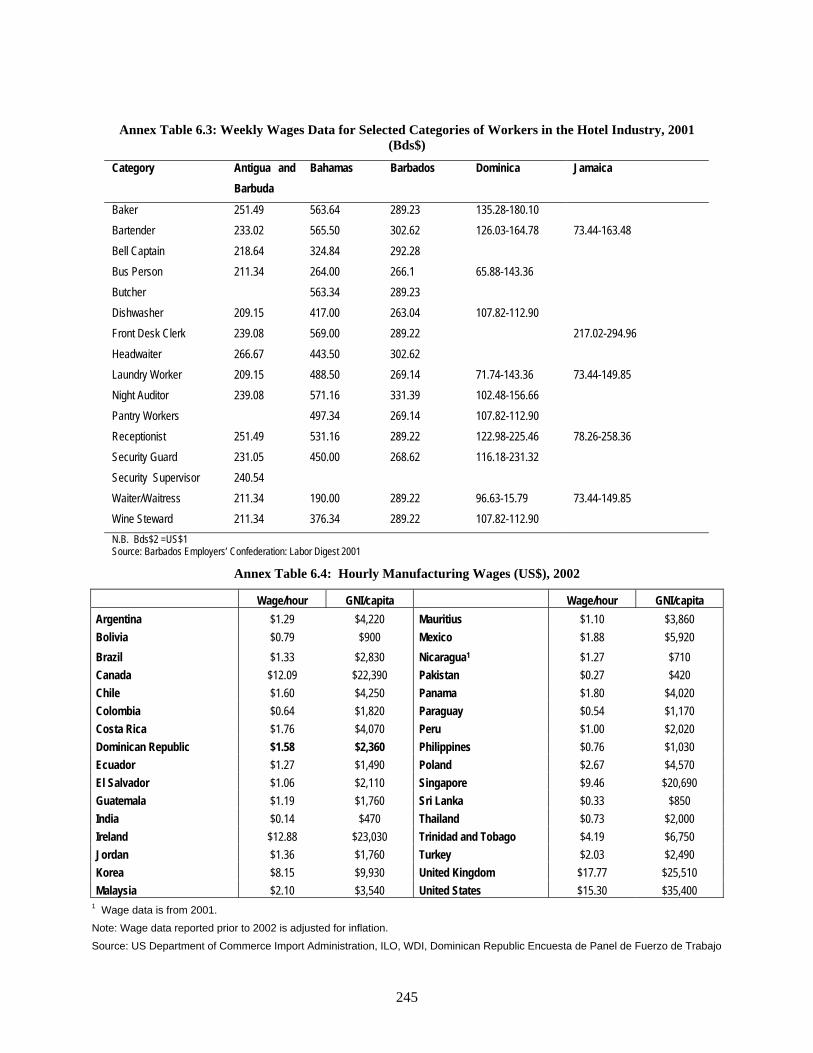
245
Annex Table 6.3: Weekly Wages Data for Selected Categories of Workers in the Hotel Industry, 2001 (Bds$)
Category Antigua and Barbuda
Bahamas Barbados Dominica Jamaica
Baker 251.49 563.64 289.23 135.28-180.10 Bartender 233.02 565.50 302.62 126.03-164.78 73.44-163.48 Bell Captain 218.64 324.84 292.28 Bus Person 211.34 264.00 266.1 65.88-143.36 Butcher 563.34 289.23 Dishwasher 209.15 417.00 263.04 107.82-112.90 Front Desk Clerk 239.08 569.00 289.22 217.02-294.96 Headwaiter 266.67 443.50 302.62 Laundry Worker 209.15 488.50 269.14 71.74-143.36 73.44-149.85 Night Auditor 239.08 571.16 331.39 102.48-156.66 Pantry Workers 497.34 269.14 107.82-112.90 Receptionist 251.49 531.16 289.22 122.98-225.46 78.26-258.36 Security Guard 231.05 450.00 268.62 116.18-231.32 Security Supervisor 240.54 Waiter/Waitress 211.34 190.00 289.22 96.63-15.79 73.44-149.85 Wine Steward 211.34 376.34 289.22 107.82-112.90 N.B. Bds$2 =US$1 Source: Barbados Employers’ Confederation: Labor Digest 2001
Annex Table 6.4: Hourly Manufacturing Wages (US$), 2002
Wage/hour GNI/capita Wage/hour GNI/capita Argentina $1.29 $4,220 Mauritius $1.10 $3,860 Bolivia $0.79 $900 Mexico $1.88 $5,920 Brazil $1.33 $2,830 Nicaragua1 $1.27 $710 Canada $12.09 $22,390 Pakistan $0.27 $420 Chile $1.60 $4,250 Panama $1.80 $4,020 Colombia $0.64 $1,820 Paraguay $0.54 $1,170 Costa Rica $1.76 $4,070 Peru $1.00 $2,020 Dominican Republic $1.58 $2,360 Philippines $0.76 $1,030 Ecuador $1.27 $1,490 Poland $2.67 $4,570 El Salvador $1.06 $2,110 Singapore $9.46 $20,690 Guatemala $1.19 $1,760 Sri Lanka $0.33 $850 India $0.14 $470 Thailand $0.73 $2,000 Ireland $12.88 $23,030 Trinidad and Tobago $4.19 $6,750 Jordan $1.36 $1,760 Turkey $2.03 $2,490 Korea $8.15 $9,930 United Kingdom $17.77 $25,510 Malaysia $2.10 $3,540 United States $15.30 $35,400
1 Wage data is from 2001.
Note: Wage data reported prior to 2002 is adjusted for inflation.
Source: US Department of Commerce Import Administration, ILO, WDI, Dominican Republic Encuesta de Panel de Fuerzo de Trabajo
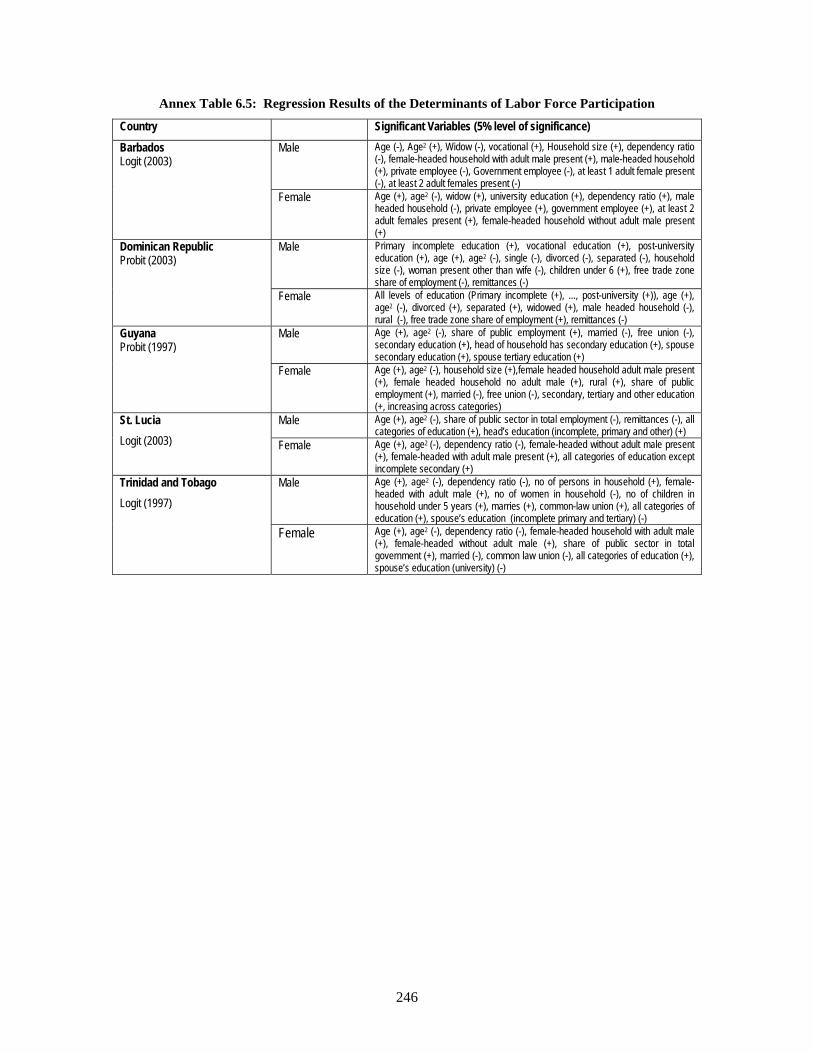
246
Annex Table 6.5: Regression Results of the Determinants of Labor Force Participation
Country Significant Variables (5% level of significance)
Male Age (-), Age2 (+), Widow (-), vocational (+), Household size (+), dependency ratio (-), female-headed household with adult male present (+), male-headed household (+), private employee (-), Government employee (-), at least 1 adult female present (-), at least 2 adult females present (-)
Barbados Logit (2003)
Female Age (+), age2 (-), widow (+), university education (+), dependency ratio (+), male headed household (-), private employee (+), government employee (+), at least 2 adult females present (+), female-headed household without adult male present (+)
Male Primary incomplete education (+), vocational education (+), post-university education (+), age (+), age2 (-), single (-), divorced (-), separated (-), household size (-), woman present other than wife (-), children under 6 (+), free trade zone share of employment (-), remittances (-)
Dominican Republic Probit (2003)
Female All levels of education (Primary incomplete (+), ..., post-university (+)), age (+), age2 (-), divorced (+), separated (+), widowed (+), male headed household (-), rural (-), free trade zone share of employment (+), remittances (-)
Male Age (+), age2 (-), share of public employment (+), married (-), free union (-), secondary education (+), head of household has secondary education (+), spouse secondary education (+), spouse tertiary education (+)
Guyana Probit (1997)
Female Age (+), age2 (-), household size (+),female headed household adult male present (+), female headed household no adult male (+), rural (+), share of public employment (+), married (-), free union (-), secondary, tertiary and other education (+, increasing across categories)
Male Age (+), age2 (-), share of public sector in total employment (-), remittances (-), all categories of education (+), head’s education (incomplete, primary and other) (+)
St. Lucia Logit (2003) Female Age (+), age2 (-), dependency ratio (-), female-headed without adult male present
(+), female-headed with adult male present (+), all categories of education except incomplete secondary (+)
Male Age (+), age2 (-), dependency ratio (-), no of persons in household (+), female-headed with adult male (+), no of women in household (-), no of children in household under 5 years (+), marries (+), common-law union (+), all categories of education (+), spouse’s education (incomplete primary and tertiary) (-)
Trinidad and Tobago Logit (1997)
Female Age (+), age2 (-), dependency ratio (-), female-headed household with adult male (+), female-headed without adult male (+), share of public sector in total government (+), married (-), common law union (-), all categories of education (+), spouse’s education (university) (-)
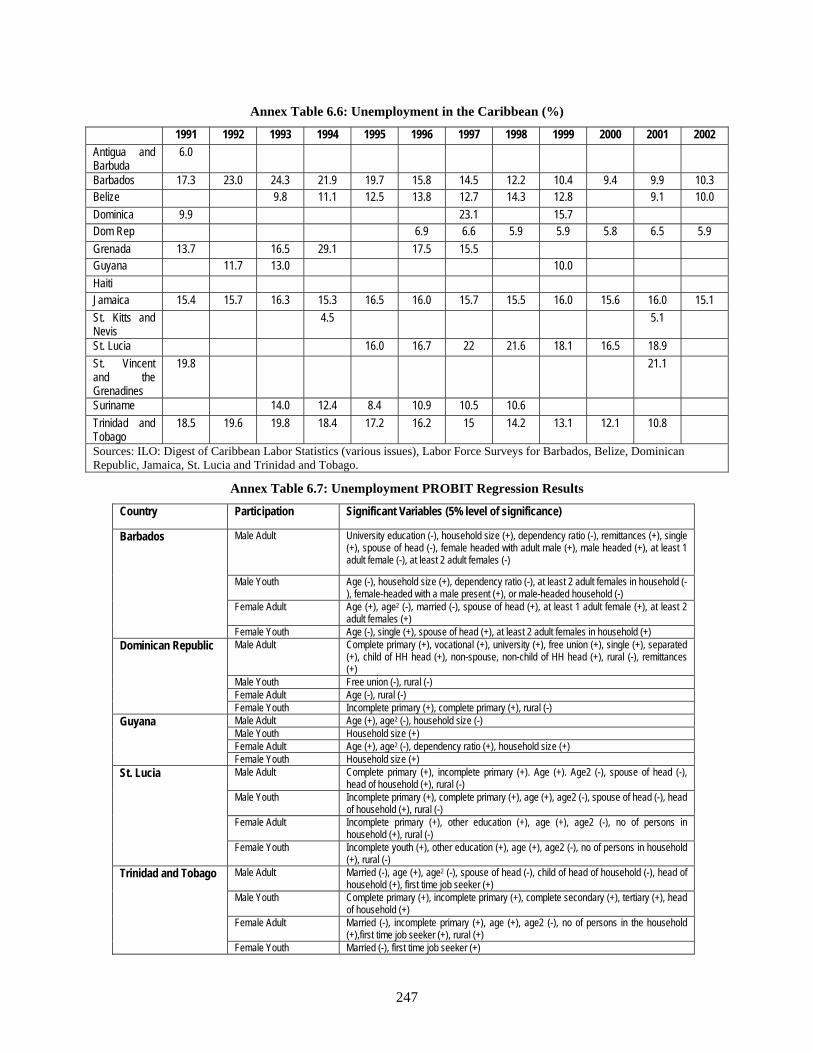
247
Annex Table 6.6: Unemployment in the Caribbean (%) 1991 1992 1993 1994 1995 1996 1997 1998 1999 2000 2001 2002
Antigua and Barbuda
6.0
Barbados 17.3 23.0 24.3 21.9 19.7 15.8 14.5 12.2 10.4 9.4 9.9 10.3 Belize 9.8 11.1 12.5 13.8 12.7 14.3 12.8 9.1 10.0 Dominica 9.9 23.1 15.7 Dom Rep 6.9 6.6 5.9 5.9 5.8 6.5 5.9 Grenada 13.7 16.5 29.1 17.5 15.5 Guyana 11.7 13.0 10.0 Haiti Jamaica 15.4 15.7 16.3 15.3 16.5 16.0 15.7 15.5 16.0 15.6 16.0 15.1 St. Kitts and Nevis
4.5 5.1
St. Lucia 16.0 16.7 22 21.6 18.1 16.5 18.9 St. Vincent and the Grenadines
19.8 21.1
Suriname 14.0 12.4 8.4 10.9 10.5 10.6 Trinidad and Tobago
18.5 19.6 19.8 18.4 17.2 16.2 15 14.2 13.1 12.1 10.8
Sources: ILO: Digest of Caribbean Labor Statistics (various issues), Labor Force Surveys for Barbados, Belize, Dominican Republic, Jamaica, St. Lucia and Trinidad and Tobago.
Annex Table 6.7: Unemployment PROBIT Regression Results
Country Participation Significant Variables (5% level of significance)
Male Adult University education (-), household size (+), dependency ratio (-), remittances (+), single (+), spouse of head (-), female headed with adult male (+), male headed (+), at least 1 adult female (-), at least 2 adult females (-)
Male Youth Age (-), household size (+), dependency ratio (-), at least 2 adult females in household (-), female-headed with a male present (+), or male-headed household (-)
Female Adult Age (+), age2 (-), married (-), spouse of head (+), at least 1 adult female (+), at least 2 adult females (+)
Barbados
Female Youth Age (-), single (+), spouse of head (+), at least 2 adult females in household (+) Male Adult Complete primary (+), vocational (+), university (+), free union (+), single (+), separated
(+), child of HH head (+), non-spouse, non-child of HH head (+), rural (-), remittances (+)
Male Youth Free union (-), rural (-) Female Adult Age (-), rural (-)
Dominican Republic
Female Youth Incomplete primary (+), complete primary (+), rural (-) Male Adult Age (+), age2 (-), household size (-) Male Youth Household size (+) Female Adult Age (+), age2 (-), dependency ratio (+), household size (+)
Guyana
Female Youth Household size (+) Male Adult Complete primary (+), incomplete primary (+). Age (+). Age2 (-), spouse of head (-),
head of household (+), rural (-) Male Youth Incomplete primary (+), complete primary (+), age (+), age2 (-), spouse of head (-), head
of household (+), rural (-) Female Adult Incomplete primary (+), other education (+), age (+), age2 (-), no of persons in
household (+), rural (-)
St. Lucia
Female Youth Incomplete youth (+), other education (+), age (+), age2 (-), no of persons in household (+), rural (-)
Male Adult Married (-), age (+), age2 (-), spouse of head (-), child of head of household (-), head of household (+), first time job seeker (+)
Male Youth Complete primary (+), incomplete primary (+), complete secondary (+), tertiary (+), head of household (+)
Female Adult Married (-), incomplete primary (+), age (+), age2 (-), no of persons in the household (+),first time job seeker (+), rural (+)
Trinidad and Tobago
Female Youth Married (-), first time job seeker (+)
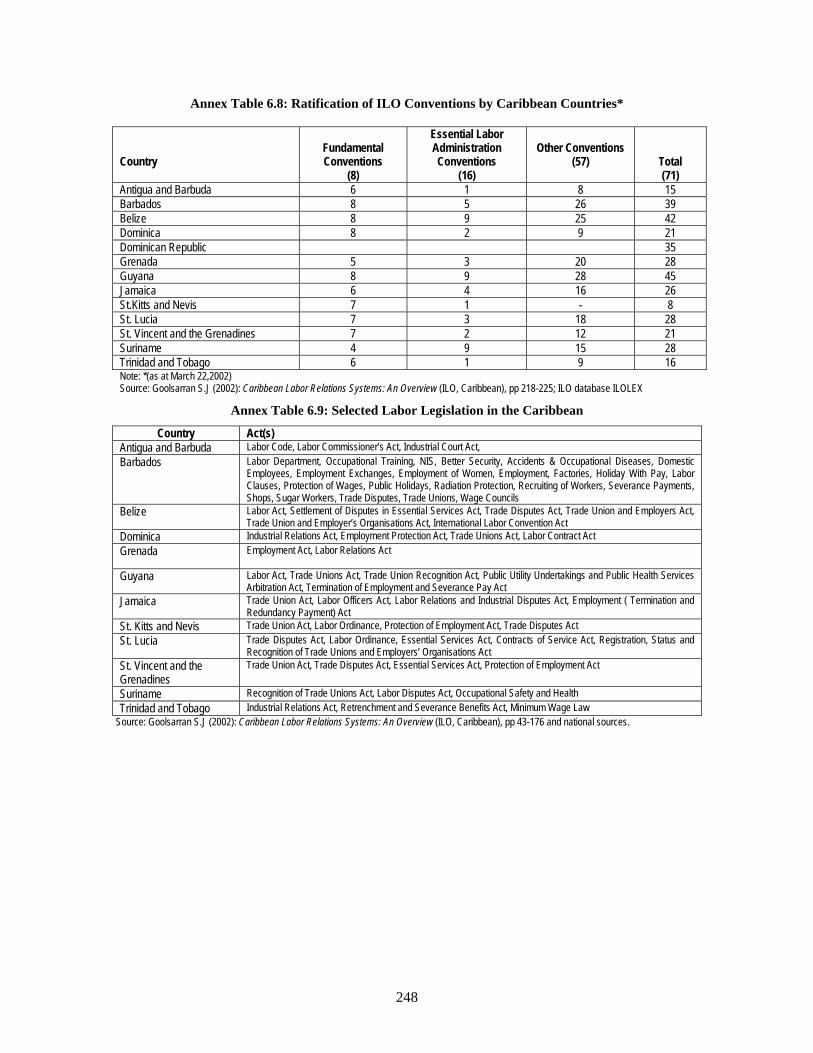
248
Annex Table 6.8: Ratification of ILO Conventions by Caribbean Countries*
Note: *(as at March 22,2002) Source: Goolsarran S.J (2002): Caribbean Labor Relations Systems: An Overview (ILO, Caribbean), pp 218-225; ILO database ILOLEX
Annex Table 6.9: Selected Labor Legislation in the Caribbean
Country Act(s) Antigua and Barbuda Labor Code, Labor Commissioner’s Act, Industrial Court Act, Barbados Labor Department, Occupational Training, NIS, Better Security, Accidents & Occupational Diseases, Domestic
Employees, Employment Exchanges, Employment of Women, Employment, Factories, Holiday With Pay, Labor Clauses, Protection of Wages, Public Holidays, Radiation Protection, Recruiting of Workers, Severance Payments, Shops, Sugar Workers, Trade Disputes, Trade Unions, Wage Councils
Belize Labor Act, Settlement of Disputes in Essential Services Act, Trade Disputes Act, Trade Union and Employers Act, Trade Union and Employer’s Organisations Act, International Labor Convention Act
Dominica Industrial Relations Act, Employment Protection Act, Trade Unions Act, Labor Contract Act Grenada Employment Act, Labor Relations Act
Guyana Labor Act, Trade Unions Act, Trade Union Recognition Act, Public Utility Undertakings and Public Health Services
Arbitration Act, Termination of Employment and Severance Pay Act Jamaica Trade Union Act, Labor Officers Act, Labor Relations and Industrial Disputes Act, Employment ( Termination and
Redundancy Payment) Act St. Kitts and Nevis Trade Union Act, Labor Ordinance, Protection of Employment Act, Trade Disputes Act St. Lucia Trade Disputes Act, Labor Ordinance, Essential Services Act, Contracts of Service Act, Registration, Status and
Recognition of Trade Unions and Employers’ Organisations Act St. Vincent and the Grenadines
Trade Union Act, Trade Disputes Act, Essential Services Act, Protection of Employment Act
Suriname Recognition of Trade Unions Act, Labor Disputes Act, Occupational Safety and Health Trinidad and Tobago Industrial Relations Act, Retrenchment and Severance Benefits Act, Minimum Wage Law
Source: Goolsarran S.J (2002): Caribbean Labor Relations Systems: An Overview (ILO, Caribbean), pp 43-176 and national sources.
Country
Fundamental Conventions
(8)
Essential Labor Administration Conventions
(16)
Other Conventions
(57)
Total (71)
Antigua and Barbuda 6 1 8 15 Barbados 8 5 26 39 Belize 8 9 25 42 Dominica 8 2 9 21 Dominican Republic 35 Grenada 5 3 20 28 Guyana 8 9 28 45 Jamaica 6 4 16 26 St.Kitts and Nevis 7 1 - 8 St. Lucia 7 3 18 28 St. Vincent and the Grenadines 7 2 12 21 Suriname 4 9 15 28 Trinidad and Tobago 6 1 9 16
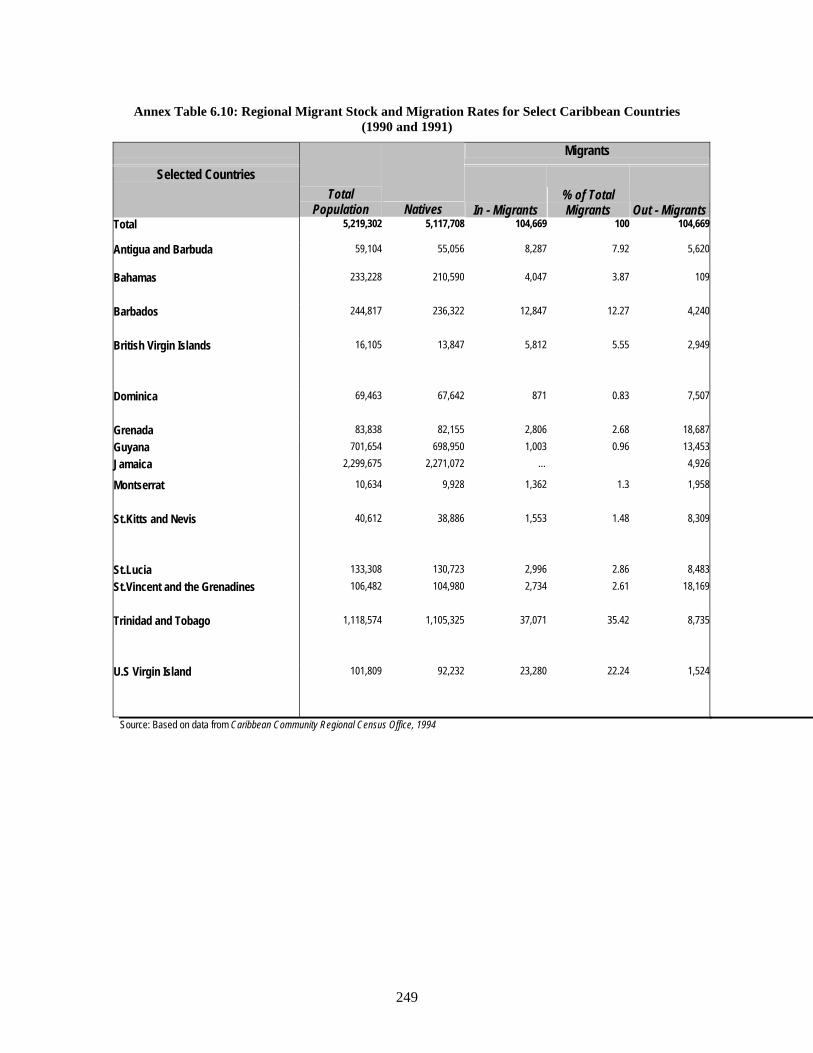
249
Annex Table 6.10: Regional Migrant Stock and Migration Rates for Select Caribbean Countries (1990 and 1991)
Migrants
Selected Countries Total
Population Natives In - Migrants % of Total Migrants Out - Migrants
Total 5,219,302 5,117,708 104,669 100 104,669
Antigua and Barbuda 59,104 55,056 8,287 7.92 5,620
Bahamas 233,228 210,590 4,047 3.87 109
Barbados 244,817 236,322 12,847 12.27 4,240
British Virgin Islands 16,105 13,847 5,812 5.55 2,949
Dominica 69,463 67,642 871 0.83 7,507
Grenada 83,838 82,155 2,806 2.68 18,687Guyana 701,654 698,950 1,003 0.96 13,453Jamaica 2,299,675 2,271,072 … 4,926
Montserrat 10,634 9,928 1,362 1.3 1,958
St.Kitts and Nevis 40,612 38,886 1,553 1.48 8,309
St.Lucia 133,308 130,723 2,996 2.86 8,483St.Vincent and the Grenadines 106,482 104,980 2,734 2.61 18,169
Trinidad and Tobago 1,118,574 1,105,325 37,071 35.42 8,735
U.S Virgin Island 101,809 92,232 23,280 22.24 1,524
Source: Based on data from Caribbean Community Regional Census Office, 1994
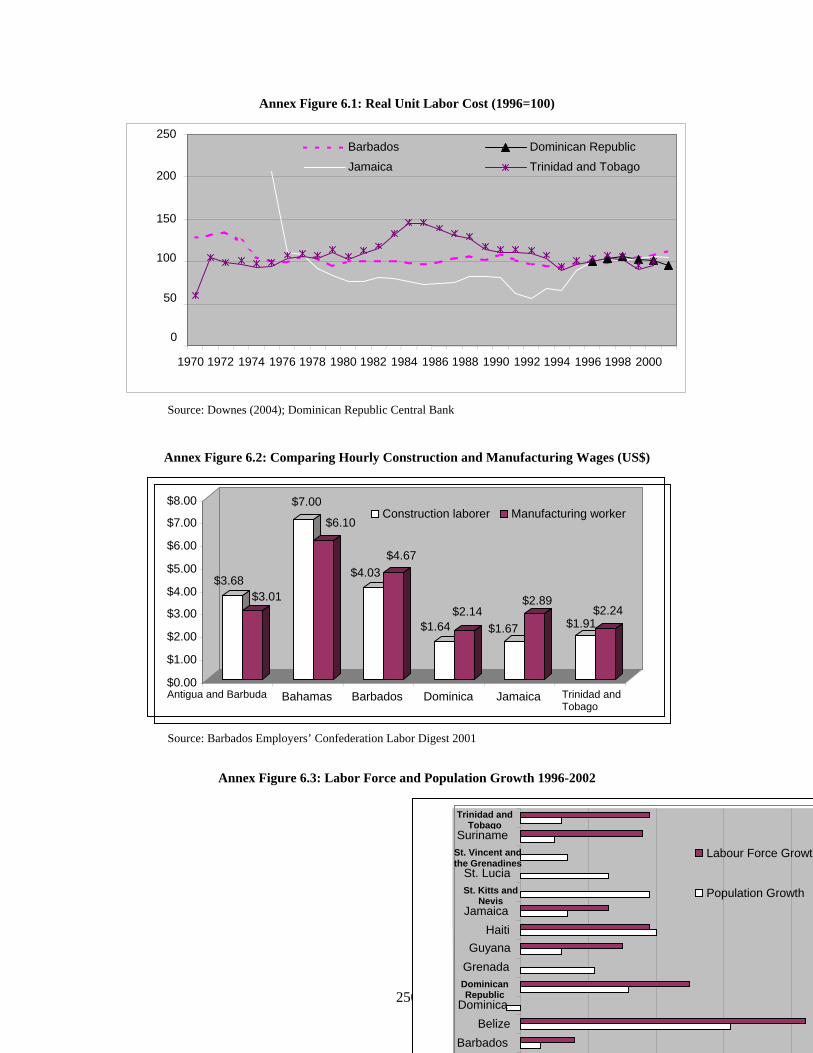
250
Annex Figure 6.1: Real Unit Labor Cost (1996=100)
Source: Downes (2004); Dominican Republic Central Bank
Annex Figure 6.2: Comparing Hourly Construction and Manufacturing Wages (US$)
Source: Barbados Employers’ Confederation Labor Digest 2001
Annex Figure 6.3: Labor Force and Population Growth 1996-2002
0
50
100
150
200
250
1970 1972 1974 1976 1978 1980 1982 1984 1986 1988 1990 1992 1994 1996 1998 2000
Barbados Dominican Republic Jamaica Trinidad and Tobago
BarbadosBelize
Dominica
Dominican Republic
GrenadaGuyana
HaitiJamaica
St. Kitts and Nevis
St. Lucia
St. Vincent andthe Grenadines
Suriname
Trinidad andTobago
Labour Force Growth
Population Growth
$3.68$3.01
$7.00 $6.10
$4.03$4.67
$1.64$2.14
$1.67
$2.89
$1.91 $2.24
$0.00 $1.00 $2.00 $3.00 $4.00 $5.00 $6.00 $7.00 $8.00
Antigua and Barbuda Bahamas Barbados Dominica Jamaica Trinidad and Tobago
Construction laborer Manufacturing worker

251
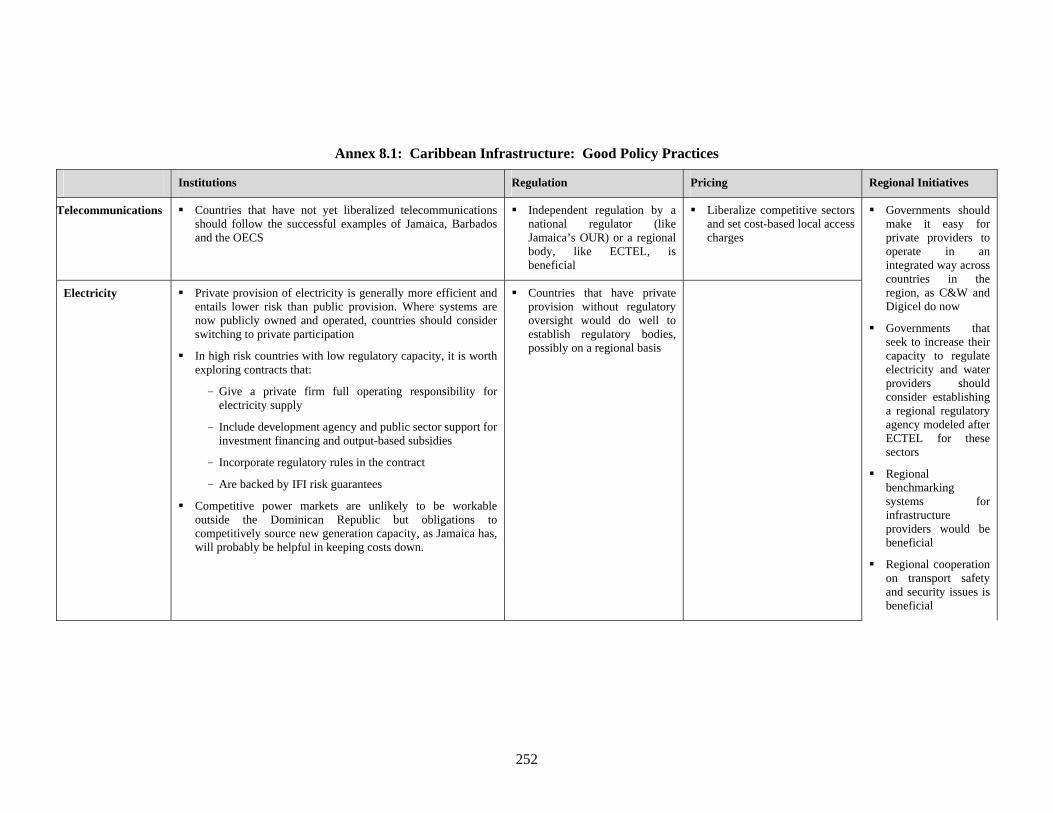
252
Annex 8.1: Caribbean Infrastructure: Good Policy Practices
Institutions Regulation Pricing Regional Initiatives
Telecommunications Countries that have not yet liberalized telecommunications should follow the successful examples of Jamaica, Barbados and the OECS
Independent regulation by a national regulator (like Jamaica’s OUR) or a regional body, like ECTEL, is beneficial
Liberalize competitive sectors and set cost-based local access charges
Electricity Private provision of electricity is generally more efficient and entails lower risk than public provision. Where systems are now publicly owned and operated, countries should consider switching to private participation
In high risk countries with low regulatory capacity, it is worth exploring contracts that:
- Give a private firm full operating responsibility for electricity supply
- Include development agency and public sector support for investment financing and output-based subsidies
- Incorporate regulatory rules in the contract
- Are backed by IFI risk guarantees
Competitive power markets are unlikely to be workable outside the Dominican Republic but obligations to competitively source new generation capacity, as Jamaica has, will probably be helpful in keeping costs down.
Countries that have private provision without regulatory oversight would do well to establish regulatory bodies, possibly on a regional basis
Governments should make it easy for private providers to operate in an integrated way across countries in the region, as C&W and Digicel do now
Governments that seek to increase their capacity to regulate electricity and water providers should consider establishing a regional regulatory agency modeled after ECTEL for these sectors
Regional benchmarking systems for infrastructure providers would be beneficial
Regional cooperation on transport safety and security issues is beneficial
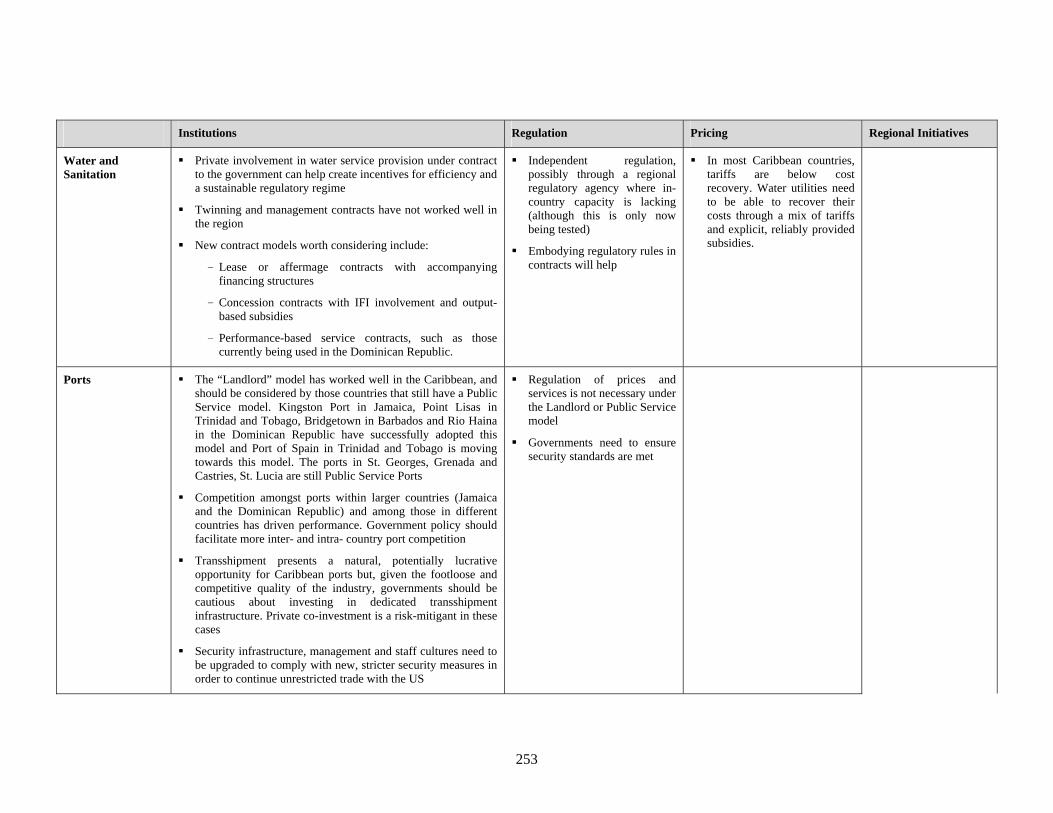
253
Institutions Regulation Pricing Regional Initiatives
Water and Sanitation
Private involvement in water service provision under contract to the government can help create incentives for efficiency and a sustainable regulatory regime
Twinning and management contracts have not worked well in the region
New contract models worth considering include:
- Lease or affermage contracts with accompanying financing structures
- Concession contracts with IFI involvement and output-based subsidies
- Performance-based service contracts, such as those currently being used in the Dominican Republic.
Independent regulation, possibly through a regional regulatory agency where in-country capacity is lacking (although this is only now being tested)
Embodying regulatory rules in contracts will help
In most Caribbean countries, tariffs are below cost recovery. Water utilities need to be able to recover their costs through a mix of tariffs and explicit, reliably provided subsidies.
Ports The “Landlord” model has worked well in the Caribbean, and should be considered by those countries that still have a Public Service model. Kingston Port in Jamaica, Point Lisas in Trinidad and Tobago, Bridgetown in Barbados and Rio Haina in the Dominican Republic have successfully adopted this model and Port of Spain in Trinidad and Tobago is moving towards this model. The ports in St. Georges, Grenada and Castries, St. Lucia are still Public Service Ports
Competition amongst ports within larger countries (Jamaica and the Dominican Republic) and among those in different countries has driven performance. Government policy should facilitate more inter- and intra- country port competition
Transshipment presents a natural, potentially lucrative opportunity for Caribbean ports but, given the footloose and competitive quality of the industry, governments should be cautious about investing in dedicated transshipment infrastructure. Private co-investment is a risk-mitigant in these cases
Security infrastructure, management and staff cultures need to be upgraded to comply with new, stricter security measures in order to continue unrestricted trade with the US
Regulation of prices and services is not necessary under the Landlord or Public Service model
Governments need to ensure security standards are met
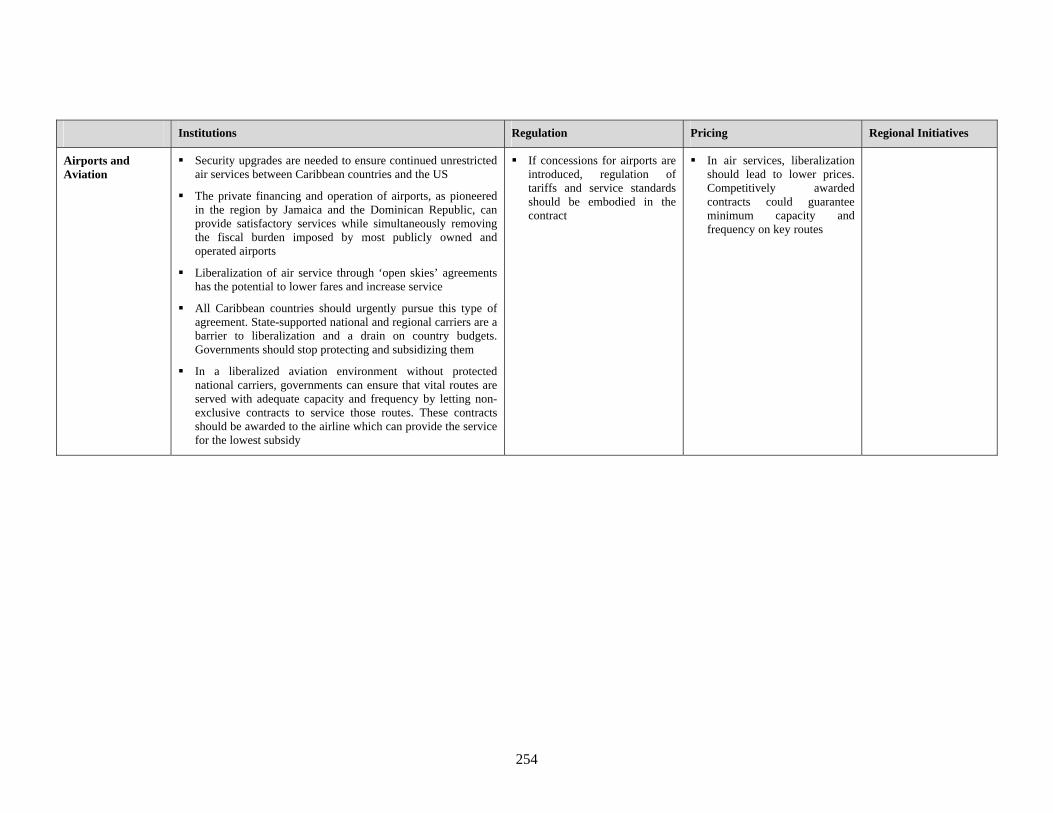
254
Institutions Regulation Pricing Regional Initiatives
Airports and Aviation
Security upgrades are needed to ensure continued unrestricted air services between Caribbean countries and the US
The private financing and operation of airports, as pioneered in the region by Jamaica and the Dominican Republic, can provide satisfactory services while simultaneously removing the fiscal burden imposed by most publicly owned and operated airports
Liberalization of air service through ‘open skies’ agreements has the potential to lower fares and increase service
All Caribbean countries should urgently pursue this type of agreement. State-supported national and regional carriers are a barrier to liberalization and a drain on country budgets. Governments should stop protecting and subsidizing them
In a liberalized aviation environment without protected national carriers, governments can ensure that vital routes are served with adequate capacity and frequency by letting non-exclusive contracts to service those routes. These contracts should be awarded to the airline which can provide the service for the lowest subsidy
If concessions for airports are introduced, regulation of tariffs and service standards should be embodied in the contract
In air services, liberalization should lead to lower prices. Competitively awarded contracts could guarantee minimum capacity and frequency on key routes
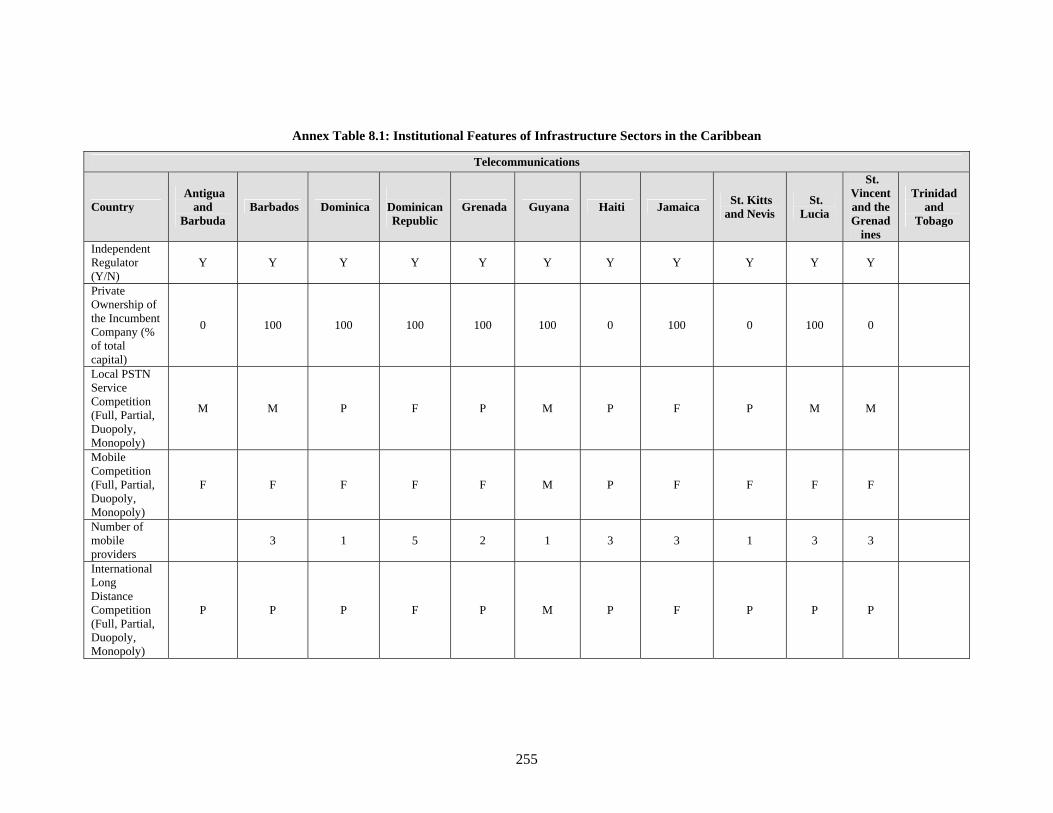
255
Annex Table 8.1: Institutional Features of Infrastructure Sectors in the Caribbean
Telecommunications
Country Antigua
and Barbuda
Barbados Dominica
Dominican Republic
Grenada Guyana Haiti Jamaica St. Kitts and Nevis
St. Lucia
St. Vincent and the Grenad
ines
Trinidad and
Tobago
Independent Regulator (Y/N)
Y Y Y Y Y Y Y Y Y Y Y
Private Ownership of the Incumbent Company (% of total capital)
0 100 100 100 100 100 0 100 0 100 0
Local PSTN Service Competition (Full, Partial, Duopoly, Monopoly)
M M P F P M P F P M M
Mobile Competition (Full, Partial, Duopoly, Monopoly)
F F F F F M P F F F F
Number of mobile providers
3 1 5 2 1 3 3 1 3 3
International Long Distance Competition (Full, Partial, Duopoly, Monopoly)
P P P F P M P F P P P
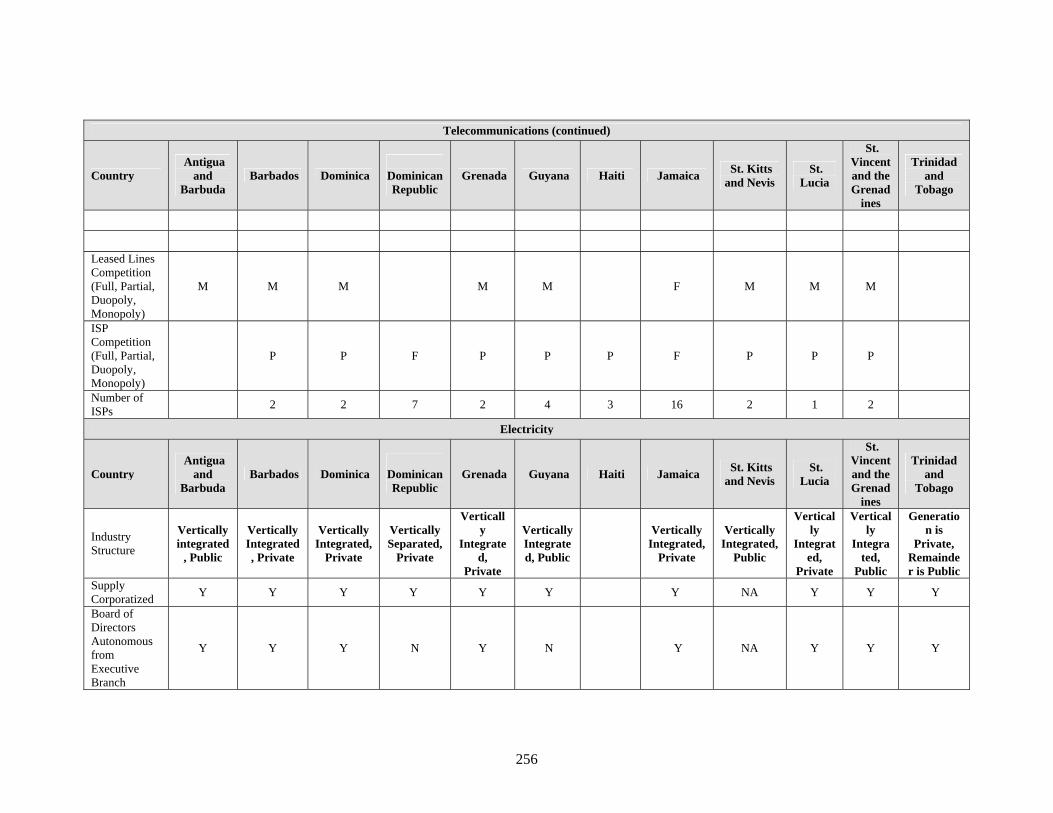
256
Telecommunications (continued)
Country Antigua
and Barbuda
Barbados Dominica
Dominican Republic
Grenada Guyana Haiti Jamaica St. Kitts and Nevis
St. Lucia
St. Vincent and the Grenad
ines
Trinidad and
Tobago
Leased Lines Competition (Full, Partial, Duopoly, Monopoly)
M M M M M F M M M
ISP Competition (Full, Partial, Duopoly, Monopoly)
P P F P P P F P P P
Number of ISPs 2 2 7 2 4 3 16 2 1 2
Electricity
Country Antigua
and Barbuda
Barbados Dominica
Dominican Republic
Grenada Guyana Haiti Jamaica St. Kitts and Nevis
St. Lucia
St. Vincent and the Grenad
ines
Trinidad and
Tobago
Industry Structure
Vertically integrated
, Public
Vertically Integrated, Private
Vertically Integrated,
Private
Vertically Separated,
Private
Vertically
Integrated,
Private
Vertically Integrated, Public
Vertically
Integrated, Private
Vertically Integrated,
Public
Vertically
Integrated,
Private
Vertically
Integrated,
Public
Generation is
Private, Remainder is Public
Supply Corporatized Y Y Y Y Y Y Y NA Y Y Y
Board of Directors Autonomous from Executive Branch
Y Y Y N Y N Y NA Y Y Y
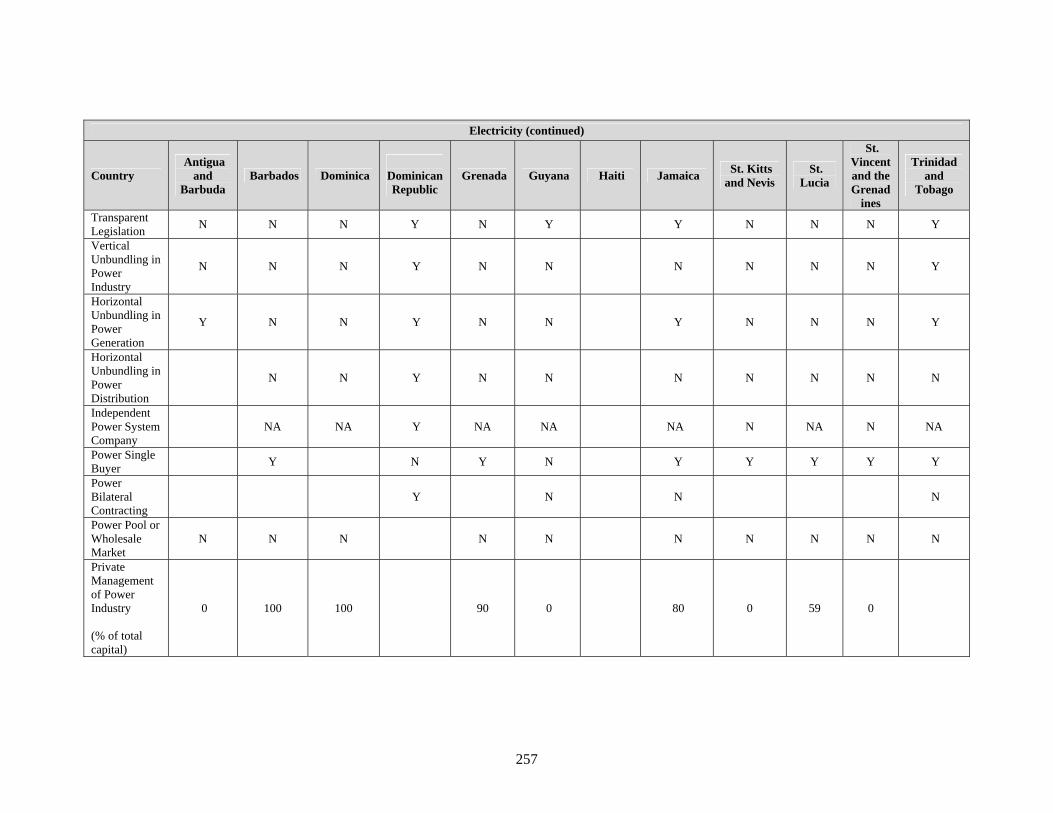
257
Electricity (continued)
Country Antigua
and Barbuda
Barbados Dominica
Dominican Republic
Grenada Guyana Haiti Jamaica St. Kitts and Nevis
St. Lucia
St. Vincent and the Grenad
ines
Trinidad and
Tobago
Transparent Legislation N N N Y N Y Y N N N Y
Vertical Unbundling in Power Industry
N N N Y N N N N N N Y
Horizontal Unbundling in Power Generation
Y N N Y N N Y N N N Y
Horizontal Unbundling in Power Distribution
N N Y N N N N N N N
Independent Power System Company
NA NA Y NA NA NA N NA N NA
Power Single Buyer Y N Y N Y Y Y Y Y
Power Bilateral Contracting
Y N N N
Power Pool or Wholesale Market
N N N N N N N N N N
Private Management of Power Industry (% of total capital)
0 100 100 90 0 80 0 59 0
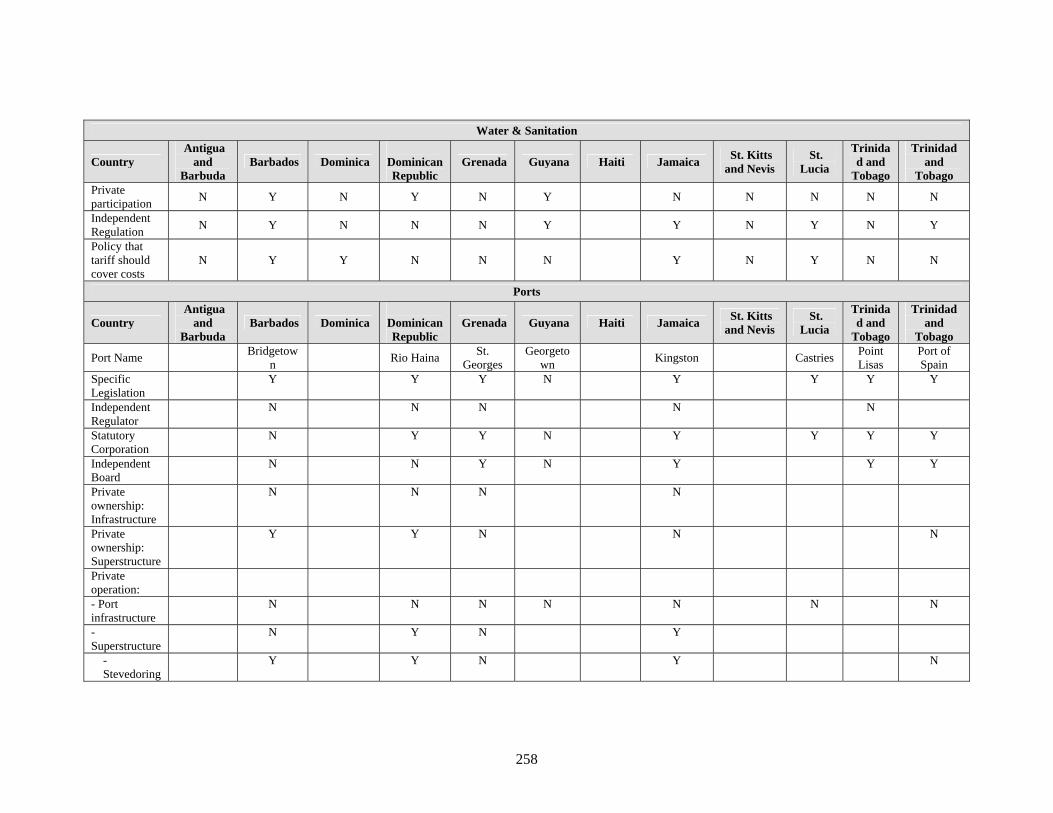
258
Water & Sanitation
Country Antigua
and Barbuda
Barbados Dominica
Dominican Republic
Grenada Guyana Haiti Jamaica St. Kitts and Nevis
St. Lucia
Trinidad and
Tobago
Trinidad and
Tobago Private participation N Y N Y N Y N N N N N
Independent Regulation N Y N N N Y Y N Y N Y
Policy that tariff should cover costs
N Y Y N N N Y N Y N N
Ports
Country Antigua
and Barbuda
Barbados Dominica
Dominican Republic
Grenada Guyana Haiti Jamaica St. Kitts and Nevis
St. Lucia
Trinidad and
Tobago
Trinidad and
Tobago
Port Name Bridgetown Rio Haina St.
Georges Georgeto
wn Kingston Castries Point Lisas
Port of Spain
Specific Legislation Y Y Y N Y Y Y Y
Independent Regulator N N N N N
Statutory Corporation N Y Y N Y Y Y Y
Independent Board N N Y N Y Y Y
Private ownership: Infrastructure
N
N N
N
Private ownership: Superstructure
Y
Y N
N
N
Private operation:
- Port infrastructure N N N N N N N
- Superstructure N Y N Y
- Stevedoring Y Y N Y N
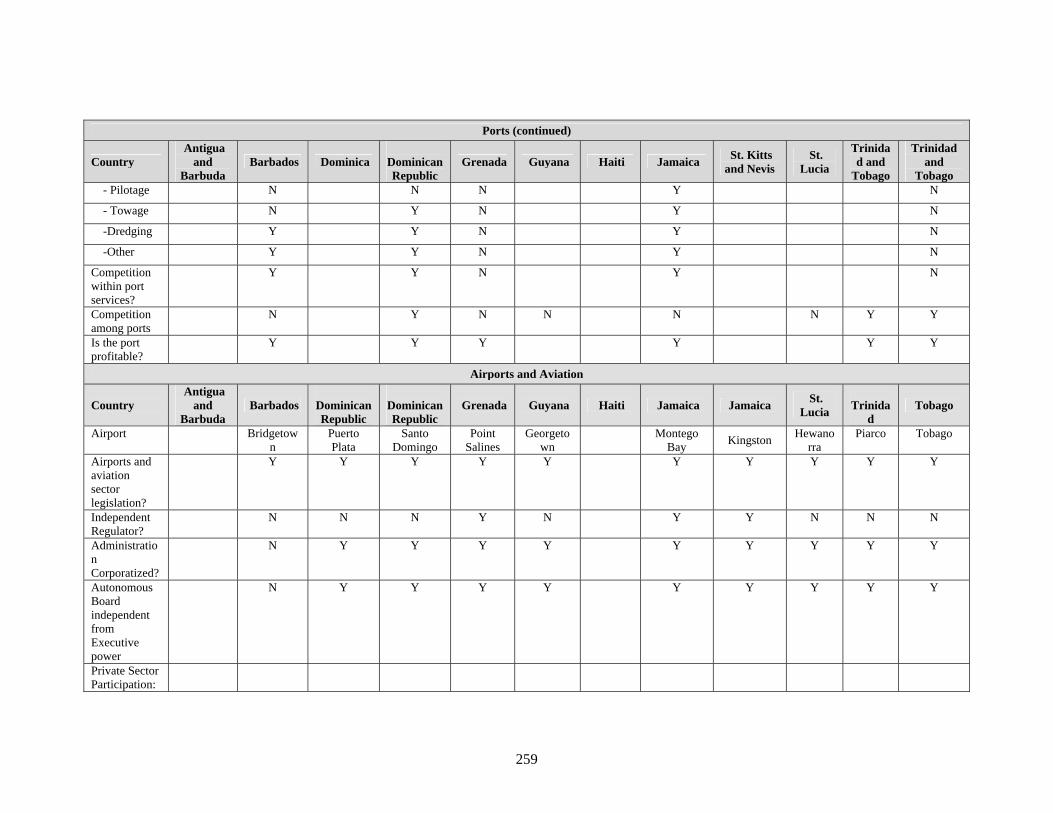
259
Ports (continued)
Country Antigua
and Barbuda
Barbados Dominica
Dominican Republic
Grenada Guyana Haiti Jamaica St. Kitts and Nevis
St. Lucia
Trinidad and
Tobago
Trinidad and
Tobago - Pilotage N N N Y N
- Towage N Y N Y N
-Dredging Y Y N Y N
-Other Y Y N Y N
Competition within port services?
Y
Y N
Y
N
Competition among ports N Y N N N N Y Y
Is the port profitable? Y Y Y Y Y Y
Airports and Aviation
Country Antigua
and Barbuda
Barbados
Dominican Republic
Dominican Republic
Grenada Guyana Haiti Jamaica Jamaica St. Lucia
Trinida
d Tobago
Airport Bridgetown
Puerto Plata
Santo Domingo
Point Salines
Georgetown Montego
Bay Kingston Hewanorra
Piarco Tobago
Airports and aviation sector legislation?
Y Y Y Y Y
Y Y Y Y Y
Independent Regulator? N N N Y N Y Y N N N
Administration Corporatized?
N Y Y Y Y
Y Y Y Y Y
Autonomous Board independent from Executive power
N Y Y Y Y
Y Y Y Y Y
Private Sector Participation:
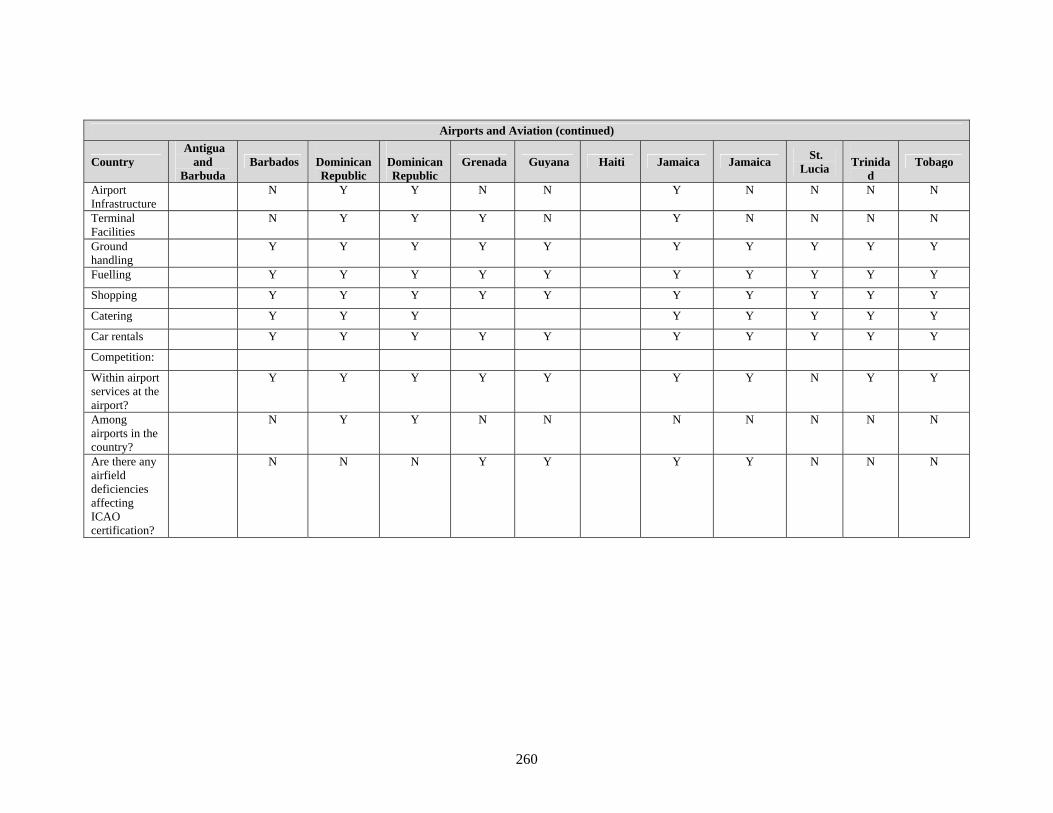
260
Airports and Aviation (continued)
Country Antigua
and Barbuda
Barbados
Dominican Republic
Dominican Republic
Grenada Guyana Haiti Jamaica Jamaica St. Lucia
Trinida
d Tobago
Airport Infrastructure N Y Y N N Y N N N N
Terminal Facilities N Y Y Y N Y N N N N
Ground handling Y Y Y Y Y Y Y Y Y Y
Fuelling Y Y Y Y Y Y Y Y Y Y
Shopping Y Y Y Y Y Y Y Y Y Y
Catering Y Y Y Y Y Y Y Y
Car rentals Y Y Y Y Y Y Y Y Y Y
Competition:
Within airport services at the airport?
Y Y Y Y Y
Y Y N Y Y
Among airports in the country?
N Y Y N N
N N N N N
Are there any airfield deficiencies affecting ICAO certification?
N N N Y Y
Y Y N N N
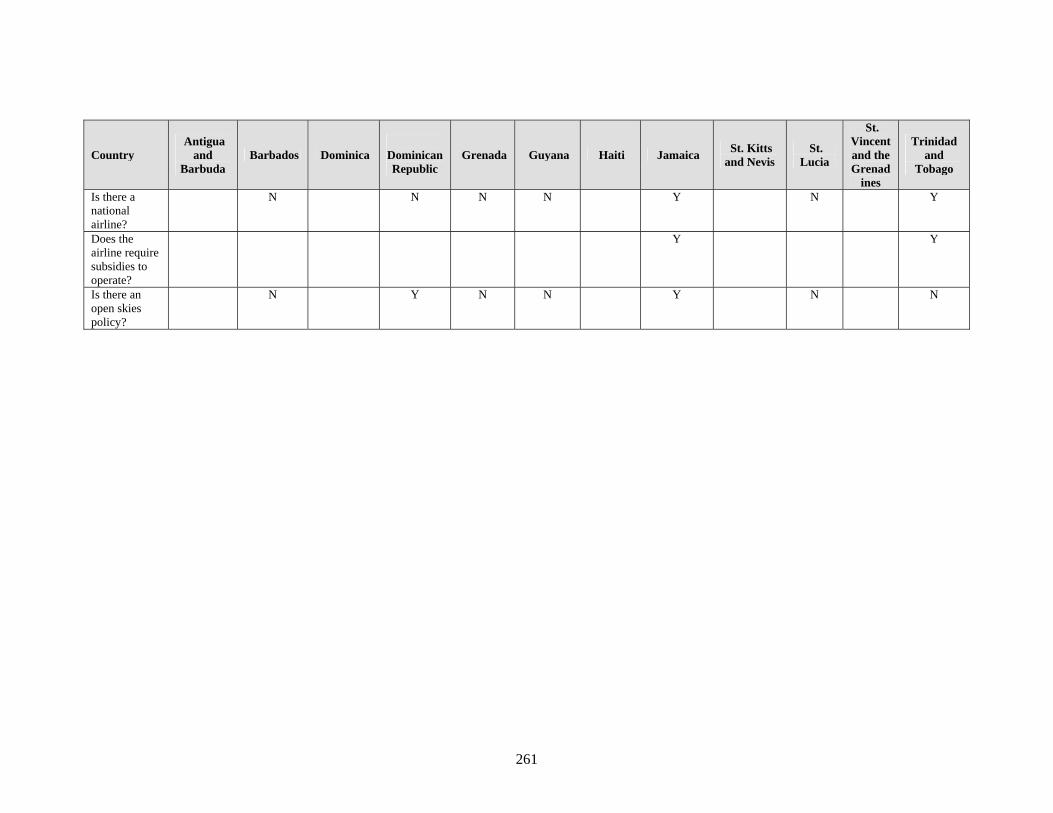
261
Country Antigua
and Barbuda
Barbados Dominica
Dominican Republic
Grenada Guyana Haiti Jamaica St. Kitts and Nevis
St. Lucia
St. Vincent and the Grenad
ines
Trinidad and
Tobago
Is there a national airline?
N
N N N
Y
N Y
Does the airline require subsidies to operate?
Y
Y
Is there an open skies policy?
N
Y N N
Y
N N

Document of the World Bank
Anna Musakova C:\Documents and Settings\wb149186\My Documents\OECS\OECS\Time to choose_report.doc 04/12/2005 3:10:00 PM