Embed Size (px)
Citation preview

Page 1 CONFIDENTIAL
September 2017 Vantiv, LLC
Confidential Information Memorandum
$600MM Incremental Revolver $1,605MM Incremental Term Loan A
$1,270,000,000 Incremental Term Loan B $761MM Term Loan B Repricing
Special Notice Regarding Publicly Available Information
THE COMPANY HAS REPRESENTED THAT THE INFORMATION CONTAINED IN THIS CONFIDENTIAL
INFORMATION MEMORANDUM IS EITHER PUBLICLY AVAILABLE OR DOES NOT CONSTITUTE MATERIAL NON-
PUBLIC INFORMATION WITH RESPECT TO THE COMPANY OR ITS SECURITIES. THE RECIPIENT OF THIS
CONFIDENTIAL INFORMATION MEMORANDUM HAS STATED THAT IT DOES NOT WISH TO RECEIVE MATERIAL
NON-PUBLIC INFORMATION WITH RESPECT TO THE COMPANY OR ITS SECURITIES AND ACKNOWLEDGES
THAT OTHER LENDERS HAVE RECEIVED A CONFIDENTIAL INFORMATION MEMORANDUM THAT CONTAINS
ADDITIONAL INFORMATION WITH RESPECT TO THE COMPANY OR ITS SECURITIES THAT MAY BE MATERIAL.
NEITHER THE COMPANY NOR THE ARRANGER TAKES ANY RESPONSIBILITY FOR THE RECIPIENT'S DECISION
TO LIMIT THE SCOPE OF THE INFORMATION IT HAS OBTAINED IN CONNECTION WITH ITS EVALUATION OF THE
COMPANY AND THE FACILITY.
Vantiv, LLC
Revolver & Term Loan A Joint Lead Arrangers
Documentation Agents
Term Loan B Joint Lead Arrangers

Page 2 CONFIDENTIAL
September 2017 Vantiv, LLC
Notice to and Undertaking by Recipients
This Confidential Information Memorandum (the "Confidential Information Memorandum") has been prepared solely for informational purposes from
information supplied by or on behalf of Vantiv, LLC. (the "Company"), and is being furnished by Morgan Stanley (the "Arranger") to you in your capacity as
a prospective lender (the "Recipient") in considering the proposed Credit Facility described in the Confidential Information Memorandum (the "Facility").
ACCEPTANCE OF THIS CONFIDENTIAL INFORMATION MEMORANDUM CONSTITUTES AN AGREEMENT TO BE BOUND BY THE TERMS OF
THIS NOTICE AND UNDERTAKING AND THE SPECIAL NOTICE SET FORTH ON THE COVER PAGE HEREOF (THE “SPECIAL NOTICE”). IF THE
RECIPIENT IS NOT WILLING TO ACCEPT THE CONFIDENTIAL INFORMATION MEMORANDUM AND OTHER EVALUATION MATERIAL (AS
DEFINED HEREIN) ON THE TERMS SET FORTH IN THIS NOTICE AND UNDERTAKING AND THE SPECIAL NOTICE, IT MUST RETURN THE
CONFIDENTIAL INFORMATION MEMORANDUM AND ANY OTHER EVALUATION MATERIAL TO THE ARRANGER IMMEDIATELY WITHOUT
MAKING ANY COPIES THEREOF, EXTRACTS THEREFROM OR USE THEREOF.
I. Confidentiality
As used herein: (a) "Evaluation Material" refers to the Confidential Information Memorandum and any other information regarding the Company or the
Facility furnished or communicated to the Recipient by or on behalf of the Company in connection with the Facility (whether prepared or communicated by
the Arranger or the Company, their respective advisors or otherwise) and (b) "Internal Evaluation Material" refers to all memoranda, notes, and other
documents and analyses developed by the Recipient using any of the information specified under the definition of Evaluation Material.
The Recipient acknowledges that the Company considers the Evaluation Material to include confidential, sensitive and proprietary information and agrees
that it shall use reasonable precautions in accordance with its established procedures to keep the Evaluation Material confidential; provided however that
(i) it may make any disclosure of such information to which the Company gives its prior written consent and (ii) any of such information may be disclosed
to it, its affiliates and their respective partners, directors, officers, employees, agents, advisors and other representatives (collectively, "Representatives")
(it being understood that such Representatives shall be informed by it of the confidential nature of such information and shall be directed by the Recipient
to treat such information in accordance with the terms of the Notice and Undertaking and the Special Notice). The Recipient agrees to be responsible for
any breach of the Notice and Undertaking or the Special Notice that results from the actions or omissions of its Representatives.
The Recipient shall be permitted to disclose the Evaluation Material in the event that it is required by law or regulation or requested by any governmental
agency or other regulatory authority (including any self-regulatory organization) or in connection with any legal proceedings. The Recipient agrees that it
will notify the Arranger as soon as practical in the event of any such disclosure (other than at the request of a regulatory authority), unless such notification
shall be prohibited by applicable law or legal process.
The Recipient shall have no obligation hereunder with respect to any Evaluation Material to the extent that such information (i) is or becomes publicly
available other than as a result of a disclosure by the Recipient in violation of this agreement, or (ii) was within the Recipient's possession prior to its being
furnished pursuant hereto or becomes available to the Recipient on a non-confidential basis from a source other than the Company or its agents, provided
that the source of such information was not known by the Recipient to be bound by a confidentiality agreement with or other contractual, legal or fiduciary
obligation of confidentiality to the Company or any other party with respect to such information.
In the event that the Recipient of the Evaluation Material decides not to participate in the transaction described herein, upon request of the Arranger, such
Recipient shall as soon as practicable return all Evaluation Material (other than Internal Evaluation Material) to the Arranger or represent in writing to the
Arranger that the Recipient has destroyed all copies of the Evaluation Material (other than Internal Evaluation Material) unless prohibited from doing so by
the Recipient's internal policies and procedures.
II. Information
The Recipient acknowledges and agrees that (i) the Arranger received the Evaluation Material from third party sources (including the Company) and it is
provided to the Recipient for informational purposes, (ii) the Arranger and its affiliates bear no responsibility (and shall not be liable) for the accuracy or
completeness (or lack thereof) of the Evaluation Material or any information contained therein, (iii) no representation regarding the Evaluation Material is
made by the Arranger or any of its affiliates, (iv) neither the Arranger nor any of its affiliates has made any independent verification as to the accuracy or
completeness of the Evaluation Material, and (v) the Arranger and its affiliates shall have no obligation to update or supplement any Evaluation Material
or otherwise provide additional information.
The Evaluation Material has been prepared to assist interested parties in making their own evaluation of the Company and the Facility and does not
purport to be all-inclusive or to contain all of the information that a prospective participant may consider material or desirable in making its decision
to become a lender. Each Recipient of the information and data contained herein should take such steps as it deems necessary to assure that it has
the information it considers material or desirable in making its decision to become a lender and should perform its own independent investigation
and analysis of the Facility or the transactions contemplated thereby and the creditworthiness of the Company. The Recipient represents that it is
sophisticated and experienced in extending credit to entities similar to the Company. The information and data contained herein are not a substitute
for the Recipient's independent evaluation and analysis and should not be considered as a recommendation by the Arranger or any of its affiliates
that any Recipient enter into the Facility.
The Evaluation Material may include certain forward looking statements and projections provided by the Company. Any such statements and
projections reflect various estimates and assumptions by the Company concerning anticipated results. No representations or warranties are made
by the Company or any of its affiliates as to the accuracy of any such statements or projections. Whether or not any such forward looking
statements or projections are in fact achieved will depend upon future events some of which are not within the control of the Company. Accordingly,
actual results may vary from the projected results and such variations may be material. Statements contained herein describing documents and
agreements are summaries only and such summaries are qualified in their entirety by reference to such documents and agreements.
2

Page 3 CONFIDENTIAL
September 2017 Vantiv, LLC
III. General
It is understood that unless and until a definitive agreement regarding the Facility between the parties thereto has been executed, the Recipient will
be under no legal obligation of any kind whatsoever with respect to the Facility by virtue of this Notice and Undertaking except for the matters
specifically agreed to herein and in the Special Notice.
The Recipient agrees that money damages would not be a sufficient remedy for breach of this Notice and Undertaking or of the Special Notice, and
that in addition to all other remedies available at law or in equity, the Company and the Arranger shall be entitled to equitable relief, including
injunction and specific performance, without proof of actual damages.
This Notice and Undertaking and the Special Notice together embody the entire understanding and agreement between the Recipient and the
Arranger with respect to the Evaluation Material and the Internal Evaluation Material and supersedes all prior understandings and agreements
relating thereto. The terms and conditions of this Notice and Undertaking and the Special Notice shall apply until such time, if any, that the Recipient
becomes a party to the definitive agreements regarding the Facility, and thereafter the provisions of such definitive agreements relating to
confidentiality shall govern. If you do not enter into the Facility, the application of this Notice and Undertaking and the Special Notice shall terminate
with respect to all Evaluation Material on the date falling one year after the date of the Confidential Information Memorandum.
This Notice and Undertaking and the Special Notice shall be governed by and construed in accordance with the law of the State of New York,
without regard to principles of conflicts of law (except Section 5-1401 of the New York General Obligation Law to the extent that it mandates that the
law of the State of New York govern).
IV. No Offer or Solicitation
This Confidential Information Memorandum is not intended to and shall not constitute an offer to sell or the solicitation of an offer to sell or the
solicitation of an offer to buy any securities or a solicitation of any vote of approval, nor shall there be any sale of securities in any jurisdiction in
which such offer, solicitation or sale would be unlawful prior to registration or qualification under the securities laws of any such jurisdiction.
V. Forward-Looking Statements
This Confidential Information Memorandum contains forward-looking statements that are subject to risks and uncertainties. All statements other than
statements of historical fact or relating to present facts or current conditions included in this Confidential Information Memorandum are forward-
looking statements including any statements regarding guidance and statements of a general economic or industry specific nature. Forward-looking
statements give our current expectations and projections relating to our financial condition, results of operations, guidance, plans, objectives, future
performance and business. You can identify forward-looking statements by the fact that they do not relate strictly to historical or current facts. These
statements may include words such as “anticipate,” “estimate,” “expect,” “project,” “plan,” “intend,” “believe,” “will,” “may,” “should,” “can have,”
“likely” and other words and terms of similar meaning in connection with any discussion of the timing or nature of future operating or financial
performance or other events.
The forward-looking statements contained in this Confidential Information Memorandum are based on assumptions that we have made in light of
our industry experience and our perceptions of historical trends, current conditions, expected future developments and other factors we believe are
appropriate under the circumstances. As you review and consider information presented herein, you should understand that these statements are
not guarantees of future performance or results. They depend upon future events and are subject to risks, uncertainties (many of which are beyond
our control) and assumptions. Although we believe that these forward-looking statements are based on reasonable assumptions, you should be
aware that many factors could affect our actual future performance or results and cause them to differ materially from those anticipated in the
forward-looking statements. Certain of these factors and other risks are discussed in the filings of the Company with the U.S. Securities and
Exchange Commission (the “SEC”) and include, but are not limited to: (i) our ability to adapt to developments and change in our industry; (ii)
competition; (iii) unauthorized disclosure of data or security breaches; (iv) systems failures or interruptions; (v) our ability to expand our market
share or enter new markets; (vi) our ability to identify and complete acquisitions, joint ventures and partnerships; (vii) failure to comply with
applicable requirements of Visa, MasterCard or other payment networks or changes in those requirements; (viii) our ability to pass along fee
increases; (ix) termination of sponsorship or clearing services; (x) loss of clients or referral partners; (xi) reductions in overall consumer, business
and government spending; (xii) fraud by merchants or others; (xiii) a decline in the use of credit, debit or prepaid cards; (xiv) consolidation in the
banking and retail industries; (xv) the effects of governmental regulation or changes in laws; (xvi) outcomes of future litigation or investigations; (xvii)
uncertainties as to the timing of the transaction; (xviii) uncertainties as to whether the transaction will be completed; (xix) the possibility that
shareholders or other third parties will file lawsuits challenging the transaction; (xx) potential operating costs, customer loss and business disruption
occurring prior to completion of the transaction or if the transaction is not completed; (xxi) the effect of the announcement of the transaction on our
business relationships, operating results and business generally; (xxii) the failure to satisfy conditions to completion of the transaction, including the
receipt of all required regulatory approvals; and (xxiii) difficulty in retaining certain key employees as a result of the transaction. Should one or more
of these risks or uncertainties materialize, or should any of these assumptions prove incorrect, our actual results may vary in material respects from
those projected in these forward-looking statements. More information on potential factors that could affect the Company’s financial results and
performance is included from time to time in the “Risk Factors” and “Management’s Discussion and Analysis of Financial Condition and Results of
Operations” sections of the Company’s periodic reports filed with the SEC, including the Company’s most recently filed Annual Report on Form 10-K
and its subsequent filings with the SEC.
Any forward-looking statement made by us in this Confidential Information Memorandum speaks only as of the date of this Confidential Information
Memorandum. Factors or events that could cause our actual results to differ may emerge from time to time, and it is not possible for us to predict all
of them. We undertake no obligation to publicly update any forward-looking statement, whether as a result of new information, future developments
or otherwise, except as may be required by law.
3

Page 4 CONFIDENTIAL
September 2017 Vantiv, LLC
VI. Important Additional Information and Where to Find It
This Confidential Information Memorandum may be deemed to be solicitation material in respect of the acquisition (the “Acquisition”) of Worldpay
Group plc (“Worldpay”) by the Company, including the issuance of shares of the Company’s common stock in respect of the Acquisition. In
connection with the foregoing proposed issuance of the Company’s common stock, the Company expects to file a proxy statement on Schedule 14A
with the SEC. To the extent the Company effects the Acquisition of Worldpay as a Scheme of Arrangement under United Kingdom law, the issuance
of the Company’s common stock in the Acquisition would not be expected to require registration under the Securities Act of 1933, as amended (the
“Act”), pursuant to an exemption provided by Section 3(a)(10) under the Act. In the event that the Company determines to conduct the Acquisition
pursuant to an offer or otherwise in a manner that is not exempt from the registration requirements of the Act, it will file a registration statement with
the SEC containing a prospectus with respect to the Company’s common stock that would be issued in the Acquisition. INVESTORS AND
STOCKHOLDERS ARE URGED TO READ THE PROXY STATEMENT AND OTHER RELEVANT DOCUMENTS FILED OR TO BE FILED WITH
THE SEC CAREFULLY WHEN THEY BECOME AVAILABLE BECAUSE THEY WILL CONTAIN IMPORTANT INFORMATION ABOUT THE
COMPANY, THE ACQUISITION AND RELATED MATTERS. Investors and stockholders will be able to obtain free copies of the proxy statement
and other documents filed by the Company with the SEC at the SEC’s website at www.sec.gov. In addition, investors and stockholders will be able
to obtain free copies of the proxy statement and other documents filed by the Company with the SEC at http://investors.vantiv.com/.
VII. Participants in the Solicitation
The Company and its directors, officers and employees may be considered participants in the solicitation of proxies from the Company’s
stockholders in respect of the Acquisition. Information regarding the persons who may, under the rules of the SEC, be deemed participants in the
solicitation of the Company’s stockholders in connection with the Acquisition, including names, affiliations and a description of their direct or indirect
interests, by security holdings or otherwise, will be set forth in the proxy statement and other relevant materials to be filed with the SEC. Information
concerning the interests of the Company’s participants in the solicitation, which may, in some cases, be different than those of the Company’s
stockholders generally, is set forth in the materials filed by the Company with the SEC, including in the proxy statement for the Company’s 2017
Annual Meeting of Stockholders, which was filed with the SEC on March 15, 2017, as supplemented by other Company filings with the SEC, and will
be set forth in the proxy statement relating to the Acquisition when it becomes available.
VIII. Non-GAAP Financial Measures
This Confidential Information Memorandum contains estimated financial information that is unaudited and not presented in accordance with US
Generally Accepted Accounting Principles (GAAP).
Such information includes financial information presented in accordance with International Financial Reporting Standards (IFRS); information
relating to the combined financial data presented with the side-by-side financials; estimated efficiencies and run-rate savings; estimated synergies
and efficiencies; and adjusted earnings per share, which excludes non-cash amortization of intangible assets. This information has been provided
on a forward-looking basis pursuant to an exception for non-GAAP financial measures included in disclosures relating to a proposed business
combination transaction, the entity resulting from the business combination transaction or an entity that is a party to the business combination
transaction where the communication containing such disclosure is subject to the SEC’s rules relating to communications applicable to business
combination transactions. Investors should not place undue reliance on these measures and should carefully review the risks and uncertainties
described in the cautionary statement relating to “Forward-Looking Statements” contained herein.
IX. Representations
It is understood and acknowledged that any person's access to, and use of, any of the attached materials constitutes their overall acceptance of the
following: (1) none of Vantiv, Worldpay, the Company, or any other party involved in the preparation of the attached materials makes any
representation, warranty or claim that the materials and information contained therein is current or accurate; (2) by virtue of access to these
materials, no one shall be entitled to claim detrimental reliance on any information provided or expressed; (3) no person should rely on statements
or representations made within these materials nor should any person rely on the statements or representations made by any other source based
on these materials; and (4) neither Vantiv, Worldpay, the Company, nor any other party involved in the preparation of the attached materials shall
have any duty or liability to any person in connection with the attached materials.
4


Page 6 CONFIDENTIAL
September 2017 Vantiv, LLC
Table of Contents
1. Contact List 7
2. Transaction Timeline 15
3. Transaction Summary 16
4. Company Overviews 20
5. Strategic Rationale & Proposed Transaction Structure 23
6. Industry Overview 25
7. Credit Highlights 27
8. Historical Financial Results & Management’s Discussion and Analysis 38
9. Summary Terms and Conditions 49
1
2
3
4
5
6
7
8
9
6

Page 7 CONFIDENTIAL
September 2017 Vantiv, LLC
1. Contact List
Vantiv 8500 Governors Hill Drive
Symmes Township, OH 45249
Name / Title Office E-mail
Stephanie Ferris Tel: +1 513 900 5131 [email protected]
Chief Financial Officer
Ned Greene Tel: +1 513 900 5200 [email protected]
Chief Legal Officer & Secretary
Tim Cooper Tel: +1 513 900 5181 [email protected]
Treasurer
Chris Thompson Tel: +1 513 900 5401 [email protected]
Chief Accounting Officer
Jared Warner Tel: +1 513 900 5263 [email protected]
Deputy General Counsel
Mark Wright Tel: +1 513 900 5183 [email protected]
Assistant Treasurer
7

Page 8 CONFIDENTIAL
September 2017 Vantiv, LLC
1. Contact List
Morgan Stanley 1585 Broadway
New York, NY, 10036
Name / Title Office E-mail
IBD - Business Services Group
Seth Bergstein Tel: +1 212 761 7019 [email protected]
Head of Global Services Group Fax: +1 212 507 0257
Managing Director
Paul Wasinger Tel: +1 212 761 0687 [email protected]
Head of Payments and Processing Fax: +1 212 507 0084
Managing Director
Ryan Fernandes Tel: +1 212 761 4418 [email protected]
Vice President Fax: +1 718 233 0765
William Zapata Tel: +1 212 761 9210 [email protected]
Associate
Simon Osipov Tel: +1 212 761 0483 [email protected]
Analyst
Global Capital Markets – Credit Advisory
Brian Janiak Tel: +1 212-761-1282 [email protected]
Executive Director Fax: +1 212-507-3446
Maksim Rakhman Tel: +1 212-761-0755 [email protected]
Associate Fax: +1 212-507-0255
8

Page 9 CONFIDENTIAL
September 2017 Vantiv, LLC
1. Contact List
Morgan Stanley (cont’d) 1585 Broadway
New York, NY, 10036
Name / Title Office E-mail
Leveraged Finance
Barry Price Tel: +1 212 761 3458 [email protected]
Managing Director Fax: +1 212 507 4738
Robbie Pearson Tel: +1 212 761 1132 [email protected]
Executive Director Fax: +1 201 633 4287
Jordan Ransom Tel: +1 212 761 0074 [email protected]
Associate
James Temple Tel: +1 212 761 3585 [email protected]
Analyst
Legal and Compliance
Jason Terrana Tel: +1 212 762 4814 [email protected]
Executive Director Fax: +1 212 507 6368
9

Page 10 CONFIDENTIAL
September 2017 Vantiv, LLC
1. Contact List
Credit Suisse Eleven Madison Avenue
New York, NY, 10010
Name / Title Office E-mail
Technology Investment Banking
Brian Gudofsky Tel: +1 212 325 6571 [email protected]
Global Head of Technology Services
Managing Director
Gary Katz Tel: +1 212 538 8468 [email protected]
Director
Cyril Paleath Tel: +1 212 325 6446 [email protected]
Vice President
Chih-ya Tseng Tel: +1 212 538 3132 [email protected]
Associate
James Eisenstein Tel: +1 212 538 2791 [email protected]
Analyst
Leveraged Finance Origination & Restructuring
Jeb Slowik Tel: +1 212 538 0515 [email protected]
Managing Director
Jason Kulig Tel: +1 212 538 1319 [email protected]
Vice President
Kevin Johnston Tel: +1 212 538 1004 [email protected]
Associate
Daniel Eder Tel: +1 212 538 2161 [email protected]
Analyst
10

Page 11 CONFIDENTIAL
September 2017 Vantiv, LLC
1. Contact List
MUFG 1221 Avenue of the Americas, 6th Floor
New York, NY 10020
Name / Title Office E-mail
Corporate Advisory Group
Robert Smock Tel: +1 212 782 4609 [email protected]
Managing Director
Joanita Ricketts Tel: +1 212 782 6564 [email protected]
Director
Gordon O’Brien Tel: +1 212 782 4966 [email protected]
Vice President
Leveraged Finance
James Gorman Tel: +1 212 405 7453 [email protected]
Managing Director
Yen Hua Tel: +1 212 405 7421 [email protected]
Director
Global Relationship Management
Scott Hagel Tel: +1 916 321 7602 [email protected]
Head of GI West & Midwest
Managing Director
Erin McNaughton Tel: +1 312 696 4681 [email protected]
Director
Carol Avila Tel: +1 312 696 4708 [email protected]
Vice President
Richard Benson Tel: +1 312 696 4665 [email protected]
Associate
11

Page 12 CONFIDENTIAL
September 2017 Vantiv, LLC
1. Contact List
MUFG (cont’d) 1221 Avenue of the Americas, 6th Floor
New York, NY 10020
Name / Title Office E-mail
Portfolio Management Group
Victor Pierzchalski Tel: +1 312 696 4676 [email protected]
Managing Director
Thomas Danielson Tel: +1 312 696 4518 [email protected]
Director
Eric Hill Tel: +1 312 696 4587 [email protected]
Vice President
Colin O’Callaghan Tel: +1 312 696 4675 [email protected]
Associate
12

Page 13 CONFIDENTIAL
September 2017 Vantiv, LLC
1. Contact List
Sidley – Company Counsel 2021 McKinney Ave, Suite 2000
Dallas, TX 75201
Name / Title Office E-mail
U.S. Finance
Kelly Dybala Tel: +1 214 981 3426 [email protected]
Partner
Sean Damm Tel: +1 214 981 3447 [email protected]
Associate
Tony Ortega Tel: +1 214 981 3421 [email protected]
Associate
U.K. Finance
James Crooks Tel: +44 20 7360 2040 [email protected]
Partner
Bryan Robson Tel: +44 20 7360 3717 [email protected]
Partner
Will Gwyn Tel: +44 20 7360 2047 [email protected]
Associate
13
Page 14 CONFIDENTIAL
September 2017 Vantiv, LLC
1. Contact List
Latham & Watkins – Underwriters’ Counsel 885 Third Avenue
New York, NY 10022
Name / Title Office E-mail
Bank
Eugene P. Mazzaro Tel: +1 212 906 1763 [email protected]
Partner
Nicole C. Fanjul Tel: +1 212 906 1712 [email protected]
Associate
Capital Markets
Peter M. Labonski Tel: +1 212 906 1323 [email protected]
Partner
Keith L. Halverstam Tel: +1 212 906 1761 [email protected]
Partner
Tax
Jiyeon Lee-Lim Tel: +1 212 906 1298 [email protected]
Partner
14

Page 15 CONFIDENTIAL
September 2017 Vantiv, LLC
2. Transaction Timeline
Key event Federal holiday
September 2017
S M T W T F S
1 2
3 4 5 6 7 8 9
10 11 12 13 14 15 16
17 18 19 20 21 22 23
24 25 26 27 28 29 30
October 2017
S M T W T F S
1 2 3 4 5 6 7
8 9 10 11 12 13 14
15 16 17 18 19 20 21
22 23 24 25 26 27 28
29 30 31
Lender Call September 7th
Commitments Due September 18th
Close & Fund Term Loan B Week of October 16th
Close & Fund RCF & TLA-4 Q1 2018
15

Page 16 CONFIDENTIAL
September 2017 Vantiv, LLC
3. Transaction Summary
Notes: Assumes exchange rate of $1.2967:£1
1. PF LTM Adjusted EBITDA includes one-third of $200MM of run-rate synergies for illustrative purposes
2. Includes additional addbacks for Vantiv covenant EBITDA purposes; ~$40MM incremental addback as of 6/30/2017
3. Reflects balances expected at close
I. Transaction Overview
• Vantiv (the “Company”) is a leading, integrated payment processor and is the largest merchant and PIN debit acquirer in the U.S.,
based on number of transactions.
• On August 9, 2017, Vantiv and Worldpay announced that they reached agreement on the terms of a recommended combination,
which imply an enterprise value for Worldpay of approximately $12.0 billion (representing 18.6x LTM EBITDA without synergies).
• Worldpay is a leading payments technology company to approximately 400,000 clients worldwide. Using its network and technology,
Worldpay is able to process payments across 146 countries and in 126 currencies.
• In connection with the acquisition, Vantiv has completed an amendment to its existing credit facilities and has completed Agent-level
syndication on the acquisition financing comprised of a $600MM Incremental Revolver, $1,605MM Incremental Term Loan A-4,
$535MM Incremental Term Loan B-1, and $1,130MM of Senior Unsecured Notes
• In addition, Vantiv is seeking to reprice the existing $761MM Term Loan B and syndicate the $1,270MM Incremental Term Loan B
that was funded to complete the buyback of shares owned by Fifth Third Bank “Fifth Third” to reduce their ownership to ~4.9%
Pro forma 1st Lien and total net leverage of 4.1x and 4.8x, respectively, based on the Combined Company’s Pro Forma LTM 6/30/2017
EBITDA of $1,702MM(1)(2). The Combined Company has announced a target of de-levering to a 4.0x debt to EBITDA leverage ratio over
the next 12-18 months.
Sources & Uses and Pro Forma Capitalization
Sources ($MM) (3)
Equity Issuance 8,756
Rolled Vantiv Debt 3,304
Rolled Worldpay Debt 630
Incremental Term Loan A-4 1,605
Incremental Term Loan B-1 535
Incremental Unsecured Notes 1,130
Incremental Vantiv Term Loan B (Fifth Third) 1,270
Cash from Balance Sheet 76
Total 17,306
Uses ($MM) (3)
Equity Purchase Price 10,184
Rolled Vantiv Debt 3,304
Rolled Worldpay Debt 630
Refinanced Vantiv Debt –
Refinanced Worldpay Debt 1,568
Fifth Third Share Buyback 1,270
Provision for Transaction Expenses 350
Total 17,306
Capitalization ($MM) Current 6/30/17 Transaction-Related PF 6/30/17
Cash 120 466 586
Existing Vantiv Revolver 358 -- 358
Existing Vantiv Term Loan A 2,408 -- 2,408
Existing Vantiv Term Loan B 761 -- 761
Incremental Vantiv Term Loan B (Fifth Third) -- 1,270 1,270
Incremental Term Loan A-4 -- 1,605 1,605
Incremental Term Loan B-1 -- 535 535
Existing Vantiv Capital Leases & Leasehold Mortgages 43 -- 43
Rolled Worldpay Capital Leases -- 39 39
Total Secured Debt $3,570 $3,449 $7,019
Incremental Unsecured Notes -- 1,130 1,130
Rolled Worldpay Senior Unsecured Notes (€) -- 591 591
Total Debt $3,570 $5,170 $8,740
Net Debt $3,450 $4,703 $8,153
LTM Adjusted EBITDA
(1)(2) 991 1,702
Secured Leverage 3.6x 4.1x
Gross Leverage 3.6x 5.1x
Net Leverage 3.5x 4.8x
16

Page 17 CONFIDENTIAL
September 2017 Vantiv, LLC
3. Transaction Summary
II. Summary of Indicative Pro Rata Terms
Borrower: Vantiv, LLC (the “Borrower”)
Facility:
Amount $600MM Incremental Revolver
$1,605MM Incremental Term Loan A-4
Maturi ty 5 Years
Pricing
Opening at L+225 bps
RCF Undrawn: 37.5 bps with step-down
Total Leverage-based Pricing Grid:
4.50x+: L+225 bps
4.50x – 3.75x: L+200 bps
3.25x – 3.75x: L+175 bps
2.25x – 3.25x: L+150 bps
Below 2.25x: L+125 bps
Amortizat ion Revolver: None
Term Loan A: 5%/5%/5%/7.5%/10%
Use of
Proceeds:
Revolver: General corporate purposes
Term Loan A-4: To finance the acquisition of Worldpay, refinance existing Worldpay debt, and pay
related fees and expenses
Incremental
Facil ity:
Fixed Dollar Incremental Amount shall be $1,000,000,000 and the leverage ratios applicable to the Ratio-
Based Incremental Amount shall be set at the applicable leverage ratios on the Closing Date with ability
to incur non-USD incremental Term Loans.
Security: First lien on substantially all tangible and intangible assets, including stock of the Borrower and all
domestic restricted subsidiaries (Same as existing)
Guarantors: Vantiv Holding, LLC and the material domestic wholly-owned restricted subsidiaries of the Borrower
(Same as existing) (1)
Optional
Prepayments: Prepayable at Par
Mandatory
Prepayments:
Mandatory prepayments required from proceeds of:
100% net cash proceeds of non-ordinary course asset sale proceeds, with 12 month reinvestment
rights
100% of debt issuance proceeds (other than permitted debt)
50% of excess cash flow with leverage based stepdowns to 25% and 0% based on senior secured
leverage of 4.25x and 3.75x, respectively
(Same as existing)
Financial
Maintenance
Covenants:
Total Leverage Ratio: December 31, 2017 – September 30, 2018: 6.50 to 1.00
• December 31, 2018 – September 30, 2019: 5.75 to 1.00
• December 31, 2019 – September 30, 2020: 5.00 to 1.00
• December 31, 2020 and thereafter: 4.25 to 1.00
4.00 to 1.00 Interest Coverage Ratio
Negative
Covenants: To match Amended Existing Credit Facilities
Note
1. Worldpay US Subsidiaries expected to become guarantors post-closing
17

Page 18 CONFIDENTIAL
September 2017 Vantiv, LLC
3. Transaction Summary
III. Summary of Indicative Term Loan B Terms
Borrower: Vantiv, LLC (the “Borrower”)
Facility:
Amount $1,270MM Term Loan B
Maturi ty August 7, 2024
Amortizat ion 1.00% per annum
Use of
Proceeds: Share buyback of 19.8MM Vantiv shares to reduce Fifth Third’s stake to 4.9% post transaction
Incremental
Facil ity:
Fixed Dollar Incremental Amount shall be $1,000,000,000 and the leverage ratios applicable to the Ratio-
Based Incremental Amount shall be set at the applicable leverage ratios on the Closing Date with ability
to incur non-USD incremental Term Loans
Security: First lien on substantially all tangible and intangible assets, including stock of the Borrower and all
domestic restricted subsidiaries
Guarantors: Vantiv Holding, LLC and the material domestic wholly-owned restricted subsidiaries of the Borrower (1)
Optional
Prepayments: 101 Soft Call (6 months)
Mandatory
Prepayments:
Mandatory prepayments required from proceeds of:
100% net cash proceeds of non-ordinary course asset sale proceeds, with 12 month reinvestment
rights
100% of debt issuance proceeds (other than permitted debt)
50% of excess cash flow with leverage based stepdowns to 25% and 0% based on senior secured
leverage of 4.25x and 3.75x, respectively
Financial
Maintenance
Covenants:
None
Negative
Covenants: To match Amended Existing Credit Facilities
Note
1. Worldpay US Subsidiaries expected to become guarantors post-closing
18

Page 19 CONFIDENTIAL
September 2017 Vantiv, LLC
3. Transaction Summary
IV. Summary of Term Loan B Repricing
Borrower: Vantiv, LLC (the “Borrower”) (same as existing)
Facility:
Amount $761MM Term Loan B
Maturi ty October 14, 2023 (same as existing)
Amortizat ion 1.00% per annum (same as existing)
Use of
Proceeds: Reprice the existing Term Loan B
Incremental
Facil ity:
Fixed Dollar Incremental Amount shall be $1,000,000,000 and the leverage ratios applicable to the Ratio-
Based Incremental Amount shall be set at the applicable leverage ratios on the Closing Date with ability
to incur non-USD incremental Term Loans (same as existing)
Security: First lien on substantially all tangible and intangible assets, including stock of the Borrower and all
domestic restricted subsidiaries (Same as existing)
Guarantors: Vantiv Holding, LLC and the material domestic wholly-owned restricted subsidiaries of the Borrower
(same as existing) (1)
Optional
Prepayments: 101 Soft Call (6 months)
Mandatory
Prepayments:
Mandatory prepayments required from proceeds of:
100% net cash proceeds of non-ordinary course asset sale proceeds, with 12 month reinvestment
rights
100% of debt issuance proceeds (other than permitted debt)
50% of excess cash flow with leverage based stepdowns to 25% and 0% based on senior secured
leverage of 4.25x and 3.75x, respectively
(Same as existing)
Financial
Maintenance
Covenants:
None (same as existing)
Negative
Covenants: To match Amended Existing Credit Facilities (same as existing)
Note
1. Worldpay US Subsidiaries expected to become guarantors post-closing
19
Page 20 CONFIDENTIAL
September 2017 Vantiv, LLC
4. Company Overviews
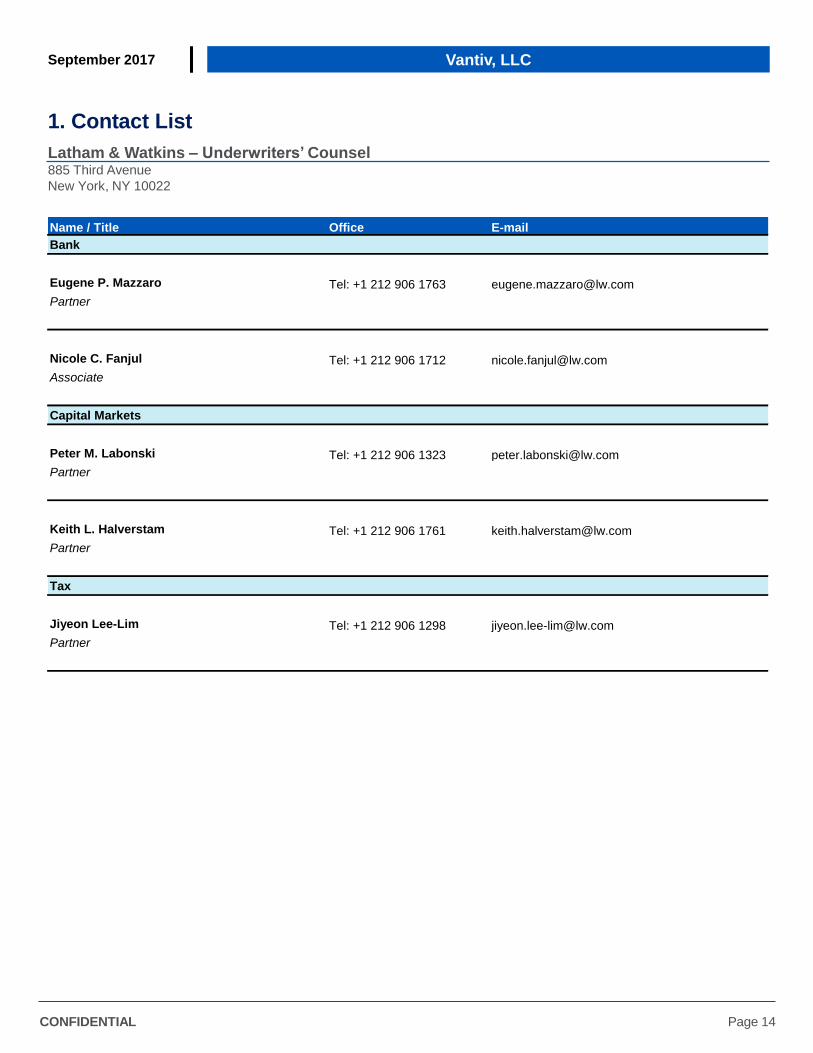
I. Vantiv Overview
Vantiv is a leading payment processor differentiated by an integrated technology platform, breadth of distribution and superior cost
structure. Vantiv offers a broad suite of payment processing services that enable its clients to meet their payment processing needs
through a single provider, including in omni-commerce environments that span point-of-sale, eCommerce and mobile devices.
According to the Nilson Report, Vantiv is the largest merchant acquirer and the largest PIN debit acquirer by number of transactions in
the U.S.
Notes
1. Based on number of total purchase transactions; analysis of data published in The Nilson Report, issue 1105 (March 2017)
2. Based on number of total purchase transactions (including all general credit, debit and prepaid cards transactions, including signature and PIN debit)
Vantiv’s integrated technology platform is differentiated from its competitors’ multiple platform architectures. It enables Vantiv to
efficiently provide a comprehensive suite of services to merchants and financial institutions of all sizes as well as to innovate, develop
and deploy new services, while generating significant economies of scale. Vantiv’s broad and varied distribution includes multiple sales
channels, such as its direct and indirect sales forces and referral partner relationships, which provide it with a growing and diverse client
base of merchants and financial institutions.
Vantiv serves its clients through two operating divisions:
• Merchant Services – Enables merchants of all sizes to accept and process credit, debit and prepaid payments and provides them
supporting value-added services, such as security solutions and fraud management, information solutions and interchange
management. In 2016, Vantiv processed approximately 21 billion transactions for its merchant client base, which includes merchant
locations across the U.S. Vantiv’s merchant client base has low client concentration and is heavily weighted in non-discretionary
everyday spend categories, such as grocery and pharmacy and includes large U.S. retailers, including over 1/3rd of the top 100
retailers.
• Financial Institutions – Provides mission critical payment services to financial institutions, such as card issuer processing, payment
network processing, fraud protection, card production, prepaid program management, ATM driving and network gateway and
switching services that utilize its proprietary Jeanie PIN debit payment network. Vantiv’s financial institution client base is also
generally well diversified and includes regional banks, community banks, credit unions and regional PIN debit networks. In 2016,
Vantiv processed approximately 4 billion transactions for these financial institutions, focusing on small to mid-sized institutions with
less than $15 billion in assets.
‘16 Net Revenue $1.9Bn
% Growth 13%
’16 Adjusted EBITDA $0.9Bn
% Margin 48%
Segment Overview
• Leading processor to banks and credit unions under
$15 billion in assets
• 4 billion transactions processed
Financial Institution Services
• #1 ranked U.S. merchant and #1 U.S. pin debit
acquirer (1)
• ~800,000 merchant locations served
• ~5,000 referring branches
• 21 billion transactions processed
• 21% U.S. merchant market share (1)(2)
• Over 1/3rd of the top 100 retailers
Merchant Services
‘16 Net Revenue $1,546MM $359MM
% Total 81% 19%
% Growth 16% 4%
20
Page 21 CONFIDENTIAL
September 2017 Vantiv, LLC
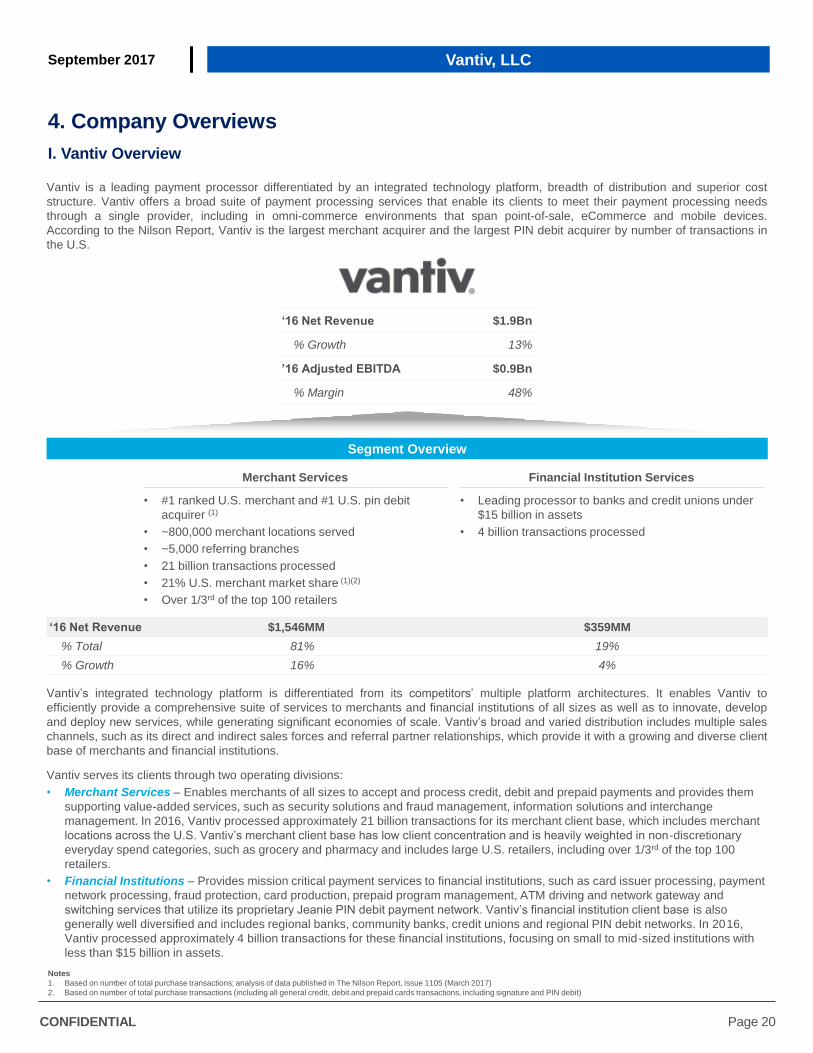
Worldpay serves a diverse set of merchants across a variety of end-markets, sizes and geographies. On an average day, it processes
over 40 million transactions worldwide (including mobile, online and in-store), offering over 300 payment methods in 126 transaction
currencies across 146 countries, while supporting approximately 400,000 clients, including large enterprises, domestic corporates and
small and medium sized businesses. Globally, Worldpay also partners with innovative and fast-growing eCommerce businesses
including many of the world’s most renowned and dynamic online brands.
Worldpay serves its clients through its three operating divisions:
• Global eCom — Global eCom provides a wide range of online and mobile multi-currency payment acceptance, validation and
settlement services for its client book of large and fast growing internet-led multinationals. The vast majority of Global eCom’s clients
sit within five priority industry verticals: Digital Content, Global Retail, Airlines, Regulated Gambling and Travel. Global eCom
accounted for 46 percent of the Worldpay Group’s business unit contribution in 2016
(4).
• WPUK — WPUK has the number one market share in the U.K., accounting for ~40 percent of the U.K. merchant market as
measured by estimated volume of transactions in 2016. It provides a strong proposition of in-store, phone, online and mobile
payment acceptance solutions for ~300,000 U.K. and Ireland-based clients, from SMBs to major retailers (including Tesco, Asda and
Next). WPUK accounted for 42 percent of the Worldpay Group’s business unit contribution in 2016
(4).
• WPUS — WPUS provides in-store, online and mobile payment acceptance solutions for U.S.-based clients, with a focus on
developing omni-commerce and integrated payment solutions for its ~100,000 SMB clients and vertical-specific solutions for ~15,000
enterprise clients in the grocery, petroleum, restaurant and retail industries. WPUS accounted for 17 percent of the Worldpay
Group’s business unit contribution in 2016
(4).
4. Company Overviews
II. Worldpay Overview
Worldpay is a leader in global payments. Worldpay provides a broad range of technology-led solutions to its merchant clients to allow
them to accept payments of almost any type, across multiple payment channels, nearly anywhere in the world. Worldpay is one of the
few global businesses able to offer functionality in most aspects of payment acceptance, whether in-store, online or on a mobile device,
by providing access to a global payments network through an agile, integrated, secure, reliable and highly scalable proprietary global
payments platform.
Source: Nilson Report, issues 1105 (March 2017) and 1110 (May 2017)
Notes: Assumes exchange rate of $1.2967:£1
1. Worldpay net revenue reflects reported gross profit for comparable reporting conventions to Vantiv, for illustrative purposes, estimated by allocating total gross profit using reported net revenue % of total
2. Underlying EBITDA shown for Worldpay, margin shown after taking into effect net revenue to gross profit adjustment
3. Assumes corporate costs of £25MM are allocated pro rata across segments by Worldpay reported net revenue
4. Corporate costs of £25MM account for (5)% of Group underlying EBITDA
‘16 Net Revenue (1) $1.3Bn
% Growth 15%
’16 Adjusted EBITDA (2) $0.6Bn
% Margin (2) 47%
Segment Overview
U.S.
• #7 merchant acquirer in US
• ~100,000 SME clients and ~15,000
enterprise clients
• Vertical-specific enterprise
solutions: Grocery, Petroleum,
Restaurant and Retail
U.K.
• #1 merchant acquirer in UK
• ~40% share of UK merchant
market by volume
• ~300,000 UK and Ireland-based
clients ranging from SMEs to major
retailers
• Online and mobile multi-currency
payments for multi-national retailers
• ~1,200 clients including some of
the largest, global online merchants
• Verticals: Digital Content, Global
Retail, Airlines, Gaming and Travel
Global eCom
‘16 Net Revenue (1) $439MM $498MM $340MM
% Total 34% 39% 27%
CC Growth 22% 8% 2%
‘16 Adj. EBITDA (2)(3) $273MM $247MM $94MM
% Margin (2)(3) 62% 50% 28%
21
Page 22 CONFIDENTIAL
September 2017 Vantiv, LLC
III. Combined Company Overview
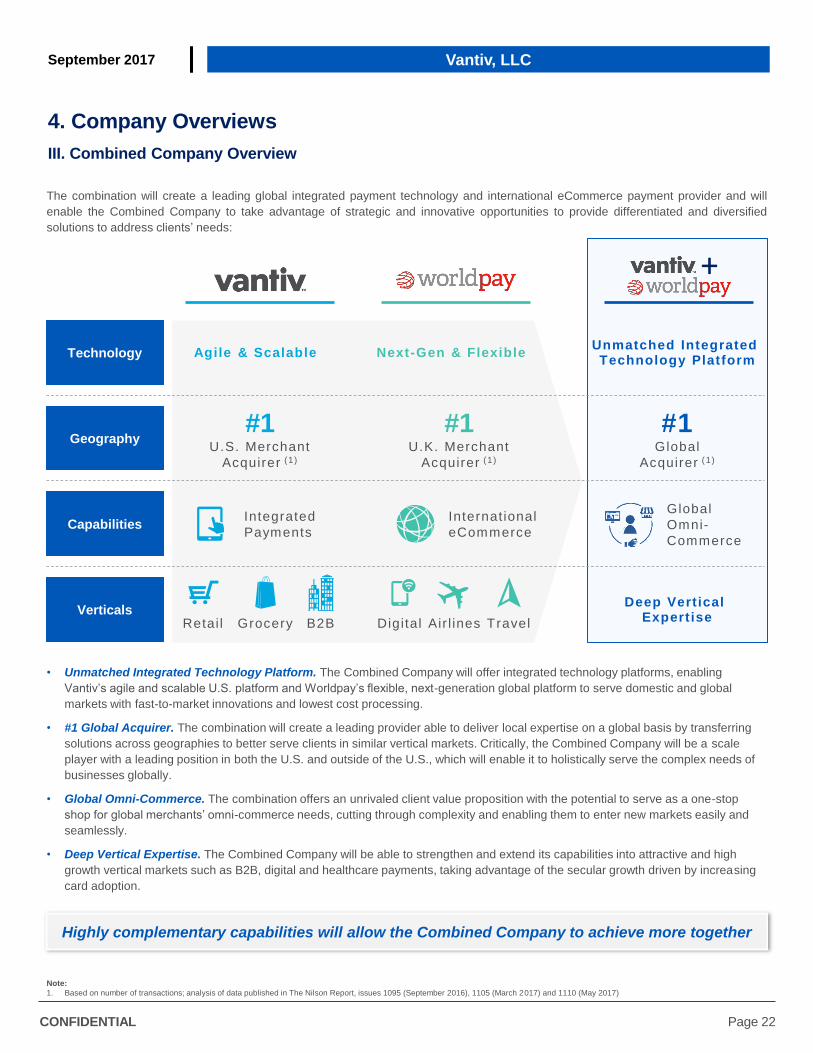
The combination will create a leading global integrated payment technology and international eCommerce payment provider and will
enable the Combined Company to take advantage of strategic and innovative opportunities to provide differentiated and diversified
solutions to address clients’ needs:
• Unmatched Integrated Technology Platform. The Combined Company will offer integrated technology platforms, enabling
Vantiv’s agile and scalable U.S. platform and Worldpay’s flexible, next-generation global platform to serve domestic and global
markets with fast-to-market innovations and lowest cost processing.
• #1 Global Acquirer. The combination will create a leading provider able to deliver local expertise on a global basis by transferring
solutions across geographies to better serve clients in similar vertical markets. Critically, the Combined Company will be a scale
player with a leading position in both the U.S. and outside of the U.S., which will enable it to holistically serve the complex needs of
businesses globally.
• Global Omni-Commerce. The combination offers an unrivaled client value proposition with the potential to serve as a one-stop
shop for global merchants’ omni-commerce needs, cutting through complexity and enabling them to enter new markets easily and
seamlessly.
• Deep Vertical Expertise. The Combined Company will be able to strengthen and extend its capabilities into attractive and high
growth vertical markets such as B2B, digital and healthcare payments, taking advantage of the secular growth driven by increasing
card adoption.
4. Company Overviews
Note:
1. Based on number of transactions; analysis of data published in The Nilson Report, issues 1095 (September 2016), 1105 (March 2017) and 1110 (May 2017)
Technology
Verticals
Geography
Capabilities
Agile & Scalable
Integrated
Payments
Internat ional
eCommerce
Global
Omni-
Commerce
Grocery Retai l Digital Air l ines
Next-Gen & Flexible Unmatched Integrated
Technology Platform
Deep Vertical Expertise B2B
#1 U.K. Merchant
Acquirer
(1)
#1 U.S. Merchant
Acquirer
(1)
#1 Global
Acquirer
(1)
Travel
+
Highly complementary capabilities will allow the Combined Company to achieve more together
22

Page 23 CONFIDENTIAL
September 2017 Vantiv, LLC
5. Strategic Rationale & Proposed Transaction Structure
I. Strategic Rationale for the Transaction
This transaction joins two highly complementary businesses and will allow the Combined Company to achieve more together than either
could on its own. The Combined Company will be well-positioned to offer more innovative and flexible technology and payment
solutions to merchants in a large and fast growing market, creating a strategic omni-commerce partner for merchants of all sizes across
industries.
Creating a leading global payment provider to power omni-commerce. Consumers continue to expect and demand more from
merchants. The global consumer has become accustomed to transacting across the channels and in the geographies of their choosing
in a way that is seamless, simple and secure. Merchants therefore require a payments provider that is able to provide a comprehensive
omni-commerce solution that can deliver a unified consumer experience on a global basis as well as the tools to help them manage and
grow their businesses. By combining the companies’ respective strengths in integrated payments, eCommerce and traditional merchant
offerings, the Combined Company will be able to enable commerce through a unified and global product suite that is in-store, online,
mobile, multi-currency and spanning geographies.
Unique combination of scale and global presence. The Combined Company will become a leading international eCommerce
payment provider, a leading U.S. payment provider and a leading U.K. and European payment provider, processing approximately $1.5
trillion in payment volume and 40 billion transactions through more than 300 payment methods in 146 countries and 126 currencies, with
a combined net revenue of over $3.2 billion (on a pro forma basis, assuming the combination had completed on 31 December 2016).
The Combined Company will benefit from enhanced economies of scale, leveraging its combined operations, technology infrastructure
and data and analytics capabilities to deliver services that are cost efficient and provide superior value to clients.
Ability to capitalize on strategic and high-growth verticals. Completion of the combination will bring together two complementary
partners to create a market leader in payment technology, positioned to capitalize on strategic and high-growth verticals in the most
attractive global markets. The combination will create a leading global eCommerce provider by adding Worldpay’s leading global
eCommerce capabilities to Vantiv’s existing U.S. eCommerce capabilities. The combination will also enable the Combined Company to
export Vantiv’s integrated payments technological know-how and capabilities to Worldpay’s global merchant base. The combination will
enhance the ability of the Combined Company to strengthen and extend its capabilities into attractive and high growth vertical markets
such as B2B, digital and healthcare payments, taking advantage of the secular growth driven by increasing card adoption.
Integrated technology platforms built for innovation and to manage complexity. The Combined Company will have
complementary technology assets that will provide a strong, integrated foundation for innovation and growth, enabled by Vantiv’s agile
and scalable U.S. platform and Worldpay’s flexible, next generation global platform. The combination will enhance the ability of the
Combined Company to serve domestic and global markets and the Combined Company is also expected to benefit from a reduction in
capital expenditure by harmonizing Vantiv’s and Worldpay’s U.S. technology platforms. These U.S. and global technology platforms will
be developed, secured and optimized by one of the industry’s largest pools of engineering and technology talent.
Powerful business model and financial profile. The Combined Company will benefit from an attractive business model and financial
profile, the hallmarks of which are recurring revenue, scalability and significant operating margins. On a pro forma basis, assuming the
combination had completed on 31 December 2016, the Combined Company would have $1.5 billion of adjusted EBITDA, an EBITDA
margin of 48 percent and free cash flow generation of over $1.0 billion with 78 percent free cash flow conversion. It is expected that the
Combined Company, with its strong credit profile and attractive cash flow, will seek to reduce leverage on a consistent basis over the
medium term, including a target of de-levering to a 4.0x debt to EBITDA leverage ratio over the next 12-18 months.
Cost synergies will deliver significant value creation. The Combined Company is expected to benefit from synergies that could not
be achieved independent of the combination. Annual recurring pre-tax cost synergies of approximately $200 million are expected to be
fully realized by the end of the third year following completion of the combination. The majority of these cost synergies will be generated
by harmonizing the Combined Company’s U.S. platforms and streamlining corporate costs.
23

Page 24 CONFIDENTIAL
September 2017 Vantiv, LLC
5. Strategic Rationale & Proposed Post-Closing Structure
II. Proposed Simplified Transaction Structure Summary
Proposed post-closing structure summary subject to legal requirements and ongoing tax and structuring analysis –
subject to change
Fifth Third Bank Vantiv, Inc.
Vantiv Holding U.S.
Subsidiaries
Vantiv
Shareholders
Worldpay
U.S. Subsidiaries
Vantiv U.K.
Payments Ltd. (U.K.)
Vantiv U.K.
Solutions LTD (U.K.)
Vantiv, LLC.
(Delaware)
Vantiv
Holding, LLC.
(Delaware)
Vantiv
Cayman Holdings
Ltd. (Cayman Islands)
Vantiv U.K.
Group Ltd. (U.K.)
Worldpay Group
PLC (U.K.)
Worldpay Finance
PLC (U.K.)
Vantiv
U.K. Ltd. (U.K.)
Worldpay
Non-U.S. Subsidiaries
New Acquisition
Debt & Existing
Vantiv Debt
Existing
Worldpay Unsecured
Notes
24

Page 25 CONFIDENTIAL
September 2017 Vantiv, LLC
Electronic Payments
Electronic payments globally have evolved into a large and growing market with favorable secular trends that continue to increase the
adoption and use of card-based payment services, such as those for credit, debit and prepaid cards.
This growth is driven by the shift from cash and checks towards card-based and other electronic forms of payment due to their greater
convenience, security, enhanced services and rewards and loyalty features. Changing demographics and emerging trends, such as the
adoption of new technologies and business models, including eCommerce, mobile commerce and prepaid services, will also continue to
drive growth in electronic payments.
Payment Processing Industry
The payment processing industry is comprised of various processors that create and manage the technology infrastructure that enables
electronic payments. Payment processors help merchants and financial institutions develop and offer electronic payment solutions to
their customers, facilitate the routing and processing of electronic payment transactions and manage a range of supporting security,
value-added and back office services. In addition, many large banks manage and process their card accounts in-house. This is
collectively referred to as the payment processing value chain.
Many payment processors specialize in providing services in discrete areas of the payment processing value chain, which can result in
merchants and financial institutions using payment processing services from multiple providers. A limited number of payment
processors have capabilities or offer services in multiple parts of the payment processing value chain. The Combined Company will
provide solutions across the payment processing value chain as a merchant acquirer, payment network and as an issuer processor,
primarily by utilizing the integrated technology platform to enable clients to easily access a broad range of payment processing services
as illustrated below:
Payment processing value chain encompasses three key types of processing:
• Merchant Acquiring Processing. Merchant acquiring processors sell electronic payment acceptance, processing and supporting
services to merchants and third-party resellers. These processors route transactions originated by consumer transactions with the
merchant, including in omni-channel environments that span point-of-sale, ecommerce and mobile devices, to the appropriate
payment networks for authorization, known as “front-end” processing and then ensure that each transaction is appropriately cleared
and settled into the merchant’s bank account, known as “back-end” processing. Many of these processors also provide specialized
reporting, back office support, risk management and other value-added services to merchants. Merchant acquirers charge
merchants based on a percentage of the value of each transaction on a per transaction basis. Merchant acquirers pay the payment
network processors a routing fee per transaction and pass through interchange fees to the issuing financial institution.
• Payment Network Processing. Payment network processors, such as Visa, MasterCard and PIN debit payment networks, sell
electronic payment network routing and support services to financial institutions that issue cards and merchant acquirers that provide
transaction processing. Depending on their market position and network capabilities, these providers route credit, debit and prepaid
card transactions from merchant acquiring processors to the financial institution that issued the card and they ensure that the
financial institution’s authorization approvals are routed back to the merchant acquiring processor and that transactions are
appropriately settled between the merchant’s bank and the card-issuing financial institution. These providers also provide specialized
risk management and other value-added services to financial institutions. Payment networks charge merchant acquiring processors
and issuing financial institutions routing fees per transaction and monthly or annual maintenance fees and assessments.
• Issuer Card Processing. Issuer card processors sell electronic payment issuing, processing and supporting services to financial
institutions. These providers authorize transactions received from the payment networks and ensure that each transaction is
appropriately cleared and settled from the originating card account. These companies also provide specialized program
management, reporting, outsourced customer service, back office support, risk management and other value-added services to
financial institutions. Card processors charge issuing financial institutions fees based on the number of transactions processed and
the number of cards that are managed.
6. Industry Overview
Payment Processing Value Chain
M er chant M er chant Acqui r e r
P aym en t Ne twor k
I ssuer P r ocessor
Financ i a l Ins t i tu t i o n
Co
ns
um
er C
on
su
me
r
25

Page 26 CONFIDENTIAL
September 2017 Vantiv, LLC
Competition
U.S. Merchant Services
In the U.S. merchant services market, the Combined Company will hold the number one market position as measured by number of
transactions in 2016 according to the Nilson Report
(1). Its competitors include financial institutions and well-established payment
processing companies, including Bank of America Merchant Services, Chase Paymentech Solutions, Inc., Elavon Inc. (a subsidiary of
U.S. Bancorp), First Data Corporation, Global Payments, Inc. and Total System Services, Inc. Furthermore, the Combined Company is
facing new competitive pressure from non-traditional payments processors and other parties entering the payments industry, such as
Alibaba, Amazon, Apple, Google and PayPal, who may compete in one or more of the functions performed in processing merchant
transactions.
U.K. Merchant Services
In the U.K. merchant services market, the Combined Company will hold the number one market position as measured by number of
transactions in 2016 according to the Nilson Report
(2). Its two largest competitors in the U.K. by number of transactions are Barclays
PLC and Global Payments, Inc. In Europe and the Asia Pacific regions, financial institutions remain the primary providers of payment
processing services to merchants, although outsourcing is becoming more prevalent.
eCommerce
In the Global eCommerce market, the combination will encounter a number of niche specialists, which are typically gateway-led and
offer specific vertical, channel, geographic and/or segment solutions and compete on specific expertise and partnership coverage.
These include companies such as Adyen B.V., Braintree and Stripe, Inc. The Combined Company will also encounter a number of
global payments partners in the eCommerce market, including Elavon Inc., Ingenico Group and Wirecard AG.
U.S. Financial Institution Services
In the U.S. financial institution services market, competitors to the Combined Company include Fidelity National Information Services,
Inc., First Data Corporation, Fiserv, Inc., Total System Services, Inc. and Visa Debit Processing Service. In addition to competition with
direct competitors, the Combined Company also competes with the capabilities of many larger potential clients to conduct their key
payment processing applications in-house. The most significant competitive factors in this segment are price, system performance and
reliability, breadth of services and functionality, data security, scalability, flexibility of infrastructure and servicing capability.
6. Industry Overview
Notes:
1. The Nilson Report (March 2017, Issue 1105)
2. The Nilson Report (May 2017, Issue 1110)
26
Page 27 CONFIDENTIAL
September 2017 Vantiv, LLC
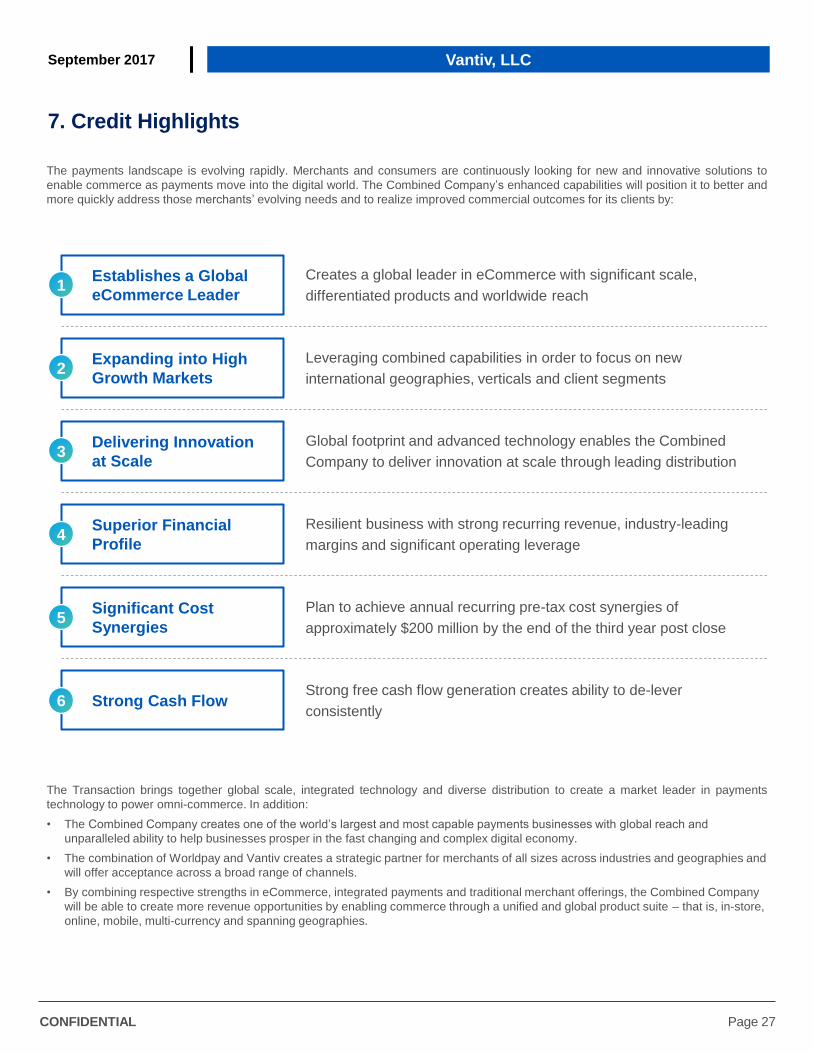
The payments landscape is evolving rapidly. Merchants and consumers are continuously looking for new and innovative solutions to
enable commerce as payments move into the digital world. The Combined Company’s enhanced capabilities will position it to better and
more quickly address those merchants’ evolving needs and to realize improved commercial outcomes for its clients by:
The Transaction brings together global scale, integrated technology and diverse distribution to create a market leader in payments
technology to power omni-commerce. In addition:
• The Combined Company creates one of the world’s largest and most capable payments businesses with global reach and
unparalleled ability to help businesses prosper in the fast changing and complex digital economy.
• The combination of Worldpay and Vantiv creates a strategic partner for merchants of all sizes across industries and geographies and
will offer acceptance across a broad range of channels.
• By combining respective strengths in eCommerce, integrated payments and traditional merchant offerings, the Combined Company
will be able to create more revenue opportunities by enabling commerce through a unified and global product suite – that is, in-store,
online, mobile, multi-currency and spanning geographies.
7. Credit Highlights
Establishes a Global
eCommerce Leader
Creates a global leader in eCommerce with significant scale,
differentiated products and worldwide reach 1
Expanding into High
Growth Markets
Leveraging combined capabilities in order to focus on new
international geographies, verticals and client segments 2
Delivering Innovation
at Scale
Global footprint and advanced technology enables the Combined
Company to deliver innovation at scale through leading distribution 3
Strong Cash Flow Strong free cash flow generation creates ability to de-lever
consistently 6
Significant Cost
Synergies
Plan to achieve annual recurring pre-tax cost synergies of
approximately $200 million by the end of the third year post close 5
Superior Financial
Profile
Resilient business with strong recurring revenue, industry-leading
margins and significant operating leverage 4
27

Page 28 CONFIDENTIAL
September 2017 Vantiv, LLC
I. Creates a Global Leader in eCommerce
The ubiquity of the internet has increasingly driven commerce to be conducted online, with the decreasing costs of technology creating
the opportunity for merchants to deploy eCommerce and mobile commerce solutions. In addition, commerce is continuing to evolve into
a global activity as merchants utilize these online methods to connect with consumers in geographic markets outside their own.
Technology and the internet continue to transform global commerce:
• The rapid growth of eCommerce and its progressively international nature is increasing complexity for merchants everywhere. From
complying with local and international regulations, to minimizing costs inherent in cross-border trade, to integrating businesses that
operate both offline in brick-and-mortar and online in eCommerce, merchants require solutions that help them manage complexity.
• The constant evolution of technology via new form factors and device types, coupled with increasing interconnectedness and
continuous new threats to security, requires that merchants adopt nimble, secure and future-proof payment solutions.
Digital Revolution Creates Opportunity
These rapidly changing consumer expectations and technology developments are difficult for merchants to address with existing
payment solutions and are difficult for traditional payment processors to support.
7. Credit Highlights
Helping clients navigate increasing complexity
and drive commerce through payments…
…as technology drives global
eCommerce growth
Seamless
Real-time
Scalable
Secure
Insights
Alternative
Payments
Developer-
Friendly
APIs
Business
Optimization
Integrated
Multi-Currency
0101 1010
Automated
+
Global eCommerce Market ($Tn) (1)
2.0
4.0 – 4.5
2015 2020F
~16%
CAGR 2x+
Note:
1. Based on McKinsey & Company research
28

Page 29 CONFIDENTIAL
September 2017 Vantiv, LLC
I. Creates a Global Leader in eCommerce (cont’d)
Vantiv’s robust U.S. eCommerce and omni-channel offering provides leading capabilities to domestic merchants. Worldpay’s
international online and multi-currency payment offering serves some of the world’s largest eCommerce merchants outside of the U.S.
Worldpay is one of the few global players to have the full eCommerce product set, across payment gateway services, fraud prevention
services, global and local card acquiring, local and alternative payment products, treasury management services, and analytics
services.
The combination creates a leading global eCommerce provider by adding Worldpay’s leading global eCommerce capabilities to Vantiv’s
existing U.S. eCommerce capabilities. A global eCommerce offering will create value for its clients by providing insights into the markets
they operate in and their consumers’ payment behavior. Offering the full range of products will also create profitable cross-sell and up-
sell opportunities for the combination’s existing clients.
The combination will be able to provide an end-to-end set of products and services across geographies which act as a key differentiator
to similar payment processors in driving simplicity and profitability in its payment solutions for merchants. The Combined Company will
have an unrivaled client value proposition with the potential to serve as a one-stop shop for global merchants’ omni-commerce needs,
cutting through complexity and enabling them to enter new markets easily and seamlessly.
eCommerce Leader Spanning U.S. + U.K. and Rest of World
7. Credit Highlights
One-stop shop for all
omni-commerce needs
Unified view of data
globally across all channels
Enable clients to
access new geographies
and markets
Empower merchants
to cut through complexity
Global network and reach
supporting 300+ payment
types across 146 countries
and 126 currencies
Consumer insights through
data & analytics and value
added services
Proven ability to partner with
merchants to drive revenue
growth
Differentiated and
advanced technology
Combination extends
ability to support
eCommerce clients
worldwide
29
Page 30 CONFIDENTIAL
September 2017 Vantiv, LLC
II. Expanding into Strategic and High-Growth Markets
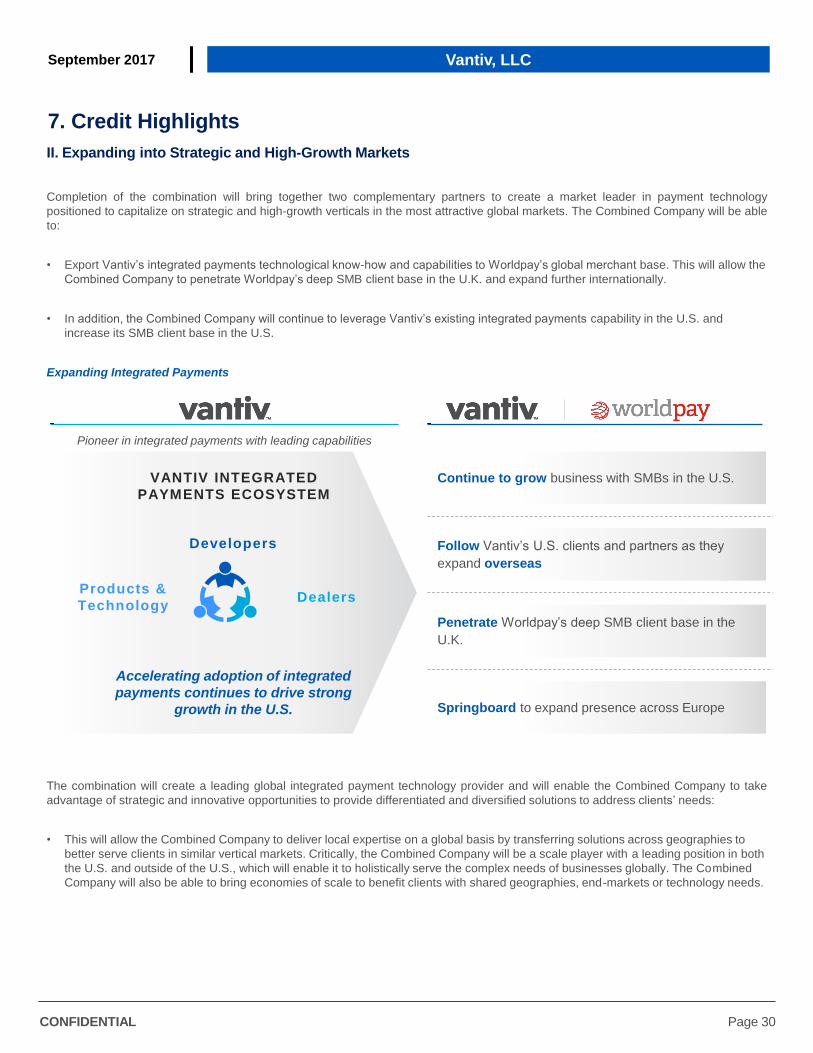
Completion of the combination will bring together two complementary partners to create a market leader in payment technology
positioned to capitalize on strategic and high-growth verticals in the most attractive global markets. The Combined Company will be able
to:
• Export Vantiv’s integrated payments technological know-how and capabilities to Worldpay’s global merchant base. This will allow the
Combined Company to penetrate Worldpay’s deep SMB client base in the U.K. and expand further internationally.
• In addition, the Combined Company will continue to leverage Vantiv’s existing integrated payments capability in the U.S. and
increase its SMB client base in the U.S.
Expanding Integrated Payments
The combination will create a leading global integrated payment technology provider and will enable the Combined Company to take
advantage of strategic and innovative opportunities to provide differentiated and diversified solutions to address clients’ needs:
• This will allow the Combined Company to deliver local expertise on a global basis by transferring solutions across geographies to
better serve clients in similar vertical markets. Critically, the Combined Company will be a scale player with a leading position in both
the U.S. and outside of the U.S., which will enable it to holistically serve the complex needs of businesses globally. The Combined
Company will also be able to bring economies of scale to benefit clients with shared geographies, end-markets or technology needs.
7. Credit Highlights
VANTIV INTEGRATED
PAYMENTS ECOSYSTEM
Products &
Technology
Developers
Dealers
Accelerating adoption of integrated
payments continues to drive strong
growth in the U.S.
Pioneer in integrated payments with leading capabilities
Continue to grow business with SMBs in the U.S.
Follow Vantiv’s U.S. clients and partners as they
expand overseas
Penetrate Worldpay’s deep SMB client base in the
U.K.
Springboard to expand presence across Europe
30

Page 31 CONFIDENTIAL
September 2017 Vantiv, LLC
II. Expanding into Strategic and High-Growth Markets (cont’d)
• Enhances the ability of the Combined Company to strengthen and extend its capabilities into attractive and high growth vertical
markets such as B2B, digital and healthcare payments, taking advantage of the secular growth driven by increasing card adoption.
For example, the Combined Company will be able to faster deploy Vantiv’s B2B enterprise payment capabilities into their large ly
untapped and combined client base.
Enhancing Deep Vertical Expertise
• The combination also provides the ability for the Combined Company to extend its capabilities into new and high-growth emerging
markets, including Latin America and Asia/Pacific, which offer significant growth potential. Worldpay is already active in these
markets, offering e-commerce solutions to global merchants. The Combined Company plans to build on its presence in these
markets over time and transact locally in many of these markets, further expanding its global revenue base. Emerging markets are
expected to drive 75% of all global card volume growth over the next 10 years and the Combined Company would be better
positioned as a leader in the deepest and most attractive global markets as a platform to capture this growth.
A Leader in the Deepest and Most Attractive Markets
7. Credit Highlights
Increasing card adoption driving secular growth with anticipated
outsized benefits in high growth verticals
Leading capabilities with deep expertise
across a broad range of key verticals
Aggressively expanding into high growth verticals (e.g., B2B, Digital, Health) B2B
DIGITAL
HEALTH
RETAIL
AIRLINES
RESTAURANT
GROCERY DRUG
Focus on expansion
in high growth
verticals
Emerging markets will drive 75% of global card volume growth over the next 10 years
U.S. &
Canada Europe Asia
Pacific
+
Middle East / Africa Latin
America
$5.2Tn
~7% CAGR
‘15 PURCHASE VOLUME
’15-’25 CAGR %
$0.6TN
~8% CAGR
$0.3TN
~14% CAGR
$11.4TN
~12% CAGR
$3.0TN
~9% CAGR
Source: The Nilson Report (January 2017, issue 1102), McKinsey & Company
31

Page 32 CONFIDENTIAL
September 2017 Vantiv, LLC
III. Delivering Innovation at Scale
The Combined Company will offer integrated technology platforms, enabling Vantiv’s agile and scalable U.S. platform and Worldpay’s
flexible, next-generation global platform to serve domestic and global markets with fast-to-market innovations and lowest cost
processing.
The Combined Company will have the ability to:
• Offer comprehensive and differentiated payment solutions with significant strategic and operational benefits. These platforms are
configurable for almost any geography, currency, region or combination and are built to seamlessly accommodate alternative
payments and support a fully omni-commerce transaction environment.
• Leverage existing deep knowledge in technology and commerce to offer solutions that reduce complexity for both high growth
segment merchants and traditional merchants, regardless of size or channel.
• Enhance the ability of the Combined Company to innovate with fast-to-market developments and proven record of M&A integration
to develop industry-leading solutions to meet emerging new client needs as the payment landscape continues to evolve.
• Access the widest set of distribution channels, ranging from large merchants and financial institutions to small and medium business
and eCommerce merchants of all sizes. This will solidify the Combined Company’s presence in high-growth channels (including
integrated payments, eCommerce and merchant bank), with 37 percent of the Combined Company focused on these fast growing
and highly profitable market segments. This will enable it to reach clients with highly complementary strategies in a manner that is
cost-effective and efficient regardless of size, type or industry vertical.
• Benefit from a reduction in capital expenditure by harmonizing Vantiv’s and Worldpay’s U.S. technology platforms.
The U.S. and global technology platforms will be developed, secured and optimized by one of the industry’s largest pools of engineering
and technology talent. Whether a local, small merchant requires an integrated payment solution to help manage their business, or a
multi-national enterprise would like to connect and transact with consumers online or cross-border, the Combined Company’s
comprehensive suite of solutions will enable them to do so seamlessly. The graphic below illustrates the platform and technology
attributes:
7. Credit Highlights
G L O B A L P A R T N E R O F C H O I C E
SEAMLESS INTEGRATED TECHNOLOGY
COMPREHENSIVE DIFFERENTIATED SOLUTION SET
#1 Global acquirer (1) | ~$1.5Tn in payments volume | Leading cost eff iciency
Next-Gen Flexible Integrated Scalable Secure
Agile
Best-in-class Security
Customer Insights through
Data Analytics
0101
1010
Omni- Channel
Online Connectivity
Alternative Payments
Multi- Currency
Revenue Opportunities
Back-office Automation
UNMATCHED SCALE
Note:
1. Based on number of transactions; analysis of data published in The Nilson Report, issues 1095 (September 2016), 1105 (March 2017) and 1110 (May 2017)
32

Page 33 CONFIDENTIAL
September 2017 Vantiv, LLC
IV. Superior Financial Profile
The Combined Company will benefit from an attractive business model and financial profile, the hallmarks of which are recurring
revenue, scalability and significant operating margins.
Compelling Model – Visibility, Sustainability, Growth and Cash Flow
As shown above, the Combined Company will:
• Have a strong, diverse and loyal client base with limited client concentration. This will allow the Combined Company to continue to
benefit from a highly visible and recurring revenue model.
• When coupled with an industry-leading margin profile and operating scale efficiencies, the Combined Company will be able to realize
margin expansion opportunities through scalable technology and significant operating leverage and deliver continued earnings
growth. In addition, this will allow the Combined Company to generate high levels of free cash flow and create ample flexibil ity for the
Combined Company to strategically deploy capital and drive value for shareholders, including pursuing acquisition opportunities that
will extend the Combined Company’s capabilities into new markets and segments.
• On a pro forma basis assuming the combination had completed as at 30 June 2017 and taking into account the financing
arrangements entered into by Vantiv, LLC in connection with the combination and the Fifth Third Transaction and the expected
approximately $200 million annual recurring pre-tax cost synergies, the Combined Company’s gross and net leverage, calculated as
debt/EBITDA, would be 4.9x and 4.6x, respectively
(4). It is expected that the Combined Company, with its strong credit profile and
attractive cash flow, will look to reduce leverage on a consistent basis over the medium term, including a target of de-levering to a
4.0x debt to EBITDA leverage ratio over the next 12-18 months.
7. Credit Highlights
• Diversified client base
• 3 – 5 year contracts
• 12% transaction CAGR
(1) (’14 –’16)
• 15% net revenue
(1)(2) CAGR (’14 –’16)
• 48% Adjusted EBITDA Margins
(LTM 6/30)
• Superior cost efficiency
• 78% free cash flow conversion (3)
(LTM 6/30)
• 10% capital expenditures (LTM 6/30)
Highly Recurring
Revenue
Robust Organic
Growth Profile
Significant Operating
Leverage
Low Capital Intensity
• Value proposition drives high recurring
revenues
• Enviable client base with high retention
rates and limited client concentration
• Strong secular growth in electronic
payments
• Broad footprint across high growth markets
supports sustained organic growth
• Industry-leading margin profile
• Continued margin expansion opportunities
from scalable technology
• High free cash flow conversion provides
ample flexibility to deploy capital
• Ability to strategically enhance footprint,
distribution and technological capabilities
Results
Notes: Assumes exchange rate of $1.2967:£1
1. Calculated as a combination of both companies utilizing the exchange rate noted above per the 2.7 Announcement
2. Worldpay net revenue reflects reported gross profit for comparable reporting conventions to Vantiv, for illustrative purposes only
3. Free cash flow conversion defined as (Adjusted EBITDA – Capex) / Adjusted EBITDA
4. Assuming one-third of $200MM of run-rate synergies for illustrative purposes, the Combined Company’s gross and net leverage would be 5.1x and 4.8x, respectively
33

Page 34 CONFIDENTIAL
September 2017 Vantiv, LLC
IV. Superior Financial Profile (cont’d)
On a pro forma basis assuming the combination had completed on 31 December 2016, the Combined Company would have processed
approximately $1.5 trillion in payment volume and 40 billion transactions through more than 300 payment methods in 146 countries and
126 currencies with combined net revenue of over $3.2 billion. In this same time period, the combination would have produced a
company with $1.5 billion of adjusted EBITDA, an adjusted EBITDA margin of 48 percent and free cash flow generation of over $1.0
billion with 78 percent free cash flow conversion. The table below illustrates the Combined Company’s attributes on a pro forma basis
for 2016:
7. Credit Highlights
Notes: Assumes exchange rate of $1.2967£1
1. Figures shown are pro forma for Combined Company
2. Worldpay for illustrative purposes only; net revenue reflects reported gross profit for comparable reporting conventions to Vantiv; Underlying EBITDA shown for Worldpay, margin shown after taking into
effect net revenue to gross profit adjustment
3. Free cash flow defined as Adjusted EBITDA – Capex
4. Free cash flow conversion defined as (Adjusted EBITDA – Capex) / Adjusted EBITDA
+ (1)(2)
FY2016 (before synergies)
Transaction Volume ($Tn) $0.9 $0.6 $1.5Tn
Transactions (Bn) 25 15 40Bn
Net Revenue ($Bn) $1.9 $1.3 (2) $3.2Bn
Adjusted EBITDA ($Bn) $0.9 $0.6 $1.5Bn
Margin (%) 48% 47% (2) 48%
Free Cash Flow ($Bn) (3) $0.8 $0.4 $1.2Bn
Conversion (%) (4) 87% 66% 78%
34

Page 35 CONFIDENTIAL
September 2017 Vantiv, LLC
V. Significant Cost Synergies
The Combined Company is expected to benefit from synergies that could not be achieved independent of the combination. In
accordance with the Rules of the UK Takeover Code, Vantiv undertook a thorough synergies process and prepared a Quantified
Financial Benefits Statement (QFBS), prior to announcing the anticipated synergies figures publicly. This effort was prepared in concert
with Deloitte to produce an appropriately vetted and detailed synergies analysis. As a result of this analysis, it is expected that:
• The combination will result in annual recurring pre-tax cost synergies of approximately $200 million. The synergies are expected to
be fully realized by the end of the third year following completion of the combination.
• The majority of these cost synergies will be generated by harmonizing the Combined Company’s U.S. platforms and streamlining
corporate costs.
• Worldpay’s processing capabilities in the U.S. are expected to be migrated to Vantiv’s processing platforms and Worldpay’s legacy
platform will be retired.
• The Combined Company is expected to incur one-off restructuring and integration costs of approximately $330 million. The majority
of these costs will be incurred by the end of the second year following completion of the combination.
Identifiable and Achievable Cost Synergies
7. Credit Highlights
$200MM Estimated Run-Rate Cost Synergies
By End of Third Year Post Close
Annual Run-Rate Synergies
U.S. Technology, Operations and
Selling, General & Administrative
Expenses 63%
Group General & Administrative
Expenses 22%
eCom Technology, Operations and
Selling, General & Administrative
Expenses 15%
1
2
3
35
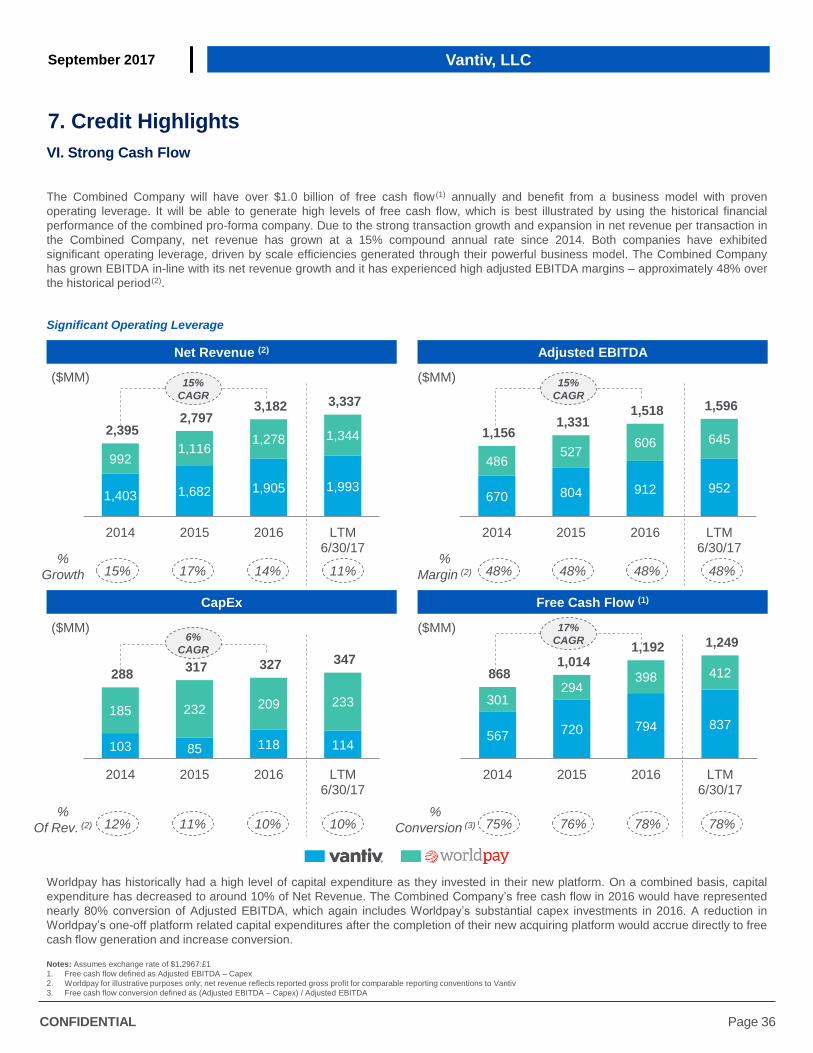
Page 36 CONFIDENTIAL
September 2017 Vantiv, LLC
VI. Strong Cash Flow
The Combined Company will have over $1.0 billion of free cash flow
(1) annually and benefit from a business model with proven
operating leverage. It will be able to generate high levels of free cash flow, which is best illustrated by using the historical financial
performance of the combined pro-forma company. Due to the strong transaction growth and expansion in net revenue per transaction in
the Combined Company, net revenue has grown at a 15% compound annual rate since 2014. Both companies have exhibited
significant operating leverage, driven by scale efficiencies generated through their powerful business model. The Combined Company
has grown EBITDA in-line with its net revenue growth and it has experienced high adjusted EBITDA margins – approximately 48% over
the historical period (2).
Significant Operating Leverage
Worldpay has historically had a high level of capital expenditure as they invested in their new platform. On a combined basis, capital
expenditure has decreased to around 10% of Net Revenue. The Combined Company’s free cash flow in 2016 would have represented
nearly 80% conversion of Adjusted EBITDA, which again includes Worldpay’s substantial capex investments in 2016. A reduction in
Worldpay’s one-off platform related capital expenditures after the completion of their new acquiring platform would accrue directly to free
cash flow generation and increase conversion.
1,403 1,682 1,905 1,993
992 1,116
1,278 1,344 2,395 2,797
3,182 3,337
2014 2015 2016 LTM6/30/17
7. Credit Highlights
670 804 912 952
486 527
606 645 1,156
1,331 1,518 1,596
2014 2015 2016 LTM6/30/17
($MM) ($MM)
48% 48% 48% 48% %
Margin (2) 15% 17% 14% 11% %
Growth
15%
CAGR
Net Revenue (2) Adjusted EBITDA
15%
CAGR
CapEx Free Cash Flow (1)
Notes: Assumes exchange rate of $1.2967:£1
1. Free cash flow defined as Adjusted EBITDA – Capex
2. Worldpay for illustrative purposes only; net revenue reflects reported gross profit for comparable reporting conventions to Vantiv
3. Free cash flow conversion defined as (Adjusted EBITDA – Capex) / Adjusted EBITDA
103 85 118 114
185 232 209 233
288 317 327 347
2014 2015 2016 LTM6/30/17
567 720 794 837
301 294
398 412 868 1,014
1,192 1,249
2014 2015 2016 LTM6/30/17
75% 76% 78% 78% %
Conversion (3) 12% 11% 10% 10% %
Of Rev. (2)
($MM) ($MM) 6%
CAGR
17%
CAGR
36

Page 37 CONFIDENTIAL
September 2017 Vantiv, LLC
VI. Strong Cash Flow (cont’d)
Vantiv’s management has historically used the company’s significant free cash flow to enable it to consistently de-lever. Vantiv has
shown discipline in managing leverage levels post acquisition. The company has opportunistically increased leverage a few times –
including in 2014 to fund the Mercury transaction – and has subsequently quickly de-levered back down again, by nearly a turn per year,
in both 2012 and 2015.
Vantiv’s Consistent Track Record of De-levering
7. Credit Highlights
Notes:
1. Includes additional addbacks for Vantiv covenant EBITDA purposes; ~$40MM incremental addback as of 6/30/2017
2. Leverage increase in 2014 driven by financing for the Mercury acquisition
3.2x
2.4x 2.8x
4.2x
3.6x 3.3x
3.5x
2011A 2012A 2013A 2014A 2015A 2016A LTM6/30/17
4.0x
2.5x
3.1x
4.8x
3.9x
3.4x 3.6x
2011A 2012A 2013A 2014A 2015A 2016A LTM6/30/17
Gross Debt / Adjusted EBITDA (1)(2)
Net Debt / Adjusted EBITDA (1)(2)
De-levering Post Mercury
De-levering Post Mercury
37

Page 38 CONFIDENTIAL
September 2017 Vantiv, LLC
8. Historical Financial Results & Management’s Discussion and Analysis
I. Vantiv Historical Financial Results
Notes:
1. Defined as adjusted EBITDA - capital expenditures
2. Includes $33MM of capital lease obligations as of August 2017
Fiscal Year Ended December 31, 6 Months Ended LTM CAGR
($ in millions) 2014 2015 2016 6/30/2016 6/30/2017 6/30/2017 '14 - '16
Merchant Services Net Revenue 1,067 1,336 1,546 729 835 1,652 20%
% Growth 27% 25% 16% 16% 15% 15%
Financial Institutions Net Revenue 336 346 359 183 165 341 3%
% Growth 0% 3% 4% 7% (10%) (5%)
Total Net Revenue 1,403 1,682 1,905 912 1,000 1,993 17%
% Growth 20% 20% 13% 14% 10% 11%
Income from Operations 315 434 569 257 227 539 34%
% Margin 22% 26% 30% 28% 23% 27%
Depreciation and Amortization 275 277 270 133 154 291
Adjusted EBITDA 670 804 912 427 466 952 17%
% Growth 15% 20% 13% 14% 9% 11%
% Margin 48% 48% 48% 47% 47% 48%
Net Income 169 209 281 131 122 272 29%
Less: Net Income Attributable to NCI (44) (61) (68) (32) (24) (60) 24%
Net Income Attributable to Vantiv, Inc. 125 148 213 99 98 212 30%
Capital Expenditures 103 85 118 63 59 114 7%
% Margin 7% 5% 6% 7% 6% 6%
Free Cash Flow (1) 567 720 794 364 407 837 18%
Total Debt 3,417 3,090 3,242 3,024 3,570 3,570
Cash and Cash Equivalents 412 197 139 203 120 120
Net Debt 3,005 2,893 3,103 2,822 3,450 3,450
(2) (2)
38

Page 39 CONFIDENTIAL
September 2017 Vantiv, LLC
8. Historical Financial Results & Management’s Discussion and Analysis
II. Vantiv Management’s Discussion and Analysis
Six Months Ended June 30, 2017 vs. Six Months Ended June 30, 2016
Net Revenue
Net revenue in the Merchant Services segment increased 15% to $835.0 million for the six months ended June 30, 2017
from $729.0 million for the six months ended June 30, 2016. The increase during the six months ended June 30, 2017 was
primarily due to transaction growth of 10% and a 4% increase in net revenue per transaction associated with continued
penetration of small and mid-sized merchants.
Net revenue in the Financial Institutions segment decreased 10% to $165.1 million for the six months ended June 30, 2017
from $182.7 million for the six months ended June 30, 2016. The decrease during the six months ended June 30, 2017 was
due to an 8% decrease in transactions and lower net revenue per transaction primarily driven by compression from the
Fifth Third contract renewal and the de-conversion of a major client.
Total Net revenue, which is revenue less network fees and other costs, increased 10% to $1,000.1 million for the six
months ended June 30, 2017 from $911.7 million for the six months ended June 30, 2016 due to the factors discussed
above.
Sales and Marketing
Sales and marketing expense increased 15% to $323.3 million for the six months ended June 30, 2017 from $280.5 million
for the six months ended June 30, 2016. The increase was primarily attributable to higher residual payments to referral
partners as a result of increased revenue in the Merchant Services segment in connection with the continued penetration of
small and mid-sized merchants.
Other Operating Costs
Other operating costs increased 5% to $154.9 million for the six months ended June 30, 2017 from $147.3 million for the
six months ended June 30, 2016. When excluding transition, acquisition and integration costs, other operating costs
increased 4% to $146.6 million for the six months ended June 30, 2017 from $141.3 million for the six months ended June
30, 2016. The increase is primarily attributable to an increase in information technology and operation costs, in support of
revenue growth.
General and Administrative
General and administrative expenses increased 50% to $140.0 million for the six months ended June 30, 2017 from $93.1
million for the six months ended June 30, 2016. When excluding transition, acquisition and integration costs, which include
a $38 million charge related to a settlement agreement stemming from legacy litigation of an acquired company, as well as
share-based compensation costs, general and administrative expenses increased 1% to $64.0 million for the six months
ended June 30, 2017 from $63.2 million for the six months ended June 30, 2016.
Depreciation and Amortization
Depreciation expense associated with property, equipment and software increased to $43.2 million for six months ended
June 30, 2017 from $34.2 million for the six months ended June 30, 2016. The increase is primarily attributable to recent
acquisitions.
Amortization expense associated with intangible assets, which consist primarily of customer relationship intangible assets,
increased to $111.3 million for the six months ended June 30, 2017 from $99.3 million for the six months ended June 30,
2016. The increase is primarily attributable to an increase in amortization of customer relationship intangible assets as a
result of recent acquisitions.
Income from Operations
Income from operations decreased 12% to $227.5 million for the six months ended June 30, 2017 from $257.3 million for
the six months ended June 30, 2016.
39

Page 40 CONFIDENTIAL
September 2017 Vantiv, LLC
II. Vantiv Management’s Discussion and Analysis (cont’d)
Six Months Ended June 30, 2017 vs. Six Months Ended June 30, 2016
Interest Expense—Net
Interest expense—net increased to $58.9 million for the six months ended June 30, 2017 from $53.8 million for the six
months ended June 30, 2016. This increase in interest expense—net is primarily attributable to October 2016 debt
refinancing, which resulted in an increase in the amount of outstanding debt and interest rate swaps.
Non-Operating Expense
Non-operating expense were $4.7 million and $10.3 million for the three and six months ended June 30, 2016, respectively,
primarily relating to the change in fair value of the TRA entered into as part of the acquisition of Mercury.
Income Tax Expense
Income tax expense for the six months ended June 30, 2017 was $38.9 million compared to $62.3 million for the six
months ended June 30, 2016, reflecting effective rates of 24.1% and 32.2%, respectively. Vantiv’s effective rate reflects the
impact of non-controlling interests not being taxed at the statutory corporate tax rates. The effective tax rate for the six
months ended June 30, 2017 includes a $14.1 million credit to income tax expense as a result of adoption of ASU 2016-09,
Compensation - Stock Compensation (Topic 718) - Improvements to Employee Share-Based Payment Accounting.
8. Historical Financial Results & Management’s Discussion and Analysis
40

Page 41 CONFIDENTIAL
September 2017 Vantiv, LLC
II. Vantiv Management’s Discussion and Analysis (cont’d)
Fiscal Year Ended December 31, 2016 vs. Fiscal Year Ended December 31, 2015
Net Revenue
Net revenue in the Merchant Services segment increased 16% to $1,545.9 million for the year ended December 31, 2016
from $1,335.6 million for the year ended December 31, 2015. The increase during the year ended December 31, 2016 was
due primarily to transaction growth of 11% and a 5% increase in net revenue per transaction associated with continued
penetration of small and mid-sized merchants.
Net revenue in the Financial Institutions segment increased 4% to $358.9 million for the year ended December 31, 2016
from $346.1 million for the year ended December 31, 2015. The increase during the year ended December 31, 2016 was
due to a 4% increase in net revenue per transaction primarily due to value-added services including the impact of EMV
card reissuance and fraud related services.
Total Net revenue increased 13% to $1,904.8 million for the year ended December 31, 2016 from $1,681.7 million for the
year ended December 31, 2015 due to the factors discussed above.
Sales and Marketing
Sales and marketing expense increased 16% to $582.3 million for the year ended December 31, 2016 from $503.9 million
for the year ended December 31, 2015. The increase was primarily attributable to higher residual payments to referral
partners as a result of increased revenue in the Merchant Services segment in connection with the continued penetration of
small and mid-sized merchants.
Other Operating Costs
Other operating costs increased 4% to $294.2 million for the year ended December 31, 2016 from $284.1 million for the
year ended December 31, 2015. When excluding transition, acquisition and integration costs, other operating costs
increased 11% to $285.4 million for the year ended December 31, 2016 from $256.3 million for the year ended December
31, 2015. The increase was primarily attributable to an increase in information technology and operation costs, in support
of revenue growth.
General and Administrative
General and administrative expenses increased 4% to $189.7 million for the year ended December 31, 2016 from $182.4
million for the year ended December 31, 2015. When excluding transition, acquisition and integration costs as well as
share-based compensation, general and administrative costs increased 7% to $125.2 million for the year ended December
31, 2016 from $117.1 million for the year ended December 31, 2015. General and administrative expenses continue to
grow slower than net revenue as Vantiv continues to drive efficiencies in the back office.
Depreciation and Amortization
Depreciation expense associated with property, equipment and software decreased to $70.5 million for the year ended
December 31, 2016 from $76.6 million for the year ended December 31, 2015.
Amortization expense associated with intangible assets, which consist primarily of customer relationship intangible assets,
decreased to $199.6 million for the year ended December 31, 2016 from $200.4 million for the year ended December 31,
2015.
Income from Operations
Income from operations increased 31% to $568.5 million for the year ended December 31, 2016 from $434.4 million for the
year ended December 31, 2015.
Interest Expense—Net
Interest expense—net increased to $109.5 million for the year ended December 31, 2016 from $105.7 million for the year
ended December 31, 2015. The increase in interest expense—net is primarily attributable to interest rate swaps.
8. Historical Financial Results & Management’s Discussion and Analysis
41

Page 42 CONFIDENTIAL
September 2017 Vantiv, LLC
II. Vantiv Management’s Discussion and Analysis (cont’d)
Fiscal Year Ended December 31, 2016 vs. Fiscal Year Ended December 31, 2015
Non-Operating Income (Expense)
Non-operating expenses were $36.3 million for the year ended December 31, 2016, related to the change in fair value of
the Mercury TRA entered into as part of the acquisition of Mercury and a charge related to the October 2016 debt
refinancing. Non-operating expense was $31.3 million for the year ended December 31, 2015, primarily related to the
change in fair value of the Mercury TRA.
Income Tax Expense
Income tax expense for the year ended December 31, 2016 was $141.9 million compared to $88.2 million for the year
ended December 31, 2015, reflecting effective rates of 33.6% and 29.6%, respectively. Vanitv’s effective rate reflects the
impact of non-controlling interest not being taxed at the statutory corporate tax rates. As Vantiv’s non-controlling interest
declines to the point Vantiv Holding is a wholly-owned subsidiary, Vantiv’s expects the effective rate to increase to
approximately 36.0%.
8. Historical Financial Results & Management’s Discussion and Analysis
42

Page 43 CONFIDENTIAL
September 2017 Vantiv, LLC
I. Worldpay Historical Financial Results
Notes:
1. Net revenue reflects reported gross profit for comparable reporting conventions to Vantiv
2. Segment net revenue estimated by allocating total gross profit using reported net revenue % of total
3. Reflects reported net revenue growth
4. WPUS growth reflects constant currency for FY2015, FY2016, 6 months ended 6/30/2016 and 6 months ended 6/30/2017
5. Defined as adjusted EBITDA - capital expenditures
6. Net of issuance discount and other related costs
7. Excludes cash held on behalf of CVR holders
8. Historical Financial Results & Management’s Discussion and Analysis
Fiscal Year Ended December 31, 6 Months Ended LTM CAGR
(£ in millions) 2014 2015 2016 6/30/2016 6/30/2017 6/30/2017 '14 - '16
Global eCommerce Net Revenue (1)(2) 241 278 339 166 193 366 19%
% Growth (3) 18% 17% 22% 25% 17% 17%
WPUK Net Revenue (1)(2) 324 355 384 187 191 388 9%
% Growth (3) 8% 11% 8% 12% 2% 3%
WPUS Net Revenue (1)(2) 200 227 262 120 140 283 15%
% Growth (3)(4) (1%) 7% 2% 5% 3% 18%
Total Net Revenue (1) 765 860 985 473 524 1,036 13%
% Growth (3) 9% 12% 15% 16% 11% 12%
Operating Profit 296 341 389 182 190 398 15%
% Margin 39% 40% 40% 38% 36% 38%
Underlying Depreciation and Amort. 78 66 78 36 57 99
Underlying EBITDA 375 406 468 218 248 497 12%
% Growth 8% 8% 15% 19% 14% 13%
% Margin 49% 47% 47% 46% 47% 48%
Profit 92 138 245 112 129 262 64%
Capital Expenditures 143 179 161 82 101 180 6%
% Margin 19% 21% 16% 17% 19% 17%
Free Cash Flow (5) 232 227 307 136 147 318 15%
Total Debt (6) 2,423 1,591 1,681 1,640 1,669 1,669
Cash and Cash Equivalents (7) 169 165 313 267 360 360
Net Debt 2,254 1,425 1,368 1,373 1,309 1,309
43

Page 44 CONFIDENTIAL
September 2017 Vantiv, LLC
II. Worldpay Management’s Discussion and Analysis
Six Months Ended June 30, 2017 vs. Six Months Ended June 30, 2016
Revenue
Revenue of £2,509.5m (2016: £2,135.6m) was £373.9m, or 18%, higher than in the prior year. This reflected an 11%
increase in total transaction value driven by a 6% increase in total transactions and a 4% increase in average transaction
value. The year-on-year increase also benefited from foreign currency translation on the WPUS revenue of £152.4m,
therefore on a constant currency basis, revenue increased by 10%.
Net revenue
Net revenue at £600.5m increased by £60.8m, or 11% (2016: £539.7m) and net revenue as a percentage of total
transaction value remained stable at 0.25%. On a constant currency basis, the growth in net revenue was 7% and reflects
a 17% increase in the Global eCom business, a 2% increase in WPUK and a 3% increase in WPUS.
The increase in Global eCom reflects strong growth across most products and verticals and all geographic regions.
Worldpay also continued to benefit from the translation of non-Sterling trading as a result of the weakening of Sterling.
In WPUK, transaction volumes grew by 9% and value grew by 4% as Worldpay saw strong growth in the Large Corporates
sector offset by weaker trading in Small Corporate and SMB business. Also affecting the net revenue performance year-on-
year was the loss of Visa Europe rebates in late 2016 (following the acquisition of Visa Europe by Visa Inc.) as well as
increases in scheme fees year-on year and a one-off timing benefit from a reduction in interchange costs in the first half of
2016. Worldpay also experienced a slowdown in consumer spending and weaker sales in the last two months of the
period.
In WPUS, the 3% underlying growth benefitted from a reclassification of debit routing income from the schemes to net
revenue from cost of sales. There was no impact on gross profit or underlying EBITDA. Excluding this, net revenue and
transaction volumes were broadly flat year-on-year as growth in Corporate and Partnerships was offset by the continued
decline in ATMs and an increase in scheme fees.
Gross profit (comparable to Vantiv Net Revenue and indicated as Net Revenue on page 43)
Gross profit increased by £50.9m, or 11%, to £523.7m (2016: £472.8m). On a constant currency basis the growth was 7%
and reflects an 18% increase in the Global eCom business and a 2% increase in WPUK. Gross profit in WPUS was
unchanged.
Underlying personnel and net operating expenses
Underlying personnel and net operating expenses increased by £21.3m, or 8%, to £276.2m (2016: £254.9m) and included
for the first time from 1 April 2017, the costs associated with the running of the New Acquiring Platform of £5.9m. On a
constant currency basis, the increase in net operating costs was 4% which was significantly lower than the net revenue
growth and demonstrates a continued focus on cost control and operating efficiency.
Underlying EBITDA
Underlying EBITDA increased by £29.6m, or 14%, to £247.5m (2016: £217.9m). On a constant currency basis the growth
was 11%, reflecting a 20% increase in Global eCom, a 2% increase in WPUK and a 12% increase in WPUS, offset by a
9% increase in Corporate costs. Underlying EBITDA as a percentage of net revenue was 41.2% compared with 40.4% in
the prior year.
8. Historical Financial Results & Management’s Discussion and Analysis
44

Page 45 CONFIDENTIAL
September 2017 Vantiv, LLC
II. Worldpay Management’s Discussion and Analysis (cont’d)
Six Months Ended June 30, 2017 vs. Six Months Ended June 30, 2016
Underlying depreciation and amortization
Underlying depreciation and amortization increased by £20.8m, or 57%, to £57.2m (2016: £36.4m). On a constant currency
basis, the increase was 52% and reflects higher levels of capital expenditure as well as the commencement, in April 2017,
of amortization on the remaining components of Worldpay’s new acquiring platform which adds approximately £18m this
financial year to the Group’s depreciation and amortization charge.
Total costs incurred to 30 June 2017 on the new acquiring platform programme are £569.7m, of which £368.6m has been
included within tangible and intangible assets on the balance sheet and is being depreciated, with the remainder charged
directly to the income statement.
Underlying finance costs
Underlying finance costs at £29.3m were broadly in line with the prior year (2016: £28.2m). The average cost of debt during
the period was 3.1%.
Gain on disposal of investment and subsidiary
During the period the Group made a partial disposal of its investment in Blue Star Sports Holdings Inc., realising a gain on
disposal of £7.5m. It also disposed of its Swedish subsidiary realising a loss on disposal of £0.6m.
Share of results of joint venture and associate
The share of results of joint venture and associate was a loss of £0.6m in the period (2016: loss of £0.5m) and reflects
Worldpay’s remaining investment in Pazien Inc..
Profit before tax
Profit before tax was £128.9m (2016: £168.6m). The movement year-on-year reflects the continued strong underlying
trading performance in the Global eCom division and strong cost control throughout the Group, as well as the reduction in
separately disclosed items affecting EBITDA, offset by increased depreciation and the movements in separately disclosed
items affecting finance income/(costs).
Tax
The tax charge on underlying results for the Group was £38.8m (2016: £40.5m), representing both current tax and deferred
tax charges. The underlying tax charge has been calculated by applying an estimate of the underlying effective tax rate for
the full year of 23.2% which is higher than the UK headline rate for the year of 19.25% primarily due to profits in overseas
territories with higher taxation rates, along with non-deductible costs.
The tax credit of £3.0m (2016: charge of £69.5m) arising on separately disclosed items comprises a credit of £11.4m offset
by a tax charge of £8.4m in relation to Visa Europe. The prior year charge for the six months to 30 June 2016 includes a
tax charge of £86.5m relating to the disposal of the interest in Visa Europe.
After including separately disclosed items, the Group’s total tax charge for the period was £35.8m (2016: £110.0m).
8. Historical Financial Results & Management’s Discussion and Analysis
45

Page 46 CONFIDENTIAL
September 2017 Vantiv, LLC
II. Worldpay Management’s Discussion and Analysis (cont’d)
Fiscal Year Ended December 31, 2016 vs. Fiscal Year Ended December 31, 2015
Revenue
Revenue of £4,540.8m (2015: £3,963.0m) was £577.8m, or 15%, higher than in the prior year. This reflected a 12%
increase in total transaction value driven by a 14% increase in total transactions, partly offset by a 2% fall in average
transaction value. The year-on-year increase also benefited from foreign currency translation on the WPUS revenue of
£248.7m.
Net revenue
Net revenue increased by £142.5m, or 15%, to £1,124.2m (2015: £981.7m) and net revenue as a percentage of total
transaction value increased by one basis point to 0.25%. On a constant currency basis, the growth was 11% and reflects a
22% increase in the Global eCom business, an 8% increase in WPUK and a 2% increase in WPUS.
The increase in Global eCom reflects strong growth across a number of products, especially net acquiring income and
treasury management and foreign exchange services. Worldpay also benefited from the translation of non-Sterling trading
as a result of the weakening of Sterling. Transaction volumes increased by 30%, which was higher than expected due to
the unusually strong performance in the first half and the benefit of some non-recurring items. Volumes were particularly
strong in the Digital Content vertical where transaction values are typically lower. As a result, the average transaction value
fell by 6% but net revenue as a percentage of transaction value remained strong at 0.32%.
In WPUK, strong client acquisition and cross-sales, particularly in SMB and Small Corporate, as well as continuing growth
in the use of cards as a payment mechanism, led to a 7% increase in transaction volumes. Total transaction value grew by
3%, reflecting the increase in the use of contactless payments for lower value purchases and the continued retail price
deflation. Net revenue as a percentage of total transaction value increased by one basis point to 0.21%, benefiting from
increased cross-sales of transformational products and services and, in the first half, the effect of lower interchange costs
on the acquiring margin.
In WPUS, the 2% underlying growth was driven principally by acquiring volume growth, reflecting an increase in
transaction volumes in both the Small and Corporate Business segments. Transaction volumes were up 7%, principally
driven by growth in the Corporate segment where margins are typically lower than in the Small Business Unit. Continued
downward pressure on petrol prices led to a decline in average transaction values of 2%.
Gross profit (comparable to Vantiv Net Revenue and indicated as Net Revenue on page 43)
Gross profit increased by £124.8m, or 15%, to £985.2m (2015: £860.4m). On a constant currency basis the growth was
11% and reflects a 21% increase in the Global eCom business, an 8% increase in WPUK and a 3% increase in WPUS.
The increase in Global eCom and WPUK was driven by the net revenue improvements noted earlier. In WPUS, lower
commission payments resulted in a slight improvement in the gross profit growth rate compared to the net revenue growth
rate.
8. Historical Financial Results & Management’s Discussion and Analysis
46

Page 47 CONFIDENTIAL
September 2017 Vantiv, LLC
II. Worldpay Management’s Discussion and Analysis (cont’d)
Fiscal Year Ended December 31, 2016 vs. Fiscal Year Ended December 31, 2015
Underlying personnel and net operating expenses
Underlying personnel and net operating expenses increased by £63.3m, or 14%, to £517.6m (2015: £454.3m). On a
constant currency basis the increase was 10% and reflected both higher staff and non-staff costs.
The average number of employees increased to 5,095 from 4,982 in the prior year. The increase was largely driven by
recruitment in the latter half of 2015 to enhance capabilities in sales, marketing and lead generation, product development
and product management. In addition, there was further investment in 2016 in technology expertise and data analytics to
support the ambitious growth plans of the Group and in central functions to support listed company requirements. Bonus
costs also increased reflecting the higher headcount and the outperformance against targets.
Non-staff cost increases included higher rent costs following the move to a new WPUS office and data center in Atlanta;
increased security spend; higher advertising costs reflecting the growth in sales; and additional costs in Corporate as a
result of becoming a listed company. In addition, bad debt expenses increased by £5.3m to £20.8m, partly reflecting the
increased transaction volumes and partly as a result of a specific provision for chargebacks in relation to a car hire
company which went into administration in January 2017.
Underlying EBITDA
Underlying EBITDA increased by £61.5m, or 15%, to £467.6m (2015: £406.1m). On a constant currency basis the growth
was 13%, reflecting an 18% increase in Global eCom, an 11% increase in WPUK, a 9% increase in WPUS and a 28%
increase in Corporate costs. Underlying EBITDA as a percentage of net revenue was 41.6% compared with 41.4% in the
prior year.
Underlying depreciation and amortization
Underlying depreciation and amortization increased by £12.8m, or 20%, to £78.4m (2015: £65.6m). On a constant currency
basis, the increase was 16%. This increase reflects higher levels of capital expenditure (excluding expenditure on
Worldpay’s new acquiring platform). At 31 December 2016, the total amount recorded in intangible assets under
construction in relation to Worldpay’s new acquiring platform was £291.5m (31 December 2015: £235.3m). Amortization on
Worldpay’s new acquiring platform has been low to date. However, as the assets become available for use, this will lead to
a substantial increase in the underlying depreciation and amortization charge. Once in use, these assets will be
depreciated over 10 years.
Underlying finance costs
Underlying finance costs at £60.3m (2015: £151.2m) were £90.9m lower than the prior year. The substantial decrease
reflects the benefit from the change in the Group’s capital structure following the IPO in October 2015. The average cost of
debt was 3.1%.
8. Historical Financial Results & Management’s Discussion and Analysis
47

Page 48 CONFIDENTIAL
September 2017 Vantiv, LLC
II. Worldpay Management’s Discussion and Analysis (cont’d)
Fiscal Year Ended December 31, 2016 vs. Fiscal Year Ended December 31, 2015
Disposal of interest in Visa Europe
On 21 June 2016, the Group disposed of its interest in Visa Europe to Visa Inc. and received a mixture of cash and non-
cash consideration valued at €1,051.3m. The consideration was made up of €589.7m up-front cash, €405.4m of Series B
preferred stock in Visa Inc. and €56.2m deferred cash which will be paid in three years. €547.5m of the up-front cash
consideration and all of the preferred stock may be reduced by any final settlement of potential liabilities relating to ongoing
interchange-related litigation involving Visa Europe. On disposal of the Visa Europe shares, the Group, along with the other
former members of Visa Europe, entered into a Litigation Management Deed (LMD). Under this arrangement, potential
losses from Visa Europe interchange litigation will be set against the preferred stock, through adjusting the ratio of
conversion to ordinary stock. A Loss Sharing Agreement (LSA) entered into by Worldpay, along with the ten other largest
UK members of Visa Europe, provides a second level of protection to Visa Inc., capped at the €547.5m of up-front cash
consideration.
The holders of the CVRs (a separate class of shares in the Company) are entitled to 90% of the net post-tax proceeds of
the disposal in accordance with the terms of the CVRs (subject to the Company’s right of retention), with Worldpay
retaining 10% of the net proceeds.
The Visa Europe asset was recognized in the Group’s balance sheet at 31 December 2015 as a fair value through profit
and loss financial asset. On disposal, it has been derecognized from the Group’s balance sheet and the elements of
consideration and the potential losses related to the interchange litigation set out above, recognized along with the
corresponding tax liabilities. The CVR liabilities have also been revalued to reflect the impact of the transaction.
The initial gain on the disposal of the Visa Europe shares of £207.0m (2015: share revaluation gain of £195.7m) together
with related fair value and FX gains and dividends received on the preference shares and cash received of £64.6m (2015:
nil) has been recognized in finance income in the Group’s income statement as a separately disclosed item. These have
been partly offset by a loss on valuation of the related CVR liabilities of £161.7m (2015: £140.9m). Tax on the above gain
was £91.9m. The cumulative post-tax gain attributable to the shareholders of Worldpay is £33.6m, of which £18.0m was
recognized in 2016 and £15.6m in 2015.
Profit before tax
Profit before tax was £264.1m (2015: £19.1m). The improvement reflects the strong underlying trading performance,
together with a reduction in underlying finance costs and the net gain in relation to the disposal of Visa Europe, partly offset
by the foreign exchange losses.
Tax
The tax charge on underlying results for the Group increased by £32.4m, or 65%, to a charge of £82.1m in the year ended
31 December 2016 (2015: £49.7m), representing both current tax and deferred tax charges. The underlying tax charge was
driven principally by taxable profits arising in the UK, US and Netherlands, partly offset by utilisation of brought forward
taxable losses in the US.
The charge reflects an effective tax rate on underlying results of 25.1%, which is higher than the UK headline rate for the
year of 20.0% primarily due to profits in overseas territories with higher taxation rates, along with non-deductible costs.
The tax charge of £50.5m (2015: credit of £0.8m) arising on separately disclosed items includes a tax charge of £91.9m
relating to the disposal of the interest in Visa Europe. This is relatively high as no deferred tax asset has been recognised
on the estimated liability under the LSA in excess of that which has been offset against the Visa Inc. preference shares.
After including separately disclosed items, the Group’s total tax charge increased by £83.7m to £132.6m in the year ended
31 December 2016 (2015: £48.9m), inclusive of the tax on the disposal of Visa Europe.
8. Historical Financial Results & Management’s Discussion and Analysis
48
Page 49 CONFIDENTIAL
September 2017 Vantiv, LLC
9. Summary Terms and Conditions
Posted separately to Intralinks
49