Embed Size (px)
Citation preview

Confidential: For Review Only
Health Effects of Non-sugar Sweeteners: Systematic Review
and Meta-analysis
Journal: BMJ
Manuscript ID BMJ.2018.046063
Article Type: Research
BMJ Journal: BMJ
Date Submitted by the Author: 18-Jul-2018
Complete List of Authors: Toews, Ingrid; Universitatsklinikum Freiburg Medizinische Universitatsklinik, Institute for Evidence in Medicine Lohner, Szimonetta; Pecsi Tudomanyegyetem Termeszettudomanyi Kar, Cochrane Hungary Kuellenberg de Gaudry, Daniela; Medical Center - University of Freiburg,
Institute for Evidence in Medicine Sommer, Harriet; Medical Center - University of Freiburg, German Cochrane Centre; Universitatsklinikum Freiburg Medizinische Universitatsklinik, Institute for Medical Biometry and Statistics Meerpohl, Joerg; Medical Center - University of Freiburg, German Cochrane Centre
Keywords: non-sugar sweeteners, systematic review, meta-analysis, obesity, diabetes, aspartame, GRADE, guideline
https://mc.manuscriptcentral.com/bmj
BMJ

Confidential: For Review Only
1
HEALTH EFFECTS OF NON-SUGAR SWEETENERS: SYSTEMATIC REVIEW AND META-ANALYSIS
Ingrid Toews IT, researcher1, Szimonetta Lohner SL, researcher2, Daniela Küllenberg de Gaudry DKdG, researcher1, Harriet Sommer HS, researcher1, 3, Joerg J
Meerpohl JJM, co-director1, 4
1 Cochrane Germany, Medical Center - University of Freiburg, Faculty of Medicine, University of Freiburg, Breisacher Str. 153, 79110 Freiburg, Germany
2 Cochrane Hungary, Medical Center, University of Pécs, Rákóczi út 2, 7623 Pécs, Hungary
3 Institute for Medical Biometry and Statistics, Medical Center – University of Freiburg, Faculty of Medicine, University of Freiburg, Stefan-Meyer-Str. 26, 79104
Freiburg, Germany
4 Centre de Recherche Épidémiologie et Statistique Sorbonne Paris Cité – U1153, Inserm / Université Paris Descartes, Cochrane France, Hôpital Hôtel-Dieu, 1
place du Parvis Notre Dame, 75181 Paris Cedex 04, France
Correspondence to: Joerg J Meerpohl, [email protected], Breisacher Str. 153, 79110 Freiburg, Germany, Tel: +49 761 203 6691
Word count: 6178
Page 1 of 49
https://mc.manuscriptcentral.com/bmj
BMJ
123456789101112131415161718192021222324252627282930313233343536373839404142434445464748495051525354555657585960

Confidential: For Review Only
2
ABSTRACT
Objective
To assess the effects of any type of non-sugar sweetener (NSS) on different health outcomes in healthy adults and children, or overweight and obese
populations in weight loss studies.
Design
We conducted a systematic review following standard Cochrane review methodology. Final study selection, data extraction and risk of bias assessment were
carried out by two authors independently. We combined study data in meaningful meta-analyses whenever possible. All other outcome data were narratively
synthesised. Statistical analyses were conducted in the statistical software environment, R. Mean differences and relative risks or odds ratios with 95%
confidence interval were reported.
Data sources
We searched for studies in Medline (Ovid), EMBASE, the Cochrane Library, the WHO ICTRP, ClinicaltTrials.gov and reference lists of relevant publications.
Eligibility criteria for selecting studies
Studies including healthy adults or children with or without overweight or obesity were eligible. We included all study designs that allowed for a direct
concurrent comparison of effects. The NSSs used had to be clearly named, the dose had to be within the acceptable daily intake (ADI) as established by
recognised regulatory bodies, and the intervention duration had to be at least 7 days.
Results
Our search resulted in 13941 unique records. 67 references, reporting on 57 individual studies provided data for this review. In adults, there was evidence of
very low and low certainty from a limited number of small studies for a small beneficial effect of NSSs on BMI, fasting blood glucose, energy intake, sugar
intake, and blood pressure and evidence of very low certainty that higher doses of NSSs were associated with greater weight gain compared to lower doses. For
all other outcomes no differences were detected when comparing no NSSs usage to NSSs usage, or comparing different doses of NSSs. There was no evidence
of any effect of NSSs on overweight and/or obese adults actively trying to lose weight (very low to moderate certainty). In children, a smaller increase in BMI z-
score was observed with NSSs intake compared to no intake (moderate certainty of evidence), but no significant differences were observed in body weight (low
Page 2 of 49
https://mc.manuscriptcentral.com/bmj
BMJ
123456789101112131415161718192021222324252627282930313233343536373839404142434445464748495051525354555657585960

Confidential: For Review Only
3
certainty of evidence), or when comparing different doses of NSSs (very low to moderate certainty). There was no evidence of any effect of NSSs on overweight
and/or obese children actively trying to lose weight (very low to low certainty of evidence).
Conclusions
For most outcomes there seemed to be no difference between the intervention and control groups. We identified very few studies for each outcome, most of
these had small numbers of participants, and many were of very short duration. We therefore have limited confidence in the reported effects. The
methodological and reporting quality of the included studies is limited. Future studies should assess the effects of NSSs on health with a minimum intervention
duration of 7 days. Detailed descriptions of interventions, comparators and outcomes should be included in all reports.
Systematic review registration
This systematic review is registered in Prospero under CRD42017047668 available from:
http://www.crd.york.ac.uk/PROSPERO/display_record.php?ID=CRD42017047668
Keywords: Non-sugar sweeteners, systematic review, meta-analysis, overweight, obesity, diabetes, dental health, aspartame, stevia, sucralose, saccharin,
GRADE, guideline
Page 3 of 49
https://mc.manuscriptcentral.com/bmj
BMJ
123456789101112131415161718192021222324252627282930313233343536373839404142434445464748495051525354555657585960
Confidential: For Review Only
4
INTRODUCTION
Growing concerns about health and quality of life have encouraged people to adapt healthy lifestyles and avoid the consumption of food rich in sugars, salt, or
fat to prevent obesity and other non-communicable diseases. With increased consumer interest in reducing energy intake, food products containing non-sugar
sweeteners (NSSs) rather than simple sugars (mono- and disaccharides) have become increasingly popular 1. Replacing sugars with NSSs bears promise of
health benefits primarily by reducing the contribution of sugars to daily calorie intake and thus reducing the risk of unhealthy weight gain 2-4. However,
evidence for health effects due to use of NSSs is conflicting. While some studies report an association between use of NSSs and lower risk of developing type-2
diabetes, overweight and obesity, thus, suggesting a benefit for general health and the disease management of diabetic patients 5 6, other studies suggest use
of NSSs may increase risk of overweight, diabetes and cancer 7. Further investigations are needed to clarify the benefits and harms of NSSs consumption.
Therefore, the objective of our review was the investigation of health effects of NSSs in adults and children.
Description of the exposure/intervention of interest
NSSs differ from sugars not only in their taste properties, but also in how the body metabolizes them 8 and how they in turn impact physiological processes 9.
NSSs are generally sweeter than sucrose, but contain far fewer or no calories. Each sweetener is unique in its sweetness intensity, persistence of the sweet
taste, coating of the teeth and aftertaste effect 10.
The definitions and terminology for NSSs vary. In some cases the term artificial sweeteners is used as a synonym for NSSs, in other cases as a subcategory. In
this systematic review we will use the term NSSs as a category including both artificial sweeteners and naturally-occurring non-caloric sweeteners (see Figure
1).
FIGURE 1 HERE
There is variability in the range of NSSs approved in different countries. In the United States, for example, the FDA has approved six NSSs for consumption 11
while in the European Union the range of currently approved NSSs is wider, including, for example, cyclamate 12. Various studies have been conducted to
determine the safety of NSSs. In general, current evidence supports the safety of several NSSs to be used in foods 13. Recognised regulatory bodies have
established acceptable daily intakes (ADIs) based on these safety studies. Other NSSs are currently declared as unsafe or have not yet been assessed.
Although many of the NSSs currently being used in foods have been declared safe for consumption at levels below the respective ADIs , less is known regarding
potential health effects of NSSs within this range of intake as evidence from studies and reviews is often limited and conflicting. Hence, this systematic review
seeks to comprehensively assess the health effects of commonly consumed NSSs by addressing the following research questions:
1. In a general/healthy adult population what are the effects of consumption of NSSs versus no consumption on relevant health outcomes?
Page 4 of 49
https://mc.manuscriptcentral.com/bmj
BMJ
123456789101112131415161718192021222324252627282930313233343536373839404142434445464748495051525354555657585960

Confidential: For Review Only
5
2. In a general/healthy adult population what are the effects of higher versus lower doses and/or more frequent versus less frequent NSSs consumption
on relevant health outcomes?
3. In an overweight or obese adult population with explicit intentional weight loss what are the effects of consumption of NSSs versus no consumption on
relevant outcomes?
4. In a general/healthy child population what are the effects of consumption of NSSs versus no consumption on relevant outcomes?
5. In a general/healthy child population what are the effects of higher vs lower dose and/or more frequent versus less frequent NSSs consumption on
relevant outcomes? (lower versus higher doses and more frequent versus less frequent intake of NSS)
6. In a population of overweight and obese children with explicit intentional weight loss what are the effects of consumption of NSSs versus no
consumption on relevant outcomes?
The World Health Organization (WHO) is developing guidance on the use of NSSs by adults and children. This systematic review will inform the development of
relevant WHO recommendations.
METHODS
In accordance with the WHO guideline development process 14, we conducted a systematic review and meta-analyses according to the methodological
recommendations of the Cochrane Collaboration 15. Ethical approval was not required for this research.
Inclusion criteria
We included studies with a general, healthy population of adults (≥ 18 years) or children (< 18 years), including those with overweight or obesity. Studies that
exclusively included overweight and/or obese adults or children, specifically trying to lose weight (i.e. weight loss studies), were also included and analysed
separately. Studies including diseased populations and pregnant women were excluded as well as in vitro and animal studies.
The interventions and exposures of interest included any type of NSSs, either as an individual intervention or in combination with other NSSs. Interventions or
exposures described as ‘diet sodas’, ‘diet beverages’, or ‘diet soft drinks’ etc. were included when the sweeteners used in the products were NSSs and their
type was sufficiently specified. Studies that did not specify the type of sweetener were excluded. Studies which applied concomitant interventions were
included as long as the interventions were similar and equally balanced between the intervention and comparator groups to establish fair comparisons. We
included studies that reported to use NNSs within the acceptable daily intake as established by the Joint FAO/WHO Expert Committee on Food Additives
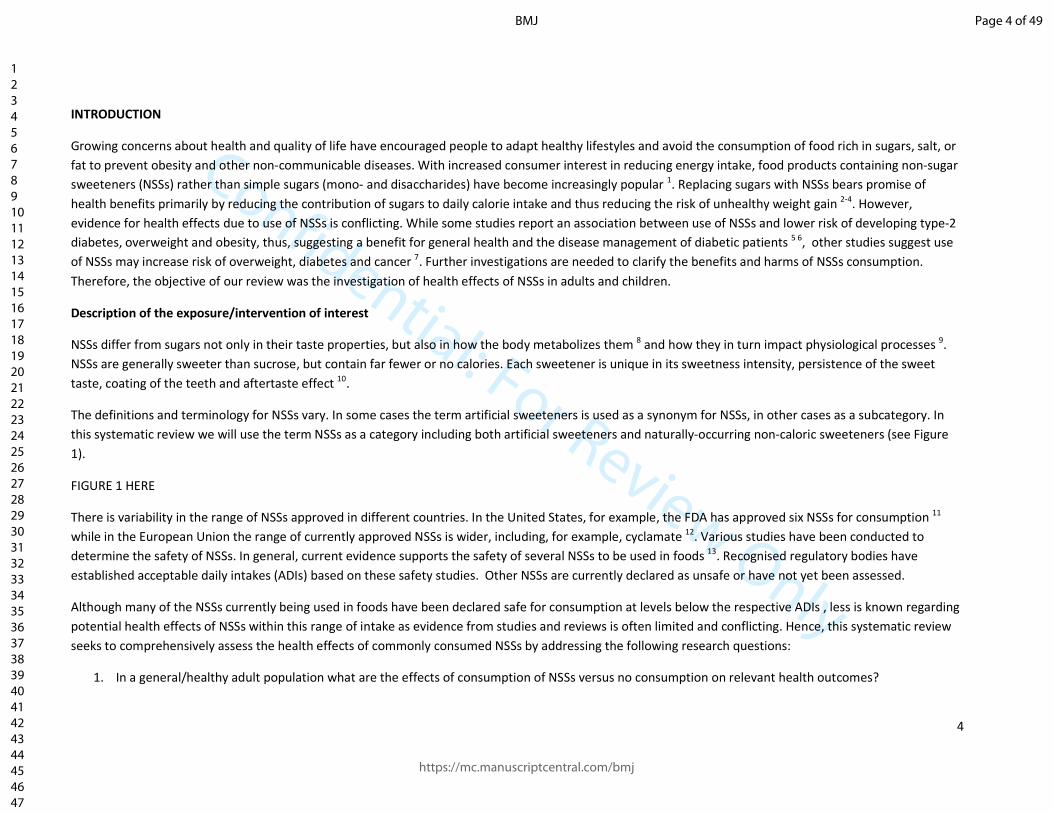
(JECFA), the European Food Safety Authority (EFSA) or the United States Food and Drug Administration (US FSA) (see Table 1), or did not report any information
on dosage. Where the acceptable daily intake values differed between the regulatory bodies, we used the higher value as threshold for inclusion in our review.
Studies in which sweetener intake explicitly exceeded the ADI were excluded. All studies had to have a minimum intervention duration of seven days.
Page 5 of 49
https://mc.manuscriptcentral.com/bmj
BMJ
123456789101112131415161718192021222324252627282930313233343536373839404142434445464748495051525354555657585960
Confidential: For Review Only
6
Non-sugar sweetener ADI defined by JECFA for the general population in mg / kg bw / day 16
ADI defined by EFSA for the general population in mg / kg bw / day
ADI defined by the US FDA for the general population in mg / kg bw / day
Acesulfame K 15 9 17 15
Advantame 5 5 32.8
Aspartame 40 40 50
Brazzein - Not approved Not approved
Cyclamate 11 7 Not approved
Neotame 0.3 0-2 18 0.30
Saccharin 15 5 15
Sucralose 5 15 5
Steviol glycosides 4 4 19 4
Thaumatin Not approved ADI not specified Not approved Table 1: Amount of acceptable daily intake (ADI) of NSSs (not exhaustive); bw = body weight, kg = kilogram, mg = milligram
We included studies that compared the intervention against the intake of any alternative intervention, for example, any other type of caloric or non-caloric
sweetener, any type of sugar, no intervention, placebo or plain water, etc.
The outcome measures of interest were any effects of NSSs on the following critical and important outcomes: body weight, oral health, incidence of diabetes
(critical outcome for adults only, important outcome for children only), eating behaviour (critical outcome for children only, important outcome for adults
only). Secondary outcomes: preference for sweet taste, incidence of any type of cancer, incidence of cardiovascular disease, incidence of chronic kidney
disease, incidence of asthma, incidence of allergies, mood, behaviour, neurocognition.
We included all parallel-grouped or cross-over (quasi-)randomised controlled trials (RCTs), and cluster-randomised trials. In cross-over RCTs, we considered
both phases of the study because the effect of NSSs intake is not expected to last long enough to bias the results from the second phase of cross-over trials for
the outcomes evaluated in this review. Furthermore, we included non-randomised controlled trials 20 and prospective and retrospective cohort studies, case-
control studies and cross-sectional studies but analysed them separately. Studies with observational design were included because the possible long-term
effects of NSSs, for example on the incidence of noncommunicable diseases, such as cancer, are generally difficult to assess in RCTs. We included unpublished
and ongoing studies.
Search methods for identification of studies
Page 6 of 49
https://mc.manuscriptcentral.com/bmj
BMJ
123456789101112131415161718192021222324252627282930313233343536373839404142434445464748495051525354555657585960

Confidential: For Review Only
7
The search strategy for this review combined electronic searches and hand searching. For the electronic searches, no date or language restrictions were
applied. A systematic literature search in the following databases was conducted last on 25 May 2017: Medline, Medline in Process and Medline Daily Update,
EMBASE, and the Cochrane Central Register of Controlled Trials (CENTRAL) (SL). In order to identify ongoing or completed, but unpublished trials, the World
Health Organization International Clinical Trials Registry Platform Search Portal (WHO ICTRP Search Portal) as well as ClinicalTrials.gov were searched on
23.11.2017 (IT). Search strategies are listed in the supplementary material. The reference lists of relevant systematic reviews were screened manually to
identify further potentially relevant citations.
Selection of studies
All titles and abstracts of records identified in the databases and other sources above were screened for eligibility by one researcher (DKdG, SL or IT). Two
review authors independently evaluated full texts of all potentially eligible studies for appropriateness for inclusion without prior consideration of the results
(DKdG, SL, IT). Any disagreements were resolved by discussion or feedback from a third author (JJM).
Data extraction and management
Two review authors independently extracted data and cross-checked the extracted information on study characteristics, included participants, interventions
and reported outcomes using a piloted, standardised data extraction form in the online software Covidence (DKdG, SL, IT). Any differences related to the data
extraction were resolved by re-checking the full text of the study or by discussion. If study data was only available from figures, data was extracted using the
validated software ‘Plot Digitizer’ (plotdigitizer.sourceforge.net) 21. When study data were ambiguous or data were not reported in a form that could be used
for formal comparison, we contacted the corresponding and first author of the original publication via e-mail.
Assessment of risk of bias
Two review authors independently assessed the risk of bias for each study. Any disagreements were resolved by discussion or a third author (JJM). For the Risk
of bias assessment of RCTs we used the Cochrane Risk of bias tool for RCTs 22. For non-randomised controlled trials we used the ROBINS-I tool 23. We planned to
create funnel plots when data of ten or more studies were available to assess the likelihood of dissemination bias.
Data synthesis
We calculated risk ratios (RRs) and their respective 95% confidence intervals (CIs) for RCTs, controlled clinical trials and cohort studies, and odds ratios (OR) and
their respective 95% CIs for case-control studies, when they were not reported. We calculated mean differences (MD) or standardised mean differences (SMD)
with 95% CIs for continuous outcomes. We conducted meta-analyses, when comparable outcome data from two or more studies were available. In the meta-
analyses, we used the random-effects model. When baseline and final values were given, we computed changes from baseline. We imputed the missing
Page 7 of 49
https://mc.manuscriptcentral.com/bmj
BMJ
123456789101112131415161718192021222324252627282930313233343536373839404142434445464748495051525354555657585960

Confidential: For Review Only
8
standard deviation using an imputed correlation coefficient 24. In this review, we used a correlation coefficient of zero. Statistical analyses were conducted
using the statistical software R with the R package ‘meta’ and ‘metasens’ 25.
Sensitivity analyses
We tested the robustness of our results using sensitivity analyses. In forest plots we reported results of analyses with the random-effects model as our primary
effect estimate. For all meta-analyses we conducted sensitivity analyses using the fixed-effect model. In most sensitivity analyses with the fixed-effect-model
the effects were more precise (narrower 95% CIs) and consequently sometimes statistically significant compared to analyses with the random-effects-model.
However, given the clinical heterogeneity of the included studies these were judged to not be appropriate, and therefore the results are not reported in detail.
We found only one study with low risk of bias so that an analysis of studies with a low risk of bias only was not feasible. Study populations with participants ≥
18 years and < 18 years were regrouped in sensitivity analyses so that the effect of NSSs on children only and adults only could be analysed.
Assessment of the certainty of the evidence
We used the GRADE approach to assess the certainty of the evidence for the most relevant, available measures of all critical and important outcomes 26.
According to the GRADE approach we classified the certainty of evidence in four categories: high, moderate, low and very low certainty of evidence. The GRADE
certainty assessment per outcome was documented in GRADE Evidence profiles together with the pooled effects for the interventions. The online software
GRADEpro GDT 27 was used to compile the evidence profiles. Assessments of the certainty of evidence for all outcomes were reviewed with the WHO Nutrition
Guidance Expert Advisory Group (NUGAG) subgroup on diet and health as part of the WHO guideline development process.
Outcomes for which evidence from RCTs is available, additional evidence from non-randomised studies and observational studies can be found in the
supplementary materials. Where case-control studies and cross-sectional studies provide the best available body of evidence this evidence is presented in the
main text.
The presentation of the results in this systematic review is primarily structured according to age group, adults or children, and outcome. Within the each
outcome we present the results for each PICO question separately, describing results of RCTs first, followed by non-randomised and observational studies.
RESULTS
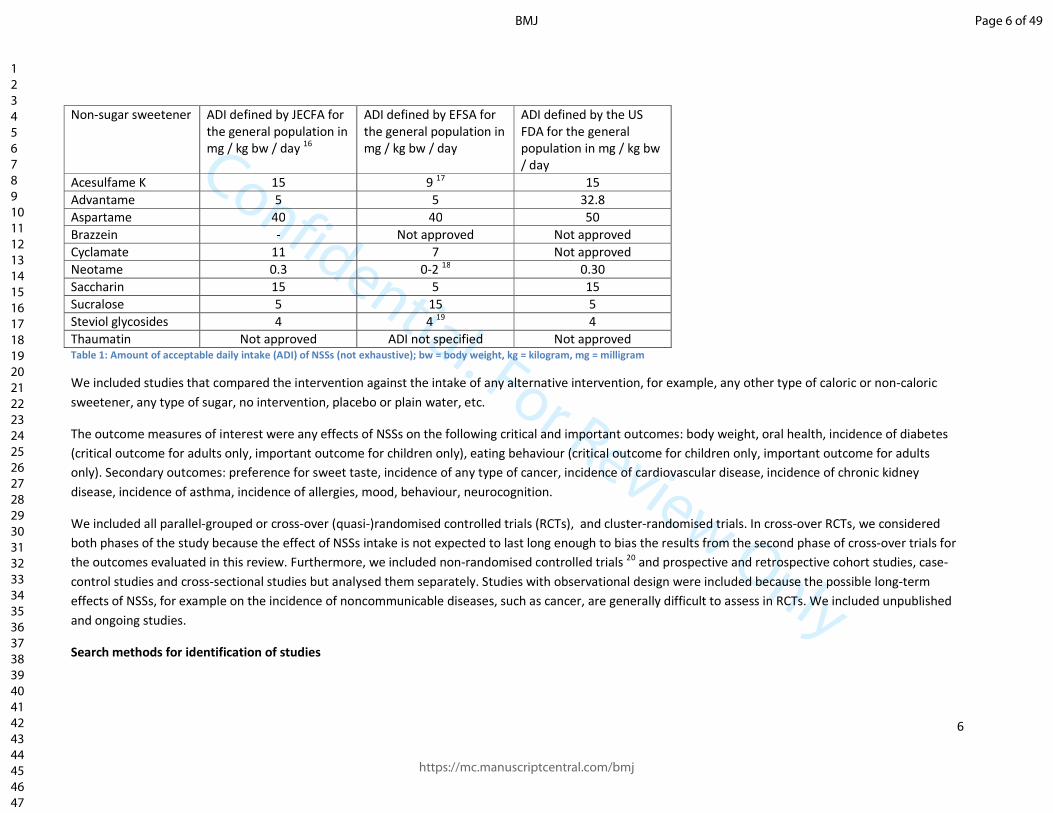
Details of the study selection are presented in Figure 2. Key characteristics of all included studies are listed in Table 2.
FIGURE 2 HERE
Page 8 of 49
https://mc.manuscriptcentral.com/bmj
BMJ
123456789101112131415161718192021222324252627282930313233343536373839404142434445464748495051525354555657585960
Confidential: For Review Only
9
Study ID Study
design
Population N
Intervention
N
Control
N overall /
at baseline
For-profit
funding*
Intervention Source Dose Duration Control
1. Baird 2000 RCT Adults, healthy 77 31 118 yes Sucralose Liquid in ascending dose (125, 250 and 500 mg during week 1-3, 4-7 and 8-12, respectively)
90 days / 12 weeks
Fructose
2. Ballantyne 2011
RCT Adults, overweight males
20 20 40 yes Aspartame Liquid No information, only no. and kJ of drinks
8 weeks Sucrose
3. Blackburn 1997
RCT Adults, overweight
82 81 186 yes Aspartame Mixed No information 16 weeks Avoidance of NNSs
4. Bosetti 2009 Case-control study
Adults - - 3117 no Saccharin Mixed No information 10-16 years No intervention
5. Cabaniols 2011
Case-control study
Adults 122 122 244 no Aspartame Mixed No information 5 years No intervention
6. Cartwright 1981
Case-control study
Adults probably - - 1901 no Saccharin Tabletop sweetener
No information at least 1 year
No intervention
7. Colditz 1990 Cohort study
Adults, female - - 31940 no Saccharin Mixed 0.0 - 5.8, or more than 5.8 g 8 years No intervention
8. deRuyter 2012
RCT Children, healthy
319 322 641 no Combination of NSSs (40 mg sucralose, 10 mg acesulfame-K)
Liquid 40 mg sucralose, 10 mg acesulfame-K
18 months Sucrose
9. Duran Aguero 2014
Cross-sectional study
Children - - 1224 no Aspartame, acesulfame, cyclamate, saccharin
Mixed No information No information
No exposure
10. Duran Aguero 2015
Cross-sectional study
Adults - - 1224 no Acesulfame or sucralose or aspartame
Mixed No information No information
No exposure
11. Eeden 1991 RCT Adults, with aspartame sensitivity
32 44 yes Aspartame Capsule 30 mg/kg bw 7 days Placebo
12. Fernandes 2013
Cross-sectional study
Adults - - 261 no Aspartame or saccharin or sucralose
Mixed No information No information
No exposure
13. Frey 1976 RCT Children 61 65 126 yes Aspartame Mixed Depending on age: 610, 800, 1600, 2000, 2400 mg
13 weeks Sucrose
14. Gallus 2007 Case-control study
Adults 10510 7028 17538 no Saccharin or aspartame
Mixed No information 2 years No intervention
Page 9 of 49
https://mc.manuscriptcentral.com/bmj
BMJ
123456789101112131415161718192021222324252627282930313233343536373839404142434445464748495051525354555657585960

Confidential: For Review Only
10
15. Goodman 1986
Case-control study
Adults probably - - 534 no Saccharin Mixed No information No information
No intervention
16. Guo 2014 Cohort study
Adults - - 566398; 263923 with enough data
no Saccharin Tabletop sweetener
No information 10 years Sugar
17. Gurney 1997 Case-control study
Children 56 94 150 no Aspartame Mixed No information No information
No exposure
18. Howe 1977 Case-control study
Adults - - 1264 no Saccharin Mixed No information No information
No intervention
19. Iscovich 1987
Case-control study
Adults probably - - 351 no Saccharin Mixed No information No information
No intervention
20. Kanders 1988
RCT Adults, overweight
29 30 59 yes Aspartame Mixed 278mg - 311mg - 383 mg increase over time
12 weeks No intervention
21. Kessler 1978 Case-control study
Adults - - 519 no Saccharin or cyclamate
Mixed No information No information
No intervention
22. Kim 2011 RCT Adults probably 9 12 21 no Aspartame Liquid No information 4 weeks Sugar
23. Knopp 1976 RCT Children, overweight
22 33 59 yes Aspartame Capsule 2.7 00 mg 7 weeks Placebo
24. Kuk 2016 Cross-sectional study
Adults - - 2856 no Aspartame or saccharin
Mixed No information No information
No exposure
25. Kuzma 2015 Cross-over RCT
Adults - - 10 no Aspartame Liquid - 8 days Glucose or fructose
26. Lee 2012 RCT Adults probably unclear unclear 51 no Aspartame Liquid up to 600mg or more / day 2 weeks Sugar
27. Lim 2006 Cohort study
Adults - - 473984 no Aspartame Liquid No information No information
Aspartame
28. Lindseth 2014
RCT Adults - - 30 no Aspartame Mixed 10 mg / kg bw or 25 mg / kg bw
8 days Aspartame
29. Maersk 2012 RCT Adults, overweight
12 10/13/12
60 yes Aspartame Liquid No information 6 months Mix of glucose and fructose
30. Maki 2008 RCT Adults 50 50 100 yes Stevia Capsule 1000 mg 4 weeks Placebo
31. McCullough fin
Cohort study
Adults - - 101638 no Aspartame Tabletop sweetener
No information No information
Aspartame
32. Moller-Jensen 1983
Case-control study
Adults probably - - 1156 no Saccharin or cyclamate
Mixed No information No information
No intervention
Page 10 of 49
https://mc.manuscriptcentral.com/bmj
BMJ
123456789101112131415161718192021222324252627282930313233343536373839404142434445464748495051525354555657585960

Confidential: For Review Only
11
33. Momas 1994
Case-control study
Adults 219 792 1011 no Saccharin Mixed No information No information
No intervention
34. Mommsen 1983
Case-control study
Adults - - 141 no Saccharin Mixed No information No information
No intervention
35. Naismith 1995
Cross-over non-RCT
Adults - - 6 no Combination of NSSs (acesulfame-k, aspartame)
Mixed No information 10 days Sugar
36. Naismith 1995
Cross-over non-RCT
Adults - - 14 no Combination of NSSs (acesulfame-k, aspartame)
Mixed No information 10 days Sugar
37. Najem 1982 Case-control
Adults 76 150 226 no Saccharin Mixed No information No information
No intervention
38. Nomura 1991
Case-control
Adults 261 522 783 no Saccharin Mixed No information No information
No intervention
39. Parker 1997 Cohort Adults - - 465 no Saccharin Mixed 0-28.2g 1 year exposure
Sugar or no exposure
40. Porikos 1982 Cross-over non-RCT
Adults - - 6 yes Aspartame Mixed No information 12 days Sugar
41. Raben 2001 RCT Adults, overweight
20 21 41 yes Combination of AS (54% aspartame, 23% cyclamate, 22% acesulfame K, and 1% saccharin)
Mixed 4800, 5700, or 6700 mg depending on weight group
10 weeks Sucrose
42. Reid 2007 RCT Adults 68 65 133 no Aspartame Liquid No information 4 weeks Sucrose
43. Reid 2010 RCT Adults, overweight
29 24 71 yes Aspartame Liquid No information 4 weeks Sucrose
44. Reid 2014 RCT Adults, obese 21 20 44 yes Aspartame Liquid No information 4 weeks Sucrose
45. Serra-Majem 1996
Cross-sectional
Adults, mostly 441 2009 2450 yes Cyclamate Mixed 0.38 - 3.50 unit not given 2 days prior to survey
No exposure
46. Simon 1975 Case-control
Adults 135 538 673 no Cyclamate Liquid No information No information
No exposure
47. Spiers 1998 Cross-over RCT
Adults - - 48 yes Aspartame Capsule 45 mg / kw bw, low: 15 mg/ kg bw
20 days Placebo
48. Stanhope 2013
non-RCT Adults 23 18/16/28
80 no Aspartame Liquid No information 12 days Sugar
49. Stanhope 2015
non-RCT Adults 23 18/16/28
85 no Aspartame Liquid No information 2 weeks Sugar
50. Taljaard 2013
RCT Children 103 104/103/103
414 yes Sucralose Liquid No information 20 weeks Sucrose
51. Tordoff 1990 Cross-over non-RCT
Adults - - 41 no Aspartame Liquid 590 mg 21 days High fructose corn syrup
Page 11 of 49
https://mc.manuscriptcentral.com/bmj
BMJ
123456789101112131415161718192021222324252627282930313233343536373839404142434445464748495051525354555657585960

Confidential: For Review Only
12
52. Warrington 2011
RCT Adults 12 12 24 yes Advantame Capsule 0.375–0.5 mg/kg body weight
4 weeks Placebo
53. Wolraich 1994
Cross-over non-RCT
Children, Partly with sugar sensitivity reported by parents
- - 48 yes Aspartame or saccharin
Mixed Aspartame: preschool: 693 mg, school-age: 864 mg, saccharin: preschool: 214, School-age: 256 mg
3 weeks Sugar
54. Wulaningsih 2017
Cross-sectional
Adults - - 15731 no Aspartame Mixed No information No information
No exposure
55. Yu 1997 Case-control
Adults 127 254 381 no Saccharin Mixed No information Up to more than 15 years
No exposure
56. Zanela 2002 non-RCT Children 50 50/50/50
200 no Stevia Mouthrinse No information 4 weeks Water
Table 2: Details of included studies (RCT = randomised, controlled trial; non-RCT = non-randomised controlled trial; AS = artificial sweetener);
*For profit funding includes sponsoring of study material, i.e. intervention substances, as well as financial sponsoring for conducting the study
Page 12 of 49
https://mc.manuscriptcentral.com/bmj
BMJ
123456789101112131415161718192021222324252627282930313233343536373839404142434445464748495051525354555657585960

Confidential: For Review Only
13
Risk of bias in included RCTs with data for analyses
Detailed results of the assessment of risk of bias in included RCTs (n=22) are summarised in the
supplementary material. Unclear reporting about random sequence generation and allocation
concealment were the main reasons for unclear risk of bias in RCTs, while lack of blinding of participants
and personnel was the main reason for high risk of bias. Other potential sources of bias were rarely
suspected. The overall risk of bias assessment of controlled clinical trials and observational studies (n=35)
was serious mainly due to suspected bias caused by confounding, and bias caused by classification of the
intervention. The risk of bias assessment for individual non-randomised studies can be found in the
supplementary material.
Health effects of NSSs on adults
We included 17 RCTs 17 29-44, six controlled clinical trials 45-49, five prospective or retrospective cohort
studies 50-54, 15 case-control studies 55-69 and five cross-sectional studies 70-74 in our assessment of health
effects of NSSs on healthy adults. We identified seven ongoing studies in adults 75-81 and one study
awaiting classification 82.
Body weight
In RCTs, no significant differences in change in body weight were observed between adults receiving NSSs
compared to those receiving different sugars or placebo (MD 1.29 kg, 95% CI -2.80 to 0.21, 5 studies,
n=229, very low certainty of evidence) (see Figure 3).
FIGURE 3 HERE
Subgroup analysis by body weight status, suggested that NSSs use by overweight and/or obese individuals
(not trying to lose weight) resulted in reduced body weight of 1.99 kg (95% CI -2.84 to -1.14, 3 studies,
n=146) but no change in body weight in normal weight individuals (0.03 kg, 95% CI -0.03 to 0.09, 2 studies
n=110) (Figure 3). As assessed in RCTs, change in BMI was 0.6 units lower in adults receiving NSSs
compared to those receiving sucrose (95% CI –1.19 to -0.01, 2 studies, n=174, low certainty of evidence).
Otherwise, RCTs, non-randomised controlled trials and observational studies comparing NSSs use to no
NSSs use and with insufficient data for a meta-analysis indicated no consistent difference between the
intervention and control group with regard to difference in body weight and other measures of
overweight and obesity (see supplementary material).
One cohort study 50 assessed different levels of NSSs intake and reported that weight gain was 0.09 kg
lower in women consuming 0 to 5.8 g saccharin per day compared to more than 5.8 g saccharin per day
(95% CI -0.13 to -0.05, 1 study, outcome assessed in n=17934, very low certainty of evidence).
Two RCTs 31 32 investigated the effect of NSSs in overweight populations trying to lose weight, however
they did not provide enough data to conduct meta-analysis (SE/SD not reported). One study 31 reported
no difference in body weight between the study groups (MD 0.10 kg, 95% CI -0.31 to 0.11, n=163, low
certainty of evidence). The other study 32 reported no significant differences between the study groups
with regard to reduction in body weight, BMI or body fat.
Diabetes/glycaemic control
In two RCTs fasting blood glucose levels were 0.16 mmol/l lower in the groups receiving aspartame or a
combination of NSSs compared to groups receiving sugar (95% CI -0.26 to -0.06, 2 studies, n=52, very low
Page 13 of 49
https://mc.manuscriptcentral.com/bmj
BMJ
123456789101112131415161718192021222324252627282930313233343536373839404142434445464748495051525354555657585960

Confidential: For Review Only
14
certainty of evidence) 37 39. However, there were no differences observed in plasma insulin (MD -1.60
pmol/l, 95% CI -8.39 to 5.19, 2 studies, n=52) or insulin resistance and beta-cell function as measured by
the Homeostatic Model Assessment of insulin Resistance (HOMA-IR) (MD -0.14, 95% CI -0.38 to 0.10, 2
studies, n=66, very low certainty of evidence) 37 39. Additional markers for diabetes were reported by
single studies only (see supplementary material).
Eating behaviour
Energy intake, appetite
Pooled data from four RCTs 17 39-41 (n=318 at baseline) showed that overall energy intake was 1064.73 kJ
lower in those receiving NSSs compared to those receiving sugar (95% CI -1867.03 to -262.44, 4 studies,
n=278, very low certainty of evidence) (see Figure 4). Subgroup analysis by study duration indicated this
result was largely being driven by one study that lasted 10 weeks (95% CI -3125.35 to -2068.65, 1 study,
n=42), as studies of short duration lasting 4 weeks did not show a significant reduction (95% CI -1445.24
to 247.36, 3 studies, n=276). One RCT 38 reported narratively that there were no significant differences in
energy intake between the stevia and placebo group. Data from two non-randomised controlled trials 45 46
(n=22) suggested no difference between the intervention and control group for energy intake.
FIGURE 4 HERE
One RCT 29 investigated the effect of NSSs on energy intake in overweight populations trying to lose
weight. Energy intake was reported to be 548 kJ lower in the group receiving NSSs compared to the group
avoiding NSSs (95% CI -692.73 to -403.27, 1 study, n=128). In addition, no significant differences were
observed for self-control with respect to eating (MD -0.20, 95% CI -1.03 to 0.63, n=186, low certainty of
evidence) or feelings of hunger (MD -0.20, 95% CI -1.03 to 0.63, n=186, low certainty of evidence). A
separate RCT 30 reported narratively that self-reported appetite remained the same in both those
receiving NSSs and those receiving no intervention over the study period of 12 weeks.
Sugar intake, sweet preference
The pooled effect from three RCTs 17 39 40 showed that sugar intake was 89.71 g lower in in adults receiving
NSSs compared to those receiving sugar (95% CI -127.63 to -51.80, 3 studies, n=135, very low certainty of
evidence) (see Figure 5).
FIGURE 5 HERE
All three studies included overweight or obese participants. Both studies by Reid 17 40 measured sugar
intake by including the sucrose from the control intervention in their outcome measure. Data from two
non-randomised controlled trials 49 46 and one cross-sectional study 72 showed that there were no
differences in sugar intake between the intervention and control groups.
Two RCTs 31 32 were identified that investigated the effect of NSSs on preference for sweet taste or sugar
intake in overweight populations trying to lose weight. The preference for sweet taste, as assessed by
desire for sweets, measured on a 0 to 10 scale with higher values indicating more desire for sweets, was
slightly lower in the group receiving NSSs compared to the group not receiving NSSs (MD -0.2, 95% CI -
0.34 to - 0.06, 1 study, 186 participants, moderate certainty of evidence). Sugar intake was similar
between the groups after 3 years of follow up (MD -0.00 g, 95% CI -0.18 to 0.18, 1 study, 186
participants)31.
Page 14 of 49
https://mc.manuscriptcentral.com/bmj
BMJ
123456789101112131415161718192021222324252627282930313233343536373839404142434445464748495051525354555657585960

Confidential: For Review Only
15
Cancer
The risk for bladder or lower urinary tract cancer as assessed in meta-analysis of case control studies
seemed to be similar in those exposed to sweeteners and those unexposed to sweeteners (OR 1.03, 95%
CI 0.84 to 1.25, 8 studies, n=4509, very low certainty of evidence) (see Figure 6).
FIGURE 6 HERE
The odds ratios for other types of cancer as reported in various observational studies suggest no
difference in risk for different cancers except for ovarian cancer (OR 0.61, 95% CI 0.38 to 0.98, 1 case-
control study, n=459) and pancreatic cancer (OR 0.19, 95% CI 0.08 to 0.46, 1 case control study, n=978).
The certainty of evidence for the risk of different types of cancers was very low.
There was no association between consumption of higher doses of aspartame and incidence of the main
subtypes of lymphoid cancers, non-Hodgkin lymphoma subtypes (p = 0.69), or non-lymphoid leukaemia in
two prospective cohort studies with up to ten years of follow up (n=473984) 52 53 or between
consumption of higher doses of NSSs and lower urinary tract cancer (n=149) (very low certainty of
evidence) as reported in one case-control study 66.
Blood pressure
Data from three RCTs showed that systolic and diastolic blood pressure were lower in those receiving
NSSs compared to those receiving sugar or placebo (systolic: MD -4.90 mmHg, 95% CI -9.78 to -0.03;
diastolic: -3.27 mmHg, 95% CI -7.21 to 0.67, 3 studies, n=202 at baseline, very low certainty of evidence) 37-39. Another RCT reported narratively that there was no change in blood pressure in the study groups 29.
No significant differences in systolic and diastolic blood pressure were reported in one RCT assessing the
effect of aspartame in overweight populations trying to lose weight 32. After 12 weeks the group
differences in diastolic blood pressure were 6 mmHg less in males and 1 mmHg more in females when the
aspartame group was compared to the control group (not enough data for formal statistical comparison,
very low certainty of evidence).
Other outcomes
In studies assessing NSSs intake compared to no NSSs intake, we found an increased risk of depression in
one cohort study (OR 1.14, 95% CI 1.02 to 1.27, 1 study, n= 263,923) 51 and no effects on the incidence of
kidney disease (very low certainty of evidence) 44, mood 17 29 40 42 (moderate certainty of evidence),
behavior (very low certainty of evidence) 83, neurocognition (low certainty of evidence) 42 or risk of
adverse events such as skin reactions, loss of appetite and headaches (RR 0.65, 95% CI 0.16 to 2.59, 3
studies, n=167, low certainty of evidence) 29 42 44. We identified no studies investigating the incidence of
asthma or the incidence of allergies.
In studies comparing different does of NSSs intake, evidence from one cross-over RCT 36 reported that the
participants were significantly more depressed when consuming the higher dose of aspartame compared
to the lower dose (low certainty of evidence). The study reported significantly better results in
participants receiving lower doses of aspartame with respect to neurocognition (low certainty of
evidence), but no difference in adverse events for higher versus lower intake of aspartame (low certainty
of evidence) 36. Similarly, no significant differences in the risk for adverse events were observed as
Page 15 of 49
https://mc.manuscriptcentral.com/bmj
BMJ
123456789101112131415161718192021222324252627282930313233343536373839404142434445464748495051525354555657585960

Confidential: For Review Only
16
reported in two RCTs between those receiving NSSs and those not receiving NSSs in overweight
populations trying to lose weight 31 32 (RR 1.38, 95% CI 0.58 to 3.28, n=204, low certainty of evidence).
Effects of NSSs in healthy children
Overall we identified four RCTs 84-87, two non-randomised controlled trials 83 88, one case-control study 89
and one cross-sectional study 70 that contributed data to our review regarding health effects of NSSs in
children. We identified one ongoing study in children 90.
Body weight
Two RCTs 85 91 found a similar weight gain in children receiving NSSs and children not receiving NSSs (MD -
0.60 kg, 95% CI -1.33 to 0.14, 2 studies, n=467, low certainty of evidence) (see Figure 7). There was no
difference in effect when the oldest age group (13-21 years) from one study 85 was excluded in a
sensitivity analysis (MD -0.50 kg 95% CI -1.43 to 0.42, 2 studies, n=722).
FIGURE 7 HERE
Two RCTs 87 92 reported a significantly smaller increase in BMI z-score in children receiving NSSs compared
to children receiving sucrose (MD -0.15, 95% CI -0.17 to -0.12, n=528, moderate certainty of evidence).
One RCT 92 (n=641) reported no group differences in body fat measured by electrical impedance (MD -
0.83% body fat, 95% CI -2.12 to 0.46), waist circumference (-0.50 cm, 95% CI -1.73 to 0.73), skinfold
thickness (MD -1.5 mm, 95% CI -4.71 to 1.71) and waist to height ratio (MD -0.50%, 95% CI -1.73 to 0.73).
One RCT including overweight or obese children involved in a weight loss programme 86 reported a lower
weight gain in children receiving aspartame compared to children receiving placebo (MD -0.75 kg, 95% CI
-1.08 to -0.43, 1 study, n=57, low certainty of evidence).
Dental health
One non-randomised controlled trial 88 showed that mouth rinses with chlorhexidine were more effective
in decreasing plaque volume than stevioside. Plaque volume was similar in the groups using water or
stevioside (low certainty of evidence).
Eating behaviour
Satiety, appetite and energy intake
One RCT (n=141) reported that self-reported satiety one minute after intake was similar between children
receiving NSSs compared to children receiving sucrose (OR 0.77, 95% CI 0.46 to 1.29) and 15 minutes after
intake (OR 1.44, 95% CI 0.86 to 2.40) 84. Self-reported appetite increase (RR 0.84, 95% CI 0.22 to 3.29) or
appetite decrease (RR 1.08, 95% CI 0.44 to 2.63) were similar between the study groups in another RCT
(n=126)85. According to evidence from a third RCT, energy intake was lower in the sucralose group
compared to the sucrose group (MD 197.60 kJ, 95 % CI -327.18 to 722.38, n=190, low certainty of
evidence) 87. In one non-randomised controlled trial mean daily energy intake was reported to be similar
between the groups receiving aspartame or saccharin and significantly increased in the group that
received sucrose 83. Energy intake in the preschool group was 6711, 6640 or 7728 kJ daily with aspartame,
saccharin or sucrose, respectively and 8100, 8284 and 9293 kJ for school-age children. One RCT with
overweight children involved in active weight loss, assessed change in appetite as self-reported adverse
Page 16 of 49
https://mc.manuscriptcentral.com/bmj
BMJ
123456789101112131415161718192021222324252627282930313233343536373839404142434445464748495051525354555657585960

Confidential: For Review Only
17
event which was reported to be no different between the study groups (incidence rate ratio 0.94 95% CI
0.35 to 2.49, 1 study, n=55, very low certainty of evidence)86.
Preference for sweet taste
One cross-over non-randomised controlled trial 83 (n=47) reported significantly lower sugar intake in
children receiving aspartame or saccharin compared to children receiving sucrose (not enough data for
formal statistical comparison, very low certainty of evidence). The effect seemed to be strongly related to
the sugar content of the experimental diets.
Diabetes
One cross-over non-randomised controlled trial 83 found showed a significantly higher increase in blood
glucose in preschool age children receiving aspartame compared to sucrose (MD 0.24 mmol/l, 95% CI 0.09
to 0.39, n=25), a significantly higher increase in blood glucose in school age children receiving saccharin
compared to sucrose (MD 0.65 mmol/l, 95% CI 0.44 to 0.86, n=23), and a significantly lower increase in
blood glucose in preschool-age children receiving aspartame compared to saccharin (MD -0.75 mmol/l, 95
% CI -0.95 to -0.64, n=23, very low certainty of evidence). In overweight children involved in active weight
loss, blood glucose decreased less strongly in children receiving NSSs compared to children not receiving
NSSs (MD 5.70 mg/dl, 95% CI 4.16 to 7.24, n=49, very low certainty of evidence)86.
Cancer
One case-control study 89 (n=150) reported no difference in risk for primary brain tumours when looking
at aspartame intake from all sources (RR 1.1, 95% CI 0.5 to 2.6) or aspartame intake from diet drinks only
(RR 0.9, 95% CI 0.3 to 2.4) (very low certainty of evidence). Furthermore, there was no difference in risk of
primary brain tumours with different durations or frequencies of aspartame intake (very low certainty of
evidence) (see supplementary material).
Cardiovascular disease
One RCT 85 reported that total cholesterol concentration strongly decreased in the sucrose groups while
it increased in the aspartame group (MD 17.10 mg/dl 95% CI 12.64 to 21.56, n=45). The change in
triglyceride concentration (MD 4.00, 95% CI -0.50 to 8.50, n=45, unit of measurement not reported) and
blood pressure (no numerical data reported, very low certainty of evidence) were similar between the
study groups. Another RCT 86 reported that systolic and diastolic blood pressure were similar in
overweight children involved in active weight loss receiving NSSs or placebo (systolic: MD 1.00 mmHg,
95% CI -0.95 to 2.95; diastolic: MD 1.00 mmHg, 95% CI -0.53 to 2.53, 1 study, n=55, very low certainty of
evidence).
Kidney disease
In RCTs, no differences were observed in creatinine, an intermediate marker for kidney disease, in
overweight children involved in weight loss studies receiving or not receiving NSSs (MD 0.02 mg/dl, 95%
CI -0.01 to 0.05, 1 study, n=49, very low certainty of evidence) 86 nor in normal weight children receiving
NSSs or not receiving NSSs (MD 0.03, 95% CI -0.14 to 0.20, 1 study, n=126 at baseline, very low certainty
of evidence)85 86. However, when excluding the oldest age group (13 to 21 years) in a sensitivity analysis,
creatinine decreased more strongly in the sucrose group (MD 0.12, 95% CI 0.04 to 0.20, n=80).
Other outcomes
Page 17 of 49
https://mc.manuscriptcentral.com/bmj
BMJ
123456789101112131415161718192021222324252627282930313233343536373839404142434445464748495051525354555657585960
Confidential: For Review Only
18
In one non-randomized controlled trial, we found no difference in effect between children receiving NSSs
and children not receiving NSSs on self-rated mood states (very low certainty of evidence) 83, behavior
(very low certainty of evidence) 83, and cognitive performance 83 (low certainty of evidence). One RCT 87
described significantly worse neurocognitional performance in tests of cognitive abilities in children
receiving NSSs compared to children receiving sugar 87 (n=386). One RCT reported no difference in the
occurrence of adverse events in children receiving NSSs and children not receiving NSSs (RR 1.28, 95% CI
0.86 to 1.91, n=126, low certainty of evidence) 85. However, a higher risk of adverse effects in overweight
children involved in active weight loss not receiving NSSs compared to overweight children involved in
active weight loss receiving NSSs was observed in one RCT (incidence rate ratio 1.37, 95% CI 1.05 to 1.79,
1 study, n=55, low certainty of evidence) 86. Overall there were 103 adverse effects noted in the
intervention group and 113 in the control group.
We identified no studies investigating the effect of NSSs on incidence of asthma or incidence of allergies.
DISCUSSION
Principal findings
Overall, we included 56 studies in adults and children, which assessed the effect of NSSs on different
health outcomes. For most outcomes there seemed to be no statistical or clinically relevant difference
between those receiving NNS and those not receiving NSSs or receiving lower doses of NSS. The certainty
of the included evidence ranged from very low to moderate and our confidence in the reported effect
estimates is accordingly limited.
Strengths and weaknesses in relation to other studies
In a preparatory mapping review 93 we identified 372 primary and secondary studies that investigated the
effects of NSSs on different health outcomes. Unfortunately, the methodological and reporting quality of
many publications was limited. Most did not contain enough information on the study design or lacked
other reporting detail, i.e. the sweetener used was not transparently reported, such that a large number
of the studies identified in the mapping review were not eligible for this systematic review. Studies
included in this systematic review were rarely comparable with regard to their aim, design and methods
so that meaningful comparisons between them was challenging. While most included studies reported
sufficient detail for the population included, few reported sufficient information on the intervention,
comparator and outcomes. For example, comparisons of effects of different doses of sweeteners in
children were not possible because most studies did not report the respective information on dosage.
Additionally, studies reported dosage and outcomes measures so differently, that we could not assess the
effect of dose on any outcome (e.g., two studies 83 85 report dose of aspartame and assess eating
behaviour, but the outcome was measured as energy intake or in a decrease in appetite). In addition,
outcomes of relevance for this review were often only measured indirectly with intermediate markers.
Lastly, most included studies had small sample sizes and their study duration was mostly too short to infer
any meaningful longer term results.
We identified several other systematic and narrative reviews which examined the effects of NSSs on a
range of health outcomes 3-6 94-97. The inclusion and exclusion criteria used in these systematic reviews
differed from ours, as did the synthesis methods. Still the reviews found similar results to ours: Brown 4
found no strong clinical evidence for an effect of artificial sweeteners on metabolic effect in youths, while
Cheungpasitporn 3 found no effect of artificially sweetened soda on chronic kidney disease. Greenwood 5
Page 18 of 49
https://mc.manuscriptcentral.com/bmj
BMJ
123456789101112131415161718192021222324252627282930313233343536373839404142434445464748495051525354555657585960

Confidential: For Review Only
19
reported no consistent association with artificially-sweetened soft drinks and diabetes risk. Onakpoya 95
reported a non-significant reduction in systolic blood pressure and significant reductions in diastolic blood
pressure and fasting blood glucose with steviol glycoside compared to placebo, but indicated that the
evidence was not robust due to heterogeneity. Lastly, Wiebe 6 reported a decrease in BMI in those
consuming foods and drinks containing non-caloric sweeteners compared to an increase in BMI in those
consuming foods and drinks containing sucrose. Wiebe further highlights the lack of high quality research
regarding non-caloric sweeteners. Overall, published systematic reviews rarely allowed drawing firm
conclusions. Main concerns were limitations in the literature search and the data analyses. In contrast to
our review, meta-analyses were mostly not planned and conducted, instead the authors summarised the
individual study results narratively.
The findings of our review might be biased by the fact that only one reviewer assessed inclusion of studies
in the initial title and abstract screening phase. Hence, relevant references may have inadvertently not
been included in this review. However, we deem this rather unlikely given that only clearly irrelevant
references were excluded at this stage. Furthermore, we did not seek clarification with the study authors
about whether our assessment of risk of bias in the individual studies was in fact correct. In the statistical
analyses, missing standard deviations for change in outcomes were imputed, in some cases,
approximation was used for the analyses 98. This means that the reliability of the analyses of changes in
outcomes might be weakened by the unavailability of data and the use of imputed values and
approximation.
Implications for clinicians and policymakers
This review was prepared to inform a WHO guideline on use of NSSs. This guideline will provide
information on implications for actions by health experts and policy makers.
Unanswered questions and future research
To date several studies on the effects of NSSs on different health outcomes have been conducted.
However, their methodological and/or reporting quality is mostly limited and often not sufficiently
detailed to include their results in meta-analyses. We recommend that future studies assess the effects of
NSSs on health outcomes with a minimum duration of intervention of at least seven days. Longer-term
studies are needed to assess effects on overweight and obesity, risk for diabetes, cardiovascular disease,
and kidney disease. Type and dosage of sweetener use should be reported precisely and transparently in
all studies. Consistent use of core outcome measures and consensus on timing and mode of assessment
would further facilitate pooling of data across studies.
Most of the studies identified for this review used single sweeteners and the use patterns of sweeteners
in the studies might be different from real life practice 99. Therefore, the certainty in the evidence
presented in this review might further be affected by indirectness. For example, NSSs can be consumed in
different ways, including as a table top sweetener, i.e. added to tea or coffee as a replacement for sugar,
where the dosage is freely determined by the users themselves and might be higher than in the studies.
Moreover, in contrast to many of our included studies that use a single NSS only, in many food items
different types of NSSs are combined in order to cover different bitter or metallic aftertastes of individual
sweeteners and provide an adequate sweetness. Future research might consider exploring the effects of
different combinations of sweeteners administered in doses similar to different real life use patterns.
Moreover, development and research on NSSs is continuously ongoing and new alternatives to sugar are
presented on a regular basis. Therefore, we need data on the safety and benefits and harms of other
Page 19 of 49
https://mc.manuscriptcentral.com/bmj
BMJ
123456789101112131415161718192021222324252627282930313233343536373839404142434445464748495051525354555657585960

Confidential: For Review Only
20
sweeteners than those assessed in this review for a comprehensive overview of the health effects of
NSSs. Lastly, appropriate, long-term studies that consider baseline consumption of sugar and NSSs 99
should investigate whether NSSs might be a safe and effective alternative to sugar.
Page 20 of 49
https://mc.manuscriptcentral.com/bmj
BMJ
123456789101112131415161718192021222324252627282930313233343536373839404142434445464748495051525354555657585960

Confidential: For Review Only
21
REFERENCES
1. Sakurai M, Nakamura K, Miura K, et al. Sugar-sweetened beverage and diet soda consumption and the 7-year risk for type 2 diabetes mellitus in middle-aged Japanese men. Eur J Nutr 2014;53(1):251-58.
2. Miller PE, Perez V. Low-calorie sweeteners and body weight and composition: a meta-analysis of randomized controlled trials and prospective cohort studies. Am J Clin Nutr 2014;100(3):765-77. doi: 10.3945/ajcn.113.082826
3. Cheungpasitporn W, Thongprayoon C, O'Corragain OA, et al. Associations of sugar-sweetened and artificially sweetened soda with chronic kidney disease: a systematic review and meta-analysis. Nephrology (Carlton) 2014;19(12):791-7. doi: 10.1111/nep.12343
4. Brown RJ, de Banate MA, Rother KI. Artificial sweeteners: a systematic review of metabolic effects in youth. Int J Pediatr Obes 2010;5(4):305-12. doi: 10.3109/17477160903497027
5. Greenwood DC, Threapleton DE, Evans CE, et al. Association between sugar-sweetened and artificially sweetened soft drinks and type 2 diabetes: Systematic review and dose-response meta-analysis of prospective studies. Br J Nutr 2014;112(5):725-34. doi: http://dx.doi.org/10.1017/S0007114514001329
6. Wiebe N, Padwal R, Field C, et al. A systematic review on the effect of sweeteners on glycemic response and clinically relevant outcomes. BMC Med 2011;9(Journal Article):123. doi: 10.1186/1741-7015-9-123
7. Olivier B, Serge AH, Catherine A, et al. Review of the nutritional benefits and risks related to intense sweeteners.[Erratum appears in Arch Public Health. 2015;73:49; PMID: 26500771]. Archives of
Public Health (2015) 73:41 Archives of Public Health;73(41) doi: DOI 10.1186/s13690-015-0092-x 8. Sardarodiyan M, Hakimzadeh V. Artificial sweeteners. International Journal of PharmTech Research
2016;9(4):357-63. 9. Ferrazzano GF, Cantile T, Alcidi B, et al. Is Stevia rebaudiana Bertoni a Non Cariogenic Sweetener? A
Review. Molecules (Basel, Switzerland) 2015;21(1):E38. doi: 10.3390/molecules21010038 [published Online First: 2015/12/30]
10. Mortensen A. Sweeteners permitted in the European Union: safety aspects. Food & Nutrition Research 2006;50(3):104-16. doi: 1654-661X
11. US Food and Drug Administration. Additional Information about High-Intensity Sweeteners Permitted for use in Food in the United States: US Food and Drug Administration; 2017 [updated 26 May 2015. Available from: https://www.fda.gov/food/ingredientspackaginglabeling/foodadditivesingredients/ucm397725.htm accessed 14 December 2017 2017.
12. Authority EFS. Sweeteners Brussels, Belguim2017 [Available from: http://www.efsa.europa.eu/en/topics/topic/sweeteners accessed 14 December 2017 2017.
13. EFSA Panel on Dietetic Products NaA. Scientific Opinion on the substantiation of health claims related to intense sweeteners and contribution to the maintenance or achievement of a normal body weight (ID 1136, 1444, 4299), reduction of post-prandial glycaemic responses (ID 4298), maintenance of normal blood glucose concentrations (ID 1221, 4298), and maintenance of tooth mineralisation by decreasing tooth demineralisation (ID 1134, 1167, 1283) pursuant to Article 13(1) of Regulation (EC) No 1924/2006. Parma, Italy, 2011.
14. World Health Organization. WHO handbook for guideline development, 2nd edition. Geneva, Switzerland: World Health Organization 2014.
15. Higgins JPT, Green S. Cochrane handbook for systematic reviews of interventions. Version 5.1.0. . Chichester, West Sussex: John Wiley & Sons 2011.
16. World Health Organization. Evaluations of the Joint FAO/WHO Expert Committee on Food Additives (JECFA) http://apps.who.int/food-additives-contaminants-jecfa-database/search.aspx: World Health Organization; 2017 [Available from: http://apps.who.int/food-additives-contaminants-jecfa-database/search.aspx accessed 28 November 2017 2017.
Page 21 of 49
https://mc.manuscriptcentral.com/bmj
BMJ
123456789101112131415161718192021222324252627282930313233343536373839404142434445464748495051525354555657585960
Confidential: For Review Only
22
17. Reid M, Hammersley R, Duffy M. Effects of sucrose drinks on macronutrient intake, body weight, and mood state in overweight women over 4 weeks. Appetite 2010;55(1):130-6. doi: 10.1016/j.appet.2010.05.001
18. Ebbeling CB, Feldman HA, Chomitz VR, et al. A randomized trial of sugar-sweetened beverages and adolescent body weight. N Engl J Med 2012;367(15):1407-16. doi: 10.1056/NEJMoa1203388
19. European Food Safety Authority. Revised exposure assessment for steviol glycosides for the proposed uses as a food additive 2016 [Available from: http://www.efsa.europa.eu/de/efsajournal/pub/1972 accessed 03.05.2016.
20. Lefebvre C, Manheimer E, Glanville J. Searching for Studies. Cochrane Handbook for Systematic Reviews of Interventions: John Wiley & Sons, Ltd 2008:95-150.
21. Jelicic Kadic A, Vucic K, Dosenovic S, et al. Extracting data from figures with software was faster, with higher interrater reliability than manual extraction. J Clin Epidemiol 2016;74:119-23. doi: 10.1016/j.jclinepi.2016.01.002 [published Online First: 2016/01/19]
22. Nettleton JA, Lutsey PL, Wang Y, et al. Diet soda intake and risk of incident metabolic syndrome and type 2 diabetes in the Multi-Ethnic Study of Atherosclerosis (MESA). Diabetes Care 2009;32(4):688-94. doi: 10.2337/dc08-1799
23. Sterne JA, Hernan MA, Reeves BC, et al. ROBINS-I: a tool for assessing risk of bias in non-randomised studies of interventions. BMJ 2016;355:i4919. doi: 10.1136/bmj.i4919
24. Hozo SP, Djulbegovic B, Hozo I. Estimating the mean and variance from the median, range, and the size of a sample. BMC Medical Research Methodology 2005;5(1):13. doi: 10.1186/1471-2288-5-13
25. R Development Core Team. R: A Language and Environment for Statistical Computing. Vienna, Austria.: the R Foundation for Statistical Computing, 2011.
26. Guyatt GH, Oxman AD, Vist GE, et al. GRADE: an emerging consensus on rating quality of evidence and strength of recommendations. BMJ 2008;336(7650):924-6.
27. GRADEpro GDT: GRADEpro Guideline Development Tool [program]. Hamilton, Canada: McMaster University, 2015.
28. Liberati A, Altman DG, Tetzlaff J, et al. The PRISMA statement for reporting systematic reviews and meta-analyses of studies that evaluate healthcare interventions: explanation and elaboration. Bmj 2009;339:b2700. doi: 10.1136/bmj.b2700 [published Online First: 2009/07/23]
29. Baird IM, Shephard NW, Merritt RJ, et al. Repeated dose study of sucralose tolerance in human subjects. Food Chem Toxicol 2000;38 Suppl 2:S123-9.
30. Ballantyne CJ, Hammersley R, Reid M. Effects of sucrose added blind to the diet over eight weeks on body mass and mood in men. Appetite 2011;57:S3. doi: 10.1016/j.appet.2011.05.118
31. Blackburn GL, Kanders BS, Lavin PT, et al. The effect of aspartame as part of a multidisciplinary weight-control program on short- and long-term control of body weight. Am J Clin Nutr
1997;65(2):409-18. 32. Kanders BS, Lavin PT, Kowalchuk MB, et al. An evaluation of the effect of aspartame on weight loss.
Appetite 1988;11 Suppl 1(Journal Article):73-84. 33. Kim EJ, Kim MY, Kim JS, et al. Effects of fructooligosaccharides intake on body weight, lipid profiles,
and calcium status among Korean college students. Faseb Journal 2011;25 34. Kuzma JN, Cromer G, Hagman DK, et al. No difference in ad libitum energy intake in healthy men and
women consuming beverages sweetened with fructose, glucose, or high-fructose corn syrup: a randomized trial. Am J Clin Nutr 2015;102(6):1373-80. doi: 10.3945/ajcn.115.116368
35. Lee BH, Kim EJ, Kim MY, et al. Effect of Fructooligosaccharides on Improvement of blood glucose, calcium status and habitual bowel movement among college students in Korea. Faseb Journal 2012;26
36. Lindseth GN, Coolahan SE, Petros TV, et al. Neurobehavioral effects of aspartame consumption. Res
Nurs Health 2014;37(3):185-93. doi: 10.1002/nur.21595 37. Maersk M, Belza A, Stodkilde-Jorgensen H, et al. Sucrose-sweetened beverages increase fat storage in
the liver, muscle, and visceral fat depot: a 6-mo randomized intervention study. Am J Clin Nutr 2012;95(2):283-9. doi: 10.3945/ajcn.111.022533
Page 22 of 49
https://mc.manuscriptcentral.com/bmj
BMJ
123456789101112131415161718192021222324252627282930313233343536373839404142434445464748495051525354555657585960

Confidential: For Review Only
23
38. Maki KC, Curry LL, Carakostas MC, et al. The hemodynamic effects of rebaudioside A in healthy adults with normal and low-normal blood pressure. Food Chem Toxicol 2008;46 Suppl 7:S40-6. doi: 10.1016/j.fct.2008.04.040
39. Raben A, Moller AC, Vasilaras TH, et al. A randomized 10 week trial of sucrose vs artificial sweeteners on body weight and blood pressure after 10 weeks [abstract]. Obesity Res 2001;9:86s.
40. Reid M, Hammersley R, Duffy M, et al. Effects on obese women of the sugar sucrose added to the diet over 28 d: a quasi-randomised, single-blind, controlled trial. Br J Nutr 2014;111(3):563-70. doi: 10.1017/S0007114513002687
41. Reid M, Hammersley R, Hill AJ, et al. Long-term dietary compensation for added sugar: effects of supplementary sucrose drinks over a 4-week period. Br J Nutr 2007;97(1):193-203. doi: 10.1017/S0007114507252705
42. Spiers PA, Sabounjian L, Reiner A, et al. Aspartame: neuropsychologic and neurophysiologic evaluation of acute and chronic effects. Am J Clin Nutr 1998;68(3):531-7.
43. van den Eeden SK. A randomized crossover trial of aspartame and sleep. Am J Clin Nutr 1991;53(3):P-30.
44. Warrington S, Lee C, Otabe A, et al. Acute and multiple-dose studies to determine the safety, tolerability, and pharmacokinetic profile of advantame in healthy volunteers. Food Chem Toxicol 2011;49 Suppl 1:S77-83. doi: 10.1016/j.fct.2011.06.043
45. Naismith DJ, Rhodes C. Adjustment in Energy-Intake Following the Covert Removal of Sugar from the Diet. J Hum Nutr Diet 1995;8(3):167-75. doi: DOI 10.1111/j.1365-277X.1995.tb00309.x
46. Porikos KP, Hesser MF, van Itallie TB. Caloric regulation in normal-weight men maintained on a palatable diet of conventional foods. Physiol Behav 1982;29(2):293-300.
47. Stanhope K, Bremer A, Medici V, et al. Compared with aspartame, consumption of high fructose corn syrup-and sucrose-sweetened beverages increases triglycerides, cholesterol, non-HDL cholesterol, apolipoprotein-B uric acid in youngmen and women. J Womens Health 2013;22 (10)(10):898-99. doi: http://dx.doi.org/10.1089/jwh.2013.ab02
48. Stanhope KL, Medici V, Bremer AA, et al. A dose-response study of consuming high-fructose corn syrup-sweetened beverages on lipid/lipoprotein risk factors for cardiovascular disease in young adults. Am J Clin Nutr 2015;101(6):1144-54. doi: 10.3945/ajcn.114.100461
49. Tordoff MG, Alleva AM. Effect of drinking soda sweetened with aspartame or high-fructose corn syrup on food intake and body weight. Am J Clin Nutr 1990;51(6):963-9.
50. Colditz GA, Willett WC, Stampfer MJ, et al. Patterns of Weight Change and Their Relation to Diet in a Cohort of Healthy Women. Am J Clin Nutr 1990;51(6):1100-05.
51. Guo X, Park Y, Freedman ND, et al. Sweetened beverages, coffee, and tea and depression risk among older US adults. PLoS One 2014;9(4):e94715. doi: 10.1371/journal.pone.0094715
52. Lim U, Subar AF, Mouw T, et al. Consumption of aspartame-containing beverages and incidence of hematopoietic and brain malignancies. Cancer Epidemiol Biomarkers Prev 2006;15(9):1654-9. doi: 10.1158/1055-9965.EPI-06-0203
53. McCullough ML, Teras LR, Shah R, et al. Artificially and sugar-sweetened carbonated beverage consumption is not associated with risk of lymphoid neoplasms in older men and women. J Nutr 2014;144(12):2041-9. doi: 10.3945/jn.114.197475
54. Parker DR, Gonzalez S, Derby CA, et al. Dietary factors in relation to weight change among men and women from two southeastern New England communities. Int J Obes Relat Metab Disord 1997;21(2):103-9.
55. Bosetti C, Gallus S, Talamini R, et al. Artificial sweeteners and the risk of gastric, pancreatic, and endometrial cancers in Italy. Cancer Epidemiol Biomarkers Prev 2009;18(8):2235-8. doi: 10.1158/1055-9965.EPI-09-0365
56. Cabaniols C, Giorgi R, Chinot O, et al. Links between private habits, psychological stress and brain cancer: a case-control pilot study in France. J Neurooncol 2011;103(2):307-16. doi: 10.1007/s11060-010-0388-1
57. Cartwright RA, Adib R, Glashan R, et al. The epidemiology of bladder cancer in West Yorkshire. A preliminary report on non-occupational aetiologies. Carcinogenesis 1981;2(4):343-7.
Page 23 of 49
https://mc.manuscriptcentral.com/bmj
BMJ
123456789101112131415161718192021222324252627282930313233343536373839404142434445464748495051525354555657585960

Confidential: For Review Only
24
58. Gallus S, Scotti L, Negri E, et al. Artificial sweeteners and cancer risk in a network of case-control studies. Ann Oncol 2007;18(1):40-4. doi: 10.1093/annonc/mdl346
59. Goodman MT, Morgenstern H, Wynder EL. A case-control study of factors affecting the development of renal cell cancer. Am J Epidemiol 1986;124(6):926-41.
60. Howe GR, Burch JD, Miller AB, et al. Artificial sweeteners and human bladder cancer. Lancet 1977;2(8038):578-81.
61. Iscovich J, Castelletto R, Esteve J, et al. Tobacco smoking, occupational exposure and bladder cancer in Argentina. Int J Cancer 1987;40(6):734-40.
62. Kessler I, Clark JP. Saccharin, cyclamate, and human bladder cancer. No evidence of an association. JAMA 1978;240(4):349-55.
63. Moller-Jensen O, Knudsen JB, Sorensen BL, et al. Artificial sweeteners and absence of bladder cancer risk in Copenhagen. Int J Cancer 1983;32(5):577-82.
64. Momas I, Daures JP, Festy B, et al. Relative importance of risk factors in bladder carcinogenesis: some new results about Mediterranean habits. Cancer Causes Control 1994;5(4):326-32.
65. Najem GR, Louria DB, Seebode JJ, et al. Life time occupation, smoking, caffeine, saccharine, hair dyes and bladder carcinogenesis. Int J Epidemiol 1982;11(3):212-7.
66. Nomura AM, Kolonel LN, Hankin JH, et al. Dietary factors in cancer of the lower urinary tract. Int J
Cancer 1991;48(2):199-205. 67. Simon D, Yen S, Cole P. Coffee drinking and cancer of the lower urinary tract. J Natl Cancer Inst
1975;54(3):587-91. 68. Yu Y, Hu J, Wang PP, et al. Risk factors for bladder cancer: a case-control study in northeast China. Eur
J Cancer Prev 1997;6(4):363-9. 69. Mommsen S, Aagaard J, Sell A. A case-control study of female bladder cancer. Eur J Cancer Clin Oncol
1983;19(6):725-9. 70. Duran Aguero S, Onate G, Rivera PH. Consumption of non-nutritive sweeteners and nutritional status
in 10-16 year old students. Arch Argent Pediatr 2014;112(3):207-14. doi: 10.5546/aap.2014.eng.207
71. Fernandes J, Arts J, Dimond E, et al. Dietary factors are associated with coronary heart disease risk factors in college students. Nutr Res 2013;33(8):647-52. doi: 10.1016/j.nutres.2013.05.013
72. Kuk JL, Brown RE. Aspartame intake is associated with greater glucose intolerance in individuals with obesity. Appl Physiol Nutr Me 2016;41(7):795-98. doi: 10.1139/apnm-2015-0675
73. Serra Majem L, Ribas L, Ingles C, et al. Cyclamate consumption in Catalonia, Spain (1992): relationship with the body mass index. Food Addit Contam 1996;13(6):695-703.
74. Wulaningsih W, Van Hemelrijck M, Tsilidis KK, et al. Investigating nutrition and lifestyle factors as determinants of abdominal obesity: an environment-wide study. International Journal of Obesity 2017;41(2):340-47. doi: 10.1038/ijo.2016.203
75. Friel JK. Effects of Artificial Sweeteners on Gut Microbiota and Glucose Metabolism. 2016 76. Huber T. Study of the Reversibility of Glucose Intolerance Caused by Chronic Aspartame Consumption.
2015 77. Kyriazis G. Interactions of Human Gut Microbiota With Intestinal Sweet Taste Receptors (ISTAR-micro).
2017 78. Mattes. Beverage Consumption and Fine Motor Control (LCS). 2016 79. Mattes RD. The Effects of Aspartame on Appetite, Body Composition and Oral Glucose Tolerance.
2016 80. Sriphrapradang C. Sucralose Effects on Glucose Metabolism and Gut Microbiota. 2016 81. Steffen LM. Sucralose, Stevia, Gut Microbiome and Glucose Metabolism. 2016 82. Nilsson A. On the Impact of Common Sweetening Agents on Glucose Regulation, Cognitive Functioning
and Gut Microbiota. 2015 83. Wolraich ML, Lindgren SD, Stumbo PJ, et al. Effects of diets high in sucrose or aspartame on the
behavior and cognitive performance of children. N Engl J Med 1994;330(5):301-7. doi: 10.1056/NEJM199402033300501
Page 24 of 49
https://mc.manuscriptcentral.com/bmj
BMJ
123456789101112131415161718192021222324252627282930313233343536373839404142434445464748495051525354555657585960

Confidential: For Review Only
25
84. de Ruyter JC, Katan MB, Kuijper LD, et al. The effect of sugar-free versus sugar-sweetened beverages on satiety, liking and wanting: an 18 month randomized double-blind trial in children. PLoS One 2013;8(10):e78039. doi: 10.1371/journal.pone.0078039
85. Frey GH. Use of aspartame by apparently healthy children and adolescents. J Toxicol Environ Health 1976;2(2):401-15. doi: 10.1080/15287397609529442
86. Knopp RH, Brandt K, Arky RA. Effects of aspartame in young persons during weight reduction. J Toxicol
Environ Health 1976;2(2):417-28. doi: 10.1080/15287397609529443 87. Taljaard C, Covic NM, van Graan AE, et al. Effects of a multi-micronutrient-fortified beverage, with and
without sugar, on growth and cognition in South African schoolchildren: a randomised, double-blind, controlled intervention. Br J Nutr 2013;110(12):2271-84. doi: 10.1017/S000711451300189X
88. Zanela NL, Bijella MF, Rosa OP. The influence of mouthrinses with antimicrobial solutions on the inhibition of dental plaque and on the levels of mutans streptococci in children. Pesqui Odontol
Bras 2002;16(2):101-6. 89. Gurney JG, Pogoda JM, Holly EA, et al. Aspartame consumption in relation to childhood brain tumor
risk: results from a case-control study. J Natl Cancer Inst 1997;89(14):1072-4. 90. Small DM. The Effect of Artificial Sweeteners (AFS) on Sweetness Sensitivity, Preference and Brain
Response in Adolescents. 2014 91. de Ruyter JC, Olthof MR, Kuijper LD, et al. Effect of sugar-sweetened beverages on body weight in
children: design and baseline characteristics of the Double-blind, Randomized INtervention study in Kids. Contemp Clin Trials 2012;33(1):247-57. doi: 10.1016/j.cct.2011.10.007
92. de Ruyter JC, Olthof MR, Seidell JC, et al. A trial of sugar-free or sugar-sweetened beverages and body weight in children. N Engl J Med 2012;367(15):1397-406. doi: 10.1056/NEJMoa1203034
93. Lohner S, Toews I, Meerpohl JJ. Health outcomes of non-nutritive sweeteners: analysis of the research landscape. Nutr J 2017;16(1):55. doi: 10.1186/s12937-017-0278-x [published Online First: 2017/09/10]
94. Bes-Rastrollo M, Schulze MB, Ruiz-Canela M, et al. Financial Conflicts of Interest and Reporting Bias Regarding the Association between Sugar-Sweetened Beverages and Weight Gain: A Systematic Review of Systematic Reviews. Plos Med 2013;10(12):e1001578; dicsussion e78-e78; dicsussion e78. doi: ARTN e1001578
10.1371/journal.pmed.1001578 95. Onakpoya IJ, Heneghan CJ. Effect of the natural sweetener, steviol glycoside, on cardiovascular risk
factors: a systematic review and meta-analysis of randomised clinical trials. Eur J Prev Cardiol 2015;22(12):1575-87. doi: 10.1177/2047487314560663
96. Ulbricht C, Isaac R, Milkin T, et al. An evidence-based systematic review of stevia by the Natural Standard Research Collaboration. Cardiovasc Hematol Agents Med Chem 2010;8(2):113-27.
97. Azad MB, Abou-Setta AM, Chauhan BF, et al. Nonnutritive sweeteners and cardiometabolic health: a systematic review and meta-analysis of randomized controlled trials and prospective cohort studies. CMAJ : Canadian Medical Association Journal 2017;189(28):E929-E39. doi: 10.1503/cmaj.161390
98. Wan X, Wang W, Liu J, et al. Estimating the sample mean and standard deviation from the sample size, median, range and/or interquartile range. BMC Med Res Methodol 2014;14(1):135. doi: 10.1186/1471-2288-14-135
99. Sylvetsky AC, Blau JE, Rother KI. Understanding the metabolic and health effects of low-calorie sweeteners: methodological considerations and implications for future research. Rev Endocr
Metab Disord 2016;17(2):187-94. doi: 10.1007/s11154-016-9344-5
Page 25 of 49
https://mc.manuscriptcentral.com/bmj
BMJ
123456789101112131415161718192021222324252627282930313233343536373839404142434445464748495051525354555657585960

Confidential: For Review Only
26
ACKNOWLEDGEMENTS
The WHO Nutrition Guidance Advisory Group (NUGAG) Subgroup on diet and health, and especially
Nishida Chizuru and Jason Montez from WHO, provided valuable insight on aims and objectives of this
review. WHO agreed to the publication of this systematic review in a scientific journal because it serves as
the background evidence review for updating WHO guidelines on saturated and trans fatty acids and
should therefore be available widely.
CONTRIBUTIONS OF AUTHORS
SL, IT and JJM conceived and designed the review. JJM coordinated the review. SL, JJM and IT designed
the search strategy. SL and IT undertook the searches. SL and IT screened the search results. IT organised
the retrieval of the papers. SL, IT, DKdG, JJM screened the papers against eligibility criteria. SL, IT, DKdG
appraised the quality of the papers. SL, IT, DKdG, HS extracted data from the papers. HS analysed data. SL,
JJM, IT, DKdG interpreted data. IT, SL, DKdG and JJM wrote the review and its protocol. JJM, SL and DKdG
provided general advice on the review. JJM secured funding for the review. SL, JJM, IT performed previous
work that was the foundation of the current review. The questions guiding the review were discussed and
developed by the WHO NUGAG Subgroup on Diet and Health, and the study protocol was approved, by
the NUGAG Subgroup on Diet and Health. Neither WHO nor the WHO NUGAG Subgroup on Diet and
Health played a role in data collection or analysis.
DECLARATIONS OF INTEREST
All authors have completed the ICMJE uniform disclosure form at www.icmje.org/coi_disclosure.pdf and
declare: no support from any organisation for the submitted work; no financial relationships with any
organisations that might have an interest in the submitted work in the previous three years; no other
relationships or activities that could appear to have influenced the submitted work.
DATA TRANSPARENCY
All authors, external and internal, had full access to all of the data (including statistical reports and tables)
in the study and can take responsibility for the integrity of the data and the accuracy of the data analysis.
TRANSPARENCY DECLARATION
The lead author (the manuscript's guarantor) affirms that the manuscript is an honest, accurate, and
transparent account of the study being reported; that no important aspects of the study have been
omitted; and that any discrepancies from the study as planned (and, if relevant, registered) have been
explained.
DATA SHARING
Full datasets can be obtained from the corresponding author at [email protected].
LICENSING STATEMENT
The Corresponding Author has the right to grant on behalf of all authors and does grant on behalf of all
authors, a worldwide license to the Publishers and its licensees in perpetuity, in all forms, formats and
media (whether known now or created in the future), to i) publish, reproduce, distribute, display and
store the Contribution, ii) translate the Contribution into other languages, create adaptations, reprints,
Page 26 of 49
https://mc.manuscriptcentral.com/bmj
BMJ
123456789101112131415161718192021222324252627282930313233343536373839404142434445464748495051525354555657585960

Confidential: For Review Only
27
include within collections and create summaries, extracts and/or, abstracts of the Contribution, iii) create
any other derivative work(s) based on the Contribution, iv) to exploit all subsidiary rights in the
Contribution, v) the inclusion of electronic links from the Contribution to third party material where-ever
it may be located; and, vi) license any third party to do any or all of the above.
Page 27 of 49
https://mc.manuscriptcentral.com/bmj
BMJ
123456789101112131415161718192021222324252627282930313233343536373839404142434445464748495051525354555657585960

Confidential: For Review Only
Types of sweeteners of interest in context
251x94mm (96 x 96 DPI)
Page 28 of 49
https://mc.manuscriptcentral.com/bmj
BMJ
123456789101112131415161718192021222324252627282930313233343536373839404142434445464748495051525354555657585960

Confidential: For Review Only
PRISMA flow chart of included studies 28
167x149mm (96 x 96 DPI)
Page 29 of 49
https://mc.manuscriptcentral.com/bmj
BMJ
123456789101112131415161718192021222324252627282930313233343536373839404142434445464748495051525354555657585960

Confidential: For Review Only
Effect of NSSs on weight change (kg) in adults
169x92mm (96 x 96 DPI)
Page 30 of 49
https://mc.manuscriptcentral.com/bmj
BMJ
123456789101112131415161718192021222324252627282930313233343536373839404142434445464748495051525354555657585960

Confidential: For Review Only
Effect of NSSs on daily energy intake in kJ by study duration (4 or 10 weeks)
169x78mm (96 x 96 DPI)
Page 31 of 49
https://mc.manuscriptcentral.com/bmj
BMJ
123456789101112131415161718192021222324252627282930313233343536373839404142434445464748495051525354555657585960

Confidential: For Review Only
Effect of NSSs on daily sugar intake (g) in adults
271x67mm (96 x 96 DPI)
Page 32 of 49
https://mc.manuscriptcentral.com/bmj
BMJ
123456789101112131415161718192021222324252627282930313233343536373839404142434445464748495051525354555657585960

Confidential: For Review Only
Effect of NSSs on risk (OR) of bladder cancer (<1 = increased risk of cancer with NSSs)
279x120mm (96 x 96 DPI)
Page 33 of 49
https://mc.manuscriptcentral.com/bmj
BMJ
123456789101112131415161718192021222324252627282930313233343536373839404142434445464748495051525354555657585960

Confidential: For Review Only
Effect of NSSs on weight change (kg) in children
282x71mm (96 x 96 DPI)
Page 34 of 49
https://mc.manuscriptcentral.com/bmj
BMJ
123456789101112131415161718192021222324252627282930313233343536373839404142434445464748495051525354555657585960
Confidential: For Review Only
Supplementary file 1
References to included studies
1. Baird, I.M., et al., Repeated dose study of sucralose tolerance in human subjects. Food Chem
Toxicol, 2000. 38 Suppl 2: p. S123-9.
2. Ballantyne, C.J., R. Hammersley, and M. Reid, Effects of sucrose added blind to the diet over eight
weeks on body mass and mood in men. Appetite, 2011. 57: p. S3.
3. Blackburn, G.L., et al., The effect of aspartame as part of a multidisciplinary weight-control
program on short- and long-term control of body weight. Am J Clin Nutr
1997. 65(2): p. 409-418.
4. Bosetti, C., et al., Artificial sweeteners and the risk of gastric, pancreatic, and endometrial cancers
in Italy. Cancer Epidemiol Biomarkers Prev, 2009. 18(8): p. 2235-8.
5. Bruun, J.M., et al., Consumption of sucrose-sweetened soft drinks increases plasma levels of uric
acid in overweight and obese subjects: a 6-month randomised controlled trial. Eur J Clin Nutr, 2015. 69(8):
p. 949-53.
6. Cabaniols, C., et al., Links between private habits, psychological stress and brain cancer: a case-
control pilot study in France. J Neurooncol, 2011. 103(2): p. 307-16.
7. Cartwright, R.A., et al., The epidemiology of bladder cancer in West Yorkshire. A preliminary
report on non-occupational aetiologies. Carcinogenesis, 1981. 2(4): p. 343-7.
8. Colditz, G.A., et al., Patterns of Weight Change and Their Relation to Diet in a Cohort of Healthy
Women. Am J Clin Nutr, 1990. 51(6): p. 1100-1105.
9. de Ruyter, J.C., et al., The effect of sugar-free versus sugar-sweetened beverages on satiety, liking
and wanting: an 18 month randomized double-blind trial in children. PLoS One, 2013. 8(10): p. e78039.
10. de Ruyter, J.C., et al., Effect of sugar-sweetened beverages on body weight in children: design and
baseline characteristics of the Double-blind, Randomized INtervention study in Kids. Contemp Clin Trials,
2012. 33(1): p. 247-57.
11. de Ruyter, J.C., et al., A trial of sugar-free or sugar-sweetened beverages and body weight in
children. N Engl J Med, 2012. 367(15): p. 1397-406.
12. Duran Aguero, S., et al., [Association between non-nutritive sweeteners and obesity risk among
university students in Latin America]. Rev Med Chil, 2015. 143(3): p. 367-73.
13. Duran Aguero, S., G. Onate, and P.H. Rivera, Consumption of non-nutritive sweeteners and
nutritional status in 10-16 year old students. Arch Argent Pediatr, 2014. 112(3): p. 207-214.
14. Fernandes, J., et al., Dietary factors are associated with coronary heart disease risk factors in
college students. Nutr Res, 2013. 33(8): p. 647-52.
15. Frey, G.H., Use of aspartame by apparently healthy children and adolescents. J Toxicol Environ
Health, 1976. 2(2): p. 401-15.
Page 35 of 49
https://mc.manuscriptcentral.com/bmj
BMJ
123456789101112131415161718192021222324252627282930313233343536373839404142434445464748495051525354555657585960

Confidential: For Review Only
16. Gallus, S., et al., Artificial sweeteners and cancer risk in a network of case-control studies. Ann
Oncol, 2007. 18(1): p. 40-4.
17. Goodman, M.T., H. Morgenstern, and E.L. Wynder, A case-control study of factors affecting the
development of renal cell cancer. Am J Epidemiol, 1986. 124(6): p. 926-41.
18. Guo, X., et al., Sweetened beverages, coffee, and tea and depression risk among older US adults.
PLoS One, 2014. 9(4): p. e94715.
19. Gurney, J.G., et al., Aspartame consumption in relation to childhood brain tumor risk: results from
a case-control study. J Natl Cancer Inst, 1997. 89(14): p. 1072-4.
20. Hammersley, R., et al., Obese women partially compensate for sucrose added to the diet, without
weight gain, over 28 days. Proceedings of the Nutrition Society, 2011. 70 (6): p. E384.
21. Howe, G.R., et al., Artificial sweeteners and human bladder cancer. Lancet, 1977. 2(8038): p. 578-
81.
22. Iscovich, J., et al., Tobacco smoking, occupational exposure and bladder cancer in Argentina. Int J
Cancer, 1987. 40(6): p. 734-40.
23. Kanders, B.S., et al., An evaluation of the effect of aspartame on weight loss. Appetite, 1988. 11
Suppl 1(Journal Article): p. 73-84.
24. Kessler, I. and J.P. Clark, Saccharin, cyclamate, and human bladder cancer. No evidence of an
association. JAMA, 1978. 240(4): p. 349-55.
25. Kim, E.J., et al., Effects of fructooligosaccharides intake on body weight, lipid profiles, and calcium
status among Korean college students. Faseb Journal, 2011. 25.
26. Knopp, R.H., K. Brandt, and R.A. Arky, Effects of aspartame in young persons during weight
reduction. J Toxicol Environ Health, 1976. 2(2): p. 417-28.
27. Kuk, J.L. and R.E. Brown, Aspartame intake is associated with greater glucose intolerance in
individuals with obesity. Applied Physiology Nutrition and Metabolism, 2016. 41(7): p. 795-798.
28. Kuzma, J.N., et al., No difference in ad libitum energy intake in healthy men and women
consuming beverages sweetened with fructose, glucose, or high-fructose corn syrup: a randomized trial.
Am J Clin Nutr, 2015. 102(6): p. 1373-80.
29. Lee, B.H., et al., Effect of Fructooligosaccharides on Improvement of blood glucose, calcium status
and habitual bowel movement among college students in Korea. Faseb Journal, 2012. 26.
30. Lim, U., et al., Consumption of aspartame-containing beverages and incidence of hematopoietic
and brain malignancies. Cancer Epidemiol Biomarkers Prev, 2006. 15(9): p. 1654-9.
31. Lindseth, G.N., et al., Neurobehavioral effects of aspartame consumption. Res Nurs Health, 2014.
37(3): p. 185-93.
32. Maersk, M., et al., Sucrose-sweetened beverages increase fat storage in the liver, muscle, and
visceral fat depot: a 6-mo randomized intervention study. Am J Clin Nutr, 2012. 95(2): p. 283-9.
Page 36 of 49
https://mc.manuscriptcentral.com/bmj
BMJ
123456789101112131415161718192021222324252627282930313233343536373839404142434445464748495051525354555657585960

Confidential: For Review Only
33. Maki, K.C., et al., The hemodynamic effects of rebaudioside A in healthy adults with normal and
low-normal blood pressure. Food Chem Toxicol, 2008. 46 Suppl 7: p. S40-6.
34. McCullough, M.L., et al., Consumption of artificially and sugar-sweetened carbonated beverages
and risk of non-Hodgkin lymphoid neoplasms: The Cancer Prevention Study-II Nutrition Cohort. Cancer
Prev Res, 2013. 6(11).
35. McCullough, M.L., et al., Artificially and sugar-sweetened carbonated beverage consumption is
not associated with risk of lymphoid neoplasms in older men and women. J Nutr, 2014. 144(12): p. 2041-
9.
36. Moller-Jensen, O., et al., Artificial sweeteners and absence of bladder cancer risk in Copenhagen.
Int J Cancer, 1983. 32(5): p. 577-82.
37. Momas, I., et al., Relative importance of risk factors in bladder carcinogenesis: some new results
about Mediterranean habits. Cancer Causes Control, 1994. 5(4): p. 326-32.
38. Mommsen, S., J. Aagaard, and A. Sell, A case-control study of female bladder cancer. Eur J Cancer
Clin Oncol, 1983. 19(6): p. 725-9.
39. Naismith, D.J. and C. Rhodes, Adjustment in Energy-Intake Following the Covert Removal of Sugar
from the Diet. J Hum Nutr Diet, 1995. 8(3): p. 167-175.
40. Najem, G.R., et al., Life time occupation, smoking, caffeine, saccharine, hair dyes and bladder
carcinogenesis. Int J Epidemiol, 1982. 11(3): p. 212-7.
41. Nomura, A.M., et al., Dietary factors in cancer of the lower urinary tract. Int J Cancer, 1991. 48(2):
p. 199-205.
42. Parker, D.R., et al., Dietary factors in relation to weight change among men and women from two
southeastern New England communities. Int J Obes Relat Metab Disord, 1997. 21(2): p. 103-9.
43. Porikos, K.P., M.F. Hesser, and T.B. van Itallie, Caloric regulation in normal-weight men
maintained on a palatable diet of conventional foods. Physiol Behav, 1982. 29(2): p. 293-300.
44. Raben, A., et al., A randomized 10 week trial of sucrose vs artificial sweeteners on body weight
and blood pressure after 10 weeks [abstract]. Obesity Res, 2001. 9: p. 86s.
45. Raben, A., et al., Increased postprandial glycaemia, insulinemia, and lipidemia after 10 weeks'
sucrose-rich diet compared to an artificially sweetened diet: A randomised controlled trial. Food Nutr Res,
2011. 55.
46. Raben, A., et al., Sucrose compared with artificial sweeteners: different effects on ad libitum food
intake and body weight after 10 wk of supplementation in overweight subjects. Am J Clin Nutr, 2002.
76(4): p. 721-9.
47. Raben, A., et al., Sugar - But not sweeteners - Increases the body weight of obese persons after 10
week intake. [Danish]. Ugeskr Laeger, 2003. 165(15): p. 1552-1557.
48. Reid, M., R. Hammersley, and M. Duffy, Effects of sucrose drinks on macronutrient intake, body
weight, and mood state in overweight women over 4 weeks. Appetite, 2010. 55(1): p. 130-6.
Page 37 of 49
https://mc.manuscriptcentral.com/bmj
BMJ
123456789101112131415161718192021222324252627282930313233343536373839404142434445464748495051525354555657585960
Confidential: For Review Only
49. Reid, M., et al., Effects on obese women of the sugar sucrose added to the diet over 28 d: a quasi-
randomised, single-blind, controlled trial. Br J Nutr, 2014. 111(3): p. 563-70.
50. Reid, M., et al., Long-term dietary compensation for added sugar: effects of supplementary
sucrose drinks over a 4-week period. Br J Nutr, 2007. 97(1): p. 193-203.
51. Serra Majem, L., et al., Cyclamate consumption in Catalonia, Spain (1992): relationship with the
body mass index. Food Addit Contam, 1996. 13(6): p. 695-703.
52. Simon, D., S. Yen, and P. Cole, Coffee drinking and cancer of the lower urinary tract. J Natl Cancer
Inst, 1975. 54(3): p. 587-91.
53. Sorensen, L.B., et al., Effect of sucrose on inflammatory markers in overweight humans. Am J Clin
Nutr, 2005. 82(2): p. 421-7.
54. Sorensen, L.B., et al., Sucrose compared with artificial sweeteners: a clinical intervention study of
effects on energy intake, appetite, and energy expenditure after 10 wk of supplementation in overweight
subjects. Am J Clin Nutr, 2014. 100(1): p. 36-45.
55. Spiers, P.A., et al., Aspartame: neuropsychologic and neurophysiologic evaluation of acute and
chronic effects. Am J Clin Nutr, 1998. 68(3): p. 531-7.
56. Stanhope, K., et al., Compared with aspartame, consumption of high fructose corn syrup-and
sucrose-sweetened beverages increases triglycerides, cholesterol, non-HDL cholesterol, apolipoprotein-B
uric acid in youngmen and women. J Womens Health, 2013. 22 (10)(10): p. 898-899.
57. Stanhope, K.L., et al., A dose-response study of consuming high-fructose corn syrup-sweetened
beverages on lipid/lipoprotein risk factors for cardiovascular disease in young adults. Am J Clin Nutr, 2015.
101(6): p. 1144-54.
58. Taljaard, C., et al., Effects of a multi-micronutrient-fortified beverage, with and without sugar, on
growth and cognition in South African schoolchildren: a randomised, double-blind, controlled
intervention. Br J Nutr, 2013. 110(12): p. 2271-84.
59. Tordoff, M.G. and A.M. Alleva, Effect of drinking soda sweetened with aspartame or high-fructose
corn syrup on food intake and body weight. Am J Clin Nutr, 1990. 51(6): p. 963-9.
60. van den Eeden, S.K., A randomized crossover trial of aspartame and sleep. Am J Clin Nutr, 1991.
53(3): p. P-30.
61. Van den Eeden, S.K., et al., Aspartame ingestion and headaches: a randomized crossover trial.
Neurology, 1994. 44(10): p. 1787-93.
62. Warrington, S., et al., Acute and multiple-dose studies to determine the safety, tolerability, and
pharmacokinetic profile of advantame in healthy volunteers. Food Chem Toxicol, 2011. 49 Suppl 1: p. S77-
83.
63. Wolraich, M.L., et al., Effects of diets high in sucrose or aspartame on the behavior and cognitive
performance of children. N Engl J Med, 1994. 330(5): p. 301-7.
Page 38 of 49
https://mc.manuscriptcentral.com/bmj
BMJ
123456789101112131415161718192021222324252627282930313233343536373839404142434445464748495051525354555657585960

Confidential: For Review Only
64. Wulaningsih, W., et al., Investigating nutrition and lifestyle factors as determinants of abdominal
obesity: an environment-wide study. International Journal of Obesity, 2017. 41(2): p. 340-347.
65. Yu, Y., et al., Risk factors for bladder cancer: a case-control study in northeast China. Eur J Cancer
Prev, 1997. 6(4): p. 363-9.
66. Zanela, N.L., M.F. Bijella, and O.P. Rosa, The influence of mouthrinses with antimicrobial solutions
on the inhibition of dental plaque and on the levels of mutans streptococci in children. Pesqui Odontol
Bras, 2002. 16(2): p. 101-6.
Ongoing studies and studies awaiting classification
1. Friel, J.K., Effects of Artificial Sweeteners on Gut Microbiota and Glucose Metabolism. 2016.
2. Huber, T., Study of the Reversibility of Glucose Intolerance Caused by Chronic Aspartame
Consumption. 2015.
3. Kyriazis, G., Interactions of Human Gut Microbiota With Intestinal Sweet Taste Receptors (ISTAR-
micro). 2017.
4. Mattes, Beverage Consumption and Fine Motor Control (LCS). 2016.
5. Mattes, R.D., The Effects of Aspartame on Appetite, Body Composition and Oral Glucose
Tolerance. 2016.
6. Nilsson, A., On the Impact of Common Sweetening Agents on Glucose Regulation, Cognitive
Functioning and Gut Microbiota. 2015.
7. Small, D.M., The Effect of Artificial Sweeteners (AFS) on Sweetness Sensitivity, Preference and
Brain Response in Adolescents. 2014.
8. Sriphrapradang, C., Sucralose Effects on Glucose Metabolism and Gut Microbiota. 2016.
9. Steffen, L.M., Sucralose, Stevia, Gut Microbiome and Glucose Metabolism. 2016.
Page 39 of 49
https://mc.manuscriptcentral.com/bmj
BMJ
123456789101112131415161718192021222324252627282930313233343536373839404142434445464748495051525354555657585960

Confidential: For Review Only
Example of search strategy
„Artificial sweeteners” and “Natural non-caloric sweeteners” search strategy for Ovid MEDLINE(R) In-
Process & Other Non-Indexed Citations and Ovid MEDLINE(R) <1946 to Present>
1 Aspartame/
2 aspartame*.mp.
3 acesulfame.mp.
4 ace K.mp.
5 Saccharin/
6 saccharin*.mp.
7 sucralose.mp.
8 neotame.mp.
9 advantame.mp.
10 Cyclamates/
11 cyclamate*.mp.
12 neohesperidin.mp.
13 alitame*.mp.
14 artificial sweetener*.mp.
15 Stevia/
16 stevia*.mp.
17 steviol*.mp.
18 stevioside*.mp.
19 rebaudioside*.mp.
20 rebiana*.mp.
21 thaumatin*.mp.
22 brazzein*.mp.
23 mogroside*.mp.
24 ((non-calori* or noncalori*) adj (sweetener* or sweetner*)).mp.
25 ((non-sugar or nonsugar) adj (sweetener* or sweetner*)).mp.
26 ((non-nutritive or nonnutritive) adj (sweetener* or sweetner*)).mp.
27 ((low-calori* or lowcalori*) adj (sweetener* or sweetner*)).mp.
28 ((intense or high intensity or high potency) adj (sweetener* or sweetner*)).mp.
29 natural sweetener*.mp.
30 Non-Nutritive Sweeteners/
31 natural sweetening agent*.mp.
32 sugar substitute*.mp.
33 ((non-caloric or noncaloric or zero caloric or diet) adj (beverage* or drink*)).mp.
34 sweetening agents/ or non-nutritive sweeteners/
35 or/1-34
36 exp animals/ not humans.mp. [mp=title, abstract, original title, name of substance word, subject heading word,
keyword heading word, protocol supplementary concept word, rare disease supplementary concept word, unique
identifier]
37 35 not 36
Page 40 of 49
https://mc.manuscriptcentral.com/bmj
BMJ
123456789101112131415161718192021222324252627282930313233343536373839404142434445464748495051525354555657585960
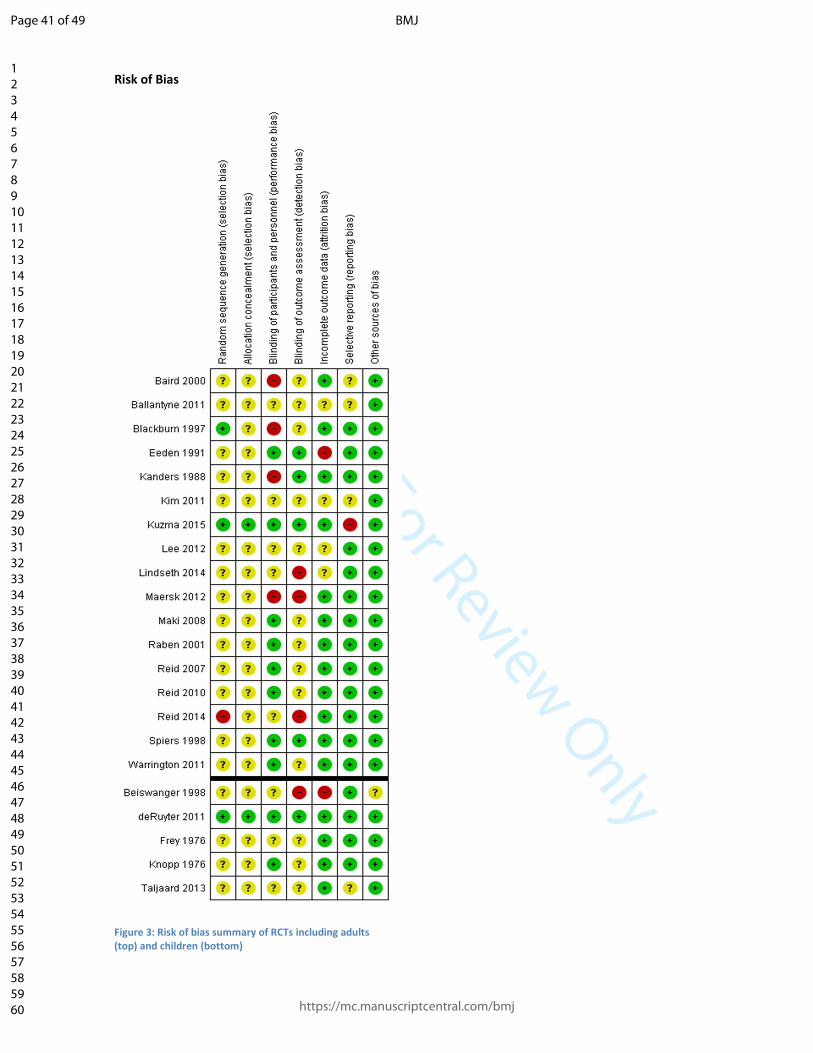
Confidential: For Review Only
Risk of Bias
Figure 3: Risk of bias summary of RCTs including adults
(top) and children (bottom)
Page 41 of 49
https://mc.manuscriptcentral.com/bmj
BMJ
123456789101112131415161718192021222324252627282930313233343536373839404142434445464748495051525354555657585960
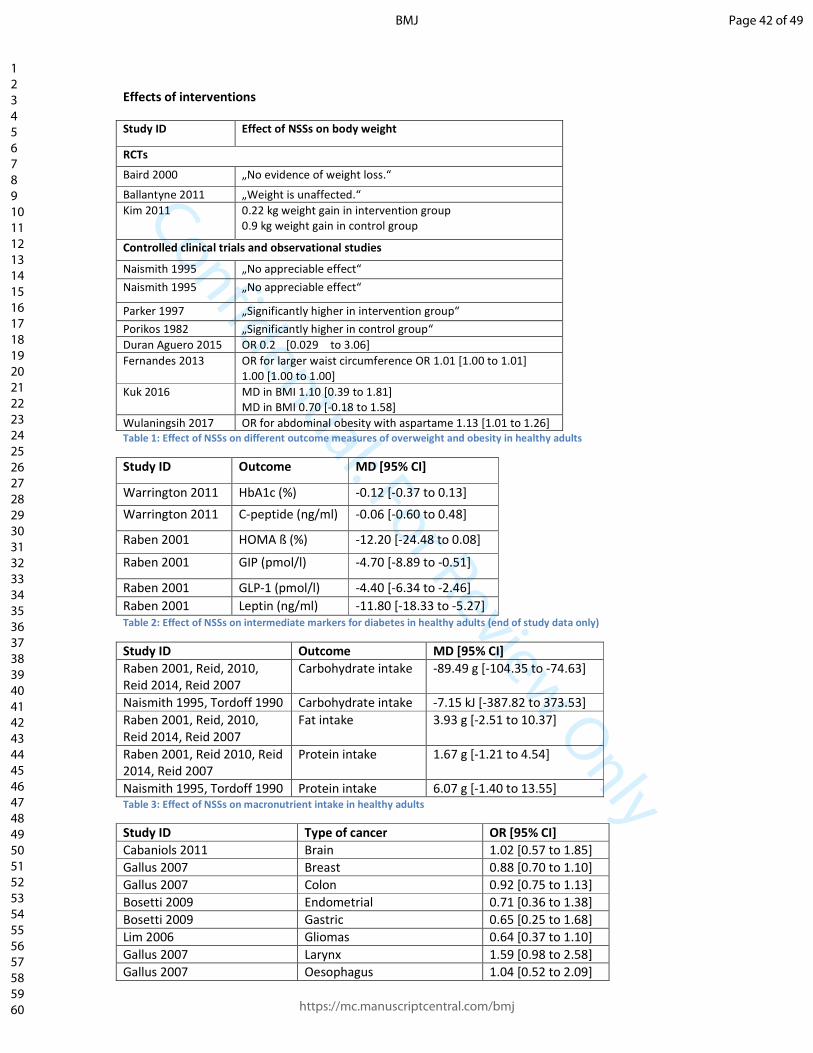
Confidential: For Review Only
Effects of interventions
Study ID Effect of NSSs on body weight
RCTs
Baird 2000 „No evidence of weight loss.“
Ballantyne 2011 „Weight is unaffected.“
Kim 2011 0.22 kg weight gain in intervention group
0.9 kg weight gain in control group
Controlled clinical trials and observational studies
Naismith 1995 „No appreciable effect“
Naismith 1995 „No appreciable effect“
Parker 1997 „Significantly higher in intervention group“
Porikos 1982 „Significantly higher in control group“
Duran Aguero 2015 OR 0.2 [0.029 to 3.06]
Fernandes 2013 OR for larger waist circumference OR 1.01 [1.00 to 1.01]
1.00 [1.00 to 1.00]
Kuk 2016 MD in BMI 1.10 [0.39 to 1.81]
MD in BMI 0.70 [-0.18 to 1.58]
Wulaningsih 2017 OR for abdominal obesity with aspartame 1.13 [1.01 to 1.26]
Table 1: Effect of NSSs on different outcome measures of overweight and obesity in healthy adults
Study ID Outcome MD [95% CI]
Warrington 2011 HbA1c (%) -0.12 [-0.37 to 0.13]
Warrington 2011 C-peptide (ng/ml) -0.06 [-0.60 to 0.48]
Raben 2001 HOMA ß (%) -12.20 [-24.48 to 0.08]
Raben 2001 GIP (pmol/l) -4.70 [-8.89 to -0.51]
Raben 2001 GLP-1 (pmol/l) -4.40 [-6.34 to -2.46]
Raben 2001 Leptin (ng/ml) -11.80 [-18.33 to -5.27]
Table 2: Effect of NSSs on intermediate markers for diabetes in healthy adults (end of study data only)
Study ID Outcome MD [95% CI]
Raben 2001, Reid, 2010,
Reid 2014, Reid 2007
Carbohydrate intake -89.49 g [-104.35 to -74.63]
Naismith 1995, Tordoff 1990 Carbohydrate intake -7.15 kJ [-387.82 to 373.53]
Raben 2001, Reid, 2010,
Reid 2014, Reid 2007
Fat intake 3.93 g [-2.51 to 10.37]
Raben 2001, Reid 2010, Reid
2014, Reid 2007
Protein intake 1.67 g [-1.21 to 4.54]
Naismith 1995, Tordoff 1990 Protein intake 6.07 g [-1.40 to 13.55] Table 3: Effect of NSSs on macronutrient intake in healthy adults
Study ID Type of cancer OR [95% CI]
Cabaniols 2011 Brain 1.02 [0.57 to 1.85]
Gallus 2007 Breast 0.88 [0.70 to 1.10]
Gallus 2007 Colon 0.92 [0.75 to 1.13]
Bosetti 2009 Endometrial 0.71 [0.36 to 1.38]
Bosetti 2009 Gastric 0.65 [0.25 to 1.68]
Lim 2006 Gliomas 0.64 [0.37 to 1.10]
Gallus 2007 Larynx 1.59 [0.98 to 2.58]
Gallus 2007 Oesophagus 1.04 [0.52 to 2.09]
Page 42 of 49
https://mc.manuscriptcentral.com/bmj
BMJ
123456789101112131415161718192021222324252627282930313233343536373839404142434445464748495051525354555657585960

Confidential: For Review Only
Gallus 2007 Oral cavity and pharynx 0.79 [0.45 to 1.39]
Gallus 2007 Ovary 0.61 [0.38 to 0.98]
Lim 2006 Overall hematopoietic cancer 0.89 [0.76 to 1.27]
Bosetti 2009 Pancreatic 0.19 [0.08 to 0.46]
Gallus 2007 Prostate 1.08 [0.81 to 1.45]
Gallus 2007 Rectum 0.79 [0.60 to 1.05]
Gallus 2007, Goodman 1986 Renal cell cancer 1.04 [0.81 to 1.34]
McCullough 2014 Hodgkin lymphoma 0.77 [0.44 to 1.32]
McCullough 2014 Multiple Myeloma 0.85 [0.62 to 1.17]
McCullough 2014 All non-Hodgkin lymphoma 1.29 [1.08 to 1.54] Table 4: Effect of NSSs on the risk for different types of cancer
Study ID Outcome MD [95% CI]
Raben 2001,
Warrington 2011
serum triglyceride concentration -0.02 mmol/l [ -0.21 to 0.16]
Raben 2001,
Warrington 2011, Frey
1976*
serum triglyceride 0.27 mmol/l [-0.92 to 1.46]
Maersk 2012, Raben
2001, Warrington 2011
serum cholesterol
concentrations
-0.14 mmol/l [-0.84 to 0.56]
Maersk 2012,
Warrington 2011
LDL cholesterol concentration -0.09 mmol/l [-1.04 to 0.86]
Maersk 2012, Raben
2001, Warrington 2011
serum HDL cholesterol
concentration
-0.01 mmol/dl [-0.08 to 0.05]
Stanhope 2013,
Stanhope 2015
serum triglyceride
concentrations
”No difference between groups”
Table 5: Effect of NSSs on intermediate markers of cardiovascular disease in healthy adults, * sensitivity analysis
Dose OR [95% CI]
Aspartame first consumed at age <3 1.0 [0.3 to 3.1]
Aspartame first consumed at age of 3-7 y 1.2 [0.4 to 3.6]
Aspartame consumption duration <2 y 1.2 [0.4 to 3.3]
Aspartame consumption duration ≥2 y 1.1 [0.3 to 3.4]
Aspartame consumption duration <1 times/week 1.6 [0.5 to 5.2]
Aspartame consumption duration ≥ 1 times/week 0.9 [0.3 to 2.4] Table 6: Effect of different exposure categories of aspartame on risk for brain cancer in children
Figure 1: Effect of NSSs on BMI in adults
Page 43 of 49
https://mc.manuscriptcentral.com/bmj
BMJ
123456789101112131415161718192021222324252627282930313233343536373839404142434445464748495051525354555657585960

Confidential: For Review Only
Figure 2: Effect of NSSs on HOMA-IR in adults
Figure 3: Effect of NSSs on carbohydrate intake (g) by study duration in adults
Figure 4: Effect of NSSs on fat intake (g) in adults
Page 44 of 49
https://mc.manuscriptcentral.com/bmj
BMJ
123456789101112131415161718192021222324252627282930313233343536373839404142434445464748495051525354555657585960

Confidential: For Review Only
Figure 5: Effect of NSSs on fat intake (g) in adults
Figure 6: Effect of NSSs on systolic blood pressure in adults
Figure 7: Effect of NSSs on LDL cholesterol in adults
Figure 8: Effect of NSSs on HDL cholesterol in adults
Page 45 of 49
https://mc.manuscriptcentral.com/bmj
BMJ
123456789101112131415161718192021222324252627282930313233343536373839404142434445464748495051525354555657585960

Confidential: For Review Only
Figure 9: Effect of NSSs on change in creatinine (mg/dl) in adults
Figure 10: Effect of NSSs on risk for adverse events in adults by duration
Figure 11: Effect of NSSs on change in haematocrit (%) in adults
Page 46 of 49
https://mc.manuscriptcentral.com/bmj
BMJ
123456789101112131415161718192021222324252627282930313233343536373839404142434445464748495051525354555657585960

Confidential: For Review Only
Figure 12: Effect of NSSs on change in BMI z-score in children
Figure 13: Effect of NSSs on blood Hb in children
Page 47 of 49
https://mc.manuscriptcentral.com/bmj
BMJ
123456789101112131415161718192021222324252627282930313233343536373839404142434445464748495051525354555657585960
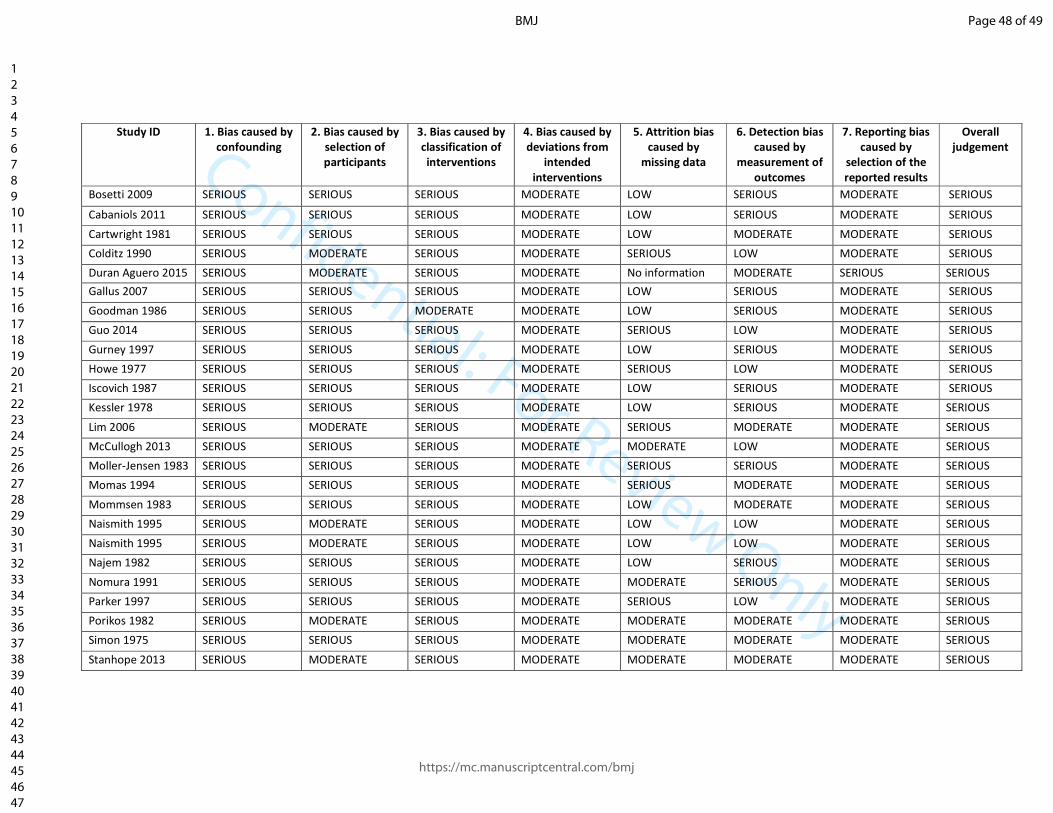
Confidential: For Review Only
Study ID 1. Bias caused by
confounding
2. Bias caused by
selection of
participants
3. Bias caused by
classification of
interventions
4. Bias caused by
deviations from
intended
interventions
5. Attrition bias
caused by
missing data
6. Detection bias
caused by
measurement of
outcomes
7. Reporting bias
caused by
selection of the
reported results
Overall
judgement
Bosetti 2009 SERIOUS SERIOUS SERIOUS MODERATE LOW SERIOUS MODERATE SERIOUS
Cabaniols 2011 SERIOUS SERIOUS SERIOUS MODERATE LOW SERIOUS MODERATE SERIOUS
Cartwright 1981 SERIOUS SERIOUS SERIOUS MODERATE LOW MODERATE MODERATE SERIOUS
Colditz 1990 SERIOUS MODERATE SERIOUS MODERATE SERIOUS LOW MODERATE SERIOUS
Duran Aguero 2015 SERIOUS MODERATE SERIOUS MODERATE No information MODERATE SERIOUS SERIOUS
Gallus 2007 SERIOUS SERIOUS SERIOUS MODERATE LOW SERIOUS MODERATE SERIOUS
Goodman 1986 SERIOUS SERIOUS MODERATE MODERATE LOW SERIOUS MODERATE SERIOUS
Guo 2014 SERIOUS SERIOUS SERIOUS MODERATE SERIOUS LOW MODERATE SERIOUS
Gurney 1997 SERIOUS SERIOUS SERIOUS MODERATE LOW SERIOUS MODERATE SERIOUS
Howe 1977 SERIOUS SERIOUS SERIOUS MODERATE SERIOUS LOW MODERATE SERIOUS
Iscovich 1987 SERIOUS SERIOUS SERIOUS MODERATE LOW SERIOUS MODERATE SERIOUS
Kessler 1978 SERIOUS SERIOUS SERIOUS MODERATE LOW SERIOUS MODERATE SERIOUS
Lim 2006 SERIOUS MODERATE SERIOUS MODERATE SERIOUS MODERATE MODERATE SERIOUS
McCullogh 2013 SERIOUS SERIOUS SERIOUS MODERATE MODERATE LOW MODERATE SERIOUS
Moller-Jensen 1983 SERIOUS SERIOUS SERIOUS MODERATE SERIOUS SERIOUS MODERATE SERIOUS
Momas 1994 SERIOUS SERIOUS SERIOUS MODERATE SERIOUS MODERATE MODERATE SERIOUS
Mommsen 1983 SERIOUS SERIOUS SERIOUS MODERATE LOW MODERATE MODERATE SERIOUS
Naismith 1995 SERIOUS MODERATE SERIOUS MODERATE LOW LOW MODERATE SERIOUS
Naismith 1995 SERIOUS MODERATE SERIOUS MODERATE LOW LOW MODERATE SERIOUS
Najem 1982 SERIOUS SERIOUS SERIOUS MODERATE LOW SERIOUS MODERATE SERIOUS
Nomura 1991 SERIOUS SERIOUS SERIOUS MODERATE MODERATE SERIOUS MODERATE SERIOUS
Parker 1997 SERIOUS SERIOUS SERIOUS MODERATE SERIOUS LOW MODERATE SERIOUS
Porikos 1982 SERIOUS MODERATE SERIOUS MODERATE MODERATE MODERATE MODERATE SERIOUS
Simon 1975 SERIOUS SERIOUS SERIOUS MODERATE MODERATE MODERATE MODERATE SERIOUS
Stanhope 2013 SERIOUS MODERATE SERIOUS MODERATE MODERATE MODERATE MODERATE SERIOUS
Page 48 of 49
https://mc.manuscriptcentral.com/bmj
BMJ
123456789101112131415161718192021222324252627282930313233343536373839404142434445464748495051525354555657585960

Confidential: For Review Only
Stanhope 2015 SERIOUS MODERATE SERIOUS MODERATE MODERATE LOW MODERATE SERIOUS
Tordoff 1990 SERIOUS MODERATE LOW MODERATE LOW LOW MODERATE SERIOUS
Wolraich 1994 SERIOUS SERIOUS LOW LOW LOW LOW MODERATE SERIOUS
Yu 1997 SERIOUS SERIOUS SERIOUS MODERATE LOW SERIOUS MODERATE SERIOUS
Zanela 2002 SERIOUS MODERATE LOW MODERATE LOW LOW MODERATE SERIOUS
Duran Aguero 2014 SERIOUS SERIOUS SERIOUS LOW LOW LOW MODERATE SERIOUS
Kuk 2016 SERIOUS SERIOUS SERIOUS LOW MODERATE LOW MODERATE SERIOUS
Wulaningsih 2016 SERIOUS SERIOUS SERIOUS LOW MODERATE LOW MODERATE SERIOUS
Serra-Majem 1996 SERIOUS SERIOUS SERIOUS LOW LOW LOW MODERATE SERIOUS
Fernandes 2013 SERIOUS SERIOUS SERIOUS LOW LOW LOW MODERATE SERIOUS
Page 49 of 49
https://mc.manuscriptcentral.com/bmj
BMJ
123456789101112131415161718192021222324252627282930313233343536373839404142434445464748495051525354555657585960


![Confidential: For Review Only - BMJ...Confidential: For Review Only 4 Introduction Psoriasis is a chronic, immune-mediated inflammatory skin disease [1], consisting of red, heavily](https://img.dokumen.tips/doc/110x75/60fadfe181e304552649b889/confidential-for-review-only-bmj-confidential-for-review-only-4-introduction.jpg)