Embed Size (px)
Citation preview

Volume 8, Number 1 Department of Computer Science Spring, 1999 Brown University
conduit!condu t!conduit!condu t!conduit!condu t!
Roberto Tamassiaattending a workshopon graph drawing in
Barbados
GRAPH DRAWING andINFORMATION VISUALIZATION
Information visualization isan emerging discipline thataddresses the problem ofcommunicating the struc-ture of information spacethrough diagrams. Quot-ing from an article by DavidHarel (Comm. ACM 31(5)1988):
“The intricate nature ofa variety of computer-related systems and sit-uations can, and in ouropinion should, be rep-resented via visual for-malisms; visual becausethey are to be gener-ated, comprehended,
e next decade the use
and communicated by humans; andformal, because they are to be manip-ulated, maintained, and analyzed bycomputers.”
“...in th
of information visualizationtechniques will be essential tothe success of portals and other
large information repositorieson the Internet”
The benefits of informa-tion visualization includeanalysis through visualexploration, discovery ofpatterns and correlations,and abstraction and sum-marization. It is antici-pated that in the nextdecade the use of informa-tion visualization techniq
ues will beessential to the success of portals andother large information repositories onthe Internet.Brown University, Box 1910, P
Traditionally, information visualizationhas focused on the display of quantita-tive information (e.g., bar charts, piecharts, function plots) and geographicinformation (e.g., road and subwaymaps), where a natural mapping existsbetween the data and their geometriclocation in the diagram. A great introduc-tion to these types of visualizations isgiven in the books by Edward Tufte (TheVisual Display of Quantitative Informa-tion and Envisioning Information).
From quantitative to relational
More recently, researchers have startedaddressing the problem of visualizingrelational information, where net-works (also known as graphs) modelcollections of objects and connectionsbetween those objects. Examples include:• Web: site maps, browsing history dia-
grams, presentation and refinementof query results, product catalogs.
• Software engineering: UML classand state-transition diagrams, sub-
r
routine-call graphs, data-flow dia-grams.
• Database systems: entity-relation-ship diagrams.
ovidence, RI 02912, USA
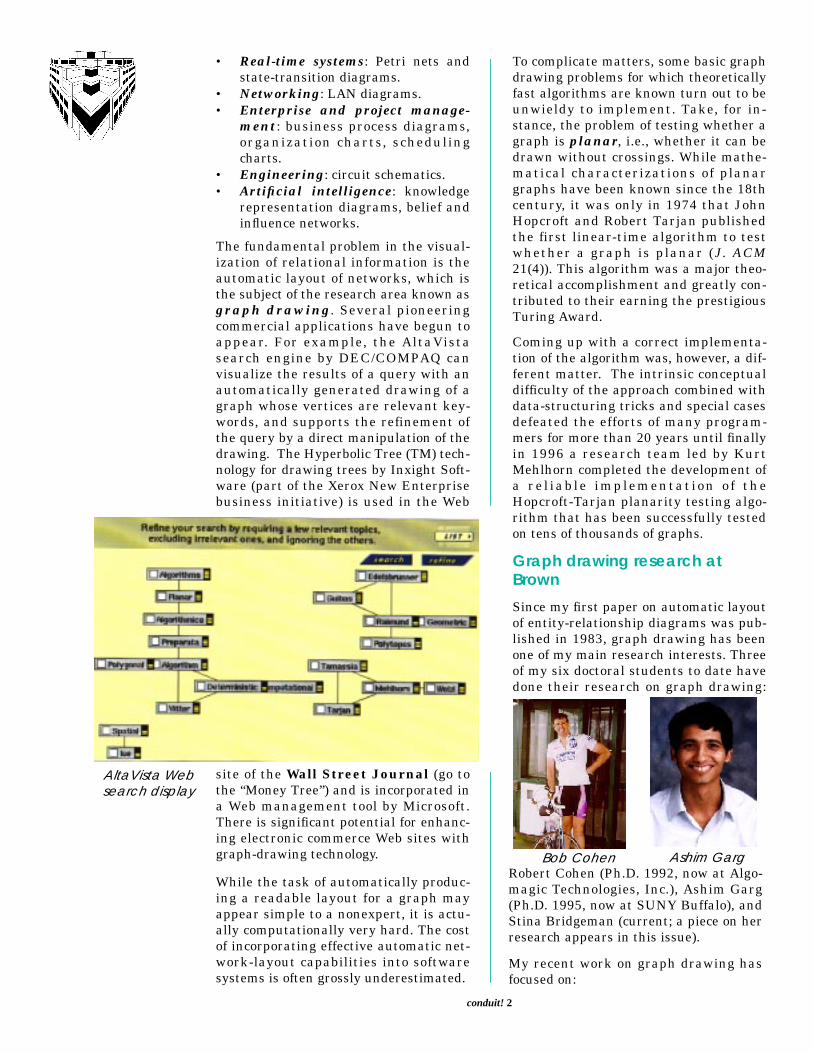
AltaVista Websearch display
• Real-time systems: Petri nets andstate-transition diagrams.
• Networking: LAN diagrams.• Enterprise and project manage-
ment: business process diagrams,organization charts, schedulingcharts.
• Engineering: circuit schematics.• Artificial intelligence: knowledge
representation diagrams, belief andinfluence networks.
The fundamental problem in the visual-ization of relational information is theautomatic layout of networks, which isthe subject of the research area known asgraph drawing. Several pioneeringcommercial applications have begun toappear. For example, the AltaVistasearch engine by DEC/COMPAQ canvisualize the results of a query with anautomatically generated drawing of agraph whose vertices are relevant key-words, and supports the refinement ofthe query by a direct manipulation of thedrawing. The Hyperbolic Tree (TM) tech-nology for drawing trees by Inxight Soft-ware (part of the Xerox New Enterprisebusiness initiative) is used in the Web
site of the Wall Street Journal (go tothe “Money Tree”) and is incorporated ina Web management tool by Microsoft.There is significant potential for enhanc-ing electronic commerce Web sites withgraph-drawing technology.
While the task of automatically produc-ing a readable layout for a graph mayappear simple to a nonexpert, it is actu-ally computationally very hard. The costof incorporating effective automatic net-work-layout capabilities into softwaresystems is often grossly underestimated.
conduit
To complicate matters, some basic graphdrawing problems for which theoreticallyfast algorithms are known turn out to beunwieldy to implement. Take, for in-stance, the problem of testing whether agraph is planar, i.e., whether it can bedrawn without crossings. While mathe-matical characterizations of planargraphs have been known since the 18thcentury, it was only in 1974 that JohnHopcroft and Robert Tarjan publishedthe first linear-time algorithm to testwhether a graph is planar (J. ACM21(4)). This algorithm was a major theo-retical accomplishment and greatly con-tributed to their earning the prestigiousTuring Award.
Coming up with a correct implementa-tion of the algorithm was, however, a dif-ferent matter. The intrinsic conceptualdifficulty of the approach combined withdata-structuring tricks and special casesdefeated the efforts of many program-mers for more than 20 years until finallyin 1996 a research team led by KurtMehlhorn completed the development ofa re l iab le implementat ion of theHopcroft-Tarjan planarity testing algo-rithm that has been successfully testedon tens of thousands of graphs.
Graph drawing research atBrown
Since my first paper on automatic layoutof entity-relationship diagrams was pub-lished in 1983, graph drawing has beenone of my main research interests. Threeof my six doctoral students to date havedone their research on graph drawing:
Robert Cohen (Ph.D. 1992, now at Algo-magic Technologies, Inc.), Ashim Garg(Ph.D. 1995, now at SUNY Buffalo), andStina Bridgeman (current; a piece on herresearch appears in this issue).
My recent work on graph drawing hasfocused on:
Bob Cohen Ashim Garg
! 2

Graph drawing serve
• interactive layout techniques• Web-based graph-drawing systems• software design patterns for graph
drawing
Graph drawing on the WebThe Graph Drawing Server is a Web-based system that provides graph draw-ing services. It can be accessed in vari-ous ways:
• through an interactive graph editorimplemented as a Java applet
• through an HTML form that allowsthe definition of the input graph in avariety of formats
• through a Java package that pro-vides an API for involving the server
It supports various layout styles anddrawing algorithms, including orthogo-
nal layouts computed by
r
the GIOTTO algorithmand hierarchical layouts
Graph-drawing gurus. l to r: IoannisTollis, Roberto, Giuseppe Di Battista
computed by an algorithm that distrib-utes vertices on horizontal layers, andhas been successfully used by manyresearchers worldwide to experimentwith graph-layout techniques.
Graph drawing in JavaI am developing a library of reusablesoftware components for graph drawingin Java. This work is based on algorithmengineering techniques that include theuse of novel algorithmic patterns. Thelibrary can be used to incorporate auto-matic layout capability in various inter-faces that make use of diagrams. I planto show its applications especially to Webbrowsers and programming environ-ments.
In addition to algorithmic and systemsresearch, my future graph-drawing work
condui
includes the development and commer-cialization of a package of Java softwarecomponents for graph layout in collabora-tion with Algomagic Technologies, arecent startup founded by Robert Cohen,Michael Goodrich from Johns HopkinsUniversity and myself.
A book on graph drawing
I have recently published a book on thesubject in collaboration with three othergraph-drawing gurus: Giuseppe Di Bat-tista from the University of Rome, Italy,Peter Eades from the University of New-castle, Australia, and Ioannis Tollis fromthe University of Texas at Dallas. The rig-orous treatment of the subject allows thisbook to be used as a text for graduate
courses and as a reference for research-ers, while the large number of examplesand figures makes it also suitable for soft-ware practitioners.
The latest issue of Dr. Dobb’s Journal(June 1999, page 134) mentions the bookas follows:
“The final book this month isGRAPH DRAWING: Algorithms forthe Visualization of Graphs, byGiuseppe Di Batista, Peter Eades,Roberto Tamassia, Ioannis G. Tollis.The title is an accurate summary ofthe book’s contents, but doesn’t dojustice to its breadth. Section 5.1, forexample, is devoted to angles inorthogonal drawings, while chapter7 covers incremental constructiontechnniques. The style is academic—there are a lot of references, and alot of proofs and lemmas—but thebook will be a rich mine of ideas foranyone who is trying to persuade acomputer to turn data into dots,boxes, lines and arrows.”
and Peter Eades
t! 3

THE
Roger Blumb
“HORIZON”This imposing iron andazure glass monument byartist Costas Varotsos wascommissioned by Generaland Mrs. Kanellakis inmemory of their son Parisand his family. With majes-tic Mt. Parnassos as a back-drop and the town of Liyabelow, the sculpture islocated on family-ownedland—a favorite summerhaunt where they’d gathereach year to take familysnapshots. The inscriptionreads:
DPARIS
THEIR PARENT
EDICATED TO OUR CHILDREN- MATE - ALEXANDRA - STEPHANOSS ELEFTHERIOS AND ROULA KANELLAKIS
20-12-95Paris’s legacy will endure via fellowships and awards established to honor his memory—theACM’s Kanellakis Award, Brown’s Kanellakis Graduate Fellowship and MIT’s KanellakisGraduate Fellowship, to name a few. His parents have donated the land around the monu-ment, aptly, to the SOS Children’s Village International Parc. Said his mother, “It was theirfavorite summer place on earth and now their spirits shall dwell there—near to us—whilethose we cherish are young and together in eternity.”
UNIQUENESS OF CS92
erg
The failure of contemporarytechnologies significantly totransform, much less im-prove, elementary and sec-ondary education in the 20thcentury is by now well-known. Even if radio, televi-sion, film, and now comput-ers have all contributed agreat deal to changing whatwe teach and learn, theythus far have had remark-ably little effect on how weteach and learn it in school.
In his insightful book, Teachers andMachines (Teachers College Press,1986), the historian Larry Cuban pre-sents data suggesting that, among otherthings, the failure of classroom technolo-gies in American schools in this centuryhas had much to do with a top-downmethod of implementation and promo-tion which has kept school teachers from
conduit!
using the technologies effectively and/oron a large scale. He writes that “claimspredicting extraordinary changes inteacher practice and student learning,mixed with promotional tactics, domi-nated the literature in the initial wave ofenthusiasm for each new technology.Seldom were these innovations initiatedby teachers” (p. 4).
Cuban also described a cycle that hascharacterized the fate of classroom tech-nology since 1920: exhilaration, followedby scientific credibility, then disappoint-ment, and finally teacher-bashing. Firstpublished in 1986, Cuban’s book had lit-tle to say, and no interesting data, aboutthe use of computers, but anyone follow-ing even newspaper articles about com-puters in schools over the past fewmonths will realize that all the stages ofCuban’s cycle can already be identifiedin the short history of computers as aspecies of classroom technology.
In its preference for top-down design andpromotion of educational technology, agood deal of university research has onlycontributed to the unfortunate story of
4
“Thewith
from fiprop
w
computers in school. The typical univer-sity-school collaboration model in com-puter science has been that a group ofuniversity researchers develops a tool, orset of tools and curricula, based on theirown expert intuitions of good design,instructional need, and educational val-ue, and then attempts to recommend thetool, and the vision implicit in its design,to working teachers. This model has metwith remarkably little success, consider-ing the tremendous expertise (technicaland pedagogical) and resources (publicand private) that have been devoted to it.
In light of the history of classroom tech-nology, the difference in the approach tothe study and use of computers at schoolembodied in The Educational Software
Seminar begins nota product, deducedrst principles, but withosals gathered fromorking teachers”
Seminar at Brown (CS92/ED89) is clear.The Seminar begins not with a product,deduced from first principles, but withproposals gathered from working teach-ers. These teachers specify instructionalobjectives and technical constraints, aswell as their speculations and aspirationsconcerning how the computer mightimprove student learning and their ownteaching.In the spring semester, Brown under-graduates enrolled in the Seminar readthese proposals—which are solicited,gathered and negotiated in the fall—andchoose those in which they are mostinterested. Then, working in teams ofthree or four, students in CS92 design,create, test and implement the programsproposed. In the process of building thesoftware, the teams work closely withtheir sponsoring teacher and her/his stu-dents, and the production work (whichincludes the creation and presentation ofstoryboards as well as prototypes) is donein parallel with seminar discussions ofliterature drawn from computer scienceand the history and philosophy of educa-tion, as well as the cognitive and socialsciences. As remarkable as the products
conduit!
of the Seminar have been—a phenome-non due in no small part to the excellenttechnical preparation the studentsreceive in the CS Department—it is theprocess that, in my view, makes the Sem-inar a valuable, liberal arts (i.e. non-technical) undergraduate experience.
The Educational Software Seminar hasbeen in existence for more than a decade,and it owes that existence to Andy vanDam. Orchestrating and teaching theSeminar with David Niguidula in theearly and middle 1990s, when studentsbuilt software in Hypercard for teachersin schools with Macintosh computers(small in size and number), Andy devel-oped a curriculum for the course and hisstudents produced a set of programs thatremain interesting and useful in thestudy of educational software. Indeed,many of those programs are still popularwith teachers and students—a greattribute both to Andy’s and David’s idea ofthe course and to how much their stu-dents were able to do even with veryprimitive authoring tools.
Last year I began teaching the Seminar,and decided first to expand the pool ofpossible projects to include proposals notonly from teachers in K-12, but fromBrown University faculty and educatorsin other community institutions as well.The range of possible platforms was sim-ilarly expanded to include not only thePC but the Web as well. With the kindand indispensable cooperation of theMultimedia Lab at Brown, CS92 stu-dents were able to choose from a varietyof multimedia authoring tools, in addi-tion to the programming languagesavailable and taught in CS, and thuscould design for a greater number ofplatforms, instructional goals, and tech-nical constraints than in previous years.Finally, the readings for the course wererevised to incorporate recent studies likeCuban’s and the 1997 analysis of theApple Classrooms of Tomorrow Project(Judith Sandholtz et al., Teaching withTechnology [Teachers College Press,1997]), and to better reflect the interdis-ciplinary nature of the Seminar.
For all the changes, however, Andy’s andDavid’s idea of the Seminar remains, andthis is what makes CS92 such a success-ful course and worthwhile experience forstudents as well as our clients. Last year
5

Visitors to the CityStreets exhibit atthe Providence
Children’s Museum
our students worked with elementary,secondary, university and communityteachers, creating programs for settingsas diverse as the Blessed SacramentSchool (with Macintosh computersequipped with only
“...computer science students...areable to arrive at important, novel
insights about the connectionsamong questions concerning tech-nology, pedagogy and cognition”
4MB of RAM) andthe Brown School ofMedicine; coveringsubjects as differentas 4th grade socialstudies and under-graduate visual art;using tools as vari-ous as Hyperstudio and
Java; and serv-ing audiences as diverse as 7th gradescience students at the Wheeler Schooland visitors to the City Streets exhibit atthe Providence Children’s Museum. Allof the programs were completed and con-tinue to be used, not only by their spon-soring teachers but by teachers andstudents who have downloaded themfrom the course Web site as well.
This year, we are again working with theVartan Gregorian Elementary Schooland both undergraduate and post-gradu-ate teachers at Brown, and we areexcited to be working with the elemen-tary school classroom at Hasbro Chil-dren’s Hospital for the first time. Thestudents in the Seminar are workingwith teachers and their students, docu-menting their activities on project pages,thinking carefully about pedagogy, learn-ing and the design of electronic media,and are again doing remarkable work.This year I’ve been especially struck bythe extent to which computer science
conduit!
students, some of them reading philoso-phy, cognitive science, and/or social sci-ence for the first time at Brown in CS92,are able to arrive at important, novelinsights about the connections among
questions concerning technology, peda-gogy and cognition.
In his important book, The Language ofEducation (Charles Thomas, 1960), thephilosopher Israel Scheffler wrote that“educational research must not be con-ceived as a single science, but rather asthe common focus of many sciences withbearings on educational practice” (p. 73).While I won’t raise local blood-pressuresby making a similar claim about com-puter science research, the experiencesof the students in CS92 clearly demon-strate how success in the creation of edu-cational software necessarily involvesideas from the computer, cognitive andhuman sciences, as well as creativeinsights not clearly derivable from thefirst principles of any (known) science.This sort of non-algorithmic complexitymakes the creation of genuinely effectiveeducational software extremely difficult,and indeed the computer industry haslargely retreated from education toentertainment and from the classroom tothe home; but, of course, it is preciselythis sort of complexity that makes educa-tional software, and educational technol-ogy in general, such a challenging butpotentially rewarding area of research.
The Educational Software Seminar pro-vides not only a unique, productivemodel of university-school and univer-sity-community collaboration, but animportant method of inquiry into therelation between technology and educa-tion as well. CS92 projects and pro-grams, past and present, along withteam project pages and our syllabus andbibliography, can all be found at thecourse Web site: http://www.cs.brown.edu/courses/cs092/.
6
THE 22nd IPP SYMPOSIUM
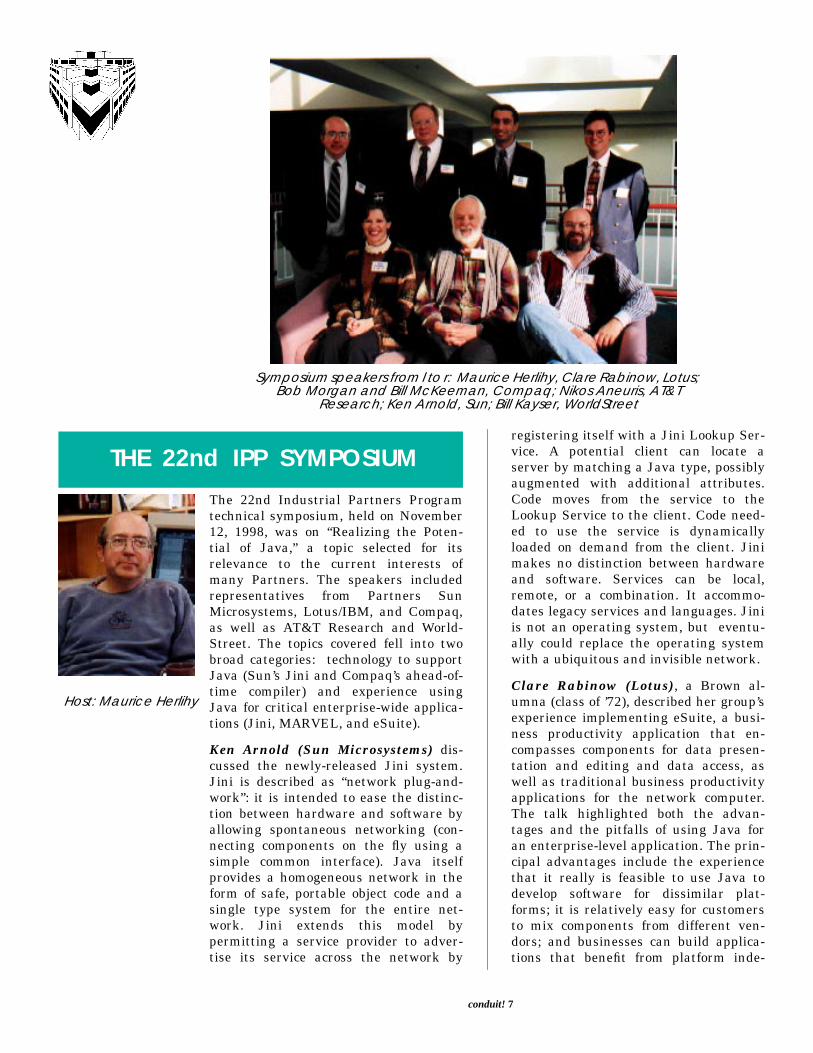
Symposium speakers from l to r: Maurice Herlihy, Clare Rabinow, Lotus;Bob Morgan and Bill McKeeman, Compaq; Nikos Aneuris, AT&T
Research; Ken Arnold, Sun; Bill Kayser, WorldStreet
Host: Maurice Herlihy
The 22nd Industrial Partners Programtechnical symposium, held on November12, 1998, was on “Realizing the Poten-tial of Java,” a topic selected for itsrelevance to the current interests ofmany Partners. The speakers includedrepresentatives from Partners SunMicrosystems, Lotus/IBM, and Compaq,as well as AT&T Research and World-Street. The topics covered fell into twobroad categories: technology to supportJava (Sun’s Jini and Compaq’s ahead-of-time compiler) and experience usingJava for critical enterprise-wide applica-tions (Jini, MARVEL, and eSuite).
Ken Arnold (Sun Microsystems) dis-cussed the newly-released Jini system.Jini is described as “network plug-and-work”: it is intended to ease the distinc-tion between hardware and software byallowing spontaneous networking (con-necting components on the fly using asimple common interface). Java itselfprovides a homogeneous network in theform of safe, portable object code and asingle type system for the entire net-work. Jini extends this model bypermitting a service provider to adver-tise its service across the network by
conduit
registering itself with a Jini Lookup Ser-vice. A potential client can locate aserver by matching a Java type, possiblyaugmented with additional attributes.Code moves from the service to theLookup Service to the client. Code need-ed to use the service is dynamicallyloaded on demand from the client. Jinimakes no distinction between hardwareand software. Services can be local,remote, or a combination. It accommo-dates legacy services and languages. Jiniis not an operating system, but eventu-ally could replace the operating systemwith a ubiquitous and invisible network.
Clare Rabinow (Lotus), a Brown al-umna (class of ’72), described her group’sexperience implementing eSuite, a busi-ness productivity application that en-compasses components for data presen-tation and editing and data access, aswell as traditional business productivityapplications for the network computer.The talk highlighted both the advan-tages and the pitfalls of using Java foran enterprise-level application. The prin-cipal advantages include the experiencethat it really is feasible to use Java todevelop software for dissimilar plat-forms; it is relatively easy for customersto mix components from different ven-dors; and businesses can build applica-tions that benefit from platform inde-
! 7
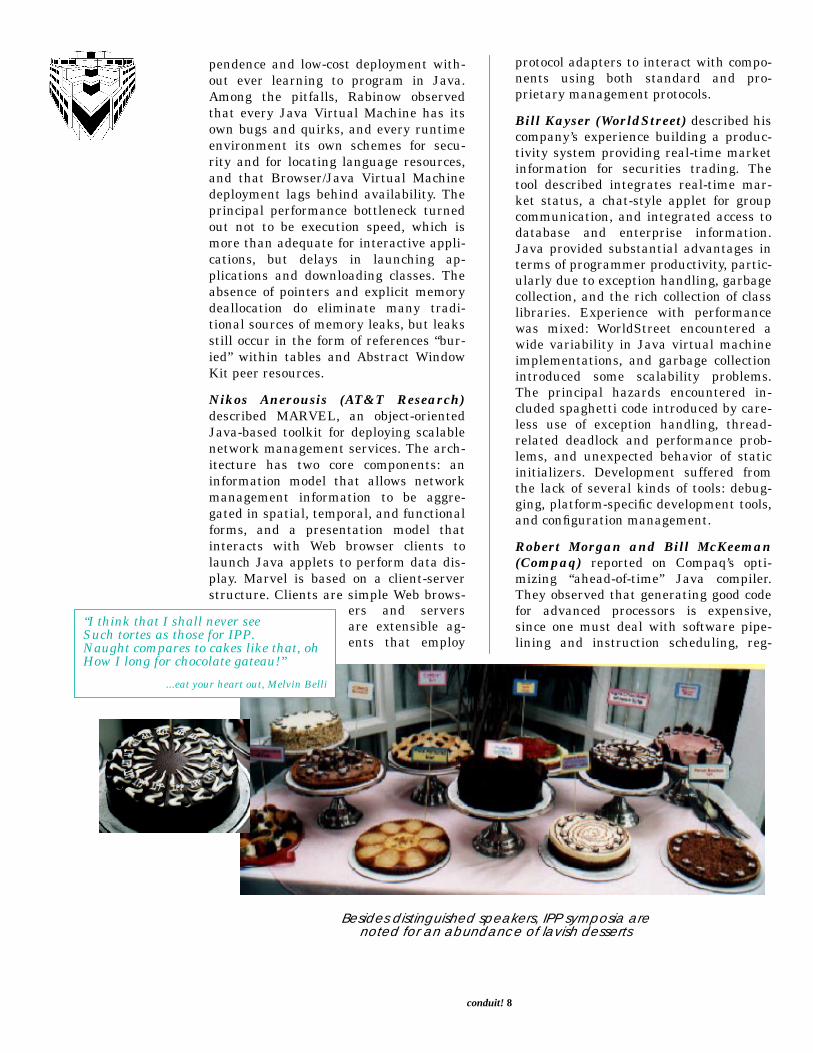
“I think that I shalSuch tortes as thosNaught compares tHow I long for choc
...eat y
pendence and low-cost deployment with-out ever learning to program in Java.Among the pitfalls, Rabinow observedthat every Java Virtual Machine has itsown bugs and quirks, and every runtimeenvironment its own schemes for secu-rity and for locating language resources,and that Browser/Java Virtual Machinedeployment lags behind availability. Theprincipal performance bottleneck turnedout not to be execution speed, which ismore than adequate for interactive appli-cations, but delays in launching ap-plications and downloading classes. Theabsence of pointers and explicit memorydeallocation do eliminate many tradi-tional sources of memory leaks, but leaksstill occur in the form of references “bur-ied” within tables and Abstract WindowKit peer resources.
Nikos Anerousis (AT&T Research)described MARVEL, an object-orientedJava-based toolkit for deploying scalablenetwork management services. The arch-itecture has two core components: aninformation model that allows networkmanagement information to be aggre-gated in spatial, temporal, and functionalforms, and a presentation model thatinteracts with Web browser clients tolaunch Java applets to perform data dis-play. Marvel is based on a client-serverstructure. Clients are simple Web brows-
ers and servers
l never seee for IPP.o cakes like that, oholate gateau!”our heart out, Melvin Belli
are extensible ag-ents that employ
conduit!
Besides distinguished speanoted for an abundan
protocol adapters to interact with compo-nents using both standard and pro-prietary management protocols.
Bill Kayser (WorldStreet) described hiscompany’s experience building a produc-tivity system providing real-time marketinformation for securities trading. Thetool described integrates real-time mar-ket status, a chat-style applet for groupcommunication, and integrated access todatabase and enterprise information.Java provided substantial advantages interms of programmer productivity, partic-ularly due to exception handling, garbagecollection, and the rich collection of classlibraries. Experience with performancewas mixed: WorldStreet encountered awide variability in Java virtual machineimplementations, and garbage collectionintroduced some scalability problems.The principal hazards encountered in-cluded spaghetti code introduced by care-less use of exception handling, thread-related deadlock and performance prob-lems, and unexpected behavior of staticinitializers. Development suffered fromthe lack of several kinds of tools: debug-ging, platform-specific development tools,and configuration management.
Robert Morgan and Bill McKeeman(Compaq) reported on Compaq’s opti-mizing “ahead-of-time” Java compiler.They observed that generating good codefor advanced processors is expensive,since one must deal with software pipe-lining and instruction scheduling, reg-
8
kers, IPP symposia arece of lavish desserts

INTERACTIVand SIM
Stina Bridgeman
ister allocation, loop transformations,and a host of similar optimizations criti-cal for exploiting the power of modernprocessor architectures. These kinds ofoptimizations cannot be done effectivelyby a just-in-time (JIT) compiler becausethey take too much time. An ‘‘ahead-of-time’’ compiler requires advanced analy-sis to generate good code. Challengesinclude computing concrete types, opti-mizing dynamic method calls, placingdata objects on the stack whenever possi-ble, eliminating null reference and arraybounds checks, and analyzing aliasingamong references, as well as classicaloptimizations. They described a compiler
conduit!
E GRAPH DRAWINGILARITY METRICS
structure that starts with Java bytecodes and successively either computesinformation for later phases or moves theprogram closer to machine instructions.The final result is a “native” machine-code representation of the program,encompassing a level of optimizationbeyond what a just-in-time compilercould provide.
This IPP symposium gave an rare snap-shot of how well Java is realizing (andsometimes not completely realizing) itspotential to transform the computingworld in essential ways.
Being able to draw nice pictures ofgraph-structured information is a usefulthing—data structure visualization, vis-ual programming, database design, Webnavigation, and a variety of other appli-cations can benefit from clear andunderstandable drawings of graphs. Agraph-drawing algorithm typically at-tempts to optimize certain aesthetic cri-teria while working within a givendrawing paradigm. So, for example, analgorithm may attempt to minimize thenumber of bends in an orthogonal draw-ing, where vertices are placed at gridpoints and edges are chains of horizontaland vertical segments. There are, of
course, tradeoffs inherent in this—requiring a straight-line drawing mayincrease the area requirements, minimiz-ing the area may increase the number ofedge bends, and so forth.
Interactive Graph DrawingA great deal of work has been put intodeveloping graph drawing algorithmsand one can find an algorithm that doesa good job of layout for a variety of appli-cations. Many of these algorithms, how-ever, were developed using a batch modelin which the graph is redrawn fromscratch each time. Such algorithms arenot well suited for interactive applica-tions, where the typical scenario is thatthe user requests an initial drawing ofthe graph, then makes some smallchanges and requests a new drawing,and then makes another small change ortwo and requests a third drawing, andthen makes yet another change... Thesechanges may be made because the user isexplicitly editing the graph or becausethe graph represents some structure thatis being updated, such as a map showingthe user’s navigation through a collec-tion of Web pages or topics returned by asearch engine.
In this interactive model, it is assumedthat the user has gained some knowl-edge—built up a “mental map”—of theprevious drawing, and so it is desirableto preserve the mental map by havingsmall changes in the graph structuretranslate into small changes in the draw-ing, even at the expense of the other
9

An orthogonal drawing, withsome user changes
New drawing produced byInteractiveGiotto
aesthetic criteria. Redrawing the graphfrom scratch at each step often causeslarge changes in the drawing, destroyingthe user’s mental map and forcing her tospend considerable time refamiliarizingherself with the layout—imagine how dis-orienting it would be if the map of theWeb pages you’ve explored were com-pletely redrawn each time you visited anew page.
Of course, eventually the “at the expenseof the other aesthetic criteria” bit adds upand it may be desirable to redraw thegraph from scratch periodically, but agood deal of effort on the user’s part canstill be saved when this is done only peri-odically and not after every change.
SimilarityThe goal of preserving the user’s mentalmap brings up the idea of similarity—ifthe new drawing looks similar to the old,the user’s familiarity with the old draw-ing will transfer to the new drawing withminimal effort. The question is, how doesone measure similarity between draw-
New drawing produced by Giotto
conduit! 1
ings of graphs? Interactive drawingalgorithms frequently seek to preservethe mental map by attempting to mini-mize the change between drawings,typically by allowing only very limitedmodifications (if any) to the position ofvertices and edge bends in the existingdrawing. Some layout adjustment algo-rithms (where the idea is to rearrange adrawing in order to improve some aes-thetic criteria) use a notion of proximityto preserve the mental map, by requir-ing that a point’s position in the newdrawing be closer to its own old positionthan any other point. Orthogonal order-ing has also been proposed as a factor insimilarity—if the relative north/south/east/west relationship between pairs ofvertices is preserved, the new drawingwill tend to look more like the originalthan if these relationships are changed.
The goal of my current research is todefine and evaluate similarity metrics forgraph drawings, and in so doing, gainsome insight into what features of thedrawing are most important for visualsimilarity. Such insight will be useful indesigning new interactive algorithmsthat better optimize the desired aes-thetic criteria while preserving themental map. Developing similarity met-rics will also provide a basis of com-parison between different drawing algo-rithms—currently the comparison is stilldone in terms of “traditional” optimiza-tion criteria like the area and thenumber of edge bends, and discussion ofmental map preservation is limited tostating that the algorithm does a goodjob because it doesn’t change the draw-ing much.
0

“A metricrect rotat
Interactiveis importrotation
destroy th
My focus has been on measuring similar-ity between two drawings of the samegraph; determining how similar two dif-ferent graphs are is another problementirely, and one that is less immedi-ately applicable to interactive graphdrawing. The initial step has been todefine metrics based on mental mapmodels that have been proposed in theliterature—vertex position, proximity,orthogonal ordering and edge shape.(For orthogonal drawings, edge shape isthe sequence of left and right turns madealong each edge.)
A successful similarity metric shouldpass three tests. It should qualitativelyreflect human judgment so that orderinga set of new drawings with respect to theoriginal based on the metric’s valueyields the same ordering a human wouldproduce when asked to arrange the samedrawings. It should also quantitatively
that chooses the cor-ion can be used to fixGiotto’s output, whichant because a largeis a very easy way toe user’s mental map”
reflect human judgment so that thevalue of metric is proportional to the per-ceived difference in similarity. Andfinally, it should choose the correct rota-tion; namely, given the original drawingand a set of new drawings identical toeach other except for a rotation factor,the metric’s value should be the lowestfor the rotation that a human would saybest matches the original drawing. Thislast condition is the easiest to satisfy,and was motivated by the “rotation prob-lem” of InteractiveGiotto.InteractiveGiotto, largely developed byJody Fanto ’97, is essentially a front-endto the successful (batch-model) orthogo-nal drawing algorithm, Giotto. It seeksto preserve the look of the drawing byapplying constraints fixing the anglebetween adjacent edges around verticesand the number and direction (left orright) of bends along edges. The rotation
conduit! 1
problem comes up because InteractiveG-iotto throws away coordinate informationwhen computing the new drawing, andthus may produce a drawing that isrotated by a multiple of 90 degrees withrespect to the original. A metric thatchooses the correct rotation can be usedto fix InteractiveGiotto’s output, which isimportant because a large rotation is avery easy way to destroy the user’s men-tal map.
To evaluate the metrics it is necessary toobtain multiple drawings of the samegraph. For orthogonal drawings, Interac-tiveGiotto is well suited for this purposebecause its constraints can be relaxed ona vertex-by-vertex or edge-by-edge basis,making it possible to obtain multipledrawings of the same graph with vary-ing degrees of similarity to the originaldrawing. (This is in contrast to mostinteractive drawing algorithms, whichproduce a single output drawing for agiven input.) Having multiple drawingsof the same graph is important because itis very difficult to judge whether one pairof drawings is more or less similar thananother when the two pairs are draw-ings of different graphs.
So far I have focused primarily on evalu-ating the metrics based on theirqualitative behavior and their ability tochoose the correct rotation, because hav-ing a human assign meaningful numericsimilarity values to drawings is very dif-ficult. (One future project is to devise away to get such values in as objective amanner as possible.) There have beensome winners and some losers—theorthogonal ordering metrics tended to dobest in both respects, with the proximitymetrics faring the worst—but nothing sofar has been an obvious “perfect metric.”Most of the metrics are suitable forchoosing the correct rotation, at leastwhen the possible angles of rotation arewidely separated (e.g., multiples of 90degrees), and most of the metrics do anOK, but not stellar, job of ordering thedrawings.
This may be because these metrics allconsider the big picture, taking the viewthat all parts of the drawing are createdequal and so a change has the sameeffect wherever it is applied. This is notnecessarily the case, though—while
1
LETTERS
attempting to order the drawings forevaluating the metrics, I quickly realizedthat landmarks are important. One tendsto focus quickly on sections of the draw-ing that are distinctive, and if these arepresent (and relatively unchanged) in thenew drawing, it greatly increases the per-ceived similarity of the drawings. Also,landmarks vary in importance—a verydistinctive structure in the graph is morenoticeable, as is one that is relatively
conduit
& ALUMNI EMAIL
separate from other parts of the draw-ing. My current direction is to furtherinvestigate how to identify landmarks,how to measure their importance andhow to measure how they change, in thehopes of improving the similarity met-rics.
And if anyone has a desire to spend timestaring at lots of drawings of graphs,come see me. :)
E. GORDON GEE, PresidentDear Suzi—A note to tell you that I justread the latest issue of conduit!. It is afirst-rate publication and certainly rep-resents the Department, as well as theUniversity, very well. Would you pleasepass my delight in that product to otherswho contributed to this? Best personalwishes.
JASON LANGO AND NATE STAHL,ScBs ’98Hello friends and former colleagues! Itwould take a while to tell you all individ-ually, so I thought that I would be lazyand spam you all. Nate and I have de-cided to leave Silicon Graphics and pur-sue career opportunities at a muchsmaller company named Network Appli-ance (www.netapp.com) working onsystems software for the NetCache box.We’re unable to check our email at SGI,but the mail addresses [email protected] [email protected] will continue toreach us at our apartment.
ED LAZOWSKA, AB ’72The following was sent to Andy van Damby David Salesin, ScB ’83, under the sub-ject line “Remarkable people:”“Every Jan 1, the Seattle Times recog-nizes ‘remarkable people...who addedmeasurably to the quality of life in thePuget Sound region.’ Among the half-dozen individuals who are recognized thisyear is our own Ed Lazowska. Read itonline at http://www.seattletimes.com/news/editorial/html98/bested_010199.-html, where they say “Ed Lazowska isn’t
exactly a household name, but at the Uni-versity of Washington, where he is chairof Computer Science and Engineering,and among state education leaders, he issomething of a hero. Lazowska has assist-ed Seattle Public Schools in a variety ofways, from Internet connections to tech-nology training for teachers. He is aleader in the K-20 network that willsomeday link all the state’s schools andcolleges. Lazowska was a 1998 recipientof a UW Public Service Award. He is rec-ognized for his efforts to bolster thestate’s economic future through technol-ogy-smart policies.”
EVAN MAIR, BA ’93As the popular saying goes, you can takethe Brown CS grad out of the Sunlab, butyou can’t core-dump the desire to code.During my years in medical school, Ideveloped commercial medical softwarefor the 3Com Palm series as well as help-ing the Boston University Medical Cam-pus develop its Internet presence. I amnow entering my residency in DiagnosticRadiology at Boston Medical Center,where I hope to continue my research onimage compression and archiving sys-tems for radiology services. I can bereached at [email protected].
LAURENT MICHEL, PhD ’99Hi! I am now working for Ilog S.A., aFrench company that specializes in theproduction of software libraries for combi-natorial optimization problems. About ayear ago they acquired CPLEX (theleader in linear programming). Basically,Ilog has a suite of products ranging frolibraries for LP/IP/MIP to constraint pro-gramming libraries (general-purpose CP)and even scheduling. They also have a
! 12

fac.acti
whole different sector of activity in com-puter graphics (high-performance 2D/3Drendering) and telecom.I am working in the Optimization R&Dteam in the modeling language group. Iam working from Belgium while Ilogheadquarters are in Paris. You can findout more about them at http://www-.ilog.com. My work email address [email protected], and I’m more likely toanswer quickly on this one!
VISWANATH RAMACHANDRAN,PhD ’98After my Ph.D., I joined Netscape (now aunit of AOL), working on the NetscapeWeb server as an engineer. I’ve beenfocusing mostly on programming lan-guage work, developing language run-times for Java and JavaScript. I amreally excited about being in the forefrontof the NetEconomy and electronic com-merce. On the personal front, I gotmarried to Shanthi in April 1998. Stay intouch folks, my email is [email protected].
SRIDHAR RAMASWAMY, PhD ’98Hi everyone! My wife Seema (Tufts DMD’96) and I have moved from New Jersey
conduit
to the Bay Area. I am leaving the com-fortable and laid-back environment ofBell Labs for the thriving madness of Sili-con Valley. I am joining a small companycalled Epiphany. We make ERM (enter-prise relationship management) software.I would love to hear from friends. I can bereached at [email protected].
MICHAEL RUBIN, ScB ’99Hello conduit! It’s funny how only afterI leave Brown do we get a chance to talk.Currently I am in California working atNetwork Appliance and having a greattime.
After all the time and all the work, Ithink I am enjoying the fruits of mylabors—a job where I sit in one room allday pushing buttons. Seriously, I am hav-ing a great time out here. It’s amazinghow much easier it is to work withoutsleep deprivation. It’s hard to write oneof these without sounding like all thehundreds of other recent grads who havenothing monumental to say. Work is bet-ter than I hoped. Love is better than Ihoped. Life is good. Thanks to all thosewho helped make this happen, [email protected].
Eugene Charniak. This last yearEugene Charniak gave two invited talksat conferences on machine learning. Hewas pleased about these invitationsbecause, while his research has alwaysbeen in natural-language processing, itwas only a few years ago that he began toapply machine-learning techniques to theproblem. Thus he was happy to get thisindication of “acceptance” in his newresearch community. Of these invitations,the more prestigious was from the NIPS(Neural Information Processing Systems)conference. However, the invitation thatinitially had him more excited was theSnowbird conference on machine learn-ing, a conference famous because it isheld in ski season at a ski resort, andafternoons are left open for skiing.Eugene always felt that clearly thesefolks knew how to throw a conference!
Unfortunately, about two months beforethe conference Eugene had a skiing acci-dent, and his physical therapist assuredhim that he would be crazy to try skiinggiven the state of his left knee. So, whilehis talk was very well received, the con-ference was less than a total success forhim.
At the beginning of this last FebruaryEugene (as well as Tom Dean) went to aconference center in Conway, CT, a notedski center, for a retreat for students andprofessors connected with some newinterdepartmental grants (Computer Sci-ence, Neuroscience, Cognitive Science,and Applied Math). Again, afternoonswere free for skiing. With a year of kneeexercises under his britches, Eugene ven-tured onto the slopes and is pleased toreport that his knee held up just fine.
▼▼▼
! 13

Tom Dean. Tom, program committeechair for IJCAI-99, attended a meeting ofthe IJCAI Inc. board of trustees in Parisduring the World Cup Games.
John Hughes. Well...the graphicsgroup sent six papers to SIGGRAPH—actually, something like a total of 12items went out, from course and panelproposals to papers to who-knows-what.One cool thing was the paper-that-be-came-a-paper in the last three daysbefore the deadline, with two undergrad-uates as lead authors. As for me person-ally, I’ve been working on the Andyfest(the May 27-28 gathering of Andy’sfriends, colleagues and ex-students world-wide to celebrate his 60th birthday), mycourses, the five-year review of the gradprogram and being graduate advisor—allthe stuff professors do.
Franco Preparata. Franco was ap-pointed to the international committeethat assigns the Gödel Prize in theoreti-cal computer science. He was alsoappointed to the Scientific Board of ISTI(Istituto per le Scienze e la Tecnologiadell’Informazione) in Pisa, Italy, a unit ofthe Italian National Research Council. Inthe late fall of 1998, he successfully ledthe technical review of the project “Ro-bust and Applicable Geometric Comput-ing,” which, funded by ARO, is the mainsupport of our three-university Center forGeometric Computing. This review cap-ped the initial three-year phase and hassecured funding for the subsequent two-year option. At RECOMB99, the premierinternational conference in computa-tional biology (held this year in Lyon,France), he presented the results of hiswork with Eli Upfal, which are the sub-ject of a recent patent application.
▼▼▼
▼▼▼
▼▼▼
conduit
John Savage. In April John served ona committee that wrote a report to theNSF entitled “Challenges for Theory ofComputing.” This report offers NSFadvice on funding research in theoreticalcomputer science. Its URL is http://www.cse.buffalo.edu/~selman/report.
Roberto Tamassia. Roberto cochairedthe program committee of the Workshopon Algorithms and Data Structures (Van-couver) and served on the program com-mittee of the Workshop on AlgorithmEngineering and Experimentation (Balti-more). He also gave a keynote lecture atthe Symposium on Algorithms and Com-putation (Taejon, South Korea).
Eli Upfal. Eli’s financial computingresearch group visited Goldman Sachs inNew York in December. He participatedin an NSF review panel in January andwas appointed associate editor for theSIAM Journal on Discrete Mathematics.
Andy van Dam. Andy has beenawarded the 1999 IEEE James H. Mulli-gan, Jr. Educational Medal “for his field-defining textbooks, the introduction ofinnovative educational technology, andinspired undergraduate teaching.”
Peter Wegner. Peter is retiring inJune. This spring and summer he will belecturing in Amsterdam, Lisbon andTokyo. He was recently awarded the Aus-trian Medal of Honor in Science and Art.
▼▼▼
▼▼▼
▼▼▼
▼▼▼
▼▼▼
! 14

FROM CAMBRIDGE TO CAMBRIDGE
Peter Wegner
“Abstraction is theenemy of realism”
The Dome, MIT and The Bridge of Sighs, St. John’s College
During the week of April 12-16, 1999, Iattended the 35th anniversary of MIT’sLaboratory for Computer Science and the50th anniversary of the Cambridge (En-gland) Computing Lab. The MIT eventfeatured Bill Gates’ $20-million gift andkeynote talk about the future of comput-ing, and the unveiling of MIT’s Oxygenproject for next-generation intelligentpersonal assistants. The British event, agathering of about 500 mainly Britishcomputer scientists, featured a keynotetalk by Maurice Wilkes, who developedthe first stored-program computer in thelate 1940s and retains his resilience atage 85. Since I cannot do justice, in thisshort article, either to the goals of Oxy-gen or to the British views of the pastand future of computer science, I shallrelate some anecdotes.
In talking to Bill Gates, I asked aboutMicrosoft’s goals for computer graphics.Bill seemed surprised at the question, asthough he had not thought about it be-fore. He spoke of Microsoft’s wonderfulresearchers in the graphics area, andsaid that one of the goals of graphics wasrealism. A few days later, at the confer-ence dinner in St. John’s College in theother Cambridge, I sat next to Alvy Ray
conduit
Smith, who designed the graphics effectsin Star Wars at LucasFilm and Toy Storyat Pixar and is now a researcher at Mi-crosoft. When I told him I had asked BillGates about the goals of graphics, hecupped his ear and waited expectantly.On hearing that Gates had mentioned re-alism as a major goal, Alvy said there ismuch debate in the graphics communityabout the role of realism in graphics re-search. In fact, the Brown graphicsgroup’s project on non-photorealistic ren-dering specifically explores nonrealisticabstractions that focus on details of a vi-sual image considered relevant while ig-noring details considered irrelevant.
Data visualization strays from realismeven further, since its visualizationshave no realistic image to which theycorrespond. Abstraction is the enemy ofrealism.
At dinner with Maurice Wilkes and hiswife Nina, we revisited the early historyof computing. Maurice discussed his tripto the US in the late 1940s to attend acourse that enabled him to build the firststored-program computer in 1949, oneyear ahead of his US competitors. Wetalked about my days as a student in the
! 15

FROM
Tom De
first ever computing course during 1953-54. I was later given a copy of the 1954final exam, which I would certainly failtoday because it included hardwarequestions as well as advanced numeri-cal analysis.
On the final day of the conference I wasinvited to lunch at the Microsoft Re-search Lab by Roger Needham, whoheaded the Cambridge Computing Labbefore Robin Milner took over threeyears ago. It occupies a very pleasantspace in the center of Cambridge andhas some impressive researchers, includ-ing Luca Cardelli and Tony Hoare, aswell as a superb panorama overlookingone of the main thoroughfares.
These two anniversary celebrations al-lowed me to meet many old friends whohad traveled on parallel tracks andwere, like me, nearing the end of their
conduit!
THE CHAIRMAN
an
academic career. These events markednot only a celebration of the past, butalso a passing of the baton from the oldguard to a new generation who must dealwith new technologies of networking, col-laboration, and electronic commerce.Oxygen is an ambitious effort to developan integrated approach to technologies ofthe 21st century, but foundations for in-tegration have yet to be developed.
The Microsoft connection at both Cam-bridge reunions reflects Microsoft’s emer-gence as a ubiquitous presence in com-puting on both sides of the Atlantic. Mi-crosoft’s attention to the past could wellprove useful in its bid to define the fu-ture. If Microsoft succeeds, historianswill identify the shift from old to newtechnology with a shift from an IBM-dominated to a Microsoft-dominated com-puter industry.
This short note re-ports some sad news,some news that iscause for celebrationbut makes us recallsome sad events of therecent past, and somenews about changesin the life of a friendand colleague that arecause for both reflec-tion and celebration.
First, some very sad news. Markus Meis-ter, in his second year of Ph.D. study inthe department, died in a Christmas Eveautomobile accident in British Columbia.Markus was well loved in our commu-nity. In addition to his research in graph-ics, Markus was prankster and pros-elytizer for classical music, mathematicsfor its own sake, and all things concern-ing Japanese culture. His whimsical sidewas obvious in his interest in anime vid-eos, particularly those including the char-acter Totoro, and in his fascination withall sorts of hardware, including sportscars well past their prime but nonethe-less beautiful. More than anything else,
we’ll remember Markus for his generousand enthusiastic spirit and his infectioussense of fun.
The next piece of news concerns the 1998ACM Kanellakis Theory and PracticeAward. This was given to Randal E. Bry-ant, Edmund M. Clarke, Jr., E. AllenEmerson, and Kenneth L. McMillan fortheir invention of “symbolic model check-ing,” a method of formally checking sys-tem designs that is widely used in thecomputer hardware industry and is be-ginning to show significant promise alsoin software verification and other areas.This award was established in memory ofour friend and colleague Paris Kanel-lakis, whose tragic death in late 1995 cutshort a distinguished research career.Paris and his family are frequently in ourthoughts and we often hear from theirmany friends, students, and colleaguesfrom around Brown and throughout theworld.
Finally, on April 22 we had a party forPeter Wegner, who will be retiring at theend of this semester. We don’t expect tosee any less of Peter in his new role asemeritus professor, and indeed his retire-ment party was cause for a celebration ofhis scholarly achievements and his manycontributions to the department. At the
16

BROWN ENTERS THE CA
Rosemary Simpson
Enjoying his retirement party at the Faculty Club. Clockwisefrom bottom left: Peter with President Gee, with long-time
friends from the Sociology Department Marilyn and DietrichRueschmeyer, and with CS chairmen past and present
party President Gee thanked Peter for his long service to Brownand announced the news that Peter would receive the Medal ofHonor for Arts and Sciences from the President of the AustrianFederation at a ceremony this summer. President Gee re-marked on some of the extraordinary events in Peter’s life, fromhis escape from Austria as a child on the “Kindertransport” to theaward of the Austrian Medal of Honor almost exactly 60 years tothe day later. There is certainly no reason for sadness that Peterhas passed this milestone in his career; quite to the contrary, welook forward to following his scholarly achievements and comicshenanigans for decades to come. The sentiment on the brassplaque affixed to the classic spindle-back Brown chair that hewas given at the party read, “To an unrepentant punster, inde-fatigable scholar, and generous friend.”
VE ERA
In the fall of 1997, six Brown depart-ments—Applied Math, Chemistry, Cogni-tive Science, Computer Science, Geology,and Physics—were awarded a joint Na-tional Science Foundation MRI (MajorResearch Infrastructure) grant to devel-op a university-wide computing facilityfor collaborative research and educa-tion. The result is a new supercomputingand immersive virtual reality lab—theTechnology Center for Advanced Sci-entific Computation and Visualization—conduit
located at 180 George St. This lab will beavailable as a research, computing, andeducation facility and is expected to fos-ter scientific investigation and graduateand undergraduate instruction in a vari-ety of fields, including chemistry, geology,cognitive and linguistic sciences, phys-ics, computer science and applied mathe-matics. The lab contains a high-perform-ance parallel computer, the IBM SP, anda cave.
What is a Cave?Brown’s cave is an eight-foot cubicle inwhich high-resolution stereo graphics are
! 17

“...it ishow
puthold
Illustration of CAVE™ in use
projected onto three walls and the floor tocreate an immersive virtual reality expe-rience. High-end workstations generatethe 3D virtual world and create thesounds of the environment. Special hard-
easier to understandsomething works or is together if you canit in your hand or walkaround inside it”
ware and software keep track of the posi-tions and movements of a person enteringthat virtual environment, changing theimages in the cave in a way that allowsthe visitor to feel immersed in the virtualspace.Our cave is based on the original CAVE™developed at the Electronic VisualizationLab at the University of Illinois, Chicago,as part of long-term research on tools andapplications for immersive virtual reality.It was first demonstrated at the SIG-GRAPH ’92 conference. Since then, doz-ens of caves have been installed world-
conduit!
wide with applications ranging from sci-entific visualization, industrial research,and training, to education, theatre, andthe arts. (See http://www.cs.brown.edu/research/graphics/research/vr.html forcave-related resources and applications.)
Brown’s Technology Center forAdvanced Scientific Computa-tion and VisualizationThe Technology Center resources includean IBM RS/6000 SP parallel computerand the cave. The IBM computer will beused to simulate complex processes as di-verse as the movement of the earth’smantle, subatomic particle interactions,and the function of the human heart. Itwill also drive the projectors that displaythose images in the cave. For example, aresearcher studying a simulation of airflow around a space shuttle can walkaround a model of the shuttle floatingwithin the cave, even feeling compelled toduck while walking under it. The re-searcher could see patterns of airflowaround the shuttle by positioning andmoving colored streamers in the flowmuch like tails on a kite. “We anticipatethat the cave will become a powerful toolfor facilitating scientific insight,” said
18

CA
Samuel Fulcomer, Center director. “Thisis based on the idea that it is easier to un-derstand how something works or is puttogether if you can hold it in your hand orwalk around inside it.”
People interacting with the cave’s graph-ics wear tracking devices to monitor theirmovements, lightweight stereo eyewearto see objects in 3D, and slippers to pro-tect the delicate polymer screens liningthe cubicle. The projected virtual spaceappears seamless, without any intersec-tions between floor and walls.
VE™ showing projection system
As viewers negotiate a virtual environ-ment, objects may appear to hang inspace in front of them, tangible and with-in reach. This is an effect of the stereoglasses, which create slightly offset imag-es for the left and right eyes. The cave us-er may also wear special gloves that sendthe computer information about hand lo-cation and thus let him or her interactwith the virtual environment using ges-tures. A viewer could change the lightingand artwork in a virtual gallery, preciselyposition an artificial valve in a virtualheart, or fly over a virtual Martian land-scape.
Dedication CeremonyThe dedication ceremony will take placeat 2pm on May 26, 1999, in the C.V. Starr
conduit
Auditorium of MacMillan Hall, 167 Thay-er St. and will feature Brown PresidentE. Gordon Gee; Andries van Dam, theThomas J. Watson Jr. University Profes-sor of Technology and Education and Pro-fessor of Computer Science; GeorgeKarniadakis, Professor of Applied Math-ematics; and Paul M. Horn, IBM SeniorVice President of Research. After the cer-emony, there will be demos at the 180George Street facility, among them aMars topology demo by the Geology De-partment and 3D modeling and an archi-tectural walkthrough of a virtual en-vironment by the Computer Science De-partment.
Computer Science ApplicationPossibilitiesLike all the departments collaborating inthe cave facility, Computer Science is de-veloping research and educational appli-cations that would either be impossible ormuch less effective without it. Some ofthese areas include:
Scientific visualization: In conjunc-tion with NASA, the Graphics Group hasbeen doing computational fluid dynamicsstudies that will benefit from the cave’senvironment. New studies of bloodflowsare also being developed. Professor DavidLaidlaw is studying biomedical areaswhere he points out that graphically-based studies of deep structure and tis-sue in areas like the brain, the hand andthe spine will enormously benefit fromimmersive 3D visualization.
Concept visualization: Professor EliUpfal states that both research andteaching of theoretical areas would bene-fit from access to an immersive 3D visual-ization facility. For example, networkanalysis studies involve multiple dimen-sions and he feels that the developmentof intuition about these processes wouldbe greatly accelerated by such a facility.
Algorithm visualization: ProfessorRoberto Tamassia currently uses exten-sive visualization techniques for algo-rithm teaching and research and feelsthat 3D immersive techniques would behighly beneficial. He pointed out, howev-er, that the small size of the facility wouldseverely limit its usefulness in teaching.
! 19

N
MitchCherni
Hagit S
Lauren
T.M. M
Behavior simulation: Professor NancyPollard and her students have beenstudying interactive teaching situations.One project, called Coach, is a 2D/3Delectronic playbook for football. Coachescan develop and modify football plays andplayers can view animations of thoseplays within a 3D environment (e.g. froma first-person point of view). A secondproject explores animation of dance mo-tions for archival and teaching purposes.
User interface research: GraphicsGroup members Andy Forsberg and JoeLaViola have been investigating multi-modal user interfaces needed in comput-ing environments where users no longer
conduit!
AME ADVISOR THESIS
ackStan Zdonik “Building Quer
mizers with Cotors”
hatkay LeslieKaelbling
“Learning MoRobot Navigat
t Michel Pascal VanHentenryck
“Localizer: A MLanguage for LSearch”
urali JeffreyVitter
“Efficient Hiddface Removal iand in Practic
OUR M
work solely in a desktop keyboard-screen-mouse mode. New approaches that incor-porate new gestural, vocal, and visual vo-cabularies are needed to work in theseenvironments.Research and educational opportunitiesexist in all of these areas, as well as po-tentially in other domains such as sys-tems analysis. For further information onresearch, support, and demos, contact:Director Sam Fulcomer at [email protected]:
20
POSITION
y Opti-mbina-
Assistant professor atBrandeis
dels forion”
Postdoctoral fellow atthe National Centerfor BiotechnologyInformation. She isdeveloping methodsfor faster and moreaccurate biomedicalinformation retrievaland on applyingmachine-learning-typemethods in bioinfor-matics
odelingocal
Ilog S.A., Belgium
en-Sur-n Theorye”
CS post-doc at Stan-ford working in therobotics and graphicslabs with ProfessorsLeo Guibas and Jean-Claude Latombe,among others
OST RECENT PhDs

Eugene Charniak
CHARNIAK UNPLUGGED
Laurent Michel and poultryafter his defense and cele-brating with his wife, Valerie
Hagit and Eadohcomplete a
construction project
Mitch Cherniack
A few conduit!s ago I wrote an articleentitled “Bad Trips,” about problems thathave come up in faculty’s trips to givetalks, etc. The problems were mostlystandard, from bad travel connections tobad weather. However, I just heard anew class of problem from one of mygraduate students, Heidi Fox. She and acolleague were invited to give a talk at aconference on some work they had donejointly. They agreed that her colleaguewould give the talk, and thus Heidi wasnot planning on going at all. However,this was the end of last year, when therewas a threat of a government shutdown,
conduit
and as Heidi’s colleague is a governmentemployee, if the government did shutdown, he could not go (or at least couldnot be reimbursed for travel expenses)because technically he would be unem-ployed. Thus Heidi had to plan on goingand since the government eventually didnot close down, they both were there.Having both authors of a paper show upat this conference seems to have beenpretty unusual. Actually, just getting oneauthor to show up was not that commoneither. For the four or so papers in thesession, only three authors showed:Heidi, her colleague, and one otherauthor. On the other hand, perhaps themissing authors knew something thatHeidi did not—showing up was clearly
! 21

“..
wo
optional, since the speakers outnumberedthe rest of the audience.
To understand the following bit of depart-mental goings-on, you need to know onepiece of university/department trivia.The university distinguishes betweenvery small purchases and bigger ones.Very small are handled from petty cash.While this is convenient for small pur-chases, the amount of paperwork per dol-lar is clearly higher than for larger ones.Thus when the department ran out ofcookies last fall (they are served beforedepartmental talks, along with tea andcoffee), Jennet Kirschenbaum figuredthat we should stock up for a while andhad a purchase order made out to thetune of $125. Then she and MaryAndrade walked through a local grocerystore (the only one that takes Brown pur-chase orders) with calculator, trying tobuy exactly $125 worth of cookies. This
.the department goesthrough130 dollars’rth of cookies in six to
seven weeks”
turned out to be a shopping cart full,which, as you might expect, attracted alot of attention (“Can I come to theparty?”) The bill was $130. Jennet esti-mates that we use about $10 of cookiesper event. Figuring about two events perweek, the department goes through 130dollars’ worth of cookies in six to sevenweeks. In the meantime, Jennet storesthe cookies “on the 5th floor—locked up.”On a related topic, as mentioned else-where in this conduit!, our fall IPP sym-posium was on the Java programminglanguage. Since parking is always tightaround Brown, Suzi Howe had spacesreserved for the speakers near our build-ing. However, in order to direct them tothe spaces, and in order to make surethat they bunched up the cars so theycould all fit in, Mary Andrade and DawnNicholaus took turns patrolling outsidethe building to intercept the speakers. Asthey had no idea what the speakerslooked like and vice versa, they carried a
conduit
sign (hastily improvised by attachingcardboard to a fly swatter) that adver-tised the conference. The sign said, withan admirable economy of words, “JAVA”.But while the speakers knew how tointerpret this, the average passerby,needless to say, did not, and this at-tracted even more attention than walkingdown supermarket aisles with $130worth of cookies (“Where’s the free coffee,lady?”) The fly swatter is now retired tothe CS archive.
Avi Silberschatz of operating systemsfame was a speaker in the department’sdistinguished lecture series this year. Inhis talk he mentioned a common OS tech-nique of keeping twice as much storageas one needs for an IO-bound task. Onethen reads into half of the storage whileone is reading out of the other half.When the input half is all filled up, onejust switches halves. In his talk Silber-schatz mentioned that Stan Zdonik toldhim of someone who did this with dishes.I immediately knew what he was talkingabout because many years ago I decidedthat it would be a great idea to have twodishwashers. One puts dishes into onewhen they are dirty, then when it is fullone runs it. In the meantime one isremoving dishes from the other dish-washer. The point, of course, is that onenever has the task of removing dishes toa cabinet. After the talk Stan told methat the person in question is Tom, one ofthe Click and Clack brothers. In re-searching this article I called Stan to askwhether Tom was Click or Clack. Stansaid that this is a deep philosophicalquestion about which there is a greatdeal of controversy. He did give me a bitof fast-breaking news however; namely,that MIT, after having U.N. Secretary-General Kofi Annan as its graduationspeaker two years ago and PresidentClinton last year, is going to have Clickand Clack this year (they are both MITalums). Remember you heard it herefirst!
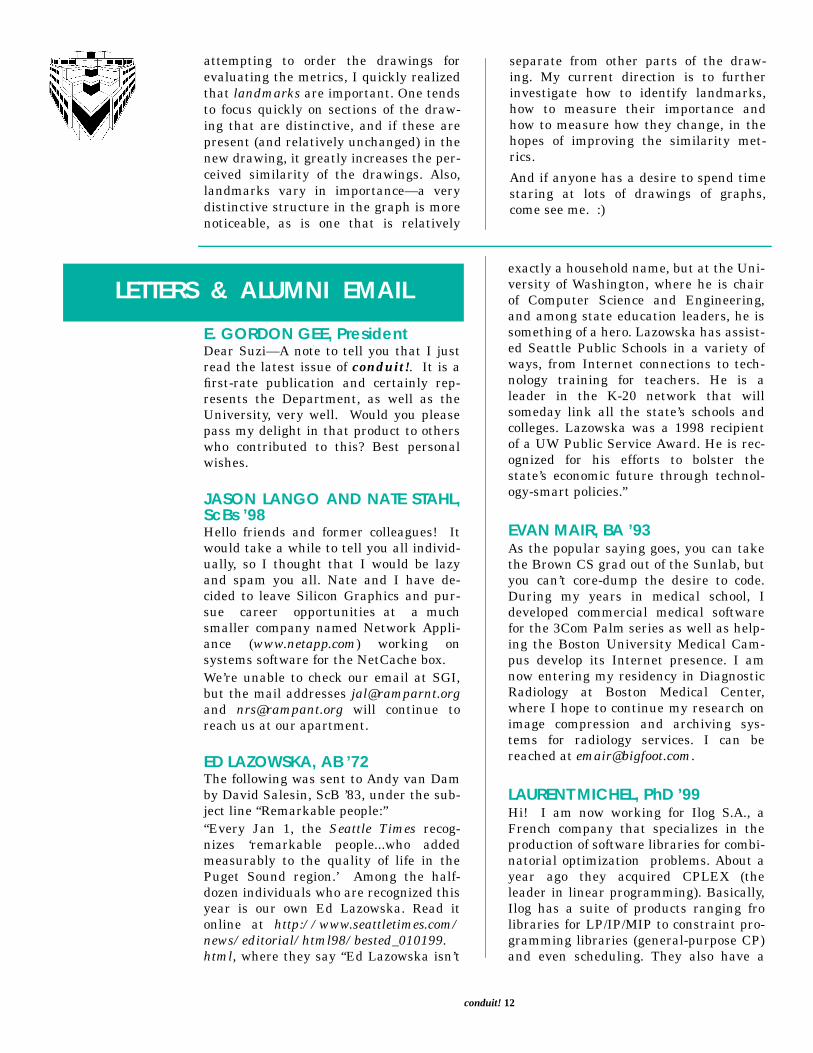
I learned about an even more ambitioushome-improvement scheme a month ortwo later when I attended the Neural In-formation Processing conference to givean invited talk. I noticed that Mike Moz-er, who graduated from Brown about
! 22
Daw
1980 or so and worked with me on an AIproject during his senior year, was alsospeaking, and we got together to bringeach other up to date on what was new inour lives. Mike is now a professor of com-puter science at the University of Colo-rado, and one of his projects is wiring uphis entire house so that his home comput-
er knows things
“ ANDYFES
like (a) whether heis in the house andif so, in whichroom, (b) whatlights he has on, (c)what he has theheat set to, etc. AsMike is particular-ly interested in ap-plications of mach-ine learning (whichis why we wereboth at this confer-ence), his basicidea was to get themachine to learnhis habits and pref-erences so that itturn off lights that
could do things likewere not in use, raise and lower the tem-
n and Julia
conduit!
T ”
perature to save on fuel, and even turnon lights when he is about to move to adifferent room (it notes motion in theroom and has learned that at the particu-lar hour in question Mike usually leavesthat room to go to a second room). Hishouse, as you might imagine, has beenwritten up many times (both academical-ly and in the popular press), and has itsown Web page:....www.cs.colorado.edu/~mozer/adaptive-house. One interestingresult of this project is that Mike’s waterheater is the property of the University ofColorado.Finally, on the day of one of last winter’slarger snowstorms, Dawn Nicholausbrought her five-year-old daughter Juliato work with her for a few hours. When Iemerged from the elevator on the fourthfloor, Julia was sitting there and greetedme with a cheerful “Hi, bro!” Not expect-ing a greeting at that point, and certainlynot expecting that particular honorific, Imanaged only a weak “Hi” back. Laterthat day Dawn and I discussed whether amiddle-aged white professor could be a“bro,” and eventually decided that if Juliathought so, then yes. For the next fewdays the administrative staff called me‘‘bro.”
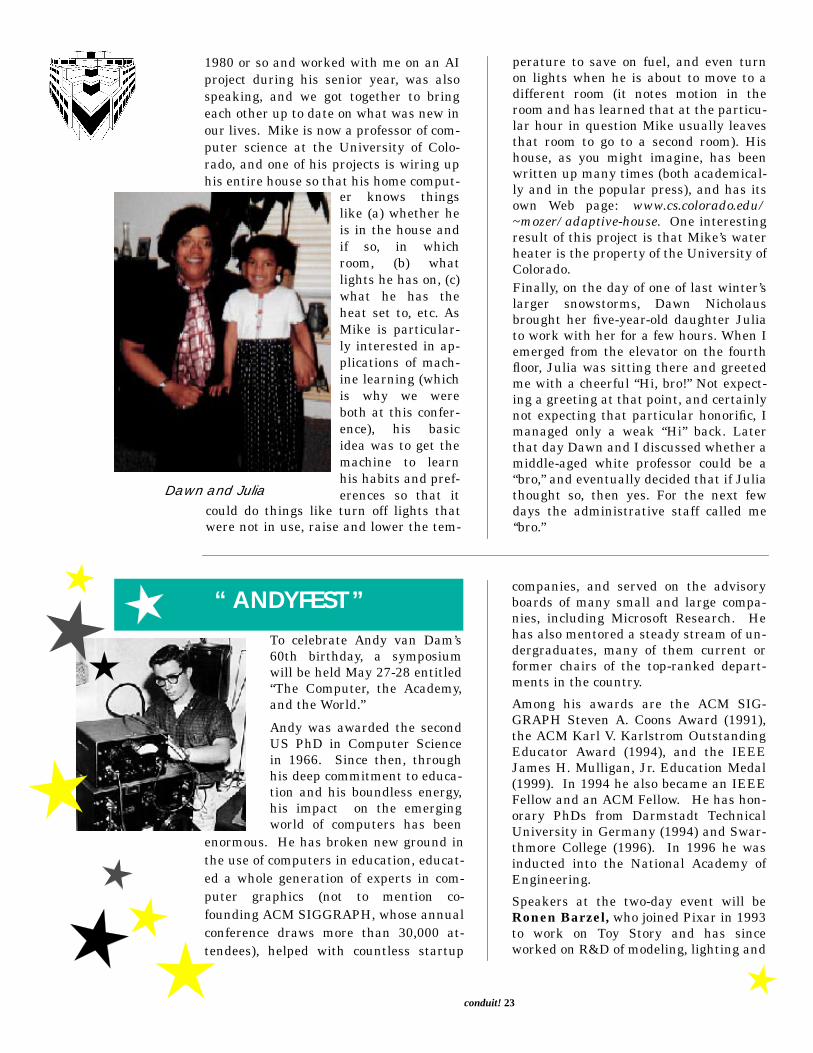
To celebrate Andy van Dam’s60th birthday, a symposiumwill be held May 27-28 entitled“The Computer, the Academy,and the World.”
Andy was awarded the secondUS PhD in Computer Sciencein 1966. Since then, throughhis deep commitment to educa-tion and his boundless energy,his impact on the emergingworld of computers has been
enormous. He has broken new ground inthe use of computers in education, educat-ed a whole generation of experts in com-puter graphics (not to mention co-founding ACM SIGGRAPH, whose annualconference draws more than 30,000 at-tendees), helped with countless startup
companies, and served on the advisoryboards of many small and large compa-nies, including Microsoft Research. Hehas also mentored a steady stream of un-dergraduates, many of them current orformer chairs of the top-ranked depart-ments in the country.
Among his awards are the ACM SIG-GRAPH Steven A. Coons Award (1991),the ACM Karl V. Karlstrom OutstandingEducator Award (1994), and the IEEEJames H. Mulligan, Jr. Education Medal(1999). In 1994 he also became an IEEEFellow and an ACM Fellow. He has hon-orary PhDs from Darmstadt TechnicalUniversity in Germany (1994) and Swar-thmore College (1996). In 1996 he wasinducted into the National Academy ofEngineering.
Speakers at the two-day event will beRonen Barzel, who joined Pixar in 1993to work on Toy Story and has sinceworked on R&D of modeling, lighting and
23

Department of ComputeBrown University
Box 1910, Providence, RI 0
conduit!
Printed on recyled papePrinted on recyled pape
animation tools; Ingrid Carlbom (’80),Head of the Visual Communications Re-search Department in the MultimediaCommunications Research Laboratory atBell Labs; Steven J. DeRose (’89), co-founder of Electronic Book Technologiesand now Chief Scientist at Inso ElectronicPublishing Systems; Henry Fuchs, Fe-
derico Gil Professor of Computer
r Scienc
2912, U
r
The Co
Dep
WW
r
The Co
Dep
WW
Science and Adjunct Professor ofRadiation Oncology at the Univer-sity of North Carolina and winner ofACM SIGGRAPH’s 1992 ComputerGraphics Achievement Award; Dr.Alan Kay, Disney Fellow and VicePresident of Research and Develop-ment, The Walt Disney Company,who is best known for the idea ofpersonal computing, the conceptionof the intimate laptop computer, and
e
SA
condui
conduit!A publication of
mputer Science DepartmentBrown University
❦Inquiries to: conduit!
artment of Computer ScienceBox 1910, Brown University
Providence, RI 02912FAX: 401-863-7657
PHONE: 401-863-7610EMAIL: [email protected]: http://www.cs.brown.edu/
publications/conduit/
Suzi HoweEditor-in-Chie
conduit!A publication of
mputer Science DepartmentBrown University
❦Inquiries to: conduit!
artment of Computer ScienceBox 1910, Brown University
Providence, RI 02912FAX: 401-863-7657
PHONE: 401-863-7610EMAIL: [email protected]: http://www.cs.brown.edu/
publications/conduit/
Suzi HoweEditor-in-Chief
the inventions of the now ubiquitousoverlapping-window interface and mod-ern object-oriented programming andwhose numerous honors include theACM Software Systems Award; EdLazowska (’72), Professor and Chair ofthe Department of Computer Scienceand Engineering at the University ofWashington; Raj Reddy, Dean of theSchool of Computer Science at CarnegieMellon University and the Herbert A.Simon University Professor of ComputerScience and Robotics, who received theACM Turing Award in 1995; and DavidSalesin (’83), Senior Researcher atMicrosoft Research and an AssociateProfessor in the Department of Comput-er Science and Engineering at the Uni-versity of Washington.
http://www.cs.brown.edu/~andyfest
t! 24
NON-PROFITU.S. Postage
PAIDProvidence, RI
Permit #202
Address changes welcomed
Jeff CoadyTechnical Support
Katrina AveryEditorf
Address changes welcomed
Jeff CoadyTechnical Support
Katrina AveryEditor