Embed Size (px)
Citation preview

Conductive ATO-Acrylate Nanocomposite Hybrid Coatings:Experimental Results and Modeling
VICTOR A. SOLOUKHIN,1 JOSE C. M. BROKKEN-ZIJP,2 GIJSBERTUS DEWITH2
1Oce-Technologies B.V., P.O. Box 101, 5900 MA Venlo, The Netherlands
2Laboratory of Materials and Interface Chemistry, Eindhoven University of Technology, P.O. Box 513,5600 MB Eindhoven, The Netherlands
Received 4 November 2006; accepted 18 December 2006DOI: 10.1002/polb.21114Published online in Wiley InterScience (www.interscience.wiley.com).
ABSTRACT: The electrical volume conductivity r of antimony-doped tin oxide (ATO)–acry-late nanocomposite hybrid coatings was investigated. The relation between r and the vol-ume filler fraction p was analyzed for the ATO-acrylate coatings containing ATO nano-particles grafted with different amounts of 3-methacryloxy-propyl-trimethoxy-silane cou-pling agent. Percolation thresholds were observed at very low filler fractions (1–2 vol %)for the coatings containing ATO nanoparticles with a low amount of surface grafting. Amodified effective medium approximation (EMA) model was introduced. This model takesinto consideration different distances between adjacent semiconductive particles in theparticle network. The model elucidates how self-arrangement of the particles influencesthe location of the percolation threshold in the log r � p plot. The modified EMA modelcan successfully explain the multiple transition behavior and the variable percolationthresholds found for the ATO-acrylate nanocomposite hybrid coatings. VVC 2007 Wiley Period-
icals, Inc. J Polym Sci Part B: Polym Phys 45: 2147–2160, 2007
Keywords: conducting polymers; effective medium approximation model; electricalconductivity; electrical volume conductivity; modeling; nanocomposites; nanocompositehybrid coatings; nanoparticles; structure–property relations; thermoset polymers
INTRODUCTION
Over the past two decades electrically conductingcomposite materials have received considerableattention from the scientific community and haveoccupied already a significant segment in the mar-ket of performance materials.1–7 Such compositematerials typically consist of a conductive fillerand an insulating, for example, polymeric matrix.Carbon black,5,6–18 graphite,12,15,19,20 various met-als,12,21–23 and conducting polymers1–4,24,25 havebeen already used as a filler material in differentgeometrical forms, such as particles, fibers and
flakes.1–7,25 A limited amount of literature is, how-ever, available on the use of nonmetallic inorganicparticles as a filler material in conducting compo-sites. Because of their electrical, thermomechani-cal and optical properties, the electrical conductingcomposite materials find their application in vari-ous fields ranging from permanent antistaticmaterials to electromagnetic interference shield-ing applications.1–4,26
The electrical volume conductivity r of a two-phase composite depends on a number of parame-ters: conductivity of each phase, filler fraction,shape, size and spatial distribution of the filler,and so forth The level of conductivity of the com-posite rises drastically when conducting particlesform a network through the insulating matrix.The concentration of the filler at which this steepincrease starts is often called percolation thresh-
Correspondence to: J. C. M. Brokken-Zijp (E-mail: [email protected])
Journal of Polymer Science: Part B: Polymer Physics, Vol. 45, 2147–2160 (2007)VVC 2007Wiley Periodicals, Inc.
2147

old. A few models are available and are used todescribe the conductivity of two-phase compositeswith respect to the volume filler fraction p. Theyare based on the percolation theory,27–29 on theeffective medium approximation (EMA) theorythat was originally proposed by Bruggeman30 andLandauer,31 and on the general effective media(GEM) theory, which is a combination of the firsttwo and was proposed by McLachlan et al.32
Unfortunately, these models can be used onlyfor composites with certain morphologies. In par-ticular, they cannot explain a multiple transitionbehavior in a log r � p plot, which was reported inthe literature 10–13,20,23,33 and was also found inthe course of this work. Furthermore, volume con-ductivity values of a conducting filler, rc such ascarbon black with rc � 102 S/cm,8 are typically notequal to the maximum volume conductivity valuesachieved in the composites using such fill-ers,5,6,10,11,13,14,17 although according to the modelsavailable, r of a composite should be approxi-mately equal rc, once a percolation threshold ispassed. Moreover, it cannot explain percolationthresholds below 17 vol %, whereas in practicethese values are often found.1,4,6,18
A modified EMA model is introduced in thepresent article. This model takes into considera-tion different distances between the adjacentconductive particles in the particle network andonly assumes transfer of electrons between thenearest neighbor particles. This model is used toexplain the volume conductivity of grafted semi-conducting antimony-doped tin oxide (ATO)nanoparticles embedded in insulating cross-linked an acrylic matrix. The volume conductiv-ity of these ATO-acrylate coatings was deter-mined in relation to the volume filler fractionand to the amount of grafted methacrylic groupson the surface of the ATO particles.
EXPERIMENTAL
Coating Preparation
Grafted nano-sized antimony doped tin oxide par-ticles were prepared from ATO nanoparticles andthe silane-coupling agent 3-methacryloxy-propyl-trimethoxy-silane (MPS). The ATO particles werespherical with a diameter of about 7 nm. Theywere purchased as a dispersion in water with pH(7 and a solid content of 12 wt % (with a dopinglevel of 15 mol %) from LWB-Eindhoven (the Neth-erlands). MPS was purchased from ABCR (USA).
Later we describe briefly the surface modifica-tion of the ATO particles and refer to the workdone by Posthumus et al.34 for more details. Thesurface modification of the ATO particles wasneeded to improve dispersability of the nanopar-ticles in organic media. The ATO particles weregrafted in different degrees with methacrylgroups by adding different amounts of MPS tothe reaction mixture, ranging from a MPS/ATOratio of 0.04 till 0.34 g/g. During grafting thewater present in the dispersion was replaced byan organic solvent to stabilize the dispersion ofnanoparticles and to enhance the mixing of thisdispersion later on with an acrylic prepolymer.The excess of the MPS molecules was convertedinto MPS oligomers. The amount of grafted MPSwas determined using FT-IR, TEM, and BETmeasurements according to the method de-scribed in detail in ref. 34.
After surface modification of the ATO par-ticles, the obtained organic solvent dispersionwas mixed with an acrylic prepolymer mixture(Ebecryl 745; UCB, Belgium), a photoinitiator 2-hydroxy-2-methyl-1-phenyl-propan-1-one (Aldrich)and n-propanol. This mixture was applied with adoctor blade on polycarbonate substrate. The sol-vent was evaporated and the coating was cured byUV irradiation (1000–1100 mJ/cm2) under nitro-gen atmosphere. Both the acrylic prepolymers andmethacrylic groups of MPS on the surface of theATO particles and on the MPS oligomer werecrosslinked during cure as was confirmed with FT-IR measurements. The coating thickness rangedfrom 5 to 25 lm after curing as measured on thecross section with optical microscopy. Commer-cially available rectangular polycarbonate plates(G.E. Plastics, the Netherlands) were used as sub-strates. The substrates were used as received afterremoving the protective sheets.
Electrical Conductivity Measurements
Electrical conductivity measurements were car-ried out using the four-point probe measurementtechnique.35,36 Prior to the measurements, fourparallel traces of silver adhesive (silver conductiveadhesive 416, EMS, USA) were applied on eachcoating, to decrease the contact resistance betweenthe electrodes and the coatings. The measure-ments were done using a KEITHLEY 237 as apower source and current measuring unit, andwith a KEITHLEY 6517A electrometer as a highvoltage resistance meter. The volume conductivity
2148 SOLOUKHIN, BROKKEN-ZIJP, AND DE WITH
Journal of Polymer Science: Part B: Polymer PhysicsDOI 10.1002/polb

of the ATO-acrylate nanocomposite hybrid coat-ings was calculated from
r ¼ ln2
ptIsVm
8>: 9>;; ð1Þ
where t represents coating thickness; Is, sourcedcurrent; and Vm, measured voltage, respectively.35
Avolume conductivity lower than 10�10 S/cm couldnot be measured reliably with our measuring unit.
TEMMeasurements
Transmission electron microscopy was used tostudy the morphology of the ATO-acrylate nano-composite hybrid coatings and to estimate size ofthe particles. Thin cross-sectional cuts of thecomposite were prepared using a Reichert-JungUltracut E microtom. TEM-analysis was perfor-med using a Jeol 2000FX.
RESULTS AND DISCUSSION
The Modified EMAModel
In the effective medium approximation (EMA)model, the relation between the volume filler frac-tion of an electrically conducting phase and the vol-ume conductivity of the composite is obtained bydividing the composite into a number of imaginaryspace filling polyhedra. These polyhedra are occu-pied with either the conducting filler or with theinsulating matrix, and their conductivities are equalto those of the corresponding phases.30,31,37,38
If the local volume conductivities rl within thecomposite are distributed according to some distri-bution function P(rl), the effective volume conduc-tivity of a composite re within the EMA model isgiven by39
Zdr1Pðr1Þ r1 � re
r1 þ ðz=2� 1Þre ¼ 0; ð2Þ
where z is the coordination number of the imagi-nary polyhedron. In case of a two-phase (conduc-tor-insulator) system with a simple cubic likearrangement, that is z ¼ 6, eq 2 transforms into
prc � rerc þ 2re
8>: 9>;þ ð1� pÞ ri � reri þ 2re
8>: 9>; ¼ 0; ð3Þ
where rc and ri are the volume conductivity of theconducting and insulating phase, respectively,with the corresponding relative volume fractions pand 1� p.37,39
In the EMA model, re is equal to ri at low vol-ume fractions of the conducting phase, because ofthe very low probability for conducting particles tocreate a continuous contacting particle network.At high volume fractions re equals rc, due to theformation of an infinite conducting cluster22 con-sisting of a large number of continuous contactsbetween the conducting particles. The critical vol-ume fraction at which an abrupt insulator to con-ductor transition occurs is known as the percola-tion threshold.
Although the EMA model is well known, it can-not fit a multiple transition behavior in a log r � pplot and fails to explain the difference between themaximum r reached after the percolation thresh-old when compared with the rc.
10–13,20,23,33 Thesame is true for the percolation theory.
It is clear that the percolation threshold is asso-ciated with the occurrence of continuous conduct-ing paths. These paths might be formed eitherthrough ‘‘geometrical touch,’’ that is a real physicalcontact between the adjacent particles, or ‘‘electri-cal touch,’’ that is that with a small distancebetween the adjacent particles allowing interpar-ticle tunneling8,17 or hopping.40,41 Therefore, thetransition between different levels of volume con-ductivity may be related to the creation of suchcontacts.
In a modified version of the EMA model pro-posed by Mikrajuddin et al.,38 different types ofcontacts between the phases are considered as in-dependent parameters. Unfortunately, this modelstill cannot explain the existence of percolationthresholds at very low filler fractions, that is 0.03–5.0 vol %, observed in our materials as well as bysome other researchers.11,13–15,18,19,22,24,42 In thefollowing we elaborate our modified EMAmodel.
Similarly as in the model of Mikrajuddinet al.,38 we divided the composite into n polyhedra.Each filler particle occupies one polyhedron, andthe total number of the occupied polyhedra is no.The probability of one polyhedron occupied by aparticle is
gp ¼no
n¼ nou
nu¼ nou
V¼ Vo
V
8>: 9>; nou
Vo
8>: 9>; ¼ p
f; ð4Þ
where u, V and Vo are the volume of one polyhe-dron, the total volume of the entire composite andthe volume occupied by the particles in the com-posite, respectively; p ¼ Vo/V is the volume fillerfraction, and f ¼ Vo/nou is the filling factor. Forspherical particles f equals to 0.5236, 0.6802, or0.7405 for a simple cubic (SC), body centered cubic
CONDUCTIVE ATO-ACRYLATE COATINGS 2149
Journal of Polymer Science: Part B: Polymer PhysicsDOI 10.1002/polb

(BCC) or face centered cubic (FCC) like particlearrangement, respectively.32 The probability forthe insulating material to occupy a polyhedron isgiven then by
gi ¼ 1� p
fð5Þ
In general, with a random distribution, theprobability for a particle-particle contact can Berepresented by
gpp;1 ¼ Kg2p ¼ Kp
f
8>>: 9>>;2
ð6Þ
where K is a constant, and the numbering in thesubscript of the probability (1, 2, or 3) is introducedto indicate one of the subsequent approximations.The first approximation considers direct contact(geometrical touch). When p equals f, then gpp,1¼ 1 orK f
f
8: 9;2¼ 1: Thus, K¼ 1 and eq 6 reads
gpp;1 ¼p2
f 2ð7Þ
Each particle-particle contact has a contactresistance Rpp proportional to the correspondingvolume resistivity qpp (Fig. 1). Equivalently a par-ticle-particle volume conductivity rpp ¼ 1/qpp canbe used. Using a similar route, the probability foran insulator-insulator contact with a volume con-ductivity rii (Fig. 1) can be given by
gii ¼ 1� p
f
8>>: 9>>;2
ð8Þ
Since the total probability of all particle-parti-cle, particle-insulator and insulator-insulator con-
tacts must be unity, the probability of a particle-in-sulator contact equals38
gpi;1 ¼ 2p
f
8>>: 9>>; 1� p
f
8>>: 9>>; ð9Þ
Similarly to the particle-particle and insulator-insulator contacts, the particle-insulator contactshould be associated with a volume conductivityrpi (Fig. 1).
For demonstration’s sake, an example of varia-tions in probabilities of the particle-particle, parti-cle-insulator and insulator-insulator contacts withchanges in the volume filler fraction are depictedin Figure 2 for a simple cubic like particle arrange-ment.
In a real composite system, however, adjacentparticles can be at a distance larger than the phys-ical particle-particle contact, and still conduct elec-tricity (electrical touch), as long as the interpar-ticle distance is less than a few nm. Such a configu-ration of particles depends on filler fraction, anddecreases the probability of particle-particle and/or particle-insulator contacts at constant fillerfractions. Thus, we can assume that the probabil-ity of a ‘‘particle-insulator-particle’’ contact, whichhas some volume conductivity rpip (Fig. 1), willcontain both gpp,1 and gq-,1, and can be expressedby
gpip;1 ¼ cpp 1� p
f
8>>: 9>>;gpp;1 þ cpi 1� p
f
8>>: 9>>;gpi;1; ð10Þ
Figure 1. Schematic representations of the variousparticle contacts and their associated resistances in acomposite system with spherical particles as filler. Notethat Rpop is represented as a part of Rpp (see the text).(see supplemental draft).
Figure 2. The relation between the probabilities ofparticle–particle (gpp), particle–insulator (gpi) and insu-lator-insulator (gii) contacts versus the volume filler frac-tion of spherical particles (SC particle arrangement; seethe text for input data) (see supplemental draft). [Colorfigure can be viewed in the online issue, which is avail-able at www.interscience.wiley.com.]
2150 SOLOUKHIN, BROKKEN-ZIJP, AND DE WITH
Journal of Polymer Science: Part B: Polymer PhysicsDOI 10.1002/polb

where cpp and cpi are the relative probability con-tributions of the particle-particle and particle-insulator contacts to the probability of the particle-insulator-particle contacts, respectively, (0 < cpp,cpi < 1). Then the probabilities of the particle-par-ticle and particle-insulator contacts become
gpp;2 ¼ gpp;1 1� cpp 1� p
f
8>>: 9>>;8>>: 9>>;; ð11Þ
and
gpi ¼ gpi;1 1� cpi 1� p
f
8>>: 9>>;8>>: 9>>; ð12Þ
The probabilities should obey the unity rule
gii þ gpi þ gpip;1 þ gpp;2 ¼ gii þ gpi;1 þ gpp;1 ¼ 1 ð13Þ
One can state that the existence of the particle-insulator-particle contacts might also alter theprobability of the insulator-insulator contacts aswell. This will occur when the conducting phasebecomes the main phase in the composite. Forpractical systems, however, p is less that 0.30 and,therefore, alterations in gii can be neglected andthe gii used is given in eq 8.
Furthermore, even if the particle-particle con-tacts are established, it will be difficult to ensurethat all such contacts are clean ones, that is free ofany less conducting or isolating intermediatelayer.38,43 This is of particular importance, whenthe surfaces of the particles are (partly) modifiedwith such a layer, as in our systems studied here.Thus, an insulating layer, with a thickness of �1nm, has to be considered as well. To do so, a newprobability is introduced, which will account forthe particle-particle contacts with a very thin insu-lating layer. We write this probability as,38
gpop ¼ bgpp;2; ð14Þwhere b is a constant characterizing the fraction ofcontacts with a thin insulating layer (�1 nmthick). A volume conductivity of such a particle-‘‘oxide’’-particle layer is rpop. Note that the associ-ated Rpop is not included in Figure 1 explicitly, butpresented there as a part of Rpp. Evidently, theprobability of the particle-particle contacts thenbecomes
gpp ¼ ð1� bÞgpp;2 ð15Þ
Since the total of probabilities must Be one,That is
gpp þ gpop þ gpip þ gpi þ gii ¼ 1; ð16Þ
we can derive the final probabilities
gpp ¼ ð1� bÞðf � cppf þ cpppÞp2
f 3; ð17Þ
gpop ¼ bðf � cppf þ cpppÞp2
f 3; ð18Þ
gpip ¼ ðf � pÞð2cpiðf � pÞ þ cpppÞ pf 3
; ð19Þ
gpi ¼ 2ðf � pÞðð1� cpiÞf � cpipÞ pf 3
; ð20Þ
gii ¼ 1� p
f
8>>: 9>>;2
ð21Þ
Typical changes in these probabilities versusvolume filler fraction are shown in Figure 3. forthis demonstration a simple cubic like particlearrangement, with cpp and cpi equal to 0.3 and bequal to 0.2 were used.
Self-arrangement of nanoparticles into anetwork structure is a well-recognized pheno-menon.1,2,18,44 When this takes place in a conduct-ing composite during processing, it will enhancethe formation of a conducting network and shiftthe percolation threshold to a lower filler fraction.To include the self-arrangement of the particles,
Figure 3. The relation between the probabilities ofparticle–particle (gpp), particle–‘‘oxide’’–particle (gpop),particle–insulator–particle (gpip), particle–insulator (gpi)and insulator–insulator (gii) contacts versus the volumefiller fraction of spherical particles (SC like particlearrangement; see the text for input data). [Color figurecan be viewed in the online issue, which is available atwww.interscience.wiley.com.]
CONDUCTIVE ATO-ACRYLATE COATINGS 2151
Journal of Polymer Science: Part B: Polymer PhysicsDOI 10.1002/polb
we introduce a new constant Ka, which increasesthe propensity of the particles to form networkchains. Different propensities can exist for differ-ent types of interparticle contacts, but for simplic-ity we use only one constant for self-arrangementof particles.
Substituting the conductivities, the probabil-ities, eqs 17–21, and Ka into eq 2, we obtain thefinal result representing our modified EMAmodel:
Ka
"gpp
rpp � re
rpp þ z2 � 1
8: 9;re
8>>>>>>:9>>>>>>;
þ gpoprpop � re
rpop þ z2 � 1
8: 9;re
8>>>>>>:9>>>>>>;
þ gpiprpip � re
rpip þ z2 � 1
8: 9;re
8>>>>>>:9>>>>>>;#
þ gpirpi � re
rpi þ z2 � 1
8: 9;re
8>>>>>>:9>>>>>>;
þ giirii � re
rii þ z2 � 1
8: 9;re
8>>>>>>:9>>>>>>; ¼ 0;
ð22Þ
where the coordination number z equals 6, 8 or 12for SC, BCC or FCC like particle arrangements,respectively.32
Equation 22 is a 5th order polynomial in re.Among the five roots of the polynomial, only one istypically positive and represents the re of the com-posite. We have calculated the roots of the polyno-mial usingMathematica software.
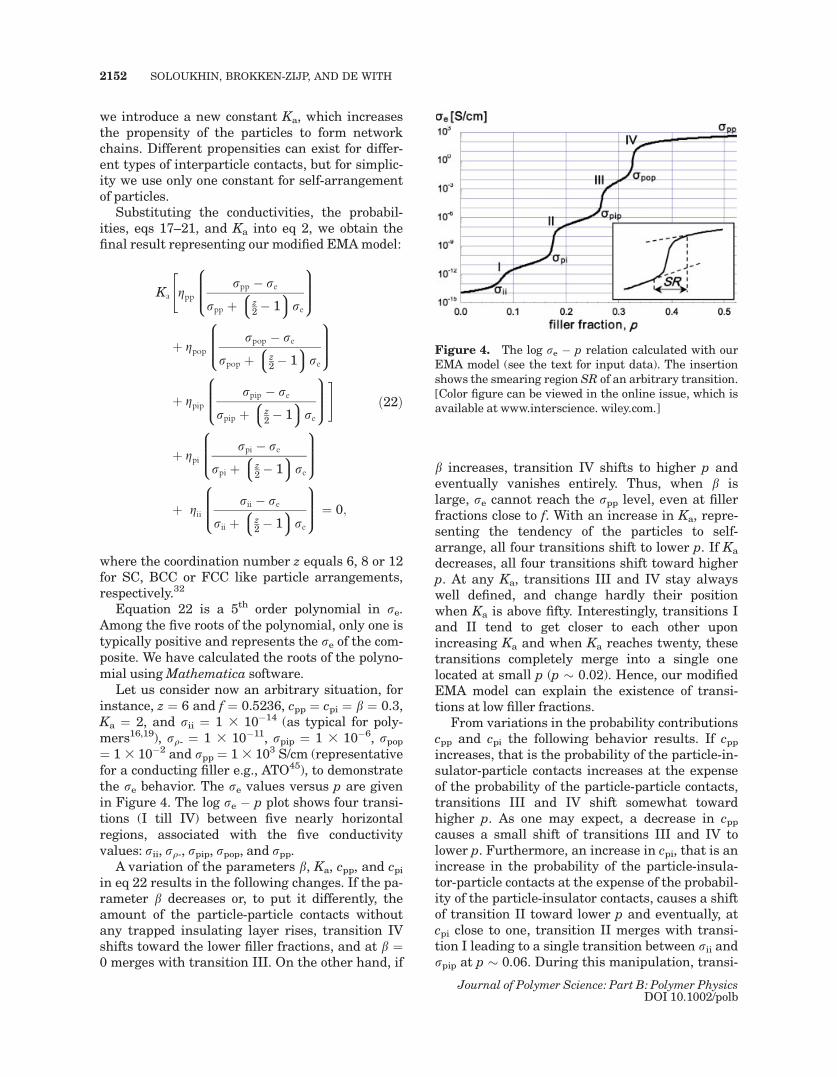
Let us consider now an arbitrary situation, forinstance, z ¼ 6 and f ¼ 0.5236, cpp ¼ cpi ¼ b ¼ 0.3,Ka ¼ 2, and rii ¼ 1 3 10�14 (as typical for poly-mers16,19), rq- ¼ 1 3 10�11, rpip ¼ 1 3 10�6, rpop¼ 1 3 10�2 and rpp ¼ 1 3 103 S/cm (representativefor a conducting filler e.g., ATO45), to demonstratethe re behavior. The re values versus p are givenin Figure 4. The log re � p plot shows four transi-tions (I till IV) between five nearly horizontalregions, associated with the five conductivityvalues: rii, rq-, rpip, rpop, and rpp.
A variation of the parameters b, Ka, cpp, and cpiin eq 22 results in the following changes. If the pa-rameter b decreases or, to put it differently, theamount of the particle-particle contacts withoutany trapped insulating layer rises, transition IVshifts toward the lower filler fractions, and at b ¼0 merges with transition III. On the other hand, if
b increases, transition IV shifts to higher p andeventually vanishes entirely. Thus, when b islarge, re cannot reach the rpp level, even at fillerfractions close to f. With an increase in Ka, repre-senting the tendency of the particles to self-arrange, all four transitions shift to lower p. If Ka
decreases, all four transitions shift toward higherp. At any Ka, transitions III and IV stay alwayswell defined, and change hardly their positionwhen Ka is above fifty. Interestingly, transitions Iand II tend to get closer to each other uponincreasing Ka and when Ka reaches twenty, thesetransitions completely merge into a single onelocated at small p (p � 0.02). Hence, our modifiedEMA model can explain the existence of transi-tions at low filler fractions.
From variations in the probability contributionscpp and cpi the following behavior results. If cppincreases, that is the probability of the particle-in-sulator-particle contacts increases at the expenseof the probability of the particle-particle contacts,transitions III and IV shift somewhat towardhigher p. As one may expect, a decrease in cppcauses a small shift of transitions III and IV tolower p. Furthermore, an increase in cpi, that is anincrease in the probability of the particle-insula-tor-particle contacts at the expense of the probabil-ity of the particle-insulator contacts, causes a shiftof transition II toward lower p and eventually, atcpi close to one, transition II merges with transi-tion I leading to a single transition between rii andrpip at p � 0.06. During this manipulation, transi-
Figure 4. The log re � p relation calculated with ourEMA model (see the text for input data). The insertionshows the smearing region SR of an arbitrary transition.[Color figure can be viewed in the online issue, which isavailable at www.interscience. wiley.com.]
2152 SOLOUKHIN, BROKKEN-ZIJP, AND DE WITH
Journal of Polymer Science: Part B: Polymer PhysicsDOI 10.1002/polb

tions III and IV undergo a minor shift towardhigher p. A decrease in cpi causes, on the otherhand, a shift of transition II toward higher p. Dur-ing this manipulation, transitions III and IVundergo a minor shift toward lower p.
Apart from the above-discussed variations, thewidth of the so-called smearing region33 associatedwith every transition (see the insertion in Fig. 4)may vary. In particular, the largest widening ofthe smearing region occurs when a transitionbetween two neighboring nearly horizontal regionswith a relatively small difference in their conduc-tivity values takes place. In the case of many suchtransitions (more than we have introduced) withrelatively small differences in their conductivities(less than two orders of magnitude), a gradualincrease in the log re � p plot over a large or eventhe full p range will occur. A number of suchexperimental observations have been alreadyreported.11,16,20,25
As will be clear, the thickness of the insulatinglayers between the adjacent conducting particlesplays a crucial role in the modified EMA model. Inthe case when a few nearly horizontal regions areobserved in log r � p plots of composites, theymight be attributed to relevant conductivities, andthereafter to various insulating layers, whichinfluence the rate of tunneling8,17 and/or hop-ping.40,41 Moreover our modified EMA modelshows clearly the possibility for the existence ofboth a single percolation-like trend and a trendwith gradual growth over the filler fraction range,as extreme cases, and allows the existence oftrends with multiple transitions, as intermediatecases. It also shows that the percolation thresholdcan occur at a very low filler fraction.
Our modified EMA model explains the changesin the log re � p behavior due to formation of a net-work, that is an arrangement of the particlesforming conducting paths. The importance ofthis phenomenon was already mentioned in theliterature.1–4,6,7,18,22,25,33,44 Moreover, the modelbehaves in a similar way as was already describedqualitatively by Roldugin and Vysotskii.33 Theypredicted the existence of several percolationthresholds in the log re � p plot in a two compo-nent polymer composite.
The ATO-Acrylate Nanocomposite Hybrid Coatings
The crosslinked ATO acrylate coatings appeared tobe bluish and had a good optical transparency.They did not show any dark spots and exhibitedvery limited light scattering. This is due to the
nanometer size of the ATO particle itself and theabsence of ATO agglomerates. One of the TEMimages of these coatings is given in Figure 5. Inthis figure small aggregates of spherical ATO par-ticles as well as the primary particle size of �7 nmcan be seen. In our TEM pictures no indication forthe presence of agglomerated ATO particles in thecoatings was found. This suggests that the ATOparticles were very well dispersed in the coatingformulation before and after crosslinking. This canbe explained by the grafting method used to mod-ify the surfaces of the particles.34 After crosslink-ing the ATO acrylate coatings adhered well to thepolycarbonate substrates.
In these coatings the ATO particles were alwaysgrafted with a certain amount of MPS. The cover-age of the ATO particles with grafted MPS groupswith respect to the MPS/ATO ratio used in thegrafting reaction is shown schematically in Figure6, where the surface coverage reaches saturationat approximately MPS/ATO ¼ 0.1, correspondingapproximately to 2 lmol of grafted MPS persquare meter of the surface of the ATO particles.As has been shown before 2 lmol of grafted MPSper square meter is about 60% of the amountneeded for a closed MPS monolayer on the surfaceof the particles.34 The grafting of the particles wasneeded to obtain a good quality coating. Moreover,
Figure 5. TEM image of an ATO–acrylate nanocompo-site hybrid coating with 1 vol % of ATO nanoparticles(MPS/ATO ratio¼ 0.34 g/g).
CONDUCTIVE ATO-ACRYLATE COATINGS 2153
Journal of Polymer Science: Part B: Polymer PhysicsDOI 10.1002/polb

during crosslinking the methacryl group of thegrafted MPS reacted further with the acrylate ma-trix monomer and as a consequence the ATO par-ticles were chemically connected with the cross-linked matrix after cure.46 The amount of graftedMPS and the reaction of these grafted groups dur-ing cure will influence the distance between theATO particles in the particle networks as well asthe position of the percolation threshold (seebelow).
The experimentally determined r of the cross-linked ATO-acrylate nanocomposite hybrid coat-ings are given in Figure 7a as dots for five differentMPS/ATO ratios. These ratios describe the amountof MPS used for the surface modification of theATO particles and their relation with the actualMPS amount present on the surface of the par-ticles (see Fig. 6). The fitting of these experimentaldata with our new EMA model is shown in Figure7(b) (for details see Appendix).
No clear single percolation-like trend, butcurves with nearly horizontal plateau-like regionscan be observed in Figure 7a. The best theseregions can be seen for the coatings with MPS/ATO ratios equal to 0.04, 0.08, and 0.09.
A comparison between the coatings with similarfiller fractions but different MPS/ATO ratiosreveals that the amount of the silane-couplingagent used to modify the surface of the ATO par-ticles plays a significant role in the r of the ATO-acrylate nanocomposite hybrid coatings (Fig. 8).
For the MPS/ATO ratio range from 0.04 to 0.1, asubstantial decrease in r of the these coatings wasobserved. For the MPS/ATO ratio > 0.1, the r ofthe coatings is approximately constant. As isshown in Figure 6 the amount of grafted MPS sur-face groups increased till the MPS/ATO ratioreached 0.1. Above that level the amount of thesesurface groups hardly increases further. Hence,the trends seen in Figures 5 and 8 strongly suggestthat the amount of grafted molecules on the ATO
Figure 7. (a) The experimentally determined r valuesof the ATO–acrylate nanocomposite hybrid coatings ver-sus p for different MPS/ATO ratios. (b) The experimen-tally determined r values for each p for different MPS/ATO ratios (dots) fitted with our EMA model (curves);See Table 1 for input data used for these fittings.
Figure 6. Schematic representation of the amount ofMPS molecules grafted on the surface of the ATO par-ticles with respect to the MPS/ATO ratio used in the syn-thesis, and of MPS molecules grafted on the surface ofan ATO particle.
2154 SOLOUKHIN, BROKKEN-ZIJP, AND DE WITH
Journal of Polymer Science: Part B: Polymer PhysicsDOI 10.1002/polb

particles directly influences r of the ATO - acrylatecoatings.
These experimental results can be explainedwith aid of our EMA model. The detailed descrip-tion of the procedure used is given in the Appen-dix. As one can see from Figure 7(b), the calculatedcurves are in reasonable agreement with themeasured log r � p data. This proves the relevanceof our EMA model. In this procedure we assumedthat the two nearly horizontal levels shown in Fig-ure 7a are dominated by rpip and rpop, respectively.A good correlation was obtained by modifying theself-arrangement constant Ka only, keeping the cppand cpi values for the five sets of the ATO-acrylatenanocomposite hybrid coatings identical. This sug-gests that the amount of MPS grafted on the sur-face of the particles is the main factor determiningthe position of the percolation threshold as wellas the distance between the adjacent particles andthe r of the composite at a certain particle concen-tration.
The relation between the Ka parameter and theMPS/ATO ratio is shown in Figure 9. It appearsthat upon an increase in the MPS/ATO ratio from0.04 to 0.1, the Ka decreases from about 44 to about10 and thereafter is approximately constant.When these changes are compared with theamount of grafted MPS on the surface of the par-ticles (Fig. 6) a clear correlation is suggested.Apparently an increase in the amount of MPSmol-ecules on the particle surface causes a decrease inthe ability of the ATO particles to arrange them
into a network and when the grafted MPS amountbecomes stable (MPS/ATO ratio � 0.1) this abilityreaches a low steady level.
Grafting with MPS replaces the hydroxylgroups on the surface of the ATO particles bymethacrylic groups. This lowers the surface ten-sion of the particles itself and lowers the surfacetension difference between the ATO particles andthe acrylic prepolymer matrix. It has been shownearlier that this difference influences strongly theself-arrangement of nanoparticles into fractal par-ticle network structures during the cure of a ther-moset nanocomposite18,42,44 and a decrease in thisdifference shifts the percolation threshold to ahigher filler fraction.18,42 Such a shift is observedhere too [Fig. 7(b)]. Hence, the larger the amountof MPS grafted on the surface, the higher the per-colation threshold is. When the log r � p relationis calculated for coatings containing ATO particleswith the maximum amount of grafted MPS stud-ied here (about 60% surface coverage) the calcu-lated Ka value is still quite large (about 10). A fur-ther decrease in Ka, for instance, by grafting thesurface of the particles with 100% MPS, will shiftthe percolation threshold to even higher values.Also the grafting of the surface with a different sil-ane coupling agent may alter Ka and the positionof the percolation threshold when the surface ten-sion of the grafted coupling agent is different fromgrafted MPS (assumed equal amounts grafted).This change will alter the interfacial tension
Figure 8. The experimental values of r of the ATO-acrylate nanocomposites versus the MPS/ATO ratiosused to make these coatings for p values of 15, 20, and25 vol %.
Figure 9. The constant Ka, which represents thepropensity of nanoparticles for self-arrangement into aparticle network, versus the MPS/ATO ratio (particlearrangements used: SC, BCC, and FCC).
CONDUCTIVE ATO-ACRYLATE COATINGS 2155
Journal of Polymer Science: Part B: Polymer PhysicsDOI 10.1002/polb

between the grafted particles and matrix andtherefore modifies the Ka values and shifts theposition of the percolation threshold.
One can notice that the fitted log r � p curvestend to split into two groups on the basis of theposition of the first percolation threshold. The rea-son for this may be the steep decrease in Ka at theMPS/ATO ratio at 0.1 (Fig. 9) and the almost con-stant Ka values for MPS/ATO ratios above 0.1 andbelow 0.1, respectively.
The maximum values of r found (�10�4 S/cm)appeared to be much lower than those known forthe filler material itself (�103–104 S/cm).45 OurEMA model calculations suggest that this has tobe attributed to the presence of an isolating layerbetween adjacent particles in the network. Theseisolating layers can be explained by the presenceof grafted isolating MPS groups on the surface, thelarger the amount the lower is the maximum valueof r observed, which is in line with expectation.These isolating layers between adjacent ATO par-ticles may be absent when nongrafted ATO par-ticles could be used. Unfortunately, attempts tomake ‘‘homogeneous’’ ATO/acrylate coatings fromwell dispersed nongrafted ATO dispersions couldnot be made.
Recently, it was shown that under optimumthermoset processing conditions physical contactswithout the presence of an isolating layer mayoccur between semiconductive nanoparticles pres-ent in a particle network in a thermoset matrix,even when the filler amount is well below 17vol %.47 The experimental data and the model pre-sented in this article47 confirm that, indeed, evenin the ATO/acrylate coatings containing 30 vol %filler discussed here, the maximum value of rfound is too low to assume physical contactbetween the particles.
The fitting of our experimental data of theATO acrylate coatings in Figure 7 with our EMAmodel is based on limiting the variables byincluding for some variables reasonable assump-tions (see Appendix). At present, we only drawqualitative conclusions from the data given inFigure 7. We are gathering much more experi-mental data for these coatings by varying theintrinsic conductivity of the filler particles. Weexpect that based on these data quantitative con-clusions may be drawn.
A percolation threshold far below 17 vol % wasfound for several thermoset two componentcomposites containing semiconductive sphericalnanoparticles.1,18,42,43,48,49 Often this could beexplained by the presence of a fractal particle net-
work formed by diffusion limited cluster-clusteraggregation. That fractal particle network struc-tures can be present in MPS grafted ATO/acrylatecoatings was shown before.46
Also for a broad range of two component sys-tems composed of a thermoplastic polymer matrixand carbon black particles as filler percolationthresholds well below 5 vol % were found. Severalqualitative percolation models were presented toexplain such a low percolation threshold.48,50–52 Inthese models a large interfacial tension betweenparticle and matrix seems to play an importantrole in explaining the low percolation threshold.Our EMA model can be used, in principle, toexplain or forecast quantitatively the log r � prelation in these materials and the Ka valuesobtained will show the interfacial tension contri-bution. However, it is extremely difficult to dis-perse completely the CB particles in a thermoplas-tic polymer melt during extrusion. Moreover, partof the polymer matrix may crystallize during cool-ing and the crystalline fraction of the matrix does,in general, not contain CB particles. Sometimesthe processing time is too short to complete parti-cle network formation during processing. Hence,we expect that our EMA model can be used only toexplain or forecast quantitatively the log r � pcurves for two component systems correctly, whenadditional corrections for a nonoptimum disper-sion of the CB particles in the matrix and/or a vol-ume correction for the crystalline fraction of thepolymer matrix is included in our EMA model.Moreover, processing conditions should be used,which allow for complete particle network forma-tion before geltime (thermoset polymer matrix),solidification and/or crystallisations (thermoplasticpolymer matrix). Sometimes CB polymer compo-sites with low percolation threshold are reported,which contain three or four components. We thinkthat using our EMA model to explain/forecast thelog r � p curves for these systems will be generallyproblematic especially because in these systems alarge part of the CB particles is often present atthe interface between two polymer matrix compo-nents.48,50–52
CONCLUSIONS
A modified effective medium approximation(EMA) model, which takes into consideration dif-ferent types of contacts between the adjacent par-ticles in a particle network, was introduced. Thismodel clearly demonstrates a multiple transition
2156 SOLOUKHIN, BROKKEN-ZIJP, AND DE WITH
Journal of Polymer Science: Part B: Polymer PhysicsDOI 10.1002/polb

behavior in the log r � p plot of polymer-nanocom-posites that contain conducting nanoparticles asfiller. This model also elucidates how self-arrange-ment of particles influences the location of the per-colation threshold in the log r � p plot and whymaximum values of r of a composite can be consid-erably lower than the volume conductivity of thecorresponding filler.
The volume conductivity of the ATO-acrylatenanocomposite hybrid coatings was determined asa function of the volume fraction of ATO nanopar-ticles and of the amount of methacrylic groups(MPS) grafted on the surface of the ATO particles.A percolation threshold associated with an insula-tor to dissipator transition was observed at verylow filler fractions, that is 1–2 vol %, when theamount of MPS grafting on the ATO particles islow. The percolation threshold shifted to higher fil-ler fractions when amount of MPS grafting wasincreased. This can be explained by a decrease inthe self-arrangement ability of the particles due tothe lowering of the difference in surface tensionbetween the grafted ATO particles and the acrylicmatrix before and during cure of the acrylatemonomer. A good fit between our experimentaldata and the calculated data using our EMAmodelwas found. It was also shown that the parametersof our EMA model, which reflects self-arrange-ment of the nanoparticles, correlates with theamount of MPS groups grafted on the ATO par-ticles. Stepwise increases in the r values in the logr � p plots were experimentally observed. Thisbehavior can be explained by the occurrence of dif-ferent distances between ATO nanoparticles in theparticle network at different particle concentra-tions.
Our EMA model is, in principle, also suitableto explain or forecast the log r � p plots of othertwo component polymer composites containingas filler (semi) conductive nano particles. How-ever, it may be needed to include corrections fornonoptimum starting dispersions of the fillerparticles and/or volume correction for the crys-talline fraction of the polymer matrix in ourEMA model. The present model can only beapplied when processing conditions are chosen,which allow complete particle network formationbefore geltime (thermoset polymer matrix), solid-ification and/or crystallization (thermoplasticpolymer matrix).
We are grateful to Prof. dr. M.A.J. Michels (Laboratoryof Theoretical Polymer Physics, TU/e, the Netherlands)for his valuable comments, to Dr. J. Loos for the TEM
measurements, to Dr. W. Posthumus for the preparationof the ATO-acrylate nanocomposite hybrid coatings andto IOP Center (the Netherlands) for financial support.
APPENDIX
Prior to fitting the experimental data (Fig. 7a) with ourEMAmodel (eq 22), one has to recognize that the experi-mental data points lie in a restricted area of filler frac-tions/conductivities among those theoretically possible.Therefore, to use the model, a number of reasonableassumptions have to be made. We take rii ¼ 1 3 10�14 S/cm as typical for polymers16,19 and rpp ¼ 13 103 S/cm asone of the lowest conductivity values for ATO known.45
The particle-insulator conductivity is taken being equalto that of the insulator-insulator conductivity, that is rq-¼ rii ¼ 1 3 10�14 S/cm. The latter is done because of thefollowing. Firstly, an exact trend for r < 10�10 S/cmcould not be measured for our coatings and, therefore,an accurate value for the rq- is unknown. Secondly, theparticle-insulator conductivity is likely to be in a rangeof 10�14 to 10�12 S/cm and, therefore, is unlikely to inter-fere with the conductivity values measured at r > 10�10
S/cm.Since even at the highest volume filler fraction (0.30)
of the ATO nanoparticles the volume conductivityachieved for the ATO-acrylate nanocomposite hybridcoatings was much lower than that known for the fillermaterial itself, a predominance of clean particle-particlecontacts in the range of the conductivity measured canbe excluded. Nevertheless, a small amount of clean par-ticle-particle contacts may be still present in the coat-ings. The fact that a closed MPS monolayer could not beattained on the surface of the ATO particles supportsthis assumption. Therefore, we should assign a rela-tively high magnitude to b. We take b ¼ 0.9, whichimplies that 90% of all contacts between the adjacentparticles have a very thin insulating monolayer (�1 nmthick).
As is obvious from the discussion above, the conduc-tivities rpip and rpop must play the most important rolein the 10�10 to 10�3 S/cm conductivity region. For calcu-lating the fittings, we take r measured at 30 vol % of theATO particles as the rpop values in most of the cases. Forthe set of coatings with MPS/ATO ratio ¼ 0.04 we used rmeasured at 25 vol %, since for this set a coating with 30vol % of the ATO particles could not be made. In most ofthe cases, we took r at 10 vol % of the ATO particles asthe rpip values. For the set with the MPS/ATO ratioequal to 0.17 we chose r of the 0.34 ratio set, because acoating with 10 vol % of the ATO particles was not avail-able. The exact r values taken for the fittings are givenin Table A1.
The remaining parameters, namely, the self-arrange-ment constant Ka and the probability contributions cppand cpi, are the variables, which have to be found by fit-ting the experimentally obtained log r � p curves.
CONDUCTIVE ATO-ACRYLATE COATINGS 2157
Journal of Polymer Science: Part B: Polymer PhysicsDOI 10.1002/polb

Because an increase of Ka above fifty hardly changes thelocation of the four transitions (see main text), Ka wasrestricted to 1 � Ka � 50. The probability contributionscan take any value between zero and one, or 0 � cpp � 1and 0� cpi � 1.
The fittings were done in the following way. Usingthe rpip and rpop values selected for each log r � p rela-
tion (see Table 1), fifty log r � p curves were calculatedcorresponding to Ka ranging from 1 to 50 for every com-bination of cpp and cpi and p ranging from 0 to f using a
step Dp¼ 0.01. The mean rexpi value was used during cal-
culations when several rexpi values were available. The
filling factor f was taken equal to 0.5236, 0.6802or 0.7405 for the SC, BCC, or FCC like particle arran-gement, respectively.32 For every MPS/ATO ratioand p a squared difference sum was computed foreach calculated log re � p curve, that is s ¼ffiffiffiffiffiffiffiffiffiffiffiffiffiffiffiffiffiffiffiffiffiffiffiffiffiffiffiffiffiffiffiffiffiffiffiffiffiffiffiffiffiffiffiffiffiffiffiffiffiffiffiffiffiffiffiffi
1Nc
PNci¼1ðlogrcalci � logrexpi Þ2
qwhere Nc is the number of
rexpi points for every curve (see Table 1). For each combi-
nation of cpp and cpi, a Ka value, at minimal s value foreach log r � p curve, was found. Next for each combina-tion of cpp and cpi a squared difference sum was com-
puted, that is S ¼ffiffiffiffiffiffiffiffiffiffiffiffiffiffiffiffiffiffiffiffiffiffiffiffiffiffiffiffiffiffiffiffiffiffiffiffiffiffiffiffiffiffiffiffiffiffiffiffiffiffiffiffiffiffiffiffiffiffi1N
PNi¼1
�log rcalci � logrexpi
�2q, where
N is the number of all experimental points,
N ¼ P5c¼1 Nc ¼ 36: In these calculations the Ka values
at the lowest s values for a particular combination ofcpp and cpi were used. Lastly, the cpp and cpi valuescorresponding to the lowest S were used in the finalfittings. The final log r � p curves, calculated using the
parameters of Table 1, are shown in Figure 7b for the SClike particle arrangement.
To speed up the computation process, it was decidedto make calculations in two steps. Firstly, a 3D-matrixcomprised of cpp (cpp
min ¼ 0, Dcpp ¼ 0.05, cppmax ¼ 1), cpi
(cpimin ¼ 0, Dcpi ¼ 0.05, cpi
max ¼ 1) and Ka (Kamin ¼ 1, DKa ¼
1, Kamax ¼ 50) was adopted. It appeared that for every
particle arrangement, the cpp and cpi values associatedwith the lowest S were less than 0.5. Next, a 3D-matrixcomprised of cpp (cpp
min ¼ 0, Dcpp ¼ 0.01, cppmax ¼ 0.5),
cpi (cpimin ¼ 0, Dcpi ¼ 0.01, cpi
max ¼ 0.5) and Ka (Kamin ¼ 1,
DKa ¼ 1, Kamax ¼ 50) was adopted, which yielded the
final cpp, cpi and Ka values given in Table 1. As an exam-ple, a plot of the S values computed for the FCC like par-ticle arrangement, with cpp and cpi ranging from 0 till0.5 with a step of 0.01 and the Ka values correspondingto the best fit for each combination of cpp and cpi, isdepicted in Figure A1. It appeared that no fittings wereobtained when cpi was less than 0.15 for the FCC likeparticle arrangement. This happened because duringcalculation of the log re - p curves the boundary condi-tion (see next paragraph), which was defined for the setof the ATO-acrylate nanocomposite hybrid coatings withthe MPS/ATO ratio equal to 0.04, was not met.
The following boundary conditions were used duringcomputation. Prior to calculation of the log re � p curves,it was checked whether the particle–particle, particle–‘‘oxide’’–particle, particle–insulator–particle, particle–insulator and insulator–insulator probabilities obey thefollowing rules: 0 � gpp � 1, 0 � gpop � 1, 0 � gpip � 1, 0� gq- � 1 and 0 � gii � 1. As a double check, it was con-
Table A1. The Parameters Used to Fit the Experimental Volume Conductivity Values of the ATO–AcrylateNanocomposite Hybrid Coatings with respect to Filler Fraction and MPS/ATO Ratio (Fig. 7a) by means of theModified EMAModel, and the Fitting Results Obtained (Fig. 7b)
PAa z fMPS/
ATO (g/g)rpop (10
–4)(S/cm)
rpip (10–7)
(S/cm) Nc s S cpp cpi Ka
SC 6 0.5236 0.04 3.329 174.3 6 0.387 0.383 0.02 0.30 440.08 2.343 28.37 10 0.420 440.09 1.567 7.315 6 0.424 100.17 0.623 0.061 8 0.382 110.34 0.519 0.061 6 0.254 11
BCC 8 0.6802 0.04 3.329 174.3 6 0.343 0.368 0.05 0.24 470.08 2.343 28.37 10 0.404 480.09 1.567 7.315 6 0.376 110.17 0.623 0.061 8 0.392 120.34 0.519 0.061 6 0.274 12
FCC 12 0.7405 0.04 3.329 174.3 6 0.283 0.364 0.32 0.19 390.08 2.343 28.37 10 0.349 390.09 1.567 7.315 6 0.356 90.17 0.623 0.061 8 0.446 100.34 0.519 0.061 6 0.348 10
See the text for a detailed description of each parameter given in the table.a PA stands for particle arrangement.
2158 SOLOUKHIN, BROKKEN-ZIJP, AND DE WITH
Journal of Polymer Science: Part B: Polymer PhysicsDOI 10.1002/polb

trolled whether the sum of all possible contacts is a unity(eq 16) at any cpp and cpi combination. Moreover for thelog r � p curves, calculated for the data correspondingto the MPS/ATO ratio equal 0.04, rcalcp¼0:01 had to be equalor more than rexpp¼0:01 of the coating with the MPS/ATOratio equal to 0.08. For the log re � p curves calculatedfor the data corresponding to the MPS/ATO ratio equal0.09, 0.17, and 0.34, rcalcp¼0:04 had to be lower than 10�10 S/cm. If any of the above indicated boundary conditionswas not met, then the calculation with the correspond-ing Ka, cpp and cpi values was terminated.
Additionally, for every combination of Ka, cpp, and cpivalues corresponding to the lowest squared differencesum of value of S, log re � p dependencies were calcu-lated for b ranging from zero to one with a step Db ¼ 0.1.This was done to see whether the preliminary selected b(b ¼ 0.9), indeed, provides the best fit. The quality of the
fit was judged using S, which was computed for every b.It appeared that b � 0.8 provided the best fittings for theobtained Ka, cpp, and cpi values. The S versus b depend-encies found for the SC, BCC, and FCC like particlearrangements are depicted in Figure A2. Looking atthese data, one can conclude that our choice for b ¼ 0.9 isa justified one (see earlier text).
REFERENCES AND NOTES
1. Skotheim, T.; Elsenbauer, R. L.; Reynolds, J. R. Hand-book of conducting polymers; Marcel Dekker: Basel,1999.
2. Nalwa, S. Handbook of Advanced Electronic andPhotonic Materials; Academic Press: London, 2001.
3. Chandrasekdar, P. Conducting Polymers: Funda-mentals and Applications, A practical approach;Kluwer: Dordrecht, 1999.
4. Gul, V. E. Structure and Properties of ConductingPolymer Composites; VSP: Utrecht, 1996.
5. Medalia, A. Rubber Chem Tech 1985, 59, 433.6. Sichel, K. Carbon Black Polymer Composites;Marcel
Dekker: New York, 1982.7. Donnet, J. B.; Bansal, R. C.; Wang, M. J. Carbon
Black Science and Technology; Marcel Dekker: NewYork, 1993.
8. Rubin, Z.; Sunshine, S. A.; Heaney, M. B.; Bloom, I.;Balberg, I. Phys Rev B 1999, 59, 12190–12199.
9. Dishovsky, N.; Grigorova, M. Mater Res Bull 2000,35, 403–409.
10. Wisniewski, G. SynthMetals 2000, 109, 295–299.11. Vilıcakova, J.; Saha, P.; Kresalek, V.; Quadrat, O.
SynthMetals 2000, 113, 83–87.12. Novak, I.; Krupa, I.; Chodak, I. Eur Polym Mater
2003, 39, 585–592.
Figure A1. Standard deviation S computed for a FCClike particle arrangement with cpp ranging from 0 to0.50 and cpi ranging from 0.16 to 0.50 with a step of 0.01(a). The self-arrangement constant Ka equaled to thatrepresenting the smallest S for each combination of cppand cpi. In a zoomed region (b) the minimal S at cpp¼ 0.32 and cpi ¼ 0.19 can be seen.
Figure A2. Standard deviations S calculated for dif-ferent b for three types of particle arrangements.
CONDUCTIVE ATO-ACRYLATE COATINGS 2159
Journal of Polymer Science: Part B: Polymer PhysicsDOI 10.1002/polb

13. Vilıcakova, J.; Saha, P.; Quadrat, O. Eur PolymMater 2002, 38, 2343–2347.
14. Taipalus, R.; Harmia, T.; Zhang, M. Q.; Friedrich, K.Composites Sci Tech 2001, 61, 801–814.
15. Chiteme, C.; Mclachlan, D. S. Physica B 2000, 279,60–71.
16. El-Tantawy, F.; Kamada, K.; Ohnabe, H. Mater Lett2002, 56, 112–126.
17. Balberg, I. Carbon 2002, 40, 139–143.18. Brokken-Zijp, J.; Soloukhin, V. A.; Posthumus, W.;
de With, G. Athens Conference on Coatings Scienceand Technology, Conference proceedings 29, Athens,Greece, July 2003, pp 49–69.
19. Zheng, W.; Wong, S. C. Composites Sci Tech 2003,63, 225–235.
20. Xiao, M.; Sun, L.; Liu, J.; Li, Y.; Gong, K. Polymer2002, 43, 2245–2248.
21. Hussain, S.; Barbariol, I.; Roitti, S.; Sbaizero, O. J.Eur Ceram Soc 2003, 23, 315–321.
22. Mamunya, Y. P.; Davydenko, V. V.; Pissis, P.; Lebe-dev, E. V. Eur PolymMater 2002, 38, 1887–1897.
23. Thommerel, E.; Valmalette, J. C.; Musso, J.; Villain,S.; Gavarri, J. R.; Spada, D. Mater Sci Eng A 2002,328, 67–79.
24. Ahmed, S. M.; Patil, R. C.; Nakayama, M.; Ogura,K. SynthMet 2000, 114, 155–160.
25. Jia, W.; Tchoudakov, R.; Segal, E.; Joseph, R.;Narkis, M.; Siegmann, A. Synth Metals 2003,132, 269–278.
26. Encyclopedia of Polymer Science and Technology;Wiley: New York, 2003.
27. Landauer, R. Electrical conductivity in inhomogene-ous media, in American Institute of Physics Confer-ence Proceedings, Electrical transport and opticalproperties of inhomogeneous media, No. 40; Gar-land J. C., Tanner D. B., Eds.; American Institute ofPhysics: New York, 1978; pp 2–45.
28. Zallen, R. The physics of amorphous solids; Wiley:New York, 1983; Chapter 4.
29. Stauffer, D. Introduction to Percolation Theory; Tay-lor & Francis: London, 1985.
30. Bruggeman,D.A.G.AnnPhysik (Leipzig) 1935, 24, 636.31. Landauer, R. J Appl Phys 1952, 23, 779.32. McLachlan, D. S.; Blaszkievicz, M.; Newnham, R. E.
J Am Ceram Soc 1990, 73, 2187–2203.33. Roldughin, V. I.; Vysotskii, V. V. Prog Org Coat 2000,
39, 81–100.34. Posthumus, W.; Magusin, P. C. M. M.; Brokken-Zijp,
J. C. M.; Tinnemans, A. H. A.; Van der Linde, R.J Colloid Interface Sci 2004, 269, 109–116.
35. Low Level Measurements, 4th ed.; Keithley Instru-ments, Inc.: Cleveland, OH, 1992.
36. ASTM standard D 991–89.37. Stroud, D. Superlattices Microstruct 1998, 23, 567–
573.38. Mikrajuddin, A.; Shi, F. G.; Chungpaiboonpatana,
S.; Okuyama, K.; Davidson, C.; Adams, J. M. MaterSci Semicond Proc 1999, 2, 309–319.
39. Kirkpatrick, S. Phys Rev Lett 1971, 27, 1722–1725.40. Brom, H. B.; Michels, M. A. J. Phil Mag B 2001, 81,
941–954.41. Godovsky, D. Y. Electron behaviour and magnetic
properties of polymer-nanocomposites in Advancesin Polymer Science: Thermal and Electrical Conduc-tivity of Polymer Materials; Godovsky, Y. K.; Pri-valko, V. P., Eds.; Springer: Berlin, 1995; pp 79–122.
42. (a) Van der Putten, D.; Moonen, J. T.; Brom, H. B.;Brokken-Zijp, J. C. M.; Michels, M. A. J. Phys RevLett 1992, 69, 494–497; (b) Adriaanse, L. J.; Reedijk,J. A.; Teunissen, P. A. A.; Brom, H. B.; Michels, M.A. J.; Brokken-Zijp J. C. M. Phys Rev Lett 1997, 78,1755–1758; (c) Brom, H. B.; Adriaanse, L. J.; Teunis-sen, Reedijk, J. A.; Michels, M. A. J.; Brokken-Zijp,J. C. M. SynthMet 1997, 84, 929–930.
43. Van Bommel, M. J.; Groen, W. A.; Van Hal, H. A. M.;Keur, W. C.; Bernards, T. N. M. J Mater Sci 1999,34, 4803–4809.
44. (a) Chen, Z.; Brokken-Zijp, J. C. M.; Michels, M. A.J. J Polym Sci B 2006, 44, 33–47; (b) Chen, Z.;Brokken-Zijp, J. C. M.; Huinink, H. P.; Loos, J.; deWith G.; Michels, M. A. J. Macromolecules 2006, 39,6115–6124.
45. Chopra, K. L.; Major, S.; Pandya, D. K. Thin SolidFilms 1983, 102, 1–46.
46. Posthumus, W. PhD. Thesis, Technical UniversityEindhoven, 2004.
47. Huijbregts, L.J.; Brom, H. B.; Brokken-Zijp, J. C.M.; Kemerink, M.; Chen, Z.; de Goeje, M. P.; Yuan,M. J Phys Chem, B 2006, 110, 23115.
48. (a) Karasek L.; Sumita, L. J. J Mater Sci 1996, 31,281–289; (b) Sumita, M.; Sakata, K.; Asai, S.; Miya-saka, K.; Nagagawa, H. Polym Bull 1991, 25, 265–271; (c) Sumita, M.; Abe, H.; Kayaki, H.; Miyasaka,K. J. Macromol Sci Phys 1986, B25, 171.
49. Levon, K.; Margolina, A.; Patashinsky, A. Z. Macro-molecules 1993, 26, 4061–4063.
50. Wessling, B. SyntheticMetals 1991, 41–43, 1057–1062.51. Grunlan, J. C.; Gerberich, W. W.; Francis, L. F.
J. Appl Polym Sci 2001, 80, 692–705.52. Narkis, M.; Lidor, G.; Vaxman, A.; Zuri, L. IEEE
Trans Elect PackagManuf 2000, 23, 239–245.
2160 SOLOUKHIN, BROKKEN-ZIJP, AND DE WITH
Journal of Polymer Science: Part B: Polymer PhysicsDOI 10.1002/polb


![Nanocomposite polymer electrolyte for rechargeable magnesium batteries · batteries in which a stable, but Li + conductive SEI is formed [32]. To date, functional electrolytes for](https://img.dokumen.tips/doc/110x75/5fd5d4a5ea33333dc711f93c/nanocomposite-polymer-electrolyte-for-rechargeable-magnesium-batteries-batteries.jpg)