Embed Size (px)
Citation preview

14.3Conditional Probability and Intersections of EventsObjectives1. Understand how to compute conditional probability.2. Calculate the probability of the intersection of two events.3. Use probability trees to compute conditional probabilities.4. Understand the difference between dependent and independent events.
You know how to compute the probability of complements and unions of events. We willnow show you how to find the probability of intersections of events, but first you need tounderstand how the occurrence of one event can affect the probability of another event.
Conditional ProbabilitySuppose that you and your friend Marcus cannot agree as to which video to rent and youdecide to settle the matter by rolling a pair of dice. You will each pick a number and thenroll the dice. The person whose total showing on the dice comes up first gets to pick the
KEY POINT
Conditional probability takesinto account that one eventoccurring may change theprobability of a second event.
Copyright © 2010 Pearson Education, Inc.
CHAPTER 14 y Probability682
video. With your knowledge of probability, you know that the number you should pick is 7because it has the highest probability of appearing, namely .
To illustrate the idea of conditional probability, let’s now change this situation slightly.Assume that your friend Janelle will roll the dice before you and Marcus pick your num-bers. You are not allowed to see the dice, but Janelle will tell you something about the diceand then you will choose your number before looking at the dice.
Suppose that Janelle tells you that the total showing is an even number. Would you stillchoose a 7? Of course not, because once you know the condition that the total is even, younow know that the probability of having a 7 is 0. A good way to think of this is that onceyou know that the total is even, you must exclude all pairs from the sample space such as(1, 4), (5, 6), and (4, 3) that give odd totals.
In a similar way, suppose that you draw a card from a standard 52-card deck, put thatcard in your pocket, and then draw a second card. What is the probability that the secondcard is a king? How you answer this question depends on knowing what card is in yourpocket. If the card in your pocket is a king, then there are three kings remaining in the
51 cards that are left, so the probability is . If the card in your pocket is not a king, then3
51
16
the probability of the second card being a king is . Why? This discussion leads us to the
formal definition of conditional probability.
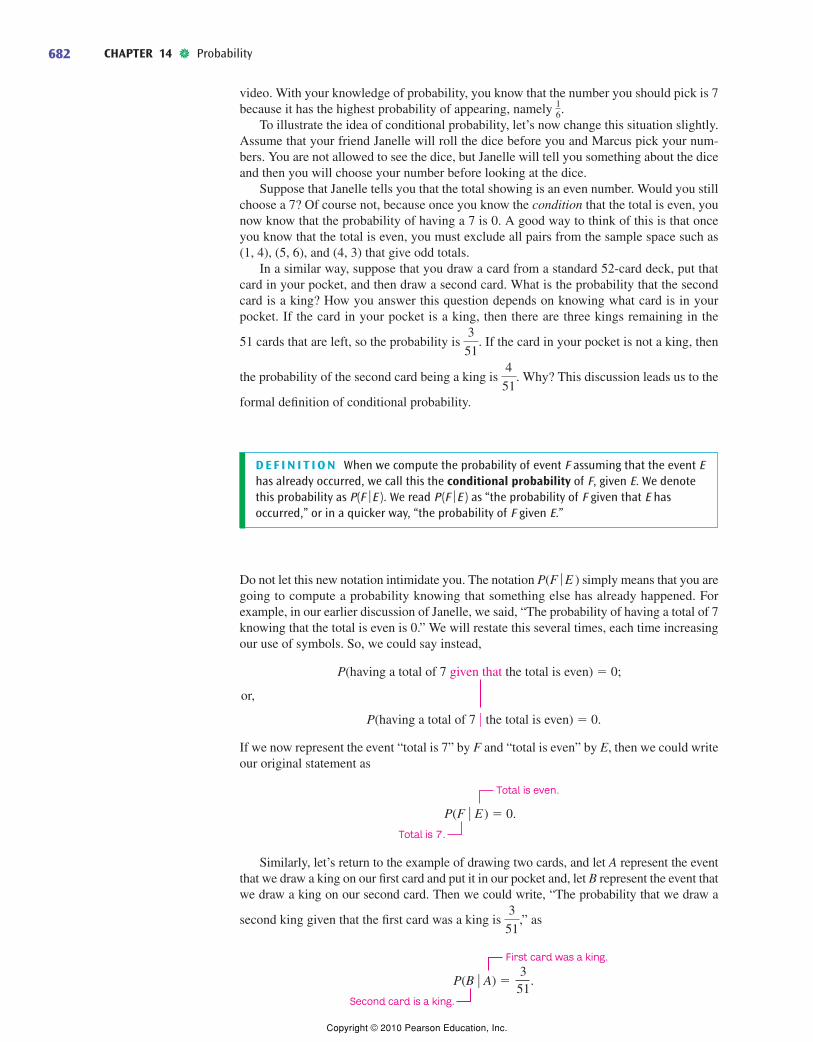
D E F I N I T I O N When we compute the probability of event F assuming that the event Ehas already occurred, we call this the conditional probability of F, given E. We denotethis probability as P(F E ). We read P(F E ) as “the probability of F given that E hasoccurred,” or in a quicker way, “the probability of F given E.”
Do not let this new notation intimidate you. The notation P(F E ) simply means that you aregoing to compute a probability knowing that something else has already happened. Forexample, in our earlier discussion of Janelle, we said, “The probability of having a total of 7knowing that the total is even is 0.” We will restate this several times, each time increasingour use of symbols. So, we could say instead,
If we now represent the event “total is 7” by F and “total is even” by E, then we could writeour original statement as
Similarly, let’s return to the example of drawing two cards, and let A represent the eventthat we draw a king on our first card and put it in our pocket and, let B represent the event thatwe draw a king on our second card. Then we could write, “The probability that we draw a
second king given that the first card was a king is ,” as
351
P(B � A) � .
First card was a king.
Second card is a king.
3
51
P(F � E ) � 0.
Total is even.
Total is 7.
P(having a total of 7 given that the total is even) � 0;
or,
P(having a total of 7 � the total is even) � 0.
ƒ
ƒƒ
4
51
Copyright © 2010 Pearson Education, Inc.

14.3 y Conditional Probability and Intersections of Events
The Venn diagram in Figure 14.12will help you remember how to com-pute conditional probability.
We drew E with a heavy line inFigure 14.12 to emphasize that whenwe assume that E has occurred, we canthen think of the outcomes outside of Eas being discarded from the discussion.In computing conditional probability,you will find it useful to consider thesample space to be E and the event asbeing E ¨ F, rather than F. We will firststate a special rule for computing con-ditional probability when the outcomesare equally likely (all have the sameprobability of occurring). We will statethe more general conditional proba-bility rule later.
S P E C I A L R U L E F O R C O M P U T I N G P ( F E ) B Y C O U N T I N G If E and F are
events in a sample space with equally likely outcomes, then .
EXAMPLE 1 Computing Conditional Probability by CountingAssume that we roll two dice and the total showing is greater than nine. What is the prob-ability that the total is odd?
SOLUTION: This sample space has 36 equally likely outcomes. We will let G be the event“we roll a total greater than nine” and let O be the event “the total is odd.” Therefore,
G = {(4, 6), (5, 5), (5, 6), (6, 4), (6, 5), (6, 6)}.
The set O consists of all pairs that give an odd total. Figure 14.13 shows you how to use thespecial rule for computing conditional probability to find P(O G).ƒ
P(F ƒ E ) =n(E ¨ F )
n(E )
ƒ
S
E F
We want the probability of theintersection outcomes, knowingthat we’re interested in onlyoutcomes for set E.
FIGURE 14.12 To compute the probability of Fgiven E, we compare the outcomes in E ¨ F with theoutcomes in E.
STotal greater
than 9Odd total
O � G
G O
(5, 6)
(6, 5)
(5, 5)
(6, 4)
(4, 6)
(6, 6)
FIGURE 14.13 To compute P(O G), we comparethe number of outcomes in O ¨ G with the numberof outcomes in G.
ƒ
Therefore,
Notice how the probability of rolling an odd total has changed from to when we know
that the total showing is greater than nine.
Now try Exercises 5 to 22. ]
1
3
1
2
P(O ƒ G) =n(O ¨ G)
n(G)=
2
6=
1
3.
683
Copyright © 2010 Pearson Education, Inc.

CHAPTER 14 y Probability684
PROBLEM SOLVING
The Order PrincipleAs we have emphasized often, the order in which we do things is important in mathematics.In Example 1, P(O G) does not mean the same thing as P(G O). To understand the differ-ence, state what P(G O) represents and then compute P(G O).
It is important to remember that the special rule for computing conditional probabilityonly works when the outcomes in the sample space are equally likely. Sometimes you maybe solving a problem where that is not the case; or, you may have a situation where it is notpossible to count the outcomes. In such cases, we need a rule for computing P(F E ) that isbased on probability rather than counting.
G E N E R A L R U L E F O R C O M P U T I N G P ( F E ) If E and F are events in a sample
space, then .
We still can use Figure 14.12 to remember this rule; however, now instead of compar-ing the number of outcomes in E ¨ F with the number of outcomes in E, we compare theprobability of E ¨ F with the probability of E.
EXAMPLE 2 Using the General Rule for Computing Conditional Probability
The state bureau of labor statistics conducted a survey of college graduates comparingstarting salaries to majors. The survey results are listed in Table 14.6.
P(F ƒ E ) =P (E ¨ F )
P (E )
ƒ
ƒ
ƒƒƒƒ
If we select a graduate who was offered between $40,001 and $45,000, what is theprobability that the student has a degree in the health fields?
SOLUTION: Each entry in Table 14.6 is the probability of an event. For example, the 8%that we highlighted is the probability of selecting a graduate in technology who earnsbetween $40,001 and $45,000, inclusive. The 14% that we highlighted tells us the proba-bility of selecting a graduate who majored in the health fields.
Let R be the event “the graduate received a starting salary between $40,001 and$45,000” and H be the event “the student has a degree in the health fields.” It is important indoing this problem that you identify clearly what you are given and what you must find. Weare given R and must find the probability of H, so we want to find P(H R), not P(R H).
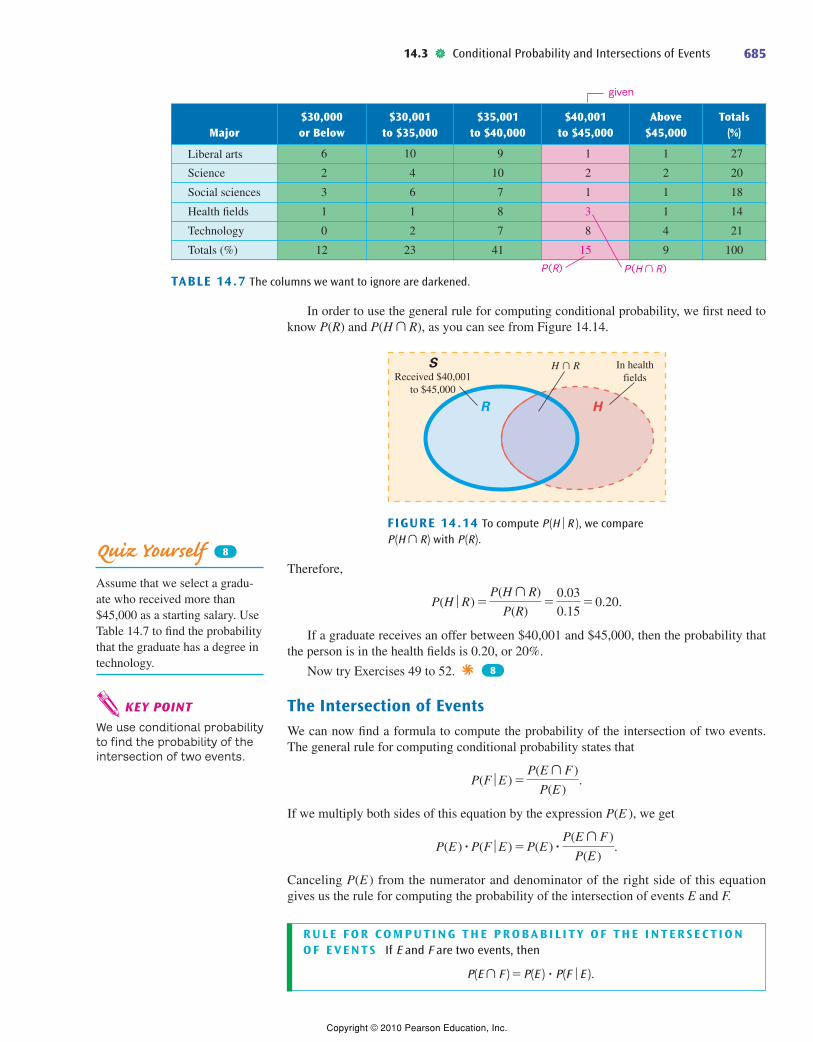
Because we want the probability of H given R, we can, in effect, ignore all the out-comes that do not correspond to a starting salary of $40,001 to $45,000. We darken thecolumns we want to ignore in Table 14.7.
ƒƒ
Major$30,000
and Below$30,001
to $35,000$35,001
to $40,000$40,001
to $45,000Above
$45,000Totals
(%)
Liberal arts 6* 10 9 1 1 27
Science 2 4 10 2 2 20
Social sciences 3 6 7 1 1 18
Health fields 1 1 8 3 1 14
Technology 0 2 7 8 4 21
Totals (%) 12 23 41 15 9 100
TABLE 14.6 Survey comparing starting salaries to major in college.
*These numbers are percentages.
Copyright © 2010 Pearson Education, Inc.
14.3 y Conditional Probability and Intersections of Events
Major$30,000 or Below
$30,001 to $35,000
$35,001 to $40,000
$40,001 to $45,000
Above $45,000
Totals (%)
Liberal arts 6 10 9 1 1 27
Science 2 4 10 2 2 20
Social sciences 3 6 7 1 1 18
Health fields 1 1 8 3 1 14
Technology 0 2 7 8 4 21
Totals (%) 12 23 41 15 9 100
TABLE 14.7 The columns we want to ignore are darkened.
given
P(R) P(H ¨ R)
SReceived $40,001
to $45,000
In healthfields
H � R
R H
FIGURE 14.14 To compute P(H R ), we compare P(H ¨ R) with P(R).
ƒ
Therefore,
If a graduate receives an offer between $40,001 and $45,000, then the probability thatthe person is in the health fields is 0.20, or 20%.
Now try Exercises 49 to 52. ]
The Intersection of EventsWe can now find a formula to compute the probability of the intersection of two events.The general rule for computing conditional probability states that
If we multiply both sides of this equation by the expression P(E ), we get
Canceling P(E ) from the numerator and denominator of the right side of this equationgives us the rule for computing the probability of the intersection of events E and F.
R U L E F O R C O M P U T I N G T H E P R O B A B I L I T Y O F T H E I N T E R S E C T I O NO F E V E N T S If E and F are two events, then
P(E ¨ F ) = P(E ) · P(F E ).ƒ
P(E ) # P(F ƒ E) = P(E ) # P(E ¨ F)
P(E ).
P(F ƒ E) =P(E ¨ F)
P(E ).
8
P(H ƒ R) =P(H ¨ R)
P(R)=
0.03
0.15= 0.20.
KEY POINT
We use conditional probabilityto find the probability of theintersection of two events.
Quiz Yourself
Assume that we select a gradu-ate who received more than$45,000 as a starting salary. UseTable 14.7 to find the probabilitythat the graduate has a degree intechnology.
8
685
In order to use the general rule for computing conditional probability, we first need toknow P(R) and P(H ¨ R), as you can see from Figure 14.14.
Copyright © 2010 Pearson Education, Inc.
KEY POINT
Trees help you visualizeprobability computations.
›
Quiz Yourself
Suppose that we draw 2 cardswithout replacement from astandard 52-card deck. What isthe probability that both cardsare face cards?
9
CHAPTER 14 y Probability686
This rule says that to find the probability of P(E ¨ F), you first find the probability of Eand then multiply it by the probability of F, assuming that E has occurred.
EXAMPLE 3 Estimating Your Grade in a ClassAssume that for your literature final your professor has written questions on 10 assignedreadings on cards and you are to randomly select two cards and write an essay on them. Ifyou have read 8 of the 10 readings, what is your probability of getting two questions thatyou can answer? (We will assume that if you’ve done a reading, then you can answer thequestion about that reading; otherwise, you can’t answer the question.)
SOLUTION: We can think of this event as the intersection of two events A and B where
A is “you can answer the first question;”
B is “you can answer the second question.”
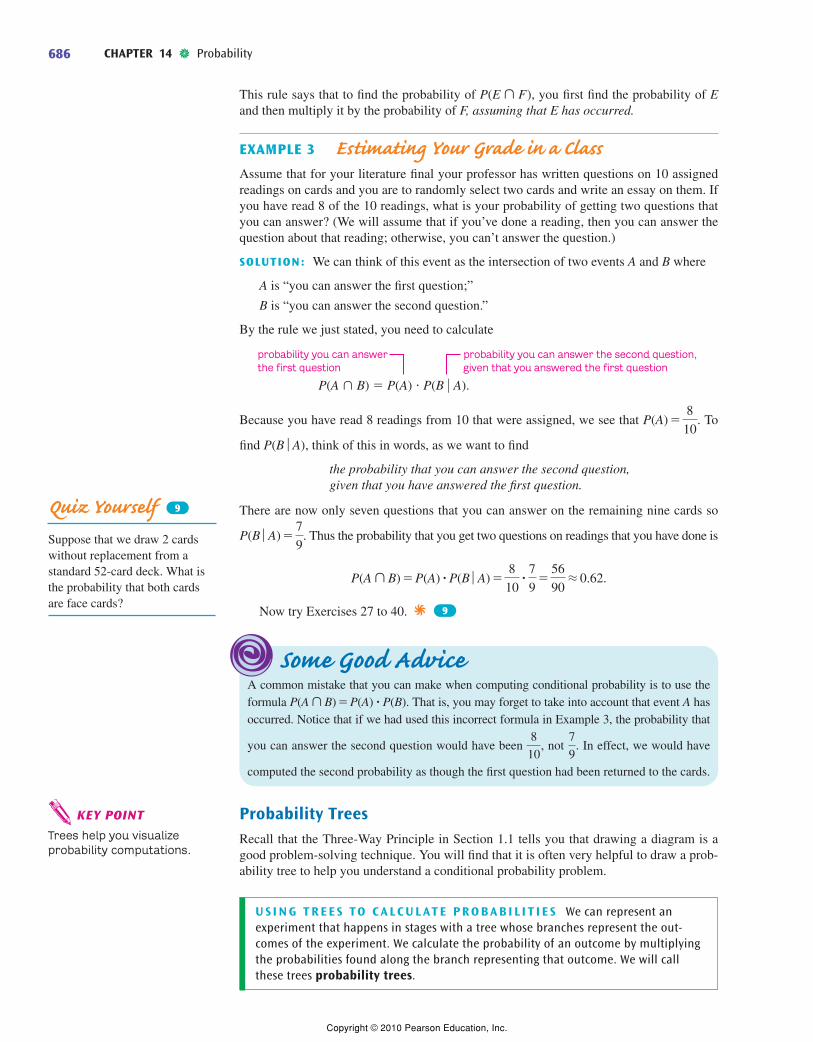
By the rule we just stated, you need to calculate
Because you have read 8 readings from 10 that were assigned, we see that . To
find , think of this in words, as we want to find
the probability that you can answer the second question,given that you have answered the first question.
There are now only seven questions that you can answer on the remaining nine cards so
. Thus the probability that you get two questions on readings that you have done is
Now try Exercises 27 to 40. ]
Some Good AdviceA common mistake that you can make when computing conditional probability is to use theformula P(A ¨ B) = P(A) · P(B). That is, you may forget to take into account that event A hasoccurred. Notice that if we had used this incorrect formula in Example 3, the probability that
you can answer the second question would have been , not . In effect, we would have
computed the second probability as though the first question had been returned to the cards.
Probability TreesRecall that the Three-Way Principle in Section 1.1 tells you that drawing a diagram is agood problem-solving technique. You will find that it is often very helpful to draw a prob-ability tree to help you understand a conditional probability problem.
U S I N G T R E E S TO C A L C U L AT E P R O B A B I L I T I E S We can represent anexperiment that happens in stages with a tree whose branches represent the out-comes of the experiment. We calculate the probability of an outcome by multiplyingthe probabilities found along the branch representing that outcome. We will callthese trees probability trees.
7
9
8
10
9
P(A ¨ B) = P(A) # P(B ƒ A) =8
10# 7
9=
56
90L 0.62.
P(B ƒ A) =7
9
P(B ƒ A)
P(A) =8
10
P(A � B) � P(A) � P(B � A).
probability you can answer the second question, given that you answered the first question
probability you can answer the first question
Copyright © 2010 Pearson Education, Inc.
14.3 y Conditional Probability and Intersections of Events
In order to show you how to use trees to visualize conditional probabilities, we willlook at the situation in Example 3 again.
EXAMPLE 4 Using a Tree to Compute ProbabilitiesRecall that you are taking an exam and will pick two questions. Eight of the 10 questionsare on readings that you have done and 2 are on readings you have not done. What is theprobability that you will get questions on two readings that you have not done? (We willassume that if you’ve done a reading, then you can answer the question about that reading;otherwise, you can’t answer the question.)
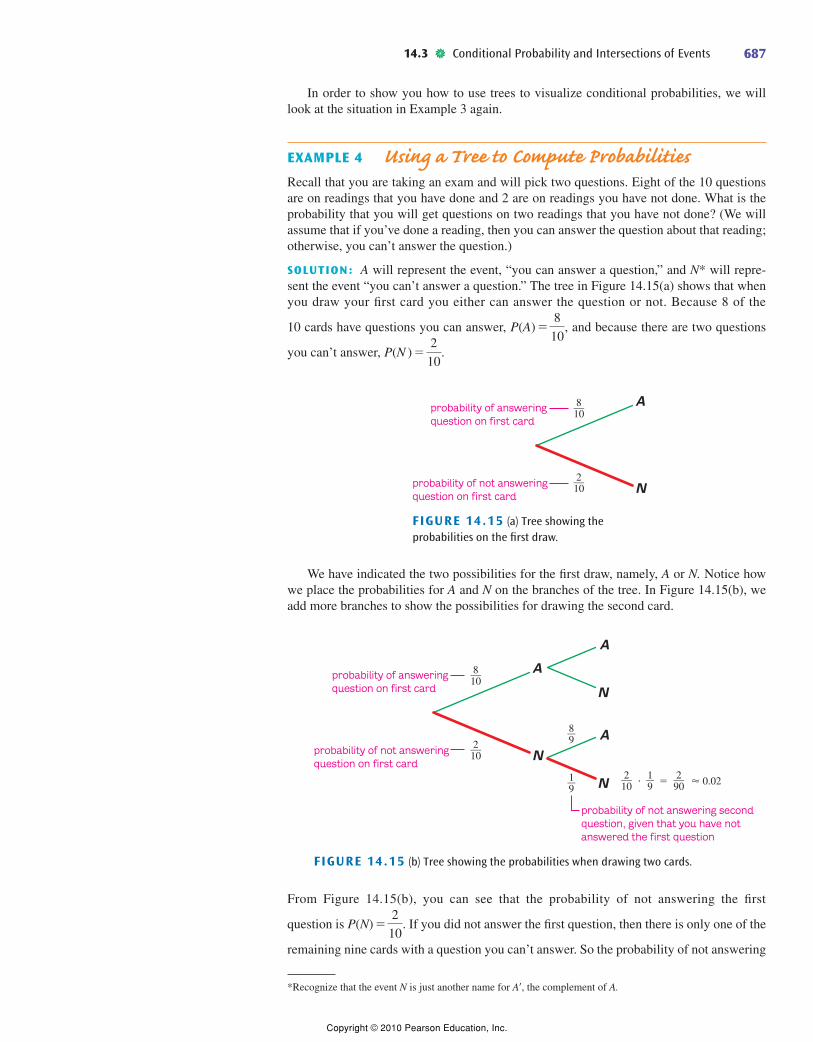
SOLUTION: A will represent the event, “you can answer a question,” and N* will repre-sent the event “you can’t answer a question.” The tree in Figure 14.15(a) shows that whenyou draw your first card you either can answer the question or not. Because 8 of the
10 cards have questions you can answer, , and because there are two questions
you can’t answer, .P(N ) =2
10
P(A) =8
10
probability of answeringquestion on first card
A
Nprobability of not answeringquestion on first card
8––10
2––10
FIGURE 14.15 (a) Tree showing theprobabilities on the first draw.
*Recognize that the event N is just another name for A¿, the complement of A.
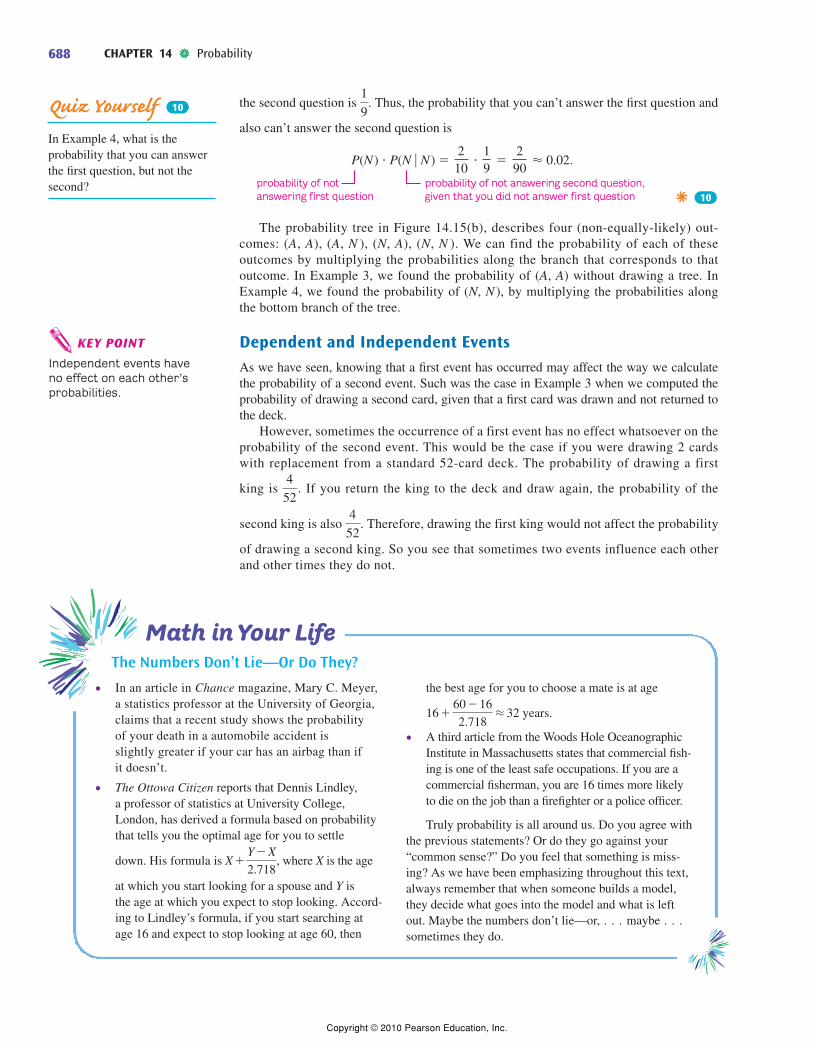
We have indicated the two possibilities for the first draw, namely, A or N. Notice howwe place the probabilities for A and N on the branches of the tree. In Figure 14.15(b), weadd more branches to show the possibilities for drawing the second card.
probability of answeringquestion on first card
A
A
N
N
A
N
probability of not answeringquestion on first card
probability of not answering secondquestion, given that you have notanswered the first question
� � � 0.02
8––10
2––10
1––9
8––9
2––10
2––90
1––9
FIGURE 14.15 (b) Tree showing the probabilities when drawing two cards.
From Figure 14.15(b), you can see that the probability of not answering the first
question is . If you did not answer the first question, then there is only one of the
remaining nine cards with a question you can’t answer. So the probability of not answering
P(N) =2
10
687
Copyright © 2010 Pearson Education, Inc.
CHAPTER 14 y Probability688
the second question is . Thus, the probability that you can’t answer the first question and
also can’t answer the second question is
]
The probability tree in Figure 14.15(b), describes four (non-equally-likely) out-comes: (A, A), (A, N ), (N, A), (N, N ). We can find the probability of each of theseoutcomes by multiplying the probabilities along the branch that corresponds to thatoutcome. In Example 3, we found the probability of (A, A) without drawing a tree. InExample 4, we found the probability of (N, N ), by multiplying the probabilities alongthe bottom branch of the tree.
Dependent and Independent EventsAs we have seen, knowing that a first event has occurred may affect the way we calculatethe probability of a second event. Such was the case in Example 3 when we computed theprobability of drawing a second card, given that a first card was drawn and not returned tothe deck.
However, sometimes the occurrence of a first event has no effect whatsoever on theprobability of the second event. This would be the case if you were drawing 2 cardswith replacement from a standard 52-card deck. The probability of drawing a first
king is . If you return the king to the deck and draw again, the probability of the4
52
10
210
290
19
P(N ) � P(N � N ) � � � � 0.02.
probability of notanswering first question
probability of not answering second question,given that you did not answer first question
1
9
KEY POINT
Independent events haveno effect on each other’sprobabilities.
Math in Your Life
• In an article in Chance magazine, Mary C. Meyer,a statistics professor at the University of Georgia,claims that a recent study shows the probabilityof your death in a automobile accident isslightly greater if your car has an airbag than ifit doesn’t.
• The Ottowa Citizen reports that Dennis Lindley,a professor of statistics at University College,London, has derived a formula based on probabilitythat tells you the optimal age for you to settle
down. His formula is , where X is the age
at which you start looking for a spouse and Y isthe age at which you expect to stop looking. Accord-ing to Lindley’s formula, if you start searching atage 16 and expect to stop looking at age 60, then
X +Y - X
2.718
the best age for you to choose a mate is at age
.
• A third article from the Woods Hole OceanographicInstitute in Massachusetts states that commercial fish-ing is one of the least safe occupations. If you are acommercial fisherman, you are 16 times more likelyto die on the job than a firefighter or a police officer.
Truly probability is all around us. Do you agree withthe previous statements? Or do they go against your“common sense?” Do you feel that something is miss-ing? As we have been emphasizing throughout this text,always remember that when someone builds a model,they decide what goes into the model and what is leftout. Maybe the numbers don’t lie—or, . . . maybe . . .sometimes they do.
16 +60 - 16
2.718L 32 years
The Numbers Don’t Lie—Or Do They?
second king is also . Therefore, drawing the first king would not affect the probability
of drawing a second king. So you see that sometimes two events influence each otherand other times they do not.
4
52
Quiz Yourself
In Example 4, what is theprobability that you can answerthe first question, but not thesecond?
10
Copyright © 2010 Pearson Education, Inc.
Quiz Yourself
The situation is the same as inExample 5. Are the events F,“a five shows on the red die,”and O, “an odd total showson the dice,” dependent orindependent?
11
14.3 y Conditional Probability and Intersections of Events
D E F I N I T I O N S Events E and F are independent events if
P (F E ) = P(F ).
If P (F E ) Z P(F ), then E and F are dependent.
This definition says that if E and F are independent, then knowing that E has occurred doesnot influence the way we compute the probability of F.
PROBLEM SOLVING
The Analogies PrincipleRecall that the Analogies Principle in Section 1.1 tells you that mathematical terminol-ogy, symbolism, and its equations are often based on real-life ideas. Although at times itmay seem difficult, if you work hard to make the connection between the intuitive ideasand the mathematical formalism, you will be rewarded by your increased understandingof mathematics. If you understand how the everyday usage of the terms independent anddependent corresponds to their mathematical definitions, it will help you remember theirmeaning.
EXAMPLE 5 Determining Whether Events Are Independent or Dependent
Assume we roll a red and a green die. Are the events F, “a five shows on the red die,” and G,“the total showing on the dice is greater than 10,” independent or dependent?
SOLUTION: To answer this question, we must determine whether P(G F ) and P(G) arethe same or different. There are three outcomes—(5, 6), (6, 5), and (6, 6)—that give a total
greater than 10, so .P(G) =3
36=
1
12
ƒ
ƒ
ƒ
689
Now,
F = {(5, 1), (5, 2), (5, 3), (5, 4), (5, 5), (5, 6)}
and
G ¨ F = {(5, 6)},
so
Because P(G F ) Z P(G), the events are dependent.
Now try Exercises 45 to 48. ]
EXAMPLE 6 Selecting a Dormitory RoomBrianna is taking part in a lottery for a room in one of the new dormitories at her college.She is guaranteed a space, but she will have to draw a card randomly to determine exactlywhich room she will have. Each card has the name of one dormitory, X, Y, or Z, and alsohas a two-person room number or an apartment number. Thirty percent of the availablespaces are in X, 50% in Y, and 20% of the spaces are in Z.
11
ƒ
P(G ƒ F ) =P(G ¨ F)
P(F )=
1/36
6/36=
1
6.
Copyright © 2010 Pearson Education, Inc.

CHAPTER 14 y Probability690
FIGURE 14.16 Probability tree for Brianna’s room assignment.
P(Z)P(Apartment | Z)P(Apartment | Z)
P(Z)
X
0.30
0.50
0.20
0.50
0.50 Apartment (0.30)(0.50) � 0.15
Room (0.30)(0.50) � 0.15
Y
0.40
0.60 Apartment (0.50)(0.60) � 0.30
Room (0.50)(0.40) � 0.20
Z
0.30
0.70 Apartment (0.20)(0.70) � 0.14
Room (0.20)(0.30) � 0.06
Half of the available spaces in X are in rooms, 40% of Y’s spaces are in rooms, and 30%of the spaces in Z are in rooms.
a) Draw a probability tree to describe this situation.
b) Given that Brianna selects a card for dormitory Y, what is the probability that she willbe assigned to an apartment?
c) What is the probability that Brianna will be assigned an apartment in one of the threedormitories?
SOLUTION:
a) In drawing the tree, we will think of Brianna’s assignment happening in two stages. First,she is assigned a dormitory, and then she is assigned either a room or an apartment. Weshow the tree in Figure 14.16, which begins with three branches corresponding to thedormitories X, Y, and Z. Each of these three branches has two further branches represent-ing the assignment of either a room or an apartment.
We wrote various probabilities along the tree’s branches in Figure 14.16. If youlook carefully at the lower branch, you see that the 0.20 is the probability that Briannawill be assigned to dormitory Z; thus, P(Z ) = 0.20. The 0.70 is a conditional prob-ability. Assuming the condition that she is assigned to dormitory Z, then there is a0.70 chance that she will be assigned to an apartment. Symbolically, this means thatP(Apartment Z ) = 0.70.ƒ
*It may seem that we have gotten away from thinking of events as subsets of the sample space, but we have not.The “Z” represents the set of cards that have dormitory Z written on them, and “Apartment” represents the set ofall cards that have apartment written on them.
The product (0.20)(0.70) = 0.14 is the probability that Brianna will be assigned todormitory Z and also to an apartment.* We could have written this numeric equationmore formally as
P(Z ¨ Apartment) = P(Z) · P(Apartment Z ),
which is the formula we gave you for computing the probability of the intersection oftwo events. In Quiz Yourself 12, we will ask you to interpret some more of theseprobabilities.
b) We can answer this question easily by looking at the branch that is highlighted in red inFigure 14.16. That branch shows that after Brianna has been assigned to dormitory Y,there is then a 0.60 chance that she will get an apartment. That is, P(Apartment Y ) = 0.60.ƒ
ƒ
Copyright © 2010 Pearson Education, Inc.

Quiz Yourself
a) Explain the meaning of the0.30 on the top branch of thetree in Figure 14.16.
b) What is the probability thatBrianna will be assigned a room,given that she is assigned todormitory Y ?
12
14.3 y Conditional Probability and Intersections of Events
*This example is based on an article that can be found at www.intuitor.com/statistics/BadTestResults.html.
c) Realize that if Brianna is assigned to anapartment, then she is in exactly one of dor-mitories X, Y, or Z. Figure 14.17 shows howto find the probability that she is assigned anapartment.
From Figure 14.17, we see that the event“Brianna is assigned an apartment” is theunion of three mutually disjoint subevents withprobabilities 0.15, 0.30, and 0.14. Therefore,the probability that Brianna is assigned anapartment is 0.15 + 0.30 + 0.14 = 0.59.
Now try Exercises 57 to 60. ]
We will now return to the issue of drug testing that we mentioned in the chapter opener.
EXAMPLE 7 Drug Testing*Assume that you are working for a company that has a mandatory drug testing policy. It isestimated that 2% of the employees use a certain drug, and the company is giving a testthat is 99% accurate in identifying users of this drug. What is the probability that if anemployee is identified by this test as a drug user, the person is innocent?
SOLUTION: Let D be the event “the person is a drug user” and let T be the event “the per-son tests positive for the drug.” We are asking, then, “if we are given that the person testspositive, what is the probability that the person does not use the drug?” Realize that thecomplement of D, namely D¿, is the event “the person does not use the drug.” So, we areasking for the conditional probability
The probability tree in Figure 14.18 will give you some insight into this problem.
Person does not use drug given that person tests positive.P(D� � T ).
12
In Y0.30
In Z0.14
In X0.15
Brianna is assigned an apartment.S
FIGURE 14.17 Probabilities thatBrianna is assigned an apartment indormitories X, Y, or Z.
Recall that . Branches 1 and 3 in Figure 14.18 correspond to the
drug test being positive. This means that P(T ) = (0.02)(0.99) + (0.98)(0.01). The event D¿ ¨ T corresponds to branch 3. Therefore, P(D¿ ¨ T) = (0.98)(0.01). From this, we seethat the probability that an innocent person will test positive for the drug is
In other words, if a person tests positive, there is a roughly chance that the person is innocent!
Now try Exercises 71 and 72. ]
1
3
P(D¿ ƒ T ) =P(D¿ ¨ T )
P(T )=
(0.98)(0.01)
(0.02)(0.99) + (0.98)(0.01)=
0.0098
.0296L 0.331.
P(D¿ ƒ T ) =P(D¿ ¨ T )
P(T )
(0.98)(0.99)
(0.98)(0.01)T
T �
D �
D0.02
0.98
0.99
0.01
0.01
0.99
(0.02)(0.01)
(0.02)(0.99)
does not take drugand tests positive
takes drug andtests positive
T
T �
FIGURE 14.18 Tree showing probabilities for drug testing.
691
Copyright © 2010 Pearson Education, Inc.
CHAPTER 14 y Probability692
Looking Back*These exercises follow the general outline of the topics presented inthis section and will give you a good overview of the material thatyou have just studied.
1. In Example 1, what were we computing when we found P(O G )?
2. We blanked out all columns in Table 14.7, except one. Why didwe do this?
3. In Example 5, how did we determine that the events F and Gwere independent?
4. What is an expert system?
Sharpening Your SkillsIn many of these exercises, you may find it helpful to draw a treediagram before computing the probabilities.
In Exercises 5–8, assume that we are rolling two fair dice. Firstcompute P(F) and then P(F E). Explain why you would expect theprobability of F to change as it did when we added the conditionthat E had occurred.
5. E—an odd total shows on the dice.
F—the total is seven.
6. E—an even total shows on the dice.
F—the total is four.
7. E—a three shows on at least one of the dice.
F—the total is less than five.
8. E—a two shows on at least one of the dice.
F—the total is greater than five.
In Exercises 9–12, we are drawing a single card from a standard52-card deck. Find each probability.
9. P(heart red) 10. P(king face card)
11. P(seven nonface card)
12. P(even-numbered card nonface card)ƒƒ
ƒƒ
ƒ
ƒ
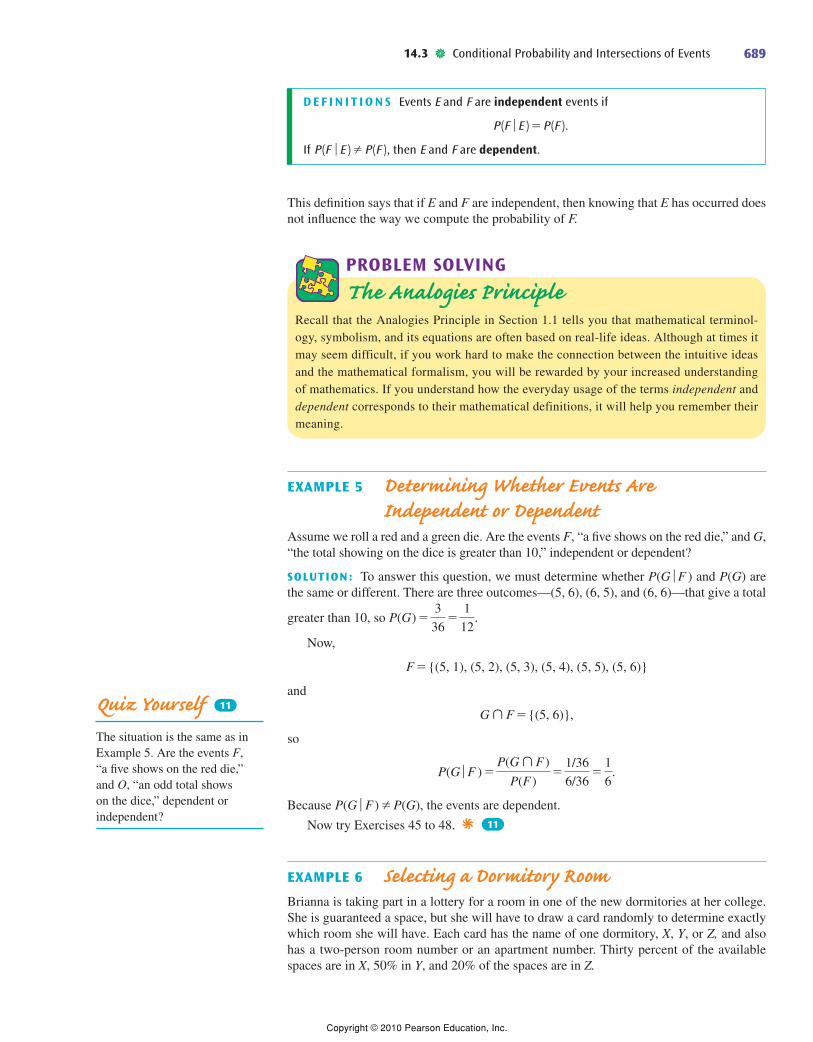
You are to randomly pick one disk from a bag that contains the disksshown below. Find each of the following probabilities. For example,P(heart yellow) means you are to find the probability of a heartbeing on the disk, given that the disk is yellow.
ƒ
*Before doing these exercises, you may find it useful to review the note How to Succeed at Mathematicson page xix.
Exercises 14.3
13. P(heart yellow) 14. P(pink smiley face)
15. P(yellow heart) 16. P(heart blue)
17. P(heart pink) 18. P(smiley face blue)
Playing a store’s discount game. To stimulate business, a depart-ment store has introduced a game called “Register Roulette.” Toplay, a customer selects a first purchase and a second purchase toqualify for a discount. The customer then reaches into a containerand randomly selects two game tokens. There are 50 green tokensthat qualify a purchase for a 10% discount, 10 blue tokens thatresult in a 20% discount, and 2 red tokens that give a 50% discount.
In Exercises 19–22, assume that you are randomly selecting two ofthese tokens, without replacement. Compute P(F E).
19. E—you select a red token first.
F—the second token is green.
20. E—you select a red token first.
F—the second token is red.
21. E—you select a nonred token first.
F—the second token is red.
22. E—you select a nonred token first.
F—the second token is nonred.
According to U.S. government statistics, mononucleosis (mono) is fourtimes more common among college students than the rest of the popu-lation. Blood tests for the disease are not 100% accurate. Assume that
ƒ
ƒƒƒƒƒƒ
¶ ¶ ¶ H I G H L I G H TExpert SystemsWhether playing chess, doing mathematics, making soup,or practicing law, what makes an expert different fromthe rest of us? Scientists studying this question have learnedthat organizing knowledge effectively makes a person anexpert. Researchers in the area of artificial intelligence havedeveloped complex computer programs called expert sys-tems that rely heavily on conditional probability to drawconclusions from an organized body of information.
The “grandfather of expert systems” is an ingenious pro-gram called Mycin, developed at Stanford University, whichdiagnoses blood infections. Some other well-known expertsystems are Hearsay, which understands spoken language;Prospector, which is able to predict the location of valuablemineral resources; and Internist, which can diagnose manyinternal diseases. With ongoing research in this area, expertsystems continue to be a major application of probability theory.
Copyright © 2010 Pearson Education, Inc.
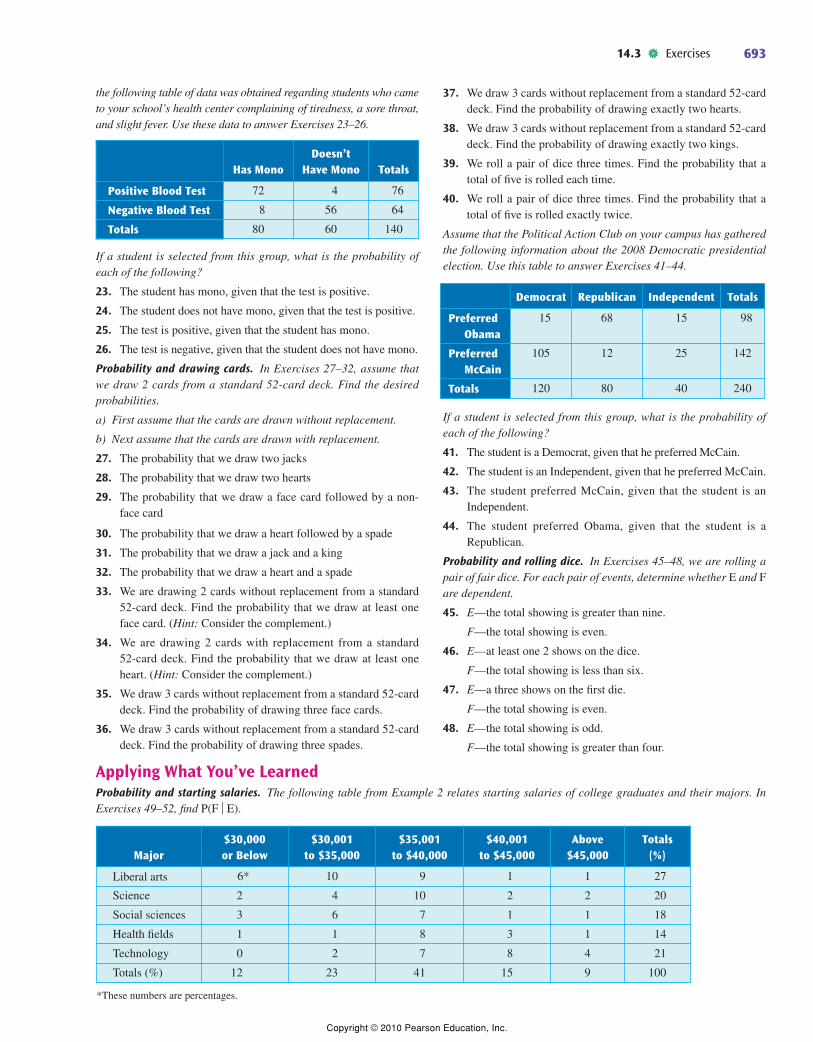
If a student is selected from this group, what is the probability ofeach of the following?
23. The student has mono, given that the test is positive.
24. The student does not have mono, given that the test is positive.
25. The test is positive, given that the student has mono.
26. The test is negative, given that the student does not have mono.
Probability and drawing cards. In Exercises 27–32, assume thatwe draw 2 cards from a standard 52-card deck. Find the desiredprobabilities.
a) First assume that the cards are drawn without replacement.
b) Next assume that the cards are drawn with replacement.
27. The probability that we draw two jacks
28. The probability that we draw two hearts
29. The probability that we draw a face card followed by a non-face card
30. The probability that we draw a heart followed by a spade
31. The probability that we draw a jack and a king
32. The probability that we draw a heart and a spade
33. We are drawing 2 cards without replacement from a standard52-card deck. Find the probability that we draw at least oneface card. (Hint: Consider the complement.)
34. We are drawing 2 cards with replacement from a standard 52-card deck. Find the probability that we draw at least oneheart. (Hint: Consider the complement.)
35. We draw 3 cards without replacement from a standard 52-carddeck. Find the probability of drawing three face cards.
36. We draw 3 cards without replacement from a standard 52-carddeck. Find the probability of drawing three spades.
If a student is selected from this group, what is the probability ofeach of the following?
41. The student is a Democrat, given that he preferred McCain.
42. The student is an Independent, given that he preferred McCain.
43. The student preferred McCain, given that the student is anIndependent.
44. The student preferred Obama, given that the student is aRepublican.
Probability and rolling dice. In Exercises 45–48, we are rolling apair of fair dice. For each pair of events, determine whether E and Fare dependent.
45. E—the total showing is greater than nine.
F—the total showing is even.
46. E—at least one 2 shows on the dice.
F—the total showing is less than six.
47. E—a three shows on the first die.
F—the total showing is even.
48. E—the total showing is odd.
F—the total showing is greater than four.
14.3 y Exercises
Has MonoDoesn’t
Have Mono Totals
Positive Blood Test 72 4 76
Negative Blood Test 8 56 64
Totals 80 60 140
the following table of data was obtained regarding students who cameto your school’s health center complaining of tiredness, a sore throat,and slight fever. Use these data to answer Exercises 23–26.
Democrat Republican Independent Totals
Preferred Obama
15 68 15 98
Preferred McCain
105 12 25 142
Totals 120 80 40 240
Major$30,000 or Below
$30,001 to $35,000
$35,001 to $40,000
$40,001 to $45,000
Above $45,000
Totals (%)
Liberal arts 6* 10 9 1 1 27
Science 2 4 10 2 2 20
Social sciences 3 6 7 1 1 18
Health fields 1 1 8 3 1 14
Technology 0 2 7 8 4 21
Totals (%) 12 23 41 15 9 100
*These numbers are percentages.
37. We draw 3 cards without replacement from a standard 52-carddeck. Find the probability of drawing exactly two hearts.
38. We draw 3 cards without replacement from a standard 52-carddeck. Find the probability of drawing exactly two kings.
39. We roll a pair of dice three times. Find the probability that atotal of five is rolled each time.
40. We roll a pair of dice three times. Find the probability that atotal of five is rolled exactly twice.
Assume that the Political Action Club on your campus has gatheredthe following information about the 2008 Democratic presidentialelection. Use this table to answer Exercises 41–44.
Applying What You’ve LearnedProbability and starting salaries. The following table from Example 2 relates starting salaries of college graduates and their majors. InExercises 49–52, find P(F E).ƒ
693
Copyright © 2010 Pearson Education, Inc.
49. E—a person majored in social science.
F—a person received a starting salary between $30,001 and$35,000.
50. E—a person majored in science.
F—a person received a starting salary between $35,001 and$40,000.
51. E—a person received a starting salary between $40,001 and$45,000.
F—a person majored in technology.
52. E—a person received a starting salary between $30,001 and$35,000.
F—a person majored in liberal arts.
Assume that a softball player has a .300 batting average—to keepthis simple we’ll assume that this means the player has 0.30 proba-bility of getting a hit in each at bat. Use this information to answerExercises 53–56. Assume that the player bats four times.
53. What is the probability that she gets a hit only in her first at bat?
54. What is the probability that she gets exactly one hit? (Realizethat there are four ways to do this.)
55. What is the probability that she gets exactly two hits?
56. What is the probability that she gets at least one hit? (Hint:Think complement.)
Selecting a dormitory room. Exercises 57–60 refer to the treediagram that we drew in Figure 14.16 of Example 6.
57. What is the meaning of the number 0.40 on the top middlebranch of Figure 14.16?
58. What is P(Room ¨ Y)?
59. What is P(Apartment X )?
60. If Brianna gets an apartment, what is the probability that she isin dorm Z?
Testing a cold medication. Imagine that you are taking part in astudy to test a new cold medicine. Although you don’t know exactlywhat drug you are taking, the probability that it is drug A is 10%,that it is drug B is 20%, and that it is drug C, 70%. From past clini-cal trials, the probabilities that these drugs will improve yourcondition are: A (30%), B (60%), and C (70%).
61. Draw a tree to illustrate this drug trial situation.
62. What is the probability that you will improve given that youare taking drug B?
63. What is the probability that you will improve?
64. If you improve, what is the probability that you are takingdrug B?
65. Probability and exam questions. Assume that either ProfessorAnsah or Professor Brunich has constructed the comprehensiveexam that you must pass for graduation. Because each professorhas extremely different views, it would be useful for you toknow who has written the exam questions so that you can slantyour answers accordingly. Assume that there is a 60% chancethat Ansah wrote the exam. Ansah asks a question about interna-tional relations 30% of the time and Brunich asks a similarquestion 75% of the time. If there is a question on the examregarding international relations, what is the probability thatAnsah wrote the exam?
ƒ
66. Probability and exam questions. Assume now that a thirdprofessor, Professor Ubaru, writes the exam 20% of the time,Brunich 30% of the time, and Ansah the rest. Ubaru asks aquestion about international relations 40% of the time, Brunich35% of the time, and Ansah 25% of the time. If there is aninternational relations question on the exam, what is the proba-bility that Brunich did not write the exam?
Product reliability. You want to purchase a DVD drive for yourlaptop computer. Assume that 65% of the drives are made outsidethe United States. Of the U.S.-made drives, 4% are defective; of theforeign-made drives, 6% are defective. Determine each probabilityrounded to three decimal places.
67. The probability that the drive you purchase is U.S. made and isnot defective
68. The probability that the drive you purchase is foreign madeand is defective
69. If your drive is defective, the probability that it is foreignmade
70. If your drive is defective, the probability that it is made in theUnited States
Drug testing. In Exercises 71 and 72, do computations similar tothose in Example 7 using this revised information. Assume that 4%of the employees use the drug and that the test correctly identifies adrug user 98% of the time. Also assume that the test identifies anonuser as a drug user 3% of the time.
71. If an employee tests positive, what is the probability that theperson is innocent?
72. If an employee tests negative, what is the probability that theperson is a user?
Communicating Mathematics73. If you know the conditional probability formula
, how do you find the probability formula
for P(E ¨ F)?
P(F ƒ E) =P(E ¨ F )
P(E )
CHAPTER 14 y Probability694
74. We say that events E and F are independent if P(F E ) =P (F ). Give an intuitive explanation of what this equation issaying.
75. In what ways are the special and general rules for computingconditional events similar? How are they different?
76. If A and B are events, can P(B A) = P(B)? When?
77. Explain how the formal definition of dependent and indepen-dent events corresponds to your intuitive understanding ofthese words in English.
78. The formula P(E ¨ F) = P(E) · P(F) is, in general, not true.When can we use this formula instead of the correct formula,P(E ¨ F) = P(E) · P(F E )?
Using Technology to InvestigateMathematics79. Search the Internet for “expert systems.” Report on an interest-
ing site that you find.
80. Search the Internet for “amazing applications of probabilityand statistics.” Report on an interesting site that you find.
ƒ
ƒ
ƒ
Copyright © 2010 Pearson Education, Inc.

14.4 y Expected Value 695
To solve this problem, we will use the formula for computing theprobability of a complement of an event. It is clear that
P(duplication of some birthdays) = 1 - P(no duplications)
To illustrate this, assume that we have three people. To have noduplications, the second person must have a birthday that is different
For Extra CreditThe birthday problem. A surprising result that appears in manyelementary discussions on probability is called the birthdayproblem. The question simply stated is this: “If we poll a certainnumber of people, what is the probability that at least two of thosepeople were born on the same day of the year?” For example, itmay be that in the survey two people were both born on March 29.
person has a birthday different from the first two is .
Therefore, for three people,
P(duplication of birthdays) = 1 - P(no duplication of birthdays)
In Exercises 81–84, we will look at several other cases.
81. Assume that we have 10 people. Find the probability thatat least 2 of the 10 people were born on the same day of theyear.
82. Repeat Exercise 81 for 20 people.
83. Find the smallest number of people such that the probability oftwo of them being born on the same day of the year is greaterthan 0.50.
84. Conduct an experiment by surveying groups of various sizes*to see how your surveys conform to the predicted probabilities.If five people are working in a group, each person can surveyfour groups of 20, 30, 40, and so on to generate a reasonableamount of data.
= 1 - a364
365b a363
365b = 0.0082.
363365
*Instead of surveying people, you can write the numbers 1 to 365 on pieces of paper or cardboard and draw thesefrom a box with replacement. Be sure to shake the container well before each draw. In this way you can quicklysimulate interviews of groups of 20, 30, or 40 people, with the purpose of determining how close your experi-mental results conform to the predicted probabilities.
from that of the first person, and the third person must have a birth-day that is different from the first two. The probability that the secondbirthday is different from the first is . The probability that the third364
365
Copyright © 2010 Pearson Education, Inc.