Embed Size (px)
Citation preview
SHRP-S-328
Condition Evaluation ofConcrete Bridges Relative to
Reinforcement Corrosion
Volume 6: Method for FieldDetermination of Total
Chloride Content
Stephen E. Herald, Mark Henry,Imad L. Al-Qadi, Richard E. Weyers,
Michael A. Feeney, Stephen F. HowlumVirginia Polytechnic Institute and State University
The Charles E. Via Department of Civil EngineeringBlacksburg, VA
Philip D. CadyPennsylvania Transportation Institute
The Pennsylvania State UniversityUniversity Park, PA
Strategic Highway Research ProgramNational Research Council
Washington, DC 1993

SHRP-S-3:_ISBN: 30c'-05262-9Contract C-101
Program Manager: Don M. HarriottProject Manager: Joseph F. LamondCopy Editor: Katharyn Bine BrosseauPTI Technical Editor: Joanne M. Fox
Program Area Secretary: A/Ill Saccomano
September 1992
Key words:chloride content
chloride profileconcrete bridgeson-site testingreinforcement corrosion
specific ion probe
Strategic Highway Research ProgramNational Academy of Sciences2101 Constitution Avenue N.W.
Washington, DC 20418
(202) 334-3'774
The publication of this report does not necessarily indicate approval or endorsement of the findings,opinions, conclusions, or recommendations either inferred or specifically expressed herein by the NationalAcademy of Sciences, the United States Government, or the American Association of State Highway andTransportation Officials or its member states.
© 1993 National Academy of Sciences
IM/NAP/293

Acknowledgments
The research described herein was supported by the Strategic Highway Research Program(SHRP). SHRP is a unit of the National Research Council that was authorized by section128 of the Surface Transportation and Uniform Relocation Assistance Act of 1987.
For help in arranging the traffic control and access to the sampling locations, the authorsare especially indebted to Richard Kessler and Ron Powers of the Florida Departmentof Transportation, Howard Newlon, Jr. and Dallas Cranford of the Virginia Department ofTransportation, Gary Hoffman and Jim Seksinsky of the Pennsylvania Departmentof Transportation, and Lee Schuchardt and Gerald Anderson of the Wisconsin Departmentof Transportation. Without their cooperation this research could not have beenaccomplished.
.°°
III

Contents
Abstract .................................................. 1
Executive Summary ........................................... 3
1. Introduction ........................................... 5Needs 5
Objectives and Scope 6Research Approach 7
2. Background ............................................ 9Literature Review 9
Promising Approaches 13
3. Preliminary Laboratory Evaluations ........................... 15Specimen Preparation 15Evaluation of the Promising Approaches 19Comparison of the Test Methods 29Effects of Cement Content on the Selected Method 34
Effects of Temperature on the Selected Method 37
4. Field Validation of the Selected Method ......................... 47Site Selection 47
Sample Collection Equipment and Procedure 48Calibration of the Specific Ion Probe 50Analysis of Weighing Methods 54Crushed Versus Uncrushed Sample 56

5. Method Enhancement Studies ............................... 65Needs 65
Objectives and Scope 65Generic Equipment Specifications 66Digestion Solution 68Stabilizing Solution 71Expanded Calibration Range 74Calibration Equations for Revised Procedure 82Validation of Revised Procedures Using Field Samples 83Operator Variance 95
6. Summary and Recommendations ............................ 103
Appendix A: Chloride Analysis Procedures .......................... 107
Appendix B: Chloride Content Results for Bridgesin Field Validation Study ...................................... 119
References ............................................... 153
vi

List of Figures
3-1. Potentiometric titration versus specific ion probe ..................... 22
3-2. Potentiometric titration versus spectrophotometer .................... 25
3-3. Potentiometric titration versus digital titrator ....................... 28
3-4. Potentiometric titration versus Quantab titrator strips .................. 31
3-5. Potentiometric titration versus specific ion probe for effects of cement content . . 36
3-6. Temperature correction for the specific ion probe .................... 40
4-1. Sample extraction and collection system in operation .................. 49
4-2. Sample collected on _ter removed from collection chamber .............. 49
4-3. Potentiometric titration versus specific ion probe for all data ............. 53
4-4. Crushed versus uncrushed sample results using specific ion probe .......... 61
4-5. Potentiometfic titration versus specific ion probe for uncrushed samples ...... 63
5-1. Equivalence of predicted and titrated chloride contents for threeextraction solution volumes .................................. 70
5-2. Equivalence of predicted and titrated chloride contents of the extractionsolution diluted by a ratio of 1:3 .............................. 73
vii

5-3. Calibration equation for chloride instrument number 1 and the 95-percentconfidence limits ........................................ 78
5-4. The relationship between the titrated percent chloride and the initialpr,_icted percent chloride in 100-ml solution ....................... 85
5-5. The relationship between the chloride contents using the standard and developedmethods for Florida samples ................................. 91
5-6. The relationship between the chloride contents using the standard and developedmethods for Pennsylvania samples ............................. 92
5-7. The relationship between the chloride contents using the standard and developedmethods for Virginia samples ................................ 93
5-8. The relationship between the chloride contents using the standard and developedmethods for Wisconsin samples ............................... 94
5-9. The relationship between the chloride contents using the standard and developedmethods for the combined State samples .......................... 96
5-10. Comparison of the chloride content determinations by two operatorson concrete specimens from four States ......................... 101
A-1. The specific ion probe .................................... 109
A-2. The DR 2000 spectrophotometer ............................. 113
A-3. The digital titrator ...................................... 115
A-4. The Quantab titrator strips ................................. 117
oJ.
VUl

List of Tables
3-1. Properties of the concrete mixtures ............................. 16
3-2. Comparison of the potentiometric titration and amount of chloride added ...... 18
3-3. Comparison of potentiometric titration and the specific ion proberesults at w/c = .47 ...................................... 20
3-4. Comparison of potentiometric titration and the spectrophotometer resultsat w/c = .47 .......................................... 24
3-5. Comparison of potentiometeric titration and the digital titrator results atw/c = .47 ............................................ 26
3-6. Comparison of the potentiometric titration and the Quantab titrator strip resultsfor acid soluble chlorides at w/c = .47 .......................... 30
3-7. Comparison of test methods ................................. 33
3-8. Potentiometric titration and specific ion probe results for differentcement contents ......................................... 35
3-9. Specific ion probe test results for the effect of reaction temperature ......... 38
3-10. Effects of temperature on the percent chloride prediction ................ 42
4-1. Output from two-way analysis of variance for the specific ionprobe (percent chloride) .................................... 54
4-2. Results of various weighing methods ............................ 56
ix

4-3. Field validation test results .................................. 5"_
5-1. Specific chloride ion probe measured chloride content of powdered concretesamples digested in three different chloride extraction solution volumes ....... 69
5-2. Effects of addition of a stabilizing solution to the 10-, 20-, and 30-mlchloride extraction solutions at a constant ratio of 1:3 .................. 72
5-3. Calibration solution millivolt readings using different probe-potentiometercombinations for the original and new solutions ..................... 75
5-4. Chloride solution calibration readings for chloride instrument number one ..... 77
5-5. Millivolt readings from calibration solution for meter and probe combinations . . . 80
5-6. Chloride content results using equations 5-4 and 5-5 and AASHTO methodat: 100-ml solution ....................................... 84
5-7. Percent chloride results using the developed procedures for Florida samples .... 86
5-8. Percent chloride results using the developed procedures for Pennsylvaniasamples .............................................. 87
5-9. Percent chloride results using the developed procedures for Virginia samples . . . 88
5-10. Percent chloride results using the developed procedures for Wisconsin samples . . 89
5-11. Operator variance data for Florida samples ........................ 97
5-12. Operator variance data for Pennsylvania samples ..................... 98
5-13. Operator variance data for Virginia samples ....................... 99
5-14. Operator variance data for Wisconsin samples ..................... 100
B-1. Predicted chloride content values for Pennsylvania bridgePA 180 over 220 WB .................................... 121
X

B-2. Predicted chloride content values for Pennsylvania bridgePA 180 over 220 EB ..................................... 123
B-3. Predicted chloride content values for Pennsylvania bridgePA 11-15 over 35 NB .................................... 124
B-4. Predictedchloride content values for Pennsylvania bridgePA 11-15 over 35 SB .................................... 126
B-5. Predicted chloride content values for Virginia bridge VA 1-81 over 927 NB . . . 129
B-6. Predicted chloride content values for Virginia bridge VA 1-81 over 676 NB . . . 132
B-7. Predicted chloride content values for Virginia bridge VA 1-81 over 670 NB . . . 135
B-8. Predicted chloride content values for Florida bridge FL 206 ............. 138
B-9. Predicted chloride content values for Florida bridge FL 295 EB .......... 140
B-10. Predicted chloride content values for Florida bridge FL 312 ............. 142
B-11. Predicted chloride content values for Wisconsin bridge WI 243 WB ........ 144
B-12. Predicted chloride content values for Wisconsin bridge WI 245 WB ........ 147
B-13. Predicted chloride content values for Wisconsin bridge WI 252 ........... 150
xi
Abstract
Chloride-induced corrosion of the reinforcing steel is recognized as a primary factorcontributing to concrete bridge deck deterioration. This report deals with the selection ofa method and the development of detailed procedures to accurately measure the chloridecontent of reinforced concrete in the field.
Specific ion probe, spectrophotometer, digital titrator, and Quantab titrator strips were themethods investigated. Results from laboratory procedures and an evaluation based on cost,speed, accuracy, and level of required expertise indicated that the specific ion probe wasmore suitable for use in the field than the other methods selected.
Field validation testing undertaken to substantiate laboratory findings was accomplished byevaluating samples from bridges located in different environmental exposures. Bridges inPennsylvania, Florida, Wisconsin, and Virginia were tested for chloride content. Thedetermined chloride contents correlated very highly with the standard laboratory method(potentiometric titration--AASHTO T260-84) that was run on companion specimens.
Guidelines were produced for the instrumentation, digestion solution, and test procedure.To evaluate the enhanced procedures, manufactured-precontaminated concrete sampleswere tested in the laboratory along with samples collected from Florida, Pennsylvania,Wisconsin, and Virginia. Variance methods were used to determine the effects of multipleoperators for a fixed procedure, and a detailed test procedure, in American Society ofTesting and Materials (ASTM) format, was prepared.

Executive Summary
The standard method for determining the chloride content of concrete--potentiometric titrationin the laboratory (AASHTO T260-84)--is arduous, time-consuming, and expensive. Sincethe 1960s many alternative methods have been developed, but none have been thoroughlyevaluated for applicability and accuracy.
A detailed search of the technical literature produced four candidate methods forconsideration: the specific ion probe, spectrophotometer, digital titrator, and Quantab titratorstrips. All of these methods (as well as the standard potentiometric titration procedure)require the acquisition of drilled powder samples. Therefore, an efficient system for sampleacquisition was also developed in this research. Extensive laboratory evaluations identifiedthe specific ion probe as the best alternative based primarily on technical performance andsecondarily on cost, speed, and ease of operation.
Laboratory studies on the effects of sample and test variables on test results revealed thatcement content had no effect, but that correction factors had to be applied to correct forvariations in reaction temperature.
Field validation studies were undertaken in order to evaluate the techniques and procedures
used in adapting the specific ion probe method for performing chloride determinations in thefield. Four bridges were sampled in Pennsylvania, and three each in Florida, Wisconsin,and Virginia, providing a nationally representative range of chloride exposure environments.The method worked exceedingly well, producing chloride content results that correlated veryhighly with the standard potentiometric titration procedure (AASHTO T260-84) at productionrates per operator of 40 to 50 specimens per day in the field or 70 to 80 in the laboratory.
The specific ion probe system used in the preliminary study employed proprietary solutionsfor specimen preparation and testing, and unknown instrument configurations. Also, thecalibration ranges were not sufficient, resulting in loss of accuracy at high chloride contents.Therefore, the following supplemental studies were carded out:
3

• Commercially available potentiometers were evaluated for accuracy. The primaryqualification was a rugged potentiometer, for laboratory as well as field usage,with a resolution of 1 mV;
• Commercially available specific ion probes used in determining chlorides wereinvestigated. The Orion probe proved to be the only durable probe for the testprocedure;
• A digestive solution suitable for concrete was developed and evaluated. Thesolution developed is an acidic solution with a defoaming agent;
• The calibration solution ranges were expanded to incorporate higher percentages of
chloride. The increased ranges !mproved the accuracy of the reading. Additionalimprovement was achieved through the dilution for the sample in the stabilizingsolution;
• The accuracy of the instrument was determined using pure saline solution. Thetest displayed a workable range for the probe, which supported the use of astabilizing solution;
• The accuracy of the procedure was assessed with actual chloride-contaminatedconcrete samples. The procedure provided high correlations with the AASI-ITOmethod for samples from the laboratory and four different states; and
• The accuracy of the procedure with multiple operators was evaluated. Differentoperators produced similar results.
Finally, a detailed test procedure, in ASTM format, was prepared and is presented inVolume 8, "Procedure Manual," of this report series.
4

1
Introduction
Needs
The deterioration of concrete bridges in the United States is a monumental problem. Theseriousness of the deterioration was first noted in the early 1960s (1,2) and has grown since.The financial consequences of the problem associated with the corrosion of the reinforcingsteel in concrete bridges was recognized in the early 1970s. The Federal HighwayAdministration (FHWA) estimated the cost of bridge deck repairs at $70 million per year in1973 (3). By 1975, the estimate for bridge deck repairs was increased to $200 million peryear (4). In 1981, a report published by the U.S. General Accounting Office (5) coveringsome 514,000 of the nation's 566,000 bridges estimated the rehabilitation/replacement at$33.2 billion. About one-half, or $16 billion, is due to the corrosion of steel in concrete.
The problem has been steadily growing in magnitude; more recent projections presented inthe f'mal report Strategic Highway Research Program Research Plans estimate the liability ofcorrosion-induced deterioration in bridges at $70 billion, increasing by a rate of $.5 billionannually (6).
Many of the studies pertaining to concrete bridge deterioration address the corrosion of thereinforcement steel in concrete. The corrosion of reinforcing steel in concrete is influenced
by many factors: concrete permeability (w/c ratio); consolidation of the concrete duringplacement; the type of cement; cover depth above the reinforcement steel; relative humidity;and the ions present at the steel surface (7).
5

In reinforced concrete, a protective layer is provided in the alkaline environment andpassivity (resistance to corrosion) exists so long as the pH remains high in the concrete incontact with the surface of the reinforcement steel. Two mechanisms can destroy the passive
layer (8). The first mechanism is the reduction of alkalinity by leaching of water or areaction with carbon dioxide or some other acidic material to partially neutralize the passive
layer. The second mechanism is an electrochemical reaction of chloride ions in the presenceof oxygen.
The reaction products formed are much larger than the volume of steel, and, ultimately, thepressures induced cause rupture in the concrete above the reinforcing steel (9). Once theconcrete surface has cracked the corrosion rate increases due to the increased availability ofoxygen to depolarize cathodic areas.
The primary sources of the chloride ion detected in concrete bridges are deicing salts,sodium and/or calcium chloride, and sea water spray, which infiltrates into the concretethrough cracks or by diffusion (10). Chloride may also be present in the mixing water,admixtures, or aggregates used in the concrete mixture. A typical bridge will receive from0.25 to 1.0 lb/ft 2 of deicer salt per winter (10). These chlorides can penetrate bridgestructures through cracks, faulty joints, and diffusion through the concrete itself to initiatecorrosion. The "bare pavement" policy of the 1960s increased the amount of deicing saltsapplied each winter from 2 to 9 million tons in the snow belt states (11). This increased theseverity of the corrosion problem and accelerated the need for strategies to rehabilitate andreplace deteriorated bridges.
To implement these strategies and new anti-corrosion methods (cathodic protection, overlays,and epoxy-coated reinforcing bars), it is necessary to be able to determine the extent ofchloride contamination in bridge components. Thus, a field test procedure for determiningthe extent of chloride contamination is needed. A successful field procedure must meetseveral criteria. It must accurately determine existing chloride contamination levels; it mustbe simple enough for technicians to perform in the field; and it should not be too time- orequipment-intensive.
Objectives and Scope
The ultimate objective of this study was to develop an economic:, reliable field method ofmeasuring the chloride content of bridge components. The developed method would be usedto assess the existing corrosion condition and predict the future corrosion condition ofreinforced concrete bridge components.
6

To satisfy the objective of this study, a state-of-the-art literature review was first carried outin order to identify different chloride measurement methods. The identified methods wereinvestigated to determine their applicability relative to the measurement of chloride content ofbridge components in situ or in powdered samples. The evaluation criteria included speed,accuracy, level of expertise required, cost (equipment and samples analyzed), and equipmentlimitations. The most feasible method was chosen for field validation. An intensive field
study was conducted to validate the laboratory results. A correlation study of the developedprocedure and the standard potentiometric titration method was performed. The effects oftemperature and cement content on the developed procedure were investigated as was astatistical base to determine the instrument and operator variability. The method was field-validated using drilled concrete samples taken from bridges in Virginia, Pennsylvania,Wisconsin, and Florida.
Research Approach
The research approach employed in the pursuit of the objectives of the research consisted ofthe following steps:
• Identification of technically feasible methods;
• Selection of one of the technically feasible methods (by means of laboratoryscreening tests) for further development;
• Validation of the selected method under field conditions;
• Enhancement of the selected method, addressing shortcomings uncovered duringthe laboratory and field validation testing.
7

2
Background
Literature Review
Manual and computer data base searches were performed to identify test methods used todetermine the chloride content of concrete. In addition, sources of information containing
the chloride content for various bridges within the United States were identified: theEngineering Indexes Annual from 1955 to 1988, I-IRIS abstracts from 1979 to 1987,Chemical Abstracts, and government documents were searched.
Methods used to determine the chloride ion content of concrete may be classified asnondestructive and destructive techniques. Nondestructive techniques include the dualneutron-gamma ray and the neutron-gamma ray spectroscope. Destructive methods,requiring a drilled, powdered sample, include the American Association of State Highwayand Transportation Officials (AASHTO) Standard Method T260-84 (potentiometric titrationmethod) X-ray fluorescence, gas chromatograph, Quantab chloride titrator strips, specific ionelectrode, spectrophotometer, and argentometric digital titrator. The following sectionspresent the initial evaluation of the test methods examined in selecting the feasible methodsfor laboratory evaluation study.
Dual Neutron-Gamma Ray Technique
The dual neutron-gamma ray technique was developed for bTaWA by Columbia ScientificIndustries (12,13). The instrument can measure chloride content with respect to depth, with
9

detection limits of 0.04 to 0.08 lb Cl/yd 3 (0.02 to 0.05 kg/m 3) and depth resolutions of 0.40to 8 in. (l to 20 cm), depending on the calibration model. Calibration models would have tobe developed for specific types of bridges (e.g., concrete or steel beams, varying deckthickness, varying overlay thickness, and coastal or inland bridges) (13). The choice of thewrong cafibration model (C1 depth distribution model) will result in significant measurementerrors. The method is fast, taking two to three measurements per hour with a 10-minutesdata acquisition time. Instrument operation is straightforward and requires little training.However; instrument calibration and setup must be done by qualified scientists. Althoughoperational costs are relatively low, capital costs are very high. Also, the equipment is verylarge and is mounted on a self-contained vehicle and thus would be limited to use on bridgedecks. However, the instrument can be used to measure the chloride content of 0.66- to0.88-1b (300- to 400-g) powder concrete samples with a 0.25-in. (6.4 mm) maximum particlesize, taken from other instrument-inaccessible bridge members.
Further investigation of the dual neutron-gamma ray technique was not conducted in thisstudy for reasons of its cost, number of required chloride distribution calibration models,portability limitations, and technical qualifications of setup and calibration personnel.
Neutron-(_mma Ray Spectroscopy
Neutron-gamma ray spectroscopy uses a californium-252 neutron source for compositionmeasurements with a high-resolution, high-purity germanium detector rather than anNaI (T1) crystal gamma-ray detector (14-16). The instrument has been used to measure therelative difference with regard to surface position of the chloride content of a masonry wallby normalizing the chloride intensities to the value of silicon (C1/Si ratio). The procedureassumes that the value of silicon remains relatively constant throughout the material.
Some of the characteristics of the current neutron-gamma ray spectroscope are presentedbelow:
1. The apparatus for building walls consists of a neutron source, liquid nitrogen cooledGefHP) gamma-ray detector, amplifier, multichannel analyzer, tape and chart recorder, andreadout unit. The apparatus is awkward to transport and set up on building walls. However,smaller portable versions of the multichannel analyzer, amplifiers, and tape deck arecommercially available. Similarly, small-sized liquid nitrogen flasks are available. Theseimprovements would improve the portability of the apparatus.
10

2. For measurements of building walls, the neutron source is placed on one side of the walland the gamma-ray detector is placed directly opposite the source on the other side of thewall. This measurement setup cannot be used on most bridge components. However,measurements can be made with the detector and source on the same fiat surface if a shield
is provided for the source and detector. The increased weight would significantly reduce theportability of the apparatus.
3. The instrument measures the resulting gamma rays from a hemispherical volume with aradius of 6 to 8 in. (15 to 20 cm) around the detector and thus measures the average gamma-ray response for the volume of about 460 to 1,100 in3 (7,540 to 18,030 cc).
4. The instrument detects relative differences between average chloride contents because no
general linear relation exists between the intensity and the concentration of an element (15).To measure absolute values, the development of calibration standards would be required forvarious normalized chloride contents (normalized to silicon). Thus, calibration standardswould have to be developed for varying of silicon and chloride contents. In addition, the
presence of iron and water also influences intensity. Therefore, calibration standardsregarding the influence of these elements must be developed. In that it measures the averagechloride content of a volume of concrete, this technique may be of limited value to the
application of measuring the chloride content of reinforced concrete bridges because it canonly measure the magnitude of chloride content, not changes of 30 to 40 percent(communication with Jacob I. Tromba, 1988). Thus, one may be unable to distinguish thevariations in chloride distribution, particularly since the measured volume is hemispherical.
5. The cost of the equipment is on the order of $100,000, and skilled technicians arerequired to maintain the equipment (16). In addition, because each bridge or group ofbridges may require some adaptation, the apparatus may be most productive when operatedby specialists with a knowledge of nuclear physics. It has been suggested that the techniquemay best be used through the services of specialized consulting firms (16).
Recently, the National Science Foundation (NSF) awarded the Goddard Space Flight Centera contract to investigate the development of calibration models for neutron-gamma rayspectroscopy. Initial results seem promising (communication with Jacob I. Tromba, 1988).Given the current state of development of the technique, the apparent portability problems,calibration requirements, and cost, this technique was not investigated further in this study.
11

X-Ray Fhwrescence and Gas Chromatography
X-ray fluorescence and gas chromatography analysis methods of powder samples offer noadvantage; over other powder analysis methods because of the related power requirements (X-ray fluorescence requires approximately a 100-kV source), costs (between $25,000 and$100,000 for equipment only), and level of required expertise. These limitations wouldrestrict the use of the instruments to the laboratory. Therefore, the instruments were notevaluated further.
Quantab Chloride Titrator Strips
Quantab chloride titrator strips are simple and fast to use and are applicable to fieldmeasurement techniques of powder samples. However, some problems have beenencountered in interpreting the results. The National Ready Mixed Concrete Association hasdeveloped a method for measuring the chloride ion content of freshly mixed concrete usingQuantab titrators (17). The method has not been standardized nor has it been subjected tomultilab cooperative testing to derive its precision. However, some additional investigationwas conducted in this study because of the relatively low cost and simplicity of the method.
A simplified procedure for the Quantab method was also developed by the Building ResearchStation, Garston, Watford (U.K.), for analyzing the chloride content in portland cementconcrete (18). The developed analysis procedure for the Quantab titrator strips consists of anacid digestion of a 5.0-g sample of powdered concrete. Fifty ml of 1N nitric acid solutionwere used to digest the sample, followed by neutralization of the acid using 5.0 g ofanhydrous sodium carbonate. Chloride concentration of the sample was then determinedusing the Quantab titrator strips.
Argentometric Digital Titration
The Building Research Station, Garston, Watford (U.K.), also developed a simplifiedprocedure for chloride determination in portland cement concrete using the Hach(argentometric) test method. In this procedure, the 0.175-oz (5-g), powdered concretesample is acid-digested with nitric acid. After appropriate sample preparation, it is titratedfrom a bright yellow to faint reddish brown color and the number of digits required (usingthe digital titrator) to complete the titration is recorded (18).
12

The techniques developed by the Building Research Station were proposed methods to obtainpreliminary results for the chloride content in portland cement concrete. Minimum expertisewas required in obtaining reproducible results at the site or other "convenient places." Bothprocedures were noted for having less accuracy than standard laboratory procedures.Consequently, use of the Quantab method and the argentometric (Hach) test procedures wasrecommended as a screening process to identify chloride-contaminated samples that require amore detailed analysis. The results could also be used as a justification for the additionalexpenditure associated with the laboratory procedure (18).
Specific Ion Probe
The development of the specific ion prob e method for measuring the chloride content ofconcrete was first conducted at The Pennsylvania State University (19). The procedure wasfurther developed for field use by James Instruments (20). The method digests a 0.105-oz(3-g), powered sample in a chloride extraction solution. A combination specific chloride ionelectrode connected to a voltmeter is inserted into the sample mixture, and the miUivoltreading is recorded. The chloride content is determined by using a calibration equation,which in turn is determined every time the instrument is turned on.
Spectrophotometer
The spectrophotometric method compares the color difference of a chloride-extracted mixturewith a standard reference solution. The chloride content is a direct digital readout in ppm(21).
Promising Approaches
Based on the initial equipment costs, level of expertise required to use the equipment,ruggedness for field use, portability, and accuracy, the specific ion probe,spectrophotometer, digital titrator, and the Quantab titrator strips were selected for furtherlaboratory analysis for accuracy of results compared to the standard potentiometric titrationmethod. The standard method (potentiometric titration--AASHTO T260-84) is too costly andcomplex and not sufficiently rugged for field use. The direct measurement of chloridecontent in a drill hole using a specific ion electrode was excluded because it is applicableonly to horizontal surfaces (22), and, if a hole is to be drilled, little advantage can berealized over the powder sample measurement method.
13

The details of the four promising methods, along with the standard laboratory method(potentiometric titration) are presented in Appendix A.
14

3
Preliminary Laboratory Evaluations
Specimen Preparation
The laboratory investigation of the four selected test methods evaluated three things: theaccuracy of the test method as compared to the standard test method; the effects of cementcontent; and effects of changes in temperature on the performance of the selected testmethod. The accuracy of the test method was used as one of the criteria for the selection ofthe field test method. Prior to field validation, the effects of cement content and temperatureon the selected test method were determined. For the accuracy, cement content, andtemperature tests, concrete specimens 1 x 1 ft x 6 in. (30 x 30 x 15 cm) were cast at 10chloride contamination levels. Specimens were cast at 0.0, 0.2, 0.4, 0.8, 1.6, 3.2, 6.4, 8.6,10.8, and 12.8 C1 lb/yd 3 (0.0, 0.1, 0.2, 0.5, 1.0, 1.9, 3.8, 5.1, 6.4, and 7.6 kg/m 3,approximately) of concrete using a sodium chloride solution as additive. The characteristicsof the concrete mixtures are presented in Table 3-1. A rotary hammer drill with a 3/4-in.(19-mm) carbide drill bit was used to sample each of the concrete slabs. The extractedpowder from the multiple drill holes in a single contaminated slab was combined, dried, andsieved over a No. 50 (300/zm) sieve, and the retained 50 (300/zm) sieve material wasdiscarded.
The standard potentiometric titration procedure (23), AASHTO T-260-84, was used as thebasis for comparison of the chloride content of the test samples for each of the four selectedmethods. The procedure used is presented in Appendix A. Four samples from each of the10 chloride contamination levels were analyzed using the standard method (and the 4 selectedmethods). The results obtained using the standard potentiometric titration method werecompared with the known amounts of chloride added to each specimen. The amount of
15

Table 3-I. Properties of the concrete mixtures.
*Compressive Strength(psi)
Batch CI Content Unit Wt. Air SlumpNo. w/c (lb/yd 3) (lb/ft 3) (%) (in.) 7 day 28 day
C-0 .47 0.0 146.2 5.1 6 1/2 3600 4810
C-1 .47 .2 146.7 5.4 3 4250** 5250
C-2 .47 .4 146.7 5.2 3 4340** 5050
C-3 .47 .8 145.4 5.6 4 3/8 4140"* 4910
C-4 .47 1.6 147.0 5.0 4 4350** 4810
C-5 .47 3.2 147.6 5.0 3 5/8 3700** 5240
C-6 .47 6.4 147.3 5.7 3 3/_ 3700** 4900
C-7 .47 8.6 148.8 4.5 7 1/t- 3960 4600
C-8 .47 10.8 148.3 5.2 4 4380 5080
C-9 .47 12.8 146.5 5.4 4 3/4 3690** 4990
DC-0 .40 0.0 147.6 6.0 2 1/4 5140 6170
DC-1 .40 .2 144.5 6.6 5 1/2 4540 5890
DC-2 .40 .4 147.0 5.5 3 3/4. 5090 6400
DC-3 .40 .8 147.8 5.1 5 1/2 4850 6610
DC-4 .40 1.6 148.8 5.6 3 5130 6170
DC-5 .40 3.2 146.4 6.0 7 4860 6140
DC-6 .40 6.4 144.1 7.1 8 4940 5780
DC-7 .40 8.6 143.1 7.1 8 3/4 4840 5700
DC-8 .40 10.8 142.7 8.0 8 4840 5550
DC-9 .40 12.8 147.4 6.0 6 1/2 4820 5740
EC-0 .50 0.0 145.5 5.6 3 1/2 3750 4850
EC-1 .50 .2 146.0 5.7 3 1/2 3790 4690
EC-2 .50 .4 146. I 6.0 3 3/4 3870 4830
EC-3 .50 .8 146.6 6.0 3 3/4 3710 4580
EC-4 .50 1.6 146.6 5.2 3 3/4 3620 4480
EC-5 .50 3.2 147.0 5.3 4 1/8 3610 4230
EC-6 .50 6.4 146.3 5.5 4 3510 4290
EC-7 .50 8.6 146.8 5.6 4 3720 4250
EC-8 .50 10.8 146.2 5.4 5 3540 A,A._O
EC-9 .50 12.8 146.8 5.6 4 3520 4610
* Average of two cylinder tests.**Indicate 8-day strength results.
16

background chloride in each specimen was estimated to be the average of four tests onspecimen C-0 (0.02025 percent), as illustrated in Table 3-2. The Wilcoxon Signed Rankprocedure (24) for paired data was used to determine if the amount of chloride measuredusing the potentiometric titration less the amount of chloride added was equivalent to theamount of background chloride. The test results presented in Table 3-2 were used for thecomparison.
The results of the Wilcoxon Signed Rank procedure suggests that there is sufficient evidenceto indicate that the difference in the amount of chloride added and the amount of chloride
measured in the specimens is more than the amount of background chloride as determined bytesting four samples from specimen C-0 for chloride. In essence, the results of this analysisindicate there were errors associated in adding chloride to the 10 specimens, variations in theamount of background chloride present in the aggregate materials or mixing water in eachspecimen, and/or different amounts of aggregates present in each sample (resulting indifferent values for the amount of chloride present) as a result of the sampling procedure.
Because the results of the Wilcoxon Signed Rank analysis procedure were somewhatinconclusive, a regression analysis procedure was performed to determine if a relationshipexists between the difference in the amount of chloride added and the amount of chloridemeasured in the specimens versus the amount of chloride added to the concrete. Thefollowing equation represents the results obtained from a regression analysis:
ACT-ADD = 0.0160 + 0.103 ACTCL (3-1)
where
ACT-ADD = amount of chloride measured minus the added chloride, andACTCL = the amount of chloride added.
The results of the analysis of variance indicate that the error sum of squares for the predictedvalues is nearly as great as the error sum of squares for the regression. In summary, theanalysis of the results indicate that the total variation between the difference or backgroundchloride and the actual amount of chloride added is not entirely due to errors associated withmeasuring or adding chloride to the specimens. When incorporating the results of theWilcoxon Signed Rank procedure with the regression analysis, one may conclude that thetotal variation in the results observed is not entirely associated with operator and instrumenterrors in adding chloride to the 10 specimens. In other words, the amount of backgroundchloride present in the aggregate materials or mixing water varies in each specimen or frombatch to batch when mixing concrete, or different amounts of aggregates were present ineach sample as a result of the sampling procedure used.
17
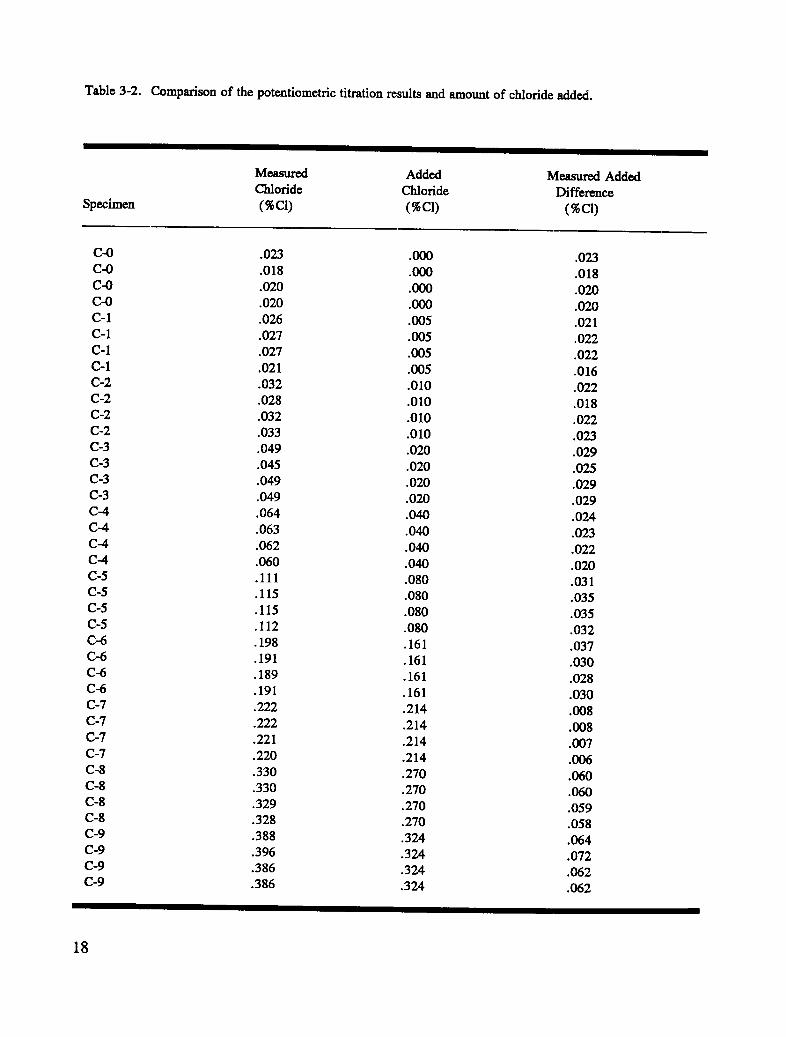
Table 3-2. Comparison of the potentiometric titration results and amount of chloride added.
Measured Added Measured AddedChloride Chloride Differenco
Specimen (% Cl) (% CI) (% CI)
C-O .023 .000 .023C-O .018 .000 .018C-O .020 .000 .020
C-0 .020 .000 .020C-1 .026 .005 .021C-1 .027 .005 .022C-I .027 .005 .022
C-1 .021 .005 .016C-2 .032 .010 .022C-2 .028 .010 .018C-2 .032 .010 .022C-2 .033 .010 .023
C-3 .049 .020 .029C-3 .045 .020 .025C-3 .049 .020 .029C=3 .049 .020 .029C-4 .064 .040 .024C-4 .063 .040 .023
C-4 .062 .040 .022C-4 .060 .040 .020C-5 111 .080 .031C-5 115 .080 .035C-5 115 .080 .035C-5 112 .080 .032
C-6 198 .161 .037C-6 191 .161 .030C-6 189 .161 .028C-6 .191 .161 .030C-7 .222 .214 .008C-7 .222 .214 .008C-7 .221 .214 .007
C-7 .220 .214 .006C-8 .330 .270 .060C-8 .330 .270 .060C-8 .329 .270 .059C-8 .328 .270 .058C-9 .388 .324 .064C-9 .396 .324 .072C-9 .386 .324 .062C-9 .386 .324 .062
18

Evaluation of the Promising Approaches
Specific Ion Probe, Model CI 500
The testing procedure developed by James Instruments, Inc. (20) involves calibrating thespecific ion electrode using three known standards by plotting the electrometer readings(millivolts) versus percent chloride on semi.log graph paper. The powdered material isplaced in an ampoule and compressed to a level corresponding to a red indicator line. Thesample is then added to a premeasured amount of the "chloride extraction liquid" and shakenfor 15 seconds. The electrode is submerged in the solution and the electrometer reading isplotted. The corresponding chloride content of the sample may then be read directly fromthe calibrated graph.
To determine the relationship between the chloride contents of the calibration liquidsprovided by James Instruments, Inc. and the readings obtained on the electrometer, adeviation from the recommended procedure was used. This deviation involved a regressionanalysis of the results, and was used instead of determining the relationship graphically, toallow more precision in the results of the analysis. Results of regression analyses at twodifferent time periods indicate that the estimated value for the slope is significantly differentfrom 0 at the 5-percent level of significance, while the intercept is not. The coefficient ofdetermination, R2, indicates that 99.8 to 99.9 percent of the variation in the log10of thepercentage of chloride present in each of the three calibration liquids can be predicted fromthe millivolt readings. The results of the analysis of variance indicate that the error sum ofsquares for the predicted values is very small, much less than the error sum of squares forthe regression.
The readings obtained from the James Instruments' specific ion probe on samples from thetest slabs were converted to percent of chloride using the regression equations. The resultsfor the potentiometric titration procedure and the specific ion probe are presented inTable 3-3.
19
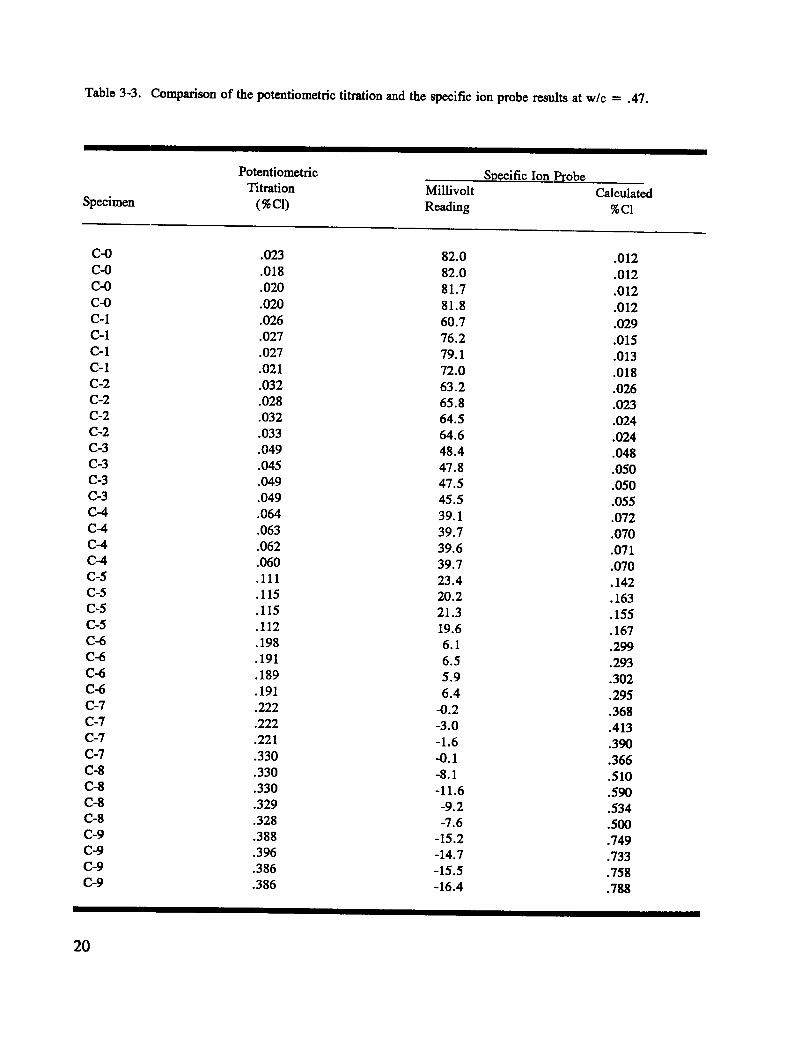
Table 3-3. Comparison of the potentiometric titration and the specific ion probe results at w/e -- .47.
Potentiometric Specific Ion ProbeTitration Millivolt Calculated
Specimen (% C1) Reading %CI
C-0 .023 82.0 .012C-0 .018 82.0 .012C-0 .020 81.7 .012
C-0 .020 81.8 .012C-1 .026 60.7 .029C-1 .027 76.2 .015C-1 .027 79.1 .013
C-1 .021 72.0 .018C-2 .032 63.2 .026C-2 .028 65.8 .023C-2 .032 64.5 .024C-2 .033 64.6 .024C-3 .049 48.4 .048C-3 .045 47.8 .050
C-3 .049 47.5 .050C-3 .049 45.5 .055C-4 .064 39.1 .072C-4 .063 39.7 .070C-4 .062 39.6 .071C-4 .060 39.7 .070
C-5 . 111 23.4 .142C-5 .115 20.2 .163C-5 •115 21.3 •155C-5 .112 19.6 .167C-6 •198 6.1 .299C-6 .191 6.5 .293C--6 .189 5.9 .302
C-6 .191 6.4 .295C-7 .222 -0.2 .368C-7 .222 -3.0 .413C-7 .221 -1.6 .390
C-7 .330 43.1 .366C-8 .330 -8.1 .510C-8 .330 -11.6 .590C-8 .329 -9.2 .534C-8 .328 -7.6 .500C-9 .388 -15.2 .749C-9 .396 -14.7 .733C-9 .386 -15.5 .758C-9 .386 -16.4 .788
20

A regression analysis to determine the relationship between the results from the standardpotentiometric titration procedure and the specific ion probe was performed. The regressionequation using the specific ion probe for the data presented in Table 3-3 is as follows:
TITR% = 0.00459 + 0.493 %JAM °s (3-2)
where
TITR% = the values for %C1 obtained from the potentiometric titration procedure, and%JAM = the readings obtained using the specific ion probe.
Results of the regression analysis indicate that the estimated value for the slope issignificantly different from 0 at the 5-percent level of significance, while the intercept is not.The coefficient of determination, R_, indicates that 99.1 percent of the variation in T/TR%
can be predicted from the independent variable %JAM°s (millivolt readings converted topercent chloride). The results of the analysis of variance indicate that the error sum ofsquares for the predicted values is very small in relation to the error sum of squares for theregression.
The regression analysis indicates that a strong relationship exists between the results from thestandard potentiometric titration procedure and the results obtained from tests conducted withthe specific ion probe. Although the results of the analysis indicate that the value for theintercept is not significantly different from 0 at the 5-percent level of significance, theintercept value obtained from the method of least squares is maintained to reduce the elementof bias in the estimates for the predicted values from the standard potentiometric titrationprocedure. A plot of the results obtained using the specific ion probe as a function of thepotentiometric titration results and the 95-percent confidence limits for the prediction intervalis presented in Figure 3-1.
Spectrophotometric Method
The DR/2000 spectrophotometric testing procedure developed by the Hach Company (21)includes specifying the chloride test procedure and entering the appropriate wavelength forthe chloride test. Two sample ceils are prepared, one with deionized water and the otherwith the filtered sample to be analyzed. Two ml of mercuric thiocyanate and 1.0 ml offerric ion solution are added to each sample and swirled to mix. After mixing, the twosamples are analyzed after a 2-minute waiting period. The blank cell is used to zero the
21

22
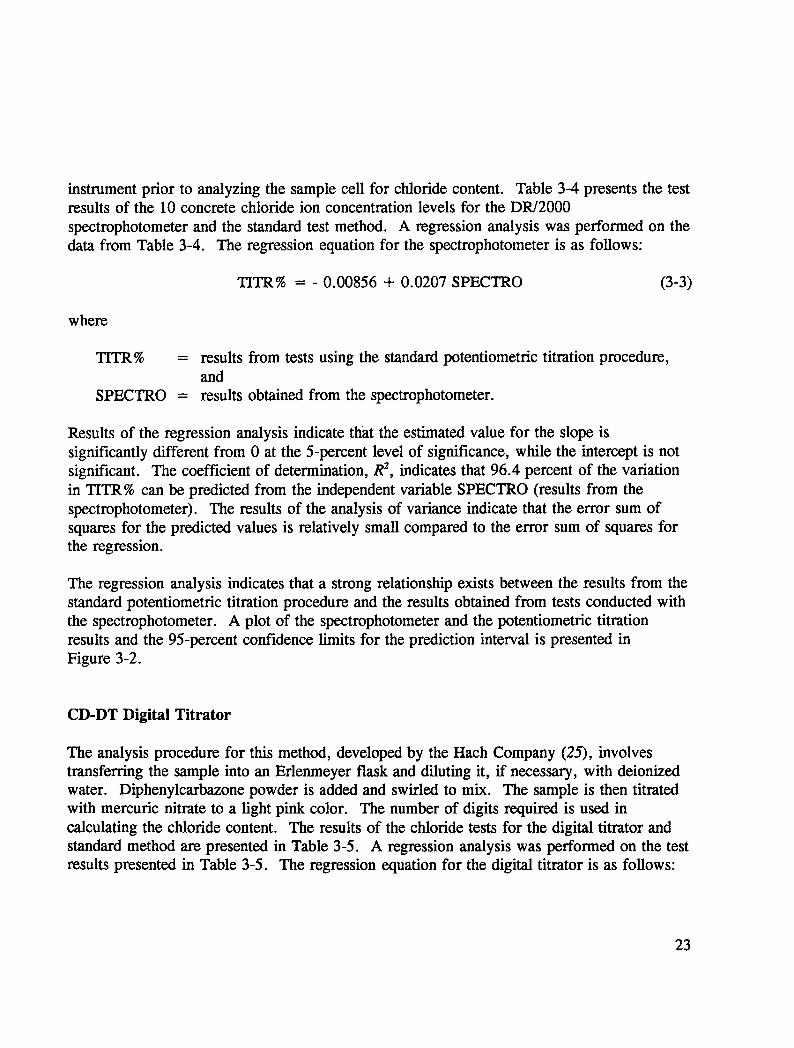
instrument prior to analyzing the sample cell for chloride content. Table 3-4 presents the testresults of the 10 concrete chloride ion concentration levels for the DR/2000
spectrophotometer and the standard test method. A regression analysis was performed on thedata from Table 3-4. The regression equation for the spectrophotometer is as follows:
TITR% = - 0.00856 + 0.0207 SPECTRO (3-3)
where
TITR% = results from tests using the standard potentiometric titration procedure,and
SPECTRO = results obtained from the spectrophotometer.
Results of the regression analysis indicate that the estimated value for the slope issignificantly different from 0 at the 5-percent level of significance, while the intercept is notsignificant. The coefficient of determination, R2, indicates that 96.4 percent of the variationin TITR% can be predicted from the independent variable SPECTRO (results from thespectrophotometer). The results of the analysis of variance indicate that the error sum ofsquares for the predicted values is relatively small compared to the error sum of squares forthe regression.
The regression analysis indicates that a strong relationship exists between the results from thestandard potentiometric titration procedure and the results obtained from tests conducted withthe spectrophotometer. A plot of the spectrophotometer and the potentiometric titrationresults and the 95-percent confidence limits for the prediction interval is presented inFigure 3-2.
CD-DT Digital Titrator
The analysis procedure for this method, developed by the Hach Company (25), involvestransferring the sample into an Erlenmeyer flask and diluting it, if necessary, with deionizedwater. Diphenylcarbazone powder is added and swirled to mix. The sample is then titratedwith mercuric nitrate to a light pink color. The number of digits required is used incalculating the chloride content. The results of the chloride tests for the digital titrator andstandard method are presented in Table 3-5. A regression analysis was performed on the testresults presented in Table 3-5. The regression equation for the digital titrator is as follows:
23

Table 3-4. Comparison of potentiometric titration and the speetrophotometer results at w/c = .47.
II
Potentiometric SpeetrophotometerTitration Chloride
Specimen (% Cl) (mg/L)
C-O .023 1.8C-O .018 2.7
C-O .020 2.3C-O .020 2.1C-1 .026 1.5C-1 .027 2.3C-1 .027 1. IC-1 .021 2.0C-2 .032 2.0C-2 .028 2.1
C-2 .032 1.8C-2 .033 1.8C-3 .049 2.4C-3 .045 2.9C-3 .049 2.1
C-3 .049 2.6C-4 .064 3.7C-4 .063 2.8C-4 .062 2.1
C-4 .060 3.4C-5 .111 4.8C-5 .115 6.2C-5 .115 6.5C-5 .112 7.9C-6 .198 9.8C-6 .191 9.9C--6 .189 9.7C-6 .191 9.5
C-7 .222 12.1C-7 .222 11.7C-7 .221 11.1C-7 .220 8.0C-8 .330 16.0
C-8 .330 16.2C-8 .329 19.7C-8 .328 17.7C-9 .388 15.8C-9 .396 17.5C-9 .386 19.1C-9 .386 18.1
24
0' o -
\ _ \ r\ ',\ \ i\o \ , , COo\ F---
\? \ \ .r\ \8\ r coo'\ \
\ '
_2
I \ \_\\\\I \
L so\\_ o\\ . _ o
--c_ \\ X_ X --_-° o_
" o_ =0"5 \ \ cD _._13,_ GO _o1,,..._ -- r_
_u") =n,'_ \ \ "©
\ \ _ =o
\ \ .=.... ,.... _.... ,.... ,.... ,.... ,.... _.... ,..,._..,, _.,.., o "_
C'4 _ 0 C) 0 .£•5 c5 c_ c5 c_ _ _ c5 _ c5 _ o _)I g,
(_I:D%) uo!.l-e._.l.t.L_!JteL.uo!4ue4oclR&f,,T,,I
25

Table 3-5. Comparison of potentiometrie titration and the digital titrator results at w/c = .47.
Potentiometrie Digital TitratorTitration Chloride
Specimen (% C1) (rag/L)
C-O .023 10.5C-O .018 5.0C-O .020 6.0C-O .020 7.0C-1 .026 8.5C-1 .027 11.0C-1 .027 2.5C-1 .021 7.0C-2 .032 10.0C-2 .028 5.0C-2 .032 8.0C-2 .033 8.0C-3 .049 9.0C-3 .045 7.5C-3 .049 13.0C-3 .049 10.0C-4 .064 13.0C-4 .063 14.0C-4 .062 15.0C-4 .060 12.0C-5 .111 25.0C-5 .115 16.0C-5 .115 18.5C-5 .112 22.0C-6 .198 30.0C-6 .191 30.0C-6 .189 32.0C-6 .191 32.5C-7 .222 34.0C-7 .222 31.0C-7 .221 35.5C-7 .220 33.0C-8 .330 52.0C-8 .330 55.0C-8 .329 51.0C-8 .328 50.0C-9 .388 59.0C-9 .396 63.0C-9 .386 55.0C-9 .386 56.0
26

TITR% = - 0.0238 + 0.00694 DIGITAL (3-4)
where
TITR% = the results from the test using the standard potentiometric titrationprocedure, and
DIGITAL = the results obtained from the digital titrator, also presented in Table 3-5.
Results of the regression analysis indicate that the estimated value for the slope issignificantly different from 0 at the 5-percent level of significance, while the intercept is not.The coefficient of determination, R2, indicates that 98.3 percent of the variation in TITR%can be predicted from the independent variable DIGITAL (readings from the digital titrator).The results of the analysis of variance indicate that the error sum of squares for the predictedvalues is relatively small compared to the error sum of squares for the regression.
The regression analysis indicates that a strong relationship exists between the results from thestandard potentiometric titration procedure and the results obtained from tests conducted withthe digital titrator. A plot of the digital titrator as a function of the potentiometric titrationresults and the associated 95-percent confidence limits is presented in Figure 3-3.
Quantab Titrator Strips
The Quantab titrator strips procedure was developed by Environmental Test Systems,Inc. (26). It involves weighing 10.0 g of the sample and adding 90 ml of boiling distilledwater, stirring constantly. The sample is stirred for 30 seconds, and after 1 minute it isstirred again for another 30-second period. Filter paper is folded to a cone and placed intothe beaker to allow some of the sample to f'dter through. A Quantab titrator strip is placedin the f'dtered portion of the sample and is left there until a dark blue color forms at the topof the strip. The reading of the Quantab titrator strip is used in determining the chloridecontent from a calibrated chart.
The titrator strips were somewhat difficult to read. The change in the color of the Quantabstrip to white indicated very low readings, which were considered unrealistic for the amountof chloride present in the samples. As a result, the highest reading that indicated a change incolor on the test strip was recorded for the result. The color change was not white but ayellow to a yellowish brown. Because these problems did occur, tests using the procedurefor water-soluble chlorides were not completed for all of the specimens.
27


Four samples from each of the 10 chloride-contaminated concrete specimens were tested fortotal chloride content (acid digestion procedure) using the Quantab titrator strips. The resultsobtained using this method are presented in Table 3-6. During this series of tests, theQuantab readings were more distinct and easier to read. The white color on the striprepresented higher readings from the previous procedure, indicating that more chloride wasbeing extracted from the sample. However, there were no secondary or partial color changesabove the white colored area as observed using the manufacturer's procedure.
Acid-digested samples analyzed using the Quantab titrator strips were compared to the resultsobtained from the potentiometric titration procedure. In comparing the results, a regressionanalysis was performed. The most appropriate regression equation for the Quantab titratorstrips was found to be:
TITR% = 0.0436 QTAB 1'5 (3-5)
where
TITR% = the results from tests using the standard potentiometric titration procedure,and
QTAB = the corresponding readings obtained for the Quantab titrator strips.
Results of the regression analysis indicate that the estimated value for the slope, .0436, issignificantly different from 0 at the 5-percent level of significance. The results of theanalysis of variance indicate that the error sum of squares for the predicted values (error) issmall compared to the error sum of squares for the regression.
The regression analysis indicates that a good relationship exists between the results from thestandard potentiometric titration procedure and the results obtained from tests conducted withthe Quantab titrator strips. A plot of the Quantab titrator strips number as a function of thepotentiometric titration results and the 95-percent confidence limits for the predicted valueare presented in Figure 3-4.
Comparison of the Test Methods
Following completion of the first series of tests, the selected methods were compared todetermine which method was more suitable for determining the chloride content of concretespecimens in the field. These comparisons were based on the accuracy in predicting resultsobtained using the standard potentiometric titration procedure, the costs associated with the
29

Table 3-6. Comparison of the potentiometric titration and the Quantab titrator strip results for acid soluble chloridesat w/c = .47.
Potentiometric Quantab Titrator
Titration Strip
Specimen (% Cl) Reading
C-O .023 .020C-O .018 .080C-O .020 1.20C-O .020 0.60C-1 .026 0.70
C-1 .027 0.60C-1 .027 0.80C-1 .021 0.60C-2 .032 0.80C-2 .028 0.80C-2 .032 0.60C-2 .O33 0.60C-3 .049 1.80
C-3 .045 0.80C-3 .049 0.85C-3 .049 1.00C-4 .064 0.50C-4 .063 1.25C-4 .062 1.10C-4 .060 1.40C-5 .111 2.15
C-5 .115 2.00
C-5 .115 2.05
C-5 .112 1.95
C.6 .198 2.60
C.6 .191 2.80
C.6 .189 3.20
C.6 .191 3.O0
C-7 .222 3.I0
C-7 .222 3.40
C-7 .221 2.95
C-7 .220 2.85
C-8 .330 4.20
C-8 .330 3.40
C-8 .329 2.95
C-8 .328 2.85
C-9 .388 4.30
C-9 .396 3.80
C-9 .386 4.35
C-9 .386 4.55
I
3O

0
", 0
\ ,, '\'\
\\ \\o \ ._\ o \ ."_
J,.
, \ o \', \\\ b
', \ \\ \ _ _U")o\ \ \ E "-
\° E _
\\\0\_ 0\ _. m\ "_E
\\ _[ \ _o0 r"
\ °\\\\ -- m\ o E
c \ [_ u e
\ F-NO' o'
_rvcn o\ ° \ ' >\ _E_ \ r -- ._
\ .-
.... , .... l .... i .... _.... _.... , .... , .... , .... _...... '.., ..... ,..'.., C) ._
oooooooooooooo_1 _
(_10%) uo!+ma_!±o!a_a_uo!_ua_od #
o_
31

prrchase of the equipment and chemicals necessary for analysis, the speed or time requiredto weigh, prepare, and analyze individual samples, the level of expertise required in usingthe procedure without sacrificing accuracy, and the limitations associated with using theprocedure :tn the field.
The standa:rd potentiometric titration method was used to standardize the 0.01N silver nitrateand sodium chloride solutions used for the analysis of chloride in accordance with AASI-ITOT260-84. 'rests for chloride content using the four selected methods were performed onstandardized solutions to verify their accuracy prior to testing the specimens. The test resultsfor all four selected methods were within the range of accuracy specified by themanufacturers.
As indicated from the analysis of the results obtained from the first series of tests forchloride, the highest accuracy is achieved using the specific ion probe, followed by thedigital titralor, the spectrophotometer, and the Quantab titrator strips (Table 3-7). Accuracyis considered the most important criterion for selecting the appropriate method since it bearsdirectly on the objective of the research--measuring the chloride content of bridges.
The initial cost of the specific ion probe was greater than the other selected methods. Thereare hidden costs associated with the spectrophotometer, the digital titrator, and the Quantabtitrator strips. Items such as filter paper, beakers, stirring rods, nitric acid, and deionizedwater are required for all three methods. Additional items such as funnels, funnelingapparatus, and pipets are required for the spectrophotometer and the digital titrator. Finally,a magnetic stirrer and magnetic stirring rods are desirable when using the digital titrator.
No special sample preparation is required for the specific ion probe. The probe can becalibrated in less than 10 minutes, after which samples can be weighed and analyzed in lessthan 10 minutes. The procedures for weighing and preparing the sample for thespectrophotometer and the digital titrator requires the same amount of time. After thesamples are prepared, the analysis procedure using the spectrophotometer requires a little lesstime than the digital titrator. The operator must pay particular attention during the titrationprocedure when using the digital titrator so that the midpoint of the titration will berecognized. The procedure for weighing and preparing the sample to be analyzed using theQuantab titrator strips does not require as much time as for the spectrophotometer and thedigital titrator. However, sometimes the operator may be required to wait as long as 20minutes before the results can be read using the Quantab titrator strips.
32

Table 3-7. Comparison of test methods.
Accuracy Level ofMethod R-sq (Adjusted) Cost _ Speedb Expertise c
Specific Ion Probe 99.0% $1,860.90 1 Simple
Spectrophotometer 96.3 % $1,363.57 2 Medium
Digital Titrator 98.3 % $ 156.74 3 Medium
Quantab Titrator Strips 91.2% $ 49.30 4 Simple
a Cost represents the initial cost of the equipment and the chemicals necessary for analyzing 40 specimens.b Speed represents the order in which samples may be weighed, prepared, and tested using each method.¢ Level of expertise gives an indication of how complicated each procedure is to use.
The analysis procedure for the specific ion probe was simplified for the operator, comparedto the original procedure developed by James Instruments. Essentially, the operator recordsreadings displayed by the electrometer while following a step-by-step procedure.Precautions must be followed in using this procedure, in order to obtain accurate results.Otherwise, the procedure is simple, quick, and straightforward. Procedures for thespectrophotometer and the digital titrator are a little more complicated than for the specificion probe. The operator not only needs to realize the importance of following the procedurecompletely, but also must be able to detect interferences that may occur and compensate forthem. The analysis procedure for using the Quantab titrator strip is a little more complicatedthan the procedure for the specific ion probe, but requires little technical expertise.
By considering each of the criteria for selecting the method for determining the chloridecontent of concrete, summarized in Table 3-7, the specific ion probe was determined to bemost suitable for the purpose intended. First of all, the apparatus required for thespectrophotometer and the digital titrator are more suited for use in the laboratory than in thefield. Second, both of these procedures require a certain level of expertise to achievemeaningful results. Finally, the Quantab titrator strips do not provide the accuracy that isdesirable for determining the time to depassivation and, at times, may require an excessiveamount of time for analysis. Therefore, the specific ion probe was investigated further tostudy the effects of cement contents and reaction temperature.
33

Effects of Cement Content on the Selected Method
The specific ion probe was tested to determine the effects that differences in cement content
representative of substructure and superstructure concrete have on measuring the chloridecontent. For this series of tests, the potentiometric titration procedure was used as thecontrol method in determining the chloride content of the test specimens. However, thepowdered concrete samples were screened, and the material larger than No. 50 mesh wasdiscarded prior to chloride content analysis.
The specific ion probe was subjected to testing concrete with water-to-cement ratios of .40and .50 at various chloride contamination levels. Chloride contaminations levels of 0.2, 0.8,1.6, 3.2, 6.4, 8.6, 10.8, and 12.8 lb C1/yd3 (0.1, 0.5, 1.0, 1.9, 3.8, 5.1, 6.4, and7.6 kg/m 3) of concrete were used for the specimens with a w/c equal to .40. Specimens witha w/c equal to .50 were tested at similar chloride contamination levels, with one exception.One specimen containing no added chloride was tested in place for the 0.2 lb Cl/yd 3(0.1 kg/m 3) contamination level. The results of the specific ion probe test and the standardtest method are presented in Table 3-8.
The milliw)lt readings for the specific ion probe, presented in Table 3-8, were converted topercent of chloride using the procedure presented in the first series of tests for chloridecontent determination. After the values for percent C1 as measured with the specific ionprobe were determined, the results presented in Table 3-8 were compared with the resultsfrom the first series of tests (Table 3-3). Graphical results of this comparison are presentedin Figure 3-5, which shows that there appears to be no significant effect of cement contenton the performance of the specific ion probe. The results obtained for specimens havingwater-to-cement ratios of .40 and .50, when compared to the results from the first series oftests, do not show specific trends.
A regression analysis was performed to determine the relationship between the results fromthe standard potentiometric titration procedure and the specific ion probe presented inTables 3-3 and 3-8. Weak correlations between cement content and potentiometric titrationresults were noted during the analysis confirming earlier suspicions that the results from thespecific ion probe were not significantly affected by differences in cement content. The mostappropriate regression equation using the specific ion probe for the data presented inTables 3-3 and 3-8 is as follows:
TITR% = 0.500 %JAMES °'s (3-6)
34

Table 3-8. Potentiometric titration and specific ion probe results for different cement contents.
Potentiometric Specific Ion ProbeTitration Millivolt Calculated
Specimen w/c (%CI) Reading %CI
DC-1 .40 .021 76.8 .015.40 .020 76.6 .015
DC-3 .40 .037 53.7 .041.40 .039 52.5 .043
DC-4 .40 .064 35.6 .088.40 .064 37.2 .083
DC-5 .40 .083 27 .127.40 .091 25.6 .135
DC-6 .40 . 158 9 .275.40 . 154 6.1 .312
DC-7 .40 . 184 1.9 .373.40 .188 .4 .398
DC-8 .40 .270 -3.2 .442.40 .264 -2.7 .433
DC-9 .40 .315 -9.2 .572.40 .315 -7.1 .522
EC-0 .50 .018 90 .008.50 .020 90.8 .008
EC-3 .50 .037 52.5 .039.50 .036 53.5 .038
EC-4 .50 .057 36.5 .078.50 .059 35.4 .081
EC-5 .50 .101 23.4 .135.50 .103 24 .132
EC-6 .50 .187 2.4 .329
.50 .185 5.9 .284EC-7 .50 .224 -2.9 .400
.50 .230 -1.3 .374EC-8 .50 .313 -7.5 .486
.50 .312 -10.9 .562EC-9 .50 .380 -13.4 .625
.50 .384 -14.2 .646
35

\ \
\ _ :o
\ ,, \\',\
b,-
" \ '\, \).
_ _ ot...)
o .I •
0 ql It* ..
,.- o
o • • • • \%..\ : •..I::,l.-)
.
'' ''i .... ]''''i ........ J .... I "'" ' i .... I .... i' ' ' I ' ; ' ,,_,.." "_
(_I:D54)uo!#Da$!l_l_#_mOl4U_4Od .4A
36 _

where
TITR% = the results from tests using the standard potentiometric titration procedure,and
%JAMES = the corresponding results for %CI obtained using the specific ion probe.
Results of the regression analysis indicate that the estimated value for the slope issignificantly different from 0 at the 5-percent level of significance. The coefficient ofdetermination, R2, is irrelevant in the regression analysis since the value for the intercept waspreviously determined to be equal to zero. The results of the analysis of variance indicatethe error sum of squares for the predicted values (error) is very small compared to the errorsum of squares for the regression. In summary, the results indicate that a strong relationshipexists between the results obtained using the specific probe and the standard potentiometric
titration procedure as evidenced by an F value of 10139.63.
Effects of Temperature on the Selected Method
The specific ion probe was also subjected to testing concrete at a single chloridecontamination level to determine the effects of temperature in measuring the chloride content.Concrete representative of bridge decks (w/c = .47) and having a chloride content of1.6 lb/yd 3 (1.0 kg/m 3) was selected for this series of tests. The physical characteristics ofthe concrete (Batch C-4), are presented in Table 3-1.
Samples were tested at temperatures ranging from 34 to 130°F (1 to 54°C) using theprocedure for the specific ion probe. The results are shown in Table 3-9. The miUivoltreadings for the specific ion probe are also presented in percent of chloride in Table 3-9,using the calibration procedure employed in the first series of tests for chloride contentdetermination. After the values for percent C1 as measured with the specific ion probe weredetermined, the results were compared with those for specimen C-4 from the first series oftests (Table 3-3) to determine the effects of temperature.
37

Table 3-9. Specific ion probe test results for the effect of reactiontemperature.
Specific Ion Probe
Test ReactionTemperature Millivolt Calculated Temperature
Specific (°F) Readin_ (% CI) (oF)
C-4 34 30.7 .099 49
C-4 34 32.4 .092 37
C-4 34 34.6 .084 42
C-4 34 29.3 •105 39
C-4 40 32.5 .095 46
C-4 40 31.4 .100 44
C-4 50 29.0 . 101 58
C-4 50 33.5 .083 58
C-4 50 32.8 .086 54
C-4 50 31.4 .100 57
C-4 50 35.6 .084 56
C-4 50 35.0 .086 59
C-4 50 38,5 .074 58
C-4 70 43.7 .059 77
C-4 70 42.2 .063 79
C-4 70 35.6 .084 79
C-4 70 43.5 .060 79
C-4 70 45.3 .055 83
C-4 70 44.9 .056 75
C-4 70 39.8 .069 80
C-4 70 40.9 .066 77
C-4 90 43.2 .060 92
C-4 90 41.1 .066 94
C-4 90 40.9 .066 94
C-4 90 42.7 .061 92
C-4 110 48.6 .047 113
C-4 100 48.8 .047 114
C-4 110 45.8 .054 114
C-4 110 47.3 .050 112
C-4 130 57.4 .033 123
C-4 130 53.8 .039 127
C-4 130 53.8 .039 127
C-4 130 51.5 .043 132
38

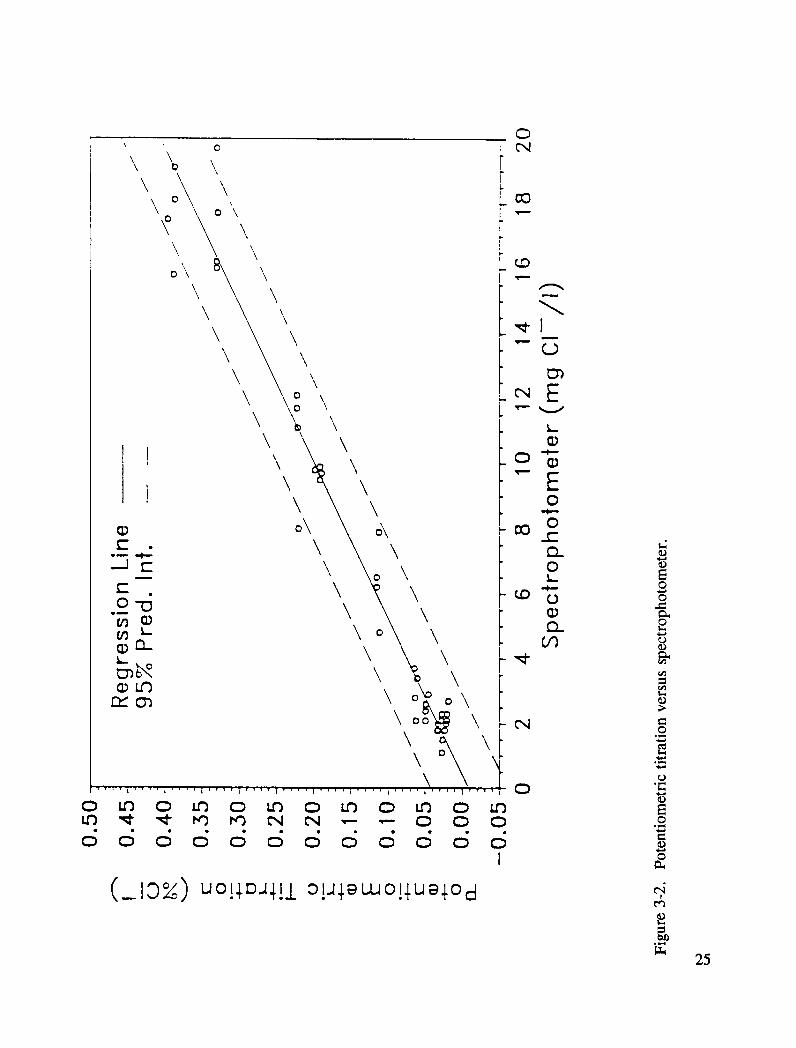
A regression analysis was performed to determine the relationship between changes in thereaction temperature and the results from the specific ion probe. The regression equation forthe effects of temperature using the specific ion probe is as follows:
ACTUAL - %JAMES = - 0.103 + 0.0119 REACTrEMP 5 (3-7)
where
ACTUAL - %JAMES = the difference in the results from tests using the specific ionprobe during the first series of tests as presented in Table 3-3and the corresponding results presented in Table 3-9, and
REACTrEMP = the various temperatures of the reaction resulting from the testprocedure, as presented in Table 3-9.
Results of the regression analysis indicate that the estimated value for the slope issignificantly different from 0 at the 5-percent level of significance, while the intercept is not.The coefficient of determination, Re, indicates that 84.7 percent of the variation in thedifference in the results from the first series of tests and the results presented in Table 3-9
can be predicted from the independent variable REACTTEMP (the reaction temperature forthe specific ion probe). The results of the analysis of variance indicate the error sum ofsquares for the predicted values (error) is small compared to the error sum of squares for theregression.
The results of the regression analysis support the determined relationship of the effects oftemperature for the specific ion probe. Though not strong when compared to results fromprevious analyses, the relationship does exist and, among other parameters, is evidenced byan F value of 171.01. Figure 3-6 illustrates the relationship between the correction factor forthe specific ion probe suggested by the results of the regression analysis and the reactiontemperature.
In order to further evaluate the effects of temperature, additional studies were carried outusing pure saline solutions at chloride concentrations of 0.0249, 0.2493, and 1.2465 percent(equivalent to 1, 10, and 50 lb/yd 3 [0.6, 6.0, and 29.8 kg/m3]) in lieu of solutions extractedfrom concrete. The purpose of using pure saline solutions was to eliminate possibleinterferences from extraneous ions. Two containers of each concentration level were
suspended in 2 in. (5 cm) of water by a styrofoam collar. The temperature of the water wasinitially decreased to 40°F (4.4°C) by the addition of ice into the water bath. The ice waterwas replaced with either cold or hot water to gradually achieve 10°F (5.6°C) increments to afinal temperature of 120°F (48.9°C).
39
\ - \\
\ o \ \\ \ \ .,--\ \\ _,o° \
\ , h
\ \ _o_\ \ r-,-_
\ ® \ f °\ \ \ v
\ U3
\ ° \ :\ oo o\ ;.\o° ° t- :n
\ E -131,..
\ \ L =I I \ \ , o.I \ \ ! E
" 1--- A\ '° \ : c =
.-.Ir" 0,, m_
c \ \ 1: _0 -6 \ \ \ F co._ [ a
Q.1 o
a_ \ \ F ,-
° \!° 8...................I.........:.........:.........l.........f.........:.........,...........,.......=.........1 1.0 0"_
o. o. o. o o o o o. o o o. o _.
(_13%) s_u_nr' % -Inn_,aV ii,,6I
40 _o ._

The effect of temperature on the pure chloride concentration was investigated using two fixedprobe-meter combinations (FPMC A and FPMC B). Two millivolt readings were recordedfor each temperature level for each of the three chloride concentration levels. The predictedchloride concentrations were calculated for each millivolt reading, as shown in Table 3-10.For millivolt to percent chloride conversion, the triple set of calibration solutions was usedwith the following results:
StandardPredictor Coefficient Deviation t-Ratio P
Constant -0.41450 0.001810 -22.90 0.028mV -0.0179332 0.0002693 -66.59 0.010
s = 0.02123
R_ (adj) = 100.0%
LOG Y = -0041450 - 0.0179332 mV (3-8)
The statistical analysis of the parameters of the equation produced the following:
Hypothesis: ot = 0 t_,_t = +12.706Alternative: a _ 0 tcalo = -22.90
Hypothesis: /_ = 0 t0nt = 12.706Alternative: fl ;_ 0 t,lc = -66.59
The results indicate that as temperature increases, the miUivolt readings increase.
The difference between the predicted and actual percent chloride and temperature relationwas investigated statistically to determine the significance of each slope at different chlorideconcentrations:
41

Table 3-10. Effects of temperature on the percent chloride prediction.
Concentration: 0.0249% Chloride
Reading No. 1 Reading No. 2
Temperature Millivolt MiUivolt(OF) Reading %C1 Reading %CI
FPMC A50 59.4 0.0315 64.10 .025860 60.9 0.0295 64.70 .025170 63.2 0.0268 67.60 .022280 66.0 0.0238 69.90 .020190 65.7 0.0241 69.60 .0205100 76.2 0.0157 78.10 .0145120 80.2 0.0133 80.70 .0130
FPblC B50 32.2 0.0594 35.90 .050160 38.5 0.0445 42.50 .037070 45.2 0.0327 49.60 .026780 49.7 0.0266 53.30 .022590 66.2 0.0159 70.60 .0131100 67.4 0.0151 71.10 .0128120 75.5 0.0106 79.20 .0090
Concentration: 0.2493% Chloride
Reading No. 1 Reading No. 2
Temperature Millivolt Millivolt(° 17) Reading %CI Reading %CI
FPMC A50 5.9 0.3064 3.20 .343760 7.1 0.2912 6.90 .293670 8.1 0. 2790 7.80 •282680 9.3 0.2652 8.50 .274390 10.1 0.2386 10.40 .2357100 13.3 0.2091 14.00 .2032120 16.6 O.1825 16.30 •1848
FPMC B50 -8.8 0.3912 -9.20 .398560 -7.5 0.3685 -7.40 .366870 -4.9 0.3270 -4.40 .319680 -3.1 0.3010 -3.00 .299790 4.4 0.2331 5.20 .2251100 6.5 0.2127 6.90 .2091120 9.8 0.1843 11.10 .1742
42

Table3-10. (continued).
Concentration: 1.2465% Chloride
Reading No. 1 Reading No. 2
Temperature Millivolt Millivolt(OF) Reading %C1 Reading %C1
FPMC A
50 -37.3 0.0315 -37.4 0.025860 -37.I 0.0295 -37.1 0.025170 -35.5 0.0268 -35.6 0.022280 -35.8 0.0238 -36.I 0.020190 -33.4 0.0241 -34.7 0.0205
100 -32.6 0.0157 -33.1 0.0145120 -31.0 0.0133 -31.6 0.0130
FPMC B
50 -43.7 0.0594 -41.6 0.050160 -43.5 0.0445 -43.0 0.030770 -43.I 0.0327 -42.7 0.026780 -43.8 0.0266 -43.5 0.022590 -40.0 0.0159 -39.9 0.0131100 -39.3 0.0151 -39.4 0.0128120 -40.1 0.0106 -37.4 0.0090
43

Cbncentration Level 0.0249
StandardPredictor Coefficient Deviation t-Ratio P
Constant 0.016389 0.002590 6.33 0.000
Temp -0. (100238 0.0000307 -7.76 0.000
s = 0.002561
g 2 (adj) = 82.0%
Concentration Level 0.2493
StandardPredictor Coefficient Deviation t-Ratio P
Constant 0.17330 0.01138 15.22 0.000
Temp -0.0020414 0.0001348 -15.14 0.000
s = 0.01126
R_ (adj) = 94.6 %
Concentration Level 1.2465
StandardPredictor Coefficient Deviation t-Ratio P
Constant 1.23516 0.08576 14.40 0.000
Temp -0.010078 0.001016 -9.92 0.000
s = 0.08481
R2 (adj) = 88.2%
A t-test was used to compare the slopes. Using the 0.0249 concentration as a base, thehypothesis and t results are shown below:
44

Hypothesis: ot = -0.002054 tcrit = +2.571Alternative: a ;_ -0.002054 tc,_o = 4.1575
Hypothesis: o_ = -0.010078 ted t = __+2.571Alternative: _ _ -0.010078 tcalc = 22.6848
The results of the test concluded that significant differences exist between slopes at thedifferent concentrations. This result implies that each concentration level reacts differently to
temperature. Therefore, a uniform temperature correction equation is an invalid correctionmethod.
45

4
Field Validation of the Selected Method
Site Selection
For field validation, 13 bridges were selected for testing from four different environmentalexposure groups. The different environmental exposure groups were defined according tothe soil freezing index. The soil freezing index combines elements of time and temperatureinto one component of measure in terms of degree days. One degree day is defined as oneday having a mean air temperature corresponding to I°F (0.6°C) below freezing, or 31 °F(-0.6°C) (27). The soil freezing index was considered appropriate for defining differentenvironmental exposure groups relative to the amount of salt being applied on bridges.
Florida was selected to represent the coastal region with 0 freezing-degree days per year. Anon-coastal area of Virginia was selected, having 0 freezing-degree per days per yearaccording to the index. The third environmental exposure group, Pennsylvania, has 0 to 500freezing-degree days per year, and Wisconsin was designated to represent the fourthenvironmental exposure group having 1,000-plus freezing-degree days per year (27).
After the bridges were selected for field validation of the ion probe, the following tests weredone:
• Modifications of the procedure for the specific ion probe,
• Development of the sampling procedure,
47

• Determination of the most viable method of weighing samples,
• Determination of whether samples needed to be crushed prior to analysis, and
• Development of the final procedure for validating the accuracy of the results for thespecific ion probe.
Sample Collection Equipment and Procedure
Obtaining a representative sample of the material to be analyzed is considered as important asthe accuracy of the method used for analyzing concrete samples for chloride. The standardprocedure for sampling in accordance with AASHTO T260-84 (23) provides that the drill bitused for the pulverizing method of sampling be of sufficient diameter to allow arepresentative sample. The hole is drilled with a rotary hammer to within 1/2 in. (13 mm)of the desired drilling depth by setting the depth indicator on the drill. Next, the hole iscleaned thoroughly using a blow out bulb. The depth indicator is again reset for anadditional 1/2-in. (13-mm) drilling to collect the sample. For this portion of the drillingoperation, some users elect to use a bit that is 1/4 in. (6 mm) smaller in diameter to preventcontamination from the sides of the drill hole. Ten grams of sample are collected from thepowdered concrete remaining in the drill hole using a spoon, and the sample is placed in asample container. Prior to testing, the sample is crushed until the entire sample passesthrough a No. 50 sieve.
In developing the sampling procedure for testing the 13 bridges, researchers considered thesize distribution of the coarse aggregate as the primary factor influencing the test results forchloride. The sampling procedure selected for field use consisted of drilling holes using arotary impact drill and a 1 1/8-in. (29-mm) -diameter Heller bit. This diameter wasconsidered sufficiently large to negate or minimize the influences that the coarse aggregate(3/4-in. (19 mm) maximum size) may have on the test results. Centering the drill hole overa large aggregate particle was not considered likely. The Heller bit is designed to allow drillcuttings to be removed from the drilling surface by means of a vacuum system. A driUstopwith 1/4-in. (6-mm) division marks controls the drilling depth. A sampling collection unitwas designed to decrease the time required to collect samples when compared to the standardprocedure described in AASHTO T260-84 (23). The sample collection system consists of a2.25 hp wet and dry vacuum cleaner fitted with a plexiglass sample collection chamber,coffee f'dters, and plastic tubing connected to the Heller bit assembly. The systemsignificantly reduces the concrete sample collection time. Figure 4-1 shows the sampleextraction and collection system in operation. Removal of the collected sample on the filteris shown in Figure 4-2.
48

Figure 4-1. Sample extraction and collection system in operation.
Figure 4-2. Sample collected on filter removed from collection chamber.49

Other equipment included a single phase generator and pachometer. The generator was usedto supply ,_,lectricity for the rotary impact drill and the sample collection unit. A pachometeris a magnetic flux device that is used for determining the position of the reinforcing steel inthe concrete.
Calibration of the Specific Ion Probe
During the; laboratory investigation of the specific ion probe, certain trends were noticed in
the readings obtained when measuring concrete specimens for chloride content. In addition,James Instruments, Inc. (communication with James Instruments, Inc., 1989) was contacted
regarding factors that may reduce the accuracy in the results obtained when using the specificion probe. Subsequently, the procedure for measuring the chloride content was modified.
Modifications of the procedure for measuring the chloride content in concrete with thespecific ion probe required interpretation of the trends in the readings on the electrometerduring the course of an observation. Three minutes after waiting for the reading on thespecific ion probe to stabilize, subsequent changes in the electrometer are recorded. Threeexamples are presented below:
Example 1 Example 2 Example 3
88.3 88.3 88.388.1 88.1 88.288.0 88.0 88.187.9 88.1 88.088.0 88.0 87.987.9 88.0 88.088.0 87.9 87.9
In the examples presented, the appropriate reading on the electrometer to record is 88.0 mV.
However, any reading within 0.1 or 0.2 mV of this number will not reduce the accuracy ofthe final results significantly. The actual trends observed during use may not be exact butshould be similar. Abnormal errors in the results using the specific ion probe may occur ifcertain prex:autions are not observed. Precautions recommended by James Instruments, Inc.to prevent the occurrence of this type of error are presented in Appendix A.
50
The procedure for testing concrete specimens using the specific ion probe was modified priorto the field investigation in an attempt to improve the accuracy and the repeatability of themeasurements and to minimize errors associated with different operators.
The specific ion probe is calibrated against a set of three standard liquids containing 0.005-,0.05-, and 0.50- percent chloride each time it is used. The probe is filled with a solutioncontaining a wetting agent until the level reaches the filling hole. The voltmeter is turnedon, and the probe is placed in each liquid for approximately 3 minutes or until the readingdoes not change more than 0.2 mV during a 60-s period. The probe is rinsed with distilledwater after each test. The following experimental procedure was used to determine thevariability between each batch of tests and within each set of tests:
1. Powdered samples were taken from seven concrete specimens cast in the laboratorycontaining 0.0-, 0.4-, 1.6-, 3.2-, 6.4-, 10.8, and 12.8- percent chloride. Using a masonrybit 3/4 in. (19 mm) in diameter, 2-in. (5-cm) holes were drilled vertically into the concretespecimens. The material passing a No. 50 (300 #m) sieve was placed into beakers and ovendried.
2. The voltmeter was turned on and the specific ion probe was calibrated using three sets ofthree standard liquids containing 0.005-, 0.05-, and 0.5- percent chloride.
3. Two 3.0-g samples were tested from each specimen using the modified specific ion probemethod described in Appendix A.
4. The voltmeter was turned off after all specimens were tested; steps 2 and 3 were repeatedfour times.
The log (base 10) of the standard liquids (dependent variable) was regressed against thereading from the probe (independent variable). One regression equation was produced foreach set of standard liquids. The general form of the resultant regression is as follows:
(%C1) = 10 Ia+b(mV)] (4-1)
51

where
a and b = regression coefficients,
mV = electrometer reading with the probe placed in the standard chloride solution,and
%C1 = chloride content of the standard chloride solution.
The relationship between the potentiometric titration values (percent chloride) and thespecific ion probe results to the 0.8th power (percent chloride °'s) is shown in Figure 4-3.The majority of the results fall inside the 95-percent prediction interval, indicating that theresults are consistent and repeatable at the 2.5-percent level of significance.
To examine the variance among results from three sets of standard liquids and the varianceamong four calibration runs, a two-way analysis of variance test was performed. The resultsare presented in Table 4-1. The total variation is partitioned into four sources: variation dueto sets; variation due to calibration runs; variation due to interaction between sets and runs;and variation due to error.
Three tests based on mean squares (MS) results were performed to measure the strength ofthe relationship. The fh'st test examined the interaction between the sets and the calibrationruns; the second test examined the effect of the sets; and the third test examined the effect ofthe calibration runs. Tests 1 through 3 indicated no interaction between sets and batches orwithin the sets or batches. Thus, the sets of standard liquids and the calibration runs areindependent.
The two-way analysis of variance tests illustrate that the specific ion probe producesconsistent results with a very small variance, independent of the number of samples perspecimen and the calibration run. The majority of the variance is due to the specific ionprobe, as shown by the magnitude of the sum of squares value for the error term. Althoughno reaction temperatures were recorded, it is suspected that the major portion of the variance
is associated with varying reaction temperatures. The calibration procedure provided byJames Instrument Company uses an upper chloride concentration of 0.5 percent. Therefore,it is inadvisable to extrapolate potentiometric titration values for specific ion probe readingsbeyond this limit unless the calibration range is expanded.
52
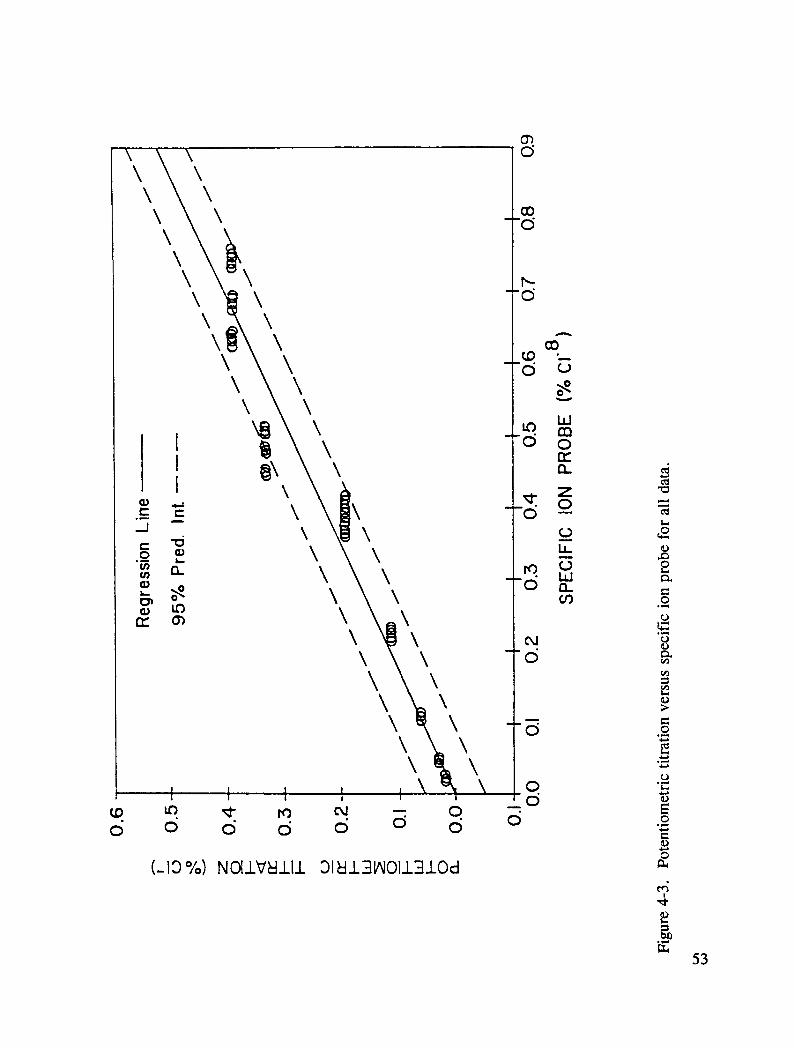
0"_0
\\ \
\\\ r--\ \ o\ \
\ \ ---"LIJ
I \ on-
I \ z "_.__.,-- \ --
0 _ \ \ LI-"_ n o 2
\ \ d
l-i
\ \ -*i*,._
to0 "I::::
0
o d d d d c_ o o ._
(-10%) NOIIVhlIII Dlhll31AlOll3lOcl_6
53

Table 4-1. Output from two-way analysis of variance for the specific ion probe (percent chloride).
Degrees of Sum of Mean
:_ource Freedom Squares Squares
Set 2 0.0302 0.0151
Run 3 0,0017 0.0006
Interaction 6 0.0003 0.0001
E_or 156 7.7357 0.0496
Total Variation 167 7.7679
Analysis of Weighing Methods
The specific ion probe method requires a 3.0-g sample. In the original James Instrumentsprocedure (20), a 3.0-g sample is measured using two quantities of a 1.5-g capacity plasticvial. The accuracies of a field balance and a triple beam balance were investigated tostreamline the procedure for sample quantification. Samples were prepared and re-weighedon a Mettler I-I31 AR Precision Scale to the nearest 0.0001 g. The AASHTO Test T260-84
requires the concrete powder to pass a No. 50 (300 gm) sieve. Therefore, only materialspassing this sieve were used in weighing accuracy analysis. The following cases wereadopted:
Case 1" The accuracy of a single 1.5-g plastic vial. A sample of concrete powder is firmlycompacted to a premeasured red line using the flat end of a pen. Seventy measurementswere recorded.
Case 2: The accuracy of a set of 20 plastic vials, each vial prepared using the methoddescribed in Case 1.
54
Case 3: The accuracy of a set of 35 3.0-g samples consisting of paired samplesfrom Case 1.
Case 4: The accuracy of 30 3.0-g samples weighed on a James Instruments, Inc. fieldbalance.
Case 5: The accuracy of 30 3.0-g samples weighed on an Ohaus 800 Series Triple BeamBalance.
Normal probability plots were generated and used to ensure that a sufficient number ofsamples were prepared and that these represented a random sample from a normaldistribution. The results indicate that it is reasonable to assume that the data were originated
from a normal population.
The t-distribution was used to calculate the 95-percent confidence interval since the truestandard deviation of the population was not known. This assumption is valid since the t-distribution approximates the normal distribution for 30 samples or more. The 95-percentconfidence interval indicates the range of values that the instrument is capable of weighingwith this level of accuracy. A smaller interval would connote a more precise value of themean weight.
The t-test was used to f'md the mean weight of the concrete powder using differentinstruments. For the first trial, the expected weight was used in the formulation of the nullhypothesis. In all cases, this resulted in very small p-values, indicating that the mean is notclose to the expected weight. Using values closer to the sample mean for the second trialresulted in the majority of p-values being close to 1.0, indicating that the sample mean ismore representative than the expected weight. The results of various weighing methods arepresented in Table 4-2. In summary, the accuracy in the James procedure (vials) wasdetermined to be 3.04 _+.05 g. Using this procedure in the field was determined to be verytime-consuming. The time required to weigh the samples in the field ranged from 5 to 6minutes. The balance supplied by James Instruments, Inc. did not maintain sufficientaccuracy for weighing the concrete specimens. However, the accuracy for a triple beambalance, 3.04 _.+.05 g, was considered acceptable. Consequently, the triple beam balance isrecommended. It requires a weighing time of 1 i/2 to 2 minutes for each specimen.
55

Table 4-2. Results of various weighing methods.
Number of Standard 95-PercentCase Measurements Mean Deviation Confidence Interval
I. 1.5g vial 70 1.52 0.056 1.51 - 1.54
2. Set of vials 40 1.48 0.042 1.47 - 1.49
3. 2 x 1.5g vials 35 3.04 0.090 3.01 - 3.07
4. Field Balance 30 2.06 0.110 3.02 - 3.10
5. Triple Beam Balance 30 3.04 0.050 3.03 - 3.06
Note: The 95-percent confidence interval is calculated assuming a t-distribution.
Crushed Versus Uncrushed Sample
The first 20 samples collected from a bridge in Pennsylvania were tested using the specificion probe to compare the test results for chloride from samples that were crushed to pass aNo. 50 (300 #m) sieve with samples that were not crushed prior to testing for chloride. The
initial results indicated a good relationship between the test results. Therefore, the remainingspecimens were not crushed in the field prior to testing for chloride. Subsequently, 20samples from one bridge in each of the four states were tested prior to crushing and aftercrushing to verify the relationship between crushing and not crushing the concrete powderedsamples. The results of the tests for chloride on 80 samples from bridges in Pennsylvania,Virginia, Florida, and Wisconsin are presented in Table 4-3. This table presents the testresults using the standard potentiometric titration procedure and the results for the specificion probe on specimens that were not crushed and on specimens crushed to pass a No. 50(300 #m) sieve.
The results presented in Table 4-3 were analyzed to determine the relationships between thesamples that were crushed versus samples obtained prior to crushing using regressionanalysis. The regression analysis equation for the relationship between samples that werecrushed and uncrushed prior to being subjected to chloride content determination using thespecific ion probe is as follows:
56

Table 4-3. Fidd validation test results.
Potentiometric Specific Ion ProbeTitration Test Results
Sample Results Crushed UncrushedState Bridge Number (%CI) ( %CI) ( %CI)
PA 11-15/35NB B-I .076 .088 .099
2 .027 .038 .035
3 .014 .023 .016
4 .018 .021 .013
G-1 .047 .055 .0732 .019 .025 .0163 .018 .025 .021
H-3 .027 .037 .036
I-I .III .164 .192
2 .025 .043 .032
PI-2 .280 .384 .505
3 .081 .138 .1254 .019 .030 .0165 .014 .023 .014
P2-2 .032 .047 .0423 .013 .025 .017
4 .015 .024 .014
C1-4 .015 .022 .016
C2-3 .025 .034 .0324 .015 .025 .017
VA I81/927 NB A-1 .256 .314 .3972 .096 .149 .1733 .030 .050 .038
4 .020 .023 .021
B-I .389 .460 .850
2 .183 .419 .367
3 .216 .322 .353
D-I .380 .641 .855
3 .142 .288 .299
4 .I01 .181 .207
5 .074 .123 .123
57

Table 4-3. (continued)
Potentiometric Specific Ion ProbeTitration Test Results
Sample Results Crushvd UnerushedState Bridge Number (%C1) (%C1) (%C1)
I-I .220 .274 .3782 .124 .188 .2263 .051 .088 .0814 .021 .037 .033
K-2 .107 .150 .1524 .025 .031 .025
L-1 .258 .327 .5252 .142 .205 .2634 .039 .074 .056
FL Rt. 312 FI-6 .106 .144 .172
F2-2 .503 .750 .8493 .333 .600 .5024 .206 .403 .4865 .231 .428 .3996 .144 .242 .212
PI-1 .338 .363 .5092 .260 .406 .3413 .170 .250 .2284 .120 .174 .1675 .073 .101 .1036 .026 .038 .031
P2-1 .146 .180 .245
2 .120 .151 .1643 .097 .129 .1304 .053 .074 .0815 .025 .042 .044
6 .018 .026 .020
P3.-4 .013 .022 .0155 .011 .019 .013
58

Table 4-3. (continued)
Potentiometric Specific Ion ProbeTitration Test Results
Sample Results Crushed UncrushedState Bridge Number (% CI) (% CI) (% CI)
WI Rt. 252WB B-2 .453 .527 .7174 .220 .285 .2945 .132 .180 .167
C-1 .319 .550 .5913 .265 .348 .3414 .148 .252 .264
D-2 .344 .549 .7573 .365 .512 .6054 .220 .382 .3815 .138 .228 .2236 .054 .072 .067
K-4 .144 .202 .1845 .I01 .125 .117
6 .040 .057 .045
L-5 .155 .193 .2196 .077 .089 .086
BWI-1 .605 .778 1.0513 .134 .208 .2974 .213 .282 .4175 .202 .275 .390
59

1/CRUSH = - 0.723 + 1.96 (1/NOTCR °75) (4-2)
where
CRUSH = the results of the analysis for percent C1 using the specific ion probe onsamples presented in Table 4-3 that have been crushed to pass a No. 50(300/zm) sieve, and
NOTCR = the results of the analysis for percent C1 using the specific ion probe onsamples presented in Table 4-3 that have not been crushed.
Results ot' the regression analysis indicate that the estimated value for the slope issignificantly different from 0 at the 5-percent level of significance. The coefficient ofdetermination, R2, indicates that 97.7 percent of the variation in the dependent variable, theinverse of the results for the samples that were crushed, can be predicted from theindependent variable, representing the results obtained from samples prior to crushing. Theresults of the analysis of variance indicate that the error sum of squares for the predictedvalues is very small in relation to the error sum of squares for the regression.
The regression analysis indicates that a strong relationship exists between the results for thesamples that were tested with the specific ion probe prior to crushing and the results obtainedafter crushing the samples to pass a No. 50 (300 _m) sieve. A plot of the results obtainedusing the specific ion probe illustrating the relationship between crushed and uncrushedsamples and the 95-percent confidence limits for the prediction interval is presented inFigure 4-4.
The regression equation for the relationship between the results from the potentiometrictitration procedure and the specific ion probe for samples that were not crushed is:
TITR% = - 0.00895 + 0.513 (NOTCR °'g) (4-3)
where
TITR% = the results of the analysis for percent chloride using potentiometrictitration on samples in Table 4-3 that were not crushed, and
NOTCR = the results of the analysis for percent chloride using the specific ionprobe on samples in Table 4-3 that were not crushed.
60

\\ \
\o o\ o\ \ I\ \ c:_
o \o '_\ \ .,--
\ \ r-,.
I I \ \ - _ =
c \ \ I ±o'-d \ \ :
L \ \ __ff'l =
......... I ......... ] ......... I ......... i" ........... _
m _ m _ u_ m u_
(_13 % /L) O"L- S'l'InS_kl P_qSnJ9#
.ul
_ 61
Results of the regression analysis indicate that the estimated value for the slope issignificantly different from 0 at the 5-percent level of significance, while the intercept is not.The coefficient of determination, R:, indicates that 95.4 percent of the variation in TITR%can be predicted from the independent variable NOTCR °'8. The results of the analysis ofvariance indicate that the error sum of squares for the predicted values is small in relation tothe error sum of squares for the regression.
The regression analysis indicates that a strong relationship exists between the results from thestandard potentiometric titration procedure and the results obtained from tests conducted withthe specific ion probe on uncrushed samples. A plot of the results obtained for theuncrushed samples using the specific ion probe as a function of the potentiometric titrationresults and the 95-percent confidence limits for the prediction interval is presented inFigure 4-5.
62
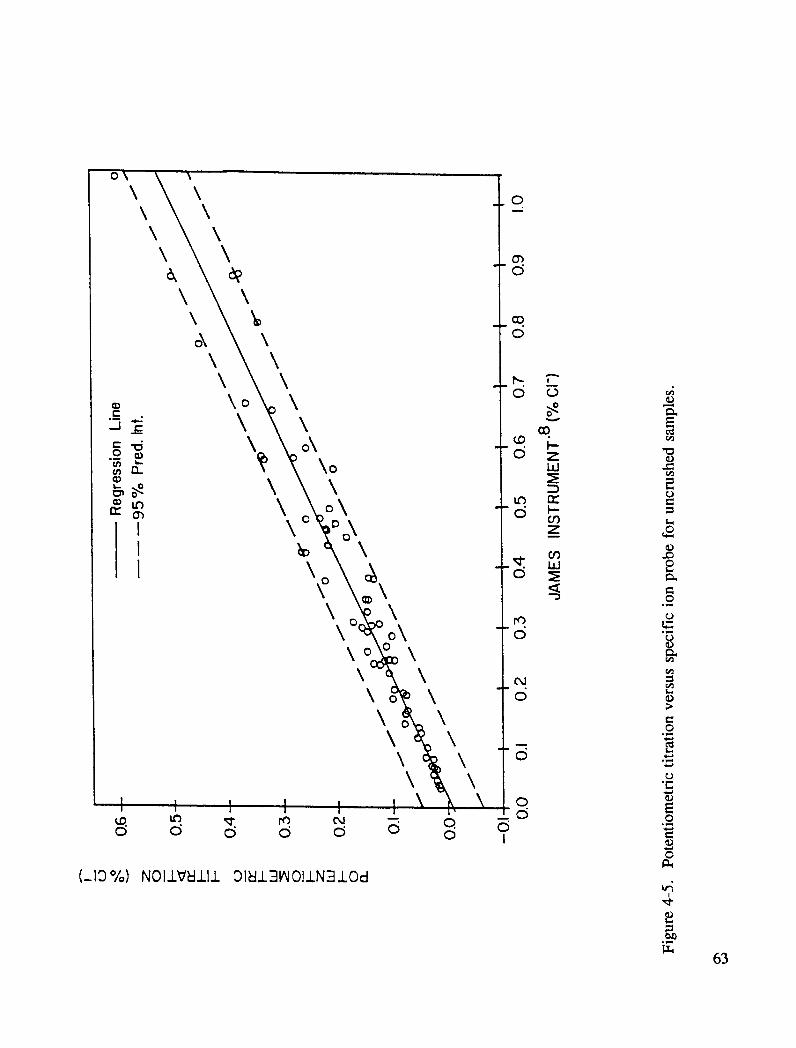
\ \ o\ \\ \\ \ 0_
\ \
o\ \ oX \\ \ _- ,_'2
= \o \ d o o"n__ \ mg_, o\ d _-._ m Z o
m d I- =
I \ ,Oo\ _ _oI _ \ cn 2
I X\o ,,, o-_ .0
\. o\ o "_
\ \ _ =\ \ o _,\ \ =o
\ \ o ._o
oo d d 0 0 o o I
0
(__13%) NOI.LV_I.LI.L 31_.L31AIOIJ..N3.LOd
63

5
Method Enhancement Studies
Needs
The present standard method for the determination of the chloride content of concrete,AASHTO T260-84, is too laborious and costly to be used to assess the present chloridecontamination level of concrete bridges. In Chapter 3 of this volume, four alternativemethods were investigated. It was concluded that the specific ion probe method was themost viable for both field and laboratory testing of powdered concrete samples. Theprocedure was shown to be accurate, fast and economical. However, the chloridemeasurement process is temperature-dependent, with the rise in temperature of the extractionsolution being a function of the type of the coarse aggregate. The acidic extraction solutionreacts more vigorously with basic aggregates such as limestone, which results in highertemperatures during measurement. Some means of temperature compensation, then, needs tobe applied to determine the standard chloride content equivalence. Also, at chloride contentsgreater than 0.5 percent, the variability of the chloride measurements increases.Furthermore, the proprietary concrete digestion solution is relatively expensive. A genericsolution would ensure that the procedure could always be done on a single, common basis.
Objectives and Scope
The objectives of the enhancement studies are to develop an inexpensive digestion solutionand improve the accuracy of the measurement procedure, especially at higher chloridecontents. The procedure should be sufficiently accurate to permit the chloride content
65

measurements to be used to determine the chloride diffusion constant for individual bridgecomponents.
The scope of the work presented in this chapter is limited to developing a chloride digestionsolution and procedure for measuring the chloride content of powdered concrete samplesusing a specific chloride probe and potentiometer. The scope includes the followingactivities:
• Selecting a chloride ion specific probe;
• Selecting a potentiometer;
• Developing a powdered concrete digestion solution;
• Expanding the calibration range for the chloride specific ion probe;
• Validating the revised chloride measurement procedure using powdered concretesamples taken from bridges in Florida, Virginia, Pennsylvania, and Wisconsin; and
• Determining the influence of operator variance for the developed chloridemeasurement procedure.
Generic Equipment Specifications
The approach used to accomplish the objectives here was to search for commerciallyavailable specific chloride probes and compatible potentiometers. In order to be useable inthe field and the laboratory, the probe must:
• Be rugged (able to withstand accidental falls);
• Be a self-contained unit having its own reference junction;
• Be resistant to acidic solutions;
• Require little expertise to maintain;
• Have a chloride solution detection range from 0.001- to 1.25-percent chloride.
66

The potentiometer must:
• Be rugged and portable;
• Have a battery operating life of at least 1000 hours;
• Have a range of ___2 V with a resolution of 1 mV in the + 200 mV region;
• Have input impedance greater than 20 Mr;
• Have a temperature measurement function (Type K or T thermocouple) with aresolution of 1 °F (0.5°C).
A search of the commercial literature disclosed only one manufacturer of a chloride ionprobe meeting the project criteria, Orion Research, Inc., Boston, MA. The Orioncombination chloride probe, model 9617B, is a solid-state probe requiring no referenceprobe. The polymer body is acid resistant with operating pH and temperature ranges of 2 to12 and 50°F to 122°F (10°C to 50°C), respectively. Chloride solution concentrationmeasurement range is 0.00018 to 3.5 percent. For comparison purposes, chlorides in adigested 3.0-g powdered concrete sample, diluted in a 100-ml solution having a measuredchloride content of 0.00018 percent would be equivalent to 0.24 lb C1/yd3 (0.14 kg/m 3)
concrete, whereas 50 lb C1/yd3 (29.75 kg/m 3) of concrete would be a 0.0375-percentsolution.
It must be stated that the presence of OH, S, Br, I, and CN in the final measurementsolution will interfere with the chloride specific ion probe's measurement of chlorides presentin the solution. Therefore, the test method may not accurately determine the chloride contentof concrete made with aggregates that contain pyrite, for example.
A search of the commercial literature disclosed several manufacturers who make a
potentiometer that meets the requirements. One is Beckman Industrial Corporation, SanDiego, CA. The Beckman model 110T was used for this project. It has input impedance of22 Mr, resolution of 0.1 mV in the __+200 mV DC range and 1 mV in the __+2 V range. Itis rugged (able to withstand accidental falls), has a waterproof case, an operating life of2000 hours on one standard 9-V battery, and a Type K thermocouple input for temperaturemeasurements to the nearest I°F (0.5°C).
67

DigestiovL Solution
The digestion solution was identified as requiring two independent chemical components.The fundaraental solution must be an acid of sufficient concentration to digest the powderedconcrete samples that is not a chloride derivative and does not present a hazardousenvironment for operators. It was observed in the earlier work that concretes containingcertain basic aggregates produced excessive foaming when introduced into the digestionsolution. Thus, a second chemical needed to be added to the solution to reduce the amountof reaction effervescence. Finally, the optimum digestion solution volume needed to beestablished.
The developed digestion solution was evaluated using one powdered concrete sample selectedfrom each of the Florida, Virginia, Pennsylvania, and Wisconsin bridge component samples.The four samples contained variate chloridecontents. Three 0.1-oz (3.0-g) samples weretaken from each powdered concrete sample, the potentiometer was turned on, and thechloride probe was calibrated. After about 3 minutes, the chloride probe was placed in thedigested sample, and the millivolt reading was recorded after it stabilized. Table 5-1
presents the millivolt readings, the calculated percent chlorides using the calibration equation,the adjusted percent chlorides (which account for the increase in solution volume), and thestandard titrated percent chlorides for three solution volumes: 0.34, 0.68, and 1.01 fl oz.(10, 20, and 30 ml). In addition, the means, variance, and coefficients of variation arepresented in Table 5-1.
It was noticed that the increase in digestion solution volume increases the amount of chloride
ions extracted from the powdered concrete sample in comparison to the 0.34-fl oz (10-ml)volume. The mean percent increases in extracted chlorides from the 0.34- to 0.68-fl oz (10-to 20-ml) and from the 0.34- to 1.01-fl oz (I0- to 30-ml) means were 6.4 and 10.6 percent,respectively. The same results are shown in Figure 5-1, where the representative curves ofthe 0.68 and 1.01 fl oz (20- and 30-ml) solutions were closer to the equivalence line than the0.34-fl oz (10-ml) set.
An increase from 0.68 to 1.01 fl oz (20 to 30 ml) was concluded to be inappropriate foranalysis because the 1.01-fl oz (30-ml) solution required excessive amounts of material for a
marginal 4.0 percent increase in the mean chloride contents. However, the improvement inreleased chlorides for the 0.68-fl oz (20-ml) solution was deemed appropriate for doublingthe extraction solution volume. Thus, a volume of 0.68 fl oz (20 ml) of the chloride
extraction solution was selected for analysis of 0.1-oz (3.0-g) powdered concrete samples.
68
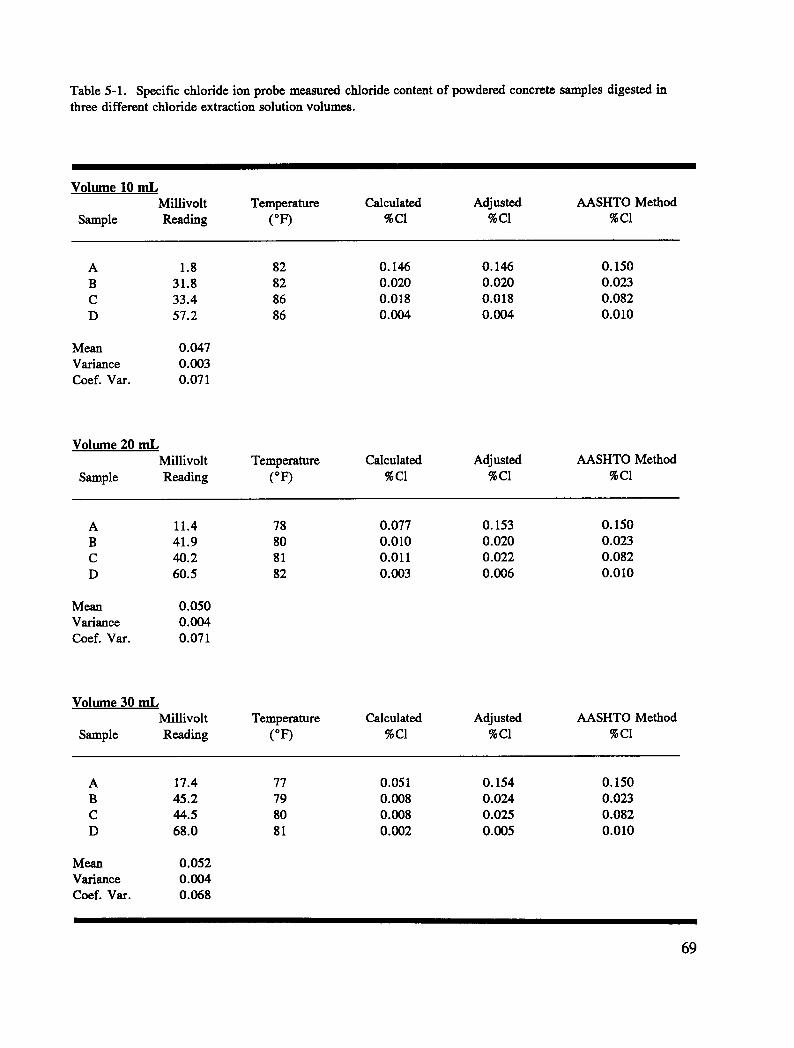
Table 5-1. Specific chloride ion probe measured chloride content of powdered concrete samples digested inthree different chloride extraction solution volumes.
Volume 10 mL
Millivolt Temperature Calculated Adjusted AASHTO MethodSample Reading (°17) %Cl %CI %CI
A 1.8 82 0.146 0.146 0.150B 31.8 82 0.020 0.020 0.023C 33.4 86 0.018 0.018 0.082D 57.2 86 0.004 0.004 0.010
Mean 0.047Variance 0.003Coef. Vat. 0.071
Volume 20 mL
Millivolt Temperature Calculated Adjusted AASHTO Method
Sample Reading (°F) %CI %CI %CI
A 11.4 78 0.077 0.153 0.150B 41.9 80 0.010 0.020 0.023C 40.2 81 0.011 0.022 0.082D 60.5 82 0.003 0.006 0.010
Mean 0.050Variance 0.004Coef. Vat. 0.071
Volume 30 mL
Millivolt Temperature Calculated Adjusted AASHTO Method
Sample Reading (°F) %CI %CI %CI
A 17.4 77 0.051 0.154 0.150B 45.2 79 0.008 0.024 0.023C 44.5 80 0.008 0.025 0.082D 68.0 81 0.002 0.005 0.010
Mean 0.052Variance 0.004CoeL Vat. 0.068
69


Stabilizing Solution
In the earlier work, reported in Chapters 2 and 3, it was observed that as the concreteaggregates became more basic (increased content and purity in limestone) the temperature ofthe digestion solution increased when the millivolt measurement was taken due to chemicalreaction. Also, the time period required for the final stabilized millivolt reading tended to betoo variable. Thus, a second (stabilizing) solution was developed and added to the 10-, 20-,and 30-ml extraction solutions at a ratio of 1:3. The final volumes were then 40, 80, and120 ml. Millivolt readings were taken for the increased volume of chloride extractionsolution. Table 5-2 presents the calculated, adjusted for extraction solution volume, andtitrated chloride contents for the 40-, 80-, and 120-ml volumes for four samples. In addition,the temperature at measurement time is recorded. The mean, variance, and coefficient ofvariation for the adjusted percent chloride results are also presented in Table 5-2.
Determining the effectiveness of the additional stabilizing solution on the dispersement of thedigestion reaction temperature was the primary objective of the test. During 10-, 20-, and30-ml measurements, the average measured reaction temperatures increased by 16.7, 11.5,and 10.1 percent for the respective volumes from a room temperature of 72°F (22°C) (seeTable 5-1). Although the effective temperatures decreased as the volumes increased from 10to 30 ml, the marginal decrease was less than 40 percent. The addition of the stabilizingsolution affected the temperature to a greater extent (see Table 5-2). The temperaturesdecreased by an average of 58 percent from the initially increased reaction temperatures.The final temperatures, in comparison to room temperature, were increased by 6.9, 4.5, and4.5 percent for 40, 80, and 120 ml.
Figure 5-2 presents an equivalence comparison for the 40-, 80-, and 120-ml predicted percentchlorides and the standard titrated chloride contents. As shown, the 80- and 120-ml curvesare significantly closer to the equivalence line than the 40-ml curve. In fact, the 120-mlcurve almost coincides with the equivalence line. The improvement in the equivalencebetween the predicted and the standard chloride content is a combination of a reduction intemperature to near room temperature and a decrease in solution chloride concentration.Also, since the specific ion probe measures the relative chloride concentrations in solution,the probe's measuring performance improves as the higher chloride levels are diluted into alower range.
Thus, the final powdered concrete chloride extraction solution for measuring the in situchloride content of concrete was increased to 1:4--20 ml of the acid-based digestion solutionfollowed by 80 ml stabilizing solution for a 3.0-g powdered concrete sample.
71
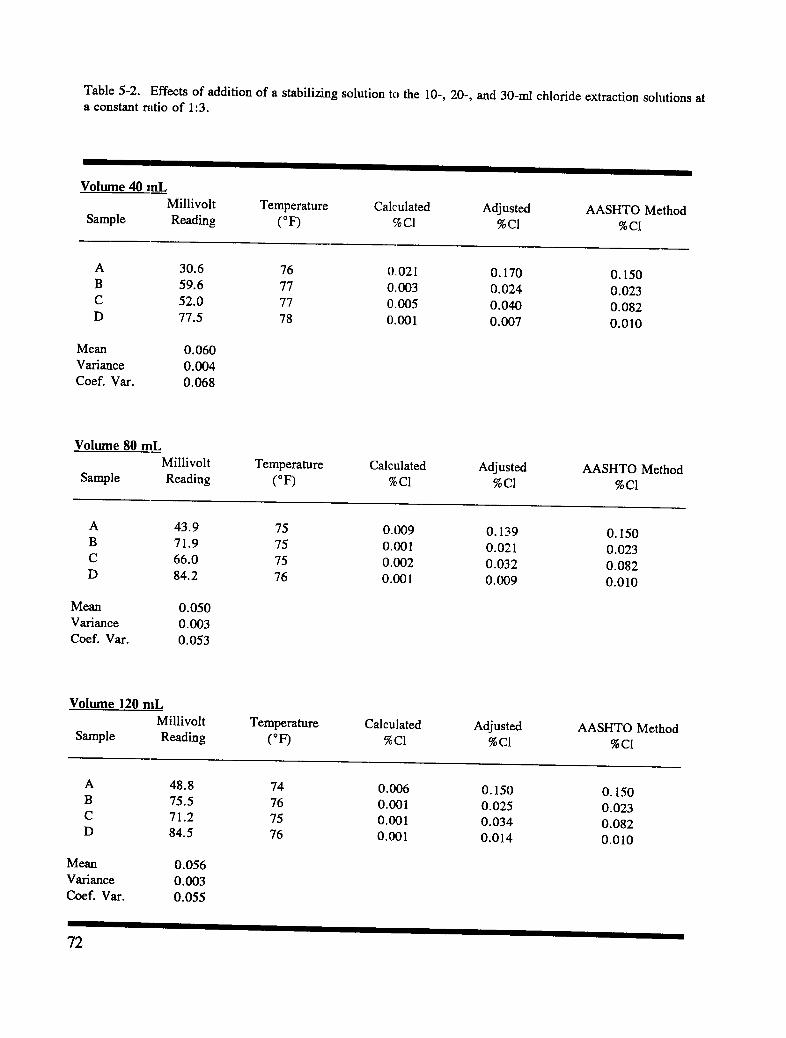
Table 5-2. Effects of addition of a stabilizing solution to the 10-, 20-, and 30-ml chloride extraction solutions ata constant ratio of 1:3.
I
Volume 40 mL
Millivolt Temperature Calculated Adjusted AASHTO Method
Sample Reading ( °F) %CI %CI %CI
A 30.6 76 0.021 0.170 0.150B 59.6 77 0.003 0.024 0.023
C 52,0 77 0.005 0.040 0.082D 77.5 78 0.001 0.007 0.010
Mean 0.060
Variance 0.004Coef. Var. 0.068
Volume 80 mL
Millivolt Temperature Calculated Adjusted AASHTO MethodSample Reading (oF) %C1 %CI % CI
A 43.9 75 0.009 0.139 0.150B 71.9 75 0.001 0.021 0.023C 66.0 75 0.002 0.032 0.082
D 84.2 76 0.001 0.009 0.010
Mean 0.050
Variance 0.003Coef. Var. 0.053
Volume 120 mL
Millivolt Temperature Calculated Adjusted AASHTO MethodSample Reading (oF) %C1 %C1 %CI
A 48.8 74 0.006 0.15{) 0.150B 75.5 76 0.001 0.025 0.023C 71.2 75 0.001 0.034 0.082D 84.5 76 0.001 0.014 0.010
Mean 0.056Variance 0.003Coef. Var. 0.055
72
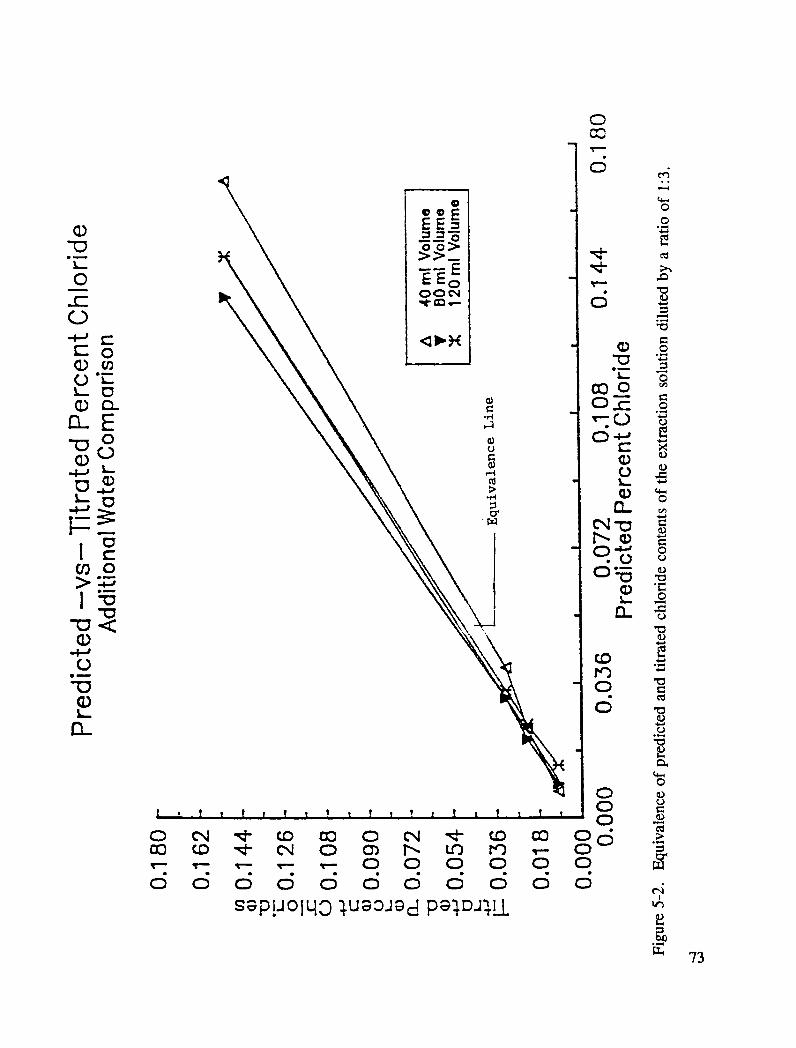

The revised chloride extraction-measurement procedure, then, becomes:
1. Weigh 3.0 g of powdered concrete sample as taken by the vacuum-carbide bitsampling method.
2. Place the 3.0-g sample in 20 ml of acid-based extraction solution in a 125-ml
plastic bottle, cover the bottle and shake vigorously to suspend the powder in thesolution, and let the powder digest for 3 minutes.
3. Carefully remove the top of the bottle (container may become pressurized duringthe digestion period). Add 80 ml of the stabilizing solution to the 3.0-g powderedconcrete sample digested in the 20 ml-digestion solution. Replace the cap on the150 ml bottle, shake vigorously for 1 minute, remove the top in the bottle, placethe probe to a depth of mid-height in the extraction solution, wait 2 minutes, andrecord the stabilized millivolt reading. A millivolt reading is stable when theoscillation is less than __+0.5 mV.
Expanded Calibration Range
In the work reported in Chapters 3 and 4, the calibration solutions used were 0.005, 0.05,and 0.5 percent, which correspond to approximately 0.2, 2.0, and 20 Ib C1/yd3 (0.1, 1.2, and11.9 kg C1/yd3) concrete. Further, it was noted that the variability of chloride contents frompredicted results increased as the chloride contents increased above the maximum calibrationsolution concentration of 0.5 percent. Therefore, the calibration solution range wasincreased in an effort to reduce the increased variability of results at higher chlorideconcentration levels. Five concentrations were selected in the range of 0.01- to 1.25-percentchlorides (0.01, 0.03, 0.3, 0.6, and 1.25 percent). Thus, the calibration solutions included a
range of chloride content of about 0.4 to 50 lb C1/yd3 (0.2 to 29.8 kg/m 3) concrete.Table 5-3 presents the recorded millivolt readings for different probe-potentiometercombinations.
The five new calibration solutions were analyzed based on a linear representation of thelogarithm (base 10) of the chloride concentrations with the millivolt readings. A generalcomparison to the old triple level concentration sets was also made. The results of the linearregression analysis are presented below.
74

Table 5-3. Calibration solution millivolt readings using different probe-potentiometer combinations for the
original and new solutions.
Original Calibration Solutions
Millivolt
Concentration Reading
0.5 %CI -5.3
0.05%CI 51.4
0.O05%CI 104.8
New Calibration Solutions
Millivolt
Concentration Reading
1.25%CI -30.6
0.6 %CI -20.3
0.3 %CI -10.4
0.03%CI 24.0
0.01%CI 4O.5
75

For the 5Aevel new calibration series:
LOG Y = -0.815327 - 0.0293951 mV (5-1)
where
LOG Y = log10 of the chloride concentrations (in %), andmV = millivolt readings
For the 3-1evel original calibration series:
LOG Y = -0.38759 - 0.0181599 mV (5-2)
The coefficients of determination (Rz) are 100 percent and 99.9 percent, respectively, andevaluations of the coefficients in the equations revealed them all to be significant.
Both equations 5-1 and 5-2 are substantial representations of the millivolt responses recorded.The slope of equation 5-1 is slightly greater than the slope of equation 5-2 because of theincreased concentration values. A comparison between the two equations is unfeasible due toinstrumentation differences as presented below.
Up to this point, a calibration equation was determined for the probe-potentiometercombination every time the instrument was turned on and a new set of chloride
measurements were taken. In this study, an effort was extended to develop a calibrationequation for a given chloride instrument (a unique combination of chloride probe-potentiometer). Eighteen sets of the extended five calibration readings were taken for asingle instrument over a 6-month period (see Table 5-4). The following presents the resultsof a linear regression analysis of the calibration reading presented in Table 5-4:
LOG Y = -0.724473 - 0.030925 mV (5-3)
Here R2 = 98.9 and two-sided t-tests reveal the coefficients to be nontrivial. Figure 5-3presents equation 5-3 and its 95-percent confidence limits.
The dynamic effects of the statistical test fall within two categories. The flu'st category is therepeatability of the readings. The regression analysis concluded that 98.7 percent of the
76

Table 5-4. Chloride solution calibration readings for chloride instrument number one.
Solution Concentration
Observation 0.01 0.03 0.3 0.6 1.25
1 42.2 25.4 -10.1 -19.8 -29.0
2 40.5 24.0 -10.4 -20.3 -30.6
3 41.1 24.6 -9.7 -19.5 -30.0
4 37.3 21.7 -11.5 -21.3 -31.5
5 42.6 26.1 -6.9 -16.7 -27.4
6 39.7 24.3 -7.0 -15.4 -24.1
7 41.2 24.8 -9.5 -19.3 -29.7
8 42.0 26.5 -5.9 -14.3 -24.6
9 42.5 26.7 -6.6 -15.6 -26.7
10 44.3 27.8 -7.4 -17.2 -28.5
11 37.0 21.6 -11.3 -20.0 -30.9
12 46.6 29.4 -6.6 -16.4 -28.3
13 42.9 28.4 -3.1 -11.9 -21.4
14 43.4 28.2 -3.4 -12.4 -21.7
15 42.9 28.0 -4.2 -13.3 -23.0
16 43.3 27.9 -4.5 -13.3 -24.0
17 43.3 28.0 -4.5 -13.3 -24.1
18 42.8 27.8 -4.7 -13.4 -23.7
77


predicted values were represented by the linear equation. Since the compiled readings werecomprised of multiple operators, the effective conclusion suggests the elimination of the useof calibration solutions preceding every initiation of the equipment. The elimination of thesolutions does not significantly affect the final analysis as revealed by the high R2 value.
The researchers are not suggesting the total elimination of the calibration solutions. Sincethe probe has an approximate life span of 1 year in normal laboratory usage (as stated by themanufacturer), the probe will eventually begin to incorrectly respond to chlorideconcentrations. Therefore, it is suggested that periodic readings be taken on the calibrationsolutions to monitor the effectiveness of the equipment and to determine the end of theprobe's useful life.
The second category is the application of the repeatability in the formulation of a uniqueequation for each chloride instrument (probe and meter combination). Currently, an operatorcalculates a predicted percent chloride content in a concrete sample from a calibrationequation that is determined each time the instrument is turned on to test a set of samples.
An additional step involves transforming the predicted values to the representative AASHTOequivalence by an alternative equation as suggested in Chapter 4.
In summary, the unique calibration solution equation totally eliminates the initial step ofdetermining a particular calibration each time the instrument is turned on. Regression of atleast five sets of calibration solution readings adequately produces the linear representation ofa chloride instrument. The linear calibration equation incorporated into an AASI-ITOequivalence equation produces a miUivolt transformation equation applicable to any concretechloride analysis made using the specified chloride instrument.
As discussed, a single calibration equation can be developed for a probe-potentiometercombination. However, it needs to be determined whether the calibration equation is uniquefor a probe or a probe-potentiometer combination. Thus, calibration equations weredeveloped for two meters (No. 1 and No. 2) and two probes (No. 1 and No. 2). ThemiUivolt readings from the five calibration solutions (0.01-, 0.03-, 0.3-, 0.6-, and1.25-percent chlorides) are presented in Table 5-5.
An analysis of variance between meters, probes, solution concentration, meter-probe (IVI*P),meter-concentration (M'C), probe-concentration (P'C) and meter-probe-solutionconcentration (M*P*C) is presented below:
79

QO O0 [',. "_1"Ir_ '_1" 14,'__ Irj t._ oo '_1" (_1 '1:t"v'_ (_ I--. QO oo ,._• ° ° o , ° , ° . ° ° , ° . ° . ° , o °
_'_ 0'_ Ir_ _"_ ,'-_ '_f" v'_ t_ _'_10 l_ _'_ C_ '_" v'_ _"J v_ L-,. ,:1- 0_
U
o,,,_
8O

Source Mean Square _Value P Value Fb Value
Meter 268.502 129.31 .0001 3.95Probe 250.274 120.53 .0001 3.95Concentration 35907.184 17293.14 .0001 2.48M*P 58.281 28.12 .0001 3.95M*C 2566.266 1235.93 .0001 2.48P*C 1.081 0.52 .7209 2.48M*P*C 0.201 0.10 .9833 2.48
Statistically, the F-values represent the distribution of the independent random variablescontained within a Chi-squared distribution. For hypothesis acceptance, the calculated valuesmust not exceed the critical tabulated values, which indicates insignificant variation among
the means. The two hypotheses being tested are:
Hypothesis: oq = o_2= • • • = _ = 0Alternative: at least one a is not equal to zero
Hypothesis: (c_3)11= (ot3)12 = ... = (ot3).m = 0Alternative: at least one (og3) is not equal to zero
The meters and the probes were analyzed by comparing the F-values and using the firsthypothesis. The meters displayed significant differences although they were not predicted tobe completely independent. Prior to the investigation, both meters were calibrated against ahigh resolution source and displayed identical millivolt responses for a given voltage. Theresults suggested that the configuration used uniquely affected the true electrical circuitry ofeach meter. The miUivolt responses were not incorrect for each combination; rather, theywere skewed about a point due to the particular electrical responses associated with theparticular meter.
The probe analysis also resulted in significant differences in the mean effects. Again, thedifference was unexpected since both probes were purchased from the same manufacturer.Although the results of the probe test signified differences, it was noticed that the truedifferences were associated with the meters rather than the probes.
The results of the concentration levels were irrelevant on an individual basis. The solutions
contained variate chloride levels and were used primarily for testing adaptivity.
81

Using the second hypothesis and comparing the F-values, the effects of the meter and probe,meter and concentration, probe and concentration, and meter, probe, and solutionconcentration combination were studied. The three alternatives were analyzed forcombination adaptivity. The F-values for the combination of the meter and probe weredetermined to be significantly different. The two components failed to disprove theindependence of the meters in an additive arrangement. In essence, the combinations ofmeters and probes reinforced the conclusion drawn from the results from the independentmeter. Again, the resulting miUivolt readings were dependent on the meter and were uniquefor variate meter/probe combinations.
In comparing the probe and concentration levels, insignificant differences were observed forthe variate combinations. Once again, the principle of meter-created differentials wasproven, because the probes performed the assigned tasks without differences in the mean mVreadings.
The significance of the analysis is represented in the comparison of the F-values for thecombinations of the meters, probes, and concentrations. The F-values concluded that theadditive effects of the three components were significant. The results justify the principlethat, regardless of the intermediate meter effects, all meter and probe combinations representsimilar final results. Although the results of the combinations are similar, the representationof the minivolt readings are unique for each specific combination. Identical meters givesimilar results, but differently manufactured and specified meters produce different millivoltreadings. In other words, calibration equations for one combination are not suitable for othermeter and probe combinations.
Calibration Equations for Revised Procedure
MiUivolt readings were taken using two fixed probe meter combinations (FPMC A andFPMC B), which were calibrated using the five solution (expanded range) calibration series.Prior to the measurement, a 3.0-g sample of crushed concrete was weighed on a triple beambalance. The weighed sample was placed in a 125-ml nalgene bottle containing 20 ml of thedigestion solution developed in this research. The bottle was capped and agitated forapproximately 1 minute. Approximately 3 minutes after the addition of the concrete, 80 mlof stabilizing solution was mechanically added to the 20-ml volume. The chloride probe anda thermocouple were inserted into the solution following agitation of the f'mal volume.Stable miUivolt and temperature responses were recorded in a 1- to 2-minute interval afteragitation.
82

To obtain the percent chlorides, equation 5-4, which was statistically obtained from thecalibration results, was applied to the millivolt readings.
LOG Y = -0.732531 - 0.0304219 mV (5-4)
where
LOG Y = log10 of the initial predicted chloride content (percent), andmV = miUivolt reading.
The initial results of the predicted percent chlorides deviated from the actual percentchlorides, which is believed to be due to the influence of the digested concrete residue. Thepredicted values were adjusted for the suspended and settled materials using equation 5-5.
%C1 = (10Y + 0.01) .99 (5-5)
where
%C1 = final predicted chloride content (%), andY = initial predicted chloride content from equation 5-4.
The coefficient adjusts for increased volume, while the constant adjusts to the lower percentchlorides. The effect of the reduced exponent is to force the higher percent chlorides closerto the equilibrium line while not greatly affecting the lower concentration levels.
The data obtained and the results of the two equations, 5-4 and 5-5, are presented inTable 5-6. The titrated percent chloride and the final predicted percent chloride relationshipare presented in Figure 5-4.
Validation of Revised Procedures Using Field Samples
Validation of the revised procedures was carried out using powdered concrete samplesextracted from existing bridge structures in Virginia, Pennsylvania, Wisconsin, and Florida.Twenty samples were chosen randomly from each state's bridge structure to be analyzed.The millivolt readings and the final percent chloride content using the procedures developedin this research are presented in Tables 5-7 through 5-10.
83

Table 5-6. Chloride content results using equations 5-4 and 5-5 and AASHTO method at 100-ml solution.
Chloride Initial Final
Content Millivolt Temperature Prexlictexi Predicted AASHTO MethodSampl_ 0b/yd 3) Reading (°F) % CI %C1 %C1
C-O 0 81.6 73 0.0006 0.0168 0.016685.4 74 0.0006 0.0166
C-1 0.2 76.2 72 0.0009 0.0197 0.019374.8 74 0.0012 0.0229
C-2 0.4 67.4 72 0.0016 0.0275 0.027471.2 74 0.0015 0.0263
C-3 0.8 58.5 72 0.0031 0.0421 0.041262.5 74 0.0028 0.0388
C-4 1.6 57.3 72 0.0033 0.0448 0.052058.3 74 0.0037 0.0480
C-5 3.2 43.5 72 0.0088 O.1002 O. 102646.8 74 0.0079 0.0914
C-6 6.4 34.7 72 0.0163 O.1759 O.143938.5 73 0.0138 0.1512
C-7 8.6 30.3 73 0.0222 0.2351 0.229333.7 73 0.0191 0.2043
C-8 10.8 24.4 73 0.0335 0.3488 0.314326.4 74 0.0312 0.3256
C-9 12.8 24.5 73 0.0333 0.3465 0.411325.8 74 0.0325 0.3385
M-I 0 84.6 73 0.0005 0.0156 0.014587.3 74 0.0005 0.0159
M-2 20.0 27.1 73 0.0277 0.2910 0.277829.3 74 0.0257 0.2703
M-3 '_0.0 23.5 73 O.0357 O.3706 O.343926.0 73 0.0320 0.3341
M-4 50.0 13.1 74 0.0740 0.7517 0.720915.7 74 0.0640 0.6530
84

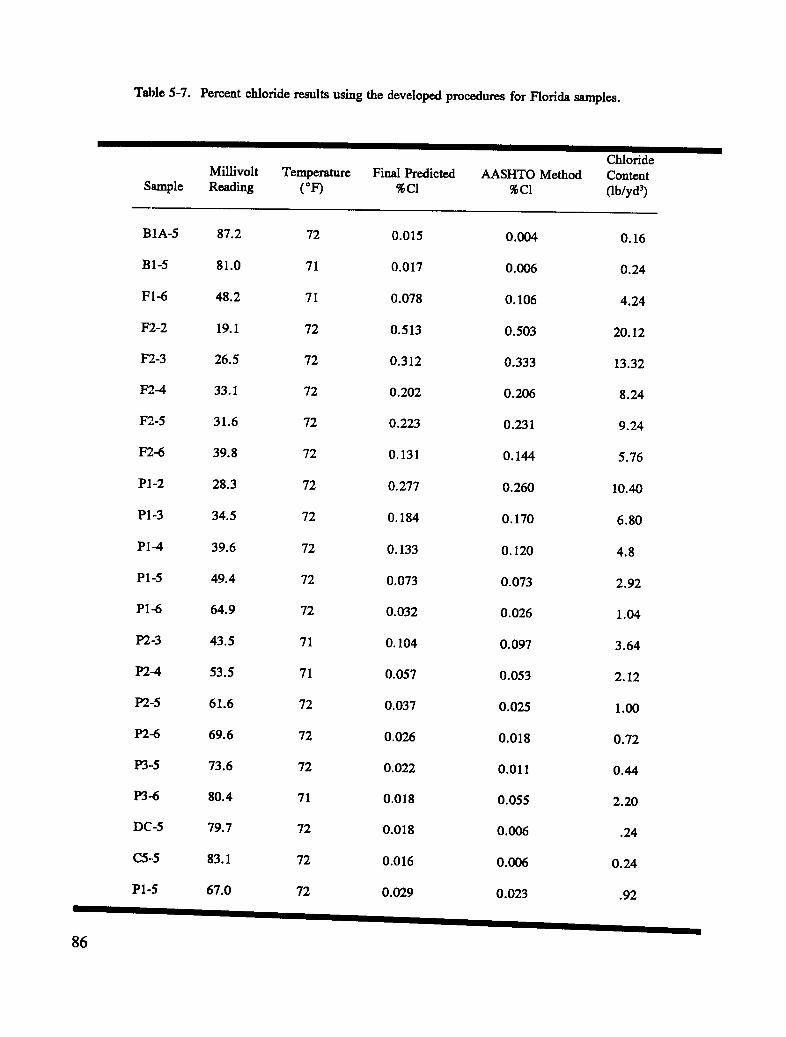
Table 5-7. Percent chloride results using the developed procedures for Florida samples.
ChlorideMillivolt Temperature Final Predicted AASHTO Method Content
Sample Reading (oF) %CI %CI 0b/yd 3)
B1A-5 87.2 72 0.015 0.004 0.16
B1-5 81.0 71 0.017 0.006 0.24
F 1-6 48.2 71 0.078 0.106 4.24
F2-2 19.1 72 0.513 0.503 20.12
F2-3 26.5 72 0.312 0.333 13.32
F2-4 33.1 72 0.202 0.206 8.24
F2-5 31.6 72 0.223 0.231 9.24
F2-6 39.8 72 0.131 0.144 5.76
PI-2 28.3 72 0.277 0.260 10.40
P1-3 34.5 72 0.184 0.170 6.80
P1-4 39.6 72 0.133 O.120 4.8
P1-5 49.4 72 0.073 0.073 2.92
P1-6 64.9 72 0.032 0.026 1.04
P2 -3 43.5 71 0.104 0.097 3.64
P2-4 53.5 71 0.057 0.053 2.12
P2-5 61.6 72 0.037 0.025 1.00
P2-6 69.6 72 0.026 0.018 0.72
P3--5 73.6 72 0.022 0.011 0.44
P3-6 80.4 71 0.018 0.055 2.20
DC-5 79.7 72 0.018 0.006 .24
C5--5 83.1 72 0.016 0.006 0.24
P1-5 67.0 72 0.029 0.023 .92
86

Table 5-8. Percent chloride results using the developed procedures for Pennsylvania samples.
Chloride
Millivolt Temperature Final Predicted AASHTO Method ContentSample Reading (°F) %CI %CI 0b/yd 3)
C1-3 74.9 71 0.021 0.014 0.56
D-1 31.4 72 0.226 0.184 7.36
E-2 68.3 71 0.027 0.023 0.92
P1-3 56.9 71 0.047 0.037 1.48
D-3(11/15) 73.9 71 0.022 0.014 0.56
H-2 60.3 71 0.040 0.038 1.52
P2-1 26.3 72 0.317 0.293 11.72
A-2 52.2 71 0.062 0.007 0.28
A-4 85.9 72 0.015 0.010 0.40
K-4 70.9 72 0.024 0.017 0.68
C2-2 67.8 71 0.028 0.019 0.76
D-3(I80) 81.5 71 0.017 0.009 0.36
K-2 79.1 74 0.018 0.015 0.60
E-4 83.5 74 0.016 0.010 0.40
I-2 71.7 71 0.024 0.018 0.72
B-3 53.2 71 0.058 0.051 2.00
L-2 67.8 71 0.028 0.020 0.80
I-1 35.8 71 0.163 0.185 7.40
A-3 78.0 71 0.019 0.016 0.64
H-2 58.8 71 0.043 0.035 1.40
87

Table 5-9. Percent chloride results using the developed procedures for Virginia samples.
I
ChlorideMillivolt Temperature Final Predicted AASHTO Method Content
Sample Reading (°F) %Cl % CI (lb/yd _)
A01 29.9 74 ,249 .256 10.24
A-2(927) 44.5 73 .098 .096 3.84
A-3 67.3 72 .028 .030 1.20
A-4 80.6 78 .018 .020 0.80
B-1 22.6 76 .406 .389 15.56
B-',' 36.5 77 .162 .183 7.32
B-':; 33.8 72 . 193 .216 8.64
D-II 22.3 73 .414 .386 15.44
D-3 36.3 73 .164 . 142 5.68
D-4 42.8 73 . 109 . 101 4.04
D-5 48.9 72 .075 .074 2.96
I-1 31.2 74 .229 .220 8.80
I-3 56.1 77 .050 .051 2.04
I-4 70.9 77 .024 .021 0.84
K-2 43.0 74 0.107 0.107 4.28
K-4 72.1 77 0.023 0.025 1.00
I_,-1 29.5 77 0.256 .258 10.32
L-4 61.3 77 .038 .039 1.56
E-2 40.3 77 .127 .134 5.36
A-2(676) 26.5 77 .312 .285 11.40
88

Table 5-10. Percent chloride results using the developed procedures for Wisconsin samples.
Chloride
Millivolt Temperature Final Predicted AASHTO Method ContentSample Reading (° F) %CI %CI (lb/yd 3)
B-5 55.7 73 0.051 0.067 2.68
A-5 49.8 74 0.071 0.132 5.28
C-3 48.0 74 0.079 0.098 3.92
A2-3 70.7 73 0.025 0.029 1.16
K-1 22.2 73 0.417 0.486 19.44
B-2 43.2 74 0.106 0.118 4.72
F-1 29.5 73 0.256 0.285 11.40
C-2 29.6 76 0.254 0.301 12.04
J-2 23.6 74 0.379 0.445 17.80
L-2 32.1 72 0.216 0.233 9.32
K-3 39.7 73 0.132 0.145 5.80
G-3 28.8 74 0.268 0.279 11.16
D-5 48.1 73 0.079 0.197 7.88
B-6 62.5 74 0.036 0.047 1.88
F-5 65.9 74 0.030 0.036 1.44
D-3 40.3 74 0.127
E-2 27.1 74 0.300 0.315 12.60
A-3 30.6 74 0.238 0.272 10.84
C-6 65.1 74 0.031 0.037 1.24
I-5 61.9 74 0.034 0.043 1.72
89

A _tatisticat analysis was performed on the results from each state. Regression equations toverify the relationship between the standard and measured chloride content values for theresults from Florida, Pennsylvania, Virginia, and Wisconsin, and all states together arepresented in equations 5-6 through 5-10.
Florida Samples
(%C1) s_d_rd= + .992 (%C1) measured (5-6)
The regression results are also presented in Figure 5-5.
Pennsylvania Samples
( % El) standard : + • 895 (%C1) measured (5-7)
The regression results are presented in Figure 5-6.
Virginia Samples
(%Cl) s_d.rd = + .967 (%C1) measured (5-8)
The regression results are presented in Figure 5-7.
Wisconsin Samples
(%C1) smd_rd= + 1.107 (%CI) measured (5-9)
The regression results are presented in Figure 5-8.
90

0
c_
o=
be) 0 >
E _ to'? .,_, _
0 E u =
i m a_ _c -o _ .N0 _'- =
•-- 0 .-- __ N
"_ 13.. eo_ _
_- r-- e
.__,1=
o
0 "_
-_- CO t'O r'-- c',,I r-,-. ,.- _ o I._0 o ["i_,'D ._- _ r,,u r'.'D •C',.I C",.I ,.-- ,.-.-• 0 0o d c{ d o d d d o o o _,
° ..,.i
91

©
LD
0
LD • __
o
c__
0t0
°-o iT _
iT _-c_ e
l I I i I , t I I I I I l I I _ I " ; l _ \l 0 "_-_
• -_
d d d d d d d o d d dsgpuolqO lueoJad pe]DJ_l_L
92 _°_,_

_" I= "2• 0 "=1 .,l_
\ _=o" I.,
rr,,, _o
0 /
i a_ E
' "O "_0 I "_-
CO o-- ¢" a)
kJ CO CL
"0 • _- N"-- _\\n a_
0 L.1J_ -- 0
o oC "_
-o iT o0 o
h _ d ee_
°_
(2) NI _ ! , I _ I _ t , ! , ! , I 1 I i I
d0 u") 0 Lib C) u") C) u3 0 u") C)
o o o o o o o o o osgp!_ol4O _u_o._gd p_o._[± _,
°_
93


Combined State Samples
The results from the four States were combined and the following equation was obtained:
(%C1) ,,_,_rd = + 1.03 (%C1) measured (5-10)
The regression results are presented in Figure 5-9.
The regression models presented above indicate a very strong correlation between thestandard and the developed methods for measuring chloride content.
Operator Variance
To determine the effects of different operators when using the revised procedures, 20samples from each of the 4 previously mentioned states were analyzed by 2 operators. Theresults of the test are summarized in Tables 5-11 through 5-14, containing the millivoltreadings and final percent chloride.
In comparing the two operators (Figure 5-10), a strong correlation was observed between theoperators' results (correlation coefficient = 92.3 percent). The following statistical analysiswas performed to verify the correlation.
Source DF MS E Value P Fb Value
Operator 1 0.02778 1.09 0.298 3.84State 3 0.35457 1.389 0.000 2.60
Operator*State 3 0.02009 0.79 0.503 2.60Error 152 0.02552Total 159
Hypothesis: /_ _ = t_Alternative: /x 1 _;__2
Using the above hypothesis (means are equal), the calculated F values (Fo) failed to exceedcritical values (F0. Thus, there are no significant differences between mean values for thetwo operators nor for the Operator*State interactions.
95


Table 5-11. Operator variance data for Florida samples.
Operator 1 Operator 2
Millivolt Predicted Millivolt Predicted
Sample Reading %CI Reading % Cl
DC-5 82.8 0.017 81.5 0.017
PC1-3 19.8 0.490 23.5 0.382
PO2-2 63.3 0.034 65.8 0.030
B2-5 94.5 0.013 87.4 0.015
P5-2 18.2 0.545 19.1 0.513
DD-2 71.3 0.024 72.8 0.023
B1-5(206) 94.5 0.013 92.5 0.014
DA-1 70.3 0.025 68.8 0.027
B1-5(312) 92.8 0.013 93.1 0.013
P3-6 82.1 0.017 80.8 0.017
B1A-5 94.7 0.013 88.3 0.015
C1A-2 70.5 0.025 68.0 0.028
DA-2 80.5 0.018 78.5 0.019
C1-4 77.3 0.019 73.2 0.022
P3-3 54.7 0.054 50.7 0.067
P1-5 95.2 0.013 66.3 0.030
C1-2 91.8 0.014 88.0 0.015
C6-6 95.8 0.013 89.7 0.014
C5-5 95.9 0.013 88.9 0.014
C2-2 92.3 0.014 88.8 0.014
97

Table 5-12. Operatorvariance data for Pennsylvania samples.
Operator 1 Operator 2
Millivolt Predicted Millivolt Predicted
Sample Reading %CI Reading %CI
C1-3 70.5 0.025 80.8 0.017
D-1 25.3 0.338 31.8 0.220
E-2 59.4 0.042 69.8 0.026
PI-3 50.1 0.070 58.8 0.043
D-3(11/15) 67.5 0.028 79.5 0.018
H-2 53.3 0.058 57.9 0.045
P2-1 24.5 0.357 26.2 0.319
A-2 52.1 0.062 53.6 0.057
A-4 78.7 0.019 80.9 0.017
K-4 64.5 0.032 70.3 0.025
C2-2 67.1 0.029 66.5 0.029
D-3(I80) 80.4 0.018 79.9 0.018
K-2 69.4 0.026 77.5 0.019
E-4 73.4 0.022 75.8 0.020
I-2 64.1 0.033 75.8 0.020
B-3 47.9 0.079 50.1 0.070
L-2 57.4 0.046 69.9 0.025
I-1 28.9 0.266 28.8 0.268
A-3 70.5 0.025 78.8 0.019
H-2 53.3 0.058 38.8 0.140
98

Table 5-13. Operator variance data for Virginia samples.
Operator 1 Operator 2
Millivolt Predicted MiUivolt Predicted
Sample Reading %CI Reading %CI
B1-4 66.3 0.030 65.2 0.031
C-3 (927) 38.3 0.144 35.7 0.171
G-4 84.4 0.016 71.8 0.024
P2-3 66.1 0.030 51.8 0.063
B-4 42.2 0.113 43.5 0.104
D-5 42.8 0.109 39.6 0.133
C-3(676) 57.1 0.047 58.6 0.043
E-2 35.0 0.178 34.8 0.181
F-3 73.4 0.022 71.2 0.024
F-2 36.3 0.164 29.4 0.258
G-1(927) 19.9 0.486 25.8 0.327
G-1(670) 35.6 0.172 33.7 0.194
B1-2 29.4 0.258 27.5 0.292
G-2 30.7 0.236 33.2 0.201
P1-2 42.7 0.109 46.2 0.088
A-2 23.5 0.382 19.0 0.517
L-1 32.5 0.210 37.4 0.153
D-2(670) 37.1 0.156 36.0 0.167
L-3 66.3 0.030 67.9 0.028
D-2(676) 25.7 0.329 27.7 0.288
99

Table 5-14. Operator variance data for Wisconsin samples.
Operator 1 Operator 2
Millivolt Predicted Millivolt Predicted
Sample Reading %CI Reading % CI
B-5 51.I 0.066 48.8 0.075
A-5 35.5 O.173 46.2 0.088
C-3 36.I O.166 37.4 O.153
A2-3 56.6 0.048 67.5 0.028
K-I 14.6 0.696 18.3 0.542
B-2 34.5 0.184 25.8 0.327
F-1 21.9 0.425 26.9 0.304
L-2 19.7 0.493 31.9 0.219
K-3 30.6 0.238 35.8 O.169
G-3 18.5 0.534 26.7 0.308
D-5 44.1 0.100 44.5 0.098
B-6 52.2 0.062 56.3 0.049
F-5 55.3 0.052 62.5 0.036
D-3 31.5 0.224 34.4 0.186
E-2 20.3 0.473 19.0 0.517
A-3 18.5 0.534 27.7 0.288
C-6 58.1 0.044 57.5 0.046
I-5 52. I 0.062 61.0 0.038
100

O O
Equolity o
0 0 o_)
0 0
00
oJ 0 0
IZ0 .II- 0 0<I 0Iv 0ILl 0I1.
o oO°00
0
6' og0
_o °
I I I I I I ! i I _ I I I I I.01 .02 .03 .04 .07 .I . .3 .4 .5 .7
OPERATOR I
Figure 5-10. Comparison of the chloride content determinations by two operators onconcrete specimens from four states.
101

6
Summary and Recommendations
An alternative method to the standard AASHTO test method T260-78 was developed todetermine the chloride content in reinforced concrete structures. The developed methodintroduces a new test procedure and a newly developed digestion solution. The procedurealso reduces the time per measurement dramatically compared to the AASI-ITO method, thuscovering more area in a work day. The specific ion probe in combination with apotentiometer can accurately determine the chloride contents of concrete samples. Thefollowing points summarize the findings and recommendations from this research:
• Specific ion probe test results are not affected by different cement contents, but areaffected by changes in temperature.
• Field validation indicated a good relationship between the results obtained using thespecific ion probe and the results obtained using the standard potentiometric titrationprocedure. Also, the procedure developed for the specific ion probe required 5 to6 minutes to analyze a concrete specimen in the field. Therefore, under fieldconditions, 40 to 50 specimens can be analyzed during an 8-hour work shift. Usingthe same procedure, 70 to 80 specimens can be analyzed in the laboratory in an8-hour shift.
• The volumetric method for sample preparation was replaced by weighing. Variancein the results based on the plastic vials was noticed and can be linked directly to themethod of placing the concrete powder into the vials. It is difficult to compact thepowder into the vial and achieve the same compaction each time. Among the three
103

weighing methods used, the triple beam balance was chosen. The triple beambalance operates very smoothly and produced a mean of 3.04 g and a standarddeviation of 0.050 g.
• In the selection of the instrumentation, the only variability pertains to thepotentiometer, since the specific ion probe has only one manufacturer. Therefore,the meter has to contain an accurate millivolt scale, with tenths, and be durable.
• A non-chlorine based digestion solution containing a chemical to reduce theeffervescence created from limestone aggregates was developed. Accuracy of theanalysis was improved by increasing the digestion solution to a volume of 20 ml.Eighty ml of a stabilizing solution was added following digestion of the concretesample for both dilution and temperature reduction. The dilution improved theaccuracy of the readings with high chloride contents, while also reducing thesolution temperature below the critical 5°F (3°C) differential above ambient. Thusthe use of the stabilizing solution eliminates the problem of erroneous determinationsdue to temperature variations, a problem that the research revealed to be unamenableto solution by calibration procedures.
• A rapid, efficient, low-cost means of acquiring powdered concrete samples in thefield was developed in this research.
• It was shown that a sufficiently significant relationship exists between chloridecontents determined on samples that were crushed to pass the No. 50 (300 #m) sievesize and those that were not to obviate the need for crushing.
• It was found that variable cement contents in the concrete samples do not have asignificant effect on chloride content determinations.
• The calibration solution range was increased for improved interpretation at higherctdoride concentrations. The new solution range covers the probable rangeencountered in the field.
• Results with standard solutions were repeatable for a specified potentiometer andprobe combination. However, periodic measurements should be performed usingthe calibration solutions to ensure proper operation. Different meter-probecombinations produced independent intermediate values, but f'mal analysis renderedsimilar results. To ensure no misinterpretations, meters and probes should becalibrated and held in a permanent configuration for the lifetime of the instruments.
104

• In the presence of concrete, the specific ion probe reacts differently than in pureszline solutions. The concrete residue forces the chloride interpretation to beadjusted for comparisons with the AASHTO method T260-84. Once adjusted, thespecific ion probe accurately determines the chloride content of concrete. Resultsbased on samples from the field indicated that the revised procedures developed inthis research produce strong correlations with AASHTO T260 for the lowerconcentrations and increased accuracy for the higher ranges.
• Strong correlation was observed between the individual analyzed States: Florida,Wisconsin, Pennsylvania, and Virginia. Each state contained separate aggregatesources, yet the results were comparable to the AASHTO method. Therefore, theprobe's only restrictions are those specified by the manufacturer.
• The operator variance was studied. The results indicated that various operatorswould produce similar results. Since the instruments require minimal technicalskills, the procedure could be performed at any analytical level and still maintainsimilar results.
A test procedure, in ASTM format, for determining chloride contents of powdered concretesamples based on this research has been prepared and can be found in Volume 8, "ProcedureManual" of this report series.
105

Appendix A
Chloride Analysis Procedures
The Standard Potentiometric Titration, AASHTO T260-84
This method was used as the basis for comparison of the chloride content of the test samples.The following procedure was used. Three g of the powdered concrete sample are weighed tothe nearest mg. Ten ml of 90 to 100°C distilled water are added and the sample is swirled.After the sample is in suspension, the slurry is ground to remove any lumps and thentransferred into a beaker. Three ml of concentrated nitric acid are added to the remaining
sample material, and this mixture is transferred quantitatively into the beaker while the slurryis stirred constantly. The solution is increased to approximately 50 ml by adding hot distilledwater.
Five drops of methyl orange indicator are added to the slurry, and the pH of the sample isadjusted if needed. The solution is then covered with a watch glass and the stirring rod isleft in the beaker. Next, the solution is heated, allowed to boil for 1 minute, and thenremoved from the heat. The sample is f'dtered into another beaker and the beaker, filterpaper, funnel, and stirring rod are rinsed thoroughly to ensure complete transfer of thechloride. Finally, the sample is allowed to cool to room temperature.
Four ml of 0.01N NaCI solution are added to the sample prior to titration with 0.01NAgNO3 solution. A chloride specific electrode, Orion Model 94-17B, its reference electrode,and a millivoltmeter are used in the determination of the titration end-point.
107

James Instruments, Model CI 500
The procedure used for testing the chloride content of concrete specimens is as follows:
1. Calibration of the electrometer: Turn the electrometer on and set the dial to readV (volts). Insert the specific ion electrode into one of the standard solutions
supplied with the instrument. Allow the electrometer reading (mV) to stabilize bywaiting approximately 1 1/2 to 2 minutes. Record the readings and the numbercorresponding to the standard solution. Repeat for the two remaining standardsolutions. Calibration of the electrometer should be done each time the instrumentis turned on.
2. Analysis of powdered concrete samples: Prior to weighing, stir the powderedsample thoroughly to ensure a uniform mixture of chloride-contaminated concrete
powder. Weigh 3.0 g of the powdered sample to the nearest 0.1 mg using ananalytical balance. Place the 3.0-g sample into the supplied chloride extractionliquid and shake for 15 seconds Insert the electrode into the digested sample for3 minutes and record the mV reading.
3. Modifications of the original procedure suggested by James Instruments (21)included weighing each specimen using a precision balance and increasing the timebefore reading the results on the electrometer to a minimum of 3 minutes. After
the 3 minutes, if the change in the mV reading resulted before the reading wasrecorded, the new reading was adopted. The specific ion probe used during thisinvestigation is shown in Figure A-1.
4. The calibration procedure:
• Turn the dial on the electrometer to read V (volts); corresponding readingswill result in mV.
• Do not allow the electrometer battery to become weak. Erratic readings mayresult.
• Refrain from storing the calibration liquids in direct sunlight or in very warmplaces.
108

Figure A-1. The specific ion probe.109

• Care should be taken to prevent contamination of the three calibration liquids.An extreme increase or decrease in the mV readings may indicatecontamination of one or more of the liquids. Normally, calibration readingsshould be within + 5 mV of previous readings and approximately 100 mV, 5(ImV, and -5 mV for calibration liquids 1, 2, and 3, respectively.
• Ensure that the distilled water does not become contaminated. Also, it isrecommended that only salt-free distilled water is used.
• Special care of the electrode is important. When not in use, the electrodeshould be submerged in distilled water to prevent clogging of the sensingdevice.
• If the filling solution is allowed to remain in the electrode for extended periodsof time, damage to the electrode may result. Clean and polish the electrodefrequently to maintain consistent results.
• Prior to using the electrode, observe the level of the tilling solution. Aninsufficient amount of filling solution will result in readings that wander andreduce the repeatability of the results. Variable readings were noticed after thelevel fell below 1/4 in. of the eyelet in the probe. For best results, it isrecommended that the probe be filled completely with f'flling solution prior touse.
• The specific ion probe should be cleaned using distilled water only.
• Never touch the tip of the probe.
• Polish the tip of the probe using the polishing strip provided by themanufacturer at frequent intervals, depending on the amount of use.
Spectrophotometer, Hach DR/2000
1. Sample preparation: Prior to weighing, stir the powdered sample thoroughly toensure a uniform mixture of chloride. Weigh 1.0 g of the powdered sample to thenearest 0.1 mg using an analytical balance. Place the sample in a 250-ml beaker.Add approximately 5 to 10 ml of deionized water. Next, add 5 ml ofconcentrated nitric acid and stir vigorously for 10 seconds After fizzing settles,
110

transfer the sample to a second 250-ml beaker using a filtering apparatus andWhatman 40 filter paper. When f'dtering, rinse the sample in the filter 4 to 5times to ensure a complete transfer of the chloride. Rinse the outer lip of thebeaker. After filtering, rinse the outside of the filter paper 3 to 4 times and rinsethe funnel and funnel tip thoroughly, allowing all of the filtrate to be transferredinto the sample beaker. If a precipitate exists, ref'tlter the sample using the aboveprocedure. After filtering, increase the sample volume to 100 ml using agraduated cylinder and distilled water. Transfer the sample in the graduatedcylinder back into the same 250-ml beaker.
2. Filtrate analysis: Specify the chloride test procedure on the spectrophotometer bypressing 7 0 ENTER. Enter the appropriate wavelength reading (455) for thechloride test. Two sample cells are prepared, one with deionized water and theother with the filtered sample to be analyzed. Pipet 25 ml of the sample into oneof the same cells. Next, pipet 25 ml of deionized water into the matching samplecell. Add 2 ml of mercuric thiocyanate to each sample cell. Next, add 1 ml offerric ion solution to each sample and swirl to mix. Observe the samples todetermine if any interferences that may reduce the accuracy are present. PressSHIFT TIME on the instrument; a 2-minute time period will start. During thiswaiting period, wipe the outside of the sample cells to remove any dirt or spots.After the 2-minute period, place the sample cell containing no chloride into theslot provided in the instrument with the numbers on the cell facing to the left.Press zero on the instrument. After the instrument provides a reading of 0 rag/l,remove the blank cell and place the cell containing the chloride sample into theinstrument in a similar manner. Press READ, wait, and record the results.
3. Modifications of the original procedure suggested by the Hach Company (22)involved the preparation of the sample prior to testing. The procedure developedby the Hach Company was applicable to water samples. Therefore, a procedurefor extracting the chloride from the powdered concrete specimens was developedprior to analyzing the samples using the procedure recommended by the HachCompany for analyzing the chloride content of water.
The spectrophotometer was developed mainly for detecting low levels of chloride.In addition, this procedure is very sensitive to interferences resulting from low pHor acidic samples. Therefore, a 1.0-g sample was weighed and acid-digestedusing .5 ml concentrated nitric acid. After the filtering process, the preparedsample of 100 ml was consistently above a pH of 3. Twenty-five ml of thissample were analyzed for chloride content. As a result, no interferences were
111

detected throughout the testing procedure. The spectrophotometer used in thisstudy is shown in Figure A-2.
CD-DT Digital Titrator (Hach Company)
The same, sample procedure used with the spectrophotometer method is adopted for the CD-DT digit_d titrator method.
1. Filtrate analysis: Remove 25 ml of the sample in the 250-ml beaker using a pipet.The sample now contains 75 ml. Place the 75-ml sample on a magnetic stirrerand insert a magnetic stirring rod. Using a pH probe, adjust the pH of the sampleusing perchloric acid (1:5 dilution) to 2.5 __+0.1. If necessary, sodium hydroxide(5N) may be used to adjust the pH upward. After the pH is properly adjusted,add the contents from one of the chloride2 powder pillows while stirring. Thesample will turn from a clear to a bright yellow color. Next, insert one of the1.128N silver chloride containers into the digital titrator. Insert one of thetitrating tubes into the tip of the silver chloride. Turn the dial until the silverchloride drips from the end of the red tube. Using a chemical-free tissue, wipethe end of the tip to remove any silver chloride from the outside. Zero the dial onthe digital titrator and insert the red tip into the 75-ml sample. Turn the dial totitrate the sample. Observe the first consistent color change, reddish yellow orbrownish yellow, which indicates the midpoint of the titration. Read and recordthe number of digits required for titrating the sample.
2. Modification of the original procedure suggested by the Hach Company (26)involved the preparation of the sample prior to testing. The procedure developedby the Hach Company was applicable to water samples. Consequently, aprocedure for extracting the chloride from the powdered concrete specimens wasdeveloped prior to analyzing the samples using the procedure recommended by theHach Company for analyzing the chloride content of water.
Unlike the spectrophotometer, the digital titrator was developed for detectinghigher levels of chloride. This procedure is also sensitive to interferencesresulting from pH. Therefore, a 1.0-g sample was weighed and acid-digestedusing .5 ml concentrated nitric acid. After the f'dtering process, the preparedsample of 100 ml was consistently above a pH of 3. Seventy-five ml of thissample were analyzed for chloride content. Prior to the analysis, each sample wasadjusted to a pH ranging from 2.4 to 2.6. As a result, no interferences were
112

Figure A-2. The DR 2000 spectrophotometer.113

detected throughout the testing procedure. The digital titrator used during theinvestigation is shown in Figure A-3.
Quantab Titrator Strips (Standard)
1. Powdered concrete sample preparation: Prior to weighing, stir the powderedsample thoroughly to ensure a uniform mixture of chloride. Weigh 10.0 g of thepowdered sample to the nearest. 1 mg using a precision scale. Place the samplein a 250-ml beaker. Add 90 ml of boiling distilled water, stirring constantly. Stirthe sample for 30 seconds, and, after 1 minute, stir the sample again for another30 seconds. Fold Whatman 40 filter paper twice, into a cone, and place it intothe beaker. Allow some of the sample to falter through.
2. Chloride analysis procedure: Place a Quantab titrator strip in the filtered portionof the sample and allow it to remain until a clark blue color forms at the top of thestrip. Allow 5 to 10 minutes for the color to change. Read the Quantab titratorstrip to the nearest .05 mark at the uppermost point of the color change. Thiscolor may be white or yellowish orange. Record the readings.
3. Modified Quantab titrator strips: The procedure developed by Environmental TestSystems, Inc. (27) was used initially for analyzing the chloride content of the testspecimens. This procedure provided an analysis of the water-soluble chloridepresent in the specimens. Because background chloride is also present in concretebridge components, the procedure was modified to provide for an acid digestion ofthe sample prior to testing. Ten g of the powdered samples were weighed,followed by the addition of 3 ml of nitric acid. The volume of the sample wasincreased to 100 ml. Then, the sample was tested for chloride content using theQuantab titrator strip. Prior to testing each sample, a pin hole was inserted alongthe yellow line near the top of the strip as recommended by Environmental TestSystems, Inc. (26) to obtain more accurate results.
The modified procedure is as follows. Prior to weighing, stir the powderedsample thoroughly to ensure a uniform mixture of chloride. Weigh 10.0 g of thepowdered sample to the nearest. 1 mg using an analytical balance. Place thesample in a 250-ml beaker. Add approximately 5 to 10 ml of distilled deionizedwater. Next, add 3 ml of concentrated nitric acid. Stir vigorously for15 seconds. Walt 1 minute and stir again for 15 seconds. After the fizzing
114

_".:..
Figure A-3. The digital titrator.115

srttles, fold the filter paper (Whatman 40) twice to form a cone. Place the f'dter paper intothe beaker containing the sample. Allow some filtrate to filter into the cone. Using a stickpin, punch a hole in the top of the strip along the yellow line. Place the Quantab titratorstrip in the filtered portion of the sample and allow it to remain until a dark blue color formsat the top of the strip. Allow 5 to 10 minutes for this to occur. Read the Quantab titratorstrip to the nearest .05 mark at the uppermost portion of the white color change. Notice thatthis portion may not extend across the entire Quantab strip. Record the reading.
The Quantab titrator strips used during this study are shown in Figure A-4.
116

Figure A-4. The Quantab titrator strips.
117

Appendix B
Chloride Content Results for Bridges inField Validation Study
119

Table B-1. Predicted chloride content values for Pennsylvania bridge PA 180 over 220 WB.
Specific Ion Probe* PotentiometricReaction Calculated Titration
Sample Reading Temperature Chloride Predicted Values
Number _M-Volts) _°F) (%CI-) (%CI-) (Ib/cu vd) _
A-I 27.8 66 .I12 .07 2.68
2 59.3 71 .028 .02 .72
3 81.6 70 .008 .01 .26
4 108.5 69 0 0 .00
B-l** 3.5 72 .336 .30 I1.66
2** 10.9 70 .242 .17 6.80
3** 34.2 70 .087 .05 2.05
4** 56.4 72 .033 .02 .83
C-I -1.3 75 .388 .40 15.81
2 I1.3 76 .228 .16 6.25
3 38.3 80 .076 .05 1.80
4 63.2 78 .027 .02 .71
D-I 1.5 65 .308 .25 9.93
2 26.6 64 .102 .06 2.42
3 44.6 65 .045 .03 I.i0
4 73 61 .006 .00 .19
E-I 56.7 68 .026 .02 .75
2 99.7 64 0 .00 .00
3 104.9 64 0 .00 .00
4 LOST LOST LOST LOST LOST
F-I 25.1 68 .113 .07 2.70
2 62 65 .018 .01 .50
3 84.9 64 .012 .01 .35
4 107.5 68 0 .00 .00
G-I 19 79 .174 .ii 4.40
2 52.1 80 .046 .03 1.12
3 80 84 .019 .01 .52
4 94.9 75 .007 .01 .22
H-I 5.7 76 .302 .24 9.63
2 37.7 70 .074 .04 1.76
3 60.6 74 .029 .02 .74
4 105.6 82 .009 .01 .28
121

Table B-1. (continued)
Specific Ion Probe * Potentiometric
Reaction Calculated Titration
Sample Reading Temperature Chloride Predicted Values
Number CM-Volts) _°F) _%CI-) _%CI-_ _Ib/cu yd)*
I-i 6.9 77 .288 .23 8.88
2 30.7 74 .104 .06 2.473 69.9 75 .020 .01 .54
4 93.3 76 .008 .01 .26
I-i 17.9 79 .180 .12 4.592 59.7 80 .034 .02 .873 88 80 .013 .01 .37
4 103.6 83 .010 .01 .31
K-I LOST LOST LOST LOST LOST2 87.1 75 .020 .01 .53
3 97.7 81 .010 .01 .314 lll.9 83 .009 .01 .27
L-I 25.8 82 .132 .08 3.20
2 91.1 83 .014 .01 .393 116.6 89 .012 .01 .36
4 ill.8 83 .009 .01 .28
•,Samples were crushed to minus 50 mesh
Actua _sample numbers wsre: _I_ ,,
B-2** => B-1 depth to
=> B-2 depth /_ to iI/_ ''B-4
=> B-3 depth iI/_ to,, 13/_,,
122

TableB_. Prediet_ c_ofidecontentv_ues _rPe_lvaniabfidgePA 180over2_ EB.
Specific Ion Probe _otentiometricReaction Calculated Titration
Sample Reading Temperature Chloride Predicted ValuesNumber _M-Volts) _°F) _%CI-) C%CI-) _Ib/cu vd)
A-1 25.2 83 .133 .093 3.67
2 31.5 81 .102 .074 2.913 85.8 83 .016 .009 .37
4 94.6 82 .012 .006 .23
B-I 6 81 .288 .180 7.112 26.1 83 .128 .090 3.55
3 62.9 81 .031 .023 .894 86.5 82 .015 .009 .34
C-I ll.9 81 .226 .147 5.80
2 LOST LOST LOST LOST LOST3 LOST LOST LOST LOST LOST
4 LOST LOST LOST LOST LOST
D-I 50.2 82 .050 .038 1.482 89.6 84 .015 .009 .343 96.6 85 .013 .007 .28
4 110.3 81 .008 .002 .06
G-I 7.7 84 .270 .171 6.75
2 54.4 85 .04_ .034 1.323 77.5 85 .021 .014 .574 94.4 83 .013 .006 .26
H-I 6.9 82 .272 .172 6.78
2 49.3 84 .051 .038 1.513 84.5 85 .017 .011 .42
4 100.9 84 .011 .005 .20
I-I 9.4 86 .248 .159 6.272 49 85 .052 .039 1.55
3 91.3 85 .014 .008 .324 108.5 86 .011 .005 .20
123

Table B-3. Predicted chloride content values for Pennsylvania bridge PA 11-15 over 35 NB.
Specific Ion Probe PotentiometricReaction Calculated Titration
Sample Reading Temperature Chloride Predicted Values
Number (M-Volts) _?F) (%CIi_ (%CI,) (ib/cu vd)
A-I 35.9 86 .088 .064 2.54
2 85.9 89 .019 .013 .50
3 85.3 86 .018 .011 .44
4 76.7 85 .021 .015 .58
B-I 33.3 88 .099 .071 2.82
2 62.3 87 .035 .026 1.02
3 94.5 88 .016 .009 .37
4 100.5 87 .013 .007 .29
C-I 37.6 85 .082 .060 2.38
2 70.8 86 .026 .019 .74
3 106.4 88 .013 .007 .27
4 95.6 88 .015 .009 .36
G-I 40.4 84 .073 .054 2.14
2 92.5 87 .016 .009 .37
3 81.2 89 .021 .015 .58
4 87.5 85 .016 .010 .39
H-1 12.7 83 .219 .143 5.64
2 27.6 85 .121 .086 3.38
3 60 85 .036 .027 1.07
4 78 84 .020 .013 .53
I-I 16 84 .192 .128 5.05
2 64.2 86 .032 .024 .94
3 77.7 85 .021 .014 .56
4 86.1 85 .017 .010 .41
Pl-I -23.1 81 .961 .488 19.23
2 -7.5 86 .505 .288 i1.35
3 26.7 84 .125 .088 3.47
4 81.6 81 .016 .010 .39
5 90 83 .014 .008 .30
124

TableB-3. (contmued)
Specific Ion Probe PotentiometricReaction Calculated Titration
Sample Reading Temperature Chloride Predicted ValuesNumber (M-Volts [ (°F) (%CI-) (%CI-)
P2-1 2.4 80 .332 .203 8.022 54.8 83 .042 .032 1.253 84.2 84 .017 .010 .41
4 88.7 82 .014 .008 .30
CI-I 60 83 .035 .026 1.022 70.6 84 .025 .018 .703 71 82 .023 .016 .65
4 90.4 86 .016 .009 .37
C2-I 51.2 85 .049 .037 1.462 57.2 85 .040 .030 1.183 62.5 83 .032 .024 .93
4 81.6 83 .017 .011 .43
125

Table B-4. Predicted chloride content values for Pennsylvania bridge PA 11-15 over 35 SB.
Specific Ion Probe PotentiometricReaction Calculated Titration
Sample Reading Temperature Chloride Predicted Values
Number _M-Volts) (°F) _%CI-) _%CI-) _ib/cu yd)
A-I 30.8 71 .086 .063 2.50
2 29.6 80 .097 .070 2.78
3 57.9 79 .031 .023 .91
4 78.2 78 .014 .008 .32
B-1 -4.7 80 .401 .238 9.38
2 15.8 83 .173 .117 4.62
3 39.6 83 .067 .050 1.97
4 71.6 84 .022 .015 .60
C-I 11.3 83 .208 .137 5.40
2 49.4 80 .044 .033 1.31
3 84.1 82 .014 .008 .32
4 85.7 79 .012 .006 .22
D-I 3 81 .291 .182 7.19
2 41.3 79 .060 .045 1.78
3 80.8 81 .015 .009 .35
4 89.1 81 .012 .006 .22
E-I 17.7 80 .158 .108 4.27
2 69.1 82 .022 .016 .62
3 93.1 80 .010 .004 .15
4 99.7 81 .009 .003 .ii
F-I 44.4 80 .055 .042 1.64
2 74 80 .018 .012 .48
3 88.3 80 .012 .006 .22
4 92.7 80 .010 .004 .17
126

TableB_. (_ntinued)
Specific Ion Probe PotentiometricReaction Calculated Titration
Sample Reading Temperature Chloride Predicted ValuesNumber (M-Volts) (0F_ 6%CI-_ (%Ci-) (Ib/cu vd_
G-I 19.3 80 .152 .105 4.132 41.9 82 .062 .047 1.843 78.5 80 .016 .010 .38
4 81.8 82 .016 .009 .37
H-I 14.7 79 .183 .123 4.842 47.5 82 .050 .038 1.50
3 66.4 83 .026 .019 .744 82 83 .016 .010 .39
I-i 35.7 81 .079 .058 2.30
2 67.8 81 .023 .016 .643 86.1 81 .013 .007 .264 93.7 85 .013 .007 .27
J-i 17.1 86 .173 .117 4.63
2 50.7 85 .046 .035 1.373 69 83 .023 .016 .654 90.2 84 .013 .007 .29
K-I 37.5 88 .078 .058 2.272 83 87 .018 .012 .46
3 81 82 .016 .009 .374 75.1 83 .019 .013 .51
L-I 12.4 85 .210 .138 5.44
2 61.5 85 .032 .023 .92
3 80.9 86 .018 .012 .474 74.4 83 .020 .013 .52
127

Table B-4. (continued)
Specific Ion Probe Potentiometric
Reaction Calculated Titration
Sample Reading Temperature Chloride Predicted Values
NLlmber fM-Volts) (°F) (%CI-) (%CI-) (Ib/cu yd)
PI-I 6.8 82 .263 .167 6.59
2 25.3 79 .120 .085 3.353 45 82 .055 .041 1.63
4 66.2 83 .026 .018 .73
P2-1 -8.1 83 .494 .283 11.15
2 13 80 .201 .133 5.263 41.6 80 .062 .046 1.82
4 63 83 .029 .021 .83
Cl-1 70.5 82 .022 .015 .592 73.9 77 .016 .010 .39
3 79.6 78 .014 .007 .29
4 80.6 78 .013 .007 .28
C2-1 42.7 78 .058 .043 1.712 63.8 77 .024 .017 .67
3 76.6 77 .014 .008 .334 76.7 78 .015 .009 .35
128

Table B-5. Predicted chloride content values for Virginia bridge VA 1-81 over 927 NB.
Specific Ion Probe PotentiometricReaction Calculated Titration
Sample Reading Temperature Chloride Predicted ValuesNumber {M-Volts_ {OF) {%CI-) {%Ci-)
A-I -2.8 96 .397 .236 9.31
2 17.6 94 .173 .117 4.623 61.5 95 .038 .028 1.12
4 91.6 97 .021 .014 .57
B-I -21.1 95 .850 .441 17.402 -I.I 91 .367 .221 8.73
3 .1 96 .353 .214 8.434 17.1 94 .177 .119 4.70
5 27.3 96 .120 .085 3.36
C-I 2.1 95 .324 .200 7.862 5 97 .289 .181 7.15
3 17.3 98 .178 .120 4.734 30.9 98 .106 .076 3.01
D-1 -21.2 98 .855 .444 17.49
2 LOST LOST LOST LOST LOST3 4.2 97 .299 .186 7.354 13.4 98 .207 .137 5.39
5 26.7 96 .123 .087 3.42
E-I -9.3 95 .519 .295 11.622 6.1 95 .276 .174 6.86
3 39.9 96 .076 .056 2.224 79.2 98 .026 .019 .75
F-I .9 97 .342 .208 8.22
2 23.1 96 .141 .098 3.863 63.8 97 .037 .028 1.08
4 89.4 97 .022 .015 .59
G-I -17.7 98 .739 .394 15.522 8.7 97 .249 .160 6.303 62.6 I00 .040 .030 1.18
4 89.1 97 .022 .015 .60
H-I -8.7 96 .507 .289 11.392 1 95 .339 .207 8.17
3 13.6 99 .206 .136 5.374 25.8 I01 .130 .091 3.60
129

Table B-5. (continued)
Specific Ion Probe Potentiometric
Reaction Calculated Titration
Sample Reading Temperature Chloride Predicted Values
Number -V_ (°F) (%CI-) (%CI-) Clb/cu yd)
I-I -1.5 99 .378 .227 8.942 11.2 98 .226 .147 5.80
3 38.4 97 .081 .059 2.344 68.3 97 .033 .024 .96
J-I -15.5 i00 .675 .366 14.42
2 -4.5 98 .427 .251 9.89
3 11.3 I00 .226 .147 5.814 32.4 95 .099 .071 2.82
K-I -7.9 I00 .493 .282 ll.13
2 21.3 97 .152 .105 4.123 57.6 99 .045 .034 1.334 82.5 98 .025 .018 .70
L-I -9.5 98 .525 .298 11.73
2 7.5 i00 .263 .168 6.603 23.6 I00 .141 .098 3.86
4 50.6 I01 .056 .042 1.66
130

Table B-5. (continued)
Specific Ion Probe PotentiometricReaction Calculated Titration
Sample Reading Temperature Chloride Predicted ValuesNumber _M-Volts) (0F) (%C1-) (%CI-) (Ib/cu vd)
PI- I 19.7 90 .167 .114 4.49
2 28.7 89 .114 .081 3.21
3 33.2 90 .095 .069 2.73
4 44.6 89 .060 .045 1.78
P2- 1 22.6 85 .145 .I00 3.96
2 28.4 88 .115 .082 3.23
3 30 91 .109 .078 3.09
4 32.4 88 .097 .070 2.78
CI- 1 14 85 .211 .139 5.46
2 17.4 94 .187 .125 4.94
3 23.7 90 .141 .098 3.87
4 32.9 90 .119 .085 3.34
C2- 1 14.9 90 .206 .136 5.35
2 LOST LOST LOST LOST LOST
3 22.1 91 .152 .105 4.12
4 22.9 91 .147 .102 4.00
BI- 1 .7 88 .381 .228 9.00
2 5.1 90 .315 .195 7.68
3 9.4 90 .261 .166 6.55
4 17.3 87 .184 .123 4.86
B2- 1 -.8 93 .411 .243 9.57
2 2 91 .362 .219 8.62
3 23.2 91 .145 .I00 3.96
4 18.8 91 .175 .118 4.65
131

Table B-6. Predicted chloride content values for Virginia bridge VA 1-81 over 676 NB.
Specific Ion Probe PotentiometricReaction Calculated Titration
Sample Reading Temperature Chloride Predicted Values
Number CM-Volts) !0F_ (%C_-) (%CI-) (ib/cu Yd)
A-1 -12.8 93 .752 .399 15.74
2 -4.3 92 .518 .294 11.60
3 12.5 94 .253 .162 6.38
4 35.9 92 .096 .070 2.75
5 71.4 92 .029 .021 .83
B-I -4.4 93 .521 .296 11.66
2 5.5 94 .341 .208 8.19
3 16 93 .218 .142 5.62
4 36.6 91 .093 .068 2.67
5 60.5 94 .041 .031 1.21
C-I 11.7 92 .260 .166 6.54
2 19 92 .191 .128 5.03
3 53.4 93 .051 .038 1.51
4 69 93 .031 .023 .91
D-I -3.2 92 .494 .283 11.15
2 2.9 95 .381 .228 9.00
3 9.7 93 .284 .178 7.04
4 17.3 93 .206 .136 5.36
5 24.6 93 .152 .105 4.13
E-I 3.3 93 .374 .224 8.85
2 9.9 93 .282 .177 6.99
3 24.4 95 .155 .106 4.19
4 44.2 96 .072 .054 2.12
F-I 3.6 94 .369 .222 8.76
2 6.9 93 .320 .197 7.78
3 9 94 .293 .183 7.23
4 20 94 .185 .124 4.88
5 30.2 95 .122 .087 3.42
G-I 32.4 95 .112 .080 3.16
2 74.7 93 .027 .020 .77
3 87.4 94 .021 .014 .57
4 93.9 94 .019 .012 .49
132

TableB_. (continued)
Specific Ion Probe PotentiometricReaction Calculated Titration
Sample Reading Temperature Chloride Predicted ValuesNumber (M-Volts) f°F) (%CI-) (%CI-) (ib/cu yd)
H-I i.I 94 .411 .243 9.582 17.3 94 .207 .136 5.37
3 35 93 .i00 .072 2.864 81.6 94 .024 .017 .65
5 82.9 93 .022 .016 .61
I-i 18.8 92 .193 .129 5.072 45.3 94 .068 .051 2.01
3 79.2 92 .024 .017 .664 80.2 92 .023 .016 .64
J-i 21.9 92 .169 .115 4.54
2 63.4 95 .038 .029 1.133 93.3 97 .021 .014 .564 93.1 97 .021 .014 .56
K-I 14.3 94 .234 .152 5.98
2 44.9 92 .068 .051 2.003 77.9 92 .024 .017 .68
4 83.8 92 .021 .015 .58
L-I -4.7 96 .530 .300 11.822 -2.1 96 .474 .273 10.77
3 9.8 94 .283 .178 7.024 18.5 94 .197 .131 5.15
5 30.7 94 .119 .085 3.34
PIA-I 23.7 94 .144 .I00 3.93
2 35.2 92 .089 .065 2.573 46.2 92 .058 .044 1.73
4 64.1 93 .033 .024 .96
P2-1 36 92 .086 .063 2.502 43.2 87 .062 .047 1.843 59.9 91 .036 .027 1.06
4 75.4 91 .023 .016 .64
P3-1 4.1 89 .329 .202 7.952 4.3 91 .327 .201 7.92
3 8.5 93 .273 .173 6.81
4 17.1 92 .188 .126 4.96
133

Table B-6. (continued)
Specific Ion Probe PotentiometricReaction Calculated Titration
Sample Reading Temperature Chloride Predicted ValuesNumber (M-Volts) (QF) (%CI-) (%CI-) (Ib/cu ydl
CI-I -.8 90 .409 .242 9.54
2 3.5 92 .339 .207 8.173 9.7 90 .258 .164 6.48
4 13.4 88 .218 .143 5.63
C2-I LOST LOST LOST LOST LOST2 2 92 .363 .219 8.633 4.1 91 .330 .202 7.98
4 7 92 .291 .182 7.19
BI-I 24.1 82 .134 .094 3.692 -2.4 89 .438 .256 i0.i0
3 29.6 89 .ii0 .079 3.104 -2.4 88 .438 .256 10.09
B2-1 37.7 92 .081 .060 2.35
2 69.1 94 .029 .021 .843 73.2 92 .025 .018 .714 86.4 94 .020 .014 .53
B3-1 59.4 90 .036 .027 1.062 82.5 91 .020 .013 .52
3 87.4 93 .019 .013 .504 87.2 92 .019 .012 .48
134

Table B-7. Predicted chloride content wlues for Virginia bridge VA I-81 over 670 NB.
Specific Ion Probe PotentiometricReaction Calculated Titration
Sample Reading Temperature Chloride Predicted ValuesNumber (_,Volts) (_F) (%C_') (%CI-) (ib/cu vd)
A-I -9.7 93 .615 .339 13.35
2 12.3 88 .232 .150 5.933 42.2 94 .070 .052 2.07
4 68.8 95 .030 .022 .885 97.5 96 .018 .012 .47
B-I 4.9 96 .326 .200 7..892 16.2 95 .200 .133 5.243 27.9 93 .122 .087 3.41
4 44.9 94 .064 .048 1.885 71.7 95 .028 .021 .81
C-I 5.6 93 .314 .194 7.652 28.6 93 .119 .084 3.33
3 62.2 94 .036 .027 1.06
4 100.5 97 .018 .012 .47
D-I 5.7 89 .310 .192 7.582 26 94 .133 .093 3.673 77.9 95 .025 .017 .69
4 98.5 95 .018 .011 .44
E-I -4.7 90 .491 .282 ii.i02 15.5 94 .206 .136 5.36
3 63.6 96 .036 .027 1.054 83.5 94 .021 .015 .58
F-I .5 93 .392 .234 9.212 20.9 96 .165 .113 4.44
3 76.6 96 .026 .019 .734 100.6 93 .016 .010 .38
135

Table B-7. (continued)
Specific Ion Probe Potentiometric
Reaction Calculated Titration
Sample Reading Temperature Chloride Predicted Values
Number _ (OF) (%CI-) (%CI-) (Ib/cu yd[
G-I 17 96 .194 .129 5.10
2 49.7 98 .056 .042 1.67
3 86.3 96 .022 .015 .58
4 88.8 94 .019 .013 .51
H-I 10.7 91 .255 .163 6.42
2 34.8 92 .095 .069 2.72
3 68.7 93 .030 .022 .88
4 101.8 92 .015 .009 .36
I-I 5.8 95 .317 .195 7.71
2 43.8 93 .068 .051 2.00
3 91.2 93 .019 .012 .48
4 96.2 94 .018 .012 .45
J-I 8.6 94 .280 .177 6.96
2 43.1 93 .070 .052 2.05
3 88.8 94 .020 .013 .53
4 89.9 94 .020 .013 .52
K-I 12.6 96 .238 .154 6.06
2 75.6 96 .027 .020 .78
3 91.6 96 .020 .014 .54
4 86.4 92 .020 .013 .52
L-I 8.8 93 .277 .175 6.90
2 39.7 91 .078 .058 2.27
3 60.6 90 .036 .027 1.08
4 85 94 .021 .015 .58
Pl-i 3.3 84 .335 .205 8.08
2 10.6 88 .247 .158 6.25
3 13.2 91 .223 .145 5.73
4 18.1 90 .180 .121 4.79
P2-1 20.9 87 .159 .109 4.28
2 53 90 .046 .035 1.37
3 72.9 92 .026 .019 .74
4 81.8 89 .019 .013 .51
136

Table B-7. (continued)
Specific Ion Probe PotentiometrlcReaction Calculated Titration
Sample Reading Temperature Chloride Predicted Values
Number {M-Volts) _°F) {%CI-) (%CI-) llb/cu yd)
P3-1 5.5 90 .308 .191 7.542 12.1 91 .233 .151 5.96
3 19.5 92 .171 .I16 4.584 32.3 90 .101 .073 2.87
BI-I 13.2 88 .221 .144 5.69
2 87.9 92 .019 .012 .493 72 90 .025 .018 .72
4 80.3 90 .021 .014 .55
B2-1 31.4 89 .112 .080 3.16
2 82.7 90 .022 .015 .603 91.8 94 .021 .014 .55
4 96.3 96 .020 .014 .54
B3-1 3.5 88 .339 .207 8.172 31.8 86 .108 .078 3.07
3 55.3 90 .048 .036 1.424 69.2 91 .032 .023 .92
CI-I -10.9 94 .617 .340 13.392 -4 86 .460 .267 10.523 5.3 90 .317 .195 7.714 14.4 90 .219 .143 5.66
C2-I 28.4 86 .124 .088 3.45
2 16.5 86 .199 .132 5.213 25.6 89 .140 .098 3.854 26 90 .139 .097 3.81
137

Table B-8. Predicted chloride content values for Florida bridge FL 206.
Specific Ion Probe PotentiometricReaction Calculated Titration
Sample Reading Temperature Chloride Predicted ValuesNumber (M-Volts) _°F) (%CI-_ (%CI-) _Ib/cu yd)
PC-1 -21.1 83 .828 .432 17.042 -19.1 85 .763 .404 15.943 -9.1 8! .502 .286 11.294 -4.4 81 .413 .244 9.61
5 -3.6 83 .401 .238 9.376 7 82 .258 .165 6.49
PC2-1 2 82 .317 .196 7.72
2 14.6 81 .188 .126 4.973 42.4 82 .062 .047 1.844 48.5 80 .048 .036 1.43
5 62.5 83 .030 .022 .886 85.9 82 .014 .008 .31
POI-I -7.2 81 .464 .268 10.58
2 -I.I 87 .364 .220 8.653 9.3 86 .237 .153 6.05
4 26.1 83 .119 .085 3.345 47.5 82 .051 .039 1.526 77.7 84 .019 .013 .50
PO2-1 46.7 83 .053 .040 1.59
2 64.7 85 .029 .021 .853 101.2 85 .012 .006 .224 II1.7 82 .008 .002 .07
5 104 81 .008 .002 .09
P5-1 -22.7 84 .883 .455 17.95
2 -13.7 84 .610 .336 13.26
3 -6.9 86 .463 .268 10.574 2.4 85 .316 .195 7.705 20.8 82 .149 .103 4.06
P6-1 -1.6 80 .369 .222 8.762 -.7 80 .356 .215 8.493 LOST LOST LOST LOST LOST
4 36 80 .080 .059 2.345 59.9 85 .035 .026 1.04
138

Table B-8. (continued)
Specific Ion Probe PotentiometricReaction Calculated Titration
Sample Reading Temperature Chloride Predicted Values
Number [M-Volts) (°F) (%CI-) _%CI-) (Ib/cu yd)
CI-I 39.4 83 .072 .054 2.12
2 58.2 84 .037 .028 1.093 66.7 82 .026 .019 .75
4 75.1 85 .022 .015 .605 83.2 83 .016 .010 .40
BI-I 68.1 82 .025 .018 .71
2 75.8 83 .020 .014 .543 90.8 85 .015 .009 .34
4 108.1 83 .009 .003 .135 113.8 83 .008 .002 .09
B2-1 55.7 81 .038 .029 1.13
2 71 81 .022 .015 .613 85.1 83 .015 .009 .37
4 101.7 82 .010 .004 .15
DA-I 74 90 .028 .020 .792 91.4 87 .017 .010 .41
3 97.5 91 .017 .011 .434 98 89 .016 .010 .38
DB-I 77.3 90 .025 .018 .72
2 92.1 92 .020 .013 .523 96.7 92 .018 .012 .46
4 98.5 89 .016 .010 .38
DC-I 79.3 91 .025 .018 .70
2 LOST LOST LOST LOST3 94.9 91 .018 .012 .46
4 97.6 92 .018 .012 .465 98.4 92 .018 .011 .45
DD-I 75.5 95 .030 .022 .862 82.9 94 .025 .018 .69
3 92.8 91 .019 .012 .494 99.2 93 .010 .012 .46
139

Table B-9. Predicted chloride content values for Florida bridge FL 295 EB.
Specific Ion Probe Potentiometric
Reaction Calculated Titration
Sample Reading Temperature Chloride Predicted Values
Number _M-Volts) (°F) (%C_-) _%CI-) Clb/cu yd)
Pl-i 15.3 81 .188 .126 4.95
2 28.6 78 .107 .077 3.02
3 41.2 80 .065 .048 1.91
4 53.8 82 .041 .031 1.21
5 56.6 81 .036 .027 1.06
P2-1 68.5 83 .025 .018 .69
2 81.3 83 .017 .010 .41
3 89.2 81 .012 .006 .24
4 95.7 80 .010 .003 .14
P3-1 ll 83 .226 .147 5.79
2 25.2 81 .125 .088 3.47
3 39.8 84 .071 .053 2.09
4 53.8 81 .040 .030 1.19
5 57.5 82 .035 .027 1.05
P4-1 66.6 82 .026 .018 .73
2 79.7 85 .019 .012 .49
3 96.6 84 .012 .006 .23
4 101.7 82 .009 .003 .13
Bl-i 91.6 83 .013 .007 .26
2 104 84 .010 .004 .17
3 113.9 84 .009 .003 .ll
4 118.5 85 .009 .003 .12
B2-1 81.3 81 .015 .009 .36
2 100.7 82 .010 .004 .14
3 I16.1 83 .008 .002 .07
4 120.3 80 .006 0 0
140

Table B-9. (continued)
Specific Ion Probe PotentiometricReaction Calculated Titration
Sample Reading Temperature Chloride Predicted Values
Number (M-Volts) (?F) C%CI-) (%C_-) (ib/cu yd)
Cl-I 85 82 .014 .008 .32
2 106.8 83 .009 .003 .12
3 109.7 83 .009 .003 .I04 114 83 .008 .002 .08
C2-I 93.9 85 .013 .007 .282 103.4 83 .010 .004 .153 108.4 84 .010 .004 .14
4 114.9 84 .009 .003 .i0
C3-1 76.5 84 .020 .013 .522 90.6 82 .012 .006 .25
3 104.9 83 .010 .003 .144 106.6 85 .011 .004 .18
C4-I 81 85 .018 .012 .46
2 102.9 86 .012 .006 .233 114.5 82 .008 .001 .05
4 114.4 80 .006 0 0
C5-I 78.6 86 .020 .013 .53
2 101.8 81 .009 .003 .ll3 117.5 78 .005 0 0
4 121.5 78 .004 0 0
C6-I 83.5 84 .016 .010 .402 104.4 83 .010 .004 .14
3 113.4 84 .009 .003 .ll4 121.2 78 .004 0 0
141
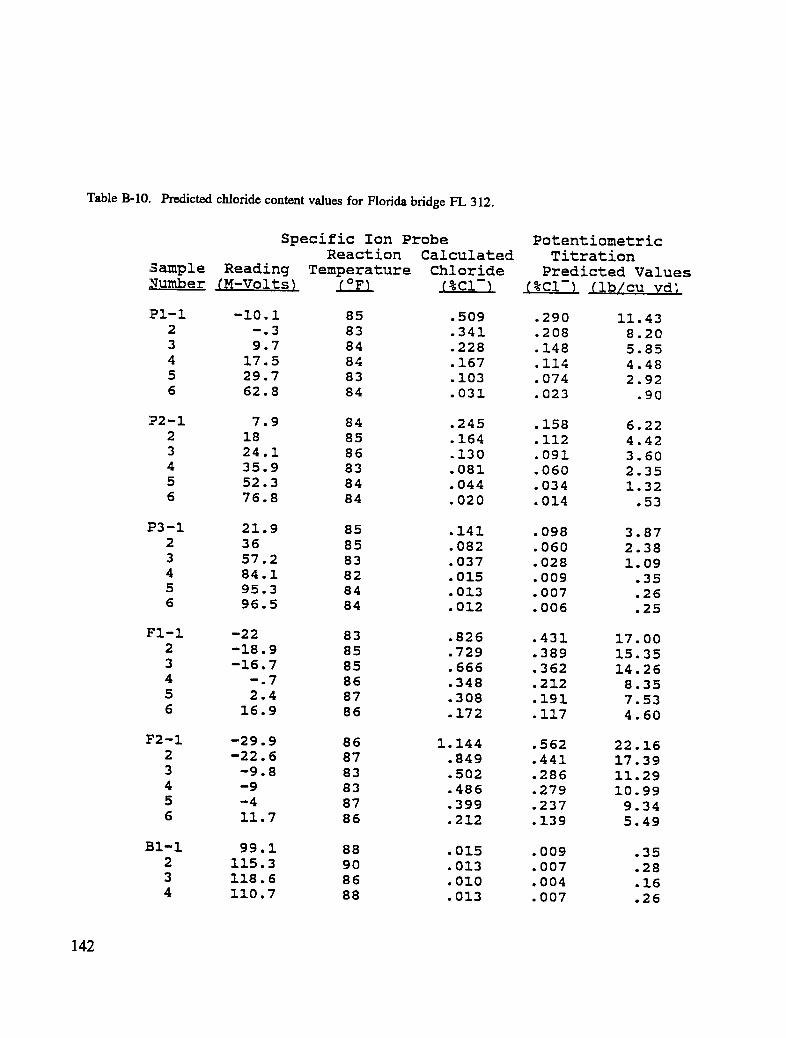
Table B-10. Predicted chloride content values for Florida bridge FL 312.
Specific Ion Probe Potentiometric
Reaction Calculated Titration
Sample Reading Temperature Chloride Predicted Values
Number _M-Volts) C_F) _%CI-) _%CI-) _Ib/cu yd_
PI-I -10.1 85 .509 .290 11.43
2 -.3 83 .341 .208 8.20
3 9.7 84 .228 .148 5.85
4 17.5 84 .167 .114 4.48
5 29.7 83 .103 .074 2.92
6 62.8 84 .031 .023 .90
P2-1 7.9 84 .245 .158 6.22
2 18 85 .164 .112 4.42
3 24.1 86 .130 .091 3.60
4 35.9 83 .081 .060 2.35
5 52.3 84 .044 .034 1.32
6 76.8 84 .020 .014 .53
P3-1 21.9 85 .141 .098 3.87
2 36 85 .082 .060 2.38
3 57.2 83 .037 .028 1.09
4 84.1 82 .015 .009 .35
5 95.3 84 .013 .007 .26
6 96.5 84 .012 .006 .25
FI-I -22 83 .826 .431 17.00
2 -18.9 85 .729 .389 15.35
3 -16.7 85 .666 .362 14.26
4 -.7 86 .348 .212 8.35
5 2.4 87 .308 .191 7.53
6 16.9 86 .172 .i17 4.60
F2-1 -29.9 86 1.144 .562 22.16
2 -22.6 87 .849 .441 17.39
3 -9.8 83 .502 .286 11.29
4 -9 83 .486 .279 10.99
5 -4 87 .399 .237 9.34
6 Ii.7 86 .212 .139 5.49
Bl-1 99.1 88 .015 .009 .35
2 115.3 90 .013 .007 .28
3 118.6 86 .010 .004 .16
4 110.7 88 .013 .007 .26
142

Table B-IO. (continued)
Specific Ion Probe PotentiometricReaction Calculated Titration
Sample Reading Temperature Chloride Predicted ValuesNumber {M-Volts) (°F) (%CI-) {%CI-) (ib/cu yd)
BIA-I 95.5 91 .018 .012 .462 108.6 91 .015 .009 .34
3 119.4 93 .015 .008 .334 121.6 92 .014 .008 .30
CI-I 54.5 87 .048 .036 1.43
2 60 91 .042 .032 1.263 62.8 90 .038 .029 1.134 74.1 90 .028 .020 .80
5 86.9 93 .022 .016 .616 96.9 94 .019 .013 .51
C2-I 74.4 91 .028 .021 .812 77.2 93 .027 .020 .793 84.2 93 .024 .017 .654 90 91 .020 .013 .52
DA-I 72.6 93 .031 .023 .892 80.9 91 .024 .017 .673 95.5 90 .017 .011 .43
4 94.8 93 .019 .013 .51
DB-I 73.5 91 .029 .021 .832 86 89 .020 .014 .54
3 93.5 89 .017 .011 .434 94.1 89 .017 .011 .43
143

Table B-1 I. Predicted chloride content values for Wisconsin bridge WI 243 WB.
Specific Ion Probe Potentiometric
Reaction Calculated Titration
S_ple Reading Temperature Chloride Predicted Values
Number (M-Volts) (°F) (%CI-) (%CI-} _Ib/cu yd)
A--1 -6.3 87 .521 .296 11.65
2 i1.8 87 .244 .157 6.19
3 23 88 .155 .106 4.19
4 42.5 88 .072 .053 2.11
5 72.4 89 .027 .019 .76
B-1 -8.8 90 .581 .323 12.74
2 -1.8 91 .434 .254 I0.01
3 18 92 .192 .128 5.05
4 46.6 90 .063 .047 1.86
5 38.9 88 .082 .061 2.39
C-i -16.1 92 .792 .417 16.43
2 -3.9 89 .472 .273 10.74
3 22.9 91 .157 .108 4.25
4 43.9 94 .072 .053 2.11
5 70.3 95 .032 .024 .94
D-l -12.9 89 .690 .372 14.68
2 i.I 92 .385 .230 9.07
3 26 91 .139 .097 3.82
4 51.I 90 .054 .040 1.59
5 32.4 83 .103 .074 2.93
E-I -Ii 91 .638 .349 13.76
2 5 91 .327 .201 7.91
3 19.9 89 .176 .i19 4.69
4 54.1 89 .048 .036 1.42
5 55.7 90 .046 .034 1.36
F-I -3.1 92 .458 .266 10.48
2 5.1 92 .326 .200 7.89
3 18.9 90 .184 .124 4.87
4 40.9 94 .080 .059 2.33
5 42.3 85 .070 .053 2.07
G-I -6.1 90 .519 .294 11.61
2 5.6 94 .320 .197 7.78
3 17.7 94 .196 .130 5.13
4 38.2 94 .088 .065 2.55
]44 5 48.8 93 .060 .045 1.78

Table B-11. (continued)
Specific Ion Probe PotentiometricReaction Calculated Titration
Sample Reading Temperature Chloride Predicted ValuesNumber (M-Volts) _°F) _%CI-) _%CI-) ,ib/cu vd)
H-I -8.3 93 .571 .319 12.56
2 4.1 92 .340 .207 8.173 18.2 95 .192 .128 5.06
4 37.8 90 .087 .064 2.525 45.6 87 .063 .047 1.87
I-i -16.3 94 .800 .420 16.56
2 -6.5 94 .530 .300 11.813 11.4 90 .250 .160 6.32
4 37.4 91 .089 .065 2.575 61.6 92 .039 .029 1.15
J-i -11.3 93 .647 .353 13.93
2 -2 90 .437 .255 10.073 11.8 92 .242 .156 6.15
4 40.9 95 .082 .061 2.395 50.3 91 .058 .043 1.71
K-I -14.5 91 .694 .374 14.742 5.1 87 .312 .193 7.623 11.3 92 .247 .159 6.25
4 32.7 93 .109 .078 3.095 58.9 90 .043 .032 1.27
L-I -9.9 90 .575 .321 12.64
2 -1.8 90 .415 .245 9.653 9.4 90 .265 .168 6.63
4 20.4 93 .174 .117 4.635 47.8 88 .061 .046 1.80
145

Table B-I 1. (continued)
Specific Ion Probe PotentiometricReaction Calculated Titration
Sample Reading Temperature Chloride Predicted Values_umber [M-Volts) (OF) 6%Ci-) (%Ci-) Clb/cu yd)
AI-I 52.7 99 .058 .043 1.71
2 63 99 .043 .032 1.26
3 72.3 104 .037 .027 1.084 68.7 102 .038 .029 1.14
A2-1 39.1 102 .092 .067 2.652 56.2 104 .055 .041 1.62
3 73.2 105 .036 .027 1.084 75.7 102 .033 .024 .96
PC1-1 41.2 97 .083 .061 2.41
2 58.1 103 .051 .039 1.523 75.5 104 .034 .026 1.01
4 55.7 102 .054 .041 1.61
PC2-1 47.6 96 .066 .049 1.94
2 57.2 i00 .051 .038 1.513 59 98 .047 .035 1.40
4 60.9 i01 .046 .035 1.38
POI-I 40.3 93 .079 .059 2.312 56.8 I01 .049 .037 1.463 59.2 102 .046 .035 1.38
4 64.3 103 .041 .031 1.22
P02-1 51.4 97 .056 .042 1.67
2 76.3 97 .028 .021 .813 70.9 96 .031 .023 .92
4 39.6 91 .081 .060 2.35
146

Table B-12. Predicted chloride content values for Wisconsin bridge WI 245 WB.
Specific Ion Probe PotentiometricReaction Calculated Titration
Sample Reading Temperature Chloride Predicted ValuesNumber (M-Volts) _OF) (%CI-) (%CI-) (ib/cu vd)
A-1 -14.4 91 .673 .365 14.37
2 .2 87 .371 .223 8.793 1.4 90 .355 .215 8.484 15 90 .207 .137 5.38
5 31.5 92 .iii .079 3.13
B-I 14.4 83 .207 .137 5.392 16.8 88 .192 .128 5.043 12.9 92 .226 .147 5.80
4 20 90 .170 .116 4.555 49.3 92 .059 .044 1.75
C-I -7.2 95 .505 .288 11.36
2 .3 97 .376 .225 8.883 12.7 94 .229 .149 5.87
4 27.8 95 .129 .091 3.585 58.9 95 .045 .034 1.35
D-I -13.6 96 .718 .385 15.16
2 10.3 88 .259 .165 6.513 13.2 94 .233 .151 5.964 37 95 .092 .067 2.64
5 65.8 96 .036 .027 1.07
E-I -7.3 I00 .552 .310 12.23
2 3.1 94 .354 .215 8.463 21.5 97 .168 .114 4.51
4 49 96 .060 .045 1.795 67.9 95 .034 .025 .99
F-I -7.3 98 .551 .310 12.20
2 7.1 90 .297 .186 7.313 18.9 96 .186 .125 4.92
4 28.4 88 .123 .087 3.435 61.6 94 .040 .030 1.17
G-I -14.9 91 .756 .401 15.81
2 -i.i 91 .421 .248 9.763 6.6 96 .292 .183 7.21
4 26.2 94 .138 .096 3.80
5 49.7 95 .058 .044 1.73 147

Table B-12. (continued)
Specific Ion Probe PotentiometricReaction Calculated Titration
Sample Reading Temperature Chloride Predicted Values
Eumber _M-Volts) (gF) _%CI-) C%CI-) Clb/cu yd)
H-1 -14 90 .661 .360 14.17
2 -4.9 92 .459 .266 10.49
3 9.2 89 .260 .165 6.524 47.2 90 .062 .047 1.84
5 66.8 93 .035 .026 1.03
I-1 -4.6 89 .451 .263 10.35
2 -I 93 .393 .234 9.233 12.3 93 .232 .151 5.934 31.5 88 .108 .078 3.07
5 51 91 .055 .042 1.64
J-i -9 90 .540 .304 12.002 .9 92 .364 .219 8.65
3 16.4 96 .200 .132 5.224 36.6 97 .095 .069 2.73
5 57.8 94 .046 .035 1.37
K-l -14.7 95 .683 .369 14.56
2 -4.5 95 .453 .263 10.39
3 8.8 94 .267 .169 6.684 23.5 94 .151 .104 4.115 36 86 .090 .066 2.60
L-I -9.5 94 .553 .311 12.252 5.7 93 .301 .187 7.39
3 19.7 91 .173 .I17 4.614 45.8 91 .066 .049 1.94
5 72.4 93 .030 .022 .88
148

TableB-12. (continued)
Specific Ion Probe PotentiometricReaction Calculated Titration
Sample Reading Temperature Chloride Predicted ValuesNumber (M-Volts) (?F) (%C]m) (%C17_ (_b/cu yd)
PO-1 3.5 87 .369 .222 8.762 5.7 91 .341 .208 8.19
3 18.4 89 .205 .136 5.354 34.6 88 .ii0 .079 3.10
5 62.6 86 .039 .030 1.17
PO2-1 39.9 88 .090 .066 2.592 58.3 88 .047 .035 1.403 60.5 88 .044 .033 1.30
4 47.6 87 .067 .050 1.98
5 68.7 87 .033 .025 .97
PC1-1 -11.2 89 .669 .363 14.312 1.5 87 .400 .238 9.37
3 8.3 88 .305 .190 7.484 28.4 84 .136 .095 3.755 36.9 91 .102 .074 2.91
6 65.7 92 .039 .030 1.17
PC2-1 25.4 95 .160 .II0 4.32
2 35.8 88 .171 .116 4.57
3 53.7 93 .058 .044 1.724 60.9 88 .043 .032 1.28
5 62.7 91 .042 .032 1.26
AI-I 49.4 97 .069 .052 2.042 64.3 I00 .046 .035 1.37
3 61.9 98 .048 .036 1.424 47.8 91 .069 .052 2.04
5 67.5 102 .040 .030 1.19
A2-1 23.1 95 .162 .Iii 4.36
2 34.4 102 .ii0 .079 3.103 59.2 103 .050 .038 1.504 64.2 I01 .043 .032 1.28
5 78 97 .029 .021 .84
149

Table B-13. Predicted chloride content values for Wisconsin bridge WI 252.
Specific Ion Probe PotentiometricReaction Calculated Titration
Sample Reading Temperature Chloride Predicted Values
Nul_ber (M-Volts) C°F) [%CI-) (%Ci-) _Ib/cu yd)
A.-I -18.8 88 .785 .414 16.32
2 -7 84 .479 .276 10.86
:3 -4.9 91 .443 .258 10.19
4 7.5 86 .264 .168 6.61
5 28.1 80 .iii .079 3.13
6 42.1 84 .066 .049 1.94
B-I -26.9 89 1.102 .546 21.50
2 -16.6 89 .717 .384 15.15
3 -5.6 90 .455 .264 10.42
4 5 88 .294 .183 7.23
5 19 88 .167 .113 4.47
6 46.4 87 .058 .043 1.71
C-I -12 86 .591 .328 12.92
2 -10.4 92 .556 .312 12.30
3 1.5 92 .341 .208 8.21
4 7.5 86 .264 .168 6.61
5 32.2 84 .097 .070 2.77
6 49.2 86 .052 .039 1.54
D-I -20.4 89 .840 .437 17.24
2 -17.9 89 .757 .402 15.83
3 -12.4 93 .605 .334 13.17
4 -1.2 91 .381 .228 8.98
5 11.7 88 .223 .146 5.75
6 43.5 92 .067 .050 1.98
E-I -21.2 89 .869 .449 17.72
2 -9.5 91 .535 .302 11.92
3 -4.6 92 .438 .256 i0.I0
4 6.2 92 .282 .177 6.99
5 27.4 91 .121 .086 3.39
6 57.6 90 .041 .031 1.22
F-I -19.3 94 .806 .423 16.66
2 -ii 90 .569 .318 12.53
3 -i.I 91 .379 .227 8.95
4 13.5 99 .215 .141 5.55
5 26.8 91 .124 .088 3.46
6 44.7 87 .061 .046 1.82150

TableB-13. (contmue_
Specific Ion Probe PotentiometricReaction Calculated Titration
Sample Reading Temperature Chloride Predicted Values
Number _M-Volts) _°F) (%CI-) (%CI-) (Ib/cu ydl
G-I -25.6 93 1.046 .523 20.61
2 -22.3 92 .911 .467 18.42
3 -15.5 87 .684 .370 14.57
4 4.1 91 .306 .190 7.50
5 14.4 91 .202 .134 5.28
6 44.7 86 .061 .046 1.80
H-I -18.1 87 .762 .404 15.92
2 -9.7 8? .537 .303 11.95
3 -3.8 92 .424 .249 9.83
4 -.3 90 .366 .221 8.70
5 18 90 .175 .118 4.65
6 50.9 92 .052 .039 1.56
I-i -19.7 91 .817 .428 16.86
2 -15.6 92 .690 .372 14.67
3 .6 90 .353 .214 8.44
4 5.2 93 .294 .184 7.25
5 24.7 93 .136 .095 3.75
6 55.1 92 .046 .034 1.36
J-i -16.9 87 .725 .388 15.28
2 -15.2 88 .676 .366 14.43
3 -7 88 .481 .277 10.91
4 2.2 88 .329 .202 7.96
5 13.6 88 .207 .137 5.38
6 40.8 89 .072 .054 2.12
K-I -17.3 91 .740 .394 15.54
2 -10.6 88 .558 .313 12.34
3 -1.5 90 .385 .230 9.06
4 16.6 89 .184 .123 4.87
5 28.7 94 .117 .083 3.29
6 53.8 88 .045 .034 1.34
L-I -18.6 88 .779 .411 16.21
2 -11.7 89 .585 .325 12.82
3 -9.8 88 .540 .305 12.00
4 i.I 89 .345 .210 8.28
5 12.2 88 .219 .143 5.65
6 36.6 91 .086 .063 2.48
151

Table B-13. (continued)
Specific Ion Probe PotentiometricReaction Calculated Titration
Sample Reading Temperature Chloride Predicted Values
Number [M-Volts) (0F) (%Ci-) (%CI-) (Ib/cu yd)
Pl-1 -.6 98 .420 .247 9.74
2 3.3 103 .361 .218 8.60
3 18 99 .200 .133 5.23
4 34.6 i01 .108 .078 3.07
5 44.5 104 .079 .058 2.30
P2-1 26.8 104 .146 .I01 3.98
2 39.4 102 .092 .067 2.65
3 49.4 104 .068 .050 1.99
4 58.1 99 .050 .037 1.47
5 59.1 103 .050 .038 1.50
BWI-I -23.8 93 1.051 .525 20.69
2 -7.2 91 .533 .301 11.87
3 7.1 88 .297 .185 7.31
4 -I.I 92 .417 .246 9.69
5 .6 93 .390 .232 9.16
BW2-1 -21.4 94 .953 .485 19.11
2 -14 93 .704 .378 14.92
3 -5.3 93 .494 .283 11.16
4 -1.5 90 .422 .248 9.79
5 2.2 93 .365 .220 8.69
AIB-I -7.8 95 .548 .308 12.15
2 12.6 97 .244 .157 6.19
3 26.1 i00 .147 .102 4.02
4 38.4 95 .092 .067 2.64
5 55.4 94 .051 .039 1.53
AICI-I -19.9 93 .896 .461 18.16
2 -10.7 95 .617 .340 13.38
3 -2.4 94 .440 .257 10.14
4 11.9 94 .249 .160 6.30
5 30 94 .124 .088 3.46
152

References
I. Portland Cement Association, U.S. Bureau of Public Roads, and Ten State Highway Agencies.
Durability of Concrete Bridge Decks, Report 5. Portland Cement Association, Skokie, II, 1969, p. 46.
2. Portland Cement Association. Durability of Concrete Bridge Decks, Final Report. Portland Cement
Association, Skokie, Ill., 1970, p. 35.
3. Dallaire, G. "Designing Bridge Decks that Won't Deteriorate." Civil Engineering 43 No. 8 (1973):43-48.
4. Godfrey, K.A. "Bridge Decks." Civil Engineering 45 No. 8 (1975): 60-65.
5. U.S. General Accounting Office. Deteriorating Highways And Lagging Revenues: A Need to Reassess
The Federal Highway Program: Report No. CED-81-42. Washington, D.C.: U.S. General AccountingOffice, 1981.
6. AASHTO, FI-IWA, TRB, and NCHRP. Strategic Highway Research Program - Research Plans. Final
Report. Washington, D.C.: Technical Research Area 4, TRB, 1986, pp. TRA 4-1 through TRA 4-60.
7. Subramanian, E.V. and H.G. Wheat. "Depassivation Time of Steel Reinforcement in a ChlorideEnvironment - A One-Dimensional Solution." Corrosion 45 No. 1 (1989): 43-48.
8. Verbeek, G.J. Corrosion of Metals in Concrete. SP-49. Detroit, MI: American Concrete Institute,1975.
9. Pourbaix, M. Atlas of Electrochemical Equilibrium in Aqueous Solutions. Houston, TX: NACE, 1974.
10. Cady, P.D. and R.E. Weyers. "Chloride Penetration and the Deterioration of Concrete Bridge Decks."Cement, Concrete, and Aggregates, 5 No. 2 (1983): 81-87.
11. Smith, D.G. Determination of Chloride Diffusion Constants for Concrete of Differing Water to CementRatios and Admixtures. Master's thesis. Virginia Polytechnic Institute and State University, 1988.
153

12. Rhodes, J.R. In Situ Determination of the Chloride Content of Portland Cement Concrete in BridgeDecks - Feasibility Study. FHWA-RD-77-26. Washington, D.C.: FHWA, U.S. Department of
Transportation, 1977, p. 114.
13. Rhocles, J.R. In Situ Determination of the Chloride Content of Portland Cement Concrete in BridgeDecks. FHWA-RD-80-O30. Washington, D.C.: FHWA, U.S. Department of Transportation, 1980,
p. 59.
14. Livingston, R.A. "X-Ray Analysis of Brick Cores from the Powell-Waller Smokehouse, ColonialWilliamsburg." Proceedings of the Third North American Masonry Conference, 1985, pp. 61/1-16.
15. Evans, L.G. "Neutron/Gamma Ray Techniques for Investigating the Deterioration of Historic
Buildings." Nuclear Instruments and Methods in Physics Research A242 No. 2 (1986): pp. 346-351.
16. Livingston, L.G. "Diagnosis of Building Condition by Neutron-Gamma Ray Technique." ASTM STP901 Philadelphia, PA: ASTM, 1986, pp. 165-180.
17. National Ready Mixed Concrete Association. Standard Practice for Rapid Determination of WaterSoluble Chloride in Freshly Mixed Concrete, Aggregate and Liquid Admixtures. Silver Spring, MD:National Ready Mixed Concrete Association, 1986.
18. Building Research Station. Determination of Chloride and Cement Content in Hardened Portland CementConcrete. Building Research Establishment Information Sheet, IS 13/77. England: Building ResearchStation, 1977.
19. Larson, T.D., P.D. Cady, F.P. Browne, and N.B. Bolling. Deicer Scaling Mechanism in Concrete.Pennsylvania Department of Highways Contract 44242, Department of Civil Engineering, ThePennsylvania State University, University Park, Pa., December 1970, pp. 87-100.
20. James Instruments, Inc. CL Test Model CL 500 Instruction Manual. Chicago, IL: James Instruments,Inc., Chicago, IL, 1988, p. 11.
21. Hath Company. DR/2OOOSpectrophotometerProcedures Manual. 2rid Edition. Loveland, CO: HaehCompany, 1988, p. 395.
22. Morris, G.L. Rapid In Situ Determination of Chloride Ion in Portland Cement Concrete Bridge Decks.FHWA-KS-RD 75-2. Washington, D.C.: FI-IWA, U.S. Department of Transportation, 1976, p. 39.
23. AASHTO. Standard Specifications for Transportation Materials and Methods of Sampling and Testing,Part H. 14th Edition. Washington, D.C.: AASI-ITO, 1986, pp. 1110-1116.
24. Ott, L. An Introduction to Statistical Methods and Data Analysis. 3rd Edition. Boston, MA: PWS-Kent Publishing Company, 1988, p. 835.
25. I-Inch Company. Digital Titrator Model 16900-01 Manual. Loveland, CO: Hach Company, 1988, p. 123.
154

26. Environmental Test System, Inc. Quantab Chloride Titrators Information Summary. Elkhart, IN:Environmental Test System, Inc., 1988, p. 2.
27. Yoder, E.J. and M.W. Witczak. Principles of Pavement Design. 2rid Edition. New York: John Wiley
and Sons, Inc., 1975, p. 711.
155

Concrete and Structures Advisory Committee
Chairman Liaisons
James J. MurphyNew York State Department of Transportation Ted Ferragut
Federal Highway AdministrationVice Chairman
Howard H. Newlon, Jr. Crawford JencksVirginia Transportation Research Council (retired) Transportation Research Board
Members Bryant Mather
U.S. Army Corps of Engineers Waterways Experiment StationCharles Arnold
Michigan Department of Transportation Thomas J. PaskoFederal Highway Administration
Don Beuerlein
Koss Construction Co. John L. RiceFederal Aviation Administration
Bernard Brown
Iowa Department of Transportation Suneel VanikarFederal Highway Administration
Richard D. Gaynor
National Aggregates Association/National Ready Mired 11/19/92Concrete Association
Expert Task GroupRobert J. Girard
Missouri Highway and Transportation Department Charles J. Arnold
Michigan Department of TransportationDavid L. Gress
University of New Hampshh'e Jack J. FontanaConsultant
Gary Lee Hoffman
Pennsylvania Department of Transportation Ronald 1. Frascoia
State of Vemlont Agency of TransportationBrian B. HopeQueens University Andrew D. Halverson
Minnesota Department of TransportationCarl E. Locke, Jr.
University of Kansas Gary Hoffman
Pennsylvania Department of TransportationClellon L. Loveall
Tennessee Department of Transportation Crawford Jencks
Transportation Research BoardDavid G. Manning
Ontario Ministry of Transportation Paul D. Krauss
Wiss Janney Elstner AssociatesRobert G. Packard
Portland Cement Association Louis Kuhlmann
Larkin Laboratory--Dow Chemicals USAJames E. Roberts
California Department of Transportation Alberto Sagues
Unh,ersity of South FloridaJohn M. Scanlon, Jr.
Wiss Janney Elstner Associates Frederick Szczepanek
New York Department of TransportationCharles F. Scholer
Purdue University Paul Virmani
Federal Highway AdministrationLawrence L. Smith
Florida Department of Transportation 10/9/92
John Strada Consultant to the Expert Task GroupWashington Department of Transportation (retired)
John Broomfield