Embed Size (px)
Citation preview

“Solutions for Sustainable Infrastructure”
Condition Assessmentof Large Diameter Mains
Bethany McDonald
Northern California Pipe Users GroupDecember 14, 2010

Outline
• Pipe materials– PCCP
– Metallic
• Leak detection in large mains
• PCCP assessment– Focus on PipeDiver
• Condition assessment of metallic mains

Prestressed Concrete Cylinder Pipe Cross Section
Steel CylinderSteel Cylinder
Concrete CoreConcrete Core
MortarMortar
Steel WiresSteel Wires

The Problem -Corrosion

AA
BB
DDCC
Split Bell
Leadite Joint Seal
Circumferential CrackBlow-out
Longitudinal Cracking
Wall Corrosion
Blow-out
Failure Modes of Metallic Mains

Multiple Cause Failure
Need a broad tool box to identify various warning signs
Longitudinal crack Wall Corrosion
Bell Splitting


Leak Detection in Large Mains
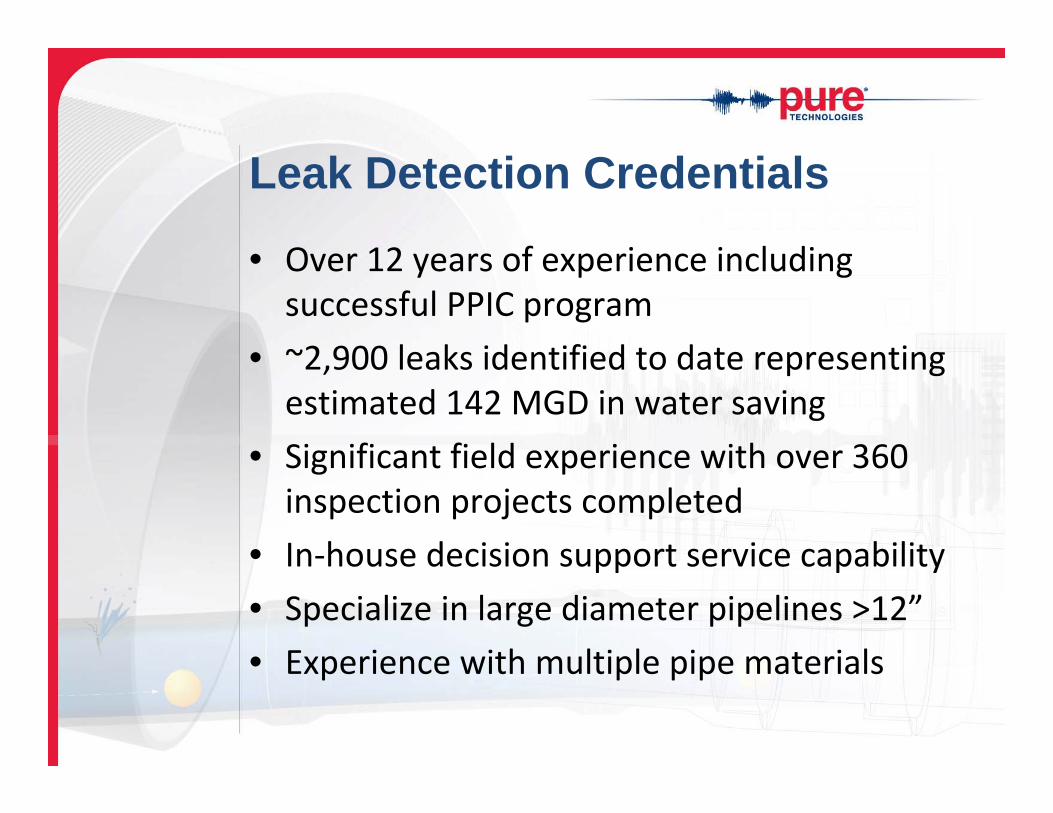
Leak Detection Credentials
• Over 12 years of experience including successful PPIC program
• ~2,900 leaks identified to date representing estimated 142 MGD in water saving
• Significant field experience with over 360 inspection projects completed
• In‐house decision support service capability
• Specialize in large diameter pipelines >12”
• Experience with multiple pipe materials

Why Look for Leaks?
• Knowledge about condition of pipeline– Minimize risk
– Optimize repair & replace programs
• Reduction of emergency response costs
• Water production cost savings – physical treatment and distribution
• Environmental sustainability – conservation of a natural resource
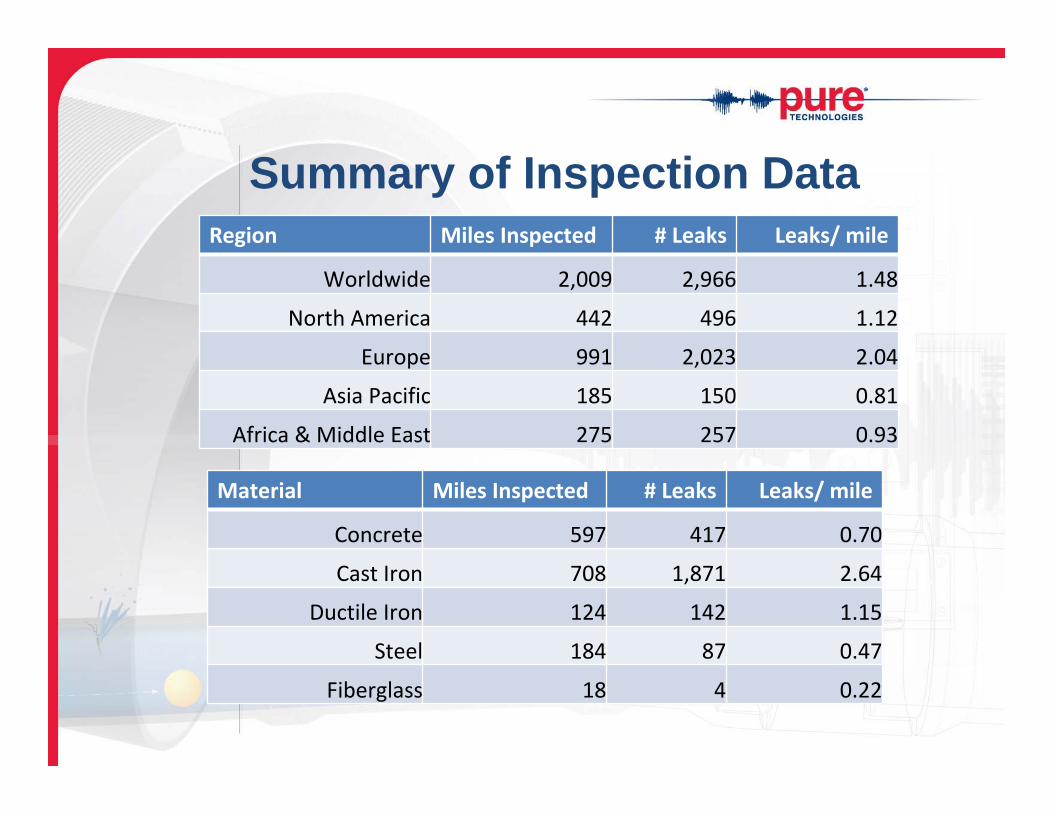
Summary of Inspection DataRegion Miles Inspected # Leaks Leaks/ mile
Worldwide 2,009 2,966 1.48
North America 442 496 1.12
Europe 991 2,023 2.04
Asia Pacific 185 150 0.81
Africa & Middle East 275 257 0.93
Material Miles Inspected # Leaks Leaks/ mile
Concrete 597 417 0.70
Cast Iron 708 1,871 2.64
Ductile Iron 124 142 1.15
Steel 184 87 0.47
Fiberglass 18 4 0.22

These are “High Value” Leaks• Typically have a volume loss 20 times greater than
small diameter mains
• Estimated to leak for an average of 10 years prior to surfacing
• AWWARF concludes average cost of a distribution main break is $5,000 to $10,000. The typical cost of a large diameter main rupture is $500,000
• Large diameter main ruptures have significantly more impact on the community and environment


Leak DetectionMethods

Internal Leak Detection Options
SmartBall®• Long point-to-point
transmission pipelines• Minimal laterals
Sahara®
• Complex interconnecting networks
• Urban centers
The noise of flowing water in a large diameter pipe masks the sound of small/medium sized leaks making them harder to find with external tools
Internal tools pass right over the leak

SmartBall Description
Power Supply
On-Board Memory
Acoustic Sensor
Microprocessor
Temperature Sensor
Rotation Sensor
Pinger
•The protective foam ball cancels apparatus noises & provides a slightly negative floatability with direct water absorption
•Aluminum core contains data acquisition system
•Data is logged on a 4 GB, security digital card

Insertion
RetrievalAirdrie
approach and departure from MH#1
0
100
200
300
400
500
600
700
800
900
1000
230 240 250 260 270 280 290 300 310 320
Run time (min)
Dis
tanc
e (m
)
Vel = 0.33 m/s
Vel = 0.33 m/s
Tracking
SmartBall Inspection Process

SmartBall Inspection Process

Sahara Description
Surface
•Technology first introduced in 1995 by WRC in London. Significant experience gained in urban environments
•Tethered cable provides high degree of operator control
•Inspection results are provided in real time
•Platform technology offers leak & gas pocket detection, video inspection, wall thickness

Sahara Equipment Overview
Electronics Stack Cable Drum Insertion Tube
Cable Winch
Tracking DeviceSensor and Parachute

Project Deliverables
Surface locations during/post survey
Summary table in report
Survey map in report, and GIS file with GPS data

• Pilot project using tethered inline leak location started in 2007
• Included two leaks on 48” lines deep underground, crossing underneath a major highway.
– These leaks could not be located with traditional leak location equipment.
• One large leak turned into a break the day before it was scheduled for repair.
– Unfortunate, but confirms that leaks precede breaks
Philadelphia, PA
Distance Surveyed 19.5 milesLeaks Located 47 leaksAverage Size TBD gallons per dayLeak Frequency 2.4 leaks / mile
50,000

More ApplicationsIn‐line Video Inspection
Odessa, TX• Inspection of a 14” PCCP line
• Line remained in service
• Tuberculation build up discovered and joints inspected
Sewer Force Main Inspection
Grand Forks, ND• Inspection of 30” and 36” PCCP
and PVC lines over 8 miles
• Two day inspection – 10.5 hrs
• Two leaks and six air pockets identified

PCCP Assessment

PCCP Assessment Methods
Visual & Sounding
Electromagnetics
Acoustic Fiber Optics

• P‐Wave and RFTC
• Detects and quantifies wire break damage
• Provides estimate of wire breaks in each pipe section
• Provides location of wire breaks
Electromagnetic Inspections

Typical Inspection Results

External Verification – Pipe 105

• Determine repair needs
• How many wire breaks is too many?
• Perform risk evaluation
• Rehabilitation
Engineering Evaluation


Validation: Pipe 32

Validation: Pipe 6

Large Diameter Long Distance Live Inspection
TANK TANK37 km

PipeDiver Launch

Retrieval

Condition Assessment of Metallic Mains
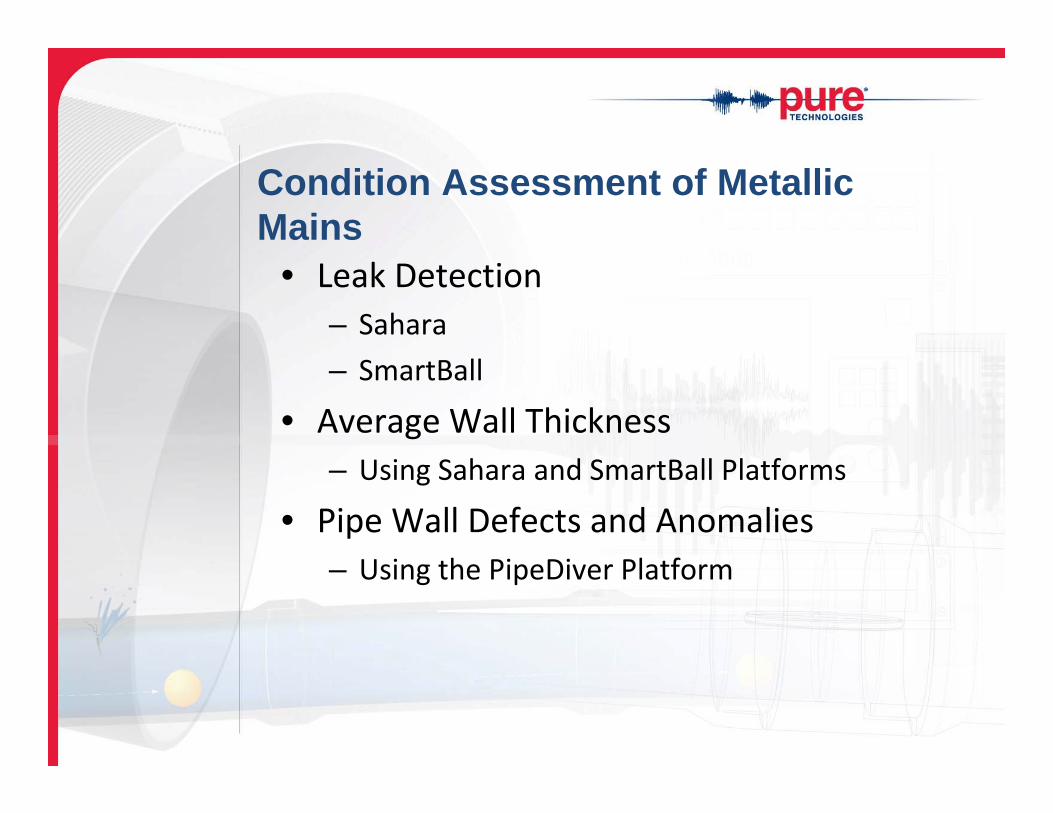
Condition Assessment of Metallic Mains
• Leak Detection– Sahara
– SmartBall
• Average Wall Thickness– Using Sahara and SmartBall Platforms
• Pipe Wall Defects and Anomalies– Using the PipeDiver Platform

• Relies on the measurement of acoustic pulses as they propagate along the pipe
• Propagation velocity of an acoustic pulse is directly proportional to the stiffness of the medium that it travels through
• Higher propagation velocity indicates higher wall stiffness
• Stiffness of the pipe wall reflects the condition of the pipe
PWA Average Wall Stiffness/Thickness

• Acoustic pulses are induced into the pipe
• A receiver records the acoustic pulses as they propagate along the pipeline
• 3‐inch interval (0.25s)
Acoustic Pulsers SmartBall™
SmartBall PWA

Relative Stiffness v.s. Distance From Insertion Location
0
1
2
0.0 3.7 7.3 11.0 14.6 18.3 22.0 25.6 29.3 32.9 36.6
Distance From Insertion Location [m]
Rel
ativ
e St
iffne
ss
Relative Stiffness vs. Distance from Insertion Location
Anomaly AnomalyJoints
Distance from Insertion Location [m]
Rel
ativ
e S
tiffn
ess
SmartBall PWA Results

Remote Field Eddy Current (RFEC)
• Emitter sends signal into pipe wall
• Signal travels through pipe wall
• Detector receives signals
• Defects appear twice: once as each of emitter and detector pass by

Identification of corrosion pits
Corrosion Pit
Dual detection as exciter & detector pass pit

Upstream direction, distance in meters
0 10 20 30 40 50 60 70 80 90 100 110 120 130 140 150
Legend:Negligible Wall Thickness Loss
Light Wall Thickness Loss
Moderate Wall Thickness Loss
Heavy Wall Thickness Loss
Nominal pipe
Pipe data N/ASmall leak pinpointedLarge leak pinpointed
Results: Leak Detection & Acoustic Wall Thickness Testing

“Solutions for Sustainable Infrastructure”
Thank you
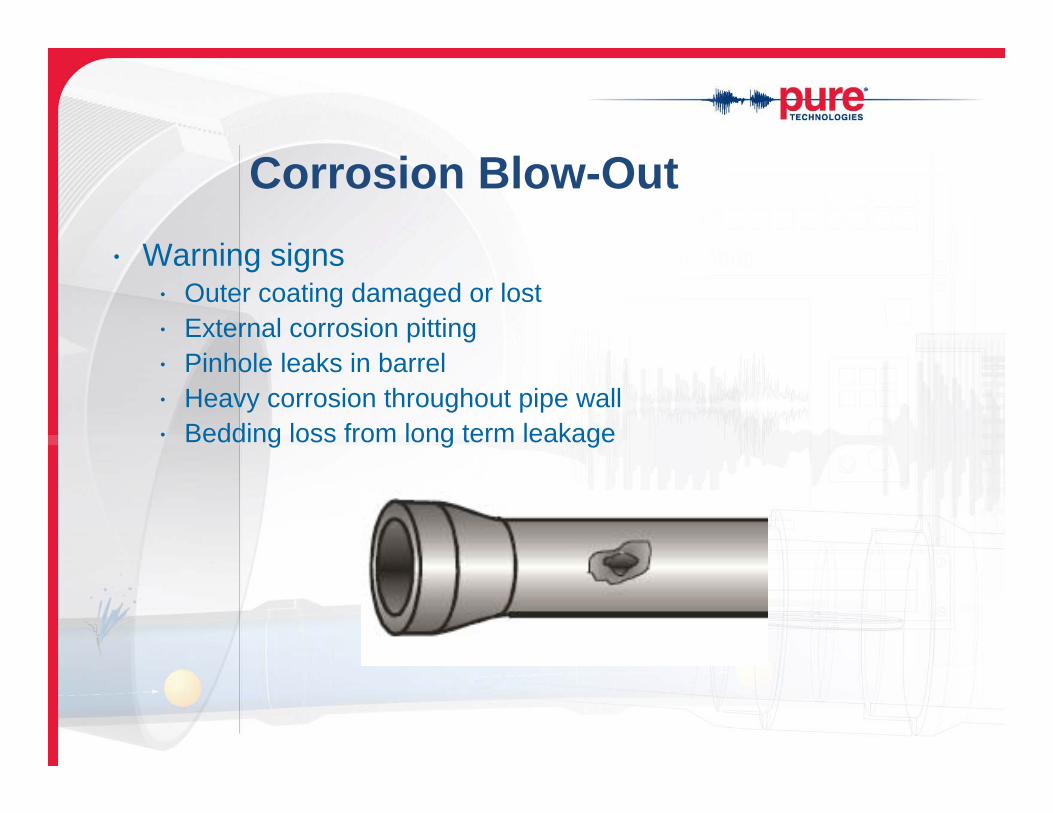
• Warning signs• Outer coating damaged or lost• External corrosion pitting• Pinhole leaks in barrel• Heavy corrosion throughout pipe wall• Bedding loss from long term leakage
Corrosion Blow-Out

• Warning signs• Use of Leadite joint sealer• Cracks at bell end• Leaking joints• Longitudinal cracks• Bedding loss from long term leakage
Joint Failure (Bell Splitting)

Cracking Failure• Warning signs
• Hairline cracks in pipe• Circumferential (mostly small diameter)• Longitudinal (mostly large diameter)• Spiral (mostly medium diameter)
• Pressure-dependent leaks• Severe, visible cracking• Bedding loss from long term leakage
SmartBall Performance• Leak location accuracy (within 3 feet)• Highly sensitive to leak noise (0.25 gpm)• Operates in all kinds of pressure pipes (DI, Steel, GRP,
PVC...)• Applicable to diameter 12” and above• Inspects up to 9 miles per day from a single deployment• Operates through 4” valve openings• Complies with usual water quality standards

Sahara Specifications
• Insertion: 2” tap (1 7/8” opening)• Diameters: 12” and up (4” to 10” in special cases)• Pressures: 5 to 200 psi• Flow Rates: 2 to 12 ft/s (1 ft/s for very short distances)• Distances: ½ mile (6,000 ft in ideal conditions)• Bends: 135° total bends (270° for very short distances)• Line Valves: Cannot survey past inline butterfly valves• Laterals: Should be closed as sensor passes by, but sensor can
generally be withdrawn if it goes down one

Information Obtained
Spectrogram
Power Cure
•Exact leak position•Approximate leak size•Direction of main•Depth of main (SmartBall)•Location of main

• 15,000‐ft 14” Cast Iron Pipe• High risk line• Two leaks were found, one small
and one medium sized. The larger one had already eroded away a void 7’ x 5’ x 3’ deep under this pipe in a main thoroughfare that carries heavy traffic.
• Bobby Walden ‐ Ops/Maint Mgr: “It was remarkably accurate, within inches”
• Rebecca West – Tech Srvcs Mgr –“savings of $2 to $4MM by not having to replace a critical line”
Spartanburg Water System, SC

GIS Pipe Mapping• Web based interface
• Visual consequence of failure and risk management
• Accurate asset monitoring for repair and replace programs
• Data inputs: manual inspections, electromagnetic inspections, leak identification, fiber optic monitoring

• Internal inspection
• Distance measurements and pipeline features recorded
• Immediate identification of pipes in a state of incipient failure
Visual & Sounding

RFTC DataRFTC Data
PHASE
AMPLITUDE

Data AnalysisData AnalysisDistress Man Hole

Fingerprint
DISTANCE NO DISTANCE
+ =

Interpreting the Signal
NO BREAKS
MIDDLE BREAKS
END BREAKSJOINT DISCONTINUITY
CYLINDER VARIATIONS

Quantification - Measurement
DISTRESS LOCATION
BASELINE
SIGNAL LENGTH

• Distressed pipe signal
• No breaks signal used to establish a baseline
• Superimpose the 2 signals when making the measurement

Factors Affecting RFEC/TC SignalFactors Affecting RFEC/TC Signal
Variation in Wire SpacingWire Anchoring
Thickness Variations Shorting Straps Installation
Diameter Variations Wire Splice
Material PropertiesJoint Configuration

Recorded Wire Break
Acoustic Monitoring
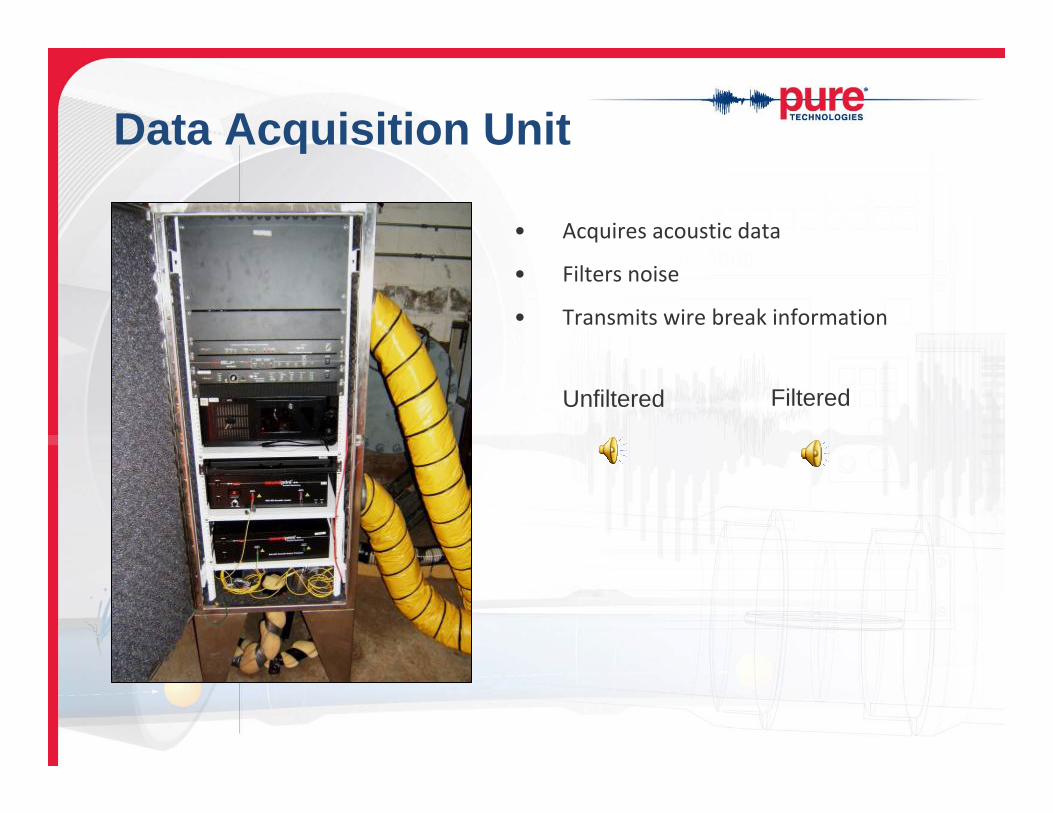
• Acquires acoustic data
• Filters noise
• Transmits wire break information
Unfiltered Filtered
Data Acquisition Unit

VALUE ADDED SERVICES
• Acoustic fiber optic (AFO) monitoring
– Wire break notifications

SAMPLE WIRE BREAK NOTIFICATION


Pipeline Selection: SmartBall
Longer pipeline length = increasing ease of use
More complex network
= increasing
risk
SmartBallMaximum Value
• Most efficient for use on long mains• Frequent laterals with unknown locations bring some risk• Long cross‐country mains: SmartBall’s “Sweet Spot”

Pipeline Selection: Sahara • Long cross‐country mains may lack existing taps• Small diameter mains often have too many bends• Urban transmission mains: Sahara’s “Sweet Spot”
Sahara MaximumValue
Longer pipeline length = increasing ease of use
More complex network
= de
creasing
ease of use
SmartBallMaximum Value

Sahara MaximumValue
Pipeline Selection: External Tools
Larger pipeline diameter= decreasing sensitivity
More complex network
= increasing
sen
sitiv
ity
SmartBallMaximum Value
External ToolMaximumValue
• When more sensitive inline tools are not feasible• Hydrant access on small mains offers improved sensitivity• Can be used to “fill in gaps” between inline inspections