Embed Size (px)
Citation preview

Concrete Pavements and Smoothness
Louisiana Transportation Engineering Conference
2007
Pavements and life will always have bumps
Learning to manage the bumps brings higher quality
Chris Abadie

“smooth” Internet images

Internet Images
ASTM Definition of Roughness
“The deviations of a pavement surface from a true planar surface with characteristic dimensions that affect vehicle dynamics……”

Research
The LTPP GPS-3 experiment showed that adjustments in design features, materials properties, and construction procedures provide smoother-built pavements with longer service life
--“Achieving a High Level of Smoothness in Concrete Pavements Without Sacrificing Long-Term Performance”, FHWA-HRT-05-069.

A
r
i
z
o
n
a
P
C
C
71
8
3
6
I
l
l
i
n
o
i
s
C
R
C
51
1
2
2
M
i
n
n
e
s
o
t
a
P
C
C
61
5
3
0
I
l
l
i
n
o
i
s
A
C
/
P
4 91
8
A
r
i
z
o
n
a
P
C
C
71
8
3
6
I
l
l
i
n
o
i
s
C
R
C
51
1
2
2
M
i
n
n
e
s
o
t
a
P
C
C
61
5
3
0
I
l
l
i
n
o
i
s
A
C
/
P
4 91
8
Results of Smoothness Modeling Sensitivity Analysis(NCHRP 1-31, Smoothness Specifications for Pavements )
Average Percent Increase in Performance Life
Reduction in roughness 10% 25% 50%
Alabama PCC 11 28 55
Arizona PCC 7 18 36
Illinois CRC 5 11 22
Minnesota PCC 6 15 30
Illinois AC/PCC 4 9 18
Alabama AC 8 20 39
Arizona AC 3 9 18
Minnesota AC 5 11 23

ArticlesPCC Pavement Smoothness:
“Characteristics and Best Practices
for Construction”, FHWA-IF-02-025,
“Constructing Smooth Concrete Pavements”, ACPA Technical Bulletin TB-006.0-C, guidelines

ACPA Covers Concrete Pavement Smoothness
Does pavement smoothness affect anything other than driver comfort?
The answer:
A resounding YES!
StaffJune 17, 2005Construction Bulletin
ACPA's plan is to promote a
uniform ride quality measurement:
Based on the International Roughness Index Uses equipment and procedures that are
repeatable and reproducible Uses equipment readily available to
contractors for quality control Is not improperly influenced by surface type
or texture Represents the actual experience of the
traveling public June 17, 2005Construction Bulletin

Research: FHWA-HRT-05-054
Analysis of differences in the longitudinal profile and roughness indices that are attributable to the different profiling equipment that have been used in the LTPP program
Conclusion: Good agreement of IRI values among the different inertial profilers that have been used in the LTPP program.
NHI Training
131100 Pavement Smoothness: “Use of Inertial Profiler Measurements for Construction Quality Control”
How to construct smooth pavements
Constructing smooth pavements requires attention to detail. Uniformity in concrete production and delivery, support conditions (both under the pavement and in the trackline), placement and consolidation, and surface texturing are the primary construction processes influencing smoothness. However, perhaps the most important details are high-quality stringlines (one line on each side, adequately tensioned with closely spaced pins) and an accurately set up paver (including sensor system).

Pavement Smoothness

National Customer Survey
Pavement Condition (smoothness) 36%
Safety 22%
Traffic Flow 16%
Visual Appeal 11%
Bridge Condition 6%
Maintenance Response Time 6%
Travel Amenities 3%

Louisiana Pavement Facts
Louisiana has 1000 miles of concrete pavement
118 miles have been constructed in 70 contracts over the last 5 years at a cost of $473 million
Most projects are 2 miles long or less

NHI Model (1993 AASHTO Pave.)
PSR= Constant x e (-0.0041*IRI)
0
1
2
3
4
5
0 50 100 150 200 250 300
IRI
PSR
Purposes for Smoothness Measurements
Maintain construction quality
Locating abnormal changes in the highway
– subsurface problems, drainage,construction deficiencies
Allocation of road maintenance resources
Pavement serviceability performance and design
Smoothness Measurements
History

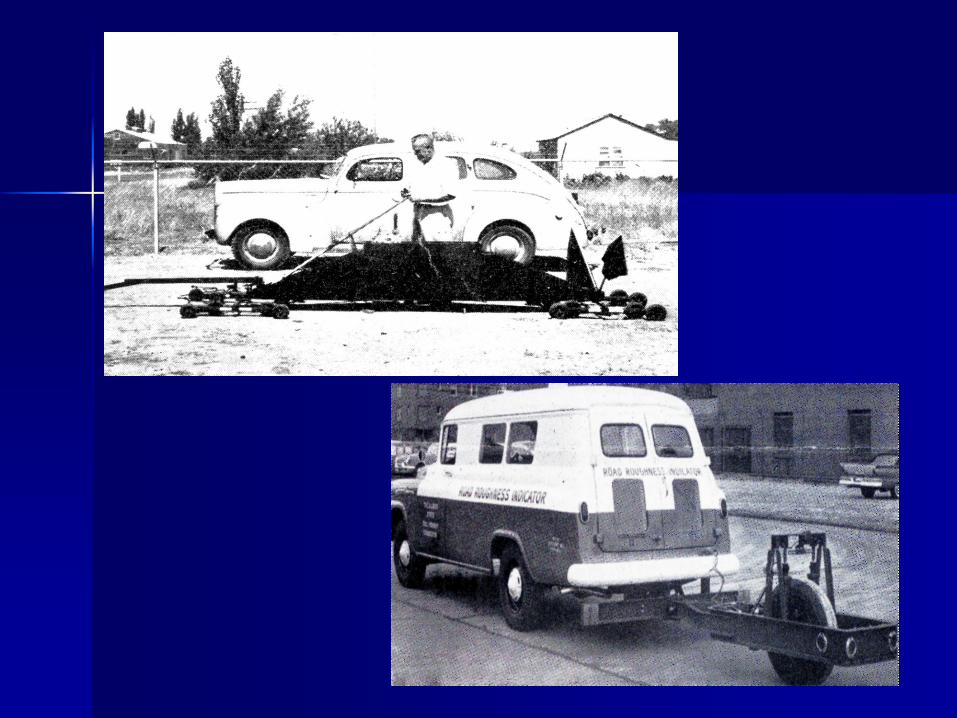
Methods
Rolling Straightedge
Ride Number (AASHO Road Test)
BPR Roughometers
Mays Ride Meter
California Type Profiler (PI), La Specs since early eighties
Inertial type Profilers (RN,PI, IRI)
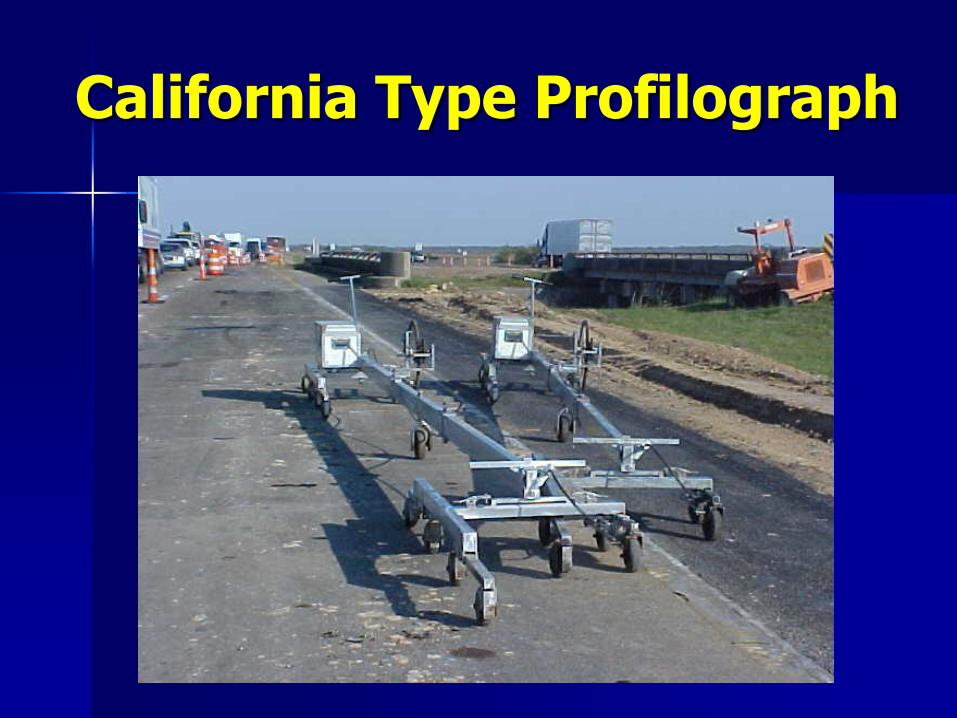
California Type Profilograph

Setting up Calibration Site
w/ Walking Profiler

ICC laser profiler
measures pavement
profile (IRI), rutting,
and PCC joint
faulting at normal
highway speeds.

US 190; CRCP, LA 1 to Hwy 415, Iberville Parish
Pavement Performance
50556065707580859095
100
2000 2003 2005
IRI

I-10 Baton Rouge
Pavement Performance
50
60
70
80
90
100
2000 2002 2005
IRI

US 171 Florien to Hornbeck (2 adjacent projects)
2005 IRI = 92 inches per mile

I-12 HammondPavement Performance
50
60
70
80
90
100
2000 2003 2005
IRI

Deficiencies with Current PI System (Manual)
Labor Intensive, Slow, Safety?
Blanking Band Filtering out Roughness
PI does not represent the “ride” of the Roadway
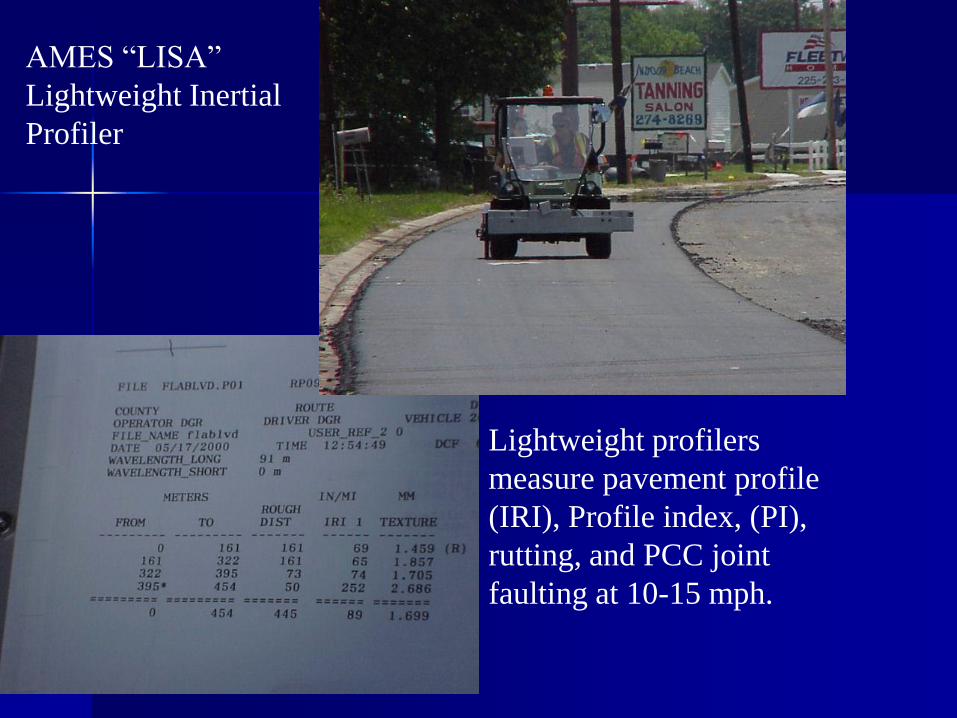
AMES “LISA”
Lightweight Inertial
Profiler
Lightweight profilers
measure pavement profile
(IRI), Profile index, (PI),
rutting, and PCC joint
faulting at 10-15 mph.

Surface Tolerance Requirements
Inertial profilers approved by Materials Engineer
Annual certification and site calibration
Measurement of both wheel paths
Average every 0.05 mile intervals

Requirements (Cont)
diamond grind to meet specs
Contractor Profile may be used for acceptance

Percent of Contract Unit Price/in/mile/sublot1
%of Unit
Price
103% 100% 90% 80% 50% or
Remove
Cat. A
Interstate and
multi-lifts<55 <65 65-75 NA >75
Cat. B
2-Lift Overlay <55 <75 75-89 NA >89
Cat. C
Single-Lift
Overlay
<55 <85 85-95 95-110 >110
Incentive
Pay,
< 45; Final Completion, Average of
All Travel Lanes (with no lot less
than 100% pay); +5% of the value
of the wearing course (plan
quantities)
Development of IRI Specifications forPCCP
LTRC Pavement Group

Methodology
Collection of Profile Data on Selected PCCP jobs using LTRC ICC’s High Speed Profiler
Developing PI and IRI data from the selected Sites
Using Linear Regression to Establish IRI values based on the Existing PI specifications ( similar to what was done for flexible pavements)
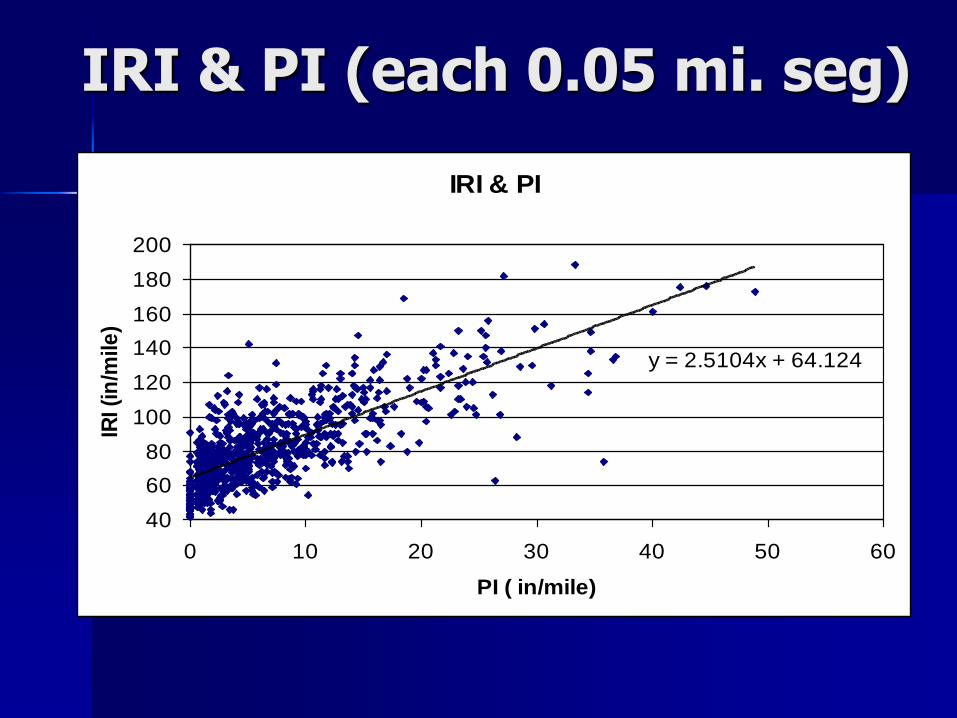
IRI & PI (each 0.05 mi. seg)
IRI & PI
y = 2.5104x + 64.124
40
60
80
100
120
140
160
180
200
0 10 20 30 40 50 60
PI ( in/mile)
IRI (i
n/m
ile
)

Payment ( Percent of Contract Unit Price/lot)
PCC
Pavements100
98 95 80 50% or
remove and
replace
Correct
or
Remove
Category I
> 45 mph
P
I 6.0 6.1-7.0 7.1-8.0 --------- -----------> 8.0
I
R
I75 76-90 90-100 --------- -----------
>100
Cat. II,
Urban Areas
< 45 mph
P
I
1212.1-13.0 13.1-14.0
--------- -----------
>14.0I
R
I 9091-100 100-110 --------- -----------
>110
Cat. IIInon-continuous
operations
< 45mph
P
I20
20.1-22.0 22.1-24.0 24.1-26.0 ----------- >26
I
R
I100
101-110 110-120 120-129
-----------
>129
Incentive recommended = 1% for 65 IRI

NHI Model (1993 AASHTO Pave.)
PSR= Constant x e (-0.0041*IRI)
0
1
2
3
4
5
0 50 100 150 200 250 300
IRI
PSR

Existing Smoothness Specifications
Profile Index
0.2” Blanking Band
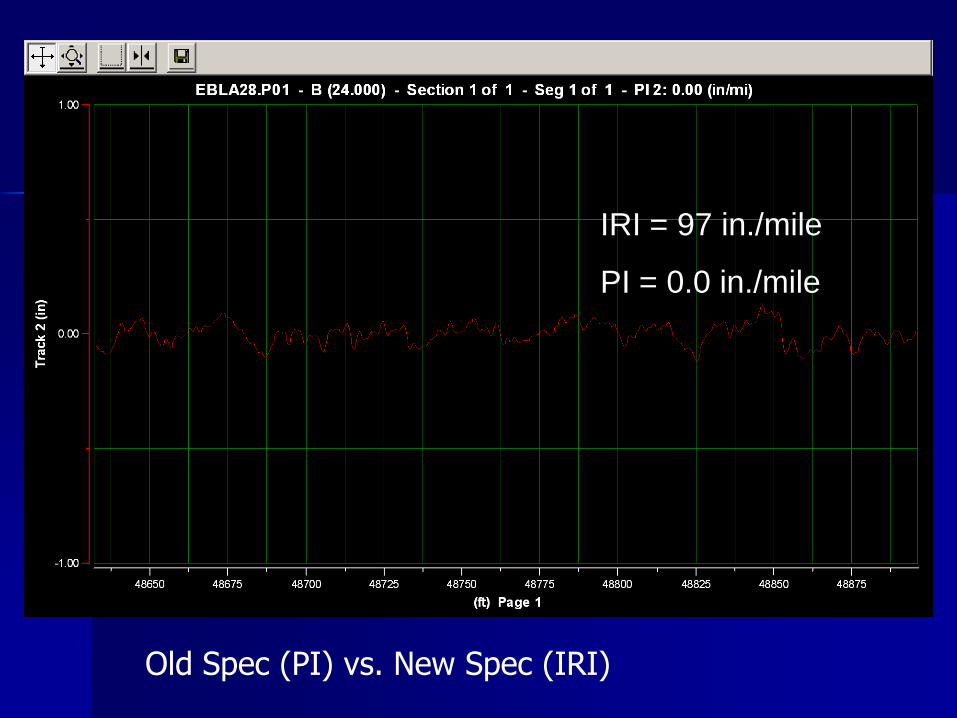
IRI = 97 in./mile
PI = 0.0 in./mile
Old Spec (PI) vs. New Spec (IRI)
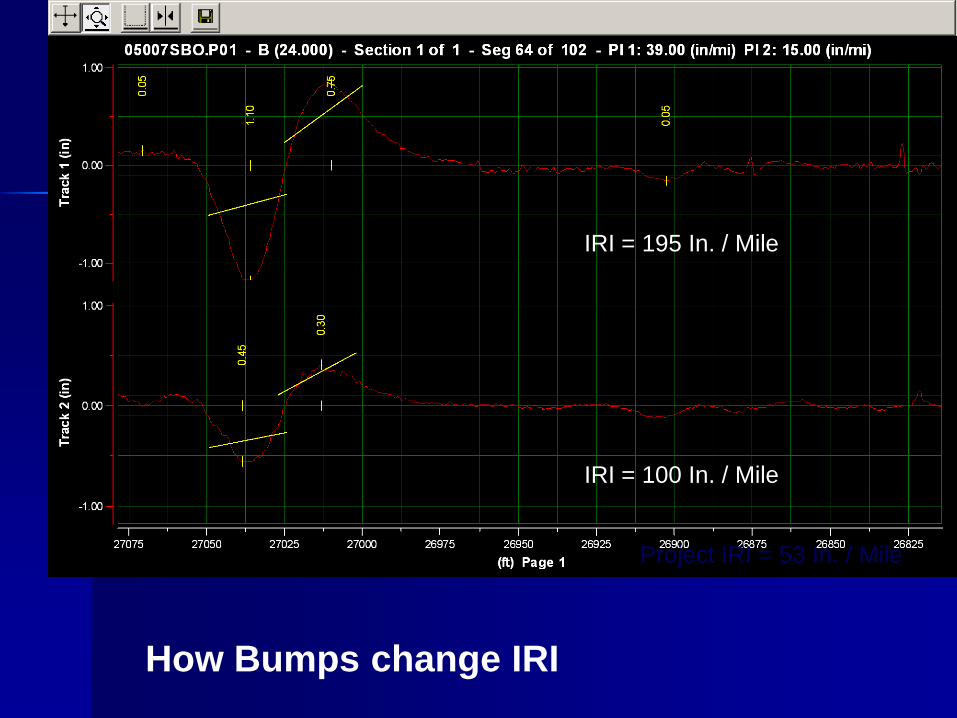
IRI = 195 In. / Mile
IRI = 100 In. / Mile
Project IRI = 53 In. / Mile
How Bumps change IRI
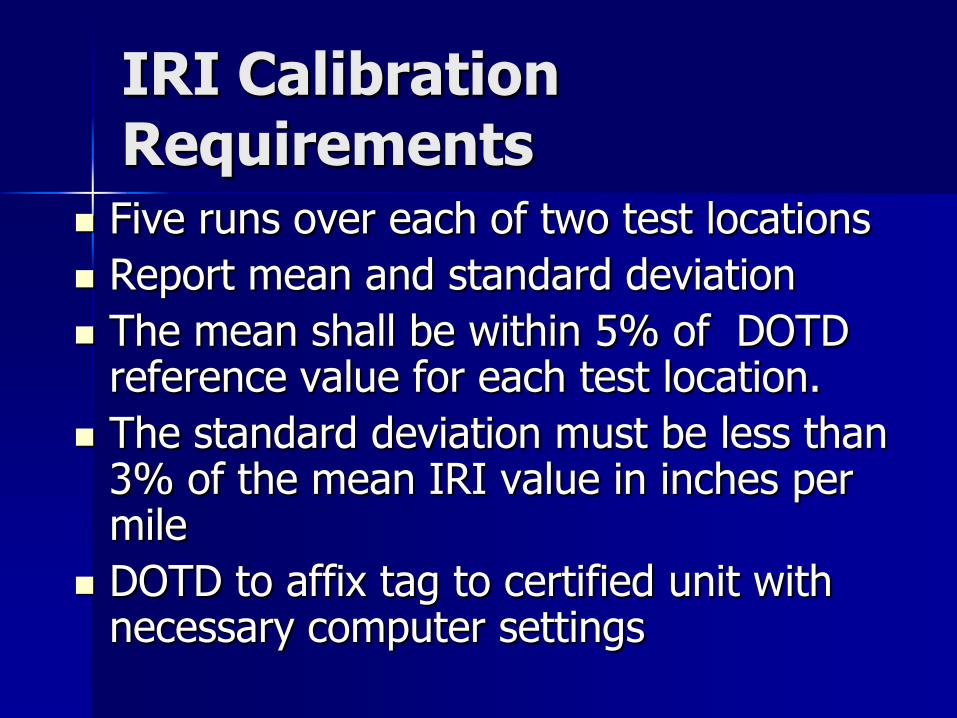
IRI Calibration Requirements
Five runs over each of two test locations
Report mean and standard deviation
The mean shall be within 5% of DOTD reference value for each test location.
The standard deviation must be less than 3% of the mean IRI value in inches per mile
DOTD to affix tag to certified unit with necessary computer settings

The Bottom Line is a Straight Line
Smooth = long life and low maintenance
All customers will say they prefer to ride on smooth pavement.
Every phase of construction is a new opportunity to achieve a smoother road