Embed Size (px)
Citation preview

CEMENT AND CONCRETE REFERENCE LABORATORY
PROFICIENCY SAMPLE PROGRAM
Final Report
Concrete Proficiency Samples
Number 175 and Number 176
CEMENT AND CONCRETE REFERENCE LABORATORY
June 2015
CCRL

www.ccrl.us
4441 Buckeystown Pike, Suite C ˜ Frederick, Maryland 21704
phone: 240-436-4800 ˜ fax: 610-834-7066 ˜ email: [email protected]
Sponsored by Committees C-1 and C-9 of ASTM International
June 25, 2015 TO: Participants in the CCRL Portland Cement Concrete Proficiency Sample Program SUBJECT: Concrete Proficiency Samples No. 175 and No. 176 Enclosed is your copy of the final report on the test results for the CCRL Concrete Proficiency Samples which were distributed in April 2015. This report consists of a statistical Summary of Results, a set of general Scatter Diagrams and associated detailed information. The Table of Results with test results and ratings for your laboratory can be viewed and printed at our website located at: http://ccrl.us/. The CCRL Proficiency Sample Programs are intended for internal use by the laboratory as a tool to identify potential problems in laboratory procedures or test equipment and to initiate remedial actions. These programs are designed to complement the CCRL Laboratory Inspection Program as part of a total quality system. Care should be taken when using this program for any other purpose. Additional samples of these two materials and other CCRL samples are available for purchase. These samples may be useful for equipment verification, technician training, and research. Contact CCRL for availability and price. It is presently anticipated that the next Concrete Proficiency Samples will be distributed in October 2015. Sincerely, Robin K. Haupt Supervisor, Proficiency Sample Programs Cement and Concrete Reference Laboratory

page 1 of 2
TO: Participants in the CCRL Concrete Proficiency Sample Program FROM: Robin K. Haupt, Supervisor, PSP SUBJECT: Explanation of Final Report on Results of Tests on Portland Cement Concrete
Proficiency Samples No. 175 and No. 176 This letter, and the material included with it, constitutes the final report and summary of results for the current pair of Concrete Proficiency Samples that were distributed in April 2015. This material includes a statistical Summary of Results, and a set of general Scatter Diagrams. If your laboratory was a participate in this program a Table of Laboratory Results (lab data and ratings) for your laboratory can be viewed and printed on the CCRL website An explanation of the program is contained in the paper: "Statistical Evaluation of Interlaboratory Cement Tests" by J. R. Crandall and R. L. Blaine , and "Statistical Aspects of the Cement Testing Program" by W.J. Youden , which can be found in Volume 59, Proceedings of the 62nd Annual Meeting of the Society, June 25, 1959, American Society for Testing and Materials.
Table of Results Each laboratory receives an individualized Table of Results that contains laboratory test results and ratings. Each line of the test information shows the test title and the reporting unit in the first two columns. After that it lists in order, the laboratory's test results for the odd and even numbered samples, overall averages for the odd and even numbered samples, and the laboratory's ratings for the odd and even samples. Please note that individual laboratory ratings were not given for temperature of concrete. The ratings for each individual laboratory were determined in the manner described by Crandall and Blaine using a rating scale of 1 to 5 instead of 0 to 4. The ratings have no valid standing beyond showing the difference between the individual laboratory result and the average for a particular test. The following table details the relationship between the ratings and the averages. Ratings Range (Number of Number (Per 100) Standard Deviations) of Laboratories achieving the rating 1 5 Less than 1 69
4 1 to 1.5 18
3 1.5 to 2 9
2 2 to 2.5 3
1 Greater than 2.5 1 The sign of the rating indicates whether the result reported was greater or less than the average obtained.
1Youden, W.J., “Statistical Aspects of the Cement Testing Program”,Volume 59, Proceedings of the 62nd Annual Meeting of the Society, June 25, 1959, American Society for Testing and Materials.
View DocumentView Document

page 2 of 2
In cases where some laboratories' results are eliminated, averages, standard deviations, coefficients of variation, and the ratings of the remaining laboratories' results, are recalculated using the data remaining after the elimination. Since the laboratory ratings given are the results from this one series of tests, you need not attach too much significance to a single low rating, or pair of ratings, from this one series. A continuing tendency to get low ratings on several pairs of samples should lead a laboratory to consider the types of error, systematic and random, that contribute to ratings that are low. Systematic error, which is indicated by low ratings with the same signs on each pair of samples, means a consistent error is occurring in equipment and/or test procedures. One indication of random error is low ratings on both samples with different signs. Since systematic error occurs with more regularity, its cause is generally easier to find than the cause of random error. Summary of Results The Summary of Results provides the statistical summary for each test. Each line lists the test, the number of participants represented, the averages, standard deviations and coefficients of variations. When necessary the data from the test is represented in two lines, one line with all results reported, and then a second line with invalid and outlying results omitted. Sometimes two or more recalculations are required to eliminate all outliers from the test. In these cases, all of the laboratories omitted in previous recalculations are also omitted in subsequent ones. Results omitted are values that are more than three standard deviations from the mean of one or both samples. Often, elimination of these outlying results has little effect on the average, but may have a more pronounced effect on the standard deviation and coefficient of variation. Scatter Diagrams General scatter diagrams are supplied with this report. Crandall and Blaine describe the manner of preparing scatter diagrams, and their interpretation, in the paper published in the 1959 ASTM Proceedings. Using the results received from each laboratory, a scatter diagram is generated for each test method by plotting the value for the odd numbered samples on the X, or horizontal axis, against the value for the even numbered samples on the Y, or vertical axis. Vertical and horizontal dashed lines, which divide the diagrams into four sections or quadrants, place the average values for the odd and even numbered samples, respectively. The first line of print under the diagram includes the test number, as given on the data sheet, the test title, and the number of data points on the diagrams. The number of plotted points may not agree with the total number of data pairs included in the analysis because a few points may be off the diagram, and some points may represent several data pairs, which are identical. Laboratories whose points are off the diagram will have a rating of ±1 for that particular test. As described in Crandall and Blaine, a tight circular pattern of points around the intersection of the median lines is the ideal situation. Stretching out of the pattern into the first (upper right) and third (lower left) quadrants, suggests some kind of bias, or tendency for laboratories to get high or low results on both samples. Examination of the scatter diagrams indicates strong evidence of bias on many tests.
CCRL PROFICIENCY SAMPLE PROGRAM Concrete Proficiency Samples No. 175 and No. 176
Final Report – June 25, 2015
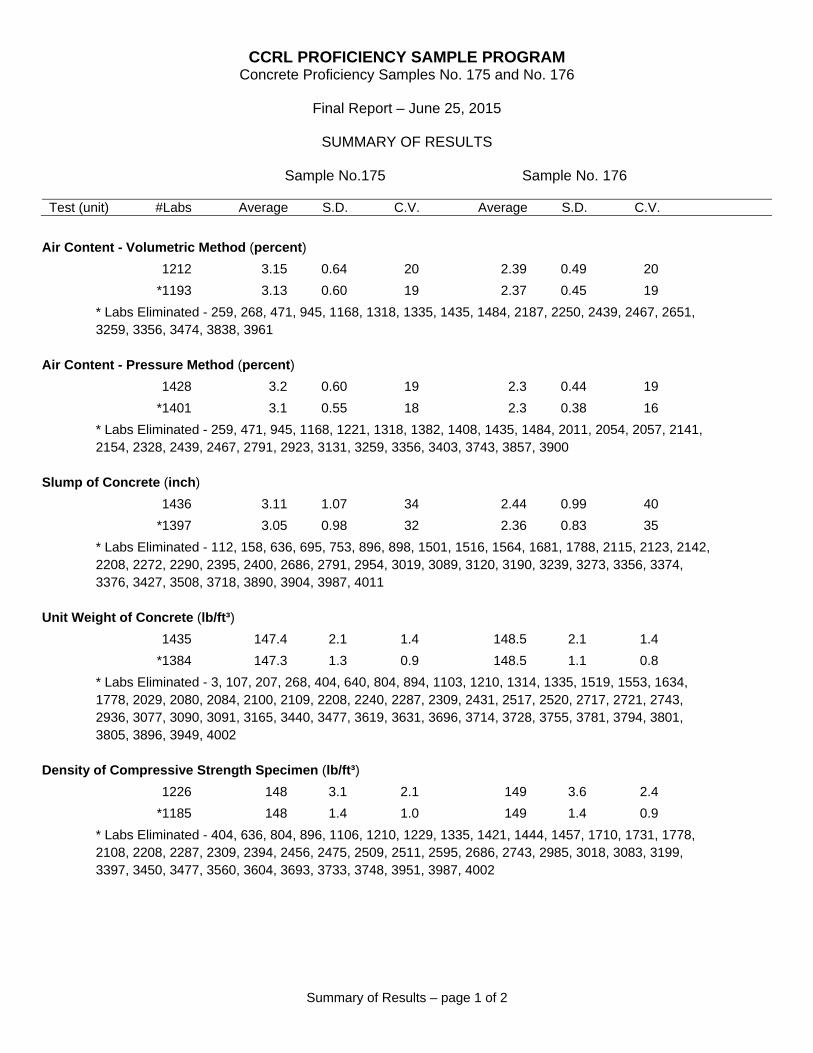
SUMMARY OF RESULTS
Sample No.175 Sample No. 176
Test (unit) #Labs Average S.D. C.V. Average S.D. C.V.
Summary of Results – page 1 of 2
Air Content - Volumetric Method (percent)
1212 3.15 0.64 20 2.39 0.49 20
*1193 3.13 0.60 19 2.37 0.45 19
* Labs Eliminated - 259, 268, 471, 945, 1168, 1318, 1335, 1435, 1484, 2187, 2250, 2439, 2467, 2651, 3259, 3356, 3474, 3838, 3961
Air Content - Pressure Method (percent)
1428 3.2 0.60 19 2.3 0.44 19
*1401 3.1 0.55 18 2.3 0.38 16
* Labs Eliminated - 259, 471, 945, 1168, 1221, 1318, 1382, 1408, 1435, 1484, 2011, 2054, 2057, 2141, 2154, 2328, 2439, 2467, 2791, 2923, 3131, 3259, 3356, 3403, 3743, 3857, 3900
Slump of Concrete (inch)
1436 3.11 1.07 34 2.44 0.99 40
*1397 3.05 0.98 32 2.36 0.83 35
* Labs Eliminated - 112, 158, 636, 695, 753, 896, 898, 1501, 1516, 1564, 1681, 1788, 2115, 2123, 2142, 2208, 2272, 2290, 2395, 2400, 2686, 2791, 2954, 3019, 3089, 3120, 3190, 3239, 3273, 3356, 3374, 3376, 3427, 3508, 3718, 3890, 3904, 3987, 4011
Unit Weight of Concrete (lb/ft³)
1435 147.4 2.1 1.4 148.5 2.1 1.4
*1384 147.3 1.3 0.9 148.5 1.1 0.8
* Labs Eliminated - 3, 107, 207, 268, 404, 640, 804, 894, 1103, 1210, 1314, 1335, 1519, 1553, 1634, 1778, 2029, 2080, 2084, 2100, 2109, 2208, 2240, 2287, 2309, 2431, 2517, 2520, 2717, 2721, 2743, 2936, 3077, 3090, 3091, 3165, 3440, 3477, 3619, 3631, 3696, 3714, 3728, 3755, 3781, 3794, 3801, 3805, 3896, 3949, 4002
Density of Compressive Strength Specimen (lb/ft³)
1226 148 3.1 2.1 149 3.6 2.4
*1185 148 1.4 1.0 149 1.4 0.9
* Labs Eliminated - 404, 636, 804, 896, 1106, 1210, 1229, 1335, 1421, 1444, 1457, 1710, 1731, 1778, 2108, 2208, 2287, 2309, 2394, 2456, 2475, 2509, 2511, 2595, 2686, 2743, 2985, 3018, 3083, 3199, 3397, 3450, 3477, 3560, 3604, 3693, 3733, 3748, 3951, 3987, 4002

CCRL PROFICIENCY SAMPLE PROGRAM Concrete Proficiency Samples No. 175 and No. 176
Final Report – June 25, 2015
SUMMARY OF RESULTS
Sample No.175 Sample No. 176
Test (unit) #Labs Average S.D. C.V. Average S.D. C.V.
Summary of Results – page 2 of 2
Compressive Strength 4 x 8 - 7 day (psi)
1082 5034 364 7.2 5232 417 8.0
*1060 5042 327 6.5 5253 337 6.4
* Labs Eliminated - 51, 447, 471, 801, 804, 1033, 1372, 1519, 1697, 1710, 1854, 2268, 2511, 2791, 2960, 3096, 3131, 3417, 3450, 3501, 3513, 3781
Compressive Strength 6 x 12 - 7 day (psi)
352 4591 363 7.9 4838 328 6.8
*348 4601 351 7.6 4850 307 6.3
* Labs Eliminated - 640, 1028, 2717, 3657
Temperature of Concrete (°F)
1435 75 6 8.4 74 6 8.5
No Labs Eliminated for This Test

0.5
0.75
1
1.25
1.5
1.75
2
2.25
2.5
2.75
3
3.25
3.5
3.75
4
1.25 1.5 1.75 2 2.25 2.5 2.75 3 3.25 3.5 3.75 4 4.25 4.5 4.75
Sam
ple
No
. 176
Air
Co
nte
nt
-V
olu
met
ric
Met
ho
d (
per
cen
t)
Sample No. 175Air Content - Volumetric Method (percent)
CCRL Proficiency Sample ProgramAir Content - Volumetric Method
CONCRETE Samples No. 175 and No. 176
0.50
0.75
1.00
1.25
1.50
1.75
2.00
2.25
2.50
2.75
3.00
3.25
3.50
3.75
4.00
1.25 1.50 1.75 2.00 2.25 2.50 2.75 3.00 3.25 3.50 3.75 4.00 4.25 4.50 4.75
Test No. 1 Air Content - Volumetric Method 1190 Points
Sample No. 175 Ave 3.13 S.D. 0.60 C.V. 19Sample No. 176 Ave 2.37 S.D. 0.45 C.V. 19
Labs Eliminated: 259, 268, 471, 945, 1168, 1318, 1335, 1435, 1484, 2187, 2250, 2439, 2467, 2651, 3259, 3356, 3474, 3838, 3961
Labs off Diagram: 3636, 3403, 3835

0.5
1
1.5
2
2.5
3
3.5
4
4.5
1 1.5 2 2.5 3 3.5 4 4.5 5
Sam
ple
No
. 176
Air
Co
nte
nt
-P
ress
ure
Met
ho
d (
per
cen
t)
Sample No. 175Air Content - Pressure Method (percent)
CCRL Proficiency Sample ProgramAir Content - Pressure Method
CONCRETE Samples No. 175 and No. 176
0.5
1.0
1.5
2.0
2.5
3.0
3.5
4.0
4.5
1.0 1.5 2.0 2.5 3.0 3.5 4.0 4.5 5.0
Test No. 6 Air Content - Pressure Method 1401 Points
Sample No. 175 Ave 3.1 S.D. 0.55 C.V. 18Sample No. 176 Ave 2.3 S.D. 0.38 C.V. 16
Labs Eliminated: 259, 471, 945, 1168, 1221, 1318, 1382, 1408, 1435, 1484, 2011, 2054, 2057, 2141, 2154, 2328, 2439, 2467, 2791, 2923, 3131, 3259, 3356, 3403, 3743, 3857, 3900

-1
-0.5
0
0.5
1
1.5
2
2.5
3
3.5
4
4.5
5
0 0.5 1 1.5 2 2.5 3 3.5 4 4.5 5 5.5 6
Sam
ple
No
. 176
Slu
mp
of
Co
ncr
ete
(in
ch)
Sample No. 175Slump of Concrete (inch)
CCRL Proficiency Sample ProgramSlump of Concrete
CONCRETE Samples No. 175 and No. 176
-1.00
-0.50
0.00
0.50
1.00
1.50
2.00
2.50
3.00
3.50
4.00
4.50
5.00
0.00 0.50 1.00 1.50 2.00 2.50 3.00 3.50 4.00 4.50 5.00 5.50 6.00
Test No. 2 Slump of Concrete 1397 Points
Sample No. 175 Ave 3.05 S.D. 0.98 C.V. 32Sample No. 176 Ave 2.36 S.D. 0.83 C.V. 35
Labs Eliminated: 112, 158, 636, 695, 753, 896, 898, 1501, 1516, 1564, 1681, 1788, 2115, 2123, 2142, 2208, 2272, 2290, 2395, 2400, 2686, 2791, 2954, 3019, 3089, 3120, 3190, 3239, 3273, 3356, 3374, 3376, 3427, 3508, 3718, 3890, 3904, 3987, 4011

144
145
146
147
148
149
150
151
152
143 144 145 146 147 148 149 150 151
Sam
ple
No
. 176
Un
it W
eig
ht
of
Co
ncr
ete
(lb
/ft³
)
Sample No. 175Unit Weight of Concrete (lb/ft³)
CCRL Proficiency Sample ProgramUnit Weight of Concrete
CONCRETE Samples No. 175 and No. 176
144.0
145.0
146.0
147.0
148.0
149.0
150.0
151.0
152.0
143.0 144.0 145.0 146.0 147.0 148.0 149.0 150.0 151.0
Test No. 3 Unit Weight of Concrete 1360 Points
Sample No. 175 Ave 147.3 S.D. 1.3 C.V. 0.9Sample No. 176 Ave 148.5 S.D. 1.1 C.V. 0.8
Labs Eliminated: See SUMMARY OF RESULTS page for list of labs.
Labs off Diagram: 268, 404, 640, 804, 1335, 1778, 2080, 2100, 2240, 2309, 2517, 2721, 2743, 3077, 3090, 3091, 3440, 3619, 3631, 3714, 3728, 3794, 3896, 3949

145
146
147
148
149
150
151
152
153
144 145 146 147 148 149 150 151 152
Sam
ple
No
. 176
Den
sity
of
Co
mp
ress
ive
Str
eng
th S
pec
imen
(lb
/ft³
)
Sample No. 175Density of Compressive Strength Specimen (lb/ft³)
CCRL Proficiency Sample ProgramDensity of Compressive Strength SpecimenCONCRETE Samples No. 175 and No. 176
145
146
147
148
149
150
151
152
153
144 145 146 147 148 149 150 151 152
Test No. 7 Density of Compressive Strength Specimen 1180 Points
Sample No. 175 Ave 148 S.D. 1.4 C.V. 1.0Sample No. 176 Ave 149 S.D. 1.4 C.V. 0.9
Labs Eliminated: See SUMMARY OF RESULTS page for list of labs.
Labs off Diagram: 207, 646, 2267, 3671, 3631

4200
4400
4600
4800
5000
5200
5400
5600
5800
6000
6200
4000 4200 4400 4600 4800 5000 5200 5400 5600 5800 6000
Sam
ple
No
. 176
Co
mp
ress
ive
Str
eng
th 4
x 8
-7
day
(p
si)
Sample No. 175Compressive Strength 4 x 8 - 7 day (psi)
CCRL Proficiency Sample ProgramCompressive Strength 4 x 8 - 7 day
CONCRETE Samples No. 175 and No. 176
4200
4400
4600
4800
5000
5200
5400
5600
5800
6000
6200
4000 4200 4400 4600 4800 5000 5200 5400 5600 5800 6000
Test No. 4 Compressive Strength 4 x 8 - 7 day 1051 Points
Sample No. 175 Ave 5042 S.D. 327 C.V. 6.5Sample No. 176 Ave 5253 S.D. 337 C.V. 6.4
Labs Eliminated: 51, 447, 471, 801, 804, 1033, 1372, 1519, 1697, 1710, 1854, 2268, 2511, 2791, 2960, 3096, 3131, 3417, 3450, 3501, 3513, 3781
Labs off Diagram: 459, 1396, 1484, 2309, 2509, 3674, 3261, 3733, 3890

3700
3900
4100
4300
4500
4700
4900
5100
5300
5500
5700
5900
3500 3700 3900 4100 4300 4500 4700 4900 5100 5300 5500 5700
Sam
ple
No
. 176
Co
mp
ress
ive
Str
eng
th 6
x 1
2 -
7 d
ay (
psi
)
Sample No. 175Compressive Strength 6 x 12 - 7 day (psi)
CCRL Proficiency Sample ProgramCompressive Strength 6 x 12 - 7 day
CONCRETE Samples No. 175 and No. 176
3700
3900
4100
4300
4500
4700
4900
5100
5300
5500
5700
5900
3500 3700 3900 4100 4300 4500 4700 4900 5100 5300 5500 5700
Test No. 4 Compressive Strength 6 x 12 - 7 day 348 Points
Sample No. 175 Ave 4601 S.D. 351 C.V. 7.6Sample No. 176 Ave 4850 S.D. 307 C.V. 6.3
Labs Eliminated: 640, 1028, 2717, 3657

45
50
55
60
65
70
75
80
85
90
95
100
45 50 55 60 65 70 75 80 85 90 95 100
Sam
ple
No
. 176
Tem
per
atu
re o
f C
on
cret
e (°
F)
Sample No. 175Temperature of Concrete (°F)
CCRL Proficiency Sample ProgramTemperature of Concrete
CONCRETE Samples No. 175 and No. 176
45
50
55
60
65
70
75
80
85
90
95
100
45 50 55 60 65 70 75 80 85 90 95 100
Test No. 5 Temperature of Concrete 1434 Points
Sample No. 175 Ave 75 S.D. 6 C.V. 8.4Sample No. 176 Ave 74 S.D. 6 C.V. 8.5
Labs off Diagram: 1908