Embed Size (px)
Citation preview
Conceptual Geotechnical Engineering ReportGresham Vista Business Park
Gresham, Oregon
September 3, 2013

Conceptual Geotechnical Engineering ReportGresham Vista Business Park
Gresham, Oregon
September 3, 2013
Submitted To:Robin McCaffreyPort of Portland
7200 NE Airport WayPortland, Oregon 97218
By:Shannon & Wilson, Inc.
3990 Collins Way, Suite 100Lake Oswego, Oregon 97035
(503) 210-4750www.shannonwilson.com
24-1-03793-001
Excellence. Innovation. Service. ValueSince 1954
24-1-03793-001-GVBP-GeotechReport-0090313.docx 24-1-03793-001 i
EXECUTIVE SUMMARY
Subsurface Soil Conditions
The site is underlain by varying amounts of fill overlying Catastrophic Flood Deposits that consist of silts, sands, and gravels. The flood deposits are underlain by Ancestral Sandy River Deposits. With the exception of Lot 11, where 15 feet of fill has been placed over native soils, the lots are generally underlain by 5 to 7 feet of medium stiff silty soils that overly sands and gravels. The gravel layer is generally between 6 and 10 feet below the ground surface except on Lot 10, where it was encountered at the surface at the south side of the hill near the existing storage barns and 15 feet below the surface near the reservoir.
Site Development Considerations
Based on the results of our field work and geotechnical engineering analysis, it is our opinion that the site is suitable for general industrial development. Based on our limited investigation, it is likely that the proposed structures will be able to be supported on conventional shallow-footing foundations. However, we recommend that lot-specific geotechnical evaluations be completed once the proposed development type is more certain. The primary geotechnical factors influencing the design and construction of this project are the presence of shallow perched groundwater in areas, instability of the soils in the reservoir area, possible difficult excavation conditions for utilities in the underlying gravels, and moisture-sensitive silts present at the ground surface.
Site Groundwater Conditions and On-Site Infiltration Potential
The static groundwater at the site is likely more than 20 feet below the elevation of SE Glisan Street to the north. However, shallower perched water is present above the silt and clay layers that are less permeable throughout the site. This perched water was observed between approximate elevations of 208 and 294 feet and generally follows the topography of the site.
Infiltration rates at the site were highly variable based on the subsurface conditions and soils at the specific location of the test. In general, the more granular materials (sand and gravel) do provide potential onsite infiltration candidates for localized areas. This is especially applicable to lots on the south side of the site, where the main perched groundwater levels are likely more than 20 feet below the ground surface. Note, though, that these higher-permeability materials were generally more than 5 to 10 feet below the ground surface in our explorations. Based on the collected information, it is our opinion that onsite infiltration is feasible on Lots 6 through 9 and the upper portions of Lot 10; however, due to the variability, we recommend that lot-specific

24-1-03793-001-GVBP-GeotechReport-0090313.docx 24-1-03793-001
ii
infiltration testing be completed. Negligible infiltration will likely be possible on Lot 11 due to the presence of a large fill and the proximity to shallow perched groundwater.
Lot 10 Slope Stability Evaluation
We performed global stability analyses of the existing conditions on Lot 10. We performed our slope stability analysis for the groundwater conditions observed at the site and with raised or near-surface conditions in the case that infiltration is used at the site on the south side of Lot 10. Based on our analysis, with the elevated water levels, the static factor of safety for the slopes along Lot 10 is well above the standard 1.5 required for design, and the seismic factors of safety are above 1.1. Based on this analysis, the slopes on Lot 10 are generally stable in their existing condition, and it is our opinion that standard slope setback recommendations as recommended in the IBC are sufficient for development on Lot 10.
McGill Reservoir Berm Evaluation
Based on our hand-augured explorations, the reservoir berm was constructed with low plasticity medium stiff silt, sandy silt, and silty sand. Organics and other debris were present, and the soils were relatively soft and loose, indicating poor compaction. These soils are relatively high permeability for fine grained soils. Based on these observations, it is unlikely that the reservoir is lined. A liquefiable layer was encountered at the upper end of the reservoir between elevations 201 and 210, beginning approximately 7 feet below the ground surface. This layer will likely liquefy during a design-level seismic event, which may cause settlement and possible instability of the reservoir banks.

24-1-03793-001-GVBP-GeotechReport-0090313.docx 24-1-03793-001
iii
TABLE OF CONTENTS
EXECUTIVE SUMMARY ............................................................................................................. I Subsurface Soil Conditions .................................................................................................... i Site Development Considerations .......................................................................................... i Site Groundwater Conditions and On-Site Infiltration Potential ........................................... i Lot 10 Slope Stability Evaluation ......................................................................................... ii McGill Reservoir Berm Evaluation ....................................................................................... ii
1.0 INTRODUCTION ..................................................................................................................1 1.1 General .......................................................................................................................1 1.2 Scope of Work ............................................................................................................1 1.3 Project Description .....................................................................................................1
1.3.1 Site Description ............................................................................................1 1.3.2 Project Understanding ..................................................................................2 1.3.3 Existing Site Data Summary ........................................................................2
2.0 GEOLOGIC SETTING ..........................................................................................................3 2.1 Regional Geology .......................................................................................................3
2.1.1 Site Geology.................................................................................................3
3.0 FIELD EXPLORATIONS .....................................................................................................4
4.0 LABORATORY TESTING ...................................................................................................4
5.0 SUBSURFACE CONDITIONS .............................................................................................5 5.1 Project Geotechnical Engineering Units ....................................................................5
5.1.1 Fill ................................................................................................................5 5.1.2 Catastrophic Flood Deposits ........................................................................6
5.1.2.1 Catastrophic Flood Deposits – Fine-Grained Facies ...................6 5.1.2.2 Catastrophic Flood Deposits – Sand-Grained Facies ..................6 5.1.2.3 Catastrophic Flood Deposits – Gravel-Grained Facies ...............7
5.1.3 Ancestral Sandy River Deposits ..................................................................7 5.2 Groundwater ...............................................................................................................8
6.0 SEISMIC DESIGN CONSIDERATIONS .............................................................................8
7.0 CONCEPTUAL GEOTECHNICAL RECOMMENDATIONS ............................................9 7.1 General .......................................................................................................................9 7.2 Site Groundwater Conditions and On-Site Infiltration Potential ...............................9 7.3 Lot 10 Slope Stability Evaluation ............................................................................10 7.4 McGill Reservoir Berm Evaluation ..........................................................................11 7.5 Construction Considerations ....................................................................................12
24-1-03793-001-GVBP-GeotechReport-0090313.docx 24-1-03793-001
iv
7.5.1 Earthwork Considerations ..........................................................................12 7.5.2 Dewatering Considerations ........................................................................12
8.0 LIMITATIONS ....................................................................................................................12
9.0 REFERENCES .....................................................................................................................15
FIGURES
1 Vicinity Map 2a Site Plan 2b Plan of Explorations
3 Lot 10 Geologic Profile 4 Lot 10 Slope Stability Analysis
APPENDICES
A Field Explorations B Laboratory Testing C Important Information About Your Geotechnical/Environmental Report
24-1-03793-001-GVBP-GeotechReport-0090313.docx 24-1-03793-001 1
CONCEPTUAL GEOTECHNICAL ENGINEERING REPORT GRESHAM VISTA BUSINESS PARK
GRESHAM, OREGON
1.0 INTRODUCTION
1.1 General
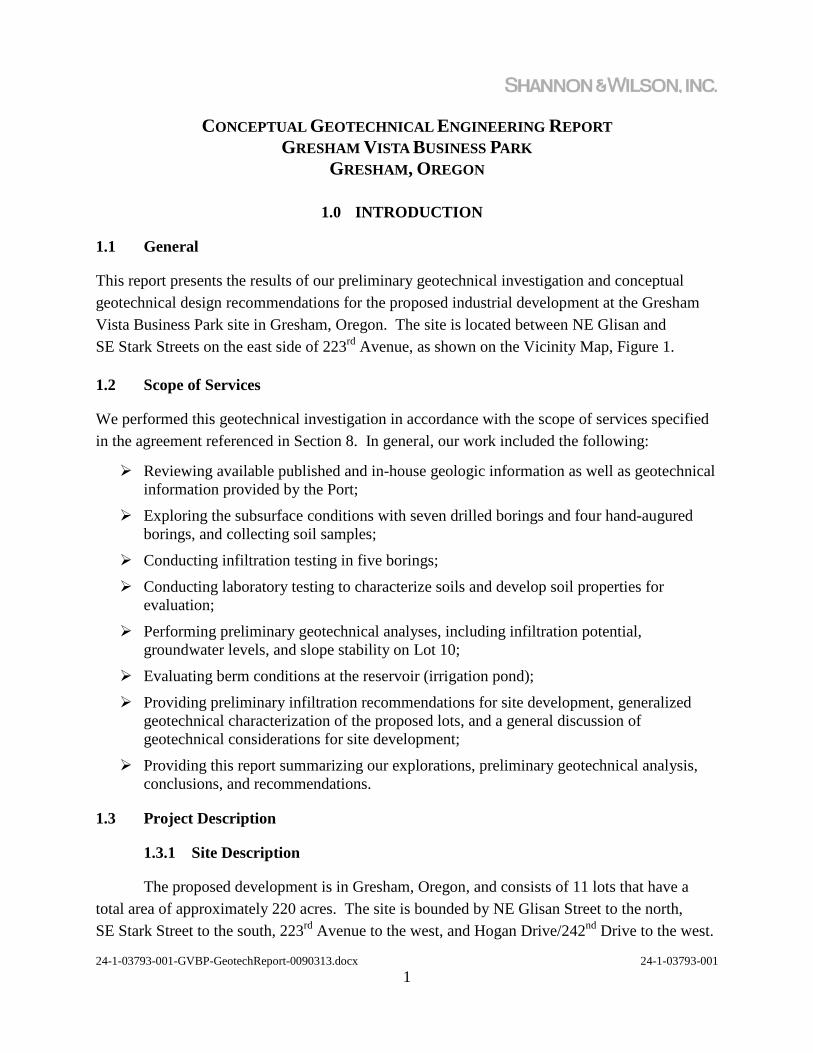
This report presents the results of our preliminary geotechnical investigation and conceptual geotechnical design recommendations for the proposed industrial development at the Gresham Vista Business Park site in Gresham, Oregon. The site is located between NE Glisan and SE Stark Streets on the east side of 223rd Avenue, as shown on the Vicinity Map, Figure 1.
1.2 Scope of Services
We performed this geotechnical investigation in accordance with the scope of services specified in the agreement referenced in Section 8. In general, our work included the following:
Reviewing available published and in-house geologic information as well as geotechnical information provided by the Port;
Exploring the subsurface conditions with seven drilled borings and four hand-augured borings, and collecting soil samples;
Conducting infiltration testing in five borings; Conducting laboratory testing to characterize soils and develop soil properties for
evaluation; Performing preliminary geotechnical analyses, including infiltration potential,
groundwater levels, and slope stability on Lot 10; Evaluating berm conditions at the reservoir (irrigation pond);
Providing preliminary infiltration recommendations for site development, generalized geotechnical characterization of the proposed lots, and a general discussion of geotechnical considerations for site development;
Providing this report summarizing our explorations, preliminary geotechnical analysis, conclusions, and recommendations.
1.3 Project Description
1.3.1 Site Description
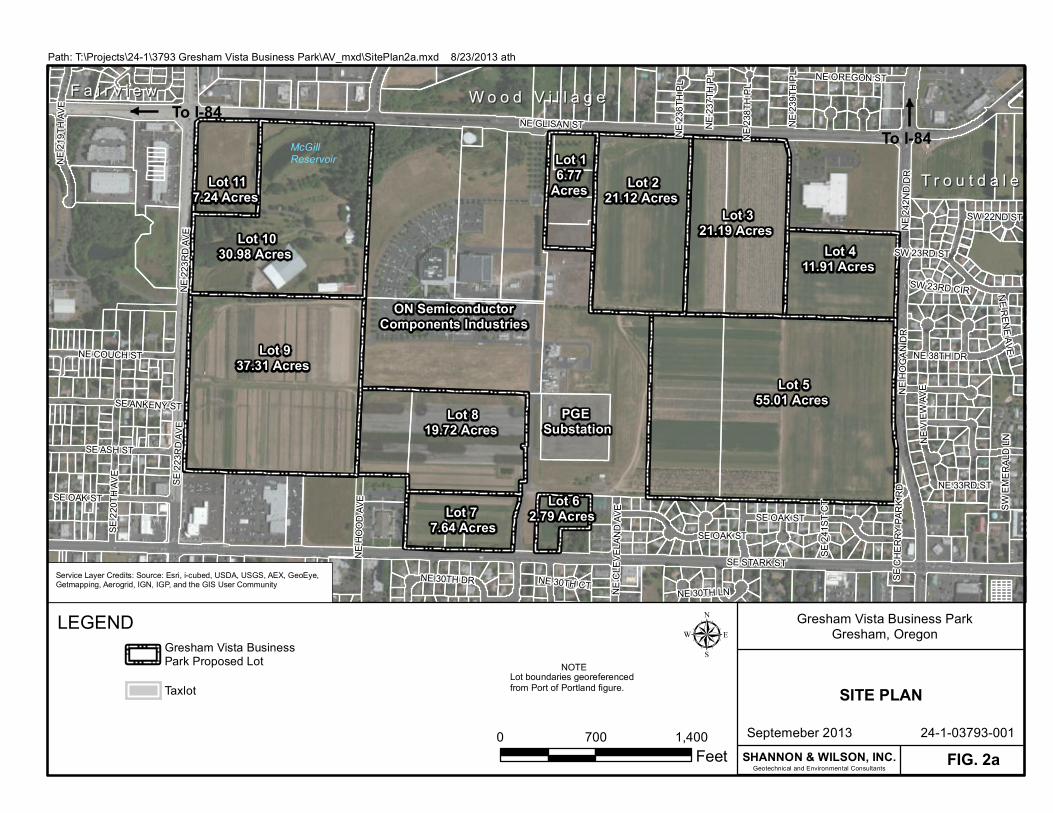
The proposed development is in Gresham, Oregon, and consists of 11 lots that have a total area of approximately 220 acres. The site is bounded by NE Glisan Street to the north, SE Stark Street to the south, 223rd Avenue to the west, and Hogan Drive/242nd Drive to the west.

24-1-03793-001-GVBP-GeotechReport-0090313.docx 24-1-03793-001
2
The 11 lots surround an ON Semiconductor Components Industries facility and a PGE substation. The proposed lots are currently undeveloped and are used for agriculture, both planted and nursery components. The site elevations are highest in the southeast corner (approximately 365 feet above mean sea level, or MSL) and slope down to the north and west. Site grades in the northeast corner are on the order of 330 to 335 feet above MSL, and they are approximately 200 to 210 feet above MSL at Glisan Street in the northeast corner. The steepest slope occurs on the northern half of Lot 10. A reservoir is located at the toe of this slope and is contained by manmade soil berms. There has been a fill pad placed on Lot 11 in the northwest corner of the site, to the west of the gravel access road. This investigation focused on Lots 7 through 11 on the western half of the site, approximately 103 acres in area.
1.3.2 Project Understanding
We understand that the port is preparing the site for development and evaluating stormwater management options for lot development. Based on information provided by the Port, onsite stormwater infiltration may be required by the City of Gresham for the proposed development. Although future site tenants and development details are unknown at this time, S&W has evaluated the potential for onsite infiltration on the currently proposed Lots 7 through 11.
The geotechnical recommendations presented in this report are based on the available project information and the subsurface conditions described in this report. If any of the noted information changes during the course of design, please inform Shannon & Wilson, Inc., in writing so that we may reconsider and amend, if necessary, the recommendations presented in this report.
1.3.3 Existing Site Data Summary
The Port has provided Shannon & Wilson with overall site topography and two previous geotechnical studies at the site. The previous reports were prepared in 1998 by GeoDesign, Inc., for a portion of the site that is now the ON Semiconductor property, and in 2012 by Carlson Geotechnical for Lot 6. Both reports indicate that the subsurface of the site consists of silt and sand overlying interbedded stiff silt and medium dense to dense sand and gravel overlying very dense gravel. Perched groundwater was encountered on Lot 6 in one test pit. The previous geotechnical report indicated that based on the infiltration testing on Lot 6, the infiltration rates were approximately 1,000 in/hr at a depth of 7 feet and 5 to 6 in/hr at a depth of 10 feet.

24-1-03793-001-GVBP-GeotechReport-0090313.docx 24-1-03793-001
3
2.0 GEOLOGIC SETTING
2.1 Regional Geology
The project site is located within the Portland structural basin, which was formed by folding and faulting of volcanic rocks of the Columbia River Basalt Group that are more than 9 million years old. Nearly 1,000 feet of Pliocene to Recent sediment has accumulated in the basin since formation of the structure; the Pliocene-age Sandy River Mudstone and Troutdale Formation (sandstone and conglomerate) account for at least several hundred feet of the sediment. In the Gresham area, the Troutdale Formation is overlain by middle to late Pleistocene alluvial deposits of the ancestral Sandy River, consisting of sandy gravel with some interbedded sand layers; these are believed to be part of a broad alluvial fan or braid plain (Evarts and O’Connor, 2008). The ancestral Sandy River deposits underlie late Pleistocene catastrophic flood deposits.
Near the end of the Pleistocene epoch or “Ice Ages,” between about 18,000 and 15,000 years ago, a series of catastrophic floods occurred in the Columbia River system (Allen and others, 2009). A lobe of the continental ice sheet blocked the mouth of the Clark Fork River in western Montana, which then formed an immense glacial lake called Glacial Lake Missoula. The lake grew until its depth and pressure overcame the ice dam, allowing the entire massive lake to empty catastrophically. Once the lake had emptied, the ice sheet again blocked the Clark Fork Valley, and the lake began to refill. Consequently, catastrophic floods called the Missoula Floods were unleashed repeatedly some 40 or more times, probably at intervals of several decades. During each flood event, floodwaters passed through the Columbia River Gorge, inundated the entire Portland basin, and back-flooded up the Willamette Valley as far south as Eugene. Each of these events was short lived, but they profoundly shaped the surficial geology of the Portland basin below an elevation of 400 feet. The Missoula Floods deposited tremendous amounts of silt, sand, and gravel within the Portland Basin.
2.1.1 Site Geology
The primary geologic units that underlie the site and vicinity are Fill, Catastrophic Flood Deposits, Ancestral Sandy River Deposits, and Troutdale Formation. These units, listed in order from youngest to oldest, are generally described as follows:
Fill: variable material placed by humans in the course of land development.
Catastrophic Flood Deposits: sediments associated with catastrophic Missoula Flood episodes. These generally include fine-grained micaceous silt and fine sand overlying coarse gravel with cobbles and boulders in a silt and sand matrix.
Ancestral Sandy River Deposits: variably cemented gravel with variable amounts of sand and fines that underlies Catastrophic Flood Deposits south of Interstate 84. The

24-1-03793-001-GVBP-GeotechReport-0090313.docx 24-1-03793-001
4
gravel deposits are crudely stratified, well sorted, and contain abundant rounded clasts of basaltic and andesitic rocks; the unit also includes thin interstratified and discontinuous silty sand lenses.
Troutdale Formation: weakly to moderately cemented gravel and cobble conglomerate with interbeds of sandstone. Sediment clasts include basalt, quartzite, and quartzofeldspathic metamorphic rocks.
Based on our interpretation of the material encountered in our borings, all units were encountered at the site except the Troutdale Formation. A nearby well log obtained from the Oregon Water Resources Department reported encountering Troutdale Formation at a depth of 85 feet below the ground surface, a depth deeper than our deepest boring. Troutdale Formation likely underlies the Ancestral Sandy River Deposits at the project site.
3.0 FIELD EXPLORATIONS
As shown on Figure 2b, Shannon & Wilson explored the subsurface conditions at the site with seven geotechnical borings and four hand auger holes. The borings, designated B-1 through B-7, were drilled between July 2 and July 5, 2013. A Shannon & Wilson engineering geologist located the borings, collected soil samples, and logged the materials encountered during drilling.
Infiltration tests were performed in or adjacent to the locations of borings B-1, B-4, B-5, B-6, and B-7. The hand augers, designated HA-1 through HA-4, were performed on Lot 10 along the berm retaining an irrigation pond (reservoir) by a Shannon & Wilson engineering geologist on July 5, 2013. The locations of the completed explorations were measured off of existing site features in the field. Details of the exploration program, including logs of the borings and hand augers, descriptions of the techniques used to advance and sample the borings, and infiltration test procedures and results, are presented in Appendix A.
4.0 LABORATORY TESTING
Laboratory tests were performed on selected samples from the borings to determine basic index and engineering properties of the soils encountered. The laboratory testing program included moisture content analyses, Atterberg Limits tests, and particle-size analyses. All laboratory testing was performed by Shannon & Wilson in general accordance with applicable ASTM International (ASTM) standards. Results of the laboratory tests and a brief description of the testing procedures are presented in Appendix B.

24-1-03793-001-GVBP-GeotechReport-0090313.docx 24-1-03793-001
5
5.0 SUBSURFACE CONDITIONS
5.1 Project Geotechnical Engineering Units
We grouped the materials encountered in our field explorations into five geotechnical engineering units, based on their age, geologic origin, and engineering characteristics:
Fill Catastrophic Flood Deposits – Fine-Grained Facies Catastrophic Flood Deposits – Sand Facies Catastrophic Flood Deposits – Gravel Facies Ancestral Sandy River Deposits
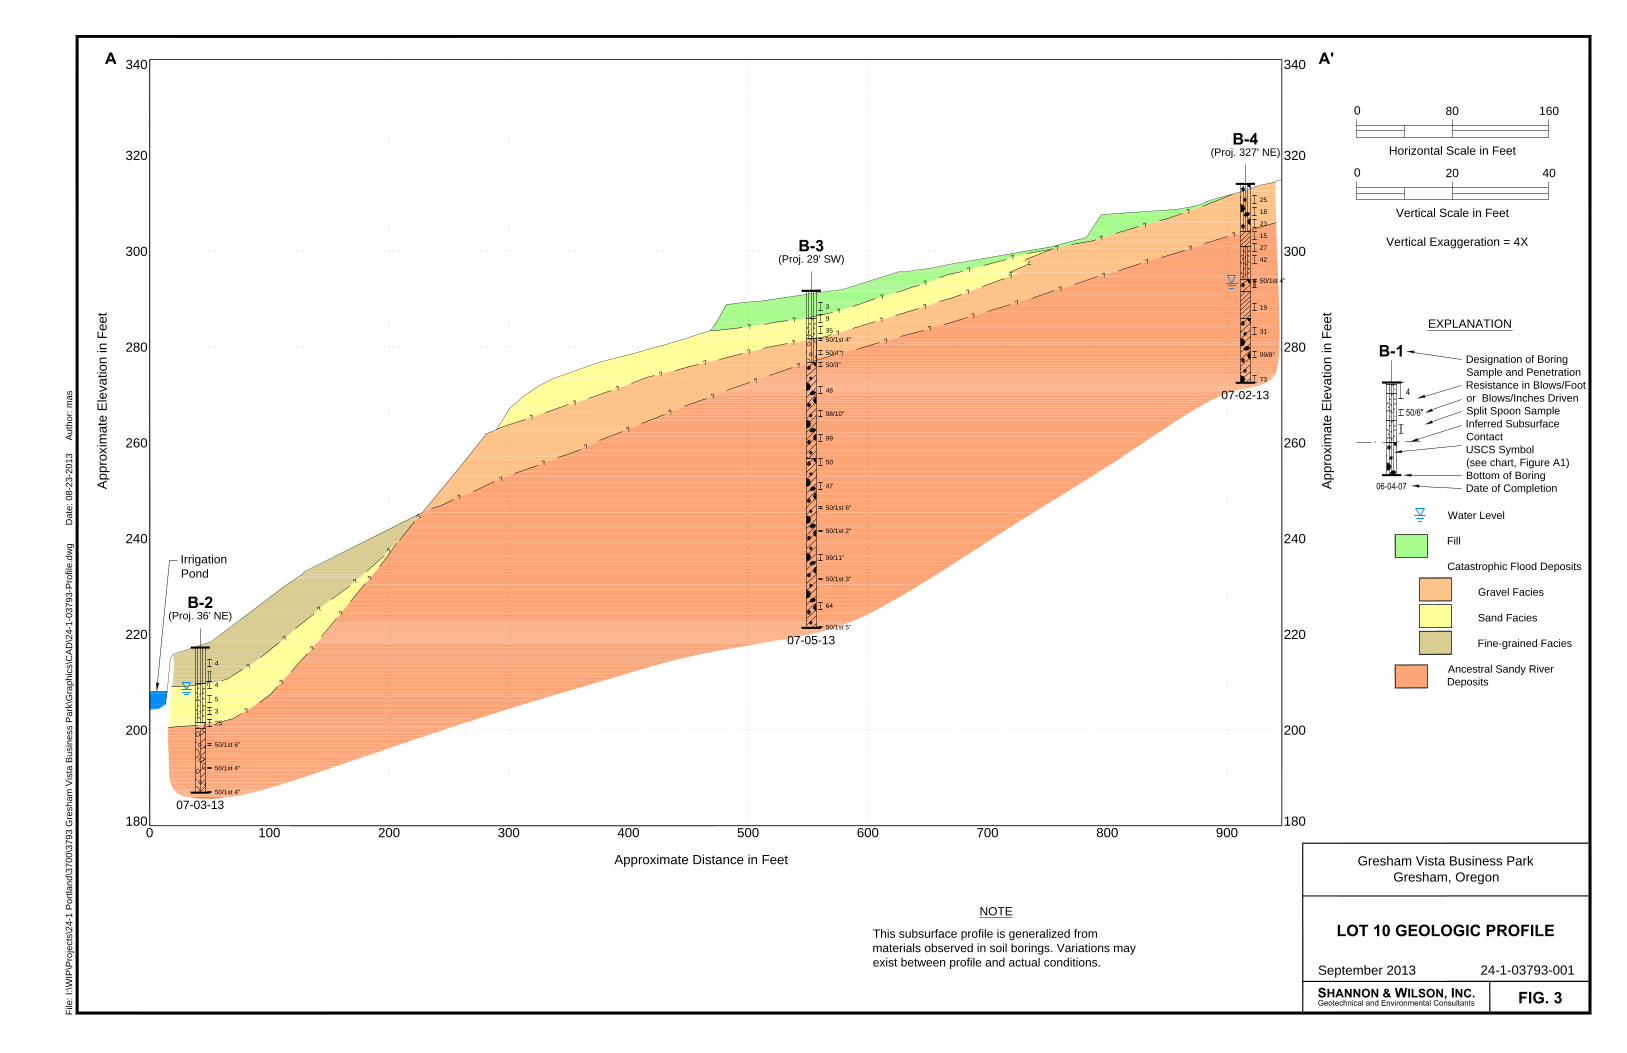
The following sections describe the general characteristics of these units. The specific terminology used in our soil description is defined in Appendix A, Figure A1. A generalized interpretation of subsurface stratigraphy is shown on the Lot 10 Geologic Profile, Figure 3. The location of the profile is shown on the Site Plan, Figure 2. Unit contacts may be more gradational than shown in the logs and profile, and conditions may vary significantly between explorations. The following discussion of units is intended to provide a general overview of subsurface conditions. Individual boring logs should be reviewed to understand the encountered subsurface conditions at specific locations.
5.1.1 Fill
Boring B-1 was drilled on the existing fill that has been placed on Lot 11. The fill was encountered from the ground surface to a depth of about 15 feet. It generally consisted of stiff to very stiff dark brown and gray Silty Sand with Gravel to Gravelly Silt with Sand (SM, ML). Sand and gravel clasts were fine to coarse. Gravel clasts were generally rounded to subrounded. Fines typically had low plasticity. Trace organics and pockets of Lean Clay (CL) were observed. Cobble-sized concrete fragments were observed at the ground surface.
Fill was also encountered in all hand augers within the berm on the northwest side of McGill Reservoir. There, the Fill generally consisted of gray to dark brown Silt or Elastic Silt with Sand to Silty Sand and Lean Clay (ML, MH, SM, CL). The sand was fine, and the fines ranged from nonplastic to medium plasticity. Trace organics were observed.
Fill was also encountered from the ground surface to a depth of about six feet in boring B-3, near the barns on the east side of Lot 10. There, the Fill consisted of soft, dark brown, nonplastic to low plasticity Silt with Sand (ML).
24-1-03793-001-GVBP-GeotechReport-0090313.docx 24-1-03793-001
6
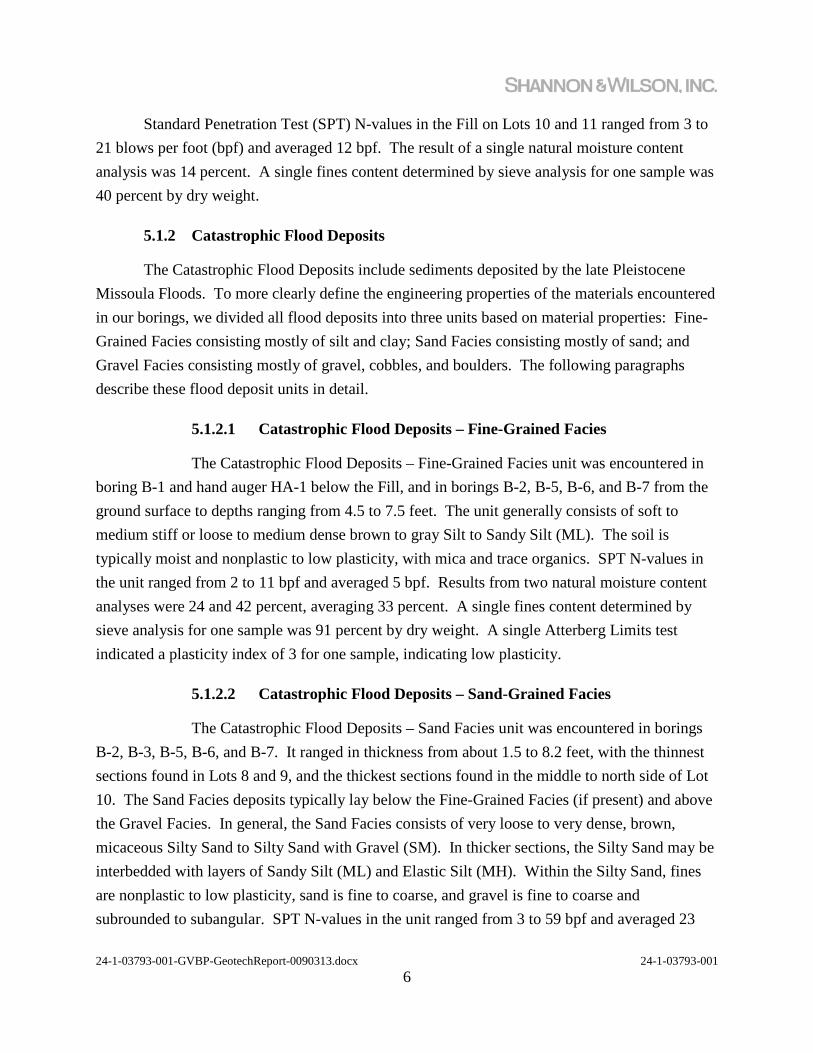
Standard Penetration Test (SPT) N-values in the Fill on Lots 10 and 11 ranged from 3 to 21 blows per foot (bpf) and averaged 12 bpf. The result of a single natural moisture content analysis was 14 percent. A single fines content determined by sieve analysis for one sample was 40 percent by dry weight.
5.1.2 Catastrophic Flood Deposits
The Catastrophic Flood Deposits include sediments deposited by the late Pleistocene Missoula Floods. To more clearly define the engineering properties of the materials encountered in our borings, we divided all flood deposits into three units based on material properties: Fine-Grained Facies consisting mostly of silt and clay; Sand Facies consisting mostly of sand; and Gravel Facies consisting mostly of gravel, cobbles, and boulders. The following paragraphs describe these flood deposit units in detail.
5.1.2.1 Catastrophic Flood Deposits – Fine-Grained Facies
The Catastrophic Flood Deposits – Fine-Grained Facies unit was encountered in boring B-1 and hand auger HA-1 below the Fill, and in borings B-2, B-5, B-6, and B-7 from the ground surface to depths ranging from 4.5 to 7.5 feet. The unit generally consists of soft to medium stiff or loose to medium dense brown to gray Silt to Sandy Silt (ML). The soil is typically moist and nonplastic to low plasticity, with mica and trace organics. SPT N-values in the unit ranged from 2 to 11 bpf and averaged 5 bpf. Results from two natural moisture content analyses were 24 and 42 percent, averaging 33 percent. A single fines content determined by sieve analysis for one sample was 91 percent by dry weight. A single Atterberg Limits test indicated a plasticity index of 3 for one sample, indicating low plasticity.
5.1.2.2 Catastrophic Flood Deposits – Sand-Grained Facies
The Catastrophic Flood Deposits – Sand Facies unit was encountered in borings B-2, B-3, B-5, B-6, and B-7. It ranged in thickness from about 1.5 to 8.2 feet, with the thinnest sections found in Lots 8 and 9, and the thickest sections found in the middle to north side of Lot 10. The Sand Facies deposits typically lay below the Fine-Grained Facies (if present) and above the Gravel Facies. In general, the Sand Facies consists of very loose to very dense, brown, micaceous Silty Sand to Silty Sand with Gravel (SM). In thicker sections, the Silty Sand may be interbedded with layers of Sandy Silt (ML) and Elastic Silt (MH). Within the Silty Sand, fines are nonplastic to low plasticity, sand is fine to coarse, and gravel is fine to coarse and subrounded to subangular. SPT N-values in the unit ranged from 3 to 59 bpf and averaged 23

24-1-03793-001-GVBP-GeotechReport-0090313.docx 24-1-03793-001
7
bpf. Results from natural moisture content analyses ranged from 18 to 40 percent and averaged 28 percent. Fines contents determined by sieve analysis ranged from 15 to 59 percent and averaged 30 percent by dry weight.
5.1.2.3 Catastrophic Flood Deposits – Gravel-Grained Facies
The Catastrophic Flood Deposits – Gravel Facies unit was encountered in boring B-4 from the ground surface to a depth of 10 feet, and in borings B-3, B-6, and B-7 below the Sand Facies deposits. Borings B-6 and B-7 were terminated in the unit, and in Boring B-3 the unit was underlain by Ancestral Sandy River Deposits. In general, the Gravel Facies consists of medium dense to very dense, dark brown and gray Poorly Graded Gravel with Silt and Sand and Cobbles to Silty Gravel with Sand and Cobbles (GP-GM, GM). Based on drill action, the unit contains scattered cobbles at least 8 inches in diameter. While no boulders were observed during drilling, boulders up to 3 feet in diameter were observed at the ground surface near B-4, and were likely derived from this unit. Four of the nine SPTs attempted in the unit met refusal, where more than 50 blows were required to drive the sampler through a six-inch interval. The non-refusal SPT N-values ranged from 18 to 34 bpf and averaged 25 bpf. Results from two natural moisture content analyses were 11 and 27 percent, averaging 19 percent. Fines contents determined by sieve analysis for two samples were 10 and 37 percent, averaging 24 percent.
5.1.3 Ancestral Sandy River Deposits
The Ancestral Sandy River Deposits were encountered below the Sand Facies in borings B-2 and B-5, and below the Gravel Facies in borings B-3 and B-4. All borings that encountered the unit were terminated in it, with the thickest penetration being 55.4 feet in boring B-3. In general, the Ancestral Sandy River Deposits consist of dense to very dense, gray, red-yellow, and brown Poorly Graded Gravel with Clay and Sand to Clayey Gravel with Sand and Cobbles (GP-GC, GC). In boring B-4, the upper portion of the unit contained 3- to 5.5-foot-thick interbeds of stiff to very stiff gray to brown Lean Clay (CL) and a 7-foot-thick interbed of dense, brown, red, and gray Silty Sand (SM). Fines in the unit are low to medium plasticity, sand is fine to coarse, and gravel is fine to coarse and rounded to subangular. Some gravel clasts are predominantly decomposed. Based on drill action, the unit contains scattered cobbles at least 8 inches in diameter. Half of the 24 SPTs attempted in the unit met refusal. The non-refusal SPT N-values ranged from 27 to 99 bpf and averaged 52 bpf, with the exception of two SPTs taken in fine-grained layers, which yielded N-vales of 15 and 19 bpf. Results from natural moisture content analyses ranged from 21 to 37 percent and averaged 27 percent. A single fines content

24-1-03793-001-GVBP-GeotechReport-0090313.docx 24-1-03793-001
8
determined by sieve analysis for one sample was 13 percent. Two Atterberg Limits tests on samples from fine-grained layer indicated plasticity indices of 9 and 10.
5.2 Groundwater
After drilling, borings B-2 and B-4 were flushed with clean water and left open from July 3 to the morning of July 5, 2013, in order to observe the natural groundwater level. Boring B-3 was left open over the same time interval, but its total depth on July 3 was only 15.8 feet, as it was still in progress. On the morning of July 5, the measured water level in boring B-2 was 8.8 feet below the ground surface, and the measured water level in boring B-4 was 20.7 feet below the ground surface. In boring B-3, water was measured at 9.9 feet below the ground surface, but it contained drilling mud and the boring was still in progress, so that level may not reflect the actual depth to groundwater. In our opinion, the values obtained from borings B-2 and B-4 are likely representative of groundwater levels at the site at the time the explorations were performed. Groundwater levels should be expected to fluctuate seasonally and with changes in precipitation, land use, and other factors. In general, we expect groundwater levels in this area to be at a seasonal high during the winter and late spring and at a seasonal low during the late summer and early fall.
6.0 SEISMIC DESIGN CONSIDERATIONS
In accordance with the site classification criteria set forth in 2012 International Building Code (2010 IBC), we recommend a Site Class D for this site. The following paragraphs describe required seismically related hazard evaluations on-site.
Strong Ground Motions: The maximum considered earthquake (MCE) ground motions at the bedrock level of SS = 0.95 g and S1 = 0.39 g were obtained from the United States Geological Survey’s Earthquake Hazards Program – 2008 interactive deaggregation website. Based on the site class and these values, the design earthquake spectral response coefficients are Fa = 1.12 and Fv = 1.62. The ground motions are based on a probabilistic hazard analysis performed by the USGS and the seismic site classification of the project site.
Fault Rupture: In the vicinity of the project site, the nearest mapped faults are the Damascus-Tickle Creek fault and Grant Butte fault, about 1.8 miles to the south, and the Lacamas Lake fault, about 4.5 miles to the northeast. All three faults are designated as Class A by the United States Geological Survey and are thought to have been active within the last 750 thousand years (Personius, 2002). Due to their mapped distance from the site, it is our opinion that the risk for fault rupture at the site is low.
Liquefaction and Lateral Spread: A layer of loose sand was encountered in B-2 near the southern side of the reservoir. Based on the observed water level and the loose, non-plastic nature of the soil, it is likely that this layer will experience liquefaction,

24-1-03793-001-GVBP-GeotechReport-0090313.docx 24-1-03793-001
9
settlement, and strength loss during a seismic event. This could cause instability of the berms surrounding the reservoir. Based on our explorations, this layer is limited to the area near the reservoir.
Other Seismic Risks: Due to the dense gravelly soils at the site and the geography, it is our opinion that the risk for liquefaction and lateral spread away from the reservoir, and tsunami or seiche at the site is minimal.
7.0 CONCEPTUAL GEOTECHNICAL RECOMMENDATIONS
7.1 General
Based on the results of our field work and geotechnical engineering analysis, it is our opinion that the site is suitable for general industrial development. Based on our limited investigation, it is likely that the proposed structures will be able to be supported on conventional shallow-footing foundations. However, we recommend that lot-specific geotechnical evaluations be completed once the proposed development type is more certain. The primary geotechnical factors influencing the design and construction of this project are the presence of shallow perched groundwater in areas, instability of the soils in the reservoir area, possible difficult excavation conditions for utilities in the underlying gravels, and moisture-sensitive silts present at the ground surface.
7.2 Site Groundwater Conditions and On-Site Infiltration Potential
As discussed above, the static groundwater at the site is likely more than 20 feet below the elevation of SE Glisan Street to the north. However, shallower perched water is present above the silt and clay layers that are less permeable throughout the site, and within the gravel layers above the cemented or fine-grained portions of the Ancestral Sandy River mudflow deposits that act as an aquitard in this area. The perched water in the area of the reservoir is an indication of the presence of this aquitard. These perched water levels were present during the previous August 2012 and our July 2013 explorations, indicating that they will likely be present year-round, even in the drier summer months. Based on our observations and the previous studies at the site, this perched water was observed between approximate elevations of 208 and 294 feet and generally follows the topography of the site.
Further, infiltration rates at the site were highly variable based on the subsurface conditions and soils at the specific location of the test. In general, the more granular materials (sand and gravel) do provide potential onsite infiltration candidates for localized areas. This is especially applicable to lots on the south side of the site, where the main perched groundwater levels are likely more than 20 feet below the ground surface. Note, though, that these higher-permeability materials were generally more than 5 to 10 feet below the ground surface in our explorations.

24-1-03793-001-GVBP-GeotechReport-0090313.docx 24-1-03793-001
10
Based on the collected information, it is our opinion that onsite infiltration is feasible on Lots 6 through 9 and the upper portions of Lot 10; however, due to the variability, we recommend that lot-specific infiltration testing be completed. Rain gardens and other shallow installations may require over-excavation to communicate with deeper, more permeable layers. In general, all infiltration features and installations should be placed to avoid shallow perched groundwater. Negligible infiltration will likely be possible on Lot 11 due to the presence of a large fill and the proximity to shallow perched groundwater.
7.3 Lot 10 Slope Stability Evaluation
Slope stability is influenced by various factors including: (1) the geometry of the soil mass and subsurface materials; (2) the weight of soil materials overlying the failure surface; (3) the shear strength of soils and/or rock along the failure surface; and (4) the hydrostatic pressure (groundwater levels) present within the landslide mass and along the failure surface. The stability of a slope is expressed in terms of factor of safety (FS), which is defined as the ratio of resisting forces to driving forces. At equilibrium, the FS is equal to 1.0 and the driving forces are balanced by the resisting forces. Failure occurs when the driving forces exceed the resisting forces, i.e., FS less than 1.0. An increase in the factor of safety above 1.0, whether by increasing the resisting forces or decreasing the driving forces, reflects a corresponding increase in the stability of the mass. In general, a static factor of safety of 1.5 is desirable for slopes that will support structures and roads. A seismic factor of safety of greater than 1.1 is also recommended.
The actual factor of safety may differ from the calculated factor of safety due to variations in soil strengths, subsurface geometry, failure surface location and orientation, groundwater levels, and other factors that are not completely known or understood. To develop the slope stability models, we used site-specific historical information, information developed from our field explorations, laboratory testing, and our experience with similar materials. Our engineering analyses and conclusions are based upon the assumption that subsurface conditions are not significantly different from those encountered by the field explorations and interpreted in the geologic profiles.
We performed global stability analyses of the existing conditions at the profile A-A’ as shown on Figure 2a and Figure 3 using the limit-equilibrium stability methods as included in SLOPE/W, Version 7.19, (Geo-Slope International, 2007). The results of the analysis are shown on Figure 4. The Morgenstern-Price method, which satisfies both force and moment equilibrium, was used to calculate the FS values for optimized failure surfaces. We performed our slope stability analysis for the groundwater conditions observed at the site and with raised or near-surface conditions in the case that infiltration is used at the site on the south side of Lot 10.
24-1-03793-001-GVBP-GeotechReport-0090313.docx 24-1-03793-001
11
Based on our analysis, with the elevated water levels, the static factor of safety for the slopes along Lot 10 is well above the standard 1.5 required for design, and the seismic factors of safety are above 1.1. Based on this analysis, the slopes on Lot 10 are generally stable in their existing condition, and it is our opinion that standard slope setback recommendations as recommended in the IBC are sufficient for development on Lot 10. Further, infiltration at the site will not adversely affect global stability of the slope shown in Figure 3. However, we recommend that once the infiltration facilities and lot layouts are complete, local slope stability be analyzed based on the final design.
7.4 McGill Reservoir Berm Evaluation
Based on our hand-augured explorations, the reservoir berm was constructed with low plasticity medium stiff silt, sandy silt, and silty sand. Organics and other debris were present, and the soils were relatively soft and loose, indicating poor compaction. These soils are relatively high permeability for fine grained soils. Groundwater was observed in two of the four hand augers and rose to 2 to 3 feet below the reservoir level within a few minutes of excavation. Based on these observations, it is unlikely that the reservoir is lined. During our explorations, the reservoir water level was between 3 and 5 feet below the top of the surrounding berm. We anticipate that the water level is higher in winter months and during periods of wet weather. We also understand that the pond is used for irrigation purposes and thus can have a variable water level throughout the year.
As discussed above, a liquefiable layer was encountered in B-2 between elevations 201 and 210, beginning approximately 7 feet below the ground surface. This layer will likely liquefy during a design-level seismic event, which may cause settlement and possible instability of the reservoir banks.
We understand that the Port is considering using this reservoir as additional storage capacity for onsite stormwater disposal. Based on our observations, it is likely that there is limited capacity within the reservoir for large amounts of additional runoff. Further, seepage will likely occur within the permeable material of the berm. If this area is needed for temporary stormwater storage, it is likely that the height of the berm will need to be increased. We recommend also that the berm be further evaluated for instability during seismic events and that the installation of a liner be considered to prevent excessive seepage and possible stability issues within the berm.
24-1-03793-001-GVBP-GeotechReport-0090313.docx 24-1-03793-001
12
7.5 Construction Considerations
7.5.1 Earthwork Considerations
The contractor may encounter difficulties during excavation at the site due to shallow perched groundwater and dense to very dense gravels with frequent cobbles and possible boulders. Temporary earth slopes may be cut at a steepness of about 1.5 horizontal to 1 vertical (1.5H:1V) above the groundwater table. Permanent earth slopes should be dressed to 2H:1V or flatter and protected from erosion.
Excavation and construction operations may expose the on-site silty surficial soils to inclement weather conditions. These soils can be easily disturbed when wet, and the stability of exposed soils may rapidly deteriorate due to a change in moisture content (i.e. wetting or drying) or the actions of heavy or repeated construction traffic. Accordingly, foundation and pavement area excavations should be adequately protected from the elements and from the actions of repetitive or heavy construction loadings.
7.5.2 Dewatering Considerations
The previous explorations on Lot 6 and our explorations have shown the potential for the presence of shallow perched groundwater at the site. Utility trench and other excavations may encounter groundwater seepage and the associated instability, especially in sandy soils.
8.0 LIMITATIONS
Our services are being performed based on the Shannon & Wilson proposal (Proposal #24-2-04550-001) executed June 28, 2013, as PO #107591 assigned under our on-call contract (Contract #612) with the Port of Portland. The analyses, conclusions, and recommendations contained in this report are based on site conditions as they presently exist, and further assume that the explorations are representative of the subsurface conditions throughout the site; that is, the subsurface conditions everywhere are not significantly different from those disclosed by the explorations. If subsurface conditions different from those encountered in the explorations are encountered or appear to be present during construction, we should be advised at once so that we can review these conditions and reconsider our recommendations, where necessary. If there is a substantial lapse of time between the submission of this report and the start of construction at the site, or if conditions have changed because of natural forces or construction operations at or adjacent to the site, we recommend that we review our report to determine the applicability of the conclusions and recommendations.

24-1-03793-001-GVBP-GeotechReport-0090313.docx 24-1-03793-001
13
Within the limitations of scope, schedule, and budget, the analyses, conclusions, and recommendations presented in this report were prepared in accordance with generally accepted professional geotechnical engineering principles and practice in this area at the time this report was prepared. We make no other warranty, either express or implied. These conclusions and recommendations were based on our understanding of the project as described in this report and the site conditions as observed at the time of our explorations.
Unanticipated soil conditions are commonly encountered and cannot be fully determined by merely taking soil samples from test borings. Such unexpected conditions frequently require that additional expenditures be made to attain a properly constructed project. Therefore, some contingency fund is recommended to accommodate such potential extra costs.
This report was prepared for the exclusive use of the owner and architect/engineer in the design of the Gresham Vista Business Park. The data and report can be provided to the contractors for their information, but our report, conclusions, and interpretations should not be construed as a warranty of subsurface conditions included in this report.
The scope of our present work did not include environmental assessments or evaluations regarding the presence or absence of wetlands, or hazardous or toxic substances in the soil, surface water, groundwater, or air, on or below or around this site, or for the evaluation or disposal of contaminated soils or groundwater, should any be encountered.
Shannon & Wilson, Inc., has prepared and included in Appendix C, “Important Information About Your Geotechnical/Environmental Report,” to assist you and others in understanding the use and limitations of our reports.
24-1-03793-001-GVBP-GeotechReport-0090313.docx 24-1-03793-001
15
9.0 REFERENCES
Allen, J.E., Burns, M., and Burns, S., 2009, Cataclysms on the Columbia: The Great Missoula Floods (2d ed.): Portland, Ore., Ooligan Press, 204 p.
Beeson, M.H., Tolan, T.L., and Madin, I.P., 1989, Geologic Map of the Lake Oswego Quadrangle, Clackamas, Multnomah, and Washington Counties, Oregon: Oregon Department of Geology and Mineral Industries, Geological Map Series GMS-59, scale 1:24,000.
Carlson Geotechnical, Report of Geotechnical Investigation & Infiltration Testing – Fresenius Medical Clinic – Phases I through III, August 22, 2012.
Evarts, R.C., and O’Connor, J.E., 2008, Geologic Map of the Camas Quadrangle, Clark County, Washington, and Multnomah County, Oregon. U.S. Geological Survey Scientific Investigations Map 3017.
GeoDesign, Inc., Geotechnical Engineering Service Report – LSI Logic Central Processing Building, Gresham, Oregon, April 15, 1998. International Building Code, 2012. Personius, S.F., compiler, 2002, Fault number 880, Lacamas Lake fault, in Quaternary fault and
fold database of the United States: U.S. Geological Survey website, http://earthquakes.usgs.gov/hazards/qfaults, accessed 07/26/2013 04:33 PM.
Personius, S.F., compiler, 2002, Fault number 878, Grant Butte fault, in Quaternary fault and fold database of the United States: U.S. Geological Survey website, http://earthquakes.usgs.gov/hazards/qfaults, accessed 07/26/2013 04:32 PM.
Personius, S.F., compiler, 2002, Fault number 879, Damascus-Tickle Creek fault zone, in Quaternary fault and fold database of the United States: U.S. Geological Survey website, http://earthquakes.usgs.gov/hazards/qfaults, accessed 07/26/2013 04:29 PM.
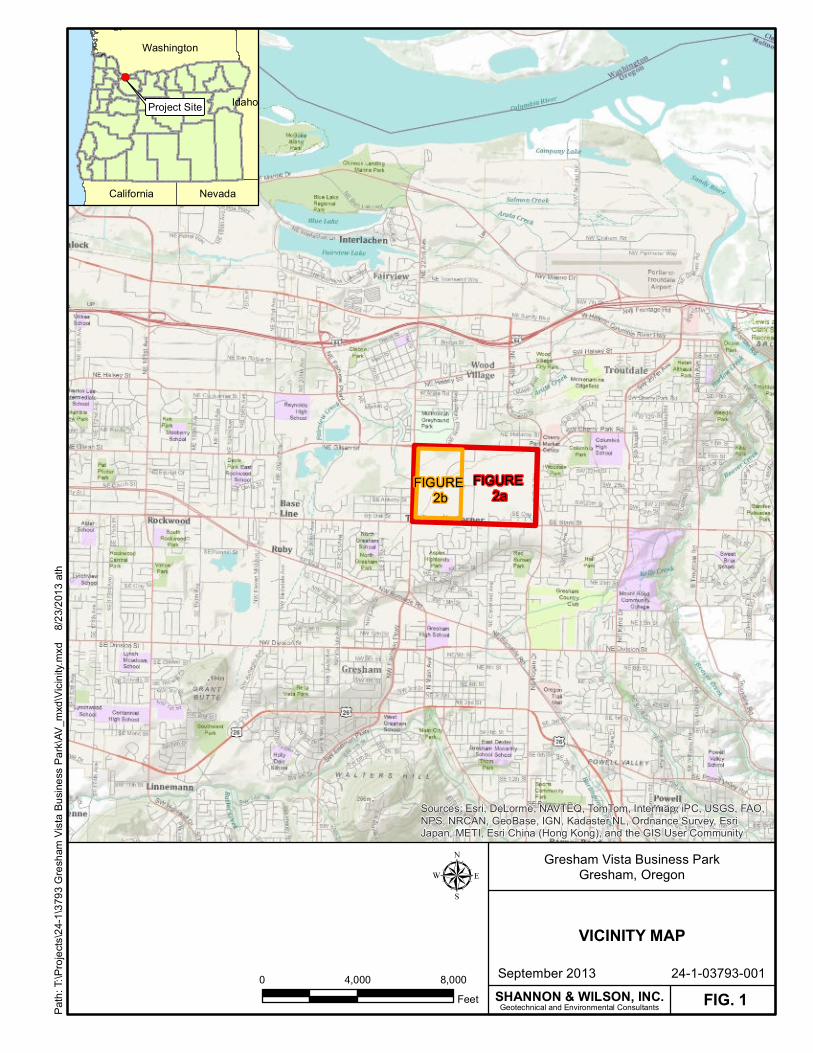
FIGURE 2a
FIGURE 2b
Sources: Esri, DeLorme, NAVTEQ, TomTom, Intermap, iPC, USGS, FAO,NPS, NRCAN, GeoBase, IGN, Kadaster NL, Ordnance Survey, EsriJapan, METI, Esri China (Hong Kong), and the GIS User Community
Gresham Vista Business ParkGresham, Oregon
VICINITY MAP
FIG. 1September 2013 24-1-03793-0010 4,000 8,000
Feet
µ
Path:
T:\Pr
ojects
\24-1\
3793
Gres
ham
Vista
Busin
ess P
ark\AV
_mxd
\Vicin
ity.mx
d 8
/23/20
13 at
h
SHANNON & WILSON, INC.Geotechnical and Environmental Consultants
!(
Project Site
Washington
NevadaCalifornia
Idaho
Lot 117.24 Acres
Lot 1030.98 Acres
Lot 937.31 Acres
Lot 819.72 Acres
Lot 62.79 Acres
Lot 555.01 Acres
Lot 321.19 Acres
Lot 221.12 Acres
Lot 16.77
Acres
Lot 411.91 Acres
PGE Substation
ON SemiconductorComponents Industries
To I-84To I-84 W o o d V i l l a g eW o o d V i l l a g e
T r o u t d a l eT r o u t d a l e
F a i r v i e wF a i r v i e w
Lot 7 7.64 Acres
McGill Reservoir
SE STARK ST
NE GLISAN ST
NE 22
3RD A
VE
NE H
OGAN
DR
NE 24
2ND
DR
SE 22
3RD A
VE
SE ASH ST
SE 22
0TH A
VE
SE OAK ST
SW 23RD ST
NE 38TH DR
SE ANKENY ST
NE COUCH ST
NE OREGON ST
NE VI
EW AV
E
NE 21
9TH
AVE
NE 30TH DR
NE C
LEVE
LAND
AVE
NE 23
9TH
PL
SW 22ND ST
NE 33RD ST
NE 23
7TH
PL
NE 23
8TH
PL
NE H
OOD
AVE
NE 23
6TH
PL
SW 23RD CIR
SE C
HERR
Y PAR
K RD
NE 30TH LN
NE RENE AVE
SW E
MERA
LD LN
NE 30TH CT
SE 24
1ST C
T
SE OAK STSE OAK ST
Gresham Vista Business ParkGresham, Oregon
SITE PLAN
FIG. 2aSeptemeber 2013 24-1-03793-001
Path: T:\Projects\24-1\3793 Gresham Vista Business Park\AV_mxd\SitePlan2a.mxd 8/23/2013 ath
SHANNON & WILSON, INC.Geotechnical and Environmental Consultants
µ
0 700 1,400Feet
Service Layer Credits: Source: Esri, i-cubed, USDA, USGS, AEX, GeoEye,Getmapping, Aerogrid, IGN, IGP, and the GIS User Community
LEGENDGresham Vista Business Park Proposed Lot NOTE
Lot boundaries georeferenced from Port of Portland figure.Taxlot

!<!<
!<
!<
!<
!<
!<
!<
!<
!<
!<
LOT 117.24 ACRES
LOT 1030.98 ACRES
LOT 937.31 ACRES
LOT 819.72 ACRES
McGill Reservoir
LOT 77.64 ACRES
NE 30TH DR
A
A'
B-3
B-2
HA-4HA-3
HA-2
HA-1
B-7i
B-6i
B-5i
B-4i
B-1i
SE STARK ST
NE GLISAN ST
NE 22
3RD A
VESE
223R
D AVE
NE H
OOD
AVE
Gresham Vista Business ParkGresham, Oregon
PLAN OF EXPLORATIONS
FIG. 2bSeptember 2013 24-1-03793-0010 400 800
Feet
µ
Path:
T:\Pr
ojects
\24-1\
3793
Gres
ham
Vista
Busin
ess P
ark\AV
_mxd
\SIteP
lan_2
b.mxd
8/2
3/201
3 ath
SHANNON & WILSON, INC.Geotechnical and Environmental Consultants
LEGENDGresham Vista Business Park Proposed Lot
NOTELot boundaries georeferenced from Port of Portland figure.Taxlot
Service Layer Credits: Source: Esri, i-cubed, USDA, USGS, AEX, GeoEye, Getmapping, Aerogrid, IGN, IGP, and the GIS User Community
Cross Section
!< Hand Auger
Boring with Infiltration Test!<
!< Boring
180
200
220
240
260
280
300
320
340
0 100 200 300 400 500 600 700 800 900
180
200
220
240
260
280
300
320
340
4
4
5
3
25
50/1st 6"
50/1st 4"
50/1st 4"
(Proj. 36' NE)
07-03-13
B-2
3
9
35
50/1st 4"
50/4"
50/3"
48
98/10"
99
50
47
50/1st 6"
50/1st 2"
99/11"
50/1st 3"
64
50/1st 5"
(Proj. 29' SW)
07-05-13
B-3
25
18
23
15
27
42
50/1st 4"
19
31
99/8"
73
(Proj. 327' NE)
07-02-13
B-4
Approxim
ate E
levation in F
eet
Approxim
ate E
levation in F
eet
A'A
Approximate Distance in Feet
??
?
?
?
?
??
?
?
?
?
?
?
?
??
??
?
?
?
?
?
?
?
?
?
?
?
?
?
?
?
?
?
?
?
?
?
?
?
?
?
?
?
?
?
?
?
?
?
?
?
?
?
Irrigation
Pond
24-1-03793-001
LOT 10 GEOLOGIC PROFILE
FIG. 3
Gresham Vista Business Park
Gresham, Oregon
September 2013
080 160
Horizontal Scale in Feet
SHANNON & WILSON, INC.
File: I:\W
IP
\P
rojects\24-1 P
ortland\3700\3793 G
resham
V
ista B
usiness P
ark\G
raphics\C
AD
\24-1-03793-P
rofile.dw
g D
ate: 08-23-2013 A
uthor: m
as
020 40
Vertical Scale in Feet
B-1
Designation of Boring
Sample and Penetration
Resistance in Blows/Foot
or Blows/Inches Driven
Split Spoon Sample
Inferred Subsurface
Contact
USCS Symbol
(see chart, Figure A1)
Bottom of Boring
Date of Completion
EXPLANATION
4
50/6"
06-04-07
Water Level
Fill
Catastrophic Flood Deposits
Gravel Facies
Sand Facies
Fine-grained Facies
Ancestral Sandy River
Deposits
? ?
This subsurface profile is generalized from
materials observed in soil borings. Variations may
exist between profile and actual conditions.
NOTE
Vertical Exaggeration = 4X

Dense Catastrophic
Flood Deposits
= 125 pcf
= 34°c = 0 psf
Loose Catastrophic
Flood Deposits
= 120 pcf
= 29°c = 0 psf
Ancestral Sandy
River Deposits
= 135 pcf
= 40°c = 0 psf
Fill
= 135 pcf
= 36°c = 0 psf
Distance (feet)
0 50 100 150 200 250 300 350 400 450 500 550 600 650 700 750 800 850 900 950 1000 1050
Elevation (feet)
160
180
200
220
240
260
280
300
320
Static Factor of Safety = 2.1
Seismic Factor of Safety = 1.1
McGill
Reservoir
Static
Failure
Surface
Seismic
Failure
Surface
A A'
FIG
. 4
LOT 10
SLOPE STABILITY ANALYSIS
FIG. 4
SHANNON & WILSON, INC.
24-1-03793-001
Gresham Vista Business Park
Gresham, Oregon
September 2013

24-1-03793-001
APPENDIX A
FIELD EXPLORATIONS

24-1-03793-001 A-i
TABLE OF CONTENTS
A.1 GENERAL ...........................................................................................................................1
A.2 BORINGS ............................................................................................................................1 A.2.1 Drilling ..................................................................................................................1 A.2.2 Disturbed Sampling ...............................................................................................1 A.2.3 Undisturbed Sampling ...........................................................................................2 A.2.4 Borehole Abandonment .........................................................................................2
A.3 HAND AUGERS .................................................................................................................3
A.4 MATERIAL DESCRIPTIONS ............................................................................................3
A.5 LOGS OF BORINGS AND HAND AUGERS ...................................................................3
A.6 INFILTRATION TESTING ................................................................................................4
TABLES A1 Infiltration Test Results
FIGURES A1 Soil Description and Log Key A2 Log of Boring B-1 A3 Log of Boring B-2 A4 Log of Boring B-3 A5 Log of Boring B-4 A6 Log of Boring B-5 A7 Log of Boring B-6 A8 Log of Boring B-7 A9 Log of Hand Auger HA-1 A10 Log of Hand Auger HA-2 A11 Log of Hand Auger HA-3 A12 Log of Hand Auger HA-4

24-1-03793-001
A-1
APPENDIX A
FIELD EXPLORATIONS A.1 GENERAL
Shannon & Wilson, Inc., explored subsurface conditions at the project site with seven geotechnical borings and four hand auger holes. The borings were designated B-1 through B-7 and ranged in depth from 9.3 to 70.4 feet below the ground surface (bgs). The hand auger holes were designated HA-1 through HA-4 and ranged in depth from 5.7 to 8.0 feet bgs. Infiltration tests were performed in or adjacent to the locations of borings B-1, B-4, B-5, B-6, and B-7. The locations of the completed explorations were measured off of existing site features in the field using a tape measure. Approximate locations of the explorations are shown on the Site Plan, Figure 2. This appendix describes the techniques used to advance and sample the explorations and presents logs of the materials encountered during drilling. It also presents infiltration testing procedures and results.
A.2 BORINGS
A.2.1 Drilling
Borings B-1 through B-7 were drilled between July 2 and July 5, 2013. The borings were drilled using a CME 75 truck-mounted drill rig provided and operated by Western States Soil Conservation, Inc., of Hubbard, Oregon. Borings B-1, B-5, B-6, and B-7 were drilled using hollow-stem auger drilling techniques. Borings B-2, B-3, and B-4 were drilled using mud-rotary drilling techniques. For each boring with an associated infiltration test (B-1, B-4, B-5, B-6, and B-7), the tests were conducted through the hollow-stem auger used for the geotechnical hole or in an adjacent hollow-stem auger set within 5 feet of the geotechnical hole location. A Shannon & Wilson engineering geologist was present during the explorations to locate the borings, observe the drilling, collect soil samples, log the materials encountered, and conduct infiltration testing.
A.2.2 Disturbed Sampling
Disturbed samples were collected in the borings, typically at 2.5- to 5-foot depth intervals, using a standard 2-inch outside diameter (O.D.) split spoon sampler in conjunction with Standard Penetration Testing. In a Standard Penetration Test (SPT), ASTM D1586, the sampler is driven 18 inches into the soil using a 140-pound hammer dropped 30 inches. The

24-1-03793-001
A-2
number of blows required to drive the sampler the last 12 inches is defined as the standard penetration resistance, or N-value. The SPT N-value provides a measure of in situ relative density of cohesionless soils (silt, sand, and gravel), and the consistency of cohesive soils (silt and clay). In some instances, a 3-inch O.D. split spoon sampler was used through the same interval as, or in lieu of, an SPT sample in order to obtain additional material for testing. All disturbed samples were visually identified and described in the field, sealed to retain moisture, and returned to our laboratory for additional examination and testing.
SPT N-values can be significantly affected by several factors, including the efficiency of the hammer used. The same automatic hammer system was used for all borings performed at the site. Automatic hammers generally have higher energy transfer efficiencies than cathead-driven hammers. Based on information we received from Western States Soil Conservation, the energy efficiency of the hammer used at the site was 73.0 percent, as previously measured on March 17, 2013. All N-values presented in this report are in blows per foot, as counted in the field. No corrections of any kind have been applied.
An SPT was considered to have met refusal where more than 50 blows were required to drive the sampler 6 inches. If refusal was encountered in the first six-inch interval (for example, 50 for 1.5”), the count is reported as 50/1st 1.5”. If refusal was encountered in the second six-inch interval (for example, 48, 50 for 1.5”), the count is reported as 50/1.5”. If refusal was encountered in the last six-inch interval (for example, 39, 48, 50 for 1.5”), the count is reported as 98/7.5”. N-values from samples acquired using a 3-inch O.D. sampler are not shown on the logs.
A.2.3 Undisturbed Sampling
Undisturbed samples were collected in 3-inch O.D. thin-wall Shelby tubes, which were pushed into the undisturbed soil at the bottoms of boreholes hydraulically. The soils exposed at the ends of the tubes were examined and described in the field. After examination, the ends of the tubes were sealed to preserve the natural moisture of the samples. The sealed tubes were stored in the upright position, and care was taken to avoid shock and vibration during their transport and storage in our laboratory.
A.2.4 Borehole Abandonment
After drilling, borings B-2 and B-4 were flushed with water and left open from July 3 to the morning of July 5, 2013, in order to observe the natural groundwater level. Boring B-3 was left open over the same time interval, but its total depth on July 3 was only 15.8 feet as it was
24-1-03793-001
A-3
still in progress. Borings B-2 through B-4 were backfilled on July 5, 2013. All other borings were backfilled as soon as they were completed. All borings were backfilled with bentonite cement grout or bentonite chips in accordance with Oregon Water Resource Department regulations. No wells or other instruments were installed in the boreholes.
A.3 HAND AUGERS
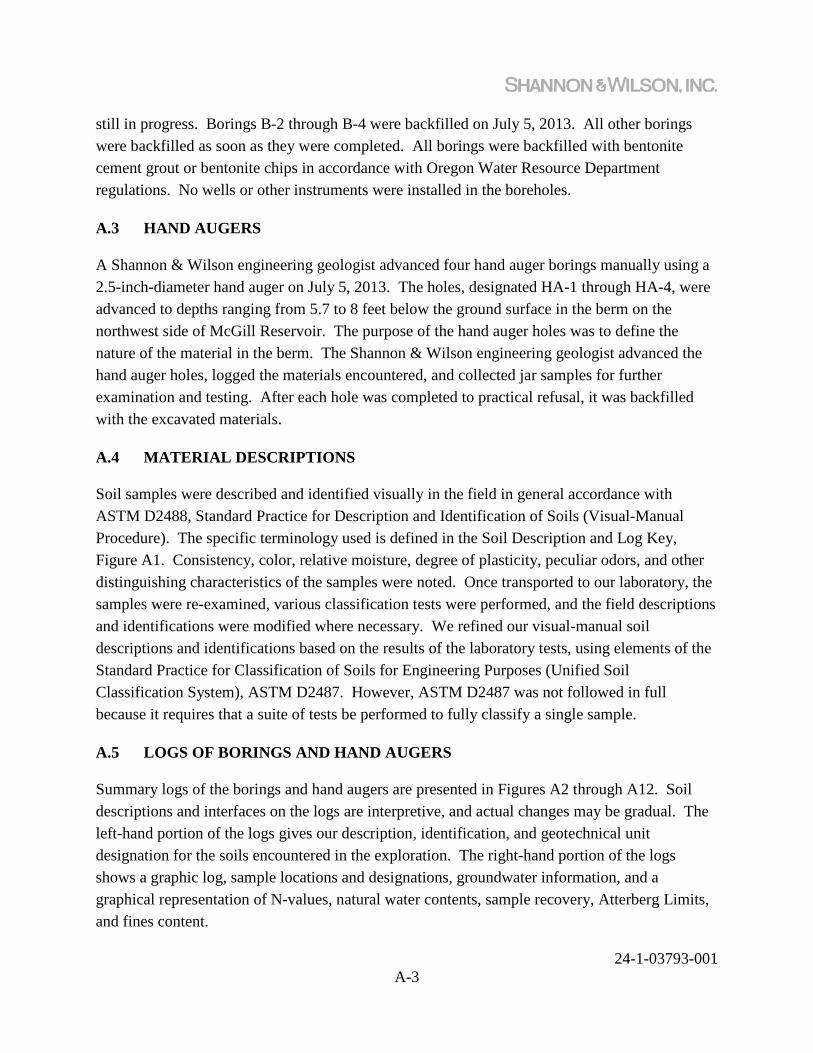
A Shannon & Wilson engineering geologist advanced four hand auger borings manually using a 2.5-inch-diameter hand auger on July 5, 2013. The holes, designated HA-1 through HA-4, were advanced to depths ranging from 5.7 to 8 feet below the ground surface in the berm on the northwest side of McGill Reservoir. The purpose of the hand auger holes was to define the nature of the material in the berm. The Shannon & Wilson engineering geologist advanced the hand auger holes, logged the materials encountered, and collected jar samples for further examination and testing. After each hole was completed to practical refusal, it was backfilled with the excavated materials.
A.4 MATERIAL DESCRIPTIONS
Soil samples were described and identified visually in the field in general accordance with ASTM D2488, Standard Practice for Description and Identification of Soils (Visual-Manual Procedure). The specific terminology used is defined in the Soil Description and Log Key, Figure A1. Consistency, color, relative moisture, degree of plasticity, peculiar odors, and other distinguishing characteristics of the samples were noted. Once transported to our laboratory, the samples were re-examined, various classification tests were performed, and the field descriptions and identifications were modified where necessary. We refined our visual-manual soil descriptions and identifications based on the results of the laboratory tests, using elements of the Standard Practice for Classification of Soils for Engineering Purposes (Unified Soil Classification System), ASTM D2487. However, ASTM D2487 was not followed in full because it requires that a suite of tests be performed to fully classify a single sample.
A.5 LOGS OF BORINGS AND HAND AUGERS
Summary logs of the borings and hand augers are presented in Figures A2 through A12. Soil descriptions and interfaces on the logs are interpretive, and actual changes may be gradual. The left-hand portion of the logs gives our description, identification, and geotechnical unit designation for the soils encountered in the exploration. The right-hand portion of the logs shows a graphic log, sample locations and designations, groundwater information, and a graphical representation of N-values, natural water contents, sample recovery, Atterberg Limits, and fines content.

24-1-03793-001
A-4
A.6 INFILTRATION TESTING
A Shannon & Wilson engineering geologist performed infiltration tests in or adjacent to the locations of borings B-1, B-4, B-5, B-6, and B-7. The tests were conducted through 4.25-inch inside diameter (I.D.) hollow-stem augers used in the geotechnical holes or set within 5 feet of the geotechnical hole locations. The tests were performed in general accordance with the Encased Falling Head Test method, described in the 2008 Portland Stormwater Management Manual, Appendix F2. At each test location, 4.25-inch I.D. hollow-stem auger was advanced to the test depth, and approximately 1 foot of water was added to pre-saturate soil. After the pre-saturation period, multiple tests were conducted by raising the head of water over the soil to approximately 1 foot and periodically measuring the depth to water from the top of the casing. Infiltration Test Results are presented in Table A1.
TABLE A1: INFILTRATION TEST RESULTS
Boring Designation
Depth1 (feet)
Infiltration Rate2 Soil Type
Approximate Fines Content
(percent by dry weight)
Geotechnical Unit4
B-1 4.5 <0.5 in/hr Gravelly Silt with Sand (ML) 70 FILL
B-4 4.6 7 to 9 in/hr Silty Gravel with Sand (GM) 37 (3) CFD-GF
B-5 4.6 <0.5in hr Silt (ML) 90 CFD-FGF
B-5 6.6 15 to 19 in/hr Silty Sand with Gravel (SM) 15 (3) CFD-SF
B-6 4.6 0 in/hr Silt (ML) 90 CFD-FGF
B-6 10.0 23 gal/min Poorly Graded Gravel with Silt and Sand (GP-GM) 10 (3) CFD-GF
B-7 4.0 <0.2 in/hr Silt with Sand to Sandy Silt (ML) 75 CFD-FGF
1Depth in feet below the ground surface at the time the explorations were performed 2Measured infiltration rates for head levels less than 1 foot; in = inches; hr = hour; gal = gallons; min = minute 3Value determined from laboratory testing 4CFD = Catastrophic Flood Deposits; FGF = Fine-grained Facies; SF = Sand Facies; GF = Gravel Facies

September 2013 24-1-03793-001
Gresham Vista Business ParkGresham, Oregon
SHANNON & WILSON, INC.Geotechnical and Environmental Consultants
Absence of moisture, dusty, dryto the touch
Damp but no visible water
Visible free water, from belowwater table
FIG. A1
Shannon & Wilson, Inc. (S&W), uses a soilidentification system modified from the UnifiedSoil Classification System (USCS). Elements ofthe USCS and other definitions are provided onthis and the following pages. Soil descriptionsare based on visual-manual procedures (ASTMD2488) and laboratory testing procedures(ASTM D2487), if performed.
STANDARD PENETRATION TEST (SPT)SPECIFICATIONS
Dry
Moist
Wet
MOISTURE CONTENT TERMS
Modifying(Secondary)
Precedes majorconstituent
Major
MinorFollows major
constituent
1All percentages are by weight of total specimen passing a 3-inch sieve.2The order of terms is: Modifying Major with Minor.3Determined based on behavior.4Determined based on which constituent comprises a larger percentage.5Whichever is the lesser constituent.
COARSE-GRAINEDSOILS
(less than 50% fines)1
PARTICLE SIZE DEFINITIONS
RELATIVE DENSITY / CONSISTENCYSand or Gravel 4
30% or morecoarse-grained:
Sandy or Gravelly 4
More than 12%fine-grained:
Silty or Clayey 3
15% to 30%coarse-grained:with Sand orwith Gravel 4
30% or more totalcoarse-grained and
lesser coarse-grained constituent
is 15% or more:with Sand orwith Gravel 5
Very softSoftMedium stiffStiffVery stiffHard
Very looseLooseMedium denseDenseVery dense
RELATIVEDENSITY
NOTE: Penetration resistances (N-values) shown on boring logs are as recorded in the field and have not been corrected for hammer efficiency, overburden, or other factors.
FINE-GRAINED SOILS(50% or more fines)1
COHESIVE SOILS
< 22 - 44 - 8
8 - 1515 - 30
> 30
1Gravel, sand, and fines estimated by mass. Other constituents, such asorganics, cobbles, and boulders, estimated by volume.
2Reprinted, with permission, from ASTM D2488 - 09a Standard Practice forDescription and Identification of Soils (Visual-Manual Procedure), copyrightASTM International, 100 Barr Harbor Drive, West Conshohocken, PA 19428.A copy of the complete standard may be obtained from ASTM International,www.astm.org.
RELATIVECONSISTENCY
N, SPT,BLOWS/FT.
5% to 12%fine-grained:with Silt orwith Clay 3
15% or more of asecond coarse-
grained constituent:with Sand orwith Gravel 5
< 5%
5 to 10%
15 to 25%
30 to 45%
50 to 100%
Surface CementSeal
Asphalt or Cap
Slough
Inclinometer orNon-perforated Casing
Vibrating WirePiezometer
N, SPT,BLOWS/FT.
< 44 - 10
10 - 3030 - 50
> 50
DESCRIPTION
< #200 (0.075 mm = 0.003 in.)
#200 to #40 (0.075 to 0.4 mm; 0.003 to 0.02 in.)#40 to #10 (0.4 to 2 mm; 0.02 to 0.08 in.)#10 to #4 (2 to 4.75 mm; 0.08 to 0.187 in.)
SIEVE NUMBER AND/OR APPROXIMATE SIZE
#4 to 3/4 in. (4.75 to 19 mm; 0.187 to 0.75 in.)3/4 to 3 in. (19 to 76 mm)
3 to 12 in. (76 to 305 mm)
Hammer:
Sampler:
N-Value:
> 12 in. (305 mm)
FineCoarse
FineMediumCoarse
BOULDERS
COBBLES
GRAVEL
FINES
SAND
Sheet 1 of 3
S&W INORGANIC SOIL CONSTITUENT DEFINITIONS
CONSTITUENT2
SOIL DESCRIPTIONAND LOG KEY
COHESIONLESS SOILS
Silt, Lean Clay,Elastic Silt, or
Fat Clay 3
PERCENTAGES TERMS 1, 2
Trace
Few
Little
Some
Mostly
WELL AND BACKFILL SYMBOLS
BentoniteCement Grout
Bentonite Grout
Bentonite Chips
Silica Sand
Perforated orScreened Casing
140 pounds with a 30-inch free fall.Rope on 6- to 10-inch-diam. cathead2-1/4 rope turns, > 100 rpm
10 to 30 inches longShoe I.D. = 1.375 inchesBarrel I.D. = 1.5 inchesBarrel O.D. = 2 inches
Sum blow counts for second and third6-inch increments.Refusal: 50 blows for 6 inches orless; 10 blows for 0 inches.
2013
_BO
RIN
G_C
LAS
S1
24-
1-03
793.
GP
J S
WN
EW
.GD
T 8
/23
/13

September 2013 24-1-03793-001
Gresham Vista Business ParkGresham, Oregon
GC
SC
Inorganic
Organic
(more than 50%of coarse
fraction retainedon No. 4 sieve)
MAJOR DIVISIONS GROUP/GRAPHICSYMBOL
CH
OH
ML
CL
TYPICAL IDENTIFICATIONS
Gravel
Sand
Silty Sand; Silty Sand with Gravel
Clayey Sand; Clayey Sand with Gravel
Clayey Gravel; Clayey Gravel withSand
Sheet 2 of 3
Gravels
Primarily organic matter, dark incolor, and organic odor
SW
(more than 12%fines)
Silts and Clays
Silts and Clays
(more than 50%retained on No.
200 sieve)
(50% or more ofcoarse fraction
passes the No. 4sieve)
(liquid limit lessthan 50)
(liquid limit 50 ormore)
Organic
Inorganic
FINE-GRAINEDSOILS
SM
Sands
Silty or ClayeyGravel
Silt; Silt with Sand or Gravel; Sandy orGravelly Silt
Organic Silt or Clay; Organic Silt orClay with Sand or Gravel; Sandy orGravelly Organic Silt or Clay
HIGHLY-ORGANIC
SOILS
COARSE-GRAINED
SOILS
OL
(less than 5%fines)
GW
Geotechnical and Environmental ConsultantsSHANNON & WILSON, INC.
(less than 5%fines)
PT
FIG. A1
(more than 12%fines)
MH
SP
GP
GM
Silty orClayey Sand
Silty Gravel; Silty Gravel with Sand
(50% or morepasses the No.
200 sieve)
SOIL DESCRIPTIONAND LOG KEY
Elastic Silt; Elastic Silt with Sand orGravel; Sandy or Gravelly Elastic Silt
Fat Clay; Fat Clay with Sand or Gravel;Sandy or Gravelly Fat Clay
Organic Silt or Clay; Organic Silt orClay with Sand or Gravel; Sandy orGravelly Organic Silt or Clay
Poorly Graded Sand; Poorly GradedSand with Gravel
Well-Graded Sand; Well-Graded Sandwith Gravel
Well-Graded Gravel; Well-GradedGravel with Sand
Poorly Graded Gravel; Poorly GradedGravel with Sand
Lean Clay; Lean Clay with Sand orGravel; Sandy or Gravelly Lean Clay
NOTES
1. Dual symbols (symbols separated by a hyphen, i.e., SP-SM, Sandwith Silt) are used for soils with between 5% and 12% fines or whenthe liquid limit and plasticity index values plot in the CL-ML area ofthe plasticity chart. Graphics shown on the logs for these soil typesare a combination of the two graphic symbols (e.g., SP and SM).
2. Borderline symbols (symbols separated by a slash, i.e., CL/ML,Lean Clay to Silt; SP-SM/SM, Sand with Silt to Silty Sand) indicatethat the soil properties are close to the defining boundary betweentwo groups.
Peat or other highly organic soils (seeASTM D4427)
2013
_BO
RIN
G_C
LAS
S2
24-
1-03
793.
GP
J S
WN
EW
.GD
T 8
/23
/13
NOTE: No. 4 size = 4.75 mm = 0.187 in.; No. 200 size = 0.075 mm = 0.003 in.
UNIFIED SOIL CLASSIFICATION SYSTEM (USCS)(Modified From USACE Tech Memo 3-357, ASTM D2487, and ASTM D2488)

September 2013 24-1-03793-001
Gresham Vista Business ParkGresham, Oregon
SHANNON & WILSON, INC.Geotechnical and Environmental Consultants
FIG. A1Sheet 3 of 3
Interbedded
Laminated
Fissured
Slickensided
Blocky
Lensed
Homogeneous
Alternating layers of varying material or colorwith layers at least 1/4-inch thick; singular: bed.Alternating layers of varying material or colorwith layers less than 1/4-inch thick; singular:lamination.Breaks along definite planes or fractures withlittle resistance.Fracture planes appear polished or glossy;sometimes striated.Cohesive soil that can be broken down intosmall angular lumps that resist furtherbreakdown.Inclusion of small pockets of different soils,such as small lenses of sand scattered througha mass of clay.Same color and appearance throughout.
At Time of DrillingDiameterElevationFeetIron OxideGallonsHorizontalHollow Stem AugerInside DiameterInchesPoundsMagnesium OxideMillimeterManganese OxideNot Applicable or Not AvailableNonplasticOutside DiameterObservation WellPounds per Cubic FootPhoto-Ionization DetectorPressuremeter TestParts per MillionPounds per Square InchPolyvinyl ChlorideRotations per MinuteStandard Penetration TestUnified Soil Classification SystemUnconfined Compressive StrengthVibrating Wire PiezometerVerticalWeight of HammerWeight of RodsWeight
ATDDiam.Elev.
ft.FeOgal.
Horiz.HSAI.D.in.
lbs.MgOmm
MnONANP
O.D.OWpcf
PIDPMTppm
psiPVCrpmSPT
USCSqu
VWPVert.
WOHWOR
Wt.
STRUCTURE TERMS1
SOIL DESCRIPTIONAND LOG KEY
1Reprinted, with permission, from ASTM D2488 - 09a Standard Practice forDescription and Identification of Soils (Visual-Manual Procedure), copyright ASTMInternational, 100 Barr Harbor Drive, West Conshohocken, PA 19428. A copy ofthe complete standard may be obtained from ASTM International, www.astm.org.2Adapted, with permission, from ASTM D2488 - 09a Standard Practice forDescription and Identification of Soils (Visual-Manual Procedure), copyright ASTMInternational, 100 Barr Harbor Drive, West Conshohocken, PA 19428. A copy ofthe complete standard may be obtained from ASTM International, www.astm.org.
ACRONYMS AND ABBREVIATIONSPoorly Graded
Well-Graded
Irregular patches of different colors.
Soil disturbance or mixing by plants oranimals.
Nonsorted sediment; sand and gravelin silt and/or clay matrix.
Material brought to surface by drilling.
Material that caved from sides ofborehole.
Disturbed texture, mix of strengths.
Mottled
Bioturbated
Diamict
Cuttings
Slough
Sheared
DESCRIPTIONNonplastic
Low
Medium
High
ADDITIONAL TERMS
PLASTICITY2
CEMENTATION TERMS1
GRADATION TERMS
APPROX.PLASITICTY
INDEXRANGE
< 4
4 to 10
10 to 20
> 20
PARTICLE ANGULARITY AND SHAPE TERMS1
Angular
Subangular
Subrounded
Rounded
Flat
Elongated
Sharp edges and unpolished planarsurfaces.
Similar to angular, but with roundededges.
Nearly planar sides with well-roundededges.
Smoothly curved sides with no edges.
Width/thickness ratio > 3.
Length/width ratio > 3.
Narrow range of grain sizes presentor, within the range of grain sizespresent, one or more sizes aremissing (Gap Graded). Meets criteriain ASTM D2487, if tested.Full range and even distribution ofgrain sizes present. Meets criteria inASTM D2487, if tested.
Crumbles or breaks with handling orslight finger pressureCrumbles or breaks with considerablefinger pressureWill not crumble or break with fingerpressure
Weak
Moderate
Strong
VISUAL-MANUAL CRITERIAA 1/8-in. thread cannot be rolledat any water content.A thread can barely be rolled anda lump cannot be formed whendrier than the plastic limit.A thread is easy to roll and notmuch time is required to reach theplastic limit. The thread cannot bererolled after reaching the plasticlimit. A lump crumbles when drierthan the plastic limit.It take considerable time rollingand kneading to reach the plasticlimit. A thread can be rerolledseveral times after reaching theplastic limit. A lump can beformed without crumbling whendrier than the plastic limit.
2013
_BO
RIN
G_C
LAS
S3
24-
1-03
793.
GP
J S
WN
EW
.GD
T 8
/23
/13

Stiff to very stiff, dark brown and gray, SiltySand with Gravel to Gravelly Silt with Sand(SM, ML); moist; fine to coarse, rounded tosubrounded gravel; fine to coarse, subroundedto subangular sand; low plasticity; traceorganics; lensed.
FILL
S-4: 3-in. sampler used to obtain more sample,N-value is from SPT S-3.
Pockets of red-yellow Lean Clay (CL); mediumto high plasticity; observed at 8.0 ft.
Medium dense, light gray and brown mottled,Silt (ML); moist; 5-10% fine sand; nonplastic;trace organics; homogenous.
CATASTROPHIC FLOOD DEPOSITSFINE-GRAINED FACIES
Completed - July 2, 2013
*
S-1
S-2
S-3S-4
S-5
S-6
201.015.0
199.516.5
1. Refer to KEY for explanation of symbols, codes, abbreviations and definitions.
2. Groundwater level, if indicated above, is for the date specified and may vary.
3. Group symbol is based on visual-manual identification and selected lab testing.
4. The hole location and elevation should be considered approximate.
16.5 ft.~ 216 ft.NAVD88NAD83
~ 684,077 ft.~ 7,706,924 ft.
~~
Sam
ples
Refer to the report text for a proper understanding of thesubsurface materials and drilling methods. The stratificationlines indicated below represent the approximate boundaries
between soil types, and the transitions may be gradual.
Hammer Wt. & Drop:
8 in.NWJ
AutomaticR
ev:
Log:
AA
H
SHANNON & WILSON, INC.
PENETRATION RESISTANCE, N
5
10
15
20
25
30
REV 3
Hollow Stem AugerWestern StatesCME-75
0
20 40 60 80
100
September 2013 24-1-03793-001
Gro
und
Wat
er Hammer Wt. & Drop:
Geotechnical and Environmental Consultants
Hole Diam.:Rod Type:Hammer Type:
FIG. A2
Typ
: M
AS
Hammer Efficiency = 73%
LEGEND
Sym
bol
Standard Penetration Test
3" O.D. Split Spoon Sample
NOTES
Total Depth:Top Elevation:Vert. Datum:Horiz. Datum:
(blows/ft.)
0 100
140 lbs / 30 inches
Dep
th, f
t.
Drilling Method:Drilling Company:Drill Rig Equipment:Other Comments:
Northing:Easting:Station:Offset:
Sample Not Recovered*
20 40 60 80
LOG OF BORING B-1
SOIL DESCRIPTION
Gresham Vista Business ParkGresham, Oregon
Elev.Depth
(ft.)
MA
ST
ER
_LO
G_E
24-
1-03
793
.GP
J S
HA
N_W
IL.G
DT
8/2
3/13
(<0.075mm)
Liquid LimitPlastic Limit
% Water Content
% Fines
Recovery (%)
21
16
13
8
11
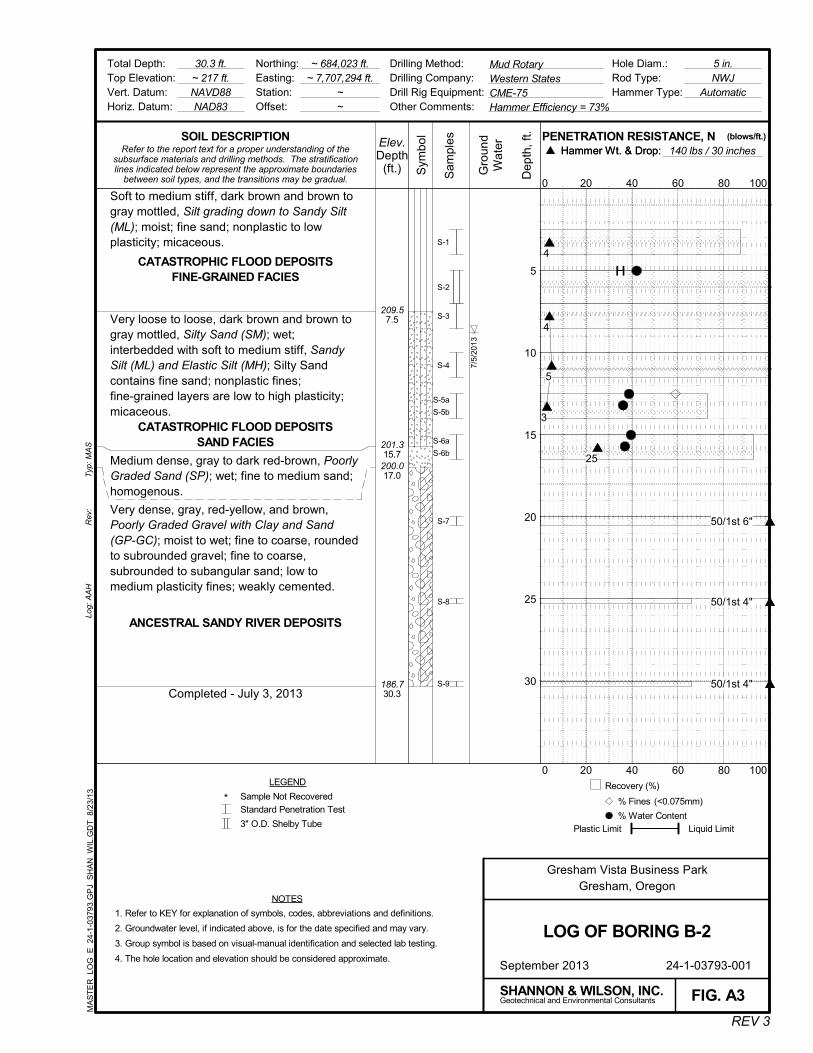
Soft to medium stiff, dark brown and brown togray mottled, Silt grading down to Sandy Silt(ML); moist; fine sand; nonplastic to lowplasticity; micaceous.
CATASTROPHIC FLOOD DEPOSITSFINE-GRAINED FACIES
Very loose to loose, dark brown and brown togray mottled, Silty Sand (SM); wet;interbedded with soft to medium stiff, SandySilt (ML) and Elastic Silt (MH); Silty Sandcontains fine sand; nonplastic fines;fine-grained layers are low to high plasticity;micaceous.
CATASTROPHIC FLOOD DEPOSITSSAND FACIES
Medium dense, gray to dark red-brown, PoorlyGraded Sand (SP); wet; fine to medium sand;homogenous.
Very dense, gray, red-yellow, and brown,Poorly Graded Gravel with Clay and Sand(GP-GC); moist to wet; fine to coarse, roundedto subrounded gravel; fine to coarse,subrounded to subangular sand; low tomedium plasticity fines; weakly cemented.
ANCESTRAL SANDY RIVER DEPOSITS
Completed - July 3, 2013
7/5/
2013
S-1
S-2
S-3
S-4
S-5a
S-5b
S-6a
S-6b
S-7
S-8
S-9
209.57.5
201.315.7
200.017.0
186.730.3
1. Refer to KEY for explanation of symbols, codes, abbreviations and definitions.
2. Groundwater level, if indicated above, is for the date specified and may vary.
3. Group symbol is based on visual-manual identification and selected lab testing.
4. The hole location and elevation should be considered approximate.
30.3 ft.~ 217 ft.NAVD88NAD83
~ 684,023 ft.~ 7,707,294 ft.
~~
Sam
ples
Refer to the report text for a proper understanding of thesubsurface materials and drilling methods. The stratificationlines indicated below represent the approximate boundaries
between soil types, and the transitions may be gradual.
Hammer Wt. & Drop:
5 in.NWJ
AutomaticR
ev:
Log:
AA
H
SHANNON & WILSON, INC.
PENETRATION RESISTANCE, N
5
10
15
20
25
30
REV 3
Mud RotaryWestern StatesCME-75
0
20 40 60 80
100
September 2013 24-1-03793-001
Gro
und
Wat
er Hammer Wt. & Drop:
Geotechnical and Environmental Consultants
Hole Diam.:Rod Type:Hammer Type:
FIG. A3
Typ
: M
AS
Hammer Efficiency = 73%
LEGEND
Sym
bol
Standard Penetration Test
3" O.D. Shelby Tube
NOTES
Total Depth:Top Elevation:Vert. Datum:Horiz. Datum:
(blows/ft.)
0 100
140 lbs / 30 inches
Dep
th, f
t.
Drilling Method:Drilling Company:Drill Rig Equipment:Other Comments:
Northing:Easting:Station:Offset:
Sample Not Recovered*
20 40 60 80
LOG OF BORING B-2
SOIL DESCRIPTION
Gresham Vista Business ParkGresham, Oregon
Elev.Depth
(ft.)
MA
ST
ER
_LO
G_E
24-
1-03
793
.GP
J S
HA
N_W
IL.G
DT
8/2
3/13
(<0.075mm)
Liquid LimitPlastic Limit
% Water Content
% Fines
Recovery (%)
4
4
5
3
25
50/1st 6"
50/1st 4"
50/1st 4"

Soft, dark brown, Silt with Sand (ML); moist;fine sand; nonplastic to low plasticity; tracecharcoal; disturbed texture.
FILL
Medium dense to dense, dark brown, gray,and red-brown, Silty Sand (SM); moist; 5-10%fine to coarse, subrounded to subangulargravel; fine to medium, subrounded tosubangular sand; nonplastic to low plasticityfines.
CATASTROPHIC FLOOD DEPOSITSSAND FACIES
Very dense, dark brown and gray, PoorlyGraded Gravel with Silt and Sand and Cobbles(GP-GM); moist; few subrounded cobbles upto 8-in.-diam., some predominantlydecomposed; fine to coarse, subrounded tosubangular gravel, some predominantlydecomposed; fine to medium sand; nonplasticto low plasticity fines.
CATASTROPHIC FLOOD DEPOSITSGRAVEL FACIES
Dense to very dense, gray, yellow, red-yellow,and brown, Poorly Graded Gravel with Clayand Sand to Clayey Gravel with Sand andCobbles (GP-GC, GC); moist; few subroundedcobbles up to 8-in.-diam.; fine to coarse,rounded to subangular gravel, somepredominantly decomposed; fine to coarse,subrounded to subangular sand; mediumplasticity fines; weakly cemented.
Slight drilling mud loss near 15.0 ft.Lost ~50 gal. of mud at 22.0 ft.
ANCESTRAL SANDY RIVER DEPOSITS
*
S-1
S-2
S-3
S-4
S-5
S-6
S-7
S-8
S-9
286.25.8
282.010.0
277.015.0
1. Refer to KEY for explanation of symbols, codes, abbreviations and definitions.
2. Groundwater level, if indicated above, is for the date specified and may vary.
3. Group symbol is based on visual-manual identification and selected lab testing.
4. The hole location and elevation should be considered approximate.
70.4 ft.~ 292 ft.NAVD88NAD83
~ 683,601 ft.~ 7,707,594 ft.
~~
Sam
ples
Refer to the report text for a proper understanding of thesubsurface materials and drilling methods. The stratificationlines indicated below represent the approximate boundaries
between soil types, and the transitions may be gradual.
Hammer Wt. & Drop:
5 in.NWJ
AutomaticR
ev:
Log:
AA
H
SHANNON & WILSON, INC.
PENETRATION RESISTANCE, N
5
10
15
20
25
30
REV 3
Mud RotaryWestern StatesCME-75
0
20 40 60 80
100
September 2013 24-1-03793-001
Gro
und
Wat
er Hammer Wt. & Drop:
Geotechnical and Environmental Consultants
Hole Diam.:Rod Type:Hammer Type:
FIG. A4
Typ
: M
AS
CONTINUED NEXT SHEET
Hammer Efficiency = 73%
LEGEND
Sym
bol
Standard Penetration Test
NOTES
Total Depth:Top Elevation:Vert. Datum:Horiz. Datum:
(blows/ft.)
0 100
Sheet 1 of 3
140 lbs / 30 inches
Dep
th, f
t.
Drilling Method:Drilling Company:Drill Rig Equipment:Other Comments:
Northing:Easting:Station:Offset:
Sample Not Recovered*
20 40 60 80
LOG OF BORING B-3
SOIL DESCRIPTION
Gresham Vista Business ParkGresham, Oregon
Elev.Depth
(ft.)
MA
ST
ER
_LO
G_E
24-
1-03
793
.GP
J S
HA
N_W
IL.G
DT
8/2
3/13
Liquid LimitPlastic Limit
% Water Content
Recovery (%)
3
9
35
50/1st 4"
50/4"
50/3"
48
98/10"
99

Dense to very dense, gray, yellow, red-yellow,and brown, Clayey Gravel with Sand andCobbles (GC); moist; few subrounded cobblesup to 8-in.-diam.; fine to coarse, rounded tosubangular gravel, some predominantlydecomposed; fine to coarse, subrounded tosubangular sand; medium plasticity fines;weakly cemented.
Hard drilling at 50.0 ft.
ANCESTRAL SANDY RIVER DEPOSITS
*
*
S-10
S-11
S-12
S-11
S-14
S-15
S-16
257.035.0
1. Refer to KEY for explanation of symbols, codes, abbreviations and definitions.
2. Groundwater level, if indicated above, is for the date specified and may vary.
3. Group symbol is based on visual-manual identification and selected lab testing.
4. The hole location and elevation should be considered approximate.
70.4 ft.~ 292 ft.NAVD88NAD83
~ 683,601 ft.~ 7,707,594 ft.
~~
Sam
ples
Refer to the report text for a proper understanding of thesubsurface materials and drilling methods. The stratificationlines indicated below represent the approximate boundaries
between soil types, and the transitions may be gradual.
Hammer Wt. & Drop:
5 in.NWJ
AutomaticR
ev:
Log:
AA
H
SHANNON & WILSON, INC.
PENETRATION RESISTANCE, N
40
45
50
55
60
65
REV 3
Mud RotaryWestern StatesCME-75
0
20 40 60 80
100
September 2013 24-1-03793-001
Gro
und
Wat
er Hammer Wt. & Drop:
Geotechnical and Environmental Consultants
Hole Diam.:Rod Type:Hammer Type:
FIG. A4
Typ
: M
AS
CONTINUED NEXT SHEET
Hammer Efficiency = 73%
LEGEND
Sym
bol
Standard Penetration Test
NOTES
Total Depth:Top Elevation:Vert. Datum:Horiz. Datum:
(blows/ft.)
0 100
Sheet 2 of 3
140 lbs / 30 inches
Dep
th, f
t.
Drilling Method:Drilling Company:Drill Rig Equipment:Other Comments:
Northing:Easting:Station:Offset:
Sample Not Recovered*
20 40 60 80
LOG OF BORING B-3
SOIL DESCRIPTION
Gresham Vista Business ParkGresham, Oregon
Elev.Depth
(ft.)
MA
ST
ER
_LO
G_E
24-
1-03
793
.GP
J S
HA
N_W
IL.G
DT
8/2
3/13
Liquid LimitPlastic Limit
% Water Content
Recovery (%)
50
47
50/1st 6"
50/1st 2"
99/11"
50/1st 3"
64
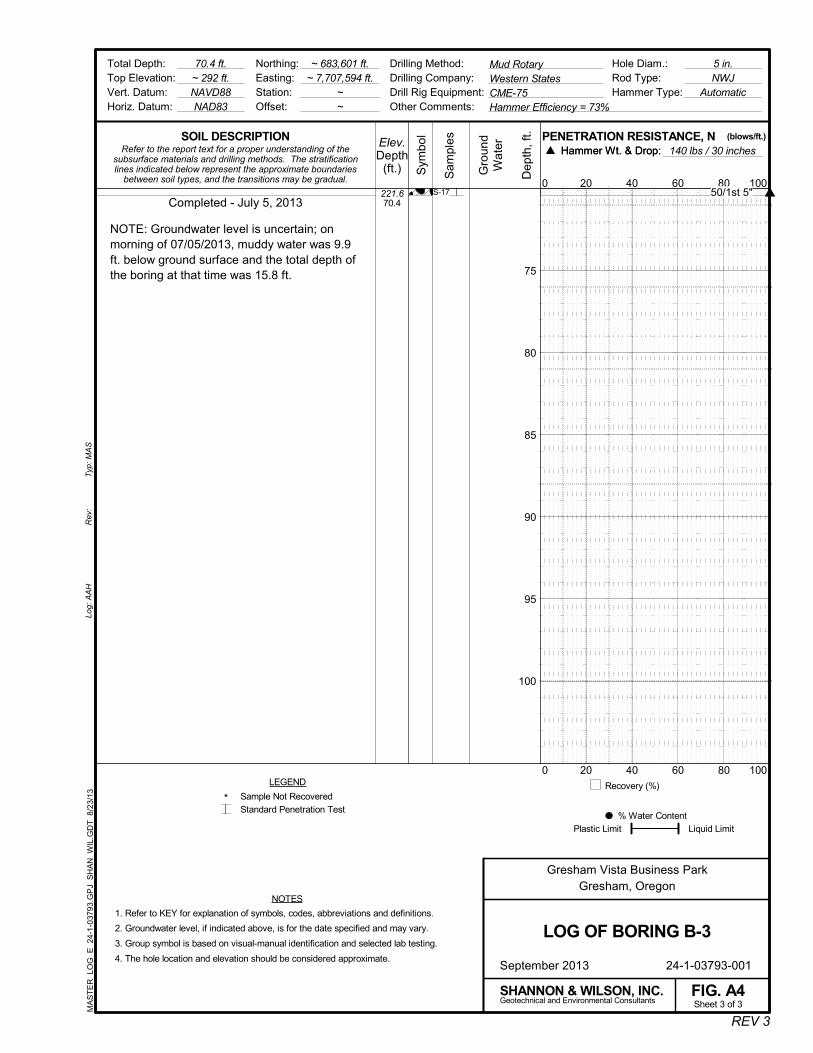
Completed - July 5, 2013
NOTE: Groundwater level is uncertain; onmorning of 07/05/2013, muddy water was 9.9ft. below ground surface and the total depth ofthe boring at that time was 15.8 ft.
S-17221.670.4
1. Refer to KEY for explanation of symbols, codes, abbreviations and definitions.
2. Groundwater level, if indicated above, is for the date specified and may vary.
3. Group symbol is based on visual-manual identification and selected lab testing.
4. The hole location and elevation should be considered approximate.
70.4 ft.~ 292 ft.NAVD88NAD83
~ 683,601 ft.~ 7,707,594 ft.
~~
Sam
ples
Refer to the report text for a proper understanding of thesubsurface materials and drilling methods. The stratificationlines indicated below represent the approximate boundaries
between soil types, and the transitions may be gradual.
Hammer Wt. & Drop:
5 in.NWJ
AutomaticR
ev:
Log:
AA
H
SHANNON & WILSON, INC.
PENETRATION RESISTANCE, N
75
80
85
90
95
100
REV 3
Mud RotaryWestern StatesCME-75
0
20 40 60 80
100
September 2013 24-1-03793-001
Gro
und
Wat
er Hammer Wt. & Drop:
Geotechnical and Environmental Consultants
Hole Diam.:Rod Type:Hammer Type:
FIG. A4
Typ
: M
AS
Hammer Efficiency = 73%
LEGEND
Sym
bol
Standard Penetration Test
NOTES
Total Depth:Top Elevation:Vert. Datum:Horiz. Datum:
(blows/ft.)
0 100
Sheet 3 of 3
140 lbs / 30 inches
Dep
th, f
t.
Drilling Method:Drilling Company:Drill Rig Equipment:Other Comments:
Northing:Easting:Station:Offset:
Sample Not Recovered*
20 40 60 80
LOG OF BORING B-3
SOIL DESCRIPTION
Gresham Vista Business ParkGresham, Oregon
Elev.Depth
(ft.)
MA
ST
ER
_LO
G_E
24-
1-03
793
.GP
J S
HA
N_W
IL.G
DT
8/2
3/13
Liquid LimitPlastic Limit
% Water Content
Recovery (%)
50/1st 5"

Medium dense, dark brown, red-brown,red-yellow, and gray, Silty Sand with Gravel toSilty Gravel with Sand (GM); moist; fine tocoarse, subrounded to subangular gravel,some predominantly decomposed; fine tocoarse, subrounded to subangular sand; low tomedium plasticity fines.
CATASTROPHIC FLOOD DEPOSITSGRAVEL FACIES
Stiff to very stiff, light gray and brown mottled,Lean Clay (CL); moist; trace fine to coarse,subangular sand; low to medium plasticity.
ANCESTRAL SANDY RIVER DEPOSITS
Dense, dark brown, red, and gray, Silty Sandwith Gravel (SM); moist; fine to coarse,subrounded to subangular gravel, somepredominantly decomposed; fine to medium,subrounded to subangular sand; low plasticityfines.S-8: 3-in. sampler used to obtain more sample,
N-value is from SPT S-7.
Very dense, dark brown, red, yellow, andgreen, Clayey Gravel with Sand (GC); moist;fine to coarse, rounded to subrounded gravel;fine to coarse, subrounded to subangularsand; low to medium plasticity fines.
Very stiff, dark brown, Lean Clay (CL); moist;trace fine gravel; trace fine to coarse,subrounded to subangular sand; gravel andsand weathered; low plasticity.
Dense to very dense, gray, dark brown, red,and yellow, Clayey Gravel with Sand andCobbles (GC); moist; trace subroundedcobbles up to 6-in.-diam.; fine to coarse,rounded to subangular gravel, some
7/5/
2013
S-1
S-2
S-3
S-4
S-5
S-6
S-7S-8
S-9
S-10
304.010.0
301.013.0
294.020.0
291.522.5
286.028.0
1. Refer to KEY for explanation of symbols, codes, abbreviations and definitions.
2. Groundwater level, if indicated above, is for the date specified and may vary.
3. Group symbol is based on visual-manual identification and selected lab testing.
4. The hole location and elevation should be considered approximate.
41.5 ft.~ 314 ft.NAVD88NAD83
~ 683,115 ft.~ 7,707,481 ft.
~~
Sam
ples
Refer to the report text for a proper understanding of thesubsurface materials and drilling methods. The stratificationlines indicated below represent the approximate boundaries
between soil types, and the transitions may be gradual.
Hammer Wt. & Drop:
5 in.NWJ
AutomaticR
ev:
Log:
AA
H
SHANNON & WILSON, INC.
PENETRATION RESISTANCE, N
5
10
15
20
25
30
REV 3
Mud RotaryWestern StatesCME-75
0
20 40 60 80
100
September 2013 24-1-03793-001
Gro
und
Wat
er Hammer Wt. & Drop:
Geotechnical and Environmental Consultants
Hole Diam.:Rod Type:Hammer Type:
FIG. A5
Typ
: M
AS
CONTINUED NEXT SHEET
Hammer Efficiency = 73%
LEGEND
Sym
bol
Standard Penetration Test
3" O.D. Split Spoon Sample
NOTES
Total Depth:Top Elevation:Vert. Datum:Horiz. Datum:
(blows/ft.)
0 100
Sheet 1 of 2
140 lbs / 30 inches
Dep
th, f
t.
Drilling Method:Drilling Company:Drill Rig Equipment:Other Comments:
Northing:Easting:Station:Offset:
Sample Not Recovered*
20 40 60 80
LOG OF BORING B-4
SOIL DESCRIPTION
Gresham Vista Business ParkGresham, Oregon
Elev.Depth
(ft.)
MA
ST
ER
_LO
G_E
24-
1-03
793
.GP
J S
HA
N_W
IL.G
DT
8/2
3/13
(<0.075mm)
Liquid LimitPlastic Limit
% Water Content
% Fines
Recovery (%)
25
18
23
15
27
42
50/1st 4"
19
31
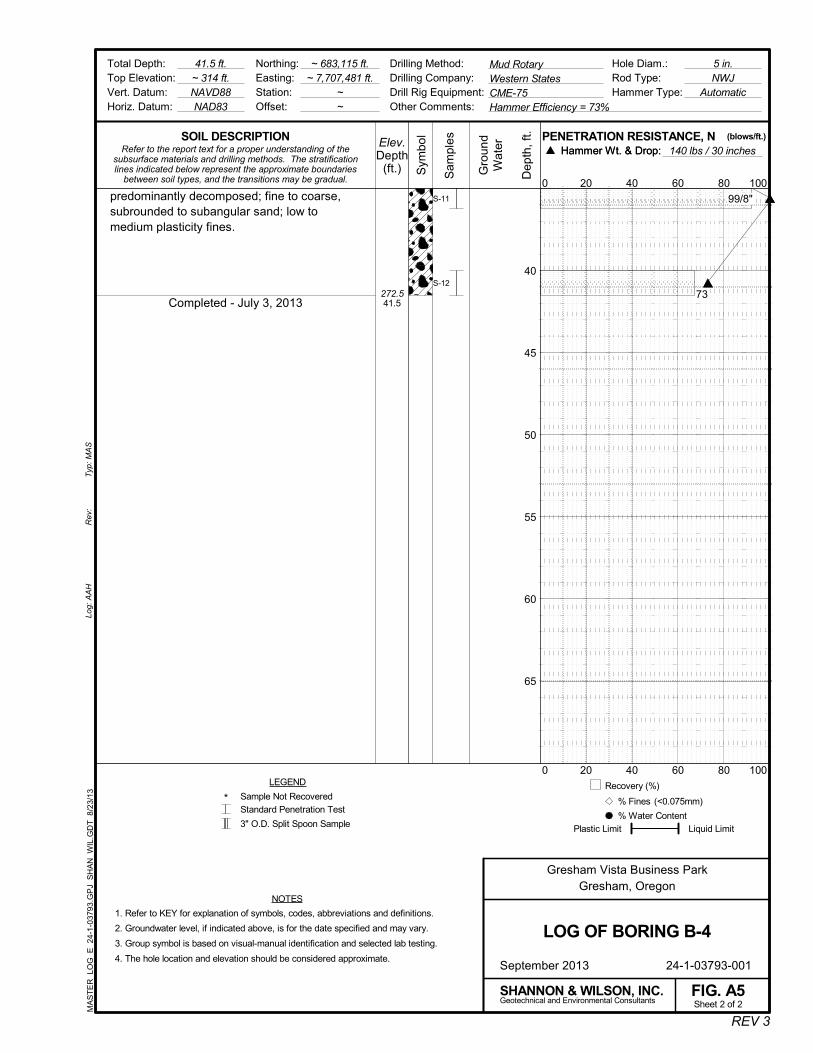
predominantly decomposed; fine to coarse,subrounded to subangular sand; low tomedium plasticity fines.
Completed - July 3, 2013
S-11
S-12272.541.5
1. Refer to KEY for explanation of symbols, codes, abbreviations and definitions.
2. Groundwater level, if indicated above, is for the date specified and may vary.
3. Group symbol is based on visual-manual identification and selected lab testing.
4. The hole location and elevation should be considered approximate.
41.5 ft.~ 314 ft.NAVD88NAD83
~ 683,115 ft.~ 7,707,481 ft.
~~
Sam
ples
Refer to the report text for a proper understanding of thesubsurface materials and drilling methods. The stratificationlines indicated below represent the approximate boundaries
between soil types, and the transitions may be gradual.
Hammer Wt. & Drop:
5 in.NWJ
AutomaticR
ev:
Log:
AA
H
SHANNON & WILSON, INC.
PENETRATION RESISTANCE, N
40
45
50
55
60
65
REV 3
Mud RotaryWestern StatesCME-75
0
20 40 60 80
100
September 2013 24-1-03793-001
Gro
und
Wat
er Hammer Wt. & Drop:
Geotechnical and Environmental Consultants
Hole Diam.:Rod Type:Hammer Type:
FIG. A5
Typ
: M
AS
Hammer Efficiency = 73%
LEGEND
Sym
bol
Standard Penetration Test
3" O.D. Split Spoon Sample
NOTES
Total Depth:Top Elevation:Vert. Datum:Horiz. Datum:
(blows/ft.)
0 100
Sheet 2 of 2
140 lbs / 30 inches
Dep
th, f
t.
Drilling Method:Drilling Company:Drill Rig Equipment:Other Comments:
Northing:Easting:Station:Offset:
Sample Not Recovered*
20 40 60 80
LOG OF BORING B-4
SOIL DESCRIPTION
Gresham Vista Business ParkGresham, Oregon
Elev.Depth
(ft.)
MA
ST
ER
_LO
G_E
24-
1-03
793
.GP
J S
HA
N_W
IL.G
DT
8/2
3/13
(<0.075mm)
Liquid LimitPlastic Limit
% Water Content
% Fines
Recovery (%)
99/8"
73

Loose, dark brown, Silt (ML); moist; 5-10%fine sand; nonplastic fines; trace organics;micaceous.
CATASTROPHIC FLOOD DEPOSITSFINE-GRAINED FACIES
Dense to very dense, dark brown to gray, SiltySand with Gravel (SM); moist; fine to coarse,subrounded to subangular gravel; medium tocoarse, subrounded to subangular sand;nonplastic to low plasticity fines.
CATASTROPHIC FLOOD DEPOSITSSAND FACIES
Dense, dark brown, gray, red, and yellow,Clayey Gravel with Sand (GC); moist; fine tocoarse, subrounded to subangular gravel;medium, subrounded to subangular sand;medium plasticity fines.
ANCESTRAL SANDY RIVER DEPOSITS
Completed - July 2, 2013
S-1
S-2a
S-2b
S-3
S-4
310.05.0
306.09.0
303.511.5
1. Refer to KEY for explanation of symbols, codes, abbreviations and definitions.
2. Groundwater level, if indicated above, is for the date specified and may vary.
3. Group symbol is based on visual-manual identification and selected lab testing.
4. The hole location and elevation should be considered approximate.
11.5 ft.~ 315 ft.NAVD88NAD83
~ 682,455 ft.~ 7,706,629 ft.
~~
Sam
ples
Refer to the report text for a proper understanding of thesubsurface materials and drilling methods. The stratificationlines indicated below represent the approximate boundaries
between soil types, and the transitions may be gradual.
Hammer Wt. & Drop:
8 in.NWJ
AutomaticR
ev:
Log:
AA
H
SHANNON & WILSON, INC.
PENETRATION RESISTANCE, N
5
10
15
20
25
30
REV 3
Hollow Stem AugerWestern StatesCME-75
0
20 40 60 80
100
September 2013 24-1-03793-001
Gro
und
Wat
er Hammer Wt. & Drop:
Geotechnical and Environmental Consultants
Hole Diam.:Rod Type:Hammer Type:
FIG. A6
Typ
: M
AS
Hammer Efficiency = 73%
LEGEND
Sym
bol
Standard Penetration Test
3" O.D. Split Spoon Sample
NOTES
Total Depth:Top Elevation:Vert. Datum:Horiz. Datum:
(blows/ft.)
0 100
140 lbs / 30 inches
Dep
th, f
t.
Drilling Method:Drilling Company:Drill Rig Equipment:Other Comments:
Northing:Easting:Station:Offset:
Sample Not Recovered*
20 40 60 80
LOG OF BORING B-5
SOIL DESCRIPTION
Gresham Vista Business ParkGresham, Oregon
Elev.Depth
(ft.)
MA
ST
ER
_LO
G_E
24-
1-03
793
.GP
J S
HA
N_W
IL.G
DT
8/2
3/13
(<0.075mm)
Liquid LimitPlastic Limit
% Water Content
% Fines
Recovery (%)
5
59
37
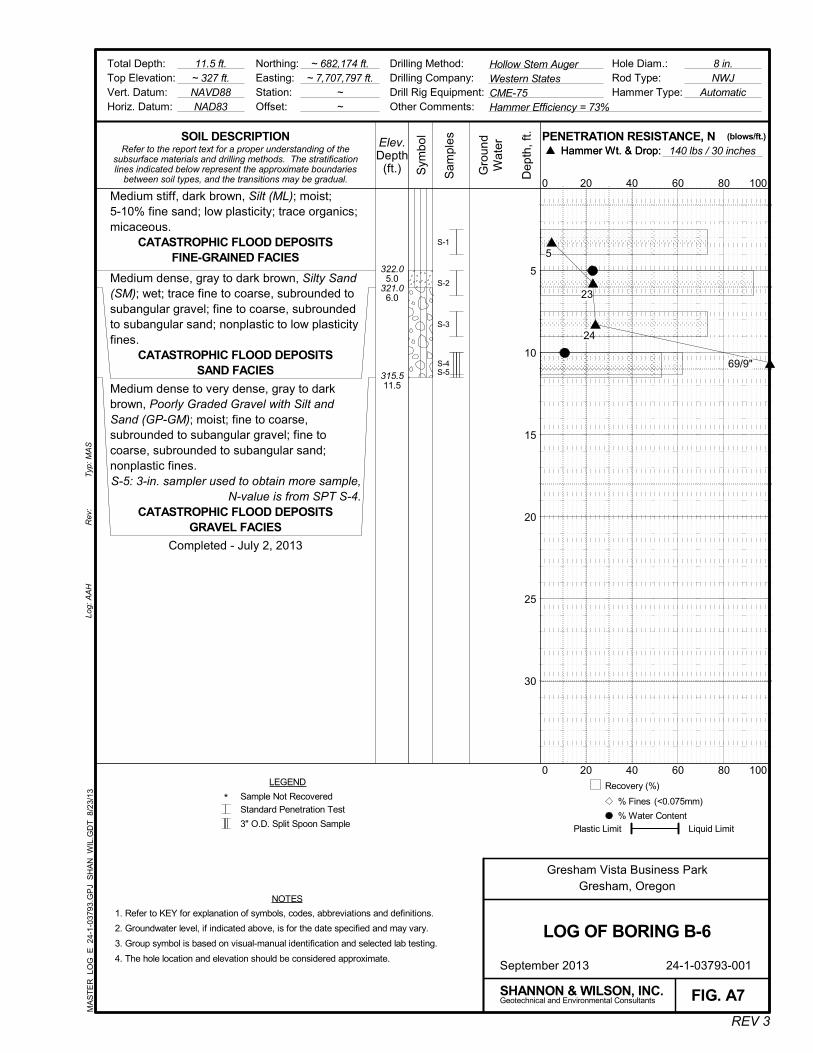
Medium stiff, dark brown, Silt (ML); moist;5-10% fine sand; low plasticity; trace organics;micaceous.
CATASTROPHIC FLOOD DEPOSITSFINE-GRAINED FACIES
Medium dense, gray to dark brown, Silty Sand(SM); wet; trace fine to coarse, subrounded tosubangular gravel; fine to coarse, subroundedto subangular sand; nonplastic to low plasticityfines.
CATASTROPHIC FLOOD DEPOSITSSAND FACIES
Medium dense to very dense, gray to darkbrown, Poorly Graded Gravel with Silt andSand (GP-GM); moist; fine to coarse,subrounded to subangular gravel; fine tocoarse, subrounded to subangular sand;nonplastic fines.S-5: 3-in. sampler used to obtain more sample,
N-value is from SPT S-4.CATASTROPHIC FLOOD DEPOSITS
GRAVEL FACIES
Completed - July 2, 2013
S-1
S-2
S-3
S-4S-5
322.05.0
321.06.0
315.511.5
1. Refer to KEY for explanation of symbols, codes, abbreviations and definitions.
2. Groundwater level, if indicated above, is for the date specified and may vary.
3. Group symbol is based on visual-manual identification and selected lab testing.
4. The hole location and elevation should be considered approximate.
11.5 ft.~ 327 ft.NAVD88NAD83
~ 682,174 ft.~ 7,707,797 ft.
~~
Sam
ples
Refer to the report text for a proper understanding of thesubsurface materials and drilling methods. The stratificationlines indicated below represent the approximate boundaries
between soil types, and the transitions may be gradual.
Hammer Wt. & Drop:
8 in.NWJ
AutomaticR
ev:
Log:
AA
H
SHANNON & WILSON, INC.
PENETRATION RESISTANCE, N
5
10
15
20
25
30
REV 3
Hollow Stem AugerWestern StatesCME-75
0
20 40 60 80
100
September 2013 24-1-03793-001
Gro
und
Wat
er Hammer Wt. & Drop:
Geotechnical and Environmental Consultants
Hole Diam.:Rod Type:Hammer Type:
FIG. A7
Typ
: M
AS
Hammer Efficiency = 73%
LEGEND
Sym
bol
Standard Penetration Test
3" O.D. Split Spoon Sample
NOTES
Total Depth:Top Elevation:Vert. Datum:Horiz. Datum:
(blows/ft.)
0 100
140 lbs / 30 inches
Dep
th, f
t.
Drilling Method:Drilling Company:Drill Rig Equipment:Other Comments:
Northing:Easting:Station:Offset:
Sample Not Recovered*
20 40 60 80
LOG OF BORING B-6
SOIL DESCRIPTION
Gresham Vista Business ParkGresham, Oregon
Elev.Depth
(ft.)
MA
ST
ER
_LO
G_E
24-
1-03
793
.GP
J S
HA
N_W
IL.G
DT
8/2
3/13
(<0.075mm)
Liquid LimitPlastic Limit
% Water Content
% Fines
Recovery (%)
5
23
24
69/9"

Soft, dark brown, Silt with Sand to Sandy Silt(ML); moist; fine sand; nonplastic to lowplasticity; trace organics.
CATASTROPHIC FLOOD DEPOSITSFINE-GRAINED FACIES
Medium dense, dark brown, Silty Sand withGravel (SM); moist; fine, subrounded tosubangular gravel; fine to medium,subrounded to subangular sand; nonplasticfines.
CATASTROPHIC FLOOD DEPOSITSSAND FACIES
Dense to very dense, gray and dark brown,Silty Gravel with Sand and Cobbles (GM);moist; few subrounded cobbles; fine to coarse,subrounded to subangular gravel; fine tomedium, subrounded to subangular sand;nonplastic fines.
CATASTROPHIC FLOOD DEPOSITSGRAVEL FACIES
Completed - July 2, 2013
Auger refusal on cobble or boulder at 9.0 ft.
S-1
S-2
S-3
S-4
327.85.2
326.07.0
323.79.3
1. Refer to KEY for explanation of symbols, codes, abbreviations and definitions.
2. Groundwater level, if indicated above, is for the date specified and may vary.
3. Group symbol is based on visual-manual identification and selected lab testing.
4. The hole location and elevation should be considered approximate.
9.3 ft.~ 333 ft.NAVD88NAD83
~ 681,872 ft.~ 7,708,189 ft.
~~
Sam
ples
Refer to the report text for a proper understanding of thesubsurface materials and drilling methods. The stratificationlines indicated below represent the approximate boundaries
between soil types, and the transitions may be gradual.
Hammer Wt. & Drop:
8 in.NWJ
AutomaticR
ev:
Log:
AA
H
SHANNON & WILSON, INC.
PENETRATION RESISTANCE, N
5
10
15
20
25
30
REV 3
Hollow Stem AugerWestern StatesCME-75
0
20 40 60 80
100
September 2013 24-1-03793-001
Gro
und
Wat
er Hammer Wt. & Drop:
Geotechnical and Environmental Consultants
Hole Diam.:Rod Type:Hammer Type:
FIG. A8
Typ
: M
AS
Hammer Efficiency = 73%
LEGEND
Sym
bol
Standard Penetration Test
NOTES
Total Depth:Top Elevation:Vert. Datum:Horiz. Datum:
(blows/ft.)
0 100
140 lbs / 30 inches
Dep
th, f
t.
Drilling Method:Drilling Company:Drill Rig Equipment:Other Comments:
Northing:Easting:Station:Offset:
Sample Not Recovered*
20 40 60 80
LOG OF BORING B-7
SOIL DESCRIPTION
Gresham Vista Business ParkGresham, Oregon
Elev.Depth
(ft.)
MA
ST
ER
_LO
G_E
24-
1-03
793
.GP
J S
HA
N_W
IL.G
DT
8/2
3/13
(<0.075mm)
Liquid LimitPlastic Limit
% Water Content
% Fines
Recovery (%)
2
11
34 50/1st 3"

Dark brown, Silt with Sand (ML); moist; finesand; low plasticity; trace organics; micaceous.
FILL
Gray to brown, Silt with Sand (ML); moist towet; fine sand; low plasticity; organic odor.
CATASTROPHIC FLOOD DEPOSITSFINE-GRAINED FACIES
Completed - July 5, 2013
Dur
ing
Dril
ling
S-1
S-2
206.05.0
203.08.0
1. Refer to KEY for explanation of symbols, codes, abbreviations and definitions.
2. Groundwater level, if indicated above, is for the date specified and may vary.
3. Group symbol is based on visual-manual identification and selected lab testing.
4. The hole location and elevation should be considered approximate.
8 ft.~ 211 ft.NAVD88NAD83
~ 684,012 ft.~ 7,707,101 ft.
~~
Sam
ples
Refer to the report text for a proper understanding of thesubsurface materials and drilling methods. The stratificationlines indicated below represent the approximate boundaries
between soil types, and the transitions may be gradual.
Hammer Wt. & Drop:
2.5 in.N/AN/A
Rev
:Lo
g: A
AH
SHANNON & WILSON, INC.
PENETRATION RESISTANCE, N
5
REV 3
hand augerShannon & Wilson, Inc.hand auger
0
20 40 60 80
100
September 2013 24-1-03793-001
Gro
und
Wat
er Hammer Wt. & Drop:
Geotechnical and Environmental Consultants
Hole Diam.:Rod Type:Hammer Type:
FIG. A9
Typ
: M
AS
LEGEND
Sym
bol
Jar Sample
NOTES
Total Depth:Top Elevation:Vert. Datum:Horiz. Datum:
(blows/ft.)
0 100
140 lbs / 30 inches
Dep
th, f
t.
Drilling Method:Drilling Company:Drill Rig Equipment:Other Comments:
Northing:Easting:Station:Offset:
Groundwater LevelSample Not Recovered*
20 40 60 80
LOG OF HAND AUGER HA-1
SOIL DESCRIPTION
Gresham Vista Business ParkGresham, Oregon
Elev.Depth
(ft.)
MA
ST
ER
_LO
G_E
24-
1-03
793
.GP
J S
HA
N_W
IL.G
DT
8/2
3/13
Liquid LimitNatural Water Content
Plastic Limit
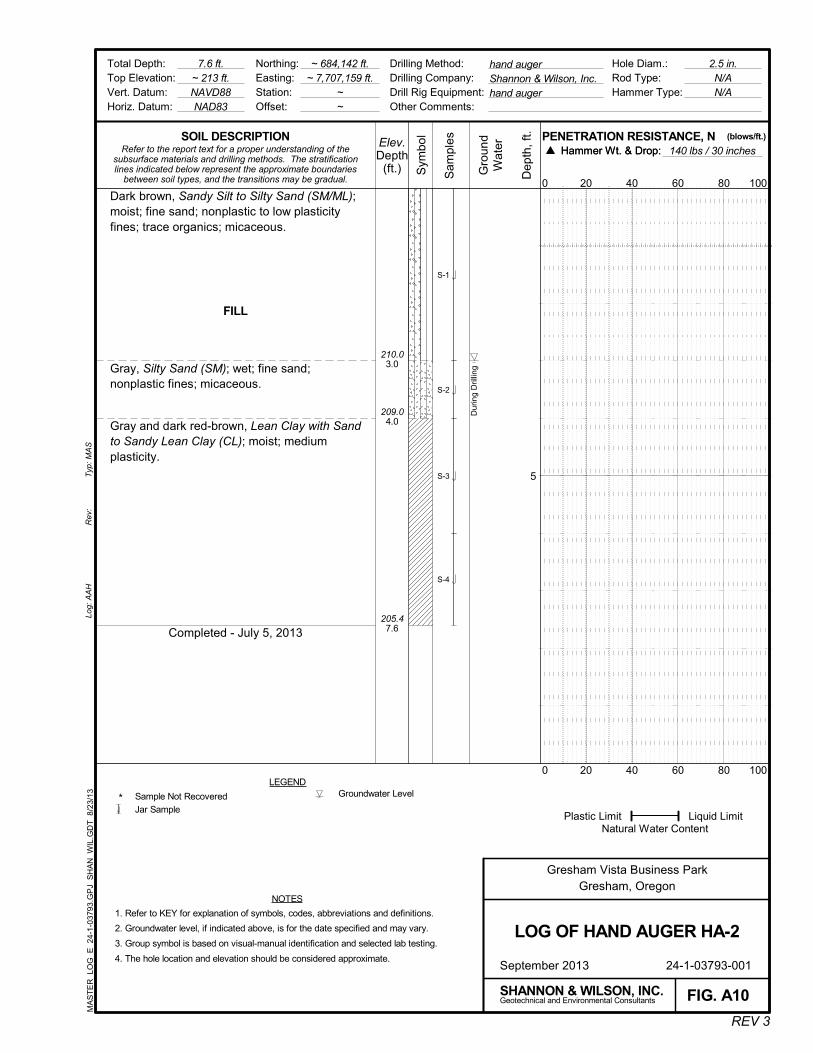
Dark brown, Sandy Silt to Silty Sand (SM/ML);moist; fine sand; nonplastic to low plasticityfines; trace organics; micaceous.
FILL
Gray, Silty Sand (SM); wet; fine sand;nonplastic fines; micaceous.
Gray and dark red-brown, Lean Clay with Sandto Sandy Lean Clay (CL); moist; mediumplasticity.
Completed - July 5, 2013
Dur
ing
Dril
ling
S-1
S-2
S-3
S-4
210.03.0
209.04.0
205.47.6
1. Refer to KEY for explanation of symbols, codes, abbreviations and definitions.
2. Groundwater level, if indicated above, is for the date specified and may vary.
3. Group symbol is based on visual-manual identification and selected lab testing.
4. The hole location and elevation should be considered approximate.
7.6 ft.~ 213 ft.NAVD88NAD83
~ 684,142 ft.~ 7,707,159 ft.
~~
Sam
ples
Refer to the report text for a proper understanding of thesubsurface materials and drilling methods. The stratificationlines indicated below represent the approximate boundaries
between soil types, and the transitions may be gradual.
Hammer Wt. & Drop:
2.5 in.N/AN/A
Rev
:Lo
g: A
AH
SHANNON & WILSON, INC.
PENETRATION RESISTANCE, N
5
REV 3
hand augerShannon & Wilson, Inc.hand auger
0
20 40 60 80
100
September 2013 24-1-03793-001
Gro
und
Wat
er Hammer Wt. & Drop:
Geotechnical and Environmental Consultants
Hole Diam.:Rod Type:Hammer Type:
FIG. A10
Typ
: M
AS
LEGEND
Sym
bol
Jar Sample
NOTES
Total Depth:Top Elevation:Vert. Datum:Horiz. Datum:
(blows/ft.)
0 100
140 lbs / 30 inches
Dep
th, f
t.
Drilling Method:Drilling Company:Drill Rig Equipment:Other Comments:
Northing:Easting:Station:Offset:
Groundwater LevelSample Not Recovered*
20 40 60 80
LOG OF HAND AUGER HA-2
SOIL DESCRIPTION
Gresham Vista Business ParkGresham, Oregon
Elev.Depth
(ft.)
MA
ST
ER
_LO
G_E
24-
1-03
793
.GP
J S
HA
N_W
IL.G
DT
8/2
3/13
Liquid LimitNatural Water Content
Plastic Limit

Dark brown, Silty Sand to Sandy Silt (SM/ML);moist; fine sand; low plasticity fines;micaceous.
FILL
Gray, red, and red-brown, Silt with Sand toElastic Silt with Sand (ML/MH); moist to wet;fine sand; medium plasticity.Grades to wet at 3.0 ft.
Gray and red-brown, Silty Sand (SM); wet; finesand; nonplastic fines; micaceous.
Gray and red-brown Sandy Silt to Silt withSand (ML); wet; fine sand; nonplastic to lowplasticity; micaceous.
Completed - July 5, 2013
Dur
ing
Dril
ling
S-1
S-2
S-3
S-4
210.52.5
208.05.0
206.07.0
205.08.0
1. Refer to KEY for explanation of symbols, codes, abbreviations and definitions.
2. Groundwater level, if indicated above, is for the date specified and may vary.
3. Group symbol is based on visual-manual identification and selected lab testing.
4. The hole location and elevation should be considered approximate.
8 ft.~ 213 ft.NAVD88NAD83
~ 684,250 ft.~ 7,707,289 ft.
~~
Sam
ples
Refer to the report text for a proper understanding of thesubsurface materials and drilling methods. The stratificationlines indicated below represent the approximate boundaries
between soil types, and the transitions may be gradual.
Hammer Wt. & Drop:
2.5 in.N/AN/A
Rev
:Lo
g: A
AH
SHANNON & WILSON, INC.
PENETRATION RESISTANCE, N
5
REV 3
hand augerShannon & Wilson, Inc.hand auger
0
20 40 60 80
100
September 2013 24-1-03793-001
Gro
und
Wat
er Hammer Wt. & Drop:
Geotechnical and Environmental Consultants
Hole Diam.:Rod Type:Hammer Type:
FIG. A11
Typ
: M
AS
LEGEND
Sym
bol
Jar Sample
NOTES
Total Depth:Top Elevation:Vert. Datum:Horiz. Datum:
(blows/ft.)
0 100
140 lbs / 30 inches
Dep
th, f
t.
Drilling Method:Drilling Company:Drill Rig Equipment:Other Comments:
Northing:Easting:Station:Offset:
Groundwater LevelSample Not Recovered*
20 40 60 80
LOG OF HAND AUGER HA-3
SOIL DESCRIPTION
Gresham Vista Business ParkGresham, Oregon
Elev.Depth
(ft.)
MA
ST
ER
_LO
G_E
24-
1-03
793
.GP
J S
HA
N_W
IL.G
DT
8/2
3/13
Liquid LimitNatural Water Content
Plastic Limit

Gray to brown, Silty Sand to Sandy Silt(SM/ML); moist; fine sand; low plasticity fines;micaceous.
FILL
Gray, red-brown, and brown, Silt with Sand(ML); moist; trace fine gravel; fine sand; lowplasticity; micaceous.
Gray and brown, Gravelly Silt with Sand (ML);moist; fine, rounded gravel; fine sand; lowplasticity.
Completed - July 5, 2013
Refusal on gravel at 5.7 ft.
Gro
undw
ater
not
obs
erve
d
S-1
S-2
209.04.0
208.05.0
207.35.7
1. Refer to KEY for explanation of symbols, codes, abbreviations and definitions.
2. Groundwater level, if indicated above, is for the date specified and may vary.
3. Group symbol is based on visual-manual identification and selected lab testing.
4. The hole location and elevation should be considered approximate.
5.7 ft.~ 213 ft.NAVD88NAD83
~ 684,317 ft.~ 7,707,414 ft.
~~
Sam
ples
Refer to the report text for a proper understanding of thesubsurface materials and drilling methods. The stratificationlines indicated below represent the approximate boundaries
between soil types, and the transitions may be gradual.
Hammer Wt. & Drop:
2.5 in.N/AN/A
Rev
:Lo
g: A
AH
SHANNON & WILSON, INC.
PENETRATION RESISTANCE, N
5
REV 3
hand augerShannon & Wilson, Inc.hand auger
0
20 40 60 80
100
September 2013 24-1-03793-001
Gro
und
Wat
er Hammer Wt. & Drop:
Geotechnical and Environmental Consultants
Hole Diam.:Rod Type:Hammer Type:
FIG. A12
Typ
: M
AS
LEGEND
Sym
bol
Jar Sample
NOTES
Total Depth:Top Elevation:Vert. Datum:Horiz. Datum:
(blows/ft.)
0 100
140 lbs / 30 inches
Dep
th, f
t.
Drilling Method:Drilling Company:Drill Rig Equipment:Other Comments:
Northing:Easting:Station:Offset:
Sample Not Recovered*
20 40 60 80
LOG OF HAND AUGER HA-4
SOIL DESCRIPTION
Gresham Vista Business ParkGresham, Oregon
Elev.Depth
(ft.)
MA
ST
ER
_LO
G_E
24-
1-03
793
.GP
J S
HA
N_W
IL.G
DT
8/2
3/13
Liquid LimitNatural Water Content
Plastic Limit

24-1-03793-001
APPENDIX B
LABORATORY TESTING
24-1-03793-001 B-i
TABLE OF CONTENTS
B.1 GENERAL .......................................................................................................................B-1
B.2 SOIL TESTING ...............................................................................................................B-1 B.2.1 Moisture (Natural Water) Content .....................................................................B-1 B.2.2 Atterberg Limits ................................................................................................B-1 B.2.3 Particle-Size Analyses .......................................................................................B-2
FIGURES B1 Atterberg Limits Results B2 Grain Size Distribution

24-1-03793-001
B-1
APPENDIX B
LABORATORY TESTING B.1 GENERAL
The soil samples obtained during the field explorations were described and identified in the field in general accordance with the Standard Practice for Description and Identification of Soils (Visual-Manual Procedure), ASTM D2488. The specific terminology used is presented in Appendix A, Figure A1. The samples were reviewed in the laboratory. The physical characteristics of the samples were noted, and the field descriptions and identifications were modified where necessary in accordance with terminology presented in Appendix A, Figure A1. Representative samples were selected for various laboratory tests. We refined our visual-manual soil descriptions and identifications based on the results of the laboratory tests, using elements of the Standard Practice for Classification of Soils for Engineering Purposes (Unified Soil Classification System), ASTM D2487. The refined descriptions and identifications were then incorporated into the Logs of Borings, presented in Appendix A. Note that ASTM D2487 was not followed in full because it requires that a suite of tests be performed to fully classify a single sample.
The soil testing program included moisture content analyses, Atterberg Limits tests, and particle-size analyses. The testing procedures from our laboratory program are summarized in the following paragraphs. All test procedures were performed by Shannon & Wilson, Inc., in accordance with applicable ASTM International (ASTM) standards.
B.2 SOIL TESTING
B.2.1 Moisture (Natural Water) Content
Natural moisture content determinations were performed in accordance with ASTM D2216 on selected soil samples. The natural moisture content is a measure of the amount of moisture in the soil at the time the explorations are performed, and is defined as the ratio of the weight of water to the dry weight of the soil, expressed as a percentage. The results of the moisture content determinations are presented graphically in the Logs of Borings in Appendix A.
B.2.2 Atterberg Limits
Atterberg Limits were determined on selected samples in accordance with ASTM D4318. This analysis yields index parameters of the soil that are useful in soil identification, as well as in
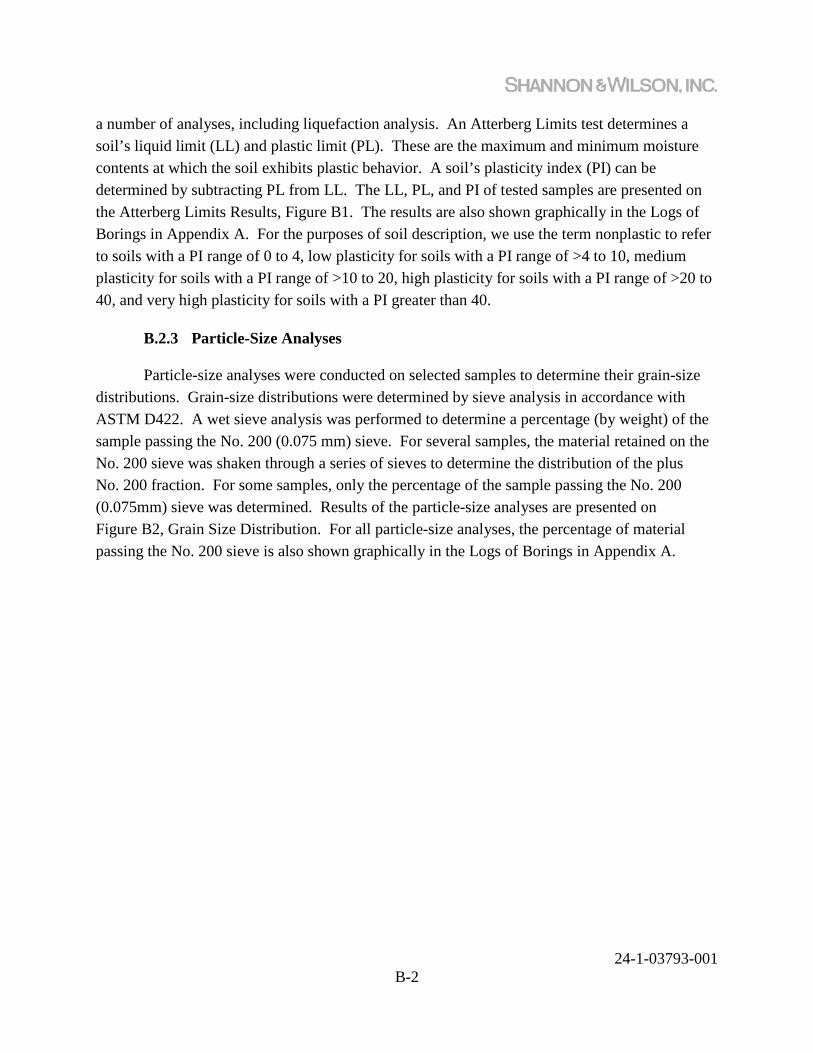
24-1-03793-001
B-2
a number of analyses, including liquefaction analysis. An Atterberg Limits test determines a soil’s liquid limit (LL) and plastic limit (PL). These are the maximum and minimum moisture contents at which the soil exhibits plastic behavior. A soil’s plasticity index (PI) can be determined by subtracting PL from LL. The LL, PL, and PI of tested samples are presented on the Atterberg Limits Results, Figure B1. The results are also shown graphically in the Logs of Borings in Appendix A. For the purposes of soil description, we use the term nonplastic to refer to soils with a PI range of 0 to 4, low plasticity for soils with a PI range of >4 to 10, medium plasticity for soils with a PI range of >10 to 20, high plasticity for soils with a PI range of >20 to 40, and very high plasticity for soils with a PI greater than 40.
B.2.3 Particle-Size Analyses
Particle-size analyses were conducted on selected samples to determine their grain-size distributions. Grain-size distributions were determined by sieve analysis in accordance with ASTM D422. A wet sieve analysis was performed to determine a percentage (by weight) of the sample passing the No. 200 (0.075 mm) sieve. For several samples, the material retained on the No. 200 sieve was shaken through a series of sieves to determine the distribution of the plus No. 200 fraction. For some samples, only the percentage of the sample passing the No. 200 (0.075mm) sieve was determined. Results of the particle-size analyses are presented on Figure B2, Grain Size Distribution. For all particle-size analyses, the percentage of material passing the No. 200 sieve is also shown graphically in the Logs of Borings in Appendix A.
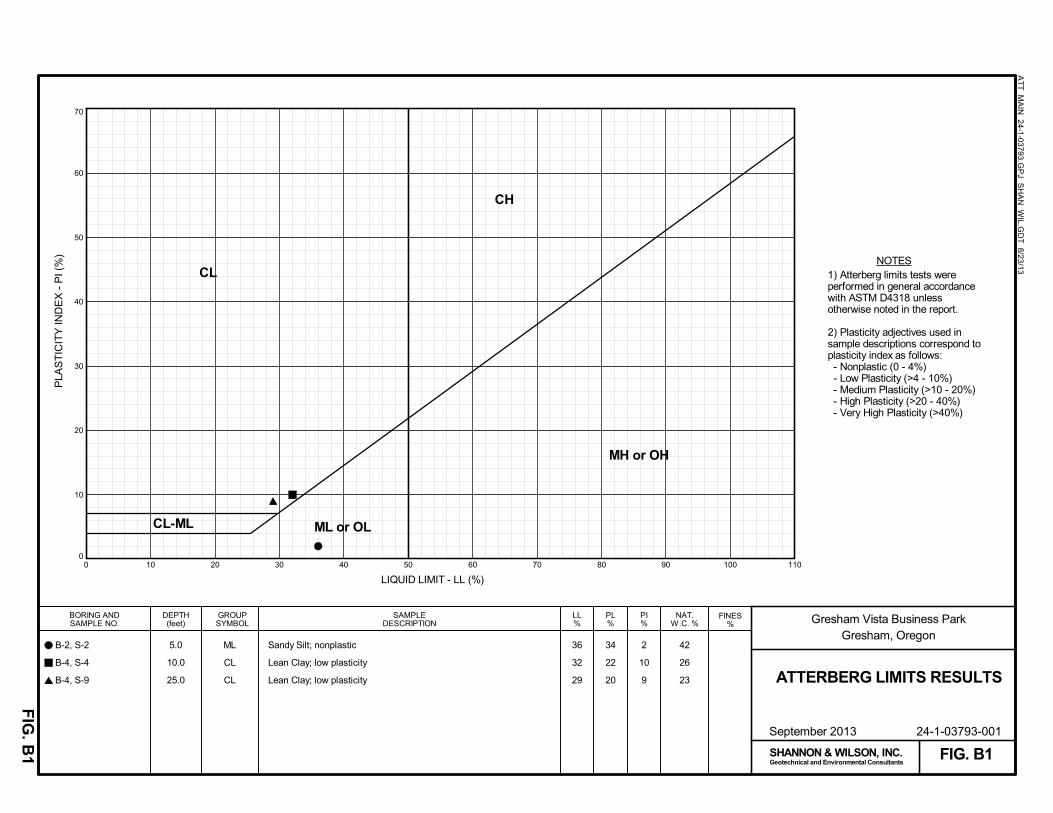
0
10
20
30
40
50
60
70
0 10 20 30 40 50 60 70 80 90 100 110
5.0
10.0
25.0
Sandy Silt; nonplastic
Lean Clay; low plasticity
Lean Clay; low plasticity
SAMPLEDESCRIPTION
BORING ANDSAMPLE NO.
42
26
23
24-1-03793-001
FINES%
LL%
36
32
29 ATTERBERG LIMITS RESULTS
LIQUID LIMIT - LL (%)
PI%
AT
T_M
AIN
24-1-03793.GP
J SH
AN
_WIL.G
DT
8/23/13
September 2013
SHANNON & WILSON, INC.
2
10
9
GROUPSYMBOL
Geotechnical and Environmental ConsultantsFIG. B1
ML
CL
CL
DEPTH(feet)
34
22
20
NAT.W.C. %
PLA
ST
ICIT
Y IN
DE
X -
PI (
%)
FIG
. B1
PL%
B-2, S-2
B-4, S-4
B-4, S-9
Gresham Vista Business ParkGresham, Oregon
NOTES1) Atterberg limits tests wereperformed in general accordancewith ASTM D4318 unlessotherwise noted in the report.
2) Plasticity adjectives used insample descriptions correspond toplasticity index as follows: - Nonplastic (0 - 4%) - Low Plasticity (>4 - 10%) - Medium Plasticity (>10 - 20%) - High Plasticity (>20 - 40%) - Very High Plasticity (>40%)
MH or OH
CH
CL
CL-ML ML or OL

0
10
20
30
40
50
60
70
80
90
100
.01
1/4
4
.004
SAND
100
90
80
70
60
50
40
30
20
10
0
GRAVEL%
FINES%
DRYDENSITY
PCF
5/8
HYDROMETER ANALYSIS
3/8
3
Geotechnical and Environmental Consultants
.6
SHANNON & WILSON, INC.
2 .03
Silty Sand with Gravel
Silt
Sandy Silt
Silty Gravel with Sand
Clayey Gravel with Sand
Silty Sand
Silty Sand with Gravel
B-1, S-2
B-1, S-6
B-2, S-5a
B-4, S-2
B-4, S-8
B-5, S-2a
B-5, S-3
BORING ANDSAMPLE NO.
SAMPLEDESCRIPTION
40
40 .01
.008
.008
6 100
.4
1 1/
2
.04
.06.8
.06
1
6 4
PE
RC
EN
T F
INE
R B
Y W
EIG
HT
3/4
COARSE MEDIUM
3
SIZE OF MESH OPENING IN INCHES
.04
SAND%
NAT.W.C. %
.03
.003
20
SIEVE ANALYSIS
200
1/2
FIG
. B2
.1
.00660
.003
COBBLES
200
GRAVEL
.3
102 1
.001
.2
.02
60
GRAIN SIZE IN MILLIMETERS
100
GS
A_M
AIN
24-1-03
793.GP
J SH
AN
_WIL.G
DT
8/23/1
3
.002
.0230
FINES: SILT OR CLAY
NO. OF MESH OPENINGS PER INCH, U.S. STANDARD
Sheet 1 of 2
September 2013
80 10
.004
.08
4
.002
8
FINE
GRAIN SIZE IN MILLIMETERS
300
.006
COARSE FINE
GRAIN SIZE DISTRIBUTION
FIG. B2
12 20
.001
40
91
59
37
13
33
15
14
24
39
27
21
23
18
SM
ML
ML
GM
GC
SM
SM
5.0
15.0
12.5
5.0
20.0
5.0
6.6
DEPTH(feet)
38
-
-
24
31
64
52
24-1-03793-001
Gresham Vista Business ParkGresham, Oregon
23
-
-
39
56
4
34
GROUPSYMBOL
PE
RC
EN
T C
OA
RS
ER
BY
WE
IGH
T
NO
TE
: Sieve and hydrom
eter analyses were perform
ed in general accordance with A
ST
M D
422unless otherw
ise noted in the report.

0
10
20
30
40
50
60
70
80
90
100
.01
1/4
4
.004
SAND
100
90
80
70
60
50
40
30
20
10
0
GRAVEL%
FINES%
DRYDENSITY
PCF
5/8
HYDROMETER ANALYSIS
3/8
3
Geotechnical and Environmental Consultants
.6
SHANNON & WILSON, INC.
2 .03
Silty Sand with Gravel
Poorly Graded Gravel with Silt and Sand
Silty Sand with Gravel
B-6, S-2
B-6, S-5
B-7, S-2
BORING ANDSAMPLE NO.
SAMPLEDESCRIPTION
40
40 .01
.008
.008
6 100
.4
1 1/
2
.04
.06.8
.06
1
6 4
PE
RC
EN
T F
INE
R B
Y W
EIG
HT
3/4
COARSE MEDIUM
3
SIZE OF MESH OPENING IN INCHES
.04
SAND%
NAT.W.C. %
.03
.003
20
SIEVE ANALYSIS
200
1/2
FIG
. B2
.1
.00660
.003
COBBLES
200
GRAVEL
.3
102 1
.001
.2
.02
60
GRAIN SIZE IN MILLIMETERS
100
GS
A_M
AIN
24-1-03
793.GP
J SH
AN
_WIL.G
DT
8/23/1
3
.002
.0230
FINES: SILT OR CLAY
NO. OF MESH OPENINGS PER INCH, U.S. STANDARD
Sheet 2 of 2
September 2013
80 10
.004
.08
4
.002
8
FINE
GRAIN SIZE IN MILLIMETERS
300
.006
COARSE FINE
GRAIN SIZE DISTRIBUTION
FIG. B2
12 20
.001
22
10
22
23
11
19
SM
GP
SM
5.0
10.0
5.0
DEPTH(feet)
56
32
61
24-1-03793-001
Gresham Vista Business ParkGresham, Oregon
22
58
17
GROUPSYMBOL
PE
RC
EN
T C
OA
RS
ER
BY
WE
IGH
T
NO
TE
: Sieve and hydrom
eter analyses were perform
ed in general accordance with A
ST
M D
422unless otherw
ise noted in the report.

24-1-03793-001
APPENDIX C
IMPORTANT INFORMATION ABOUT YOUR GEOTECHNICAL/ENVIRONMENTAL REPORT

1/2012
SHANNON & WILSON, INC. Geotechnical and Environmental Consultants
Attachment to and part of Report: 24-1-03793-001
Conceptual Geotechnical Report Gresham Vista Business Park
Date: September 2013 To: Port of Portland Attn: Robin McCaffrey
Important Information About Your Geotechnical/Environmental Report CONSULTING SERVICES ARE PERFORMED FOR SPECIFIC PURPOSES AND FOR SPECIFIC CLIENTS. Consultants prepare reports to meet the specific needs of specific individuals. A report prepared for a civil engineer may not be adequate for a construction contractor or even another civil engineer. Unless indicated otherwise, your consultant prepared your report expressly for you and expressly for the purposes you indicated. No one other than you should apply this report for its intended purpose without first conferring with the consultant. No party should apply this report for any purpose other than that originally contemplated without first conferring with the consultant. THE CONSULTANT'S REPORT IS BASED ON PROJECT-SPECIFIC FACTORS. A geotechnical/environmental report is based on a subsurface exploration plan designed to consider a unique set of project-specific factors. Depending on the project, these may include the general nature of the structure and property involved; its size and configuration; its historical use and practice; the location of the structure on the site and its orientation; other improvements such as access roads, parking lots, and underground utilities; and the additional risk created by scope-of-service limitations imposed by the client. To help avoid costly problems, ask the consultant to evaluate how any factors that change subsequent to the date of the report may affect the recommendations. Unless your consultant indicates otherwise, your report should not be used: (1) when the nature of the proposed project is changed (for example, if an office building will be erected instead of a parking garage, or if a refrigerated warehouse will be built instead of an unrefrigerated one, or chemicals are discovered on or near the site); (2) when the size, elevation, or configuration of the proposed project is altered; (3) when the location or orientation of the proposed project is modified; (4) when there is a change of ownership; or (5) for application to an adjacent site. Consultants cannot accept responsibility for problems that may occur if they are not consulted after factors, which were considered in the development of the report, have changed. SUBSURFACE CONDITIONS CAN CHANGE. Subsurface conditions may be affected as a result of natural processes or human activity. Because a geotechnical/environmental report is based on conditions that existed at the time of subsurface exploration, construction decisions should not be based on a report whose adequacy may have been affected by time. Ask the consultant to advise if additional tests are desirable before construction starts; for example, groundwater conditions commonly vary seasonally. Construction operations at or adjacent to the site and natural events such as floods, earthquakes, or groundwater fluctuations may also affect subsurface conditions and, thus, the continuing adequacy of a geotechnical/environmental report. The consultant should be kept apprised of any such events, and should be consulted to determine if additional tests are necessary. MOST RECOMMENDATIONS ARE PROFESSIONAL JUDGMENTS. Site exploration and testing identifies actual surface and subsurface conditions only at those points where samples are taken. The data were extrapolated by your consultant, who then applied judgment to render an opinion about overall subsurface conditions. The actual interface between materials may be far more gradual or abrupt than your report indicates. Actual conditions in areas not sampled may differ from those predicted in your report. While nothing can be done to prevent such situations, you and your consultant can work together to help reduce their impacts. Retaining your consultant to observe subsurface construction operations can be particularly beneficial in this respect.

1/2012
A REPORT'S CONCLUSIONS ARE PRELIMINARY. The conclusions contained in your consultant's report are preliminary because they must be based on the assumption that conditions revealed through selective exploratory sampling are indicative of actual conditions throughout a site. Actual subsurface conditions can be discerned only during earthwork; therefore, you should retain your consultant to observe actual conditions and to provide conclusions. Only the consultant who prepared the report is fully familiar with the background information needed to determine whether or not the report's recommendations based on those conclusions are valid and whether or not the contractor is abiding by applicable recommendations. The consultant who developed your report cannot assume responsibility or liability for the adequacy of the report's recommendations if another party is retained to observe construction. THE CONSULTANT'S REPORT IS SUBJECT TO MISINTERPRETATION. Costly problems can occur when other design professionals develop their plans based on misinterpretation of a geotechnical/environmental report. To help avoid these problems, the consultant should be retained to work with other project design professionals to explain relevant geotechnical, geological, hydrogeological, and environmental findings, and to review the adequacy of their plans and specifications relative to these issues. BORING LOGS AND/OR MONITORING WELL DATA SHOULD NOT BE SEPARATED FROM THE REPORT. Final boring logs developed by the consultant are based on interpretation of field logs (assembled by site personnel), field test results, and laboratory and/or office evaluation of field samples and data. Only final boring logs and data are customarily included in geotechnical/environmental reports. These final logs should not, under any circumstances, be redrawn for inclusion in architectural or other design drawings, because drafters may commit errors or omissions in the transfer process. To reduce the likelihood of boring log or monitoring well misinterpretation, contractors should be given ready access to the complete geotechnical engineering/environmental report prepared or authorized for their use. If access is provided only to the report prepared for you, you should advise contractors of the report's limitations, assuming that a contractor was not one of the specific persons for whom the report was prepared, and that developing construction cost estimates was not one of the specific purposes for which it was prepared. While a contractor may gain important knowledge from a report prepared for another party, the contractor should discuss the report with your consultant and perform the additional or alternative work believed necessary to obtain the data specifically appropriate for construction cost estimating purposes. Some clients hold the mistaken impression that simply disclaiming responsibility for the accuracy of subsurface information always insulates them from attendant liability. Providing the best available information to contractors helps prevent costly construction problems and the adversarial attitudes that aggravate them to a disproportionate scale. READ RESPONSIBILITY CLAUSES CLOSELY. Because geotechnical/environmental engineering is based extensively on judgment and opinion, it is far less exact than other design disciplines. This situation has resulted in wholly unwarranted claims being lodged against consultants. To help prevent this problem, consultants have developed a number of clauses for use in their contracts, reports and other documents. These responsibility clauses are not exculpatory clauses designed to transfer the consultant's liabilities to other parties; rather, they are definitive clauses that identify where the consultant's responsibilities begin and end. Their use helps all parties involved recognize their individual responsibilities and take appropriate action. Some of these definitive clauses are likely to appear in your report, and you are encouraged to read them closely. Your consultant will be pleased to give full and frank answers to your questions.
The preceding paragraphs are based on information provided by the ASFE/Association of Engineering Firms Practicing in the Geosciences, Silver Spring, Maryland