Embed Size (px)
Citation preview

1
Sharpen the saw …concepts, resources & issues
June 11, 2008
Mark StorlieISU Swine Field Specialist563-425-3331 or [email protected]
Market ForcesCorn – July contract
3.8 X higher
Market ForcesGOLD – June contract
4 X higher
Market ForcesMonthly Corn and Monthly Gold
CornGold

2
Market ForcesUS Dollar Index – June contract
42%
Drop
Market ForcesWheat – July contract
5.5 X
higher
41% drop
in value
Market ForcesLight Crude Oil – June contract
11+ X
higher
Market ForcesLean Hogs – June contract

3
Oct 07 $1.52 $3.40 RATIO
Nov 07 $1.74 $.22
$4.10 $.70
3.2
Dec 07 $1.94 $.20
$4.75 $.65
3.2
Jan 08 $2.19 $.25
$5.71 $.96
3.8
Feb 08 $2.13 ($.06)
$5.30 ($.41)
Mar 08 $2.32 $.19
$5.82 $.52
2.7
Apr 08 $2.46 $.14
$6.28 $.46
3.3
Market Forces
$/gal B.E. $/bu
Ethanol Production
• Thumb-rule: 10 cents/gallon increase = 30 cents/bushel.
• If ethanol is worth $3/gal today, the value of the corn going to an ethanol plant would be about $8/bushel.
Average Ratio is 3.24
Market ForcesEthanol Production
National Pork Producer Council Statement
• Economists estimate the pork industry will need to reduce production by at least 10%– meaning a reduction of 600,000 sows – to restore profitability.

4
Current Situation
• May 30, 2008 – Grimms & Plain
- Weekly slaughter 1,828,000 (6.2% over 07’)
- Large Cold storage (23% over 07’)
- Ia-Mn Apr. 1 $49.54/cwtMay. 20 $82.43/cwt
- Exports higher … 18% of production1 out of every 5 pigs
Current Situation• May 30, 2008 – Plain
- Weekly Sow slaughter * mid-March to mid-April (15% over 07’)
* slowing (08’ weekly average 8%)
• May 30, 2008 – Steve Meyer- Sow slaughter * 1.1% lower March inventory
• * Canada – 20% lower sow inventory
How do we reduce the sow herd 10% - choices …
• Do nothing and wait until 10% of the industry goes out of business and the sows go to town. (ownership transfers don’t count)
.. or..
• Industry reduces output 10%.. or ..
• Rest of World removes sows … export?
Have we had enoughsow liquidation ?
• June 27 th … next Hogs & Pig report

5
What Tools do you have in your Tool Box ???
Cash marketingForward ContractsFutures ContractsOptions Contracts
Insurance based products …
Livestock Risk Protection (LRP)Livestock Gross Margin (LGM)
Livestock Gross Margin-LGM
• Insures Gross Margin-- market price, price of corn and soybean meal
• Coverage Period:
Each month pigs will be marketed 2-5 mo laterlevel - 100, 95, 90 or 85%
• Availability:
Only last business day of each monthafter futures market closes until 9:00 am (central)
on following business day
Revenue:• Market Hog $$$$
Expense:• CORN - $$• SOYBEAN MEAL - $$
= Gross Margin
Remaining Expenses:• Feed Other and Additives $ 6.00• Veterinary and medical $ 1.00• Fuel, repairs, utilities $ 1.20• Marketing, miscellaneous $ 4.00• Interest on feed and other = $ ??• Labor $9.00/hr. (0.50 hrs) = $ 4.50Fixed Costs
• Machinery, facilities $ 13.04
Profit/Loss:
$100 +
- $$
$$ 25
30
35
40
45
50
55
60
Jan Feb Mar Apr May Jun Jul Aug Sep Oct Nov Dec
$/cw
t
Avg 90s 2001 2002 2003 2004
Factors….Season Price PatternMarket Cycles
Risk Tolerance
Market Barrow & Gilt Price

6
Market Forces … summary
• Be aware of market interactionsLonger term impact of gold/dollar on corn
• Consider Gross Return LH revenue – Corn & SBM cost
• Be prepared to responde
More with Less??
• Is it possible to find areas in your swine operation that you could reduce output with little impact on profit?
Planned Pig Flow
Market
“Begin with end in mind”
• Size of Nursery & Finisher Buildings
• Size of Groups to sell (SEW or Nursery Piglets)
Planned Pig Flow … breeding sources
Weaned
SowsSows
Culled
Repeat
Breeders
Gilt Pool
Seasonal
Breeding
Target
Gilts= - ++

7
Seasonal Impact
Farrowing Rate - month Farrowed (Pig ChampTM: Farrowing Rate Report)
Jan 74.00% Apr 89.00% Jul 90.00% Oct 81.00%
Feb 81.00% May 86.00% Aug 88.00% Nov 77.00%
Mar 85.00% Jun 89.00% Sep 87.00% Dec 76.00%
Farrowing Rate - month Bred
Jan 86.00% Apr 88.00% Jul 77.00% Oct 81.00%
Feb 89.00% May 87.00% Aug 76.00% Nov 85.00%
Mar 90.00% Jun 81.00% Sep 74.00% Dec 89.00%
Selection starts from the beginning …
Select Mating
- BLUPProvide Extra Care
- avoid stress
- nutrition/environment
Select Structure
and Growth
Select Structure
Target
-Weight .. 300 lbs
-Age.. Expose Boar 160 day
Direct Contact 15 min High Libido
-Service.. 2nd or 3rd estrus
Brainstorming the List
• PRRS has been shown to cost $10/hd
– Closing the herd for 6-9 months has been shown to stop PRRS shedding.
– Risk of re-infection or bio-security slip
• Increase weaning age.
– K-state study showed $.59/pig/extra day in faster growth, less loss – morbidity and death
• Value in growth rate may or may not be important
Wean-to-Finish ADG
1.28
1.36
1.40
1.511.49
1.54
1.59
1.25
1.35
1.45
1.55
1.65
12 15 18 21 15.5 18.5 21.5
Wean age, d
AD
G,
lb.
SE= 0.02; 0.01 lb
Linear, P<0.001
ADG = Does not account for weight or
days lost due to mortality in this study.
Trial 1 Trial 2

8
Wean-to-Finish Mortality
9.4
7.9
6.8
3.6 3.93.4
2.5
2
3
4
5
6
7
8
9
10
12 15 18 21 15.5 18.5 21.5
Wean age, d
Mo
rta
lity
, %
SE= 0.95; 0.50 %
Linear, P<0.01
Trial 1 Trial 2
Effect of lactation length and average daily feed intake on farrowing rate
70
80
90
11 to 13 14 to 16 17 to 19 20 to 22 >23
Lactation length, days
Farrow
ing r
ate
, %
< 9.2 lbs 9.2 to 12.5 lbs 12.5+ lbs
J. Anim. Sci. 75:2580-2587, 1997.
Disadvantaged pigs
• Lightweight
– Survival rate much less in pigs < 2.75 lb
Pig survival and birth weight
0
20
40
60
80
100
0 1 2 3 4 5
Birth weight, lb
Su
rviv
al
to d
ay 2
1,
%
Hall et al., 1987
35
Economic of Gestation Feed(Assuming Average Feed Cost is $220/ton)
Daily Feed Feed Cost $day 120 days 300 days
4.0 $.44 $52.80 $132.00
4.2 $.46 $55.44 $138.60
4.4 $.48 $58.08 $145.20
4.6 $.51 $60.72 $151.80
4.8 $.53 $63.36 $158.40
5.0 $.55 $66.00 $165.00
5.2 $.57 $68.64 $171.60
1 - Calibrate drop boxes2 - Examine Sow Condition
$6.60
$13.20
9
Feed to Sow Condition Score• Challenge you maternal genetics to
see if they can perform at a lower condition score.
1 2 3 4 5
Taken from “Assessing Sow Body Condition” by R. D. Coffey, G.
R. Parker, and K. M. Laurent (ASC-158; 1999).
Score Condition Detection of ribs,
backbone, “H” bones,
and pin bones
1 Emaciated Obvious
2 Thin Easily detected with
pressure
3 Ideal Barely felt with firm
pressure
4 Fat None
5 Overly fat None
Reproduction Efficiency
• Reduce Non-productive days
– Gestation feed cost … approx. $.50/day
– Timely identify and cull opens - Preg check with Real time ultrasound
– Limit repeat services
• Use what you learned today to increase the percentage of first cycle sows bred.
38
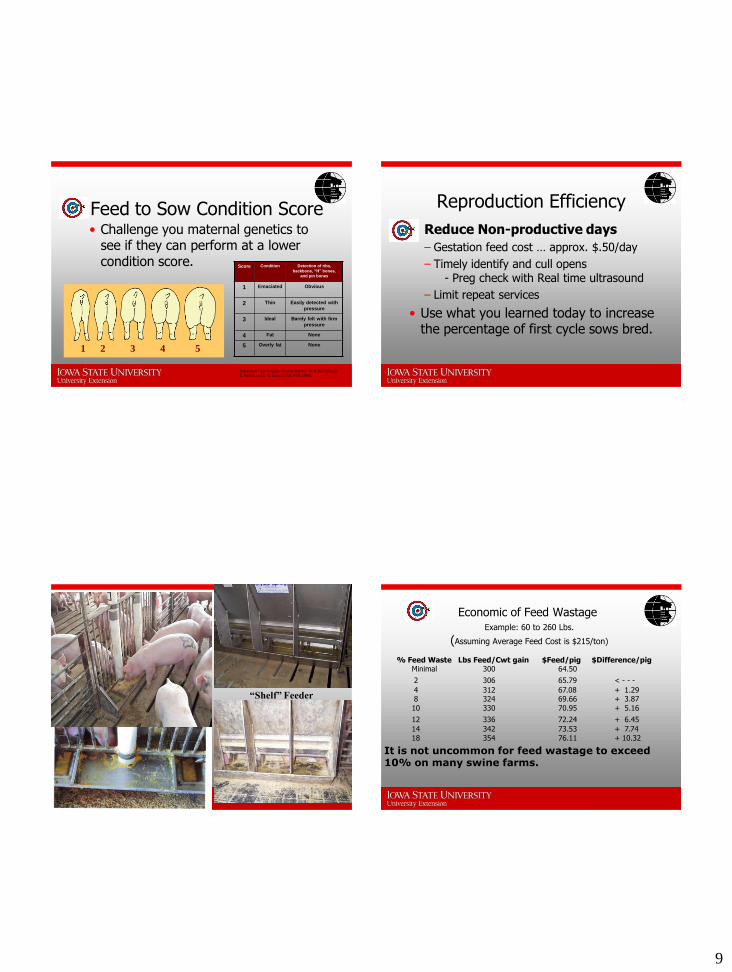
Wet/dry Feeders
“Tube” Feeder
“Shelf” Feeder
Wet/Dry Feeders
39
Economic of Feed WastageExample: 60 to 260 Lbs.
(Assuming Average Feed Cost is $215/ton)
% Feed Waste Lbs Feed/Cwt gain $Feed/pig $Difference/pigMinimal 300 64.50
2 306 65.79 < - - -
4 312 67.08 + 1.298 324 69.66 + 3.8710 330 70.95 + 5.16
12 336 72.24 + 6.45
14 342 73.53 + 7.7418 354 76.11 + 10.32
It is not uncommon for feed wastage to exceed 10% on many swine farms.

10
40
Replace/Adjust Feeders
41
Feed Budgets Are Essential
Provide the right feed to the right pig for the right amount of “time”
42
Evaluate Diet Particle Size
• Feed/gain increases 1.2% for every 100 microns above 700 microns
– Recommended micron size:• Hammermill - 700+2.25 microns
• Rollermill – 700+2.0 microns
– Excessive fine grinding (<600 microns)• Increases gastric ulcers
• Increases bridging in bins and feeders
• Increases dust
• Increases energy cost of feed manufacturing
Use Most Efficient Finishers
• Used your Group Tracker records to shut down least efficient finisher.
– Today a 2.6 conversion is over $10/pig more cost efficient than a 3.0 feed conversion barn.

11
Sale Weight
• As the cost of gain closes in on the market price the optimum sale weight will shift lower.
– Seasonal decreases in price also has an influence to lower the sale weight for more profit.
46
Heat Stress and the Breeding Herd
Jun Jul Aug Sep Oct Nov Dec Jan Feb
Heat Stress
Litters affected by heat stress on sows
Reduced boar fertility
Litters affected by reduced boar fertility
Levis, 1980
Effect Heat Stress on Boars (above 85F)
Heat stress in boars can be assessed by respiration rates:
• The normal respiration rate is 25-35 breaths per minute
• A respiration rate of 40-50 breaths should be treated as an alarm signal
• Under heat stress, it can rise up to 75 to 100 breaths per minute
Drip Cooling
• Start by 80 0F
• Provide .5-1.0 gal/hr– sized for minimal runoff from sow
• Placed 20” behind front headgate– Reduces feed wetting
– Keeps young pigs dry

12
Drippers and Heat (86 F)
Corn - Soy Corn-Soy + Fat
Drip Off Drip On Drip Off Drip On
ADF, lb/d 11.7 15.5 10.2 13.6
Wt loss, lb 58.9 19.4 59.4 21.0
Resp Rate 87 41 70 42
Pigs wean, no 8.17 8.97 8.81 8.67
Wean wt, lb 14.4 15.3 14.6 15.4
McGlone, 1998 http://www.moormans.com/Swine/TechBulletinHTML/S9333%20Heat%20Stress.htm
Water Drip and Sow Performance
Drip Off Drip On
ADF, lb/d 7.8 12.3
Wt loss, lb 47 31
Days to estrus 5.2 4.7
McGlone, 1998 http://www.moormans.com/Swine/TechBulletinHTML/S9333%20Heat%20Stress.htm
Evaporative Pad Coolers
Evaporative Cooling Pads(KoolCell Pads)
– Incoming air drawn through wet pads
– Air evaporates water from pads
• Temp reduced
• Moisture increased
– Temperature will decrease until RH nears 85%.
– When incoming air is humid (relative humidity >70%), air temp decrease will only be 5-10 F.
– When incoming air is relatively dry (<55% RH), air temp reduction may be 15 F or more.

13
Impact of Relative Humidity on Effectiveness of Evaporative Cooling
Outside RH%
Outside Temp (F) 30 50 70
Pad Exit Temp (F) 80% efficiency
76 62 66 70
84 67 73 78
92 73 79 85
100 79 87 93
Meyer and Van Fossen, ISU, 1971
Circulation FansPlan View of Arrangement
Stir Fan Placement
MWPS
Dirty Fans and Shutters
• 1/8 inch of dirt/dust can cause up to a 40% reduction in fan and shutter air flow.

14
Curtain “Check-Points”
• Over-lap with top of opening
– Minimum 3 inches of overlap needed
– Limit switch settings
– Sagging
• Curtain integrity
– End pockets
– Rodent damage
– Sagging
More Available with Pork Board Publication
• Look for the publication at :Practical Ideas to Address High Feed and Production Costs
• Available on the web:www.porkboard.org
Thank you for attending
Questions …
E-mail: [email protected]
Snouts & Tails - Electronic Newsletter – 6x/year