Embed Size (px)
Citation preview

CHAPTER 11
CONCEPTS ON MICROARRAY DESIGN FOR GENOMEAND TRANSCRIPTOME ANALYSES
HELDER I. NAKAYA, EDUARDO M. REIS,SERGIO VERJOVSKI-ALMEIDA
Departamento de Bioquimica, Instituto de Quimica, Universidade de São Paulo,05508900 São Paulo, SP, Brazil.Phone: +55-1130912173; Fax: +551130912186; E-mail:[email protected]
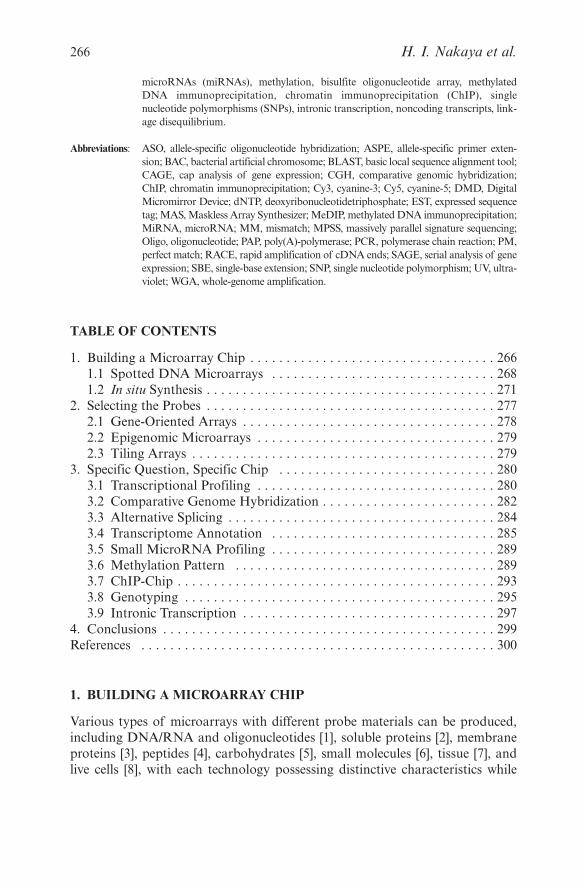
Abstract: Microarray technology has revolutionized molecular biology by permitting manyhybridization experiments to be performed in parallel. With the size of a glassmicroscope slide, this tool can carry thousands of DNA fragments in an areasmaller than a postage stamp. In this chapter, we will describe microarray chips thathost nucleic acid probes, which are the most commonly used type of microarrays.Science in this field is mostly data-driven, where biological hypothesis are generatedupon analysis and comparison of a huge amount of potentially meaningful differ-ential data derived from microarray hybridizations. DNA microarray technology isunder a constant and rapid evolution. The first paper reporting DNA microarray asa tool for transcript-level analyses has been published in 1995, and that chip hadabout 1000 Arabidopsis genes. Almost 11 years have passed and advances in minia-turization, robotic, and informatics, as well as the development of alternativeapproaches to microarray construction have permitted to put more than 250,000different spots into a single square centimeter. This rapid advance in the microarrayfield, combined with the falling price of technology and the acquisition of whole-genome sequence information for hundreds of organisms has caused biologists toabandon their home-made equipment in favor of one of an expanding range ofcommercial platforms now available on the market. However, we are still not able torepresent the entire genome of any eukaryotic organism in a unique chip or even toanalyze the great complexity of the human transcriptome. Therefore, how to chooseand design the best probes to construct DNA microarray chips is a crucial step tothe appropriate use of this powerful technique (Figure 1).
Keywords: Microarray chip, DNA microarray, spotted DNA microarray, cDNA microarray,antisense transcription, genomic microarray, comparative genomic hybridization,CGH, oligoarray, in situ synthesis, Affymetrix, NimbleGen, Agilent, microarray probe,gene-oriented array, oligonucleotide probe, epigenomic microarray, tilling array, CpGisland, expression profiling, gene atlas, alternative splicing, transcript variants,pre-mRNA, transcriptome annotation, whole-genome oligonucleotide array,
A. Buzdin and S. Lukyanov (eds.), Nucleic Acids Hybridization, 265–307.© 2007 Springer.
265
microRNAs (miRNAs), methylation, bisulfite oligonucleotide array, methylatedDNA immunoprecipitation, chromatin immunoprecipitation (ChIP), singlenucleotide polymorphisms (SNPs), intronic transcription, noncoding transcripts, link-age disequilibrium.
Abbreviations: ASO, allele-specific oligonucleotide hybridization; ASPE, allele-specific primer exten-sion; BAC, bacterial artificial chromosome; BLAST, basic local sequence alignment tool;CAGE, cap analysis of gene expression; CGH, comparative genomic hybridization;ChIP, chromatin immunoprecipitation; Cy3, cyanine-3; Cy5, cyanine-5; DMD, DigitalMicromirror Device; dNTP, deoxyribonucleotidetriphosphate; EST, expressed sequencetag; MAS, Maskless Array Synthesizer; MeDIP, methylated DNA immunoprecipitation;MiRNA, microRNA; MM, mismatch; MPSS, massively parallel signature sequencing;Oligo, oligonucleotide; PAP, poly(A)-polymerase; PCR, polymerase chain reaction; PM,perfect match; RACE, rapid amplification of cDNA ends; SAGE, serial analysis of geneexpression; SBE, single-base extension; SNP, single nucleotide polymorphism; UV, ultra-violet; WGA, whole-genome amplification.
TABLE OF CONTENTS
1. Building a Microarray Chip . . . . . . . . . . . . . . . . . . . . . . . . . . . . . . . . . . 2661.1 Spotted DNA Microarrays . . . . . . . . . . . . . . . . . . . . . . . . . . . . . . . 2681.2 In situ Synthesis . . . . . . . . . . . . . . . . . . . . . . . . . . . . . . . . . . . . . . . . 271
2. Selecting the Probes . . . . . . . . . . . . . . . . . . . . . . . . . . . . . . . . . . . . . . . . 2772.1 Gene-Oriented Arrays . . . . . . . . . . . . . . . . . . . . . . . . . . . . . . . . . . . 2782.2 Epigenomic Microarrays . . . . . . . . . . . . . . . . . . . . . . . . . . . . . . . . . 2792.3 Tiling Arrays . . . . . . . . . . . . . . . . . . . . . . . . . . . . . . . . . . . . . . . . . . 279
3. Specific Question, Specific Chip . . . . . . . . . . . . . . . . . . . . . . . . . . . . . . 2803.1 Transcriptional Profiling . . . . . . . . . . . . . . . . . . . . . . . . . . . . . . . . . 2803.2 Comparative Genome Hybridization . . . . . . . . . . . . . . . . . . . . . . . . 2823.3 Alternative Splicing . . . . . . . . . . . . . . . . . . . . . . . . . . . . . . . . . . . . . 2843.4 Transcriptome Annotation . . . . . . . . . . . . . . . . . . . . . . . . . . . . . . . 2853.5 Small MicroRNA Profiling . . . . . . . . . . . . . . . . . . . . . . . . . . . . . . . 2893.6 Methylation Pattern . . . . . . . . . . . . . . . . . . . . . . . . . . . . . . . . . . . . 2893.7 ChIP-Chip . . . . . . . . . . . . . . . . . . . . . . . . . . . . . . . . . . . . . . . . . . . . 2933.8 Genotyping . . . . . . . . . . . . . . . . . . . . . . . . . . . . . . . . . . . . . . . . . . . 2953.9 Intronic Transcription . . . . . . . . . . . . . . . . . . . . . . . . . . . . . . . . . . . 297
4. Conclusions . . . . . . . . . . . . . . . . . . . . . . . . . . . . . . . . . . . . . . . . . . . . . . 299References . . . . . . . . . . . . . . . . . . . . . . . . . . . . . . . . . . . . . . . . . . . . . . . . . 300
1. BUILDING A MICROARRAY CHIP
Various types of microarrays with different probe materials can be produced,including DNA/RNA and oligonucleotides [1], soluble proteins [2], membraneproteins [3], peptides [4], carbohydrates [5], small molecules [6], tissue [7], andlive cells [8], with each technology possessing distinctive characteristics while
266 H. I. Nakaya et al.
providing unique opportunities to increase our understanding of how a livingbeing operates. In this review we will concentrate on the construction and use ofDNA microarrays.
The principle behind microarray chips composed of nucleic acid probes issimple: DNA or oligonucleotide probes representing genes or genomic regionsof an organism capture, by preferential binding of complementary single-stranded nucleic-acid sequences, the labeled RNA, DNA, or cDNA molecules
Concepts on microarray design for genome 267
Figure 1. Steps comprised on chip design.
(targets) applied to the chip. The intensity of the label signal from the capturedtargets reflects the abundance of that target within the hybridized sample.
Single-stranded DNA probes, in the form of DNA (e.g. cDNA and bacterialartificial chromosome – BACs) or oligonucleotides are placed on a substratemade by glass or silicon. Based on the principle of whether or not there is directcontact between the sample probe and the support substrate, a robot arrayer usescontact (using printing pins) or noncontact (using piezoelectrical deposition)printing methods. An alternative method of printing is the semiconductor-basedtechnology, which consists in synthesizing oligonucleotides in situ, building upnucleotide by nucleotide each element of the array and using ink-jet printing orphotolithographic methods, similar to those used in the semiconductor industry.This technology offers the advantage of higher density and consistency [9, 10].Therefore, the key trends have been a shift from cDNA- to oligonucleotide-basedmicroarrays and from “in-house or home-brew” to higher quality commercialplatforms [11].
Oligonucleotide microarrays have several advantages in comparison to DNAmicroarrays. Today, microarray companies such as Agilent Technologies andNimbleGen offer custom oligo arrays with up to hundreds of thousands fea-tures, resulting in platforms with a very flexible custom design. Oligonucleotidescontained in these chips have great sensitivity as discussed below. Also, overlap-ping sense and antisense transcription (RNAs transcribed from both strands ofDNA in the same genomic locus), which is being recognized as a common eventin the eukaryotic cells, can be discriminated by these oligonucleotide arrays.
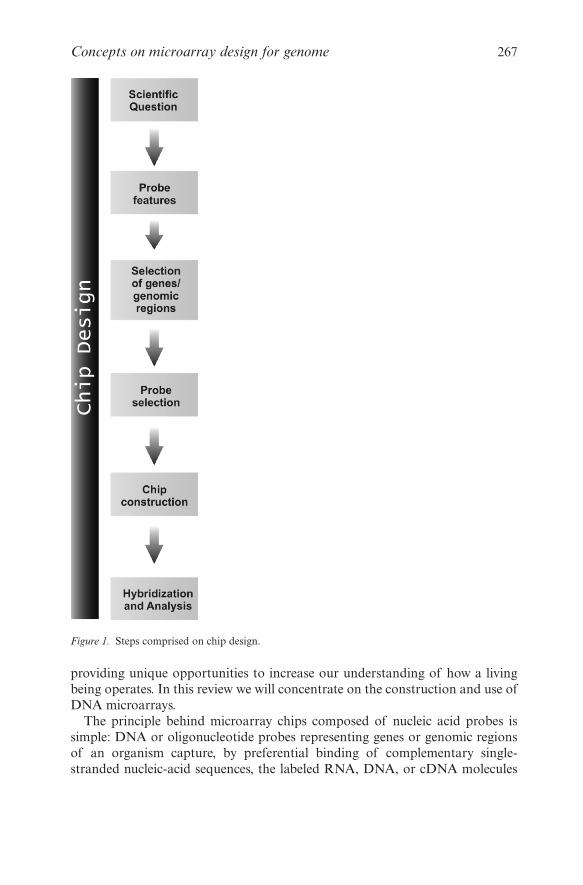
The type of microarray chip depends on the scientific question behind it.Chips comprised either by short (200–500 bp) PCR products of cDNAsequences or by oligonucleotides (17–70 bp) have high resolution but a limitedgenomic coverage (Figure 2). This kind of chip is largely used for measurementof mRNA transcript levels from annotated genes. Large genomic deletions orduplications are better detected by low-resolution microarray chips carryingfragments of several kilobases (kb) in length, such as BACs and cosmids(Figure 2). Although oligonucleotides can be either spotted or in situ synthe-sized onto a microarray chip, large DNA molecules can only be spotted.
1.1 Spotted DNA Microarrays
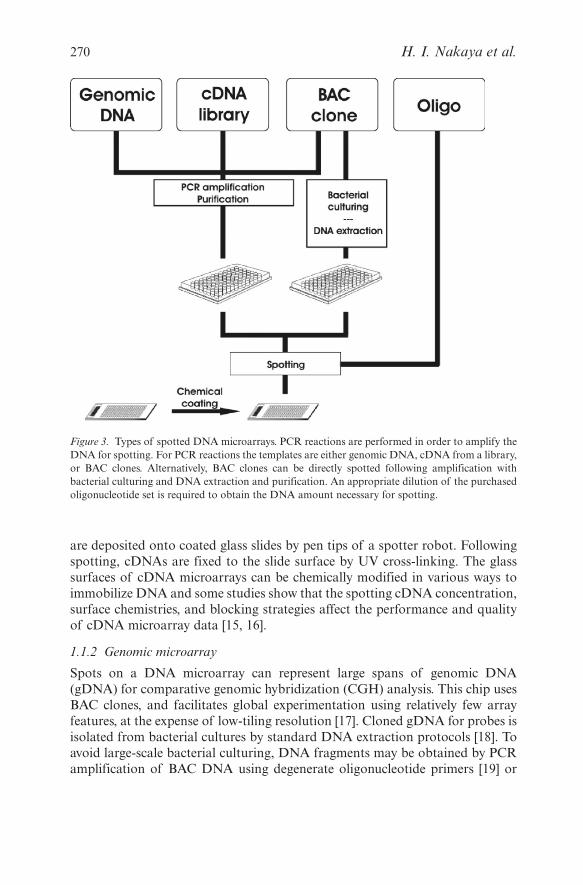
Selected DNA fragments spotted onto microarray chips can be derived fromgenomic regions, cDNA libraries, BAC clones, or synthetic oligonucleotides(Figure 3). In order to obtain the required concentration of a specific DNA forspotting, amplification and purification steps must be performed. For oligonu-cleotide microarrays, this is obtained by an appropriate dilution of the purchasedoligo set. Printing of DNA fragments is then performed by a robot arrayer usingprinting pins or piezoelectrical deposition. In general, the latter printing methodgenerates small, homogenous spots, whereas the results of contact printingdepend largely on the quality of the printing pins. Successful printing also
268 H. I. Nakaya et al.
requires controlled environmental conditions, such as optimized air humidity,temperature, and the absence of dust and dirt particles. The DNA within thecreated spots is fixed onto the array surface by covalent bonds randomly formedby cross-linking the DNA backbone of spotted probes to the chemically coatedsurface, using heat or ultraviolet radiation (UV) [12].
The advantages of being highly customizable and having a low manufacturingcost per array is balanced by the fact that substrate properties or pen-tip diam-eter of this type of microarray chip limit the density to less than 1000 featuresper cm2. Another limitation of cDNA microarrays is the possibilities of crosshybridization between mRNAs and other nonspecific elements of the cDNA clone,and the painstaking effort of maintaining accurate and viable cDNA libraries.Also, several reports show a widespread occurrence of antisense transcription inthe human genome [13, 14] and double-stranded cDNA microarrays are unable todiscriminate between sense and antisense overlapping messages. These problemsare largely circumvented by the use of oligonucleotide arrays.
1.1.1 cDNA microarray
This common variety of microarray chip uses cDNA molecules immobilized toa glass slide to assay parallel expression of RNAs transcribed from particulargenes. A cDNA is a nucleic acid molecule reversely transcribed from mRNA. Toimmobilize these molecules, a PCR amplification of cDNA libraries and purifi-cation of PCR products is needed. Double-strand DNA-amplified fragments
Concepts on microarray design for genome 269
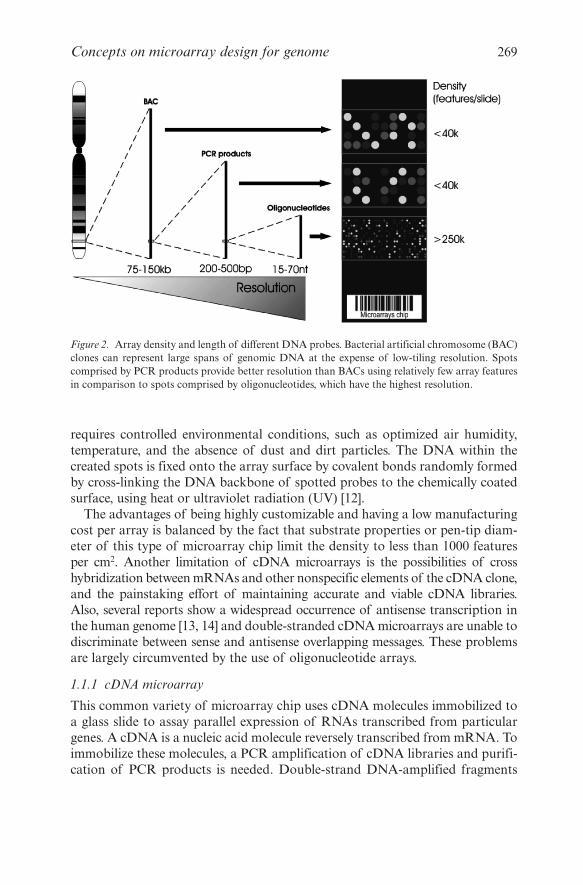
Figure 2. Array density and length of different DNA probes. Bacterial artificial chromosome (BAC)clones can represent large spans of genomic DNA at the expense of low-tiling resolution. Spotscomprised by PCR products provide better resolution than BACs using relatively few array featuresin comparison to spots comprised by oligonucleotides, which have the highest resolution.
are deposited onto coated glass slides by pen tips of a spotter robot. Followingspotting, cDNAs are fixed to the slide surface by UV cross-linking. The glasssurfaces of cDNA microarrays can be chemically modified in various ways toimmobilize DNA and some studies show that the spotting cDNA concentration,surface chemistries, and blocking strategies affect the performance and qualityof cDNA microarray data [15, 16].
1.1.2 Genomic microarray
Spots on a DNA microarray can represent large spans of genomic DNA(gDNA) for comparative genomic hybridization (CGH) analysis. This chip usesBAC clones, and facilitates global experimentation using relatively few arrayfeatures, at the expense of low-tiling resolution [17]. Cloned gDNA for probes isisolated from bacterial cultures by standard DNA extraction protocols [18]. Toavoid large-scale bacterial culturing, DNA fragments may be obtained by PCRamplification of BAC DNA using degenerate oligonucleotide primers [19] or
270 H. I. Nakaya et al.
Figure 3. Types of spotted DNA microarrays. PCR reactions are performed in order to amplify theDNA for spotting. For PCR reactions the templates are either genomic DNA, cDNA from a library,or BAC clones. Alternatively, BAC clones can be directly spotted following amplification withbacterial culturing and DNA extraction and purification. An appropriate dilution of the purchasedoligonucleotide set is required to obtain the DNA amount necessary for spotting.

linkers [20]. While oligonucleotide and small PCR fragments facilitate a moredetailed investigation at selected genomic regions, the large insert BAC clonearrays (typically ~150 kb in size) efficiently capture signals from samples of lowDNA quantity and quality for genome-wide analysis, since BAC arrays require200–400 ng of DNA, whereas oligonucleotide and cDNA platforms typicallyrequire microgram amounts [21].
1.1.3 Oligoarray
Microarray chips carrying spotted longmer oligonucleotides have recentlybecome more widely used. Single-stranded probes with 50–70 bases representingexons of genes combine the advantages of flexible and controlled probe designwith the higher probe specificity as compared to double-stranded cDNA.Presynthesis of oligos or cDNAs has the important advantage that thesequences eventually placed on the array can be exactly those desired; on theother hand presynthesis significantly increases the fixed cost attached to amultiprobe array and thus in practice limits the number of features spotted perarray to a few thousands. Pen-tip spotting methods [1, 22] will continue to be arelatively low-tech but robust and affordable method for small laboratories togenerate their own arrays, with a moderate number of features. Ink-jet methodsalso can be used to print presynthesized oligos [23]. With the recent and signif-icant improvements in spotting technology and acquisition of the genomicsequence from many organisms, whole-genome longmer oligonucleotide sets forprinting are now available for many species.
For example, a chip containing thousands of oligonucleotides has been com-mercialized by the GE Healthcare division of General Electric. This platformnamed “CodeLink Bioarray Platform” (Figure 4) is constructed by piezoelectricaldeposition of presynthesized and functionally validated 30 mer oligonucleotideprobes onto a proprietary 3D aqueous gel matrix [24]. The CodeLink platformoffers several bioarrays for both expression and single nucleotide polymorphism(SNP) studies in humans, mice, and rats [25].
1.2 In situ Synthesis
Another approach to manufacture DNA arrays employs the in situ synthesis ofoligonucleotides. Production of these microarrays requires more sophisticatedand costly equipment, and these arrays are generally produced commercially[26]. The larger vendor corporations, such as Affymetrix, NimbleGen Systems,and Agilent Technologies (Figure 5) provide suites of components, reagents, andservices. The main features of each platform are presented below.
Comprehensive comparative studies of data generated from the most widelyused commercial platforms have been carried out by different laboratories[27–29]. In each study, gene expression measurements from the platforms beingcompared were generated from a common source of biologically differentRNAs. Correlations in expression levels and comparisons for significant expression
Concepts on microarray design for genome 271

272 H. I. Nakaya et al.
Figure 4. CodeLink bioarray platform. A unique and well characterized 30 mer oligonucleotide foreach gene is deposited on a proprietary 3D gel matrix. Attachment is accomplished through covalentinteraction between the amine-modified group present on the 5′-end of the oligonucleotide and theactivated functional group present in the gel matrix. The 3D gel matrix provides an aqueousenvironment, allowing for maximal interaction between probe and target.
Synthesis in situ Spotting
Agilent Technoligies Affymetrix
AF
FY
ME
TR
IX
Nim
bleGene
CodeLink
Whole H
uman G
enome
NimbleGen Systems GE Healthcare (CodeLink)
Agilent
Figure 5. The four major vendors of microarray chips. For the three commercial microarrays on theleft the oligonucleotides are synthesized in situ, whereas for the array on the right they are pre-synthesized and spotted.
changes in genes present on all platforms, revealed considerable divergenceacross platforms [27, 29]. Unsupervised clustering and principle componentanalysis suggested that the largest variation in measurements from the commer-cial platforms was attributable to the platforms themselves. Although gene setsdid overlap to some extent across these platforms, the majority of genes thatwere identified as differentially expressed were exclusively identified with eachtechnology [27]. Other sources of divergence across platforms can be attributedto the detection of distinct types or sets of alternatively spliced transcript vari-ants, represented in each array [28] and by the labeling/hybridization protocolsof each technology – one-color based microarrays (Affymetrix and CodeLink)compared to the two-color arrays from Agilent [29]. However, later analysesunder more controlled conditions have demonstrated that good reproducibilitycan be achieved across laboratories and platforms [30–32]. The conclusion ofthese latter studies is that the main factors that influence variation are the bio-logical samples and human factors, rather than technical diversity. Specificattention can be given to these negative factors in order to minimize inconsis-tencies; nevertheless a small degree of variability is probably unavoidable withsuch a sensitive and complex technology.
1.2.1 Affymetrix
By applying photolithographic technologies derived from the semiconductorindustry to the fabrication of high-density microarrays, Affymetrix of SantaClara, California, pioneered this field and has dominated for many years. High-density Affymetrix oligonucleotide arrays, also called GeneChips have becomethe pharmaceutical industry standard owing to its extensive genetic content,high levels of reproducibility, and minimal start up time [11]. A major advan-tage of GeneChips is that they are designed in silico, thereby eliminatingmanagement of DNA clone libraries or oligonucleotide sets, and the possibilityof misidentified tubes, clones, or features [33]. The disadvantage of this plat-form is that it demands a dedicated scanner and utilizes short 25 mer oligonu-cleotides, which are less sensitive than the longer 60 mers utilized in othertechnologies. Additionally, to increase sensitivity multiple oligonucleotides arerequired for transcript detection.
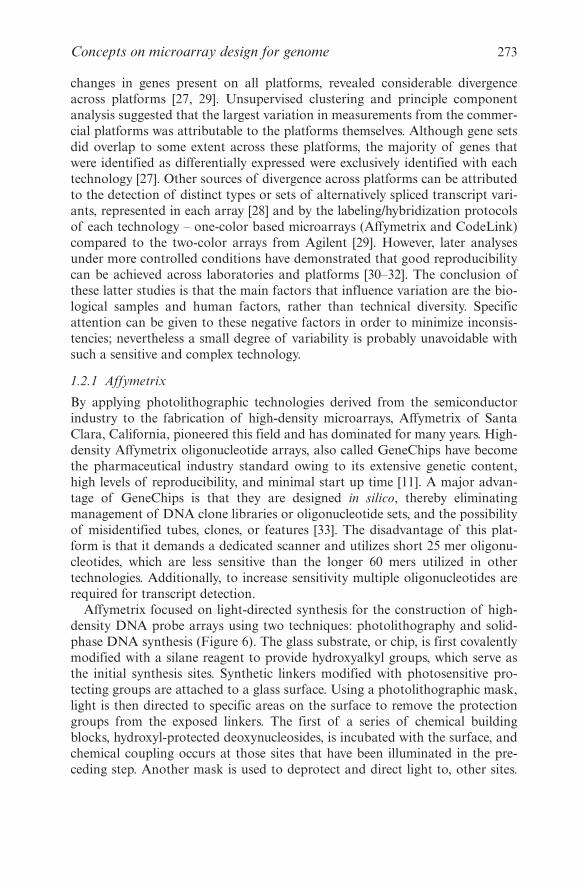
Affymetrix focused on light-directed synthesis for the construction of high-density DNA probe arrays using two techniques: photolithography and solid-phase DNA synthesis (Figure 6). The glass substrate, or chip, is first covalentlymodified with a silane reagent to provide hydroxyalkyl groups, which serve asthe initial synthesis sites. Synthetic linkers modified with photosensitive pro-tecting groups are attached to a glass surface. Using a photolithographic mask,light is then directed to specific areas on the surface to remove the protectiongroups from the exposed linkers. The first of a series of chemical buildingblocks, hydroxyl-protected deoxynucleosides, is incubated with the surface, andchemical coupling occurs at those sites that have been illuminated in the pre-ceding step. Another mask is used to deprotect and direct light to, other sites.
Concepts on microarray design for genome 273
New deoxynucleosides are added and the process is repeated until the desiredlength of oligonucleotide is synthesized. The amount of nucleic acid informa-tion encoded on the array in the form of different probes is limited only by thephysical size of the array and the achievable lithographic resolution. A 1.28 ×1.28 cm array can include over a million different oligonucleotide sequences.
For gene expression purposes, the oligonucleotides are generally 25 bases longand each transcript is represented by 11–20 such probes. Probe sequences areideally spread throughout the gene sequence, and are generally more concen-trated at the 3′-end. In addition, each perfect match (PM) probe is paired witha mismatch (MM) probe, an identical probe except for a single base differencein a central position. The MM probes act as specificity controls and enablesubtraction of background and cross-hybridization. The use of multiple inde-pendent probes for each gene greatly improves signal-to-noise ratios, improvesthe accuracy of RNA quantization (averaging and outlier rejection), increasesthe dynamic range and reduces the rates of false positive and miscalls [9].
274 H. I. Nakaya et al.
O O O O O O O O O O OHOH
OHOH
O O OT–
T–T–
C–
C–C–
+
+
T T O O O
T T O O O
O O OT T O O O
G C T C A
T A C G GC G T A TG C T C AA C G A TT T C C G
Wafer
Mask
25-mer Repeat
Photolithografic maskfor each of the fourbases at each layer
Affymetrix
Light(deprotection)
Light-sensitiveprotecting group
Figure 6. Construction of an Affymetrix chip by light-directed oligonucleotide synthesis. Lightis directed through a mask to deprotect and activate selected sites, and new protected nucleotides(in this example, thymidine derivatives) couple to the activated sites. The process is repeated,activating different sets of sites and coupling different bases (in this example, cytosine derivatives)allowing arbitrary DNA probes to be constructed at each site.
1.2.2 NimbleGen systems
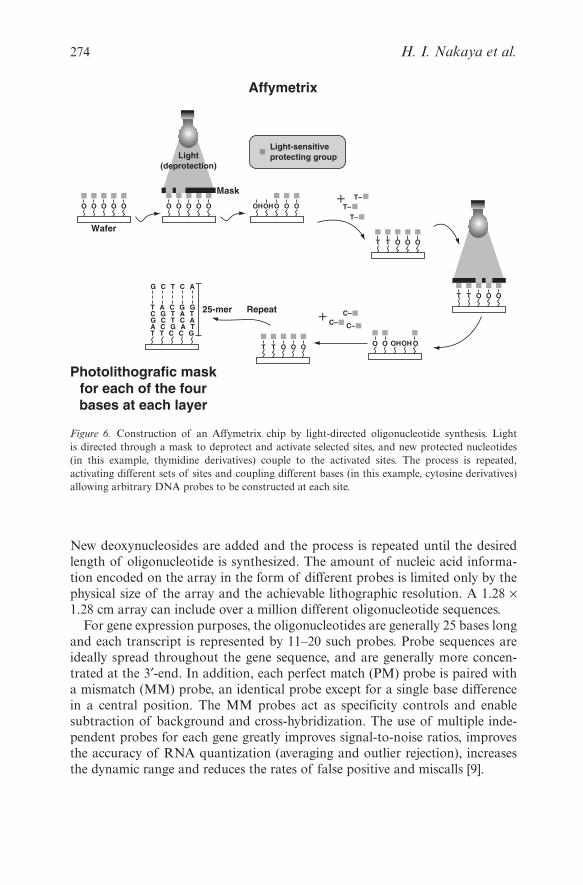
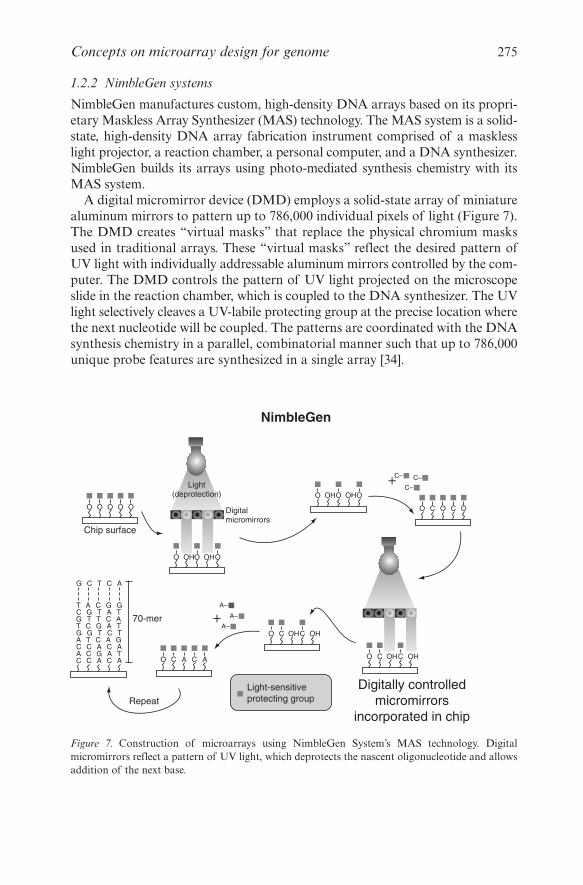
NimbleGen manufactures custom, high-density DNA arrays based on its propri-etary Maskless Array Synthesizer (MAS) technology. The MAS system is a solid-state, high-density DNA array fabrication instrument comprised of a masklesslight projector, a reaction chamber, a personal computer, and a DNA synthesizer.NimbleGen builds its arrays using photo-mediated synthesis chemistry with itsMAS system.
A digital micromirror device (DMD) employs a solid-state array of miniaturealuminum mirrors to pattern up to 786,000 individual pixels of light (Figure 7).The DMD creates “virtual masks” that replace the physical chromium masksused in traditional arrays. These “virtual masks” reflect the desired pattern ofUV light with individually addressable aluminum mirrors controlled by the com-puter. The DMD controls the pattern of UV light projected on the microscopeslide in the reaction chamber, which is coupled to the DNA synthesizer. The UVlight selectively cleaves a UV-labile protecting group at the precise location wherethe next nucleotide will be coupled. The patterns are coordinated with the DNAsynthesis chemistry in a parallel, combinatorial manner such that up to 786,000unique probe features are synthesized in a single array [34].
Concepts on microarray design for genome 275
O O O O O
O OHO OHO
Chip surface
70-mer
Repeat
NimbleGen
Light(deprotection)
Digitalmicromirrors
Digitally controlledmicromirrors
incorporated in chip
Light-sensitiveprotecting group
O C A C A
O C OHC OH
O C OHC OH
O C O C O
O OHO OHO
C–
A–
A–
A–
C–
C–+
+
G C T C A
T A C G GC G T A TG T T C AT C G A TG G T C TA T C A GC C A C AA C G A TC C A C A
Figure 7. Construction of microarrays using NimbleGen System’s MAS technology. Digitalmicromirrors reflect a pattern of UV light, which deprotects the nascent oligonucleotide and allowsaddition of the next base.

The light-directed synthesis methods, both photolithographic [35] and digitalmicromirror-based [34], have the potential to achieve feature sizes not muchlarger than a wavelength of light. This should enable substantial further reduc-tions in cost and in hybridization volume with consequent reduction in theamount of biological sample required.
1.2.3 Agilent technologies
Agilent Technologies uses proprietary SurePrint ink-jet technology and offers aflexible microarray platform. Oligonucleotides (60 mer long) are synthesizedin situ and are built up a base at a time on standard glass slides, resulting inarrays with more than 230,000 unique features. The iterative oligonucleotidesynthesis loop begins when the first nucleotide of each oligo is printed onto theactivated glass surface of the microarrays. In phosphoramidite synthesisreactions, the reactive sites on the nucleotides are blocked with chemical groupsthat can be removed selectively. This allows the bases to be added to the oligochain one base at a time in a very controlled manner. After the first base isprinted, the trityl group that protects the 5′-hydroxyl group on the nucleotide isremoved and oxidized to activate it, enabling it to react with the 3′-group onthe next nucleotide. In between each step, the excess reagents are washed awayso that they will not randomly react later in the synthesis. The process ofprinting a nucleotide followed by detritylation, oxidation, and washing isrepeated 60 times (Figure 8). After the last base in the oligo chain is printed,the microarrays undergo a final deprotection step, before moving on to qualitycontrol testing [36]. Ink-jet synthesis yields are ~98% per stage with chemicaldeprotection, as opposed to ~95% for photodeprotection, allowing the ink-jettechnology to be optimized with longer oligos and higher stringencyhybridization conditions. In situ ink-jet synthesis should have a valuable nichefor rapid turnaround of custom arrays in small lots, unless it is overtaken by themicromirror technologies.
This 60 mer oligonucleotide platform contrasts with the short 25 mers probesemployed by Affymetrix. Although short oligonucleotides should in theoryprovide the greatest discrimination between related sequences, they often havepoor hybridization properties. The 60 mers provide enhancements in sensitivityover 25 mers in part due to the larger area available for hybridization. In light-directed synthesis, failure of photodeprotection at any stage terminates theoligo. The yields per stage in the Affymetrix synthesis process are such thatattempts to make 60 mers would result in very few of them running to even halfthat length; Affymetrix settled on 25 mers partly for this reason. Another advan-tage of Agilent chips is that only one 60 mer per gene or transcript is required[36]. The reason why Affymetrix uses multiple probe pairs to estimate the abun-dance of each target transcript is partly by the need to make up for the per-formance limitations of 25 mers.
276 H. I. Nakaya et al.

2. SELECTING THE PROBES
For a given organism under study, DNA microarray probes can be designed assoon as a sequence of genomic region or transcript from that species becomesavailable. With several whole-genomes already sequenced and millions ofexpressed sequence tags (ESTs) deposited into public databases, microarrays areable to increase our understanding of basic biological processes if the investigatorselects a set of probes that are suitable to answer specific question, as discussedin the following sections.
The probe sequences used in gene-oriented arrays are selected on the basis ofgene and EST data from public databases according to a number of criteria;most importantly, they should be unique for the gene (avoiding, e.g. character-istic sequences of gene families). To minimize the probability of unspecific tar-get cross-hybridization, sequence comparison in silico tests can be performedbetween each probe and all known transcripts from that species using basic localsequence alignment tool (BLAST). Probes with a unique exact-match target areideal; for 50–70 mer oligonucleotide probes, mismatched target sequences withno more than 35% identity with no gaps are usually desirable, to decrease theprobability of cross-hybridization. In addition, probes should be relatively uniform
Concepts on microarray design for genome 277
OO
O
O
O
O
HO
O
O
O
OPMeO
5'
3'
3'
O
O
O
HO5'
5'
O
P
MeO N(iPr)2
O
O
OPMeOOxidationDeprotection
OOPMeO
ODMT
ODMT
O
O
O
OPMeO
3'O
OOPMeO
Base n+1
Ink-jet printerhead
depositionof nucleotides
layer bylayer
Agilent
Base n+2
Base n+2
Base n+1
Base n
Base n
Microarray surface
Repeat Base n+2
Base n+1
Base n
Microarray surface
Microarray surface
Me = methyl
DMT = dimethoxytrityl
iPr = isopropyl
+
Figure 8. Ink-jet synthesis of probes in the Agilent microarray chips. This figure shows the generalcycle of oligo synthesis via phosphoramidite chemistry.

in their hybridization properties, which are determined by a similar overallgyanine–cytosine (GC) content, melting temperature (Tm), and tendency toform secondary structure.
Microarrays aim to provide accurate measurements of true expression valuesof the phenomenon under study. This is achieved by a high specificity (reducedfalse–positive rate) and a high sensitivity (reduced false–negative rate) ofmicroarray probes. cDNA probes or longer oligonucleotide probes providegreater sensitivity at the expense of reduced specificity.
In general, the specificity of oligonucleotide probes is evaluated by experi-ments using target RNAs that share various degrees of sequence similarity [36, 37].For a given hybridization stringency condition and protocol, these experimentsdetermine the maximal degree of sequence similarity for which no cross-hybridization is detected, thus revealing the probe parameters for good specificity.These parameters can be applied for the design of novel probes that should workwell with the predefined hybridization protocol.
Probe sensitivity is generally defined as the lowest target concentration atwhich an acceptable accuracy is obtained [36, 38]. For a given organism, addi-tional control probes containing DNA sequences with no homology to anyknown transcript or to the genome sequence are often used to estimate the cut-off detection limit parameters. Moreover, tiling arrays can use signal intensityinformation of consecutive probes in a predefined transcriptional unit in orderto determine a detection cutoff that can be applied to identify novel transcriptsin nonannotated genomic regions [13, 14].
2.1 Gene-Oriented Arrays
Microarrays designed for measuring gene expression levels are generally biasedtoward known and predicted protein-coding genes. These genes can be deter-mined using several approaches, such as large-scale sequencing of ESTs, com-parative genomic annotation, or full-length cDNA cloning experiments. Oncethe gene sequence is obtained, cDNA or oligonucleotide probes can be designedand placed onto a microarray chip. Then, expression levels of genes can beassessed by relative hybridization between these probes and labeled targetsderived from different cell conditions or types. Although independent experi-ments are required to validate selected probes in terms of specificity and sensi-tivity (discussed above), signal intensity comparison of a given probe underdifferent controlled conditions can be used to estimate cutoff detection limitparameters that increase the specificity of measurements.
Compared to tiling arrays, the gene-oriented platform is a relatively easy-to-handle tool since it uses relatively few probes for each gene. A single chip iscapable of measuring the expression levels of all known messages of specifictypes of transcripts, being these messages protein-coding genes [39] or, for exam-ple, intronic noncoding RNAs [40] and micro-RNAs [41]. Pre-mRNA splicingat every exon–exon junction [42] or SNPs [43] of thousands of genes can also be
278 H. I. Nakaya et al.

monitored using this platform. Therefore, this tool has the advantage that a rapidevaluation of the differences between two or more transcriptomes can be madeby hybridizing the different cDNA preparations to identical chips and comparingthe hybridization patterns.
2.2 Epigenomic Microarrays
Only a minor fraction of eukaryotic genomes is occupied by genes; however,histone and nonhistone chromosomal proteins and methylated DNA bases aredistributed over both genic and intergenic regions. Once mapped, the microar-ray platform can be used to obtain the profiling patterns of these widespreadepigenomic features, such as DNA methylation [44], DNA replication [45],DNA binding, and chromatin-associated proteins and histone modifications[46]. Alternatively to the already-mapped sites, microarray-based strategies areable to identify novel DNA binding sites or novel DNA methylation regions byprobing upstream and downstream regions of genes [47], or by probing pre-dicted CpG islands of a genome [44]. Certainly, epigenomic microarrays willbecome a standard research tool for understanding chromatin structure andgene expression during development [46].
Similar to gene-oriented arrays, epigenomic microarrays are easy-to-handletools in comparison to tiling arrays and permit that many different experimentsbe performed at a low cost and lower labor analysis. However, for identificationof the complete set of epigenomic features of an organism, a tiling-array plat-form is the best tool since it covers long contiguous genomic regions.
2.3 Tiling Arrays
With the completion of sequencing of many genomes, attention has shifted todetermining the complete set of transcribed sequences and regulatory elements.This recent trend in genomics has involved the development of tiling arrays:microarrays that represent a complete non-repetitive tile path over a locus, chro-mosome or whole-genome, irrespective of any genes that may be annotated inthat region [17]. Potential uses for such unbiased representation of gDNAinclude empirical annotation of the transcriptome [48], chromatin-immunopre-cipitation-chip studies [49], characterization of the methylation state of CpGislands [50], analysis of alternative splicing [48, 51], and CGH [52].
Numerous options exist for tiling genomic sequences with oligonucleotides orPCR products, leading to microarray designs of different sequence resolutionsand feature densities (Figure 9). Oligonucleotide arrays comprise 25–70 bpprobes, which are synthesized directly on the slides or prepared in solution andthen deposited. The second type of tiling array is constructed using PCR prod-ucts typically of ~1 kb in length, or BAC arrays – typically at 1 Mb resolution(see Section 1). One caveat of PCR-based tiling arrays is that their constructionis labor intensive and therefore they are not readily scalable to the study of large
Concepts on microarray design for genome 279
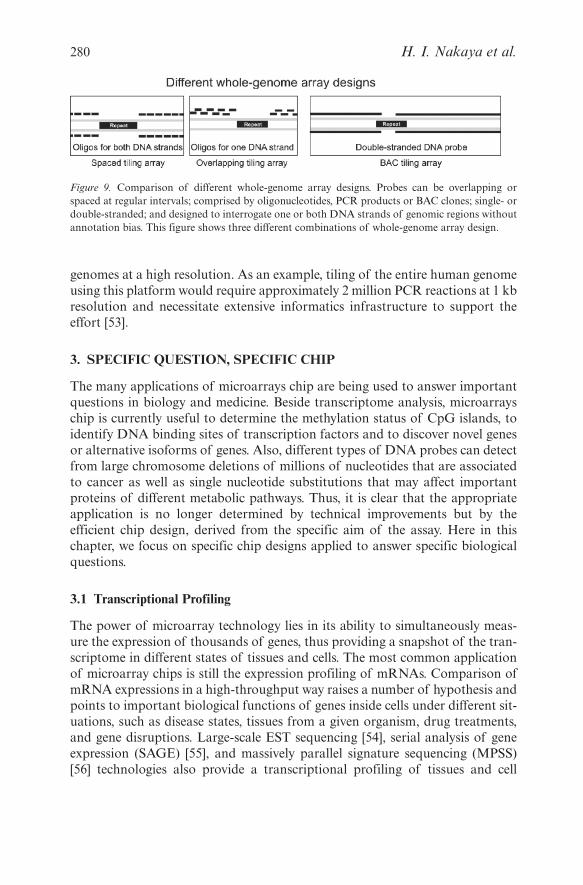
genomes at a high resolution. As an example, tiling of the entire human genomeusing this platform would require approximately 2 million PCR reactions at 1 kbresolution and necessitate extensive informatics infrastructure to support theeffort [53].
3. SPECIFIC QUESTION, SPECIFIC CHIP
The many applications of microarrays chip are being used to answer importantquestions in biology and medicine. Beside transcriptome analysis, microarrayschip is currently useful to determine the methylation status of CpG islands, toidentify DNA binding sites of transcription factors and to discover novel genesor alternative isoforms of genes. Also, different types of DNA probes can detectfrom large chromosome deletions of millions of nucleotides that are associatedto cancer as well as single nucleotide substitutions that may affect importantproteins of different metabolic pathways. Thus, it is clear that the appropriateapplication is no longer determined by technical improvements but by theefficient chip design, derived from the specific aim of the assay. Here in thischapter, we focus on specific chip designs applied to answer specific biologicalquestions.
3.1 Transcriptional Profiling
The power of microarray technology lies in its ability to simultaneously meas-ure the expression of thousands of genes, thus providing a snapshot of the tran-scriptome in different states of tissues and cells. The most common applicationof microarray chips is still the expression profiling of mRNAs. Comparison ofmRNA expressions in a high-throughput way raises a number of hypothesis andpoints to important biological functions of genes inside cells under different sit-uations, such as disease states, tissues from a given organism, drug treatments,and gene disruptions. Large-scale EST sequencing [54], serial analysis of geneexpression (SAGE) [55], and massively parallel signature sequencing (MPSS)[56] technologies also provide a transcriptional profiling of tissues and cell
280 H. I. Nakaya et al.
Figure 9. Comparison of different whole-genome array designs. Probes can be overlapping orspaced at regular intervals; comprised by oligonucleotides, PCR products or BAC clones; single- ordouble-stranded; and designed to interrogate one or both DNA strands of genomic regions withoutannotation bias. This figure shows three different combinations of whole-genome array design.

types. However, these techniques are relatively more expensive and less flexiblethan microarray technology.
In 1995, microarray technology was used for the first time to assess the tran-scriptional profiling of ~1000 Arabidopsis genes [1]. This number represents only4% of the 26,330 annotated genes from Arabidopsis. Since then, microarraytechnology has evolved fast and cDNA/oligo microarray platforms containingall genes from this organism are now available (Figure 10). In 11 years ofresearch, more than 60 papers were published by different labs across the world,reporting changes on transcriptional levels of Arabidopsis genes using microar-ray chips (Figure 10). Such simultaneous measurements of Arabidopsis geneexpression helped scientists to gain comprehensive insights into the response ofArabidopsis to several environmental conditions.
Microarray probes can only be designed based on previous information ofsequences of known or predicted genes. The exon structure of a gene defineswhere probes can be designed. In general, probes are designed close to the 3′-endof the transcript. The reason is that most of labeling protocols use the poly-Atail of target mRNAs for priming the labeling reaction.
Microarray chips are valuable tools for functional genomic studies and couldaccelerate the annotation of novel genes. Thanks to the large number of EST
Concepts on microarray design for genome 281
1995
Oct
Nu
mb
er o
f tr
ansc
rip
tio
nal
pro
filin
g p
aper
s
1995
1996
1997
1998
1999
2000
2001
2002
2003
2004
2005
2006
Ara
bid
op
sis
gen
es o
n t
he
mic
roar
rays
0
02468
1012141618
Transcriptionalprofiling papers
5000
10000
15000
Year
Release ofArabidopsis genome
Oligo microarrays
cDNA microarrays
Publication date
20000
25000
30000
1996
Aug
1997
Jan
1998
Apr
1999
Feb
1999
Dec
2000
Oct
2001
Aug
2002
Jun
2003
Apr
2004
Feb
2004
Dec
2005
Oct
Figure 10. Use of microarray technology to assess transcriptional profiling. The line graph showsthe increasing number of Arabidopsis genes represented in oligo and cDNA microarrays that wereused in the Arabidopsis transcriptional profiling papers, which were published between 1995 and2006. The number of such published papers is shown on the bar graph.

sequencing projects and the complete sequencing of many genomes, bioinfor-matics analysis can predict thousands of genes. Tissue-specific pattern ofmRNA expression of known and predicted genes can confirm their expressionand give important clues about gene function [39]. The gene atlas of the mouseand human protein-encoding transcriptomes, described by Su et al. [39], identi-fies hundreds of regions of correlated transcription and show that some genesare subject to both tissue and parental allele-specific expression, suggesting alink between spatial expression and imprinting. Also, hypotheses about thebiological roles of genes with unknown function can be raised by comparison oftheir expression levels with possible coregulated known genes [57]. In addition,the identification of groups of genes with similar expression profiles canuncover gene families or metabolic pathways that are affected in a specificcondition [58].
The use of arrays as tools for gene expression profiling on a genomic scale hassome limitations. One is that this technology is only able to measure relative levelsof mRNA expression, and not absolute amounts. Another current limitation isthat it is not reliable to compare the levels of different mRNAs from the samesample, due to differences on labeling and hybridization of each probe andtarget. Recently, these limitations started to be addressed by different approachesthat allow quantitative estimation of absolute endogenous transcript abundancesin cells, that are based on a common oligonucleotide reference [59] or on a set ofexogenous RNA controls [60]. Moreover, most hybridization arrays are notdesigned to differentiate between alternatively spliced transcripts of the samegene and, in some cases, between highly homologous members of a gene family.Finally, a change in messenger RNA does not necessarily correlate with a changein protein expression [61], and the translated protein often requires furthermodifications to attain its full activity. These latter two points are a common andlegitimate criticism of array technology because it measures an intermediate step(mRNA levels) and not a functional product (active protein). However, untilsensitive and reproducible proteomic technologies become universally accessibleto the research community, hybridization arrays will continue to be the bestopportunity for studying gene expression on a genomic scale [62].
3.2 Comparative Genome Hybridization
The CGH array technique allows the detection of chromosomal copy numberchanges on a genome-wide and with a high-resolution scale. It is used in humangenetics and oncology, with great promise for clinical application. In typicalCGH experiments, test and control DNA samples (e.g. tumor and normal cells)are isolated and used to create fluorescently labeled probes, typically cyanine-3(Cy3) and cyanine-5 (Cy5). The probes are pooled and competitively cohy-bridized to a glass slide spotted with a known array of mapped genomic clones,cDNAs, or oligonucleotides. Log ratios of the Cy5–Cy3 intensities are measuredfor each clone. Next, a log ratio profile is assembled to determine relative copy
282 H. I. Nakaya et al.
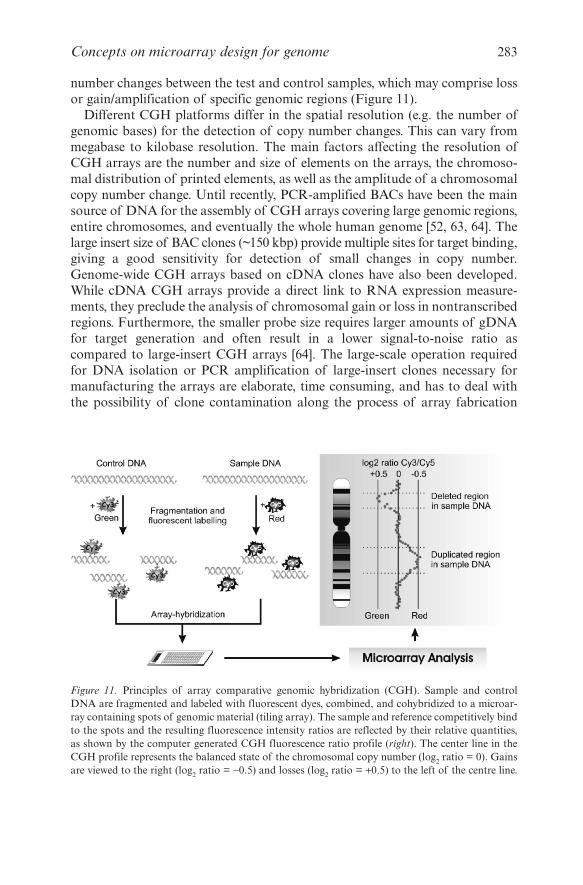
number changes between the test and control samples, which may comprise lossor gain/amplification of specific genomic regions (Figure 11).
Different CGH platforms differ in the spatial resolution (e.g. the number ofgenomic bases) for the detection of copy number changes. This can vary frommegabase to kilobase resolution. The main factors affecting the resolution ofCGH arrays are the number and size of elements on the arrays, the chromoso-mal distribution of printed elements, as well as the amplitude of a chromosomalcopy number change. Until recently, PCR-amplified BACs have been the mainsource of DNA for the assembly of CGH arrays covering large genomic regions,entire chromosomes, and eventually the whole human genome [52, 63, 64]. Thelarge insert size of BAC clones (~150 kbp) provide multiple sites for target binding,giving a good sensitivity for detection of small changes in copy number.Genome-wide CGH arrays based on cDNA clones have also been developed.While cDNA CGH arrays provide a direct link to RNA expression measure-ments, they preclude the analysis of chromosomal gain or loss in nontranscribedregions. Furthermore, the smaller probe size requires larger amounts of gDNAfor target generation and often result in a lower signal-to-noise ratio ascompared to large-insert CGH arrays [64]. The large-scale operation requiredfor DNA isolation or PCR amplification of large-insert clones necessary formanufacturing the arrays are elaborate, time consuming, and has to deal withthe possibility of clone contamination along the process of array fabrication
Concepts on microarray design for genome 283
Figure 11. Principles of array comparative genomic hybridization (CGH). Sample and controlDNA are fragmented and labeled with fluorescent dyes, combined, and cohybridized to a microar-ray containing spots of genomic material (tiling array). The sample and reference competitively bindto the spots and the resulting fluorescence intensity ratios are reflected by their relative quantities,as shown by the computer generated CGH fluorescence ratio profile (right). The center line in theCGH profile represents the balanced state of the chromosomal copy number (log2 ratio = 0). Gainsare viewed to the right (log2 ratio = −0.5) and losses (log2 ratio = +0.5) to the left of the centre line.

[65]. CGH arrays comprised of synthetic oligonucleotides are emerging as analternative technology to eliminate the need for clone management and lessenprobe identity errors. Assembly of high-density arrays composed of small (25-60 nt) oligonucleotide probes are likely to provide a better resolution thanBAC and cDNA arrays [65]. Oligonucleotide CGH arrays are readily availablethrough academic institutions (Sanger Center, UCSF, DKFZ) as well asthrough commercial suppliers (Agilent, Affymetrix, NimbleGen). In practice,current resolution of oligonucleotide CGH arrays is limited by the lower signal-to-noise ratio from individual probes, which requires that measured intensitiesfrom several adjacent probes are combined to calculate a moving average ofsignal intensities. Also, methods for reduction of genome complexity are oftenapplied to limit nonspecific target binding to short oligonucleotide probes suchas those present in Affymetrix platforms [66]. Future developments in gDNAtarget amplification and labeling will be required to expand the use of whole-genome tiling oligoarrays for CGH analysis [66].
3.3 Alternative Splicing
Almost all protein-coding genes of humans have a split structure with severalexons and introns. Intronic sequences are removed from the primary transcriptby the process of pre-mRNA splicing, an essential step in eukaryotic geneexpression. Alternative splicing is the differential processing of exon junctionsto produce a new transcript variant from one gene, and is a major determinantof the protein functional diversity underlying human physiology, development,and behavior [67]. Much of the available genomic information on alternativesplicing is derived by the alignment and conservation analysis of large numbersof ESTs and messenger RNAs to genome sequences of different organisms[68, 69]. In general, exons are called “constitutive” when are presented in everyexample of a transcript from a given locus and called “alternative” if they aresometimes skipped. Efforts are now being directed at studying relevant tran-script variants generated by alternative splicing at a global level.
Microarrays offer a high-resolution means for monitoring pre-mRNA splic-ing on a genomic scale. The use of this technology has permitted the discoveryof new alternative splicing events not previously detected in cDNA or ESTsequences [42] and large-scale detection of cell- and tissue-specific alternativesplicing events involving exons that were initially identified using EST/cDNAsequence data [70, 71]. Moreover, alternative splicing microarrays have facili-tated the global analysis of alternative exons regulated by specific splicingfactors [72, 73] and have led to the discovery of sequence motifs that correlatewith tissue-specific alternative splicing [74].
The splice array is based on the design of probes located on constitutiveexons, alternative exons, as well as on the constitutive and alternative splicejunctions. Frey et al. [75] designed a platform containing probes for all 1.14million putative exons of the mouse genome and Johnson et al. [42] for every
284 H. I. Nakaya et al.
exon–exon junction in more than 10,000 multiexon human genes. In addition,other groups [70, 76–78] used splicing-sensitive microarray containing both exonand splice junction oligonucleotide probes to assay splicing of a large number ofhuman genes. This platform permits the detection of all different types of spliceevents: exon skipping, novel exon, internal exon deletion, intron retention, oralternative usage of splice donor or acceptor sites. Another microarray formatemploying a fiber-optic-based system for the detection of specific splice variantshas been described, and this approach has been used to monitor splice variantsin different transformed cell lines and tumors [79–81].
Probes should be designed with homogeneous Tm and similar lengths to obtain acommon thermodynamic profile and junction probes being preferably centered onthe splice site. This positional constraint for junction probes may complicate probedesign, making probe composition not suitable to get the desired thermodynamicparameters. However, junction probes can be designed with a sequence up to twonucleotides off-centre, which maintained the expected specificity [82]. Cross-hybridization tests of probe sequences can be performed by BLAST analysesagainst the human EST databases using parameters for short, nearly exact matches.
Although longer exon probes are better for detecting exons, longer splicejunction probes present a unique problem. Since about half of a splice junctionprobe will be derived from one exon and about half from another, each junctionprobe has perfect complementarity over about half of its length to other RNAforms that contain a different exon [83]. Fehlbaum et al. [82] evaluated the speci-ficity of probes of splice arrays using three different probe lengths (24, 30, and40 mer) and labeled targets from only two variants of a gene (long and shortisoforms). Junction probes were designed to detect specifically each type of iso-form. Their results showed that the junction probes with 30 and 40 bases longdetect both isoforms. Due to potential hybridization of half of the junctionprobes to a single exon, only the 24 mer seems to have the specificity requiredfor isoform-specific detection of alternatively spliced events [82].
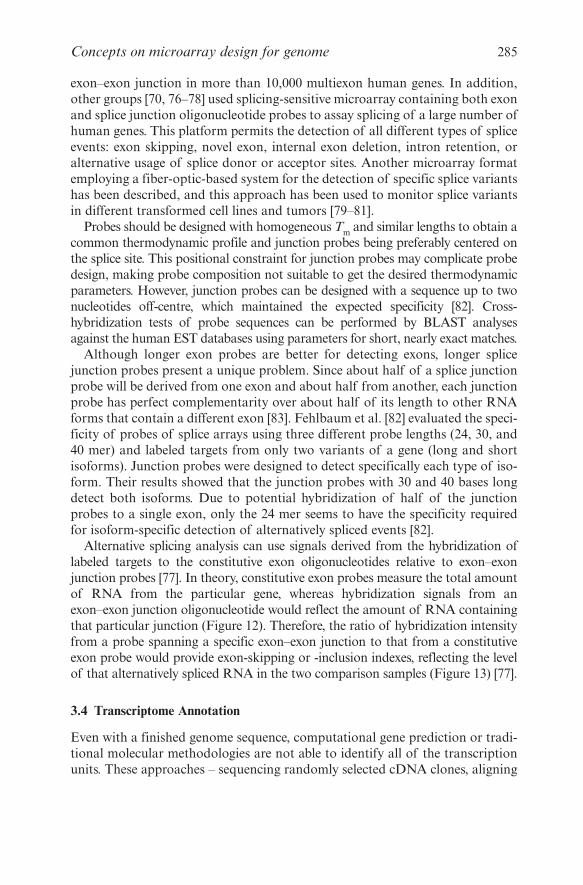
Alternative splicing analysis can use signals derived from the hybridization oflabeled targets to the constitutive exon oligonucleotides relative to exon–exonjunction probes [77]. In theory, constitutive exon probes measure the total amountof RNA from the particular gene, whereas hybridization signals from anexon–exon junction oligonucleotide would reflect the amount of RNA containingthat particular junction (Figure 12). Therefore, the ratio of hybridization intensityfrom a probe spanning a specific exon–exon junction to that from a constitutiveexon probe would provide exon-skipping or -inclusion indexes, reflecting the levelof that alternatively spliced RNA in the two comparison samples (Figure 13) [77].
3.4 Transcriptome Annotation
Even with a finished genome sequence, computational gene prediction or tradi-tional molecular methodologies are not able to identify all of the transcriptionunits. These approaches – sequencing randomly selected cDNA clones, aligning
Concepts on microarray design for genome 285
286 H. I. Nakaya et al.
Figure 12. Principles of alternative splicing detected by splicing-sensitive microarray. Probesspanning all exons and all exon–exon and exon–intron junctions are designed and placed ontomicroarrays (upper panel). The standard splicing (sample 1) and two types of alternative splicing(samples 2 and 3) of a pre-mRNA are represented as three different samples (middle panel). Sample1 is labeled with Cy3 (green) and sample 2 and 3 with Cy5 (red). Targets are mixed in two differentcombinations (sample 1 with sample 2, and sample 1 with sample 3) and each combination ishybridized to a microarray. The lower panel shows a schematic view of scanned images of these twomicroarray slides. Alternative splicing is detected by different hybridization signals of exon andjunction probes.

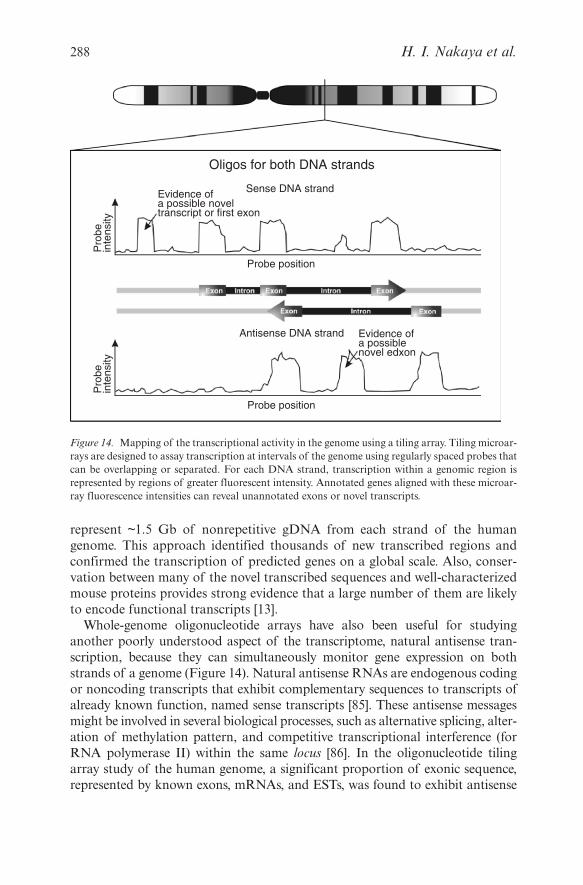
protein sequences identified in other organisms, sequencing more genomes, andmanual curation – successfully identified expressed transcripts for tens of thou-sands of genes, but they eventually reach a point of greatly diminished returns.These methods fail in detecting transcripts that are low abundance or expressed inrare cell types or in response to specific stimuli. Tiling microarrays can be used tocircumvent some of these problems, allowing confirmation of the predicted genemodels as well as being a tool for new exon and gene discovery (Figure 14) [84].
Microarray technology has permitted a refined high-throughput mapping ofthe transcriptional activity in the human genome. A pioneering study fromKapranov and colleagues [48] revealed a tenfold excess of transcriptionallyactive regions along chromosome 21 and 22 than originally predicted by map-ping of known genes. Later, this study was extended to ten human chromosomeswhere sites of transcription of polyadenylated and nonpolyadenylated RNAswere mapped at 5 bp resolution in eight cell lines [14]. Interestingly, the majorproportion of the transcriptional output of the human genome was comprisedby unannotated, nonpolyadenylated transcripts [14]. In another study, Bertoneet al. [13] constructed a set of 134 high-density oligonucleotide microarrays to
Concepts on microarray design for genome 287
Figure 13. Detection of alternative splicing by microarray. Panel A: Design of oligonucleotideprobes. The microarray probes contain oligonucleotides that target all possible exon-exon junctionsequences (J1–2, J1–3, and J2–3). Probes E1 and E3 are complementary to flanking constitutiveexons and probe E2 is complementary to alternative exon2. Panel B: Data collection and analysis.RNA samples 1 and 2 are isolated and labeled separately with Cy5 or Cy3 fluorescent dye, mixed,and hybridized to oligonucleotides in microarray. Red (Cy5) and green (Cy3) fluorescence are meas-ured and the ratio of the two values is calculated for each oligonucleotide. To assess differences insplicing pattern between the two samples, skipping indexes and inclusion indexes are calculated. Theskipping index of alternative exon2 is log2 of Cy5/Cy3 from the exon1–exon3 junction oligonu-cleotide (probe J1–3 in Panel A) divided by the mean of Cy5/Cy3 from the constitutive exons 1 and3 (probes E1 and E3 in Panel A). The inclusion index of exon2 is log2 of the mean of Cy5/Cy3 fromexon1–exon2 and exon2–exon3 (probes J1–2 and J2–3 in Panel A) divided by the mean of Cy5/Cy3from exon1 and exon3 (probes E1 and E3 in Panel A).
represent ~1.5 Gb of nonrepetitive gDNA from each strand of the humangenome. This approach identified thousands of new transcribed regions andconfirmed the transcription of predicted genes on a global scale. Also, conser-vation between many of the novel transcribed sequences and well-characterizedmouse proteins provides strong evidence that a large number of them are likelyto encode functional transcripts [13].
Whole-genome oligonucleotide arrays have also been useful for studyinganother poorly understood aspect of the transcriptome, natural antisense tran-scription, because they can simultaneously monitor gene expression on bothstrands of a genome (Figure 14). Natural antisense RNAs are endogenous codingor noncoding transcripts that exhibit complementary sequences to transcripts ofalready known function, named sense transcripts [85]. These antisense messagesmight be involved in several biological processes, such as alternative splicing, alter-ation of methylation pattern, and competitive transcriptional interference (forRNA polymerase II) within the same locus [86]. In the oligonucleotide tilingarray study of the human genome, a significant proportion of exonic sequence,represented by known exons, mRNAs, and ESTs, was found to exhibit antisense
288 H. I. Nakaya et al.
Oligos for both DNA strands
Sense DNA strandEvidence ofa possible noveltranscript or first exon
Probe position
Antisense DNA strand Evidence ofa possiblenovel edxon
Probe position
Pro
bein
tens
ityP
robe
inte
nsity
Figure 14. Mapping of the transcriptional activity in the genome using a tiling array. Tiling microar-rays are designed to assay transcription at intervals of the genome using regularly spaced probes thatcan be overlapping or separated. For each DNA strand, transcription within a genomic region isrepresented by regions of greater fluorescent intensity. Annotated genes aligned with these microar-ray fluorescence intensities can reveal unannotated exons or novel transcripts.

transcription [13]. This result demonstrates the utility of tiling arrays for helpingto unravel the high-complexity of eukaryotic transcriptomes.
3.5 Small MicroRNA Profiling
MicroRNAs (miRNAs) represent a class of small noncoding RNAs encoded inthe genomes of plants and animals that are thought to regulate gene expressionof target mRNAs. Mature miRNAs are about 22 nucleotides long and typicallyexcised from 60- to 80-nucleotide foldback RNA precursor structures [87]. In ani-mals, most miRNAs function through the inhibition of effective mRNA transla-tion of target genes through imperfect base pairing with the 3′-untranslatedregion (3′UTR) of target mRNAs [88]. Some miRNA functions include controlof cell proliferation, cell death, and fat metabolism in flies, neuronal patterningin nematodes, modulation of hematopoietic lineage differentiation in mammals,and control of leaf and flower development in plants [88]. Also, altered expres-sion of a few miRNAs has been found in some tumor types [89–92].
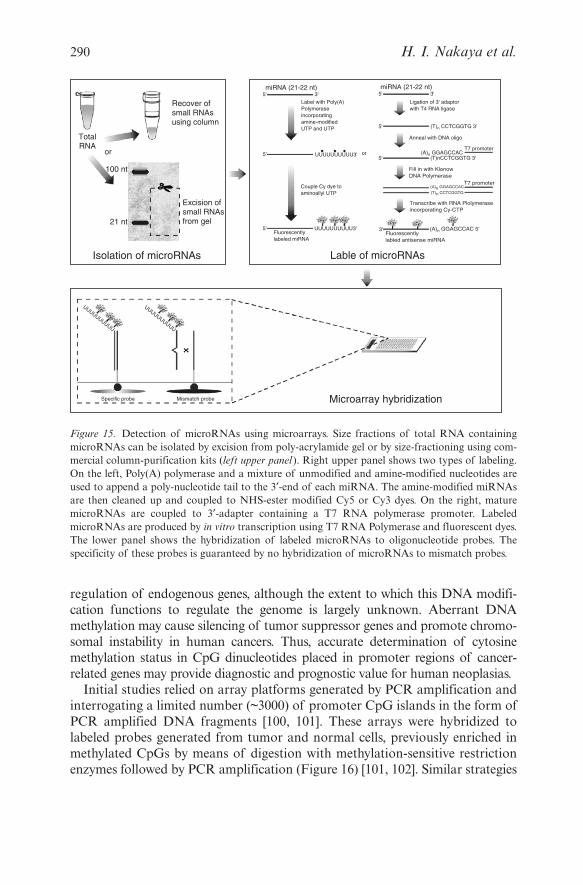
Several DNA chips have been designed to expression profile miRNAs or theirhairpin precursors across several human and mouse tissues [41, 93–97], duringmouse brain development [98] or in human B cell chronic lymphocytic leukemia[99]. Oligonucleotide probes with sequences complementary to miRNAs can bespotted [41, 93, 96–99] or in situ synthesized [94, 95] onto a microarray platformand used to capture labeled miRNAs (Figure 15). In general, miRNAs shouldbe first isolated from total RNA by excision from poly-acrylamide gel or by size-fractioning using commercial column-purification kits. Then, methods involvingPCR-based amplification or ligation strategies can be used to label mature andactive miRNAs [94–99]. A direct tiling/labeling procedure and hybridizationapproach was also developed by others [41]. Essentially, polynucleotide tails20–50 nt long are appended to the 3′-ends of all miRNAs by the poly(A)-polymerase (PAP) enzyme (Figure 15). The 3′-tail is a mixture of standard andamine-modified nucleotides, and tailed miRNAs can subsequently be labeledwith any monoreactive NHS–ester dyes, such as Cy3 and Cy5 [41].
The application of DNA microarray technology to parallel expression meas-uring of the entire endogenous set of miRNAs may offer higher sensitivity, highthroughput, and higher comparative capabilities over the other methods used todetect miRNAs, e.g. Northern blot analysis, cloning, and membrane arraysusing radioactive detection methods [95]. However, the detection of miRNAswith microarrays still meet significant difficulties, mostly due to the short size ofmiRNAs and the sequence similarity between miRNA family members.
3.6 Methylation Pattern
DNA methylation in CpG dinucleotides is an epigenetic mark crucial in regulationof gene expression. DNA methylation is required to complete embryonic develop-ment, and has been directly implicated in genomic imprinting and X chromosomeinactivation in mammals. Cytosine methylation is also important for silencing ofrepetitive elements such as transposons and retroviruses, and for epigenetic
Concepts on microarray design for genome 289
regulation of endogenous genes, although the extent to which this DNA modifi-cation functions to regulate the genome is largely unknown. Aberrant DNAmethylation may cause silencing of tumor suppressor genes and promote chromo-somal instability in human cancers. Thus, accurate determination of cytosinemethylation status in CpG dinucleotides placed in promoter regions of cancer-related genes may provide diagnostic and prognostic value for human neoplasias.
Initial studies relied on array platforms generated by PCR amplification andinterrogating a limited number (~3000) of promoter CpG islands in the form ofPCR amplified DNA fragments [100, 101]. These arrays were hybridized tolabeled probes generated from tumor and normal cells, previously enriched inmethylated CpGs by means of digestion with methylation-sensitive restrictionenzymes followed by PCR amplification (Figure 16) [101, 102]. Similar strategies
290 H. I. Nakaya et al.
TotalRNA
Recover ofsmall RNAsusing column
miRNA (21-22 nt) miRNA (21-22 nt)5'
5'
5'
5'
5'
5'
3'
3'
3'
or
Label with Poly(A)Polymeraseincorporatingamine-modifiedUTP and UTP
UUUUUUUUUU3'
Couple Cy dye toaminoallyl UTP
UUUUUUUUUU3'Fluorescentlylabeled miRNA
Specific probe Mismatch probe Microarray hybridization
UUUUUUUUUU
UUUUUUUUUU
Lable of microRNAs
(T)n CCTCGGTG 3'
Anneal with DNA oligo
(A)n GGAGCCACT7 promoter
(T)nCCTCGGTG 3'
Fill in with KlenowDNA Polymerase
Transcribe with RNA Plolymeraseincorporating Cy-CTP
(A)n GGAGCCAC 5'Fluorescentlylabled antisense miRNA
T7 promoter(A)n GGAGCCAC
(T)n CCTCGGTG
Ligation of 3' adaptorwith T4 RNA ligase
Excision ofsmall RNAsfrom gel
Isolation of microRNAs
21 nt
or
100 nt
Figure 15. Detection of microRNAs using microarrays. Size fractions of total RNA containingmicroRNAs can be isolated by excision from poly-acrylamide gel or by size-fractioning using com-mercial column-purification kits (left upper panel). Right upper panel shows two types of labeling.On the left, Poly(A) polymerase and a mixture of unmodified and amine-modified nucleotides areused to append a poly-nucleotide tail to the 3′-end of each miRNA. The amine-modified miRNAsare then cleaned up and coupled to NHS-ester modified Cy5 or Cy3 dyes. On the right, maturemicroRNAs are coupled to 3′-adapter containing a T7 RNA polymerase promoter. LabeledmicroRNAs are produced by in vitro transcription using T7 RNA Polymerase and fluorescent dyes.The lower panel shows the hybridization of labeled microRNAs to oligonucleotide probes. Thespecificity of these probes is guaranteed by no hybridization of microRNAs to mismatch probes.

Concepts on microarray design for genome 291
Figure 16. Restriction enzyme-based strategies for DNA methylation profiling. Methylation-sensitive restriction endonucleases and frequent cutter enzymes are used in the procedures. Adapter-specific aminoallyl-PCR’s selectively enrich unmethylated (left) or hypermethylated (right) DNAfractions. DNA fragments are fluorescently labeled and hybridized to microarray which containsDNA spots representing CpG island sequences.

were developed for use of higher coverage platform such as whole-genome BACspotted arrays [103, 104], and more recently, for the unbiased fine-mapping ofmethylation patterns of chromosomes 21 and 22 using tiling microarraysconsisting of over 340,000 oligonucleotide probe pairs [105].
A different strategy for methylation analysis is based on the use of bisulfiteoligonucleotide arrays (Figure 17). Sodium bisulfite treatment of DNA deami-nates cytosine to uracil, but 5′-methylcytosine is protected. Unmethylated DNAthat is treated with bisulfite contains uracil in place of cytosine and willhybridize relatively poorly to microarray oligonucleotides that contain guanines.Methylated cytosines in DNA sequences that cannot be changed by bisulfite
292 H. I. Nakaya et al.
Figure 17. Bisulfite detection of methylation patterns. For each CpG island sequence, the microar-ray contains two oligonucleotide probes; one to detect the unmodified sequence and another todetect the bisulfite-altered sequence.

treatment will retain their ability to hybridize to the oligonucleotide arrays. Builton this principle, microarrays were designed comprising oligonucleotides corre-sponding to methylated and unmethylated versions of the sequence of the CpGislands of a given gene, thus allowing detection of the methylation status ofmultiple genes simultaneously (Figure 17). The methylated version of a probeset should differ by at least 3 nt (of 21 bp) from the unmethylated one, whichwill eliminate any possible cross-hybridization between methylated andunmethylated DNA of a given gene [106]. As a result, a much strongerhybridization signal should be detected for a methylated probe set if there ismethylation and vice versa. Oligonucleotide arrays interrogating CpG islands(19-25 mer) may be synthesized in situ [107] or result from spotting of presyn-thesized oligonucleotides [106, 108–111]. Although informative and precise, theuse of bisulfite oligoarrays may be limited in genome-wide studies due to (1) lossof probe specificity resulting from the degeneration of the code caused by theconversion of unmethylated cytosines, and (2) the difficulty to design suitableoligonucleotide probes that would exhibit similar Tm and hybridization behav-ior [105]. In a variation of this method, bisulfite-converted DNA from differentsamples can be deposited in a solid support and used to interrogate labeled syntheticprobes for methylated or unmethylated versions of specific CpGs [112].
An additional approach for analysis of DNA methylation patterns involvesmethylated DNA immunoprecipitation (MeDIP) with an anti-methylcytosineantibody, followed by hybridization of the purified genomic fragments to whole-genome microarrays. This methodology was employed to generate methylationprofiles from normal and tumor cells of all human chromosomes at 80 kb reso-lution and for a large set of CpG islands using a tiled whole human genomeBAC array [113]. Because genome tiling arrays can be synthesized to containrelatively short (25 mer) oligonucleotides, they can potentially identify sites ofDNA methylation with unparalleled precision, in some cases with single-nucleotide resolution. Recently, the MeDIP approach was used to generate thefirst comprehensive DNA methylation map of an entire genome (the plantArabidopsis thaliana), at 35 bp resolution [114], and is also being used to inves-tigate in the detail the methylation pattern of a region comprising 1% of thehuman genome using Affymetrix oligonucleotide tiling arrays [115]. As tilingarrays are universal platforms they are ideal for detecting correlations betweenDNA methylation and transcriptome mapping on a genome-wide scale.
3.7 ChIP-Chip
Chromatin immunoprecipitation (ChIP) coupled to hybridization onto DNAmicroarrays (ChIP-chip) is becoming a popular approach to investigate interac-tions between proteins and DNA that occur in vivo. In ChIP-chip experiments,cross-linked chromatin–protein complexes are extracted from a cell or tissue ofinterest and the DNA sheared, typically by sonication, down to relatively short(<1 kb) fragments (Figure 18). DNA fragments cross-linked to the protein of
Concepts on microarray design for genome 293

294 H. I. Nakaya et al.
Figure 18. Schematic view of ChIP-chip procedure. Formaldehyde is used to form DNA–proteincross-links. After lyses, the extract is sonicated to shear the DNA fragments to the desired size, usu-ally 1 kb or smaller. DNA fragments cross-linked to the protein of interest are enriched by chro-matin immunoprecipitation (ChIP) using an antibody specific to that protein. Formaldehydecross-links are then reversed and the DNA is purified. Enriched DNA is labeled with a fluorescentmolecule such as Cy5 or Cy3. Genomic DNA prepared from IP input extract is generally used as areference and similarly amplified and labeled with a different fluorescent molecule. The two probesare then combined and hybridized to the DNA microarray which contains elements that representthe entire genome.

interest are enriched by immunoprecipitation with a protein-specific antibody,the formaldehyde cross-links are reversed and DNA is purified. Amplificationof immunoprecipitated DNA is usually required for microarray-based detection.Amplified immunoprecipitated DNA is labeled with a fluorescent molecule andhybridized to DNA microarrays, along with a reference (usually an aliquot ofgDNA used as input for immunoprecipitation reactions) labeled with a differentfluorophore (Figure 18) [49].
Different array platforms have been used in ChIP-chip experiments: spotteddouble-strand cDNA/DNA arrays, spotted oligonucleotide arrays, and in situsynthesized oligonucleotide arrays. Initial studies in yeast using arrays com-prised of PCR fragments spanning the whole yeast genome identified bindingsites for individual transcription factors and of protein complexes related toDNA replication, recombination, and chromatin structure [49]. ChIP-chip stud-ies in mammalian genomes have utilized different types of PCR ampliconarrays, including arrays tiling a specific genomic region of interest, mainly CpGisland arrays and promoter arrays [116]. Recently, an array comprising PCRfragment probes for 1% of the nonrepetitive complement of the human genomesequence (ENCODE array) was used to identify functional promoters in anunbiased fashion [117]. Arrays comprising of tiling DNA fragments (eitherPCR fragments or oligonucleotides) were devised as a way to increase theresolution of ChIP-chip experiments. The advent of commercially availablewhole-genome high-density oligonucleotide tiling arrays (Affymetrix, Agilent,NimbleGen) represented an additional gain in resolution and also eliminatedthe problems associated to PCR manipulations and mechanical spotting byrelying instead on in situ oligonucleotide synthesis. The high-coverage of thewhole-genome tiling arrays has paved the way for the unbiased mapping ofDNA-interacting protein factors. As an example, a study using Affymetrix arraysrepresenting essentially all nonrepetitive sequences on human chromosomes 21and 22 found that most binding sites for the transcriptional factors Sp1, cMyc,and p53 were located far from the transcription start sites of known protein-coding genes [118]. It should be noted that the optimal length of arrayedfragments is a balance between the cost of having many elements and the desirefor increased resolution, keeping in mind that arrayed elements shorter than theaverage size of a sheared chromatin fragment (generally 500–1000 bp) will notincrease resolution [49]. A comprehensive comparison of using PCR spottedarrays and long- and short-oligonucleotide arrays for ChIP-chip experiments isnot available and therefore, the best array platform for ChIP-chip experiments is notyet established.
3.8 Genotyping
SNPs are the most abundant form of genetic variation in the human genome,with estimates of more than 10 million common SNPs [119, 120]. These singlenucleotide changes in human genes may cause genetic disorders and could provide
Concepts on microarray design for genome 295

important help for explaining, e.g. disease susceptibility and cancer predisposition[121]. Therefore, it is clear that the accurate and robust detection of such SNPsplays a central role in the field of DNA diagnostics [122]. Microarray-basedgenotyping assays have been used in genome-wide linkage analysis of SNPmarkers associated to several diseases, such as prostate cancer [123], rheumatoidarthritis [124], and systemic lupus erythematosus [125].
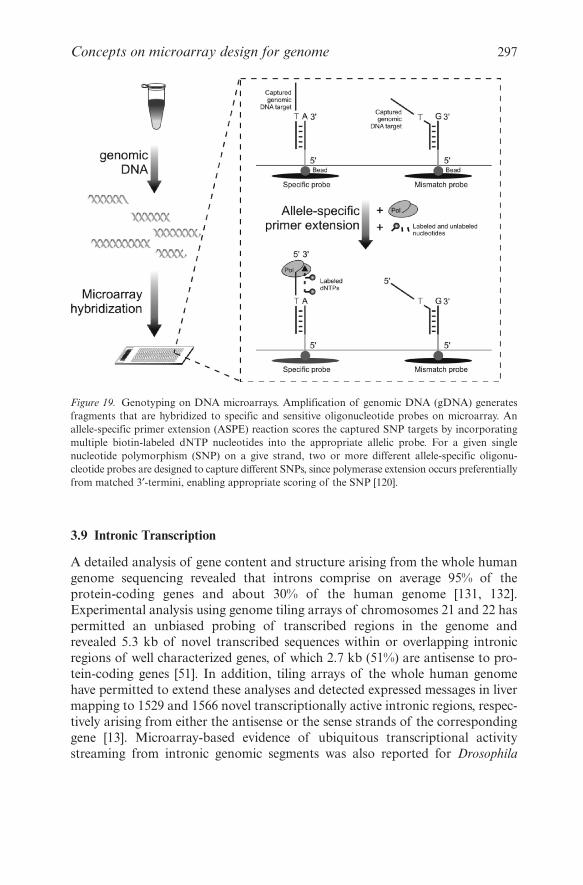
Among the numerous methods for analyzing genomic variations, microarraysare one of the most powerful tools for high-throughput SNP genotyping.Genotyping platforms, released by Affymetrix, can interrogate up to 100,000SNPs in parallel. An alternative technology, BeadArrays, developed by Illumina(San Diego, California) and not discussed in detail here, is particularly powerfulfor genotyping up to 500,000 SNPs in parallel. Essentially, the method involves(a) whole-genome amplification (WGA) to generate large amounts of amplifiedcomplex gDNA. (b) Hybridization of the WGA product to a specific and sensi-tive oligonucleotide probe array (50 mers). (c) An array-based allele-specificprimer extension (ASPE) reaction that scores the captured SNP targets byincorporating multiple biotin-labeled dNTP nucleotides into the appropriateallelic probe, followed by a sensitive detection and signal amplification step toread the incorporated labels [120].
Microarray-based systems use different molecular strategies for distinctionbetween SNP alleles. The robustness of these multiplexed systems is deter-mined by the reaction principles applied for SNP allele distinction and themicroarray formats used. The major reaction principles – allele-specificoligonucleotide (ASO) hybridization, ASPE, and single-base extension (SBE)[126] – can be applied using different combinations of PCR strategies, arraytypes, SNP selection, and labeling protocols and will not be discussed in thischapter [119]. However, a brief example of each reaction principle is pre-sented. GeneChip assays (Affymetrix) use the difference in thermal stabilitybetween a perfectly matched and mismatched ASO probe and its DNA targetto distinguish between the SNP alleles [127]. Systems that use ASPE (Figure 19)or SBE [128] reaction principles are enzyme-assisted and provide a highlyspecific SNP genotyping. This is due to the high accuracy of nucleotideincorporation by DNA polymerase or the high specificity of DNA ligase injoining two adjacent and perfectly matched DNA strands. In SBE–TAG sys-tems [128, 129], a hybrid oligonucleotide primer containing a genericsequence tag followed by a locus-specific sequence is hybridized adjacent tothe SNP and extended with fluorescent dideoxynucleotides. Multiple SBEreactions are performed in solution with each SBE primer marked by a dif-ferent unique sequence tag. The multiplex reaction is analyzed afterhybridization to a generic tag array, which is generated by spotting the reversecomplements of the sequence tags onto a glass microscope slide. Genotypingmethod using ASPE systems [120, 130] is briefly described in the legend toFigure 19.
296 H. I. Nakaya et al.
3.9 Intronic Transcription
A detailed analysis of gene content and structure arising from the whole humangenome sequencing revealed that introns comprise on average 95% of theprotein-coding genes and about 30% of the human genome [131, 132].Experimental analysis using genome tiling arrays of chromosomes 21 and 22 haspermitted an unbiased probing of transcribed regions in the genome andrevealed 5.3 kb of novel transcribed sequences within or overlapping intronicregions of well characterized genes, of which 2.7 kb (51%) are antisense to pro-tein-coding genes [51]. In addition, tiling arrays of the whole human genomehave permitted to extend these analyses and detected expressed messages in livermapping to 1529 and 1566 novel transcriptionally active intronic regions, respec-tively arising from either the antisense or the sense strands of the correspondinggene [13]. Microarray-based evidence of ubiquitous transcriptional activitystreaming from intronic genomic segments was also reported for Drosophila
Concepts on microarray design for genome 297
Figure 19. Genotyping on DNA microarrays. Amplification of genomic DNA (gDNA) generatesfragments that are hybridized to specific and sensitive oligonucleotide probes on microarray. Anallele-specific primer extension (ASPE) reaction scores the captured SNP targets by incorporatingmultiple biotin-labeled dNTP nucleotides into the appropriate allelic probe. For a given singlenucleotide polymorphism (SNP) on a give strand, two or more different allele-specific oligonu-cleotide probes are designed to capture different SNPs, since polymerase extension occurs preferentiallyfrom matched 3′-termini, enabling appropriate scoring of the SNP [120].

melanogaster [133]. In that work, it was observed that 41% of probes representingthe full complement of intronic and intergenic regions of the D. melanogastergenome are transcriptionally active [133]. The expressed intronic and intergenicsequences are more likely to be evolutionarily conserved than nonexpressed ones,and about 15% of them appear to be developmentally regulated [133]. Ubiquitousintronic transcription has been confirmed by other experimental approaches,including mapping 3′-ends of transcripts with SAGE [134], 5′-ends using capanalysis of gene expression (CAGE) [135], MPSS [136], and high-throughput full-length cDNA cloning and sequencing [137]. It has become apparent that introns,as well as intergenic regions constitute major sources of non-protein-codingRNAs [138], and experiments with genomic tiling arrays or RACE have shownthat intronic RNAs are long (400–2000 nt) transcripts [40, 139, 140].
To investigate the expression level of intronic messages in human tissues, Reiset al. [40] selected for microarray experiments a subset of ~1000 totally intronicEST clusters identified by informatics analysis, along with an additional 2000clusters from exonic segments of known genes. A representative cDNA clonefrom each selected cluster was used for construction of spotted cDNA microar-rays enriched in intronic transcripts. Hybridization of these intronic microarrayswith 27 prostate tumor samples and corresponding adjacent normal tissuerevealed that in prostate, the fraction of expressed messages arising from exonicor intronic transcripts were similar [40]. Moreover, the expression levels of 23intronic noncoding transcripts are significantly correlated (p-value < 0.001) tothe degree of prostate tumor differentiation (Figure 20). Intronic RASSF1, themost correlated gene, is expressed both as sense and antisense messages asshown by strand-specific reverse transcriptase assay. In addition to antisenseRASSF1, a number of antisense intronic messages significantly correlated to thedegree of prostate tumor differentiation were shown by RACE–PCR andstrand-specific Northern blotting to be long (0.6–1.1 kb) and unspliced [40].
Reis et al. [40] provide the first report implicating a large set of naturalintronic antisense transcripts in a human disease. It is not yet a settled issue if intumors the expression of intronic antisense RNAs is a true mechanism of regu-lation or just reflects errors in promoter recognition/transcription initiation.Nevertheless, discovery of intronic antisense messages correlated to the degreeof malignancy in prostate tumors [40] has an impact on the molecular diagnosisof cancer in general, arguing for inclusion of noncoding intronic transcripts intothe arsenal of tools used for molecular diagnostics, so far almost exclusivelypopulated by microarrays that contain only exonic protein-coding transcripts.
An intronic array may be a practical and effective compromise between abiased array that only probes the protein-coding messages, and whole humangenome tiling arrays. Intronic arrays may facilitate a comparative analysis ofintronic and protein-coding exonic transcription under a different number ofphysiological and pathological conditions. This approach should advancecurrent knowledge about the diverse biological roles of these noncoding RNAs,which are likely involved in the control of gene expression [141].
298 H. I. Nakaya et al.
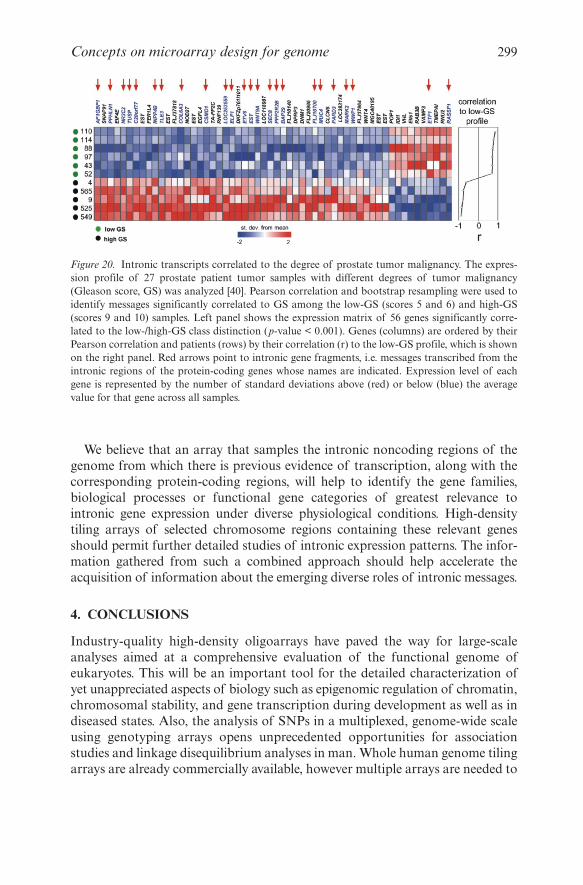
We believe that an array that samples the intronic noncoding regions of thegenome from which there is previous evidence of transcription, along with thecorresponding protein-coding regions, will help to identify the gene families,biological processes or functional gene categories of greatest relevance tointronic gene expression under diverse physiological conditions. High-densitytiling arrays of selected chromosome regions containing these relevant genesshould permit further detailed studies of intronic expression patterns. The infor-mation gathered from such a combined approach should help accelerate theacquisition of information about the emerging diverse roles of intronic messages.
4. CONCLUSIONS
Industry-quality high-density oligoarrays have paved the way for large-scaleanalyses aimed at a comprehensive evaluation of the functional genome ofeukaryotes. This will be an important tool for the detailed characterization ofyet unappreciated aspects of biology such as epigenomic regulation of chromatin,chromosomal stability, and gene transcription during development as well as indiseased states. Also, the analysis of SNPs in a multiplexed, genome-wide scaleusing genotyping arrays opens unprecedented opportunities for associationstudies and linkage disequilibrium analyses in man. Whole human genome tilingarrays are already commercially available, however multiple arrays are needed to
Concepts on microarray design for genome 299
Figure 20. Intronic transcripts correlated to the degree of prostate tumor malignancy. The expres-sion profile of 27 prostate patient tumor samples with different degrees of tumor malignancy(Gleason score, GS) was analyzed [40]. Pearson correlation and bootstrap resampling were used toidentify messages significantly correlated to GS among the low-GS (scores 5 and 6) and high-GS(scores 9 and 10) samples. Left panel shows the expression matrix of 56 genes significantly corre-lated to the low-/high-GS class distinction (p-value < 0.001). Genes (columns) are ordered by theirPearson correlation and patients (rows) by their correlation (r) to the low-GS profile, which is shownon the right panel. Red arrows point to intronic gene fragments, i.e. messages transcribed from theintronic regions of the protein-coding genes whose names are indicated. Expression level of eachgene is represented by the number of standard deviations above (red) or below (blue) the averagevalue for that gene across all samples.

cover all chromosomes at high resolution and this platform is still very expen-sive, making it not accessible to most researchers. Moreover, the enormousamount of data generated in these experiments can not be efficiently processedand interpreted. For transcriptome studies, a more practical and cost-effectivealternative is the design of gene-oriented tiling oligoarrays interrogatinggenomic sequences that span transcriptionally active exonic and intronic regionsrelative to known gene loci. Active regions can be determined by compiling theexisting experimental evidence already available at transcriptome databases(mRNA, EST, MPSS, SAGE, etc.). This approach would narrow the genomicspace that is interrogated by such gene-oriented tiling arrays, focusing on themost relevant regions for the study of gene expression.
REFERENCES
1. Schena M, Shalon D, Davis RW, Brown PO (1995) Quantitative monitoring of gene expressionpatterns with a complementary DNA microarray. Science 270:467–470
2. MacBeath G, Schreiber SL (2000) Printing proteins as microarrays for high-throughput func-tion determination. Science 289:1760–1763
3. Fang Y, Frutos AG, Lahiri J (2002) Membrane protein microarrays. J Am Chem Soc124:2394–2395
4. Min DH, Mrksich M (2004) Peptide arrays: towards routine implementation. Curr Opin ChemBiol 8:554–558
5. Shin I, Cho JW, Boo DW (2004) Carbohydrate arrays for functional studies of carbohydrates.Comb Chem High Throughput Screen 7:565–574
6. MacBeath G, Koehler AN, Schreiber SL (1999) Printing small molecules as microarrays anddetecting protein-ligand interactions en masse. J Am Chem Soc 121:7967–7968
7. Kononen J, Bubendorf L, Kallioniemi A, Barlund M, Schraml P, Leighton S, Torhorst J,Mihatsch MJ, Sauter G, Kallioniemi OP (1998) Tissue microarrays for high-throughput molec-ular profiling of tumor specimens. Nat Med 4:844–847
8. Ziauddin J, Sabatini DM (2001) Microarrays of cells expressing defined cDNAs. Nature411:107–110
9. Lipshutz RJ, Fodor SP, Gingeras TR, Lockhart DJ (1999) High density synthetic oligonu-cleotide arrays. Nat Genet 21:20–24
10. Duggan DJ, Bittner M, Chen YD, Meltzer P, Trent JM (1999) Expression profiling usingcDNA microarrays. Nat Genet 21:10–14
11. Wick I, Hardiman G (2005) Biochip platforms as functional genomics tools for drug discovery.Curr Opin Drug Discov Devel 8:347–354
12. Sievertzon M, Nilsson P, Lundeberg J (2006) Improving reliability and performance of DNAmicroarrays. Expert Rev Mol Diagn 6:481–492
13. Bertone P, Stolc V, Royce TE, Rozowsky JS, Urban AE, Zhu X, Rinn JL, Tongprasit W,Samanta M, Weissman S, et al. (2004) Global identification of human transcribed sequenceswith genome tiling arrays. Science 306:2242–2246
14. Cheng J, Kapranov P, Drenkow J, Dike S, Brubaker S, Patel S, Long J, Stern D, Tammana H,Helt G, et al. (2005) Transcriptional maps of 10 human chromosomes at 5-nucleotide resolution.Science 308:1149–1154
15. Hessner MJ, Meyer L, Tackes J, Muheisen S, Wang XJ (2004) Immobilized probe and glass sur-face chemistry as variables in microarray fabrication. BMC Genomics 5:53
16. Taylor S, Smith S, Windle B, Guiseppi-Elie A (2003) Impact of surface chemistry and blockingstrategies on DNA microarrays. Nucleic Acids Res 31(16):e87
300 H. I. Nakaya et al.

17. Bertone P, Trifonov V, Rozowsky JS, Schubert F, Emanuelsson O, Karro J, Kao MY, Snyder M,Gerstein M (2006) Design optimization methods for genomic DNA tiling arrays. Genome Res16:271–281
18. Pinkel D, Segraves R, Sudar D, Clark S, Poole I, Kowbel D, Collins C, Kuo WL, Chen C, Zhai Y,et al. (1998) High resolution analysis of DNA copy number variation using comparativegenomic hybridization to microarrays. Nat Genet 20:207–211
19. Telenius H, Carter NP, Bebb CE, Nordenskjold M, Ponder BAJ, Tunnacliffe A (1992)Degenerate oligonucleotide-primed PCR – general amplification of target DNA by a singledegenerate primer. Genomics 13:718–725
20. Watson SK, deLeeuw RJ, Ishkanian AS, Malloff CA, Lam WL (2004) Methods for highthroughput validation of amplified fragment pools of BAC DNA for constructing high reso-lution CGH arrays. BMC Genomics 5(6):1–8
21. Lockwood WW, Chari R, Chi B, Lam WL (2006) Recent advances in array comparativegenomic hybridization technologies and their applications in human genetics. Eur J Hum Genet14:139–148
22. Shalon D, Smith SJ, Brown PO (1996) A DNA microarray system for analyzing complex DNAsamples using two-color fluorescent probe hybridization. Genome Res 6:639–645
23. Stoughton RB (2005) Applications of DNA microarrays in biology. Annu Rev Biochem 74:53–8224. Dorris DR, Nguyen A, Gieser L, Lockner R, Lublinsky A, Patterson M, Touma E, Sendera TJ,
Elghanian R, Mazumder A (2003) Oligodeoxyribonucleotide probe accessibility on a three-dimensional DNA microarray surface and the effect of hybridization time on the accuracy ofexpression ratios. BMC Biotechnol 3:6
25. Stafford P, Sendera T, Kaysser-Kranich T, Palaniappan C (2003) High-quality microarray datausing CodeLink Bioarray Platform. Life Sci News 13:1–5
26. Barczak A, Rodriguez MW, Hanspers K, Koth LL, Tai YC, Bolstad BM, Speed TP, Erle DJ(2003) Spotted long oligonucleotide arrays for human gene expression analysis. Genome Res13:1775–1785
27. Tan PK, Downey TJ, Spitznagel EL, Xu P, Fu D, Dimitrov DS, Lempicki RA, Raaka BM,Cam MC (2003) Evaluation of gene expression measurements from commercial microarrayplatforms. Nucleic Acids Res 31:5676–5684
28. Yauk CL, Berndt ML, Williams A, Douglas GR (2004) Comprehensive comparison of sixmicroarray technologies. Nucleic Acids Res 32(15):e124
29. de Reynies A, Geromin D, Cayuela JM, Petel F, Dessen P, Sigaux F, Rickman DS (2006)Comparison of the latest commercial short and long oligonucleotide microarray technologies.BMC Genomics 7:51
30. Larkin JE, Frank BC, Gavras H, Sultana R, Quackenbush J (2005) Independence and repro-ducibility across microarray platforms. Nat Methods 2:337–343
31. Irizarry RA, Warren D, Spencer F, Kim IF, Biswal S, Frank BC, Gabrielson E, Garcia JGN,Geoghegan J, Germino G, et al. (2005) Multiple-laboratory comparison of microarray plat-forms. Nat Methods 2:345–349
32. Petersen D, Chandramouli GVR, Geoghegan J, Hilburn J, Paarlberg J, Kim CH, Munroe D,Gangi L, Han J, Puri R, et al. (2005) Three microarray platforms: an analysis of theirconcordance in profiling gene expression. BMC Genomics 6:63
33. Knight J (2001) When the chips are down. Nature 410:860–86134. Singh-Gasson S, Green RD, Yue YJ, Nelson C, Blattner F, Sussman MR, Cerrina F (1999)
Maskless fabrication of light-directed oligonucleotide microarrays using a digital micromirrorarray. Nat Biotechnol 17:974–978
35. Fodor SPA, Read JL, Pirrung MC, Stryer L, Lu AT, Solas D (1991) Light-directed, spatiallyaddressable parallel chemical synthesis. Science 251:767–773
36. Hughes TR, Mao M, Jones AR, Burchard J, Marton MJ, Shannon KW, Lefkowitz SM, ZimanM, Schelter JM, Meyer MR, et al. (2001) Expression profiling using microarrays fabricated byan ink-jet oligonucleotide synthesizer. Nat Biotechnol 19:342–347
Concepts on microarray design for genome 301

37. Kane MD, Jatkoe TA, Stumpf CR, Lu J, Thomas JD, Madore SJ (2000) Assessment of the sen-sitivity and specificity of oligonucleotide (50 mer) microarrays. Nucleic Acids Res28:4552–4557
38. Hardiman G (2004): Microarray platforms – comparisons and contrasts. Pharmacogenomics5:487–502
39. Su AI, Wiltshire T, Batalov S, Lapp H, Ching KA, Block D, Zhang J, Soden R, Hayakawa M,Kreiman G, et al. (2004) A gene atlas of the mouse and human protein-encoding transcrip-tomes. Pro Natl Acad Sci USA 101:6062–6067
40. Reis EM, Nakaya HI, Louro R, Canavez FC, Flatschart AV, Almeida GT, Egidio CM, PaquolaAC, Machado AA, Festa F, et al. (2004) Antisense intronic non-coding RNA levels correlate tothe degree of tumor differentiation in prostate cancer. Oncogene 23:6684–6692
41. Shingara J, Keiger K, Shelton J, Laosinchai-Wolf W, Powers P, Conrad R, Brown D, LabourierE (2005) An optimized isolation and labeling platform for accurate microRNA expression pro-filing. RNA – A Publication of the RNA Society 11:1461–1470
42. Johnson JM, Castle J, Garrett-Engele P, Kan Z, Loerch PM, Armour CD, Santos R, SchadtEE, Stoughton R, Shoemaker DD (2003) Genome-wide survey of human alternative pre-mRNA splicing with exon junction microarrays. Science 302:2141–2144
43. Conrad DF, Andrews TD, Carter NP, Hurles ME, Pritchard JK (2006) A high-resolutionsurvey of deletion polymorphism in the human genome. Nat Genet 38:75–81
44. Fraga ME, Esteller M (2002) DNA methylation: a profile of methods and applications.Biotechniques 33:632–649
45. Schubeler D, Scalzo D, Kooperberg C, van Steensel B, Delrow J, Groudine M (2002) Genome-wide DNA replication profile for Drosophila melanogaster: a link between transcription andreplication timing. Nat Genet 32:438–442
46. van Steensel B, Henikoff S (2003) Epigenomic profiling using microarrays. Biotechniques35:346–350, 352–354, 356–357
47. Ren B, Cam H, Takahashi Y, Volkert T, Terragni J, Young RA, Dynlacht BD (2002) E2F inte-grates cell cycle progression with DNA repair, replication, and G(2)/M checkpoints. Genes Dev16:245–256
48. Kapranov P, Cawley SE, Drenkow J, Bekiranov S, Strausberg RL, Fodor SP, Gingeras TR(2002) Large-scale transcriptional activity in chromosomes 21 and 22. Science 296:916–919
49. Buck MJ, Lieb JD (2004) ChIP-chip: considerations for the design, analysis, and application ofgenome-wide chromatin immunoprecipitation experiments. Genomics 83:349–360
50. Lippman Z, Gendrel AV, Black M, Vaughn MW, Dedhia N, McCombie WR, Lavine K, MittalV, May B, Kasschau KD, et al. (2004) Role of transposable elements in heterochromatin andepigenetic control. Nature 430:471–476
51. Kampa D, Cheng J, Kapranov P, Yamanaka M, Brubaker S, Cawley S, Drenkow J, PiccolboniA, Bekiranov S, Helt G, et al. (2004) Novel RNAs Identified From an In-Depth Analysis of theTranscriptome of Human Chromosomes 21 and 22. Genome Res 14:331–342
52. Ishkanian AS, Malloff CA, Watson SK, deLeeuw RJ, Chi B, Coe BP, Snijders A, AlbertsonDG, Pinkel D, Marra MA, et al. (2004) A tiling resolution DNA microarray with complete cov-erage of the human genome. Nat Genet 36:299–303
53. Royce TE, Rozowsky JS, Bertone P, Samanta M, Stolc V, Weissman S, Snyder M, Gerstein M(2005) Issues in the analysis of oligonucleotide tiling microarrays for transcript mapping.Trends Genet 21:466–475
54. Adams MD, Soares MB, Kerlavage AR, Fields C, Venter JC (1993) Rapid cDNA sequencing(expressed sequence tags) from a directionally cloned human infant brain cDNA library. NatGenet 4:373–380
55. Velculescu VE, Zhang L, Vogelstein B, Kinzler KW (1995) Serial analysis of gene expression.Science 270:484–487
56. Brenner S, Johnson M, Bridgham J, Golda G, Lloyd DH, Johnson D, Luo S, McCurdy S, FoyM, Ewan M, et al. (2000) Gene expression analysis by massively parallel signature sequencing(MPSS) on microbead arrays. Nat Biotechnol 18:630–634
302 H. I. Nakaya et al.

57. Vilo J, Kivinen K (2001) Regulatory sequence analysis: application to the interpretation of geneexpression. Eur Neuropsychopharmacology 11:399–411
58. van Someren EP, Wessels LFA, Backer E, Reinders MJT (2002) Genetic network modeling.Pharmacogenomics 3:507–525
59. Dudley AM, Aach J, Steffen MA, Church GM (2002) Measuring absolute expression withmicroarrays with a calibrated reference sample and an extended signal intensity range. ProcNatl Acad Sci USA 99:7554–7559
60. Carter MG, Sharov AA, VanBuren V, Dudekula DB, Carmack CE, Nelson C, Ko MSH (2005)Transcript copy number estimation using a mouse whole-genome oligonucleotide microarray.Genome Biol 6(7):R61
61. Anderson L, Seilhamer J (1997) A comparison of selected mRNA and protein abundances inhuman liver. Electrophoresis 18:533–537
62. Vrana KE, Freeman WM, Aschner M (2003) Use of microarray technologies in toxicologyresearch. Neurotoxicology 24:321–332
63. Greshock J, Naylor TL, Margolin A, Diskin S, Cleaver SH, Futreal PA, deJong PJ, Zhao SY,Liebman M, Weber BL (2004) 1-Mb resolution array-based comparative genomic hybridizationusing a BAC clone set optimized for cancer gene analysis. Genome Res 14:179–187
64. Mantripragada KK, Buckley PG, de Stahl TD, Dumanski JP (2004) Genomic microarrays inthe spotlight. Trends Genet 20:87–94
65. Ylstra B, van den IJssel P, Carvalho B, Brakenhoff RH, Meijer GA (2006) BAC to the future!or oligonucleotides: a perspective for micro array comparative genomic hybridization (arrayCGH). Nucleic Acids Res 34:445–450
66. Davies JJ, Wilson IM, Lam WL (2005) Array CGH technologies and their applications to can-cer genomes. Chromosome Res 13:423–423
67. Black DL (2003) Mechanisms of alternative pre-messenger RNA splicing. Annu Rev Biochem72:291–336
68. Thanaraj TA, Clark F, Muilu J (2003) Conservation of human alternative splice events inmouse. Nucleic Acids Res 31:2544–2552
69. Modrek B, Lee CJ (2003) Alternative splicing in the human, mouse and rat genomes is associ-ated with an increased frequency of exon creation and/or loss. Nat Genet 34:177–180
70. Pan Q, Shai O, Misquitta C, Zhang W, Saltzman AL, Mohammad N, Babak T, Siu H, HughesTR, Morris QD, et al. (2004) Revealing global regulatory features of mammalian alternativesplicing using a quantitative microarray platform. Mol Cell 16:929–941
71. Le K, Mitsouras K, Roy M, Wang Q, Xu Q, Nelson SF, Lee C (2004) Detecting tissue-specific regulation of alternative splicing as a qualitative change in microarray data. NucleicAcids Res 32:e180
72. Blanchette M, Green RE, Brenner SE, Rio DC (2005) Global analysis of positive and negativepre-mRNA splicing regulators in Drosophila. Genes Dev 19:1306–1314
73. Ule J, Darnell RB (2006) RNA binding proteins and the regulation of neuronal synaptic plas-ticity. Curr Opin Neurobiol 16:102–110
74. Sugnet CW, Srinivasan K, Clark TA, O’Brien G, Cline MS, Wang H, Williams A, Kulp D,Blume JE, Haussler D, Ares M (2006) Unusual intron conservation near tissue-regulated exonsfound by splicing microarrays. PLoS Comput Biol 2:22–35
75. Frey BJ, Mohammad N, Morris QD, Zhang W, Robinson MD, Mnaimneh S, Chang R, Pan Q,Sat E, Rossant J, et al. (2005) Genome-wide analysis of mouse transcripts using exon microar-rays and factor graphs. Nat Genet 37:991–996
76. Clark TA, Sugnet CW, Ares M (2002) Genomewide analysis of mRNA processing in yeastusing splicing-specific microarrays. Science 296:907–910
77. Li CX, Kato M, Shiue L, Shively JE, Ares M, Lin RJ (2006) Cell type and culture condition-dependent alternative splicing in human breast cancer cells revealed by splicing-sensitivemicroarrays. Cancer Res 66:1990–1999
78. Castle J, Garrett-Engele P, Armour CD, Duenwald SJ, Loerch PM, Meyer MR, Schadt EE,Stoughton R, Parrish ML, Shoemaker DD, Johnson JM (2003): Optimization of oligonucleotide
Concepts on microarray design for genome 303
arrays and RNA amplification protocols for analysis of transcript structure and alternativesplicing. Genome Biol 4:R66
79. Yeakley JM, Fan JB, Doucet D, Luo L, Wickham E, Ye Z, Chee MS, Fu XD (2002) Profilingalternative splicing on fiber-optic arrays. Nat Biotechnol 20:353–358
80. Li HR, Wang-Rodriguez J, Nair TM, Yeakley JM, Kwon YS, Bibikova M, Zheng C, Zhou LX,Zhang K, Downs T, et al. (2006) Two-dimensional transcriptome profiling: Identification ofmessenger RNA isoform signatures in prostate cancer from archived paraffin-embedded can-cer specimens. Cancer Res 66:4079–4088
81. Zhang CL, Li HR, Fan JB, Wang-Rodriguez J, Downs T, Fu XD, Zhang MQ (2006) Profilingalternatively spliced mRNA isoforms for prostate cancer classification. BMC Bioinformatics7:202
82. Fehlbaum P, Guihal C, Bracco L, Cochet O (2002) A microarray configuration to quantifyexpression levels and relative abundance of splice variants. Nucleic Acids Res 33(5):e47
83. Srinivasan K, Shiue L, Hayes JD, Centers R, Fitzwater S, Loewen R, Edmondson LR, Bryant J,Smith M, Rommelfanger C, et al. (2005) Detection and measurement of alternative splicingusing splicing-sensitive microarrays. Methods 37:345–359
84. Mockler TC, Chan S, Sundaresan A, Chen HM, Jacobsen SE, Ecker JR (2005) Applications ofDNA tiling arrays for whole-genome analysis. Genomics 85:655–655
85. Vanhee-Brossollet C, Vaquero C (1998) Do natural antisense transcripts make sense in eukary-otes? Gene 211:1–9
86. Lavorgna G, Dahary D, Lehner B, Sorek R, Sanderson CM, Casari G (2004) In search of anti-sense. Trends Biochem Sci 29:88–94
87. Lagos-Quintana M, Rauhut R, Meyer J, Borkhardt A, Tuschl T (2003) New microRNAs frommouse and human. RNA –A Publication of the RNA Society 9:175–179
88. Bartel DP (2004) MicroRNAs: Genomics, biogenesis, mechanism, and function. Cell116:281–297
89. Michael MZ, O’Connor SM, Pellekaan NGV, Young GP, James RJ (2003) Reduced accumu-lation of specific microRNAs in colorectal neoplasia. Mol Cancer Res 1:882–891
90. Calin GA, Dumitru CD, Shimizu M, Bichi R, Zupo S, Noch E, Aldler H, Rattan S, KeatingM, Rai K, et al. (2002) Frequent deletions and down-regulation of micro-RNA genes miR15and miR16 at 13q14 in chronic lymphocytic leukemia. Proc Natl Acad Sci USA99:15524–15529
91. Eis PS, Tam W, Sun LP, Chadburn A, Li ZD, Gomez MF, Lund E, Dahlberg JE (2005)Accumulation of miR-155 and BIC RNA in human B cell lymphomas. Proc Natl Acad SciUSA 102:3627–3632
92. Johnson SM, Grosshans H, Shingara J, Byrom M, Jarvis R, Cheng A, Labourier E, ReinertKL, Brown D, Slack FJ (2005) RAS is regulated by the let-7 MicroRNA family. Cell120:635–647
93. Liu CG, Calin GA, Meloon B, Gamliel N, Sevignani C, Ferracin M, Dumitru CD, Shimizu M,Zupo S, Dono M, et al. (2004) An oligonucleotide microchip for genome-wide microRNA pro-filing in human and mouse tissues. Proc Natl Acad Sci USA 101:9740–9744
94. Babak T, Zhang W, Morris Q, Blencowe BJ, Hughes TR (2004) Probing microRNAs withmicroarrays: tissue specificity and functional inference. RNA – A Publication of the RNASociety 10:1813–1819
95. Barad O, Meiri E, Avniel A, Aharonov R, Barzilai A, Bentwich I, Einav U, Glad S, Hurban P,Karov Y, et al. (2004) MicroRNA expression detected by oligonucleotide microarrays: systemestablishment and expression profiling in human tissues. Genome Res 14:2486–2494
96. Thomson JM, Parker J, Perou CM, Hammond SM (2004) A custom microarray platform foranalysis of microRNA gene expression. Nat Methods 1:47–53
97. Sun Y, Koo S, White N, Peralta E, Esau C, Dean NM, Perera RJ (2004) Development of amicro-array to detect human and mouse microRNAs and characterization of expression inhuman organs. Nucleic Acids Res 32:e188
304 H. I. Nakaya et al.

98. Miska EA, Alvarez-Saavedra E, Townsend M, Yoshii A, Sestan N, Rakic P, Constantine-PatonM, Horvitz HR (2004) Microarray analysis of microRNA expression in the developing mam-malian brain. Genome Biol 5:R68
99. Calin GA, Liu CG, Sevignani C, Ferracin M, Felli N, Dumitru CD, Shimizu M, Cimmino A,Zupo S, Dono M, et al. (2004) MicroRNA profiling reveals distinct signatures in B cell chroniclymphocytic leukemias. Proc Natl Acad Sci USA 101:11755–11760
100. Cross SH, Charlton JA, Nan XS, Bird AP (1994) Purification of Cpg islands using a methy-lated DNA-binding column. Nat Genet 6:236–244
101. Huang THM, Perry MR, Laux DE (1999) Methylation profiling of CpG islands in humanbreast cancer cells. Hum Mol Genet 8:459–470
102. Hatada I, Kato A, Morita S, Obata Y, Nagaoka K, Sakurada A, Sato M, Horii A, Tsujimoto A,Matsubara K (2002) A microarray-based method for detecting methylated loci. J Hum Genet47:448–451
103. Misawa A, Inoue J, Sugino Y, Hosoi H, Sugimoto T, Hosoda F, Ohki N, Imoto I, Inazawa J(2005) Methylation-associated silencing of the nuclear receptor 1I2 gene in advanced-type neu-roblastomas, identified by bacterial artificial chromosome array-based methylated CpG islandamplification. Cancer Res 65:10233–10242
104. Ching TT, Maunakea AK, Jun P, Hong CB, Zardo G, Pinkel D, Albertson DG, Fridlyand J,Mao JH, Shchors K, et al. (2005) Epigenome analyses using BAC microarrays identify evolu-tionary conservation of tissue-specific methylation of SHANK3. Nat Genet 37:645–651
105. Schumacher A, Kapranov P, Kaminsky Z, Flanagan J, Assadzadeh A, Yau P, Virtanen C,Winegarden N, Cheng J, Gingeras T, Petronis A (2006) Microarray-based DNA methylationprofiling: technology and applications. Nucleic Acids Res 34:528–542
106. Yu YP, Paranjpe S, Nelson J, Finkelstein S, Ren B, Kokkinakis D, Michalopoulos G, Luo JH(2005) High throughput screening of methylation status of genes in prostate cancer using anoligonucleotide methylation array. Carcinogenesis 26:471–479
107. Balog RP, de Souza YEP, Tang HM, DeMasellis GM, Gao B, Avila A, Gaban DJ, MittelmanD, Minna JD, Luebke KJ, Garner HR (2002) Parallel assessment of CpG methylation by two-color hybridization with oligonucleotide arrays. Anal Biochem 309:301–310
108. Shi HD, Maier S, Nimmrich I, Yan PS, Caldwell CW, Olek A, Huang THM (2003)Oligonucleotide-based microarray for DNA methylation analysis: principles and applications.J Cell Biochem 88:138–143
109. Gitan RS, Shi HD, Chen CM, Yan PS, Huang THM (2002) Methylation-specific oligonu-cleotide microarray: a new potential for high-throughput methylation analysis. Genome Res12:158–164
110. Adorjan P, Distler J, Lipscher E, Model F, Muller J, Pelet C, Braun A, Florl AR, Gutig D,Grabs G, et al. (2002) Tumour class prediction and discovery by microarray-based DNAmethylation analysis. Nucleic Acids Res 30:e21
111. Yan PS, Shi HD, Rahmatpanah F, Hsiau THC, Hsiau AHA, Len YW, Liu JC, Huang THM(2003) Differential distribution of DNA methylation within the RASSF1A CpG island inbreast cancer. Cancer Res 63:6178–6186
112. Wang Y, Zheng W, Luo J, Zhang D, Zuhong L (2006) In situ bisulfite modification ofmembrane-immobilized DNA for multiple methylation analysis. Anal Biochem 359(2):183–188
113. Weber M, Davies JJ, Wittig D, Oakeley EJ, Haase M, Lam WL, Schubeler D (2005)Chromosome-wide and promoter-specific analyses identify sites of differential DNA methyla-tion in normal and transformed human cells. Nat Genet 37:853–862
114. Zhang XY, Yazaki J, Sundaresan A, Cokus S, Chan SWL, Chen HM, Henderson IR, Shinn P,Pellegrini M, Jacobsen SE, Ecker JR (2006) Genome-wide high-resolution mapping and func-tional analysis of DNA methylation in Arabidopsis. Cell 126:1189–1201
115. Hayashi H, Nagae G, Tsutsumi S, Kaneshiro K, Kozaki T, Kaneda A, Sugisaki H, Aburatani H(2006) High-resolution mapping of DNA methylation in human genome using oligonucleotidetiling array. Hum Genet 120(5):701–711
Concepts on microarray design for genome 305

116. Bulyk ML (2006) DNA microarray technologies for measuring protein-DNA interactions. CurrOpin Biotechnol 17:422–430
117. Kim TH, Barrera LO, Qu C, Van Calcar S, Trinklein ND, Cooper SJ, Luna RM, Glass CK,Rosenfeld MG, Myers RM, Ren B (2005) Direct isolation and identification of promoters inthe human genome. Genome Res 15:830–839
118. Cawley S, Bekiranov S, Ng HH, Kapranov P, Sekinger EA, Kampa D, Piccolboni A,Sementchenko V, Cheng J, Williams AJ, et al. (2004) Unbiased mapping of transcription factorbinding sites along human chromosomes 21 and 22 points to widespread regulation of non-coding RNAs. Cell 116:499–509
119. Syvanen AC (2005) Toward genome-wide SNP genotyping. Nat Genet 37:S5–S10120. Gunderson KL, Steemers FJ, Lee G, Mendoza LG, Chee MS (2005) A genome-wide scalable
SNP genotyping assay using microarray technology. Nat Genet 37:549–554121. Huber M, Losert D, Hiller R, Harwanegg C, Mueller MW, Schmidt WM (2001) Detection of
single base alterations in genomic DNA by solid phase polymerase chain reaction on oligonu-cleotide microarrays. Anal Biochem 299:24–30
122. Huber M, Mundlein A, Dornstauder E, Schneeberger C, Tempfer CB, Mueller MW, SchmidtWM (2002) Accessing single nucleotide polymorphisms in genomic DNA by direct multiplexpolymerase chain reaction amplification on oligonucleotide microarrays. Anal Biochem303:25–33
123. Schaid DJ, Guenther JC, Christensen GB, Hebbring S, Rosenow C, Hilker CA, McDonnell SK,Cunningham JM, Slager SL, Blute ML, Thibodeau SN (2004) Comparison of microsatellitesversus single-nucleotide polymorphisms in a genome linkage screen for prostate cancer-suscep-tibility loci. Am J Hum Genet 75:948–965
124. John S, Shephard N, Liu GY, Zeggini E, Cao MQ, Chen WW, Vasavda N, Mills T, Barton A,Hinks A, et al. (2004) Whole-genome scan, in a complex disease, using 11,245 single-nucleotidepolymorphisms: comparison with microsatellites. Am J Hum Genet 75:54–64
125. Sigurdsson S, Nordmark G, Goring HHH, Lindroos K, Wiman AC, Sturfelt G, Jonsen A,Rantapaa-Dahlqvist S, Moller B, Kere J, et al. (2005) Polymorphisms in the tyrosine kinase 2and interferon regulatory factor 5 genes are associated with systemic lupus erythematosus. AmJ Hum Genet 76:528–537
126. Syvanen AC (2001) Accessing genetic variation: genotyping single nucleotide polymorphisms.Nat Rev Genet 2:930–942
127. Matsuzaki H, Dong SL, Loi H, Di XJ, Liu GY, Hubbell E, Law J, Berntsen T, Chadha M, HuiH, et al. (2004) Genotyping over 100,000 SNPs on a pair of oligonucleotide arrays. NatMethods 1:109–111
128. Hirschhorn JN, Sklar P, Lindblad-Toh K, Lim YM, Ruiz-Gutierrez M, Bolk S, Langhorst B,Schaffner S, Winchester E, Lander ES (2000) SBE-TAGS: an array-based method for efficientsingle-nucleotide polymorphism genotyping. Proc Natl Acad Sci USA 97:12164–12169
129. Fan JB, Chen XQ, Halushka MK, Berno A, Huang XH, Ryder T, Lipshutz RJ, Lockhart DJ,Chakravarti A (2000) Parallel genotyping of human SNPs using generic high-density oligonu-cleotide tag arrays. Genome Res 10:853–860
130. Fan JB, Oliphant A, Shen R, Kermani BG, Garcia F, Gunderson KL, Hansen M, Steemers F,Butler SL, Deloukas P, et al. (2003) Highly parallel SNP genotyping. Cold Spring Harb SympQuant Biol 68:69–78
131. Lander ES, Linton LM, Birren B, Nusbaum C, Zody MC, Baldwin J, Devon K, Dewar K,Doyle M, FitzHugh W, et al. (2001) Initial sequencing and analysis of the human genome.Nature 409:860–921
132. Venter JC, Adams MD, Myers EW, Li PW, Mural RJ, Sutton GG, Smith HO, Yandell M,Evans CA, Holt RA, et al. (2001) The sequence of the human genome. Science 291:1304–1351
133. Stolc V, Gauhar Z, Mason C, Halasz G, van Batenburg MF, Rifkin SA, Hua S, Herreman T,Tongprasit W, Barbano PE, et al. (2004) A gene expression map for the euchromatic genome ofDrosophila melanogaster. Science 306:655–660
306 H. I. Nakaya et al.

134. Saha S, Sparks AB, Rago C, Akmaev V, Wang CJ, Vogelstein B, Kinzler KW, Velculescu VE(2002) Using the transcriptome to annotate the genome. Nat Biotechnol 20:508–512
135. Carninci P, Kasukawa T, Katayama S, Gough J, Frith MC, Maeda N, Oyama R, Ravasi T,Lenhard B, Wells C, et al. (2005) The transcriptional landscape of the mammalian genome.Science 309:1559–1563
136. Jongeneel CV, Delorenzi M, Iseli C, Zhou D, Haudenschild CD, Khrebtukova I, Kuznetsov D,Stevenson BJ, Strausberg RL, Simpson AJ, Vasicek TJ (2005) An atlas of human gene expres-sion from massively parallel signature sequencing (MPSS). Genome Res 15:1007–1014
137. Okazaki Y, Furuno M, Kasukawa T, Adachi J, Bono H, Kondo S, Nikaido I, Osato N, SaitoR, Suzuki H, et al. (2002) Analysis of the mouse transcriptome based on functional annotationof 60,770 full-length cDNAs. Nature 420:563–573
138. Mattick JS, Makunin IV (2006) Non-coding RNA. Hum Mol Genet 15(1):R17–R29139. Rinn JL, Euskirchen G, Bertone P, Martone R, Luscombe NM, Hartman S, Harrison PM,
Nelson FK, Miller P, Gerstein M, et al. (2003) The transcriptional activity of humanChromosome 22. Genes Dev 17:529–540
140. Kapranov P, Drenkow J, Cheng J, Long J, Helt G, Dike S, Gingeras TR (2005) Examples of thecomplex architecture of the human transcriptome revealed by RACE and high-density tilingarrays. Genome Res 15:987–997
141. Reis EM, Louro R, Nakaya HI, Verjovski-Almeida S (2005) As antisense RNA gets intronic.Omics 9:2–12
Concepts on microarray design for genome 307